US11645293B2 - Anomaly detection in big data time series analysis - Google Patents
Anomaly detection in big data time series analysis Download PDFInfo
- Publication number
- US11645293B2 US11645293B2 US16/708,605 US201916708605A US11645293B2 US 11645293 B2 US11645293 B2 US 11645293B2 US 201916708605 A US201916708605 A US 201916708605A US 11645293 B2 US11645293 B2 US 11645293B2
- Authority
- US
- United States
- Prior art keywords
- time series
- series data
- time
- runtime
- window
- Prior art date
- Legal status (The legal status is an assumption and is not a legal conclusion. Google has not performed a legal analysis and makes no representation as to the accuracy of the status listed.)
- Active, expires
Links
Images


Classifications
-
- G—PHYSICS
- G06—COMPUTING OR CALCULATING; COUNTING
- G06F—ELECTRIC DIGITAL DATA PROCESSING
- G06F16/00—Information retrieval; Database structures therefor; File system structures therefor
- G06F16/20—Information retrieval; Database structures therefor; File system structures therefor of structured data, e.g. relational data
- G06F16/24—Querying
- G06F16/245—Query processing
- G06F16/2458—Special types of queries, e.g. statistical queries, fuzzy queries or distributed queries
- G06F16/2477—Temporal data queries
-
- G—PHYSICS
- G06—COMPUTING OR CALCULATING; COUNTING
- G06F—ELECTRIC DIGITAL DATA PROCESSING
- G06F16/00—Information retrieval; Database structures therefor; File system structures therefor
- G06F16/10—File systems; File servers
- G06F16/18—File system types
- G06F16/182—Distributed file systems
-
- G—PHYSICS
- G06—COMPUTING OR CALCULATING; COUNTING
- G06F—ELECTRIC DIGITAL DATA PROCESSING
- G06F16/00—Information retrieval; Database structures therefor; File system structures therefor
- G06F16/20—Information retrieval; Database structures therefor; File system structures therefor of structured data, e.g. relational data
- G06F16/23—Updating
- G06F16/2379—Updates performed during online database operations; commit processing
-
- G—PHYSICS
- G06—COMPUTING OR CALCULATING; COUNTING
- G06F—ELECTRIC DIGITAL DATA PROCESSING
- G06F16/00—Information retrieval; Database structures therefor; File system structures therefor
- G06F16/20—Information retrieval; Database structures therefor; File system structures therefor of structured data, e.g. relational data
- G06F16/24—Querying
- G06F16/245—Query processing
- G06F16/2458—Special types of queries, e.g. statistical queries, fuzzy queries or distributed queries
- G06F16/2474—Sequence data queries, e.g. querying versioned data
-
- G—PHYSICS
- G06—COMPUTING OR CALCULATING; COUNTING
- G06F—ELECTRIC DIGITAL DATA PROCESSING
- G06F16/00—Information retrieval; Database structures therefor; File system structures therefor
- G06F16/20—Information retrieval; Database structures therefor; File system structures therefor of structured data, e.g. relational data
- G06F16/25—Integrating or interfacing systems involving database management systems
- G06F16/252—Integrating or interfacing systems involving database management systems between a Database Management System and a front-end application
-
- G—PHYSICS
- G06—COMPUTING OR CALCULATING; COUNTING
- G06F—ELECTRIC DIGITAL DATA PROCESSING
- G06F16/00—Information retrieval; Database structures therefor; File system structures therefor
- G06F16/20—Information retrieval; Database structures therefor; File system structures therefor of structured data, e.g. relational data
- G06F16/26—Visual data mining; Browsing structured data
-
- G—PHYSICS
- G06—COMPUTING OR CALCULATING; COUNTING
- G06F—ELECTRIC DIGITAL DATA PROCESSING
- G06F17/00—Digital computing or data processing equipment or methods, specially adapted for specific functions
- G06F17/10—Complex mathematical operations
- G06F17/14—Fourier, Walsh or analogous domain transformations, e.g. Laplace, Hilbert, Karhunen-Loeve, transforms
- G06F17/141—Discrete Fourier transforms
- G06F17/142—Fast Fourier transforms, e.g. using a Cooley-Tukey type algorithm
-
- G—PHYSICS
- G06—COMPUTING OR CALCULATING; COUNTING
- G06F—ELECTRIC DIGITAL DATA PROCESSING
- G06F17/00—Digital computing or data processing equipment or methods, specially adapted for specific functions
- G06F17/10—Complex mathematical operations
- G06F17/18—Complex mathematical operations for evaluating statistical data, e.g. average values, frequency distributions, probability functions, regression analysis
-
- G—PHYSICS
- G06—COMPUTING OR CALCULATING; COUNTING
- G06F—ELECTRIC DIGITAL DATA PROCESSING
- G06F18/00—Pattern recognition
- G06F18/20—Analysing
- G06F18/24—Classification techniques
- G06F18/241—Classification techniques relating to the classification model, e.g. parametric or non-parametric approaches
- G06F18/2413—Classification techniques relating to the classification model, e.g. parametric or non-parametric approaches based on distances to training or reference patterns
-
- G—PHYSICS
- G06—COMPUTING OR CALCULATING; COUNTING
- G06F—ELECTRIC DIGITAL DATA PROCESSING
- G06F18/00—Pattern recognition
- G06F18/20—Analysing
- G06F18/24—Classification techniques
- G06F18/243—Classification techniques relating to the number of classes
- G06F18/2433—Single-class perspective, e.g. one-against-all classification; Novelty detection; Outlier detection
-
- G—PHYSICS
- G06—COMPUTING OR CALCULATING; COUNTING
- G06N—COMPUTING ARRANGEMENTS BASED ON SPECIFIC COMPUTATIONAL MODELS
- G06N5/00—Computing arrangements using knowledge-based models
- G06N5/04—Inference or reasoning models
-
- G—PHYSICS
- G06—COMPUTING OR CALCULATING; COUNTING
- G06N—COMPUTING ARRANGEMENTS BASED ON SPECIFIC COMPUTATIONAL MODELS
- G06N20/00—Machine learning
Definitions
- Anomaly detection in time series is a known problem in the field of computer science, and may be applicable to a range of problems in which time series data are generated and/or collected via observations or measurements of temporal processes.
- Certain aspects of anomaly detection may rely on data sampled over long time scales compared with sampling intervals between data samples (e.g., measured values that make up the time series data). In such cases, the large statistics afforded by the long-term collection of data may help in a signal-to-noise sense.
- evolutionary trends in the data, or shorter term variation may be washed out or diluted. The tradeoff between utilizing too little data and too much data may therefore present a challenge to reliable anomaly detection.
- the WAD algorithm is described in “Monitoring the Network Monitoring System: Anomaly Detection using Pattern Recognition” by Maha Mdini et al., published in May 2017 on pages 983 to 986 of the Proceedings of the IFIP/IEEE Symposium on Integrated Network and Service Management (IM) in Lisbon.
- Part of the WAD algorithm entails determining a reference model against which time series data may be compared.
- the WAD algorithm has been shown to be a fairly reliable tool for anomaly detection in some cases, the inventor has discovered through various test runs that determination of a reference model in the form of a daily pattern and a corresponding threshold during its learning phase may be improved to yield better accuracy.
- the inventor has devised an analytical approach that provides for an improved reference model for use in the WAD algorithm.
- the present disclosure addresses the need for an improved reference model determination, and provides techniques for achieving the improvement.
- a first example embodiment may involve a computer-implemented method for detecting anomalies in time series data, the method configured for operation in a computing system, and comprising: obtaining training time series data from a production database, the training time series data spanning an observation time window and comprising a series of values of a metric at regularly-spaced sample points in time, the regular spacing equal to an inter-sample time interval; analyzing the training time series data to determine one of a periodicity or a pseudo-periodicity of the training time series data across a plurality of consecutive, repeating sub-windows that span the observation time window, each equal in size to a reference time period and each spanned by the same number N of sample points of metric values, wherein N is a positive integer greater than one; determining a reference pattern comprising a series of N sample points of reference values spanning the reference time period and separated from one another by the inter-sample time interval, the reference pattern corresponding to a model time series having no anomalies greater than a threshold anomaly with
- a second example embodiment may involve a system configured for detecting anomalies in time series data, the system comprising: one or more processors; and memory configured for storing instructions that, when executed by the one or more processors, cause the system to carry out operations including: obtaining training time series data from a production database, the training time series data spanning an observation time window and comprising a series of values of a metric at regularly-spaced sample points in time, the regular spacing equal to an inter-sample time interval; analyzing the training time series data to determine one of a periodicity or a pseudo-periodicity of the training time series data across a plurality of consecutive, repeating sub-windows that span the observation time window, each equal in size to a reference time period and each spanned by the same number N of sample points of metric values, wherein N is a positive integer greater than one; determining a reference pattern comprising a series of N sample points of reference values spanning the reference time period and separated from one another by the inter-sample time interval, the reference pattern
- a third example embodiment provides an article of manufacture including a non-transitory computer-readable medium, having stored thereon program instructions that, when executed by one more processors of a system for detecting anomalies in time series data, cause the system to carry out operations including: obtaining training time series data from a production database, the training time series data spanning an observation time window and comprising a series of values of a metric at regularly-spaced sample points in time, the regular spacing equal to an inter-sample time interval; analyzing the training time series data to determine one of a periodicity or a pseudo-periodicity of the training time series data across a plurality of consecutive, repeating sub-windows that span the observation time window, each equal in size to a reference time period and each spanned by the same number N of sample points of metric values, wherein N is a positive integer greater than one; determining a reference pattern comprising a series of N sample points of reference values spanning the reference time period and separated from one another by the inter-sample time interval, the
- a system may include various means for carrying out each of the operations of the first and/or second example embodiment.
- FIG. 1 is a conceptual representation of an anomaly detection system 100 in which an anomaly detection algorithm may be implemented in a distributed Big Data environment, in accordance with example embodiments.
- FIG. 2 is a flow chart of high-level view of an example the anomaly detection process, in accordance with example embodiments.
- FIG. 3 is a flow chart illustrating an example of data filtering used in an example anomaly detection process, in accordance with example embodiments.
- FIG. 4 is a flow chart illustrating an example of data aggregation used in an example anomaly detection, in accordance with example embodiments.
- FIG. 5 is a flow chart illustrating an example of obtaining a correct reference pattern for anomaly detection in an example anomaly detection process, in accordance with example embodiments.
- FIG. 6 is a flow chart illustrating example generation of reference patterns, in accordance with example embodiments.
- FIG. 7 is a flowchart illustrating an example of anomaly detection of an example anomaly detection process, in accordance with example embodiments.
- FIG. 8 is a graph showing an example time series test signal in comparison to an example envelope defined by a corresponding reference pattern and threshold, in accordance with example embodiments.
- FIG. 9 is a plot showing a curve illustrating an example of time series data that contain anomalies, in accordance with example embodiments.
- FIG. 10 is a plot illustrating an example of alignment of different reference periods of training time series data, in accordance with example embodiments.
- FIG. 11 is a plot illustrating a fast Fourier transform of example time series data, in accordance with example embodiments.
- FIG. 12 is a plot showing an example reference pattern, in accordance with example embodiments.
- FIG. 13 is a plot showing an example deviation sequence, in accordance with example embodiments.
- FIG. 14 is a plot showing a magnified view of a section of an example deviation sequence for threshold determination, in accordance with example embodiments.
- FIG. 15 is a plot illustrating an example of anomaly detection based on a reference pattern and threshold, in accordance with example embodiments.
- FIG. 16 is a simplified block diagram of an example computing system in which anomaly detection may be implemented, in accordance with example embodiments.
- FIG. 17 is a flow chart of an example method, in accordance with example embodiments.
- Example methods, devices, and systems are described herein. It should be understood that the words “example” and “exemplary” are used herein to mean “serving as an example, instance, or illustration.” Any embodiment or feature described herein as being an “example” or “exemplary” is not necessarily to be construed as preferred or advantageous over other embodiments or features unless stated as such. Thus, other embodiments can be utilized and other changes can be made without departing from the scope of the subject matter presented herein.
- any enumeration of elements, blocks, or steps in this specification or the claims is for purposes of clarity. Thus, such enumeration should not be interpreted to require or imply that these elements, blocks, or steps adhere to a particular arrangement or are carried out in a particular order.
- Analyzing time series data for anomalies presents a number of challenges when the sources of the data are collectively stored in Big Data distributed file system.
- Such data may not only be voluminous in terms of the amount of information represented, but also diverse in terms of types or subtypes of data, and the variety of time scales of interest that may be represented.
- the time scales may apply to sampling intervals between individual time series measurements, collection intervals over which measurements are made or obtained, and periodicities of the samples over possibly multiple periods and/or pseudo-periods.
- there can be temporal evolution of periodic trends in the time series data For example, there may be a persistent period of time series samples, while at the same time an underlying process that is subject to measurements represented in the samples evolves over a time scale much larger than the period. For such situations, long-term statistics that might otherwise enhance computational accuracy could wash dilute or wash out the long-term evolution.
- Big Data refers to the use of advanced data analytics methods to extract useful information from large amounts of data stored in databases.
- Big Data may in particular apply to the use of inductive statistics and concepts to infer laws from large sets of data with low information density to reveal relationships and dependencies, as well as to perform predictions of outcomes and behaviors.
- anomaly detection methods and computer systems disclosed herein are described using an example embodiment deployed on a Big Data Hadoop system. It should be understood that this example implementation is presented for illustrative purposes, and should not be seen a limiting with respect to the described embodiments or alternative embodiments.
- a method of detecting an anomaly in one or more periodic time series may be implemented in a computing device or computing system.
- some or all of the example method could be implemented in a software language, such as Java Spark.
- the method could be implemented in other software languages and/or machine instructions.
- Each time series may reflect temporal variation of a specific metric, such as call attempts in a telecommunications system or financial transactions in a global banking system.
- the time series may be collectively stored in one Big Data distributed file system.
- the method may entail steps and operations aimed at accommodating the size and variety of stored data, as well as accounting for a variety of time scales represented in the data.
- a user may engage in the example method through a user interface of the system, causing the system to carry out operations involving configuration of operational parameters of the method, as well as providing the user with analytical results for evaluation and further analyses.
- an example method may entail obtaining user preferences in the form of a set of configuration parameters, and then fixing the value of each configuration parameter according to user preferences.
- anomaly detection may then entail detecting an update of at least one the time series in the Big Data distributed file system, and obtaining, for each updated time series, the update from the Big Data distributed file system and a periodic reference pattern from a reference pattern database.
- each periodic reference pattern may be generated using an unsupervised pattern recognition algorithm, such as the WAD algorithm.
- a sample-by-sample deviation of each update from its corresponding periodic reference pattern may be determined, followed by comparing each deviation with a corresponding predetermined threshold. Finally signaling an anomaly may be signaled in each time series for which the deviation exceeds the corresponding predetermined threshold.
- the set of configuration parameters may include: a place of storage of the time series in the Big Data distributed file system; an identity of each time series where an anomaly is to be detected; the type of preprocessing, such as filtering and aggregation, to be performed on the time series prior to said anomaly detection steps; a type of mathematical technique, such as percentile or regression analysis, used for determination of a threshold; a type of computation, such as mean value calculation or median value calculation, used for the generation of a periodic reference pattern; a type of computation, such as mean value calculation or median value calculation, used for the generation of a periodic reference pattern; temporal parameters used for the generation of a periodic reference pattern; and a type of mathematical transform, if any, to be used for the generation of a periodic reference pattern.
- Other and/or additional configuration parameters could be included as well.
- a Big Data distributed file system may be a Hadoop distributed file system or HDFS.
- the periodic reference pattern may span a reference time period equal to the periodicity of the time series data.
- Non-limiting examples of the period include one day, one week, and one month. These examples could be relevant to monitored events in a telecommunications system, for example. It will be appreciated that example embodiments are not limited by any particular or specific time period specification.
- the unsupervised pattern recognition algorithm may involve the use of a Difference over Minimum or DoM transform.
- the one or more time series may reflect the temporal variation of a metric characterizing the behavior of a telecommunications network.
- time series data may represent other temporal process as well.
- the predetermined threshold may be time-dependent.
- the example method may involve correlating several time series to obtain a combined key performance indicator of an operational system.
- a distributed Big Data processing computer system configured to execute the example method as defined above.
- a method of detecting an anomaly in a periodic or pseudo-periodic sample time series may be implemented in a computing device or computing system.
- the periodic or pseudo-periodic sample time series may reflect measured temporal variation of a specific metric over a fixed reference time period after which the specific metric's temporal variation is known to essentially repeat itself.
- the sample time series may consist of a series of values of the metric measured or obtained at consecutive sample points in time separated from each other by a regular sample time interval.
- the example method may entail one phase involving reference model generation, and another phase involving anomaly detection.
- the reference model generation phase may include operations including obtaining a training time series that represents temporal variation of the specific metric over a length of time, referred to herein as an observation time window, corresponding to an integer multiple of the fixed reference time period.
- the observation time window should span at least three reference time periods.
- the training times series should consist of a series of values of the metric at consecutive points in time separated by regular sample time interval.
- obtaining the training time series data may also entail filtering and/or aggregating multiple sources of time series data in the Big Data distributed file system. For example, for telecommunications data representing operations relating to network service delivery, filtering could be used to select service type, such as voice call attempts, content streaming requests, or data session setup. Aggregation could include aggregating data over regions or subregions of a network, or aggregating data over service types. These are just a few examples.
- a next step may entail confirming that the training time series has a periodicity corresponding to the fixed reference time period.
- a periodic reference pattern based on the training time series may then be generated (or possibly obtained from a database).
- the periodic reference pattern may itself be a reference time series over the fixed reference time period that models anomaly-free behavior of the metric over the fixed reference time period. Generation of the periodic reference pattern is described in more detail below.
- a reference threshold based on the training time series may also be determined in order to later evaluate deviations between time series data and the periodic reference pattern.
- the number of subsets may be at least three.
- each subset may be time-aligned with the periodic reference pattern, and at each sample point, a deviation between the metric value and the reference pattern may be computed. Each deviation may then be stored in one or another form of memory.
- a deviation sequence may be constructed as a sequence of deviations ranked according to deviation size, from smallest to largest.
- the deviation sequence may then be represented as or fit with a curve, and the slope of the curve estimated as a function of deviation sequence rank.
- the deviation for which the slope of the curve is largest, while still remaining below a predetermined slope upper limit may then be identified as the reference threshold.
- the slope may be determined using piecewise linear regression.
- the periodic reference pattern, in the form of a time series of reference points, together with the reference threshold, may finally be stored in a reference model database as a reference model for use in anomaly detection.
- the anomaly detection phase may include obtaining a runtime time series data to be tested, determining deviations between the runtime time series and the reference model, and identifying any deviation that exceeds the threshold as an anomaly.
- generation of a periodic reference model may entail subdividing training time series data spanning an observation time window into a plurality of subsets, each corresponding to a reference time period over which the training time series exhibits periodicity, and time aligning the subsets with a common reference time. At each sample point of the aligned subsets, a statistical measure of the aligned sample time series values is computed and used to define a reference value of a reference pattern. Further details are presented in the following paragraphs.
- a training time series is first obtained.
- the training time series may represent temporal variation of the specific metric over a length of time corresponding to the observation time window, and including an integer number n of the fixed reference time period, again n being at least three in an example embodiment.
- the training times series may consist of a series of values of the metric at consecutive points in time separated by the regular sample time interval.
- the periodicity of the training time series may be confirmed, for example by apply a fast Fourier transform (FFT).
- FFT fast Fourier transform
- confirming periodicity may involve confirming that the average value of the training time series is different from zero.
- All of the subsets are then time-aligned with a common reference time, such that there are n metric values at each sample point of the time-aligned subsets.
- a median value M i is determined from the n metric values.
- the reference threshold is then determined as described above, and both the periodic reference pattern and the threshold are stored as a reference model in a reference model database.
- the anomaly detection phase may then be carried out as described above, and further discussed below.
- the fixed reference time period may be seven consecutive days, and in particular one week from Monday to Sunday, or a single day. Other reference time periods may be used as well.
- the number n may be equal to or greater than three.
- the specific metric may characterize the behavior of one or more network components and/or one or more network subscribers of a telecommunications network, and the telecommunications network may be a mobile telecommunications network.
- the regular sample time interval may be one of 1 hour, 15 minutes, or 30 minutes. These values may be appropriate for monitoring certain events in a telecommunications network. Other values could be determined according to a particular application of the example method.
- the example methods and systems described herein may be used to check for anomalies in any kind of time series that exhibits periodic or pseudo-periodic temporal behavior. This holds irrespective of the kind of metric whose temporal behavior the time series reproduces.
- the time series may, for example, represent the change in time of a stock market index, the time changes of the temperature of a liquid, or any other kind of metric having a periodic behavior in time.
- the example anomaly detection methods and systems are described herein as applied to traffic data generated by a telecommunications network.
- the example anomaly detection methods and systems may be part of a mobile network monitoring system.
- the traffic data, which is monitored for anomalies may be any kind of metric that is logged by the mobile network monitoring and analytics system.
- the example anomaly detection methods and systems may look for anomalies in data contained in Call Data Records or CDRs.
- the anomaly detection is performed in real time on data that is continually generated by the mobile telecommunications network.
- FIG. 1 is a conceptual representation of an anomaly detection system 100 in which an anomaly detection algorithm may be implemented in a distributed Big Data environment, in accordance with example embodiments.
- the anomaly detection system 100 includes a production database 104 , an anomaly detection algorithm 102 , configuration tools 106 , a reference pattern database 108 , and an anomaly results database 110 .
- Anomaly results 112 may be displayed in a display device, which may be part of a computing device or system in which the anomaly detection system 100 is implemented.
- the illustration in FIG. 1 is conceptual in the sense that the anomaly detection algorithm 102 and configuration tools 106 are represented as operational components.
- the analytical core of the system 100 is the anomaly detection algorithm 102 .
- this algorithm may be modeled on the WAD algorithm referred to above.
- the anomaly detection algorithm may include a training phase, in which training time series data are used to generate a reference pattern that models anomaly-free behavior of the time series data.
- a threshold is also determined during the training phase.
- the anomaly detection algorithm may also include detection phase, in which deviations between runtime time series data are the reference model are evaluated using the threshold, in order to identify deviations that may be classified or identified as anomalies.
- the WAD algorithm may incorporate training and detection phases, example embodiments of the anomaly detection algorithm 102 employed in the system 100 introduce significant improvements that make it more accurate and reliable in recognizing anomalies in time series data. These improvements are particularly advantageous in the modeling anomaly-free reference patterns and determining appropriate thresholds.
- the configuration tools 106 which may be implemented in a computing device and made available by a user interface, allow a user to set parameters that control filtering and aggregation of data to be used by the anomaly detection algorithm.
- parameters may be set that control time frames to be used for sliding time windows, sampling intervals of time series data, and periodicities to consider in the analyses, among other time scales.
- the anomaly detection algorithm 102 may be embedded in a Big Data environment. Operationally, anomaly detection algorithm 102 may fetch its data inputs from the production database 104 .
- This database may for example contain data characterizing the traffic on a mobile telecommunications network, though other types of time series data may be stored.
- the configuration tools 106 may enable a user to fix the values of a set of configuration parameters of the anomaly algorithm 102 .
- the anomaly detection algorithm 102 uses a reference pattern database 108 for anomaly detection, and stores results of anomaly detection carried in the anomaly results database 110 . It may also display anomaly results 112 as a graphical representation in a display device.
- the configuration tool 106 may also allow a user to change various settings of the anomaly detection algorithm 102 .
- the settings chosen by the user may be stored in a configuration file.
- a sample configuration file is illustrated in Table 1.
- a user may set parameters and make selections, such as:
- FIGS. 2 - 7 are flow charts show example operation of various aspects of the anomaly detection system 100 , showing successive levels of detail.
- FIG. 8 illustrates the concept of applying the reference pattern in to a test time series signal to detect anomalies. Each of these figures is discussed below.
- an example method of the present disclosure may be configured to detect anomalies in the time series signal of different metrics.
- FIG. 2 is a flow chart of high-level view of an example the anomaly detection process, in accordance with example embodiments.
- a use case involving a bank client has five different bank accounts with a specific bank may serve to illustrate operation of the anomaly detection algorithm, including improvements described herein, in the context of a Big Data environment.
- the anomaly detection method of the present disclosure applied in the illustrative use case, may be used to detect anomalies in the temporal evolution of the balance of each one of the five bank accounts.
- the temporal evolution of the balance of each bank account may be represented by a time series.
- These time series may each stored in the production database 104 .
- Each of these time series may represent one metric that may be analyzed by the anomaly detection method of the present disclosure.
- the time series stored in the production database 102 may be continually updated, for example as new transactions occur.
- the production database 104 may be part of a Big Data distributed file system, such as Hadoop distributed file system (HDFS).
- HDFS Hadoop distributed file system
- the process of the example method repeatedly executes a processing loop shown in FIG. 2 , for example, on an hourly or some other regular basis.
- the repeating process represented in FIG. 2 may be applied in series or in parallel to each of possibly multiple sets of time series data, such multiple bank accounts.
- the loop may initially start at step 202 , which in the example of FIG. 2 also represents the start of subsequent, regular executions of the loop. From the stating step 202 , the process proceeds to step 204 , which involves retrieving data from the production database 104 for the most recent time window, such as the last one hour partition. More specifically, the latest hourly values of all the metrics stored in the production database 104 may be retrieved in step 204 . The process then proceeds to 206 , in which actual time series signals to be tested are constructed from the raw data retrieved in the last partition. In accordance with example embodiments, time series construction may involve filtering and aggregating the data. The filtering and aggregation may be determined according to configuration parameters previously set using the configuration tools 106 .
- step 208 involves checking whether, for each time series to be analyzed, there is a matching reference pattern stored in the reference pattern database 108 . If there is no matching reference pattern, the process proceeds to steps 210 and 212 , in which a corresponding reference pattern is generated and stored in the reference pattern database 108 .
- the checking step 208 may involve determining in an existing pattern is stale or out of date. For example, a configuration parameter may specify that an existing pattern is out of date if it was generated more than a specified time period ago, such as one day or one week. This could be associated with a sliding time window, for example. Including an expiration time for patterns enables pattern generation to accommodate evolution in the time series data.
- step 214 the matching reference pattern is used to check the time series signal for anomalies.
- step 216 the anomalies found during step 214 are stored in anomaly results database 110 . As indicated by the curved gray arrows in the figure, steps 210 to 216 are carried out for each metric under consideration.
- Steps 210 and 212 may be considered as corresponding to the learning or training phase, which will be described more in detail below.
- Steps 214 and 216 may be considered as corresponding to the detection phase, also described in more detail below.
- FIG. 3 is a flow chart illustrating an example of data filtering used in an example anomaly detection process, in accordance with example embodiments
- FIG. 4 is a flow chart illustrating an example of data aggregation used in an example anomaly detection, in accordance with example embodiments.
- the filtering starts at step 302 with retrieving the filter setting selected by a user from the configuration file.
- a retrieval request may be formulated based on the filter setting.
- the relevant time period for consideration during anomaly detection may be added to the data retrieval request.
- the period may be one hour. This means that the data from only the last hour would be retrieved from the production database 104 and be subject to anomaly detection. Other time periods could be specified as well.
- the relevant data may then be retrieved from the production database 104 based on the retrieval request.
- the data in the production database 104 may also be aggregated to build up the test time series signals, as a further aspect of specifying the to be checked for anomalies.
- An example of data aggregation is shown in FIG. 4 . It may be noted that, while filtering is done just at the data retrieval steps, aggregation may be applied multiple time to retrieved data, for example at the start of each counter process.
- the next metric for which to build up the test time series signal may be selected.
- the relevant data are aggregated according to the preferences set stored in the configuration file. As described above, preferences may be set and stored in the configuration file by a user.
- the test time series signal may the built up or constructed in step 406 . Once the time series signal (e.g., time series data) has been constructed, execution depends on whether or not a reference pattern for the selected metric already exists.
- time series signal e.g., time series data
- step 408 entails building up a training set that can then be used to generate a reference pattern.
- pattern generation is carried out at step 410 .
- a reference pattern already exists it may be retrieved from the reference pattern database 108 , as indicated at step 412 .
- a relevant threshold may also be retrieved with the pre-existing reference pattern.
- FIG. 5 next illustrates how the correct reference pattern for a given time series signal may be retrieved from the reference pattern database 108 .
- FIG. 5 is a flow chart illustrating an example of obtaining a correct reference pattern for anomaly detection in an example anomaly detection process, in accordance with example embodiments.
- the process is initiated at step 502 , which also entails loading of configuration.
- step 504 the last partition of the distributed file system is located, followed at step 506 by determination of the name of the day to which last partition corresponds.
- the number of days that have passed since the last generation of a reference pattern is next determined at step 508 , and a retrieval key is then generated at step 510 .
- the time since the last pattern generation may be measured in any time unit appropriate to the time series and temporal processes and time scales under consideration. Thus, “days since the last pattern generation” is illustrative.
- the key which may be used to identify a unique reference pattern, is a function of the number of days that have passed since the last reference pattern generation day, and also of the nature of the relevant metric and the type of filtering and aggregation done on the data. There may be other possible factors in key generation, as well.
- the next step, 512 entails checking whether there is already a reference pattern stored in the reference pattern database 108 that matches the generated key. If not, then a reference pattern first needs to may be generated at step 514 . Note that a failure to find matching pattern includes the possibility of finding an out of date or expired pattern. In accordance with example embodiments, reference patterns may expire after a predetermined amount of time. Further, the predetermined amount of time may be stored in the configuration file.
- the process then goes to steps 516 to 520 . Specifically, the matching reference pattern is fetched from the reference pattern database 108 . Once the reference pattern is retrieved, anomaly detection may be carried out at step 522 .
- FIG. 6 is a flow chart illustrating example generation of reference patterns, in accordance with example embodiments.
- the process of reference pattern generation process may be considered a learning or training phase of the anomaly detection algorithm 102 .
- the first step 602 of the process of FIG. 6 initiates a test for periodicity of the time series signal to be analyzed.
- this test may entail computing a fast Fourier transform (FFT) of the time series data, as shown at step 604 .
- FFT fast Fourier transform
- the test looks for a periodicity of one week, however, the test may search for other periodicities. If the average of the time series is zero, this may generally be taken as an indication that the signal is not periodic. A more rigorous test would be to determine that the maximum value equals zero.
- a period is detected, which may entail computation of the period at step 606 , followed by creation of signal segments at step 608 .
- signal segments are created on a granularity of days and hours.
- signal segments, or just segments correspond to a sampling interval between individual data or sample values of a time series.
- a median value is computed per segment at step 610 .
- the time series data used for training or learning may span an observation time window that includes multiple periods of the data, where the period is that determined or confirmed by the FFT.
- the time series data may then be subdivided into subsets, each spanning one period, also referred to as a reference time period.
- a minimum of three reference periods is used to determine the reference pattern. That is, the observation time window may be at least as long as three periods.
- the three (or more) subsets of data each include the same number N of sample points, each corresponding to a metric value.
- the three (or more) subsets may be time-aligned with a common reference time, such that their respective sample points also align. At each time-aligned sample point, there will therefore be three (or more) metric values, one from each subset.
- the median of the three (or more) metric values is taken at each respective sample point of the time-aligned subsets, and is set to a reference value of the reference pattern at the respective sample point. The set of all median values at all the sample points of the time-aligned subset thereby forms the sample pattern.
- a median value provides an advantage over a mean value in the WAD algorithm, and is one of the bases for the improvement disclosed herein.
- An advantage of using the median may be understood by considering a simple example, in which the median of three metric values at a particular sample point is computed. Suppose, by way of example, the three values are 0, 14, and 16. The value of 0 is most likely an anomaly. The median of the three is 14. In contrast, the mean is 10. Thus, the median gives a better estimate of an anomaly-free reference value than does the mean, which is used in the WAD algorithm.
- test thresholds may be determined using a regression method either instead of or in addition to using a percentile method. This, too, provides an improvement over existing WAD approaches. Further details of threshold determination are described below.
- the generated reference pattern and threshold are stored in the reference pattern database 108 .
- FIG. 7 is a flowchart illustrating an example of anomaly detection of an example anomaly detection process, in accordance with example embodiments. More particularly, once a pattern is generated and stored with the determined threshold, they may be applied in an example embodiment of the anomaly detection algorithm.
- a test set of the time series data is created. The test set includes data segmented in time, such as days and/or hours.
- distances between the pattern and the test set are computed. As described in connection with FIG. 2 , the patterns may be retrieved from the pattern database 108 .
- the computed distances are compared with the threshold, and those that exceed the threshold are identified as anomalies. Finally, the identified anomalies are stored in the anomaly database 110 . Subsequently, the anomaly data may be retrieved and processed using various visualization applications enabling a user to examine and analyze the anomalies.
- FIG. 8 is a graph showing an example time series test signal in comparison to an example envelope defined by a corresponding reference pattern and threshold, in accordance with example embodiments.
- the example time series test signal T is illustrative of time series data that may be analyzed for anomaly detection.
- the time series test signal T is shown to include an anomaly, represented by a sharp, tall peak demarked with a black dot.
- the graph in FIG. 8 also shows corresponding reference pattern, which may be visualized as an envelope E surrounding the time series T.
- the anomaly to be detected here is the large spike in the time series at 3 AM.
- the graph shows temporal evolution of the metric corresponding to the time series over 24 hours on Apr. 22, 2018.
- Example embodiments disclosed herein provide at least four improvements over the WAD algorithm. These may be summarized as follows.
- using the median instead of the mean in determining the pattern allows data that includes anomalies to be included in pattern generation, while at the same time suppressing the influence of anomalous data values in the pattern.
- the advantage of using periodicities appropriate to the time series data under consideration may be further enhanced by use of a sliding time window. As described below, this allows natural trends in the data over time scales longer than the periodicity to be accommodated without such trends being mistaken as anomalies.
- a natural growth trend in call traffic over the course of one year may induce only a mild effect over the course of, say, a three week sliding time window, such that three weeks of data are sufficient to determine a pattern and identify anomalies during any given three week window.
- advancing the sliding window by one week may be sufficient to observe changes in the pattern, such that the need for generating a new pattern every one or a few weeks may be detected and used to trigger operations to update the pattern and threshold.
- the anomaly detection algorithm may be used to detect anomalies in the number of call attempts per hour for a given radio cell of a mobile communications network.
- the use case presented is based on simulated data. However, there is no loss of generality, and the anomaly detection algorithm may be implemented in an actual operational environment of a telecommunications network.
- FIGS. 9 to 15 The simulation illustrated by FIGS. 9 to 15 is based on the following scenario.
- a pseudo periodic time series may be considered a time series that exhibits at least approximate periodicity. More precisely, the sample point values may repeat to within a predetermined threshold deviation with an observed and/or measurable period.
- a period of one week may be observed, such that the number of call attempts during the same hour of the same day each week is the same to within a threshold.
- the number need not be identically equal during the same hour of the same day each week; just within the threshold.
- any given sample may deviate by more than the threshold. Such a deviation may represent an anomaly if it meets the criteria of the anomaly detection algorithm disclosed herein.
- FIG. 9 is a plot showing a curve illustrating an example of time series data that contain anomalies, in accordance with example embodiments.
- the first anomaly is referenced by the label A.
- the second anomaly is indicated by the label B. It corresponds to an unusual dip in the number of call attempts on Friday, July 6 during the afternoon. This could be caused, for example, by an evacuation in Montreal affecting the radio cell. During the evacuation, very few people are left in the cell so that very few calls are made.
- the algorithm goes through its reference model generation phase.
- the reference model generation phase is based on a training time series, which is illustrated by FIG. 10 , which is a plot illustrating an example of alignment of different reference periods of training time series data, in accordance with example embodiments.
- the training time series consists of the number of call attempts per hour over a time period of three weeks. In FIG. 10 , those three weeks are overlaid and time-aligned to visualize the anomalies.
- the dashed curve shows the number of call attempts for the first week, the dashed-dotted curve the number of call attempts for the second week, and the dotted curve the number of call attempts for the third week. Each week corresponds to one subset of the training time series.
- the second subset corresponding to the second week does not display any noticeable anomalies.
- the third subset corresponding to the third week evidently, and also by way of example, has an anomaly referenced E. This anomaly is an unusually low number of call attempts on Thursday.
- the whole training time series spanning the three weeks is subjected to a Fast Fourier (FFT) transform, the result of which is shown in FIG. 11 .
- FFT Fast Fourier
- This FFT displays a dominant frequency F, which, in the current example, corresponds to the fixed reference time period of one week.
- the training time series of FIG. 10 can be used to generate the reference model. That is, the periodicity test has confirmed periodicity (or pseudo-periodicity).
- FIG. 12 is a plot showing an example reference pattern, in accordance with example embodiments.
- FIG. 12 depicts a reference pattern generated from the three weeks of data shown in FIG. 10 . As described above, this may be achieved by, for each hour of the week, taking the corresponding value for each of the three curves of FIG. 10 , and then computing the median value for each of these three values.
- the resulting reference pattern shown in FIG. 12 is a time series of median values, representing the anomaly free behavior of the number of call attempts per hour over any given one week of the training data. That is, the reference pattern shows what an anomaly-free week would look like.
- the algorithm uses the median value instead of the mean value, the reference pattern is not noticeably affected by the anomalies C, D and E shown in FIG. 10 .
- the deviation sequence is represented as a curve in FIG. 13 . That is FIG. 13 is a plot showing an example deviation sequence, in accordance with example embodiments.
- Determination of the threshold is made by considering the region of the deviation sequence curve containing the most rapid increase, and indicated in FIG. 13 by the dashed oval.
- the magnified portion of FIG. 13 is shown in FIG. 14 , which is a plot showing a magnified view of a section of an example deviation sequence for threshold determination, in accordance with example embodiments.
- the slope of the curve of FIG. 13 as a function of deviation sequence rank may be estimated. This is illustrated by the lines labeled L in FIG. 14 .
- the deviation size within the deviation sequence at which the slope is the largest while still remaining below a predetermined slope upper limit is then set as the reference threshold for the reference model.
- the reference threshold is set at 6, which is the deviation size at rank 27.
- Using a slope estimation instead of a percentile method, such as is used in the WAD algorithm, to determine the reference threshold reduces the risk of defining a too high reference threshold. Note that too high a threshold would result in missed anomalies, since the threshold may be considered a tolerance for deviations between time series data and the reference pattern not being anomalies.
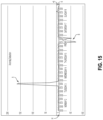
- FIG. 15 is a plot illustrating an example of anomaly detection based on a reference pattern and threshold, in accordance with example embodiments.
- FIG. 15 In which the curve of deviations represents differences between the sample time series and the reference pattern.
- a corridor labeled H in FIG. 15 corresponds to the determined reference threshold. It may be seen that the corridor extends six units above and below the horizontal axis.
- the anomaly detection algorithm may now detect the deviation A as a first anomaly, since it extends above the corridor H. It will also detect the deviation B as a second anomaly, since it extends below the corridor H. Comparison with FIG. 9 reveals that the anomaly detection algorithm has correctly detected the two anomalies.
- each reference value of the reference pattern e.g., each computed median value
- a standard deviation may also be computed.
- Such a threshold is referred to herein as a time-dependent threshold.
- a time-dependent threshold would result in a corridor of varying width as a function of time across the deviation plot of FIG. 15 .
- the anomaly detection as described above may additionally involve the use of a mathematical transform.
- a mathematical transform may, however, be considered optional.
- DoM transform may be advantageous for considering strong variations in the time series.
- FIG. 16 is a simplified block diagram of an example computing system (or computing device) 1600 .
- the computing system 1600 may be representative of a component of a Big Data distributed file system, or may be communicatively connected a Big Data distributed file system, for example.
- the computing system 1600 can be configured to perform and/or can perform one or more acts, such as the acts described in this disclosure.
- the computing device 1600 may include processor(s) 1602 , memory 1604 , network interface(s) 1606 , and an input/output unit 1608 .
- the components are communicatively connected by a bus 1610 .
- the bus could also provide power from a power supply (not shown).
- Processors 1602 may include one or more general purpose processors and/or one or more special purpose processors (e.g., digital signal processors (DSPs) or graphics processing units (GPUs). Processors 1602 may be configured to execute computer-readable instructions that are contained in memory 1604 and/or other instructions as described herein.
- DSPs digital signal processors
- GPUs graphics processing units
- Memory 1604 may include firmware, a kernel, and applications, among other forms and functions of memory. As described, the memory 1604 may store machine-language instructions, such as programming code or non-transitory computer-readable storage media, that may be executed by the processor 1602 in order to carry out operations that implement the methods, scenarios, and techniques as described herein. In some examples, memory 1604 may be implemented using a single physical device (e.g., one magnetic or disc storage unit), while in other examples, memory 1604 may be implemented using two or more physical devices. In some examples, memory 1604 may include storage for one or more machine learning systems and/or one or more machine learning models as described herein.
- machine-language instructions such as programming code or non-transitory computer-readable storage media
- the computing system 1600 can execute program instructions in response to receiving an input, such as an input received via the communication interface 1606 and/or the user interface 1608 .
- the data storage unit 1604 can also store other data, such as any of the data described in this disclosure.
- the communication interface 1606 can allow the computing system 1600 to connect with and/or communicate with another entity according to one or more protocols.
- the communication interface 1606 can be a wired interface, such as an Ethernet interface.
- the communication interface 1606 can be a wireless interface, such as a cellular or WIFI interface.
- the user interface 1608 can allow for interaction between the computing system 1600 and a user of the computing system 1600 , if applicable.
- the user interface 1608 can include, or provide an interface connection to, input components such as a keyboard, a mouse, a touch sensitive panel, and/or a microphone, and/or output components such as a display device (which, for example, can be combined with a touch sensitive panel), and/or a sound speaker.
- the client device 1612 may provide user interface functionalities.
- the computing system 1600 can also include one or more connection mechanisms that connect various components within the computing system 1600 .
- the computing system 1600 can include a connection mechanism 1610 that connects components of the computing system 1600 , as shown in FIG. 16 .
- Network interface(s) 1606 may provide network connectivity to the computing system 1600 , such as to the internet or other public and/or private networks. Networks may be used to connect the computing system 1600 with one or more other computing devices, such as servers or other computing systems. In an example embodiment, multiple computing systems could be communicatively connected, and example methods could be implemented in a distributed fashion.
- Client device 1612 may be a user client or terminal that includes an interactive display, such as a GUI. Client device 1612 may be used for user access to programs, applications, and data of the computing device 1600 . For example, a GUI could be used for graphical interaction with programs and applications described herein. In some configurations, the client device 1612 may itself be a computing device; in other configurations, the computing device 1600 may incorporate, or be configured to operate as, a client device.
- a GUI could be used for graphical interaction with programs and applications described herein.
- the client device 1612 may itself be a computing device; in other configurations, the computing device 1600 may incorporate, or be configured to operate as, a client device.
- Database 1614 may include storage for input and/or output data, such a production database for storing time series data, a configuration database for storing configuration data, and/or an anomaly results database for storing results the anomaly detection techniques described herein.
- the computing system 1600 can include one or more of the above-described components and can be arranged in various ways.
- the computer system 1600 can be configured as a server and/or a client (or perhaps a cluster of servers and/or a cluster of clients) operating in one or more server-client type arrangements, for instance.
- FIG. 17 show a flows chart a method 1700 illustrating an example embodiment a method for anomaly detection.
- the method illustrated by FIG. 17 may be carried out by, or in the context of, a Big Data distributed file system, which may include one or more a computing devices or systems, such as computing device 1600 .
- a computing device or systems such as computing device 1600 .
- the process can be carried out by other types of devices or device subsystems.
- the process could be carried out by a portable computer, such as a laptop or a tablet device.
- method 1700 may be simplified by the removal of any one or more of the features shown therein. Further, these embodiments may be combined with features, aspects, and/or implementations of any of the previous figures or otherwise described herein.
- the example method 1700 may also be embodied as instructions executable by one or more processors of the one or more server devices of the system or virtual machine or container.
- the instructions may take the form of software and/or hardware and/or firmware instructions.
- the instructions may be stored on a non-transitory computer readable medium. When executed by one or more processors of the one or more servers, the instructions may cause the one or more servers to carry out various operations of the example method.
- Block 1702 of example method 1700 may involve obtaining training time series data from a production database, the training time series data spanning an observation time window and comprising a series of values of a metric at regularly-spaced sample points in time, the regular spacing equal to an inter-sample time interval.
- Block 1704 may involve analyzing the training time series data to determine one of a periodicity or a pseudo-periodicity of the training time series data across a plurality of consecutive, repeating sub-windows that span the observation time window, each equal in size to a reference time period and each spanned by the same number N of sample points of metric values, wherein N is a positive integer greater than one.
- Block 1706 may involve determining a reference pattern comprising a series of N sample points of reference values spanning the reference time period and separated from one another by the inter-sample time interval, the reference pattern corresponding to a model time series having no anomalies greater than a threshold anomaly with respect to the periodicity or pseudo-periodicity.
- Block 1708 may involve determining a reference threshold.
- Block 1710 may involve storing the reference pattern and the reference threshold in a reference database.
- Block 1712 may involve obtaining runtime time series data from the production database, the runtime time series data spanning a runtime observation widow equal to the reference time period, and comprising runtime values of the metric at N sample points in time, separated from one another by the inter-sample time interval.
- Block 1714 may involve time aligning the N sample points of the reference pattern with the N sample points of runtime observation window.
- Block 1716 may involve computing runtime deviations between the runtime values and the reference values of the reference pattern at each of the N time aligned sample points.
- Block 1718 may involve identifying each of zero or more runtime deviations having an absolute value that exceeds the reference threshold as an anomaly.
- block 1720 may involve graphically displaying each identified anomaly and its corresponding sample time in a display device of the computing system.
- analyzing the training time series data to determine one of a periodicity or a pseudo-periodicity of the training time series data across the plurality of consecutive, repeating sub-windows may entail computing a fast Fourier transform (FFT) of the training time series data, identifying in the FFT a period equal to the reference time period in the FFT data.
- FFT fast Fourier transform
- equality may not be exact, but rather to within a pre-determined statistical uncertainty.
- periodicity or pseudo-periodicity may be recognized by determining that a computed average value of the training time series data differs from zero by greater than a predefined statistical uncertainty, or that the time series data have maximum value of training data greater than zero even if the average is zero.
- the training time series data may be considered periodic if the respective values of the metrics across the observation time window repeat to within a predefined statistical uncertainty of a respective, repeating expected value with a period equal to the reference period.
- the training time series data may be considered pseudo-periodic if the training time series data are periodic except for a non-zero but threshold-limited number of respective values of the metrics that deviate from the respective, repeating expected value by more than an anomaly threshold that is at least as large as the predefined statistical uncertainty.
- the plurality of consecutive, repeating sub-windows that span the observation time window includes at least three consecutive, repeating sub-windows.
- determining the reference pattern may entail temporally aligning the N sample points of each of the plurality of consecutive, repeating sub-windows with respect to a common starting reference time, and computing a median of the values of the metric at each temporally aligned sample point. The reference values of the reference pattern may then be set to the computed median values.
- determining a reference threshold may comprise computationally aligning the N sample points of the reference pattern with the N sample points of each of the plurality of consecutive, repeating sub-windows, and computing a deviation between the value of the metric and the reference value at each computationally aligned sample point.
- the deviation may then be arranged in a ranked deviation sequence, from smallest to largest, in which each ranked deviation is associated with a sample point and metric value of the training time series data.
- the reference threshold may then be set to the value of the metric at a particular sample point at which a rate of change between consecutive associated deviations is maximum among all consecutive deviations having rates of change below a rate upper limit.
- the rates of change between the consecutive deviations in the ranked deviation sequence may correspond to a slope of a curve of the deviations as a function of ranking.
- the method further entail determining the slope of the curve at associated sample points using piecewise linear regression.
- the example method may further entail computing a respective standard deviation for each computed median value of the metric at each temporally aligned sample point, and computationally propagating the respective standard deviations to determine a respective threshold value at each sample point of the reference pattern.
- a time-dependent reference threshold may be derived. That is, a different respective threshold may be determined for each sample point of the reference pattern.
- determining the reference pattern comprising the series of N sample points of reference values may entail retrieving a previously-determined reference pattern from the reference database.
- determining a reference threshold may entail retrieving a previously-determined reference threshold from the reference database.
- the observation time window corresponds to a sliding time window that may be advance across the time series data in the production database.
- determining the reference pattern may entail whether a previously-generated reference pattern in the reference database is out-of-date with respect to at least one of the runtime time series data or the sliding time window.
- the previously-generated reference pattern and an associated previously-determined threshold may be retrieved from a reference pattern database, for example. If the previously-generated reference pattern is not out of date, then it and the associated previously-determined threshold may be used instead of generating a new pattern and threshold. If the previously-generated reference pattern is out of date, then a new reference pattern and threshold may be generated according to the steps described above.
- the metric may characterize performance of an operational aspect of a telecommunications network.
- the operational aspect may include operation of one or more network components, or operation of one or more communication sessions of users of the telecommunications network.
- the training time series data and the runtime time series data may be or include performance log data of the telecommunications network.
- the inter-sample time interval may be 15 minutes, one hour, or one day, and the reference time period may be one week. Other values for these timescales are possible as well.
- the example method may further entail storing each identified anomaly in an anomaly database.
- the production database may be a single Big Data distributed file system (BDDFS), and the production database may include or be associated with configuration data including configuration parameters of the method.
- the example method may further entail presenting the configuration parameters on an interactive user interface of the computing system, receiving input from the interactive user interface to modify zero or more configuration parameters, storing the modified configuration parameters, and carrying out at least one step of the method according to at least on stored configuration parameter.
- DDFS Big Data distributed file system
- the example method may also be able to operate in an autonomous mode in which the operations described in blocks 1702 through 1720 execute in an autonomous loop according to triggering criteria.
- the autonomous mode may entail applying the observation time window as a sliding window, and in response to determining that a previously-generated reference pattern is out of with respect to at least one of the sliding window or the runtime time series advancing the sliding window prior to obtaining the training time series data and the runtime time series, then determining the reference pattern as an updated reference pattern to the previously-generated pattern, and determining the reference threshold an updated reference threshold to a previously-generated reference threshold. Then, anomalies may be identified in the runtime time series obtained after advancing the time window.
- the configuration parameters may include one or more of a storage location in the BDDFS of the training time series data and the runtime time series data; an identity of the runtime time series data; one or more pre-processing parameters; specification of a mathematical technique for use in determining at least one of the reference pattern or the reference threshold; specification of a mathematical technique for use in analyzing the training time series data for periodicity or pseudo-periodicity; the inter-sample time interval; or the reference time period.
- each step, block, and/or communication can represent a processing of information and/or a transmission of information in accordance with example embodiments.
- Alternative embodiments are included within the scope of these example embodiments.
- operations described as steps, blocks, transmissions, communications, requests, responses, and/or messages can be executed out of order from that shown or discussed, including substantially concurrently or in reverse order, depending on the functionality involved.
- blocks and/or operations can be used with any of the message flow diagrams, scenarios, and flow charts discussed herein, and these message flow diagrams, scenarios, and flow charts can be combined with one another, in part or in whole.
- a step or block that represents a processing of information can correspond to circuitry that can be configured to perform the specific logical functions of a herein-described method or technique.
- a step or block that represents a processing of information can correspond to a module, a segment, or a portion of program code (including related data).
- the program code can include one or more instructions executable by a processor for implementing specific logical operations or actions in the method or technique.
- the program code and/or related data can be stored on any type of computer readable medium such as a storage device including RAM, a disk drive, a solid state drive, or another storage medium.
- the computer readable medium can also include non-transitory computer readable media such as computer readable media that store data for short periods of time like register memory and processor cache.
- the computer readable media can further include non-transitory computer readable media that store program code and/or data for longer periods of time.
- the computer readable media may include secondary or persistent long term storage, like ROM, optical or magnetic disks, solid state drives, compact-disc read only memory (CD-ROM), for example.
- the computer readable media can also be any other volatile or non-volatile storage systems.
- a computer readable medium can be considered a computer readable storage medium, for example, or a tangible storage device.
- a step or block that represents one or more information transmissions can correspond to information transmissions between software and/or hardware modules in the same physical device.
- other information transmissions can be between software modules and/or hardware modules in different physical devices.
Landscapes
- Engineering & Computer Science (AREA)
- Theoretical Computer Science (AREA)
- Physics & Mathematics (AREA)
- General Physics & Mathematics (AREA)
- Data Mining & Analysis (AREA)
- Databases & Information Systems (AREA)
- Mathematical Physics (AREA)
- General Engineering & Computer Science (AREA)
- Software Systems (AREA)
- Computational Linguistics (AREA)
- Mathematical Optimization (AREA)
- Pure & Applied Mathematics (AREA)
- Mathematical Analysis (AREA)
- Artificial Intelligence (AREA)
- Computational Mathematics (AREA)
- Evolutionary Computation (AREA)
- Probability & Statistics with Applications (AREA)
- Fuzzy Systems (AREA)
- Computer Vision & Pattern Recognition (AREA)
- Computing Systems (AREA)
- Evolutionary Biology (AREA)
- Bioinformatics & Computational Biology (AREA)
- Bioinformatics & Cheminformatics (AREA)
- Life Sciences & Earth Sciences (AREA)
- Algebra (AREA)
- Medical Informatics (AREA)
- Discrete Mathematics (AREA)
- Operations Research (AREA)
- Debugging And Monitoring (AREA)
Abstract
Description
| TABLE 1 |
| #Databases location |
| hiveDatawareHouseURL=/user/hive/warehouse/astellia.db/ |
| #Spark generic configuration |
| sparkConfParam1=hive.execution.engine:mr |
| sparkConfParam2=hive.exec.dynamic.partition.mode:nonstrict |
| sparkConfParam3=hive.exec.dynamic.partition:true |
| sparkConfParam4=hive.exec.compress.output:true |
| #ouptut storage type |
| outputType=orc |
| #ouptut storage (should be same as hiveDatawareHouseURL) |
| outputPath=/user/hdfs_astellia/anomalydetect |
| #database name for pattern storage |
| patternDatabaseName=anomaly_pattern_hour |
| #database name for references of all patterns |
| referenceDatabaseName=anomaly_reference |
| #granularity of database in input |
| timeGranularity=hour |
| #pattern recognition periodicity |
| patternPeriod=week |
| #pattern days for generate (if pattern period is week, should be a multiple |
| of 7) |
| patternDaysDeep=21 |
| #optional day to test instead of last partition |
| #dayToTest=year=2018/month=4/day=15 |
| #cube name for input |
| inputTableName=data_an_service_hour |
| #database name for input cube |
| inputDatabaseName=inputDB |
| #counters to check for anomaly |
| columnToAdd1=active_subs_nb |
| columnToAdd2=impacted_subs_nb |
| #list of cube dimensions |
| inputDimension1=rat |
| inputDimension2=sqm_service_id |
| inputDimension3=id_saicluster |
| #list of group by dimensions for extraction request |
| groupByDimension1=id_saicluster |
| groupByDimension2=sqm_service_id |
| #where clause for cube extraction |
| whereClause=id_saicluster=0 and sqm_service_id=1 and rat=0 |
| #threshold for FFT (periodicity check) |
| fftThreshold=93 |
| #threshold for percentile used for anomaly check |
| patternThreshold=99 |
-
- Choose the source of the data that is to be analyzed for anomalies;
- Set a system configuration;
- Choose the metrics within the data which are to be checked for anomalies;
- Choose the kind of filtering and/or aggregation, if any, to be applied to the data prior to the actual anomaly detection;
- Define correlations between metrics to obtain a combined key performance indicator;
- Choose the type of mathematical technique, such as percentile and/or regression analysis, used for the determination of a threshold used in anomaly detection;
- Choose the type of calculation, such as mean value calculation or median value calculation used for the generation of a periodic reference pattern;
- Choose the value of temporal parameters used for the generation of a periodic reference pattern;
- Choose a type of mathematical transform, if any, to be used for the generation of a periodic reference pattern.
-
- The use of the median value instead of the mean value during the learning phase of the algorithm to obtain an anomaly free pattern. Using the median value instead of the mean value leads to a more reliable pattern generation that is free of anomalies.
- The use of a regression method instead of or in addition to a percentile method for calculating the thresholds. This provides a more accurate and reliable way to identify deviations between time series data and the reference pattern as anomalies.
- The ability to generate time-dependent thresholds, where time dependence refers to sample times within a reference pattern. Time-dependent thresholds may be weighted depending on time, and may be computed using standard deviations of the test values used in determining the reference values at each sample point of the reference pattern.
- The use of periodicities that most appropriate to the types of time series data under consideration. For example, for telecommunications data, weekly patterns may be better suited than daily patterns for generating reference patterns and identifying anomalies. This may be because weekly patterns allow for the differentiation between weekends and weekdays.
Claims (19)
Priority Applications (1)
| Application Number | Priority Date | Filing Date | Title |
|---|---|---|---|
| US16/708,605 US11645293B2 (en) | 2018-12-11 | 2019-12-10 | Anomaly detection in big data time series analysis |
Applications Claiming Priority (2)
| Application Number | Priority Date | Filing Date | Title |
|---|---|---|---|
| US201862777887P | 2018-12-11 | 2018-12-11 | |
| US16/708,605 US11645293B2 (en) | 2018-12-11 | 2019-12-10 | Anomaly detection in big data time series analysis |
Publications (2)
| Publication Number | Publication Date |
|---|---|
| US20200183946A1 US20200183946A1 (en) | 2020-06-11 |
| US11645293B2 true US11645293B2 (en) | 2023-05-09 |
Family
ID=70971697
Family Applications (1)
| Application Number | Title | Priority Date | Filing Date |
|---|---|---|---|
| US16/708,605 Active 2041-02-19 US11645293B2 (en) | 2018-12-11 | 2019-12-10 | Anomaly detection in big data time series analysis |
Country Status (1)
| Country | Link |
|---|---|
| US (1) | US11645293B2 (en) |
Cited By (6)
| Publication number | Priority date | Publication date | Assignee | Title |
|---|---|---|---|---|
| US20220101625A1 (en) * | 2021-12-13 | 2022-03-31 | Intel Corporation | In-situ detection of anomalies in integrated circuits using machine learning models |
| US20220229903A1 (en) * | 2021-01-21 | 2022-07-21 | Intuit Inc. | Feature extraction and time series anomaly detection over dynamic graphs |
| US20220335347A1 (en) * | 2021-04-15 | 2022-10-20 | Business Objects Software Ltd | Time-series anomaly prediction and alert |
| US20240007342A1 (en) * | 2022-06-30 | 2024-01-04 | Juniper Networks, Inc. | Framework for automated application-to-network root cause analysis |
| US20240028744A1 (en) * | 2022-07-21 | 2024-01-25 | University Of Chinese Academy Of Sciences | Dynamic network risk predicting method based on a graph neural network |
| US12238069B2 (en) | 2022-11-30 | 2025-02-25 | Juniper Networks, Inc. | Self-correcting service level agreement enforcer |
Families Citing this family (24)
| Publication number | Priority date | Publication date | Assignee | Title |
|---|---|---|---|---|
| US11388040B2 (en) | 2018-10-31 | 2022-07-12 | EXFO Solutions SAS | Automatic root cause diagnosis in networks |
| EP3866395B1 (en) | 2020-02-12 | 2024-05-22 | EXFO Solutions SAS | Method and system for determining root-cause diagnosis of events occurring during the operation of a communication network |
| US11720569B2 (en) * | 2020-04-07 | 2023-08-08 | Sap Se | Determining threshold values based on sampled data |
| US11095544B1 (en) * | 2020-06-17 | 2021-08-17 | Adobe Inc. | Robust anomaly and change detection utilizing sparse decomposition |
| US11989657B2 (en) * | 2020-10-15 | 2024-05-21 | Oracle International Corporation | Automated machine learning pipeline for timeseries datasets utilizing point-based algorithms |
| CN112308170B (en) * | 2020-11-10 | 2024-08-20 | 维沃移动通信有限公司 | Modeling method, device and electronic equipment |
| CN112269903B (en) * | 2020-11-19 | 2024-06-11 | 咪咕文化科技有限公司 | Data processing method, data processing device and readable storage medium |
| TWI765452B (en) * | 2020-12-08 | 2022-05-21 | 日商Jfe鋼鐵股份有限公司 | Trigger condition determination method for time-series signal, abnormality diagnosis method for monitored equipment, and trigger condition determination device for time-series signal |
| WO2022123640A1 (en) * | 2020-12-08 | 2022-06-16 | Jfeスチール株式会社 | Time series signal trigger condition determination method, method for diagnosing abnormality in monitored facility, and time series signal trigger condition determination device |
| CN112612671B (en) * | 2020-12-16 | 2024-08-16 | 深圳前海微众银行股份有限公司 | System monitoring method, device, equipment and storage medium |
| US12052134B2 (en) | 2021-02-02 | 2024-07-30 | Exfo Inc. | Identification of clusters of elements causing network performance degradation or outage |
| US11936542B2 (en) * | 2021-04-02 | 2024-03-19 | Samsung Electronics Co., Ltd. | Method of solving problem of network and apparatus for performing the same |
| CN113239956B (en) * | 2021-04-08 | 2024-01-19 | 深圳市银宝山新科技股份有限公司 | Injection mold state diagnosis method, device, computer equipment and storage medium |
| CN113689040B (en) * | 2021-08-25 | 2024-03-15 | 长江存储科技有限责任公司 | Control method and control system of measurement model and computer-readable medium |
| CN113965286B (en) * | 2021-09-28 | 2024-04-23 | 昆高新芯微电子(江苏)有限公司 | Detection and judgment method and device for TSN time window |
| CN114017136B (en) * | 2021-11-02 | 2024-08-16 | 浙江大唐国际绍兴江滨热电有限责任公司 | Soft light word plate alarming method and system of combined cycle generator set |
| US12561407B2 (en) | 2021-11-17 | 2026-02-24 | Oracle International Corporation | One-pass approach to automated timeseries forecasting |
| CN114117421B (en) * | 2021-11-29 | 2025-09-23 | 上海观安信息技术股份有限公司 | Abnormal detection method and device for user access behavior |
| CN116070818B (en) * | 2022-04-30 | 2025-11-11 | 宁波大学科学技术学院 | Penicillin production abnormality detection method based on sliding window time sequence discriminant feature analysis |
| CN115392812B (en) * | 2022-10-31 | 2023-03-24 | 成都飞机工业(集团)有限责任公司 | Abnormal root cause positioning method, device, equipment and medium |
| CN115511106B (en) * | 2022-11-15 | 2023-04-07 | 阿里云计算有限公司 | Method, device and readable storage medium for generating training data based on time sequence data |
| CN115952085B (en) * | 2022-12-15 | 2023-08-22 | 广州埃普信息科技有限公司 | Middleware system supporting rapid test development |
| CN117928655B (en) * | 2024-03-22 | 2024-07-05 | 济宁万生环保材料有限公司 | Material reaction instant acid value data on-line monitoring system |
| CN119449478B (en) * | 2024-12-20 | 2025-11-14 | 珠海格力电器股份有限公司 | Abnormal flow detection methods, devices, computer equipment and readable media |
Citations (96)
| Publication number | Priority date | Publication date | Assignee | Title |
|---|---|---|---|---|
| US5761653A (en) | 1995-04-03 | 1998-06-02 | International Business Machines Corporation | Method for estimating cardinalities for query processing in a relational database management system |
| US20040260694A1 (en) | 2003-06-20 | 2004-12-23 | Microsoft Corporation | Efficient fuzzy match for evaluating data records |
| US20050003827A1 (en) | 2003-02-13 | 2005-01-06 | Whelan Robert J. | Channel, coding and power management for wireless local area networks |
| US20050216241A1 (en) | 2004-03-29 | 2005-09-29 | Gadi Entin | Method and apparatus for gathering statistical measures |
| US20070055662A1 (en) | 2004-08-01 | 2007-03-08 | Shimon Edelman | Method and apparatus for learning, recognizing and generalizing sequences |
| US7467067B2 (en) | 2006-09-27 | 2008-12-16 | Integrien Corporation | Self-learning integrity management system and related methods |
| US7590728B2 (en) | 2004-03-10 | 2009-09-15 | Eric White | System and method for detection of aberrant network behavior by clients of a network access gateway |
| US7617170B2 (en) | 2006-10-09 | 2009-11-10 | Radware, Ltd. | Generated anomaly pattern for HTTP flood protection |
| US7620523B2 (en) | 2007-04-30 | 2009-11-17 | Integrien Corporation | Nonparametric method for determination of anomalous event states in complex systems exhibiting non-stationarity |
| US7783745B1 (en) * | 2005-06-27 | 2010-08-24 | Entrust, Inc. | Defining and monitoring business rhythms associated with performance of web-enabled business processes |
| US7886064B2 (en) | 2002-07-30 | 2011-02-08 | Sony Corporation | Program, information processing method and device |
| US7953685B2 (en) | 2007-12-27 | 2011-05-31 | Intel Corporation | Frequent pattern array |
| JP4721362B2 (en) | 2007-06-12 | 2011-07-13 | 日本電信電話株式会社 | Threshold setting method, system and program |
| WO2012113436A1 (en) | 2011-02-21 | 2012-08-30 | Telefonaktiebolaget L M Ericsson (Publ) | Service problem diagnosis for mobile wireless networks |
| CN102801587A (en) | 2012-08-29 | 2012-11-28 | 北京邮电大学 | Large-scale network-oriented virtualized monitoring system and dynamic monitoring method thereof |
| US20130097463A1 (en) | 2011-10-12 | 2013-04-18 | Vmware, Inc. | Method and apparatus for root cause and critical pattern prediction using virtual directed graphs |
| US20130110761A1 (en) * | 2011-10-31 | 2013-05-02 | Krishnamurthy Viswanathan | System and method for ranking anomalies |
| US20130262656A1 (en) | 2012-03-30 | 2013-10-03 | Jin Cao | System and method for root cause analysis of mobile network performance problems |
| US8582457B2 (en) | 2009-07-17 | 2013-11-12 | Tangoe Canada, Inc. | Determining usage predictions and detecting anomalous user activity through traffic patterns |
| WO2014040633A1 (en) | 2012-09-14 | 2014-03-20 | Huawei Technologies Co., Ltd. | Identifying fault category patterns in a communication network |
| US20150019916A1 (en) | 2013-07-11 | 2015-01-15 | Empirix Inc. | System and method for identifying problems on a network |
| US8949677B1 (en) | 2012-05-23 | 2015-02-03 | Amazon Technologies, Inc. | Detecting anomalies in time series data |
| US9026644B2 (en) | 2011-03-10 | 2015-05-05 | Verizon Patent And Licensing Inc. | Anomaly detection and identification using traffic steering and real-time analytics |
| US9122602B1 (en) | 2011-08-31 | 2015-09-01 | Amazon Technologies, Inc. | Root cause detection service |
| US20160021173A1 (en) | 2014-07-16 | 2016-01-21 | TUPL, Inc. | Resource management in a big data environment |
| US20160072599A1 (en) | 2014-09-05 | 2016-03-10 | The Nielsen Company (Us), Llc | Methods and apparatus to generate signatures representative of media |
| US9298538B2 (en) | 2012-08-16 | 2016-03-29 | Vmware, Inc. | Methods and systems for abnormality analysis of streamed log data |
| US20160183109A1 (en) | 2014-12-17 | 2016-06-23 | Alcatel-Lucent Canada Inc. | System and method of visualizing most unhealthy network elements within a network or data center |
| US9418088B1 (en) | 2015-12-02 | 2016-08-16 | International Business Machines Corporation | Identification of storage system elements causing performance degradation |
| US20160241429A1 (en) | 2015-02-12 | 2016-08-18 | Tektronix, Inc. | Knowledge base radio and core network prescriptive root cause analysis |
| US20160253366A1 (en) | 2013-10-15 | 2016-09-01 | Hewlett Packard Enterprise Development Lp | Analyzing a parallel data stream using a sliding frequent pattern tree |
| WO2016169616A1 (en) | 2015-04-24 | 2016-10-27 | Telefonaktiebolaget Lm Ericsson (Publ) | Fault diagnosis in networks |
| US9516053B1 (en) | 2015-08-31 | 2016-12-06 | Splunk Inc. | Network security threat detection by user/user-entity behavioral analysis |
| US20170004166A1 (en) | 2015-03-31 | 2017-01-05 | International Business Machines Corporation | Unsupervised multisource temporal anomaly detection |
| US20170085456A1 (en) | 2015-09-22 | 2017-03-23 | Ca, Inc. | Key network entity detection |
| US9614742B1 (en) | 2013-03-14 | 2017-04-04 | Google Inc. | Anomaly detection in time series data |
| US9654361B2 (en) | 2014-05-13 | 2017-05-16 | Cisco Technology, Inc. | Dynamic collection of network metrics for predictive analytics |
| US20170147930A1 (en) * | 2015-01-30 | 2017-05-25 | Hewlett Packard Enterprise Development Lp | Performance testing based on variable length segmentation and clustering of time series data |
| US9667521B2 (en) | 2014-01-27 | 2017-05-30 | Vencore Labs, Inc. | System and method for network traffic profiling and visualization |
| US20170207948A1 (en) | 2016-01-20 | 2017-07-20 | Tektronix Texas, Llc | Multi cause correlation in wireless protocols |
| US9727533B2 (en) | 2014-05-20 | 2017-08-08 | Facebook, Inc. | Detecting anomalies in a time series |
| US9760240B2 (en) | 2014-10-09 | 2017-09-12 | Splunk Inc. | Graphical user interface for static and adaptive thresholds |
| WO2017172541A1 (en) | 2016-03-29 | 2017-10-05 | Anritsu Company | Systems and methods for measuring effective customer impact of network problems in real-time using streaming analytics |
| US20170302554A1 (en) | 2016-04-18 | 2017-10-19 | Nyansa, Inc. | System and method for using real-time packet data to detect and manage network issues |
| US20170331673A1 (en) | 2014-10-30 | 2017-11-16 | Nokia Solutions And Networks Oy | Method and system for network performance root cause analysis |
| US9853867B2 (en) | 2015-05-19 | 2017-12-26 | Empirix, Inc. | Method and apparatus to determine network quality |
| WO2017220107A1 (en) | 2016-06-20 | 2017-12-28 | Telefonaktiebolaget Lm Ericsson (Publ) | Method and network node for detecting degradation of metric of telecommunications network |
| US20180034685A1 (en) | 2016-07-29 | 2018-02-01 | Appdynamics Llc | Algorithms for Root Cause Analysis |
| US20180039555A1 (en) | 2016-08-04 | 2018-02-08 | Oracle International Corporation | Unsupervised method for baselining and anomaly detection in time-series data for enterprise systems |
| US20180046926A1 (en) * | 2014-05-23 | 2018-02-15 | DataRobot, Inc. | Systems for time-series predictive data analytics, and related methods and apparatus |
| US20180063142A1 (en) | 2016-08-31 | 2018-03-01 | Ca, Inc. | Identifying user equipment using tuple of browser type and elapsed hash time for challenge data set |
| US9952921B2 (en) | 2014-10-10 | 2018-04-24 | Samsung Sds Co., Ltd. | System and method for detecting and predicting anomalies based on analysis of time-series data |
| US9961571B2 (en) | 2015-09-24 | 2018-05-01 | Futurewei Technologies, Inc. | System and method for a multi view learning approach to anomaly detection and root cause analysis |
| US20180219889A1 (en) | 2017-01-31 | 2018-08-02 | Splunk Inc. | Anomaly detection based on relationships between multiple time series |
| US10061637B1 (en) | 2017-01-19 | 2018-08-28 | Amdocs Development Limited | System, method, and computer program for automatic root cause analysis |
| US10083073B2 (en) | 2015-09-14 | 2018-09-25 | Dynatrace Llc | Method and system for real-time causality and root cause determination of transaction and infrastructure related events provided by multiple, heterogeneous agents |
| US20180276063A1 (en) | 2017-03-23 | 2018-09-27 | Netscout Systems, Inc | Situation analysis |
| US20180285685A1 (en) | 2016-11-07 | 2018-10-04 | Ayasdi, Inc. | Dimension grouping and reduction for model generation, testing, and documentation |
| WO2018188733A1 (en) | 2017-04-11 | 2018-10-18 | Nokia Solutions And Networks Oy | A computer implemented data processing method |
| US20180300737A1 (en) * | 2017-04-17 | 2018-10-18 | Nexosis, Inc. | Methods and apparatus for self-adaptive time series forecasting engine |
| US20180308001A1 (en) | 2017-04-20 | 2018-10-25 | Cisco Technology, Inc. | Root cause discovery engine |
| US10127695B2 (en) | 2016-02-29 | 2018-11-13 | Oracle International Corporation | Method for creating period profile for time-series data with recurrent patterns |
| US10165457B2 (en) | 2015-08-07 | 2018-12-25 | Telefonaktiebolaget Lm Ericsson (Publ) | System and method for root cause analysis of call failures in a communication network |
| US10198339B2 (en) | 2016-05-16 | 2019-02-05 | Oracle International Corporation | Correlation-based analytic for time-series data |
| US10210038B2 (en) | 2015-10-08 | 2019-02-19 | Lightbend, Inc. | Tuning context-aware rule engine for anomaly detection |
| US10210036B2 (en) | 2015-07-31 | 2019-02-19 | Cisco Technology, Inc. | Time series metric data modeling and prediction |
| US20190102718A1 (en) | 2017-09-29 | 2019-04-04 | Oracle International Corporation | Techniques for automated signal and anomaly detection |
| US20190124099A1 (en) * | 2015-10-29 | 2019-04-25 | Taras Matselyukh | Anomaly detection in a data stream |
| US20190132250A1 (en) | 2017-11-02 | 2019-05-02 | Fujitsu Limited | Network property verification |
| US20190149396A1 (en) | 2017-11-10 | 2019-05-16 | Nyansa, Inc. | System and method for network incident remediation recommendations |
| US20190163551A1 (en) | 2017-11-30 | 2019-05-30 | Optumsoft, Inc. | Automatic root cause analysis using ternary fault scenario representation |
| US20190165988A1 (en) | 2017-11-27 | 2019-05-30 | Google Llc | Real-time probabilistic root cause correlation of network failures |
| US20190260764A1 (en) | 2018-02-20 | 2019-08-22 | Darktrace Limited | Autonomous report composer |
| US10397810B2 (en) | 2016-01-08 | 2019-08-27 | Futurewei Technologies, Inc. | Fingerprinting root cause analysis in cellular systems |
| US10489363B2 (en) | 2016-10-19 | 2019-11-26 | Futurewei Technologies, Inc. | Distributed FP-growth with node table for large-scale association rule mining |
| US10515079B2 (en) | 2016-06-23 | 2019-12-24 | Airwatch Llc | Auto tuning data anomaly detection |
| US20200059800A1 (en) | 2018-08-17 | 2020-02-20 | Spectrum Effect Inc. | Method and system for detecting and resolving anomalies in a wireless network |
| US20200082013A1 (en) * | 2018-09-10 | 2020-03-12 | Ciena Corporation | Systems and methods for automated feature selection and pattern discovery of multi-variate time-series |
| US10637744B2 (en) | 2017-04-12 | 2020-04-28 | Battelle Memorial Institute | Complementary workflows for identifying one-hop network behavior and multi-hop network dependencies |
| US20200136891A1 (en) | 2018-10-31 | 2020-04-30 | EXFO Solutions SAS | Automatic Root Cause Diagnosis in Networks |
| US20200167393A1 (en) | 2017-07-13 | 2020-05-28 | Oxford University Innovation Limited | Method for automatically generating a wrapper for extracting web data, and a computer system |
| US10708344B1 (en) | 2015-12-22 | 2020-07-07 | EMC IP Holding Company LLC | Continuous performance management in information processing systems |
| US10715391B2 (en) | 2018-12-03 | 2020-07-14 | At&T Intellectual Property I, L.P. | Cloud zone network analytics platform |
| US20200278972A1 (en) | 2019-03-01 | 2020-09-03 | International Business Machines Corporation | Association Rule Mining System |
| US10771313B2 (en) | 2018-01-29 | 2020-09-08 | Cisco Technology, Inc. | Using random forests to generate rules for causation analysis of network anomalies |
| US10867036B2 (en) | 2017-10-12 | 2020-12-15 | Cisco Technology, Inc. | Multiple pairwise feature histograms for representing network traffic |
| US20210006453A1 (en) | 2019-07-03 | 2021-01-07 | Hewlett Packard Enterprise Development Lp | Self-learning correlation of network patterns for agile network operations |
| EP3764592A1 (en) | 2019-07-11 | 2021-01-13 | Exfo Inc. | Automatic root cause diagnosis in networks based on hypothesis testing |
| US20210014107A1 (en) | 2019-07-12 | 2021-01-14 | Nokia Solutions And Networks Oy | Management and control for ip and fixed networking |
| US20210110294A1 (en) | 2019-10-10 | 2021-04-15 | Pearson Education, Inc. | Systems and methods for key feature detection in machine learning model applications using logistic models |
| US20210117863A1 (en) | 2019-10-19 | 2021-04-22 | Kinaxis Inc. | Systems and methods for machine learning interpretability |
| US20210136098A1 (en) | 2019-10-30 | 2021-05-06 | Citrix Systems, Inc. | Root cause analysis in multivariate unsupervised anomaly detection |
| US11032303B1 (en) | 2018-09-18 | 2021-06-08 | NortonLifeLock Inc. | Classification using projection of graphs into summarized spaces |
| US20210184958A1 (en) | 2019-12-11 | 2021-06-17 | Cisco Technology, Inc. | Anomaly detection of model performance in an mlops platform |
| US20210250222A1 (en) | 2020-02-12 | 2021-08-12 | EXFO Solutions SAS | Method and system for determining root-cause diagnosis of events occurring during the operation of a communication network |
| US20210385331A1 (en) | 2018-07-12 | 2021-12-09 | Ribbon Communications Operating Company, Inc. | Telecommunication call emulation |
-
2019
- 2019-12-10 US US16/708,605 patent/US11645293B2/en active Active
Patent Citations (107)
| Publication number | Priority date | Publication date | Assignee | Title |
|---|---|---|---|---|
| US5761653A (en) | 1995-04-03 | 1998-06-02 | International Business Machines Corporation | Method for estimating cardinalities for query processing in a relational database management system |
| US7886064B2 (en) | 2002-07-30 | 2011-02-08 | Sony Corporation | Program, information processing method and device |
| US20050003827A1 (en) | 2003-02-13 | 2005-01-06 | Whelan Robert J. | Channel, coding and power management for wireless local area networks |
| US20040260694A1 (en) | 2003-06-20 | 2004-12-23 | Microsoft Corporation | Efficient fuzzy match for evaluating data records |
| US7590728B2 (en) | 2004-03-10 | 2009-09-15 | Eric White | System and method for detection of aberrant network behavior by clients of a network access gateway |
| US20050216241A1 (en) | 2004-03-29 | 2005-09-29 | Gadi Entin | Method and apparatus for gathering statistical measures |
| US20070055662A1 (en) | 2004-08-01 | 2007-03-08 | Shimon Edelman | Method and apparatus for learning, recognizing and generalizing sequences |
| US7783745B1 (en) * | 2005-06-27 | 2010-08-24 | Entrust, Inc. | Defining and monitoring business rhythms associated with performance of web-enabled business processes |
| US7467067B2 (en) | 2006-09-27 | 2008-12-16 | Integrien Corporation | Self-learning integrity management system and related methods |
| US7617170B2 (en) | 2006-10-09 | 2009-11-10 | Radware, Ltd. | Generated anomaly pattern for HTTP flood protection |
| US7620523B2 (en) | 2007-04-30 | 2009-11-17 | Integrien Corporation | Nonparametric method for determination of anomalous event states in complex systems exhibiting non-stationarity |
| JP4721362B2 (en) | 2007-06-12 | 2011-07-13 | 日本電信電話株式会社 | Threshold setting method, system and program |
| US7953685B2 (en) | 2007-12-27 | 2011-05-31 | Intel Corporation | Frequent pattern array |
| US8582457B2 (en) | 2009-07-17 | 2013-11-12 | Tangoe Canada, Inc. | Determining usage predictions and detecting anomalous user activity through traffic patterns |
| WO2012113436A1 (en) | 2011-02-21 | 2012-08-30 | Telefonaktiebolaget L M Ericsson (Publ) | Service problem diagnosis for mobile wireless networks |
| US9414247B2 (en) | 2011-02-21 | 2016-08-09 | Telefonaktiebolaget Lm Ericsson (Publ) | Service problem diagnosis for mobile wireless networks |
| US9026644B2 (en) | 2011-03-10 | 2015-05-05 | Verizon Patent And Licensing Inc. | Anomaly detection and identification using traffic steering and real-time analytics |
| US9122602B1 (en) | 2011-08-31 | 2015-09-01 | Amazon Technologies, Inc. | Root cause detection service |
| US20130097463A1 (en) | 2011-10-12 | 2013-04-18 | Vmware, Inc. | Method and apparatus for root cause and critical pattern prediction using virtual directed graphs |
| US20130110761A1 (en) * | 2011-10-31 | 2013-05-02 | Krishnamurthy Viswanathan | System and method for ranking anomalies |
| US20130262656A1 (en) | 2012-03-30 | 2013-10-03 | Jin Cao | System and method for root cause analysis of mobile network performance problems |
| US8949677B1 (en) | 2012-05-23 | 2015-02-03 | Amazon Technologies, Inc. | Detecting anomalies in time series data |
| US9298538B2 (en) | 2012-08-16 | 2016-03-29 | Vmware, Inc. | Methods and systems for abnormality analysis of streamed log data |
| CN102801587A (en) | 2012-08-29 | 2012-11-28 | 北京邮电大学 | Large-scale network-oriented virtualized monitoring system and dynamic monitoring method thereof |
| WO2014040633A1 (en) | 2012-09-14 | 2014-03-20 | Huawei Technologies Co., Ltd. | Identifying fault category patterns in a communication network |
| US9614742B1 (en) | 2013-03-14 | 2017-04-04 | Google Inc. | Anomaly detection in time series data |
| US20150019916A1 (en) | 2013-07-11 | 2015-01-15 | Empirix Inc. | System and method for identifying problems on a network |
| US9172593B2 (en) | 2013-07-11 | 2015-10-27 | Empirix Inc. | System and method for identifying problems on a network |
| US20160253366A1 (en) | 2013-10-15 | 2016-09-01 | Hewlett Packard Enterprise Development Lp | Analyzing a parallel data stream using a sliding frequent pattern tree |
| US9667521B2 (en) | 2014-01-27 | 2017-05-30 | Vencore Labs, Inc. | System and method for network traffic profiling and visualization |
| US9654361B2 (en) | 2014-05-13 | 2017-05-16 | Cisco Technology, Inc. | Dynamic collection of network metrics for predictive analytics |
| US9727533B2 (en) | 2014-05-20 | 2017-08-08 | Facebook, Inc. | Detecting anomalies in a time series |
| US20180046926A1 (en) * | 2014-05-23 | 2018-02-15 | DataRobot, Inc. | Systems for time-series predictive data analytics, and related methods and apparatus |
| US20160021173A1 (en) | 2014-07-16 | 2016-01-21 | TUPL, Inc. | Resource management in a big data environment |
| US20160072599A1 (en) | 2014-09-05 | 2016-03-10 | The Nielsen Company (Us), Llc | Methods and apparatus to generate signatures representative of media |
| US9760240B2 (en) | 2014-10-09 | 2017-09-12 | Splunk Inc. | Graphical user interface for static and adaptive thresholds |
| US9952921B2 (en) | 2014-10-10 | 2018-04-24 | Samsung Sds Co., Ltd. | System and method for detecting and predicting anomalies based on analysis of time-series data |
| US20170331673A1 (en) | 2014-10-30 | 2017-11-16 | Nokia Solutions And Networks Oy | Method and system for network performance root cause analysis |
| US9729386B2 (en) | 2014-12-17 | 2017-08-08 | Alcatel Lucent | System and method of visualizing most unhealthy network elements within a network or data center |
| US20160183109A1 (en) | 2014-12-17 | 2016-06-23 | Alcatel-Lucent Canada Inc. | System and method of visualizing most unhealthy network elements within a network or data center |
| US20170147930A1 (en) * | 2015-01-30 | 2017-05-25 | Hewlett Packard Enterprise Development Lp | Performance testing based on variable length segmentation and clustering of time series data |
| US20160241429A1 (en) | 2015-02-12 | 2016-08-18 | Tektronix, Inc. | Knowledge base radio and core network prescriptive root cause analysis |
| US20170004166A1 (en) | 2015-03-31 | 2017-01-05 | International Business Machines Corporation | Unsupervised multisource temporal anomaly detection |
| WO2016169616A1 (en) | 2015-04-24 | 2016-10-27 | Telefonaktiebolaget Lm Ericsson (Publ) | Fault diagnosis in networks |
| US9853867B2 (en) | 2015-05-19 | 2017-12-26 | Empirix, Inc. | Method and apparatus to determine network quality |
| US10210036B2 (en) | 2015-07-31 | 2019-02-19 | Cisco Technology, Inc. | Time series metric data modeling and prediction |
| US10165457B2 (en) | 2015-08-07 | 2018-12-25 | Telefonaktiebolaget Lm Ericsson (Publ) | System and method for root cause analysis of call failures in a communication network |
| US9900332B2 (en) | 2015-08-31 | 2018-02-20 | Splunk Inc. | Network security system with real-time and batch paths |
| US9516053B1 (en) | 2015-08-31 | 2016-12-06 | Splunk Inc. | Network security threat detection by user/user-entity behavioral analysis |
| US10083073B2 (en) | 2015-09-14 | 2018-09-25 | Dynatrace Llc | Method and system for real-time causality and root cause determination of transaction and infrastructure related events provided by multiple, heterogeneous agents |
| US20170085456A1 (en) | 2015-09-22 | 2017-03-23 | Ca, Inc. | Key network entity detection |
| US9961571B2 (en) | 2015-09-24 | 2018-05-01 | Futurewei Technologies, Inc. | System and method for a multi view learning approach to anomaly detection and root cause analysis |
| US10210038B2 (en) | 2015-10-08 | 2019-02-19 | Lightbend, Inc. | Tuning context-aware rule engine for anomaly detection |
| US20190124099A1 (en) * | 2015-10-29 | 2019-04-25 | Taras Matselyukh | Anomaly detection in a data stream |
| US9418088B1 (en) | 2015-12-02 | 2016-08-16 | International Business Machines Corporation | Identification of storage system elements causing performance degradation |
| US20170161131A1 (en) | 2015-12-02 | 2017-06-08 | International Business Machines Corporation | Identification of storage system elements causing performance degradation |
| US10708344B1 (en) | 2015-12-22 | 2020-07-07 | EMC IP Holding Company LLC | Continuous performance management in information processing systems |
| US10397810B2 (en) | 2016-01-08 | 2019-08-27 | Futurewei Technologies, Inc. | Fingerprinting root cause analysis in cellular systems |
| US20170207948A1 (en) | 2016-01-20 | 2017-07-20 | Tektronix Texas, Llc | Multi cause correlation in wireless protocols |
| US10127695B2 (en) | 2016-02-29 | 2018-11-13 | Oracle International Corporation | Method for creating period profile for time-series data with recurrent patterns |
| US10686681B2 (en) | 2016-03-29 | 2020-06-16 | Anritsu Company | Systems and methods for measuring effective customer impact of network problems in real-time using streaming analytics |
| WO2017172541A1 (en) | 2016-03-29 | 2017-10-05 | Anritsu Company | Systems and methods for measuring effective customer impact of network problems in real-time using streaming analytics |
| US20170302554A1 (en) | 2016-04-18 | 2017-10-19 | Nyansa, Inc. | System and method for using real-time packet data to detect and manage network issues |
| US10198339B2 (en) | 2016-05-16 | 2019-02-05 | Oracle International Corporation | Correlation-based analytic for time-series data |
| WO2017220107A1 (en) | 2016-06-20 | 2017-12-28 | Telefonaktiebolaget Lm Ericsson (Publ) | Method and network node for detecting degradation of metric of telecommunications network |
| US10515079B2 (en) | 2016-06-23 | 2019-12-24 | Airwatch Llc | Auto tuning data anomaly detection |
| US20180034685A1 (en) | 2016-07-29 | 2018-02-01 | Appdynamics Llc | Algorithms for Root Cause Analysis |
| US20180039555A1 (en) | 2016-08-04 | 2018-02-08 | Oracle International Corporation | Unsupervised method for baselining and anomaly detection in time-series data for enterprise systems |
| US20180063142A1 (en) | 2016-08-31 | 2018-03-01 | Ca, Inc. | Identifying user equipment using tuple of browser type and elapsed hash time for challenge data set |
| US10489363B2 (en) | 2016-10-19 | 2019-11-26 | Futurewei Technologies, Inc. | Distributed FP-growth with node table for large-scale association rule mining |
| US20180285685A1 (en) | 2016-11-07 | 2018-10-04 | Ayasdi, Inc. | Dimension grouping and reduction for model generation, testing, and documentation |
| US10061637B1 (en) | 2017-01-19 | 2018-08-28 | Amdocs Development Limited | System, method, and computer program for automatic root cause analysis |
| US20180219889A1 (en) | 2017-01-31 | 2018-08-02 | Splunk Inc. | Anomaly detection based on relationships between multiple time series |
| US10289473B2 (en) | 2017-03-23 | 2019-05-14 | Netscout Systems, Inc. | Situation analysis |
| US20180276063A1 (en) | 2017-03-23 | 2018-09-27 | Netscout Systems, Inc | Situation analysis |
| WO2018188733A1 (en) | 2017-04-11 | 2018-10-18 | Nokia Solutions And Networks Oy | A computer implemented data processing method |
| US10637744B2 (en) | 2017-04-12 | 2020-04-28 | Battelle Memorial Institute | Complementary workflows for identifying one-hop network behavior and multi-hop network dependencies |
| US20180300737A1 (en) * | 2017-04-17 | 2018-10-18 | Nexosis, Inc. | Methods and apparatus for self-adaptive time series forecasting engine |
| US20180308001A1 (en) | 2017-04-20 | 2018-10-25 | Cisco Technology, Inc. | Root cause discovery engine |
| US20200167393A1 (en) | 2017-07-13 | 2020-05-28 | Oxford University Innovation Limited | Method for automatically generating a wrapper for extracting web data, and a computer system |
| US20190102718A1 (en) | 2017-09-29 | 2019-04-04 | Oracle International Corporation | Techniques for automated signal and anomaly detection |
| US10867036B2 (en) | 2017-10-12 | 2020-12-15 | Cisco Technology, Inc. | Multiple pairwise feature histograms for representing network traffic |
| US20190132250A1 (en) | 2017-11-02 | 2019-05-02 | Fujitsu Limited | Network property verification |
| US20190149396A1 (en) | 2017-11-10 | 2019-05-16 | Nyansa, Inc. | System and method for network incident remediation recommendations |
| US20190165988A1 (en) | 2017-11-27 | 2019-05-30 | Google Llc | Real-time probabilistic root cause correlation of network failures |
| US20190163551A1 (en) | 2017-11-30 | 2019-05-30 | Optumsoft, Inc. | Automatic root cause analysis using ternary fault scenario representation |
| US10771313B2 (en) | 2018-01-29 | 2020-09-08 | Cisco Technology, Inc. | Using random forests to generate rules for causation analysis of network anomalies |
| US20190260764A1 (en) | 2018-02-20 | 2019-08-22 | Darktrace Limited | Autonomous report composer |
| US20210385331A1 (en) | 2018-07-12 | 2021-12-09 | Ribbon Communications Operating Company, Inc. | Telecommunication call emulation |
| US20200059800A1 (en) | 2018-08-17 | 2020-02-20 | Spectrum Effect Inc. | Method and system for detecting and resolving anomalies in a wireless network |
| US20200082013A1 (en) * | 2018-09-10 | 2020-03-12 | Ciena Corporation | Systems and methods for automated feature selection and pattern discovery of multi-variate time-series |
| US11032303B1 (en) | 2018-09-18 | 2021-06-08 | NortonLifeLock Inc. | Classification using projection of graphs into summarized spaces |
| EP3648406A2 (en) | 2018-10-31 | 2020-05-06 | EXFO Solutions SAS | Automatic root cause diagnosis in networks |
| US20200136891A1 (en) | 2018-10-31 | 2020-04-30 | EXFO Solutions SAS | Automatic Root Cause Diagnosis in Networks |
| EP3849142A1 (en) | 2018-10-31 | 2021-07-14 | EXFO Solutions SAS | Automatic root cause diagnosis in networks |
| US10715391B2 (en) | 2018-12-03 | 2020-07-14 | At&T Intellectual Property I, L.P. | Cloud zone network analytics platform |
| US20200278972A1 (en) | 2019-03-01 | 2020-09-03 | International Business Machines Corporation | Association Rule Mining System |
| US20210006453A1 (en) | 2019-07-03 | 2021-01-07 | Hewlett Packard Enterprise Development Lp | Self-learning correlation of network patterns for agile network operations |
| EP3764592A1 (en) | 2019-07-11 | 2021-01-13 | Exfo Inc. | Automatic root cause diagnosis in networks based on hypothesis testing |
| US11138163B2 (en) | 2019-07-11 | 2021-10-05 | EXFO Solutions SAS | Automatic root cause diagnosis in networks based on hypothesis testing |
| US20210014107A1 (en) | 2019-07-12 | 2021-01-14 | Nokia Solutions And Networks Oy | Management and control for ip and fixed networking |
| US20210110294A1 (en) | 2019-10-10 | 2021-04-15 | Pearson Education, Inc. | Systems and methods for key feature detection in machine learning model applications using logistic models |
| US20210117863A1 (en) | 2019-10-19 | 2021-04-22 | Kinaxis Inc. | Systems and methods for machine learning interpretability |
| US20210136098A1 (en) | 2019-10-30 | 2021-05-06 | Citrix Systems, Inc. | Root cause analysis in multivariate unsupervised anomaly detection |
| US20210184958A1 (en) | 2019-12-11 | 2021-06-17 | Cisco Technology, Inc. | Anomaly detection of model performance in an mlops platform |
| US20210250222A1 (en) | 2020-02-12 | 2021-08-12 | EXFO Solutions SAS | Method and system for determining root-cause diagnosis of events occurring during the operation of a communication network |
| EP3866395A1 (en) | 2020-02-12 | 2021-08-18 | EXFO Solutions SAS | Method and system for determining root-cause diagnosis of events occurring during the operation of a communication network |
Non-Patent Citations (85)
| Title |
|---|
| 3GPP, 3rd Generation Partnership Project;Technical Specification Group Services and System Aspects; Telecommunication management; Charging management; Charging Data Record (CDR) parameter description Release 15), Dec. 2018, TS 32.298 V15.5.1. |
| Agrawal et al.,Mining association rules between sets of items in large databases, May 1993,in Proceedings of the 1993 ACM SIGMOD international conference on Management of data (SIGMOD '93). Association for Computing Machinery, New York, NY, USA, 207-216. [Online], [retrieved on Feb. 19, 2021], Retrieved from the Internet <URL: https://doi.org/10.1145/170035.170072>. |
| Alipio Jorge, Hierarchical Clustering for thematic browsing and summarization of large sets of Association Rules, 2004 SIAM International Conference on Data Mining, Orlando, Florida. |
| Alzira Faria, A Methodology for Filtering Association Rules. Revista de Ciências da Computação II, 2 (Jan. 2007), 14-25. |
| Azevedo et al., Comparing Rule Measures for Predictive Association Rules, in Machine Learning: ECML 2007, [Online], [retrieved on Feb. 2, 2021], Retrieved from the Internet <URL: https://doi.org/10.1007/978-3-540-74958-5_47>. |
| Brauckhoff et al.,Anomaly extraction in backbone networks using association rules, Proceedings of the 9th ACM SIGCOMM conference on Internet measurement, pp. 28-34, Nov. 4, 2009, [Online], [retrieved on Feb. 12, 2021], Retrieved from the Internet <URL: https://hal.archives-ouvertes.fr/hal-00527139/document >. |
| Brin et al., Dynamic Itemset Counting and Implication Rules for Market Basket Data. SIGMOD 1997 Arizona USA, Rec. 26, 2 (Jun. 1997), 255-264. |
| Chen et al., Failure Diagnosis Using Decision Trees, May 2004, in International Conference on Autonomic Computing, 2004. Proceedings. IEEE, 36-43 New York, NY, USA. |
| Decker et al., Classification in Marketing Research by Means of LEM2-generated Rules, 2007, Department of Business Administration and Economics, Bielefeld University, Germany. |
| Dimopoulos et al., Identifying the Root Cause of Video Streaming Issues on Mobile Devices, Dec. 1-4, 2015, DOI: http://dx.doi.org/10.1145/2716281.2836109, Heidelberg, Germany. |
| E. Cuthill and J. McKee, Reducing the bandwidth of sparse symmetric matrices, ACM '69: Proceedings of the 1969 24th national conference, Aug. 1969, pp. 157-172. |
| E. J. Khatib, Data analytics and knowledge discovery for root cause analysis in LTE self-0rganizing networks, PhD dissertation, 2017, University of Malaga. |
| European Search Report for 19205083.9-1216 / 3648406 dated May 20, 2020. |
| European Search Report for 19206600.69-1216 dated Apr. 29, 2020. |
| Fortes et al., Context-Aware Self-Healing: User Equipment as the Main Source of Information for Small-Cell Indoor Networks, Feb. 24, 2016, IEEE vehicular technology magazine, DOI: 10.1109/MVT.2015.2479657, IEEE. |
| Fortes et al., Contextualized indicators for online failure diagnosis in cellular networks, Apr. 4, 2015, Computer Networks 82 (2015) 96-113, Elsevier B.V., Spain. |
| Fortes et al., Location-based distributed sleeping cell detection and root cause analysis for 5G ultra-dense networks 2016, 2016:149, DOI 10.1186/s 13638-016-0649-6, EURASIP Journal on Wireless Communications and Networking. |
| Gardner et al., Alarm correlation and network fault resolution using the Kohonen self-organising map., GLOBECOM 1997. IEEE Global Telecommunications Conference. Conference Record, vol. 3. IEEE, 1398-1402. IEEE, Phoenix, AZ. |
| Gogoi et al., Efficient Rule Set Generation using Rough Set Theory for Classificationof High Dimensional Data, 2011 International Journal of Smart Sensors and Ad Hoc Networks (IJSSAN) ISSN No. 2248-9738 (Print) vol. 1, Issue-2. |
| Gomez-Andrades et al., Automatic Root Cause Analysis for LTE Networks Based on Unsupervised Techniques, Apr. 2016, IEEE Transactions on Vehicular Technology, vol. 65, No. 4, DOI: 10.1109/ TVT.2015.2431742, IEEE. |
| H. Phan-Vu, B. Jaumard, T. Glatard, J. Whatley and S. Nadeau, "A Scalable Multi-factor Fault Analysis Framework for Information Systems," in 2021 IEEE International Conference on Big Data (Big Data), Orlando, FL, USA, 2021 pp. 2621-2630. doi: 10.1109/BigData52589.2021.9671747. |
| Han et al., Mining Frequent Patterns without Candidate Generation: A Frequent-Pattern Tree Approach. Data Mining and Knowledge Discovery 8, 1 (Jan. 2004), 53-87.,[Online], [retrieved on Feb. 9, 2021], Retrieved from the Internet <URL: https://doi.org/10.1023/B:DAMI.0000005258.31418.83>. |
| Han J. and Kamber M. Data Mining Concepts and Techniques (second edition), 2006 by Elsevier Inc. |
| Hanemann, A Hybrid Rule-Based/Case-Based Reasoning Approach for Service Fault Diagnosis, available on May 13, 2019, Leibniz Supercomputing Center, Munich, Germany. |
| Hermann Wietgrefe, Investigation and practical assessment of alarm correlation methods for the use in GSM access networks, NOMS 2002. IEEE/IFIP Network Operations and Management Symposium. ‘Management Solutions for the New Communications World’ (Cat.No. 02CH37327). IEEE, 391-403. ). IEEE, Florence, Italy. |
| Imran et al., Challenges in 5G: Howto Empower SON with Big Data for Enabling 5G, Nov./Dec. 2014, EEE Network, IEEE. |
| Jin et al., Nevermind, the Problem is Already Fixed: Proactively Detecting and Troubleshooting Customer DSL Problems, Nov. 30-Dec. 2010, ACM 1-4503-0448-1/10/11, Philadelphia, USA. |
| Kam Rupesh Raj et al., Dynamic Autoselection and Autotuning of Machine Learning Models for Cloud Network Analytics, DOI 10.1109/TPDS.2018.2876844, IEEE Transactions on Parallel and Distributed Systems, vol. 30, Issue: 5, May 1, 2019, pp. 1052-1064, Oct. 19, 2018. |
| Khatib et al., Data mining for fuzzy diagnosis systems in LTE networks, Jun. 1, 2015, Expert Systems with Applications 42 (2015) 7549-7559, Elsevier Ltd., Spain. |
| Klaine et al., A Survey of Machine Learning Techniques Applied to Self-Organizing Cellular Networks, Jul. 12, 2017, doi:10.1109/COMST.2017.2727878, IEEE Communications Surveysand Tutorials. |
| Leifler, Comparison of LEM2 and a Dynamic Reduct Classification Algorithm, Masters Thesis, Oct. 9, 2002, LiTH-IDA-EX-02-93, Artificial Intelligence & Integrated Computer Systems Division, Dept. of Computer and Information Science, Linkopings universitet. |
| Leskovec et al., Mining of Massive Datasets (2nd ed.), 2014, Cambridge University Press, USA. |
| Lin et al., Fast Dimensional Analysis for Root Cause Investigation in a Large-Scale Service Environment, Proceedings of the ACM on Measurement and Analysis of Computing Systems 4, 2 (Jun. 2020), 1-23., arXiv: 1911.01225 version: 2. [Online], [retrieved on Feb. 2, 2021] Retrieved from the Internet <URL: https://doi.org/10.1145/3392149>. |
| Liu aet al. Integrating Classification and Association Rule Mining, From: KDD-98 Proceedings. Copyright © 1998, American Association for Artificial Intelligence (www.aaai.org). Department of Information Systems and Computer Science National University of Singapore. |
| Liu et al., GA-AdaBoostSVM classifier empowered wireless network diagnosis, 2018, 2018:77, https://doi.org/10.1186/s13638-018-1078-5 EURASIP Journal on Nireless Communications and Networking. |
| M. Demetgul, Fault diagnosis on production systems with support vector machine and decision trees algorithms, 2013, The International Journal of Advanced Manufacturing Technology 67, 9-12 (2013), 2183- 2194. ISBN: 0268-3768, Springer Verlag. Nov. 23, 2012. |
| M. Mdini, A. Blanc, G. Simon, J. Barotin and J. Lecoeuvre, "Monitoring the network monitoring system: Anomaly Detection using pattern recognition," 2017 IFIP/IEEE Symposium on Integrated Network and Service Management(IM), Lisbon, 2017, pp. 983-986. |
| Maha Mdini, Gwendal Simon, Alberto Blanc, and Julien Lecoeuvre, Introducing an Unsupervised Automated Solution or Root Cause Diagnosis in Mobile Networks, IEEE Transactions on Network and Service Management, vol. 17, No. 1, Mar. 2020. |
| Mahapatro et al., Fault Diagnosis in Wireless Sensor Networks: A Survey, 2013, IEEE Communications Surveys & Tutorials, vol. 15, No. 4, DOI: 10.1109/SURV.2013.030713.00062, IEEE. |
| Mahimkar et al, Towards Automated Performance Diagnosis in a Large IPTV Network, Aug. 17-21, 2009, ACM 978-1-60558-59409/09/08, Barcelona, Spain. |
| Mahimkar et al., Rapid Detection of Maintenance Induced Changes in Service Performance, Dec. 6-9, 2011, ACM 978-1-4503-1041-3/11/0012, Tokyo, Japan. |
| Maimon, O and Rokach L. Data Mining and Knowledge Discovery Handbook (second edition) Springer Science+Business Media, LLC 2005, 2010. DOI 10.1007/978-0-387-09823-4. |
| Mdini et al., Monitoring the Network Monitoring System: Anomaly Detection using Pattern Recognition, May 2017, IMT Atlantique, Astellia, France. |
| Mdini M., Root Cause Diagnosis, Nov. 22, 2017, Astellia. |
| Mdini, Anomaly detection and root cause diagnosis in cellular networks. Artificial Intelligence [cs.AI]. Ecole nationale superieure Mines-Telecom Atlantique, 2019. English. NNT: 2019IMTA0144. tel-02304602. |
| Mdini, Create your own Artificial Intelligence to monitor your Linux System! Europython, Edinburg Jul. 23-29, 2018. |
| Mdini, Maha, Monitoring the Network Monitoring System: Anomaly Detection using Pattern Recognition, Cellular Networks Feb. 22, 2017. |
| Mi et al., Toward Fine-Grained, Unsupervised, Scalable Performance Diagnosis for Production Cloud Computing Systems, Jun. 2013, IEEE Transactions on Parallel and Distributed Systems, vol. 24, No. 6, DOI:10.1109/TPDS.2013.21, IEEE Computer Society. |
| Midini, Maha Anomaly Detection and Root Cause Diagnosis in Cellular Networks, Oct. 2, 2019, retrieved from https//tel.archives-ouvertes.fr/tel-02304602. |
| Midini, Maha et al., ARCD: a Solution for Root Cause Diagnosis in Mobile Networks, 2018 14th International Conference on Network and Service Management (CNSM), Nov. 5, 2018, pp. 280-284. |
| Midini, Maha et al., Introducing an Unsupervised Automated Solution for Root Cause Diagnosis in Mobile Networks, IEEE Transactions on Network and Service Management, IEEE, USA, vol. 17, No. 1, Mar. 2020, pp. 547-561. |
| Monge et al. Reasoning and knowledge acquisition framework for 5G network analytics, Oct. 21, 2017, Sensors. |
| Moysen et al., A Reinforcement Learning based solution for Self-Healing in LTE networks, 2014, 978-1-4799-4449-1/14, IEEE. |
| Munoz et al., A method for identifying faulty cells using a classification tree-based UE diagnosis in LTE, 2017, 2017:130, DOI 10.1186/s13638-017-0914-3, EURASIP Journal on Wireless Communications and Networking. |
| Nagaraj et al., Structured Comparative Analysis of Systems Logs to Diagnose Performance Problems, available May 23, 2019, Purdue University. |
| Non-Final Office Action, U.S. Appl. No. 16/659,874, dated Dec. 23, 2021, 17 pages. |
| Office Action for U.S. Appl. No. 17/172,472 dated Jun. 28, 2022, 26 pages. |
| Office Action in U.S. Appl. No. 17/835,467 dated Jan. 4, 2023. |
| Ong et al., A Manufacturing Failure Root Cause Analysis in Imbalance Dataset Using PCA Weighted Association Rule Mining, Aug. 11, 2015, Penerbit UTM Press, Melaka, Malaysia. |
| Palacios et al., Automatic feature selection technique for next generation self-organizing networks, IEEE Communications Letters, vol. 22, No. 6, Jun. 2018. Digital Object Identifier 10.1109/LCOMM.2018.2825392. |
| Palacios et al., Combination of multiple diagnosis systems in Self-Healing networks, Jul. 22, 2016, Expert Systems With Applications 64 (2016) 56-68, Elsevier Ltd., Spain. |
| Perri et al. Abductive logic programs with penalization: semantics, complexity and implementation, arXiv preprint cs/0310047 (2003). Theory and Practice of Logic Programming 5, 1-2 (2003), 123-159. |
| Pranab Ghosh, "Time Series Seasonal Cycle Detection with Auto Correlation on Spark" retrieved from: https://pkghosh.wordpress.com/2018/12/23/time-series-seasonal-cycle-detection-with-auto-correlation-on-spark/. |
| Qu et al., Multilevel Pattern Mining Architecture for Automatic Network Monitoring in Heterogeneous Wireless Communication Networks, Jun. 2016, China communications 13, No. 7: 108-116,Sep. 2, 2016. |
| Reali G. and Monacelli L., Definition and Performance Evaluation of a Fault Localization Technique foran NGN IMS Network, IEEE Transactions on Network and Service Management, vol. 6, No. 2, Jun. 2009. DOI 10.1109/TNSM.2009.090605. Downloaded on Jan. 31, 2022 at 20:51:52 UTC from IEEE Xplore. |
| Rodriguez-Perez Raquel et al: "Interpretation of machine learning models using shapley values: application to compound potency and multi-target activity predictions" Journal of Computer-Aided Molecular Design, Springer Netherlands, NL, vol. 34, No. 10, May 2, 2020 (May 2, 2020), pp. 1013-1026, XP037228335, ISSN: 0920-654X, DOI: 10.1007/S10822-020-00314-0 [retrieved on May 2, 2020]. |
| RODRIGUEZ-PÉREZ RAQUEL; BAJORATH JÜRGEN: "Interpretation of machine learning models using shapley values: application to compound potency and multi-target activity predictions", JOURNAL OF COMPUTER-AIDED MOLECULAR DESIGN, SPRINGER NETHERLANDS, NL, vol. 34, no. 10, 2 May 2020 (2020-05-02), NL , pages 1013 - 1026, XP037228335, ISSN: 0920-654X, DOI: 10.1007/s10822-020-00314-0 |
| Rohit Saluja et al: "Towards a Rigorous Evaluation of Explainability for Multivariate Time Series", Arxiv.org, Cornell University Library, 201 Olin Library Cornell University Ithaca, NY 14853, Apr. 6, 2021 (Apr. 6, 2021), XP081936276. |
| ROHIT SALUJA; AVLEEN MALHI; SAMANTA KNAPI\V{C}; KARY FR\"AMLING; CICEK CAVDAR: "Towards a Rigorous Evaluation of Explainability for Multivariate Time Series", ARXIV.ORG, CORNELL UNIVERSITY LIBRARY, 201 OLIN LIBRARY CORNELL UNIVERSITY ITHACA, NY 14853, 6 April 2021 (2021-04-06), 201 Olin Library Cornell University Ithaca, NY 14853 , XP081936276 |
| Sampath et al. Failure diagnosis using discrete-event models. IEEE transactions on control systems technology 4, 2 (1996), 105-124. ISBN: 1063-6536 Publisher: IEEE. |
| Shvachko et al., The hadoop distributed file system. In Symposium on mass storage systems and technologies (MSST). IEEE, Incline Village, NV, USA, 1-10, 2010. |
| Steinder et al., A survey of fault localization techniques in computer networks, Jul. 1, 2004, Science of Computer Programming 53 (2004) 165-194, United States. |
| Tan et al., Introduction to Data Mining, (First Edition). Addison-Wesley Longman Publishing Co., Inc., USA. A fault analysis framework for cellular networks using scalable association rule mining KDD '21, Aug. 14-18, 2021, Singapore, NY. |
| Tan et al., Introduction to Data Mining, Pearson New International Edition (First Edition). Pearson Education Limited 2014 ISBN 10: 1-292-02615-4 ISBN 13: 978-1-292-02615-2. |
| Tan et al., Selecting the right objective measure for association analysis. Information Systems 29, 4 (2004), 293-313., Elsevier, Department of Computer Science, University of Minnesota, 200 Union Street SE, Minneapolis, MN 55455, USA. |
| Toivonen et al.. Pruning and Grouping Discovered Association Rules,1995, Department of computer Science, University of Helsinki, Finland. |
| Van Melle et al., Rule-based expert systems: the EMYCIN experiments of the Stanford Heuristic Programming Project, Chapter 15, EMYCIN: A knowledge Engineer's Tool for Constructing Rule-Based Expert Systems, 1984, CUMINCAD. Addison Wesley, Reading, MA. |
| Van Melle W., Rule-based expert systems: the MYCIN experiments of the Stanford Heuristic Programming Project, Chapter 4, The Structure of the MYCIN System, 1984, CUMINCAD. Addison Wesley, Reading, MA. |
| Wang et al., An Algorithm for Mining of Association Rules for the Information Communication Network Alarms Based on Swarm Intelligence, Hindawi Publishing Corporation, Mathematical Problems in Engineering, vol. 2014, Article ID 894205, 14 pages, Jan. 1, 2014 [Online], [retrieved on Feb. 12, 2021] Retrieved from the Internet <URL: https://www.hindawi.com/journals/mpe/2014/894205/abs/>. |
| Xu et al., Industrial Big Data for Fault Diagnosis: Taxonomy, Review, and Applications, Sep. 19, 2017, IEEE Access, vol. 5, DOI: 10.1109/ACCESS.2017.2731945, IEEE. |
| Ye et al., Board-level functional fault diagnosis using multikemel support vector machines and incremental learning. IEEE Transactions on Computer-Aided Design of Integrated Circuits and Systems 33, 2 (2014), 279-290. ISBN: 0278-0070 Publisher: IEEE. |
| Zaharia et al., Spark: Cluster computing with working sets. In Proceedings of the 2nd USENIX Conference on Hot Topics in Cloud Computing (HotCloud'10), vol. 10. USENIX Association, USA, 2010. |
| Zawawy et al., Requirements-driven root cause analysis using Markov logic networks. In International Conference on Advanced Information Systems Engineering. CAiSE 2012, LNCS 7328, pp. 350-365, 2012, Springer-Verlag Berlin Heidelberg 2012. |
| Zhang et al, On Assuring End-to-End QoE in Next Generation Networks: Challenges and a Possible Solution, Jul. 2011, 0163-6804/10, IEEE Communications Magazine. |
| Zheng et al., 3-Dimensional Root Cause Diagnosis via Co-analysis, Sep. 18-20, 2012, ACM 978-1-4503-1520-3/12/09, San Jose, USA. |
Cited By (13)
| Publication number | Priority date | Publication date | Assignee | Title |
|---|---|---|---|---|
| US12118077B2 (en) * | 2021-01-21 | 2024-10-15 | Intuit Inc. | Feature extraction and time series anomaly detection over dynamic graphs |
| US20220229903A1 (en) * | 2021-01-21 | 2022-07-21 | Intuit Inc. | Feature extraction and time series anomaly detection over dynamic graphs |
| US20220335347A1 (en) * | 2021-04-15 | 2022-10-20 | Business Objects Software Ltd | Time-series anomaly prediction and alert |
| US12293320B2 (en) * | 2021-04-15 | 2025-05-06 | Business Objects Software Ltd. | Time-series anomaly prediction and alert |
| US20220101625A1 (en) * | 2021-12-13 | 2022-03-31 | Intel Corporation | In-situ detection of anomalies in integrated circuits using machine learning models |
| US12307747B2 (en) * | 2021-12-13 | 2025-05-20 | Intel Corporation | In-situ detection of anomalies in integrated circuits using machine learning models |
| US20240007342A1 (en) * | 2022-06-30 | 2024-01-04 | Juniper Networks, Inc. | Framework for automated application-to-network root cause analysis |
| US12199813B2 (en) * | 2022-06-30 | 2025-01-14 | Juniper Networks, Inc. | Framework for automated application-to-network root cause analysis |
| US11934536B2 (en) * | 2022-07-21 | 2024-03-19 | University Of Chinese Academy Of Sciences | Dynamic network risk predicting method based on a graph neural network |
| US20240028744A1 (en) * | 2022-07-21 | 2024-01-25 | University Of Chinese Academy Of Sciences | Dynamic network risk predicting method based on a graph neural network |
| US12238069B2 (en) | 2022-11-30 | 2025-02-25 | Juniper Networks, Inc. | Self-correcting service level agreement enforcer |
| US12244566B2 (en) | 2022-11-30 | 2025-03-04 | Juniper Networks, Inc. | Self-learning egress traffic controller |
| US12267300B2 (en) | 2022-11-30 | 2025-04-01 | Juniper Networks, Inc. | Intelligent firewall policy processor |
Also Published As
| Publication number | Publication date |
|---|---|
| US20200183946A1 (en) | 2020-06-11 |
Similar Documents
| Publication | Publication Date | Title |
|---|---|---|
| US11645293B2 (en) | Anomaly detection in big data time series analysis | |
| US10248528B2 (en) | System monitoring method and apparatus | |
| US11836162B2 (en) | Unsupervised method for classifying seasonal patterns | |
| US20220131770A1 (en) | System and method for predicting and reducing subscriber churn | |
| US11108835B2 (en) | Anomaly detection for streaming data | |
| EP3353688B1 (en) | Updating attribute data structures to indicate trends in attribute data provided to automated modeling systems | |
| US10171335B2 (en) | Analysis of site speed performance anomalies caused by server-side issues | |
| US20200073740A1 (en) | Systems and methods for anomaly detection in a distributed computing system | |
| CN106951984B (en) | Dynamic analysis and prediction method and device for system health degree | |
| US11074514B2 (en) | Confidence intervals for anomalies in computer log data | |
| CN111478963B (en) | Message pushing method and device, electronic equipment and computer readable storage medium | |
| US10127255B1 (en) | Computer system and method of initiative analysis using outlier identification | |
| EP3866394A1 (en) | Detection, characterization, and prediction of real-time events occurring approximately periodically | |
| US10901746B2 (en) | Automatic anomaly detection in computer processing pipelines | |
| RU2640637C2 (en) | Method and server for conducting controlled experiment using prediction of future user behavior | |
| US20250321941A1 (en) | Systems and methods for dynamic evaluation of metadata consistency and data reliability | |
| US10140345B1 (en) | System, method, and computer program for identifying significant records | |
| CN111897700A (en) | Application index monitoring method and device, electronic equipment and readable storage medium | |
| AU2021269196B2 (en) | Performance event troubleshooting system | |
| CN111800807A (en) | Method and device for alarming number of base station users | |
| CN120929371A (en) | Pressure measurement method and device, electronic equipment and storage medium | |
| CN113342608A (en) | Method and device for monitoring streaming computing engine task | |
| CN119106750A (en) | Task processing method based on large model, device, equipment and medium | |
| CN119671348A (en) | Community operation data analysis method, device, computer equipment and storage medium | |
| CN114237856A (en) | Operation type identification method and device, electronic equipment and storage medium |
Legal Events
| Date | Code | Title | Description |
|---|---|---|---|
| AS | Assignment |
Owner name: EXFO SOLUTIONS SAS, FRANCE Free format text: ASSIGNMENT OF ASSIGNORS INTEREST;ASSIGNOR:PELLOIN, FABRICE;REEL/FRAME:051226/0742 Effective date: 20191210 |
|
| FEPP | Fee payment procedure |
Free format text: ENTITY STATUS SET TO UNDISCOUNTED (ORIGINAL EVENT CODE: BIG.); ENTITY STATUS OF PATENT OWNER: LARGE ENTITY |
|
| STPP | Information on status: patent application and granting procedure in general |
Free format text: DOCKETED NEW CASE - READY FOR EXAMINATION |
|
| STPP | Information on status: patent application and granting procedure in general |
Free format text: NON FINAL ACTION MAILED |
|
| STPP | Information on status: patent application and granting procedure in general |
Free format text: RESPONSE TO NON-FINAL OFFICE ACTION ENTERED AND FORWARDED TO EXAMINER |
|
| STPP | Information on status: patent application and granting procedure in general |
Free format text: FINAL REJECTION MAILED |
|
| STPP | Information on status: patent application and granting procedure in general |
Free format text: RESPONSE AFTER FINAL ACTION FORWARDED TO EXAMINER |
|
| STPP | Information on status: patent application and granting procedure in general |
Free format text: NOTICE OF ALLOWANCE MAILED -- APPLICATION RECEIVED IN OFFICE OF PUBLICATIONS |
|
| STCF | Information on status: patent grant |
Free format text: PATENTED CASE |
|
| AS | Assignment |
Owner name: EXFO INC., CANADA Free format text: ASSIGNMENT OF ASSIGNORS INTEREST;ASSIGNOR:EXFO SOLUTIONS SAS;REEL/FRAME:065928/0957 Effective date: 20231220 |
|
| AS | Assignment |
Owner name: EXFO SOLUTIONS SAS, FRANCE Free format text: ASSIGNMENT OF ASSIGNORS INTEREST;ASSIGNOR:EXFO INC.;REEL/FRAME:070035/0499 Effective date: 20250115 |
|
| AS | Assignment |
Owner name: TC FRANCE S.A.S., FRANCE Free format text: ASSIGNMENT OF ASSIGNORS INTEREST;ASSIGNOR:EXFO SOLUTIONS SAS;REEL/FRAME:073329/0624 Effective date: 20251031 |