US11589800B2 - Method of evaluating concomitant clinical dementia rating and its future outcome using predicted age difference and program thereof - Google Patents
Method of evaluating concomitant clinical dementia rating and its future outcome using predicted age difference and program thereof Download PDFInfo
- Publication number
- US11589800B2 US11589800B2 US17/704,287 US202217704287A US11589800B2 US 11589800 B2 US11589800 B2 US 11589800B2 US 202217704287 A US202217704287 A US 202217704287A US 11589800 B2 US11589800 B2 US 11589800B2
- Authority
- US
- United States
- Prior art keywords
- cdr
- individual
- brain
- image
- pad
- Prior art date
- Legal status (The legal status is an assumption and is not a legal conclusion. Google has not performed a legal analysis and makes no representation as to the accuracy of the status listed.)
- Active, expires
Links
Images




Classifications
-
- A—HUMAN NECESSITIES
- A61—MEDICAL OR VETERINARY SCIENCE; HYGIENE
- A61B—DIAGNOSIS; SURGERY; IDENTIFICATION
- A61B5/00—Measuring for diagnostic purposes; Identification of persons
- A61B5/05—Detecting, measuring or recording for diagnosis by means of electric currents or magnetic fields; Measuring using microwaves or radio waves
- A61B5/055—Detecting, measuring or recording for diagnosis by means of electric currents or magnetic fields; Measuring using microwaves or radio waves involving electronic [EMR] or nuclear [NMR] magnetic resonance, e.g. magnetic resonance imaging
-
- A—HUMAN NECESSITIES
- A61—MEDICAL OR VETERINARY SCIENCE; HYGIENE
- A61B—DIAGNOSIS; SURGERY; IDENTIFICATION
- A61B5/00—Measuring for diagnostic purposes; Identification of persons
- A61B5/40—Detecting, measuring or recording for evaluating the nervous system
- A61B5/4076—Diagnosing or monitoring particular conditions of the nervous system
- A61B5/4088—Diagnosing of monitoring cognitive diseases, e.g. Alzheimer, prion diseases or dementia
-
- A—HUMAN NECESSITIES
- A61—MEDICAL OR VETERINARY SCIENCE; HYGIENE
- A61B—DIAGNOSIS; SURGERY; IDENTIFICATION
- A61B5/00—Measuring for diagnostic purposes; Identification of persons
- A61B5/72—Signal processing specially adapted for physiological signals or for diagnostic purposes
- A61B5/7235—Details of waveform analysis
- A61B5/7264—Classification of physiological signals or data, e.g. using neural networks, statistical classifiers, expert systems or fuzzy systems
-
- A—HUMAN NECESSITIES
- A61—MEDICAL OR VETERINARY SCIENCE; HYGIENE
- A61B—DIAGNOSIS; SURGERY; IDENTIFICATION
- A61B5/00—Measuring for diagnostic purposes; Identification of persons
- A61B5/72—Signal processing specially adapted for physiological signals or for diagnostic purposes
- A61B5/7271—Specific aspects of physiological measurement analysis
- A61B5/7275—Determining trends in physiological measurement data; Predicting development of a medical condition based on physiological measurements, e.g. determining a risk factor
-
- G—PHYSICS
- G06—COMPUTING OR CALCULATING; COUNTING
- G06T—IMAGE DATA PROCESSING OR GENERATION, IN GENERAL
- G06T7/00—Image analysis
- G06T7/0002—Inspection of images, e.g. flaw detection
- G06T7/0012—Biomedical image inspection
-
- G—PHYSICS
- G06—COMPUTING OR CALCULATING; COUNTING
- G06T—IMAGE DATA PROCESSING OR GENERATION, IN GENERAL
- G06T7/00—Image analysis
- G06T7/0002—Inspection of images, e.g. flaw detection
- G06T7/0012—Biomedical image inspection
- G06T7/0014—Biomedical image inspection using an image reference approach
- G06T7/0016—Biomedical image inspection using an image reference approach involving temporal comparison
-
- G—PHYSICS
- G16—INFORMATION AND COMMUNICATION TECHNOLOGY [ICT] SPECIALLY ADAPTED FOR SPECIFIC APPLICATION FIELDS
- G16H—HEALTHCARE INFORMATICS, i.e. INFORMATION AND COMMUNICATION TECHNOLOGY [ICT] SPECIALLY ADAPTED FOR THE HANDLING OR PROCESSING OF MEDICAL OR HEALTHCARE DATA
- G16H50/00—ICT specially adapted for medical diagnosis, medical simulation or medical data mining; ICT specially adapted for detecting, monitoring or modelling epidemics or pandemics
- G16H50/30—ICT specially adapted for medical diagnosis, medical simulation or medical data mining; ICT specially adapted for detecting, monitoring or modelling epidemics or pandemics for calculating health indices; for individual health risk assessment
-
- G—PHYSICS
- G16—INFORMATION AND COMMUNICATION TECHNOLOGY [ICT] SPECIALLY ADAPTED FOR SPECIFIC APPLICATION FIELDS
- G16H—HEALTHCARE INFORMATICS, i.e. INFORMATION AND COMMUNICATION TECHNOLOGY [ICT] SPECIALLY ADAPTED FOR THE HANDLING OR PROCESSING OF MEDICAL OR HEALTHCARE DATA
- G16H50/00—ICT specially adapted for medical diagnosis, medical simulation or medical data mining; ICT specially adapted for detecting, monitoring or modelling epidemics or pandemics
- G16H50/70—ICT specially adapted for medical diagnosis, medical simulation or medical data mining; ICT specially adapted for detecting, monitoring or modelling epidemics or pandemics for mining of medical data, e.g. analysing previous cases of other patients
-
- A—HUMAN NECESSITIES
- A61—MEDICAL OR VETERINARY SCIENCE; HYGIENE
- A61B—DIAGNOSIS; SURGERY; IDENTIFICATION
- A61B2576/00—Medical imaging apparatus involving image processing or analysis
- A61B2576/02—Medical imaging apparatus involving image processing or analysis specially adapted for a particular organ or body part
- A61B2576/026—Medical imaging apparatus involving image processing or analysis specially adapted for a particular organ or body part for the brain
-
- G—PHYSICS
- G06—COMPUTING OR CALCULATING; COUNTING
- G06T—IMAGE DATA PROCESSING OR GENERATION, IN GENERAL
- G06T2207/00—Indexing scheme for image analysis or image enhancement
- G06T2207/10—Image acquisition modality
- G06T2207/10072—Tomographic images
- G06T2207/10088—Magnetic resonance imaging [MRI]
-
- G—PHYSICS
- G06—COMPUTING OR CALCULATING; COUNTING
- G06T—IMAGE DATA PROCESSING OR GENERATION, IN GENERAL
- G06T2207/00—Indexing scheme for image analysis or image enhancement
- G06T2207/10—Image acquisition modality
- G06T2207/10072—Tomographic images
- G06T2207/10088—Magnetic resonance imaging [MRI]
- G06T2207/10092—Diffusion tensor magnetic resonance imaging [DTI]
-
- G—PHYSICS
- G06—COMPUTING OR CALCULATING; COUNTING
- G06T—IMAGE DATA PROCESSING OR GENERATION, IN GENERAL
- G06T2207/00—Indexing scheme for image analysis or image enhancement
- G06T2207/20—Special algorithmic details
- G06T2207/20081—Training; Learning
-
- G—PHYSICS
- G06—COMPUTING OR CALCULATING; COUNTING
- G06T—IMAGE DATA PROCESSING OR GENERATION, IN GENERAL
- G06T2207/00—Indexing scheme for image analysis or image enhancement
- G06T2207/20—Special algorithmic details
- G06T2207/20084—Artificial neural networks [ANN]
-
- G—PHYSICS
- G06—COMPUTING OR CALCULATING; COUNTING
- G06T—IMAGE DATA PROCESSING OR GENERATION, IN GENERAL
- G06T2207/00—Indexing scheme for image analysis or image enhancement
- G06T2207/30—Subject of image; Context of image processing
- G06T2207/30004—Biomedical image processing
- G06T2207/30016—Brain
Definitions
- the present disclosure relates to the technical field of evaluating predicted age difference (PAD) based on the corrected diffusion MRI data and using the PAD to predict current and future concomitant clinical dementia rating and related program, as well as distortion/artefact correction for diffusion magnetic resonance imaging (MRI) data in an integrated framework and program thereof.
- PAD predicted age difference
- MRI diffusion magnetic resonance imaging
- the cognitive tests include dementia assessment tests and neuropsychological tests.
- Dementia assessment tests are developed based on clinically-relevant cognitive symptoms, while neuropsychological tests are developed based on the performance in different psychological domains.
- Dementia assessment tests that are widely used include the Clinical Dementia Rating (CDR), Mini-Mental State Examination (MMSE), Montreal Cognitive Assessment (MoCA), AD8, Alzheimer's Disease Assessment Scale-Cognitive Subscale (ADAS-cog), Alzheimer's Disease Co-operative Study ADL Scale for Mild Cognitive Impairment (ADCS-ADL-MCI), and Neuropsychiatric Inventory (NPI).
- CDR Clinical Dementia Rating
- MMSE Mini-Mental State Examination
- MoCA Montreal Cognitive Assessment
- AD8 Alzheimer's Disease Assessment Scale-Cognitive Subscale
- ADCS-ADL-MCI Alzheimer's Disease Co-operative Study ADL Scale for Mild Cognitive Impairment
- NPI Neuropsychiatric Inventory
- a typical neuropsychological evaluation will assess a person's general intelligence, attention and concentration, learning and memory, reasoning and problem solving, language, visual-spatial skills (perception), motor and sensory skills, mood and behavior.
- An example of such evaluation is Repeatable Battery for the Assessment of Neuropsychological Status (RBANS).
- the clinical dementia rating is a score estimated during a semi-structure interview used for staging the severity of dementia in Alzheimer's disease (AD) (Hughes et al., 1982) or non-AD dementia (Kazui et al., 2016).
- AD Alzheimer's disease
- non-AD dementia Kazui et al., 2016
- the interview for the CDR focuses on patients' daily functioning and, therefore, is more congruent with standard diagnostic criteria of dementia (Lim et al., 2007).
- the CDR interview is conducted by certified physicians or nurses, and administered to patients and appropriate informants.
- the interview consists of 6 different domains, i.e. memory, orientation, judgment and problem solving, community affairs, home and hobbies, and personal care.
- the scores over the 6 domains are then converted to a global score of the CDR.
- the CDR score has been validated to be reliable to diagnose dementia and to grade the dementia severity (Morris, 1993). To date, the CDR has been included by professional societies worldwide in the guideline of dementia care and diagnosis (Petersen et al., 2018).
- CDR Alzheimer's disease
- the first imitation of the CDR is its inability to predict future outcome of the CDR in the upcoming 2 to 3 years.
- the CDR is reliable to grade the dementia severity, it cannot predict the progression of dementia.
- CDR future outcome is clinically important because medical professionals not only assess the severity of dementia of a patient, but also want to know whether and how fast dementia will be worsened in a few years to come.
- the CDR has stringent conditions for a successful interview. It requires well trained medical professionals and availability of reliable informants to ensure the accuracy of the CDR. Trained professionals or reliable informants may be lacking in less developed or supported areas, undermining the availability of accurate CDR.
- FW free water
- Beheshti et al. estimated PAD on the basis of individual's morphometric features of gray matter of the brain extracted from T1-weighted (T1w) MRI, and found that PAD was associated with the scores of several clinical assessments of dementia including the CDR (Beheshti et al., 2018).
- diffusion MRI is widely used as a tool in understanding the morphometric features of an individual's brain.
- DWI diffusion-weighted images
- dMRI diffusion MRI
- the artefact of susceptibility-induced distortions is the most notorious since it greatly degrades the performance of dMRI analysis.
- This artefact is usually corrected retrospectively by measuring or estimating the “field map”, which represents how a point in the undistorted space displaces (or distorts in the distortion correction context) to the distorted space.
- the field map is a 3D scalar field since DWI is usually assumed to distort along the phase-encoding (PE) direction due to low acquisition bandwidth.
- the correction method could be roughly divided into three categories.
- the first is field map-based, this method explicitly measures the field map by acquiring two gradient echo images with exact scanning parameters except for the echo time (TE), then the field map is the phase differences between the two images divided by the differences of the TE values (Jezzard et al., 1998)
- the second is reverse gradient-based (Andersson et al., 2003; Irfanoglu et al., 2015; Hedouin et al., 2017), where two b 0 images (or two complete dMRI datasets) with reverse PE gradients are acquired.
- the two b 0 images (or the two dMRI datasets) would have reverse distortions, hence the field map could be estimated by registering them to their “midpoint” image, which is theoretically the undistorted image.
- the last is anatomical image-based (Huang et al., 2008), in this category, the real b 0 image is registered to a pseudo b 0 image, which is constructed from the anatomical images, such as T1-weighted (T1w) image or T2-weighted (T2w) image. Since the anatomical images are free of distortions, the estimated displacement map of the registration could be considered as a surrogate of the field map.
- both the reverse gradient-based and the anatomical image-based methods greatly involve registration calculations, therefore, some efforts have been made to combine them by regarding the pseudo b 0 images as the midpoint images in the reverse gradient-based methods; this approach has been shown to improve the performance of distortion correction (Irfanoglu et al., 2015).
- the anatomical image-based methods use the anatomical image (T1w or T2w) to construct the pseudo b 0 image, which is used as the reference image to drive the correction.
- Correction methods in this category estimate the field map by non-linearly registering the real b 0 image (distorted) to align with the pseudo b 0 image (distortion-free). When the images are aligned well, the image discrepancy shall be low.
- the goodness of the alignment is usually measured by similarity metrics such as sum of squared differences (SSD) (Huang et al., 2008), normalized mutual information (NMI) (Bhushan et al., 2015), correlation ratio (CR) (Bhushan et al., 2015), or cross-correlation (CC) (Irfanoglu et al., 2015).
- SSD sum of squared differences
- NMI normalized mutual information
- CR correlation ratio
- CC cross-correlation
- Non-linear registration is an ill-posed problem, so it is easy to fail in nature, particularly when the images have large discrepancy.
- Two primary sources contribute to the image discrepancy, one is the spatial discrepancy, which is due to the susceptibility-induced distortions, and the other is the contrast discrepancy, which is the intensity biases between the real b 0 image and the pseudo b 0 image.
- the conventional correction methods assume that the image discrepancy is entirely caused by the susceptibility-induced distortions and disregard the contribution of the intensity biases. In this manner, the overfitting problem may become significant for regions with large intensity biases, leading to wrong point-by-point correspondence and wrong field map.
- One of the solutions is to use the cost functions which are less sensitive to the contrast discrepancy, such as NMI, CR, or CC.
- estimations using these cost functions are easy to be trapped in local minima (or maxima, depends on the cost functions), rendering the spatial discrepancy originated from the susceptibility-induced distortions not corrected very well (Bhushan C et al., 2015).
- Another solution is to adjust the hyperparameters of the correction method to make the field map smoother, consequently lowering the sensitivity of image discrepancy. Similar to the previous approach, the lower sensitivity would lead the real distortions not corrected very well.
- LDMM Large Deformation Diffeomorphic Metric Mapping
- ANTs Advanced Normalization Tools
- Employing the 3D registration correction method to solve the 1D distortion correction problem has at least two drawbacks.
- the calculated free-form deformations have to be further constrained to along the PE direction (Irfanoglu et al., 2015), leading to unnecessary calculations.
- the second, which is more serious, is that the convergence of the registration may not always correspond to the convergence of distortion correction because the registration correction method have higher degrees of freedom than the distortion problem per se.
- the present disclosure provides a brain age score used to predict the severity of dementia of a person and to predict his/her dementia outcome in the following years, and the program thereof.
- the brain age score is PAD, and it evaluates the current CDR of a patient as well as predicting the patient's CDR change in the next few years.
- Brain age is a type of brain predicted age derived from a brain image-based machine learning method (Cole and Franke, 2017). It entails training of a brain age model using a large amount of brain images from a group of healthy people together with each individual's chronological age. Typically, features of brain structure or function are extracted from the brain MRI data and the features are trained by the machine learning algorithm. The algorithm produces a prediction model to predict an individual's chronological age based on his/her brain images, hence called brain predicted age. Once the model is trained and validated, it can then be used to estimate brain age of an individual, and the PAD, defined as the difference between brain age and chronological age of an individual, is then calculated to indicate the aging status of the brain.
- the PAD defined as the difference between brain age and chronological age of an individual
- PAD has been shown to be a potential cognitive aging marker. It is associated with cognitive impairment (Liem et al., 2017), fluid intelligence (Cole, 2020; Cole et al., 2018), and various cognitive abilities (Boyle et al., 2020; Richard et al., 2018). Beheshti et al. estimated PAD using individual's morphometric features extracted from T1w MRI (Beheshti et al., 2018). They found that PAD was associated with the scores of several clinical assessments of dementia including the CDR. Beheshti's work demonstrated the capability of PAD in predicting the CDR at the moment of MRI scanning, however, they did not have longitudinal data to investigate the prediction of PAD in the CDR change in the following years.
- the Open Access Series of Imaging Studies is a databank which collects MRI and PET data, neuropsychological testing, and clinical data (https://www.oasis-brains.org/). It is publicly available to the scientific community with the aim of studying the effects of healthy aging and AD.
- the OASIS-3 is a dataset released in 2019 which comprises longitudinal data of 1098 participants, aged from 42 to 95 years (LaMontagne et al., 2019).
- CDR Clinical Dementia Rating
- the present method is based on a system of 258 cognitively normal adults in the OASIS data to build a pre-established prediction model, which is a brain age model, and applied the model to participants with different CDRs encompassing 0, 0.5 and 1 at the baseline, i.e., the time of MRI scanning, and investigated the association of PAD with the CDR change in several years of follow-up.
- PADs were different among participants with different CDR scores of 0, 0.5 and 1 at the baseline.
- PAD in participants with stable CDR of 0.5 was different from PAD in participants with the CDR of 0.5 at the baseline but turned to 0 or 1 in the follow-up.
- PAD in participants with stable CDR of 0 was different from PAD in participants whose baseline CDR was 0 but converted to 0.5 in the follow-up years.
- the present invention uses microstructural features of white matter (WM) of the brain extracted from diffusion tensor imaging (DTI) to calculate PAD, dubbed WM PAD, and establishes a method which associates the WM PAD and the CDR.
- WM white matter
- DTI diffusion tensor imaging
- an individual's WM PAD is associated with this person's concomitant CDR.
- WM PAD is also associated with the CDR change in the following two to three years. This method for associating the WM PAD and the CDR allows the medical professionals to use WM PAD as a surrogate marker to predict the CDR and its future outcome in the coming years.
- a method and related computer based program have been designed to read the specified brain image data of an individual as inputs and estimates the person's predicted age difference (PAD), and according to the predefined cutoff value of PAD, it is determined whether the person is likely/or unlikely to be cognitively normal if he/she were assessed by the clinical dementia rating (CDR).
- the current invention is directed to a method of quantitatively evaluating likelihood of a disease condition and/or condition change from a medical image of an individual's brain, the method comprising (1) processing the original medical image to obtain a first medical image and a second medical image; (2) processing the first medical image to obtain segments of at least one brain tissue of the first medical image; (3) obtaining a deformation map of the individual's brain based on the segments of at least one brain tissue obtained in the step (2); (4) correcting artifacts of the second medical image; (5) obtaining at least one diffusion-related values of the brain tissue using the artifact-corrected second medical image obtained in the step (4) and the deformation map obtained from the first medical image in the step (3); (6) calculating predicted age difference (PAD) by inputting the extracted diffusion-related values obtained in the step (5) to an established brain age prediction model; (7) predicting likelihood of a disease condition or condition change from the PAD using a disease condition or a condition change prediction model.
- PID predicted age difference
- the disease condition refers to concomitant CDR.
- the disease condition change refers to CDR change in 2-3 years.
- the diffusion-related values includes the fractional anisotropy (FA) and mean diffusivity (MD) values.
- the method of quantitatively evaluating likelihood of a disease condition or condition change from a medical image of an individual's brain wherein the second image is obtained from a diffusion tensor imaging (DTI) sequence.
- DTI diffusion tensor imaging
- the method of quantitatively evaluating likelihood of a disease condition or condition change from a medical image of an individual's brain wherein the at least one brain tissue includes white matter (WM), gray matter (GM), or both.
- WM white matter
- GM gray matter
- the method of quantitatively evaluating likelihood of a disease condition or condition change from a medical image of an individual's brain wherein the step (3) includes registering the segments of at least one brain tissue obtained in the step (2) to MNI space.
- the method of quantitatively evaluating likelihood of a disease condition or condition change from a medical image of an individual's brain wherein the step (4) includes inverting T1w contrast to synthesize a pseudo b0 image and registering the DTI to pseudo b0 image to correct the artifacts of DTI data.
- the method of quantitatively evaluating likelihood of a disease condition or condition change from a medical image of an individual's brain wherein the brain tissue of step (5) is WM.
- the method of quantitatively evaluating likelihood of a disease condition or condition change from a medical image of an individual's brain wherein the diffusion-related values of step (5) include fractional anisotropy (FA) and mean diffusivity (MD).
- CDR clinical dementia rating
- the invention is directed to a method for evaluating the clinical dementia rating (CDR) of an individual and CDR's future change from predicted age difference (PAD) based on MRI data of the individual's brain, comprising: (1) acquiring MRI data of the individual's brain using T1-weighted (T1w) imaging and diffusion tensor imaging (DTI) sequences; (2) processing the acquired T1w data so as to obtain white matter (WM) and grey matter (GM) segments; (3) registering the WM and GM segments obtained in the step (2) to the MNI space to obtain the deformation map of the individual's brain; (4) correcting artifacts of the DTI data; (5) obtaining fractional anisotropy (FA) and mean diffusivity (MD) maps for the individual in native space based on the artifact corrected DTI data; (6) extracting FA and MD values of WM region of the individual's brain using the FA and MD maps obtained in the step (5) and the deformation map obtained in the step (3); (7)
- the method for estimating the clinical dementia rating (CDR) of an individual and CDR's future change from predicted age difference (PAD) based on MRI data of the individual's brain wherein the step (2) comprising: (i) correcting SI inhomogeneity of T1w data; (ii) segmenting tissue probability maps (TPM); (iii) obtaining WM and GM segments.
- the method for estimating the clinical dementia rating (CDR) of an individual and CDR's future change from predicted age difference (PAD) based on MRI data of the individual's brain wherein the step (2) further comprising: inverting T1w contrast to synthesize a pseudo b0 image.
- the method for estimating the clinical dementia rating (CDR) of an individual and CDR's future change from predicted age difference (PAD) based on MRI data of the individual's brain wherein the step (4) comprising: registering the DTI data to pseudo b0 image to correct the artifacts of DTI data.
- the method for estimating the clinical dementia rating (CDR) of an individual and CDR's future change from predicted age difference (PAD) based on MRI data of the individual's brain comprising: (i) estimating diffusion tensor at each image pixel of the artifact corrected DTI data; (ii) calculating FA and MD at each pixel using a diffusion tensor indexes derived from the estimated diffusion tensor at each pixel; (iii) generating the FA and MD maps in the native space using the FA and MD at each pixel.
- ⁇ 1, ⁇ 2, ⁇ 3 represent the 1st, 2nd, 3rd eigenvalues of the diffusion tensor, respectively.
- the method for estimating the clinical dementia rating (CDR) of an individual and CDR's future change from predicted age difference (PAD) based on MRI data of the individual's brain comprising: (i) registering the FA and MD maps to the MNI space using the deformation maps in the step (3); and (ii) masking the registered FA and MD maps with WM segments.
- the method for estimating the clinical dementia rating (CDR) of an individual and CDR's future change from predicted age difference (PAD) based on MRI data of the individual's brain wherein: the brain predicted age model is built by regressing the chronological age of more than one individual against FA and MD values inside the WM region using a Gaussian process regression method.
- the method for estimating the clinical dementia rating (CDR) of an individual and CDR's future change from predicted age difference (PAD) based on MRI data of the individual's brain wherein: the individual's brain consists of the white matter region.
- the method for estimating the clinical dementia rating (CDR) of an individual and CDR's future change from predicted age difference (PAD) based on MRI data of the individual's brain wherein: the CDR change is the CDR of the individual in the next 2-3 years since the date of the MRI scanning.
- the invention is directed to a non-transitory computer readable medium storing a program causing a computer to execute a process for predicting the clinical dementia rating (CDR) of an individual and CDR's future change, the process comprising: (1) processing an original medical image to obtain a first medical image and a second medical image; (2) processing the first medical image to obtain segments of at least one brain tissue of the first medical image; (3) obtaining a deformation map of the individual's brain based on the segments of at least one brain tissue obtained in the step (2); (4) correcting artifacts of the second medical image; (5) obtaining fractional anisotropy (FA) and mean diffusivity (MD) values of the brain tissue using the artifacts-corrected second medical image obtained in the step (4) and the deformation map obtained from the first medical image in the step (3); (6) calculating predicted age difference (PAD) by inputting the extracted FA and MD obtained in the step (5) to an established dMRI-brain age model; (7) predicting likelihood
- CDR clinical dementia
- the non-transitory computer readable medium storing a program causing a computer to execute a process for predicting the clinical dementia rating (CDR) of an individual and CDR's future change, wherein the first image is a T1-weighted (T1w) image; and the second image is a diffusion tensor imaging (DTI) sequence.
- CDR clinical dementia rating
- T1w T1-weighted
- DTI diffusion tensor imaging
- the non-transitory computer readable medium storing a program causing a computer to execute a process for predicting the clinical dementia rating (CDR) of an individual and CDR's future change, wherein the at least one brain tissue includes white matter (WM), gray matter (GM), or both.
- CDR clinical dementia rating
- DWI are corrected with a novel method and/or a computer based program so as to remove and/or reduce the artefacts in the dMRI data more efficiently.
- a registration method which is dedicated for the susceptibility-induced distortions is developed.
- the first derivative (analytic) and the second derivative (approximated) are derived. Therefore, this method could estimate the field map using a Gauss-Newton optimization scheme, which is very efficient.
- a term called “bias field” is introduced to model the contrast discrepancy between the real b 0 image and the pseudo b 0 image. In this way, the image discrepancy would be explained by two factors: the susceptibility-induced distortions by the field map and the intensity biases by the bias field.
- the field map and the bias field are estimated simultaneously. Their values are automatically adjusted by the estimation method according to the magnitude of susceptibility-induced distortions and the level of intensity biases.
- FIG. 1 shows a flow chart of a process for estimating the CDR from WM PAD
- FIG. 2 shows a flow chart of a process for acquisition of T1w and DTI data
- FIG. 3 shows a flow chart of a process for image processing of T1w
- FIG. 4 shows a flow chart of a process for registration of GM and WM to MNI space
- FIG. 5 shows a flow chart of a process for artifact correction of DTI data
- FIG. 6 shows a flow chart of a process for reconstruction of MD and FA
- FIG. 7 shows a flow chart of a process for extraction of FA and MD
- FIG. 8 shows a flow chart of a process for estimation of WM brain age and PAD
- FIG. 9 shows a flow chart of a process for prediction of the CDR and CDR change
- FIG. 10 shows comparisons between CN1-to-[CN2], [nD1], and [nD2] of Example 2;
- FIG. 11 shows comparisons between [D1]-to-CN, [nD1], and [D1]-to-D2 of Example 2;
- FIG. 12 shows comparisons between CN1-to-[CN2], D1-to-[CN], and [CN]-to-D1 of Example 2;
- FIG. 13 shows spectrum of PAD.
- FIG. 14 shows the process for participant's brain being scanned by an MRI scanner.
- FIG. 15 shows the process for the anatomical image being converted to the pseudo b 0 image.
- FIG. 16 shows the process for extracting the real b 0 image from the dMRI data.
- FIG. 17 shows the process the pseudo b 0 image is rigidly registered to the real b 0 image.
- FIG. 18 shows the image discrepancy modeling.
- FIG. 19 shows the algorithm for estimating ⁇ and v.
- FIG. 20 shows the results of correcting the artefacts of a participant's dMRI data.
- FIG. 21 shows the PAD comparisons between CN1-to-[CN2], [nD1], and [nD2] of Example 3.
- FIG. 24 shows a conceptual data flow diagram illustrating the data flow between different components/means in an exemplary apparatus.
- FIG. 25 shows a diagram illustrating an example of a hardware implementation for an apparatus employing a processing system.
- first, second, third etc. may be used herein to describe various elements, components, regions, layers and/or sections, these elements, components, regions, layers and/or sections should not be limited by these terms. These terms are only used to distinguish one element, component, region, layer or section from another element, component, region, layer or section. Thus, a first element, component, region, layer or section discussed below could be termed a second element, component, region, layer or section without departing from the teachings of the invention.
- relative terms such as “lower” or “bottom” and “upper” or “top,” may be used herein to describe one element's relationship to another element as illustrated in the Figures. It will be understood that relative terms are intended to encompass different orientations of the device in addition to the orientation depicted in the Figures. For example, if the device in one of the figures is turned over, elements described as being on the “lower” side of other elements would then be oriented on “upper” sides of the other elements. The exemplary term “lower”, can therefore, encompasses both an orientation of “lower” and “upper,” depending of the particular orientation of the figure.
- “around”, “about”, “approximately” or “substantially” shall generally mean within 20 percent, preferably within 10 percent, and more preferably within 5 percent of a given value or range. Numerical quantities given herein are approximate, meaning that the term “around”, “about”, “approximately” or “substantially” can be inferred if not expressly stated.
- the phrase “at least one of A, B, and C” should be construed to mean a logical (A or B or C), using a non-exclusive logical OR.
- the term “and/or” includes any and all combinations of one or more of the associated listed items.
- this invention in one aspect, relates to a method and related apparatus for calculating and predicting the CDR based on the MRI data of an individual's WM PAD.
- FIG. 1 shows the overall flowchart of the invention: process of using WM PAD to evaluate the CDR and predict CDR change by a program.
- the invention starts with the acquisition of MRI data using T1w imaging and diffusion-weighted imaging sequences (step 1 ). To ensure the same WM component is selected from different brains, spatial registration of each individual's MRI image to a standard template in the MNI space is mandated (step 2 & 3 ).
- steps 2 and/or 3 are spatial normalization process during which the MRI image such as the T1w image is segmented and the segments of certain brain tissues are registered to MNI space. Therefore, a deformation map(s) of the certain brain tissues are obtained during the spatial normalization process.
- steps 5 and/or 6 are feature quantification process, during which FA and MD maps based on the artifact corrected diffusion-weighted MRI data are obtained, and FA and MD indexes of certain brain tissues are extracted.
- the resulting FA and MD values serve as input to an established dMRI-brain age model to estimate brain age and WM PAD (step 7 ).
- WM PAD is used to determine the CDR and predict CDR future change using pre-established models in programs (step 8 ). Detailed description of each step is described as follows.
- FIG. 2 shows the process of acquisition of T1w and DTI data by the program.
- Step 1 . 1 is MRI scanning of a person's brain.
- a person is scanned by a MRI system at 1.5 Tesla or 3 Tesla with a phase-arrayed multi-channel head coil.
- MRI scanning is contraindicated for participants who are pregnant within 1st trimester, having pacemaker or defibrillator implantation, or vascular clipping or stenting within 6 months.
- Step 1 . 2 is acquisition of T1w.
- T1w data are acquired using a 3-dimensional magnetization prepared rapid gradient echo sequence.
- Step 1 . 3 is acquisition of DTI data.
- DTI data are acquired using diffusion-weighted 2-dimensional single shot spin-echo echo planar imaging using 24 different magnitudes of diffusion sensitivity (b-values) corresponding to 24 different directions (b-vectors) evenly distributed in the q space.
- Step 1 . 4 is obtaining T1w and DTI data. In this way, one T1w data and one DTI data were obtained for each participant for the processing in step 2 and 4 .
- FIG. 3 shows the step of image processing of T1w by the program during the spatial normalization process.
- Step 2 . 1 is a person's T1w image.
- the T1w image is processed using the Segment toolbox in the SPM12 software (Wellcome Trust Centre for Neuroimaging, University College London, London, UK).
- Step 2 . 2 is correction of SI inhomogeneity on T1w.
- the toolbox corrects signal intensity inhomogeneity.
- Step 2 . 3 is segment tissue probability maps (TPM) using Segment toolbox in SPM12. Having corrected SI inhomogeneity, the toolbox segments the T1w image into various tissue segments, including gray matter (GM), white matter (WM), cerebrospinal fluid (CSF), bone, scalp, and others.
- GM gray matter
- WM white matter
- CSF cerebrospinal fluid
- Step 2 . 4 is obtaining GM and WM segments. In this way, six TPMs were obtained and from which GM and WM segments are selected for the processing in step 3 .
- Step 2 . 5 is inverting T1w contrast.
- the contrast of the T1w image which has been corrected for the signal intensity inhomogeneity, is inverted to synthesize a pseudo b 0 image.
- Step 2 . 6 is obtaining pseudo b 0 image: In this way, we obtain a pseudo b 0 image for each person for the processing in step 4 .
- FIG. 4 shows the process of registration of GM and WM to MNI space during the spatial normalization process.
- Step 3 . 1 is a person's GM and WM segments.
- the GM and WM segments are registered to the ICBM152 template which is defined in the MNI space.
- Step 3 . 2 is to register GM and WM segments to ICBM152 template:
- the registration invokes a process which is a variant of the Large Deformation Diffeomorphic Metric Mapping (LDDMM) (Beg et al., 2005; Miller et al., 2006).
- LDMM Large Deformation Diffeomorphic Metric Mapping
- the initial velocity situated in the ICBM152 space is iteratively estimated by shooting this velocity along the time dimension toward the individual's native space.
- the course is divided into 10 uniform intervals, and an isotropic Gaussian filter with 10 mm full width at half maximum (FWHM) is used to ensure the smoothness of the initial velocity.
- FWHM full width at half maximum
- Step 3 . 3 is obtaining a person's deformation maps: In the final stage of convergence, a deformation map which transforms the individual's TPM to match the TPM in the ICBM152 template in obtained. The deformation map is used for the processing in step 6 .
- FIG. 5 shows the process of artifact correction of DTI data.
- Step 4 . 1 is a person's DTI image.
- the raw DTI data suffers from various artefacts, including susceptibility-induced distortion, eddy current-induced distortion, head motion, and intensity inhomogeneity, which vary from person to person and should be corrected to ensure accurate registration to the MNI space.
- Step 4 . 2 is to register DTI to pseudo b 0 image.
- the DTI data are processed using a novel registration-based method which correct these artefacts in an integrated framework.
- the registration-based method registers a person's raw DTI data to the same person's pseudo b 0 image which serves as the reference image without distortion and intensity inhomogeneity.
- Step 4 . 3 is to reduce artifacts using a series of artefact models. By invoking the artefact models in the integrated framework, the process is able to reduce the artefacts of the DTI data.
- Step 4 . 4 is to obtain artefact-corrected DTI image. In this way, the artefact-corrected DTI image is obtained. When the estimation achieved convergence, the corrected DTI data is also aligned with the T1w image.
- FIG. 6 shows the process of reconstruction of MD and FA during the feature quantification process.
- Step 5 . 1 is the artefact-corrected DTI data.
- the artefact-corrected DTI data is processed to estimate the diffusion tensor and the diffusion tensor indexes derived therein.
- Step 5 . 2 is to estimate diffusion tensor at each image pixel.
- the diffusion tensor estimation is performed using an approach proposed by (Koay et al., 2007). Briefly, weighted linear least squares method is first conducted, the results are then employed as the initial estimation for the constrained nonlinear least squares method to obtain the diffusion tensors, which are ensured to be positive-definite (i.e., the eigenvalues of the diffusion tensors are all positive).
- Step 5 . 3 is to calculate FA and MD at each pixel.
- the diffusion tensor indexes i.e. fractional anisotropy (FA) and mean diffusivity (MD), are derived from the estimated diffusion tensor at each pixel.
- FA fractional anisotropy
- MD mean diffusivity
- ⁇ 1, ⁇ 2 and ⁇ 3 denoted the first, second and third eigenvalues of the diffusion tensor, respectively, and ⁇ 1, ⁇ 2 and ⁇ 3 represented ⁇ 1 ⁇ MD, ⁇ 2 ⁇ MD, and ⁇ 3 ⁇ MD, respectively.
- Step 5 . 4 is to obtain FA and MD maps in the native space: In this way, FA and MD maps for each person in native space were obtained.
- FIG. 7 shows the process of extraction of FA and MD during the feature quantification process.
- Step 6 . 1 is a person's FA and MD maps in native space. Having obtained the FA and MD maps in step 5 , it is necessary to extract FA and MD values from the standardized WM segment.
- Step 6 . 2 is to register FA and MD maps to MNI space. To do this, the FA and MD maps in the native space are normalized to the MNI space through the deformation map obtained in step 3 .
- Step 6 . 3 is to mask the registered FA and MD maps with WM segment. Having normalized to the MNI space, the FA and MD values in WM are masked by the standardized WM segment in the ICBM152 template.
- Step 6 . 4 is to obtain FA and MD values of WM.
- the values of FA and MD of WM for each person were obtained.
- the results are used for the processing in step 7 .
- FIG. 8 shows the process for estimation of WM brain age and PAD.
- Step 7 . 1 is a person's FA and MD in WM: A persons' FA and MD are used as the input to an established dMRI-brain age model which was trained and validated in advance using the DTI data acquired from the same MRI scanner.
- Step 7 . 2 is inputting the FA and MD values to an established dMRI-brain age model to estimate brain age.
- a Gaussian process regression (GPR) method was used to regress the chronological age of the participants against the FA and MD values inside the WM region.
- the output of the model is a predicted age, called dMRI-brain age, estimated on the basis of the person's FA and MD values and the GRP model.
- the performance of the model has been tested and quantified in terms of the mean absolute error (MAE) and the Pearson's correlation coefficient (r) between the dMRI-brain age and chronological age.
- MAE mean absolute error
- r Pearson's correlation coefficient
- Step 7 . 3 is calculating the WM PAD from the estimated brain age and chronological age of the person. Having obtained the dMRI-brain age, predicted age difference of white matter (WM PAD) is calculated by the formula: dMRI-brain age—chronological age.
- Step 7 . 4 is obtaining WM PAD.
- WM PAD was obtained for estimating the CDR and CDR change.
- FIG. 9 shows the process for determining of the CDR and prediction of CDR future change.
- Step 8 . 1 is a person's WM PAD.
- a person's WM PAD is used as input of an established prediction model to determine his/her CDR and/or predict CDR future change.
- Step 8 . 2 is to determine the CDR from the established model relating WM PAD to the CDR.
- a linear regression model is applied to a dataset from a group of people whose WM PAD and concomitant CDR are known in advance.
- the dataset from the group of people whose WM PAD and concomitant CDR are known in advance is used to establish a brain age model.
- Step 8 . 3 is to obtain determined CDR.
- the CDR of a person is determined from the same person's WM PAD.
- Step 8 . 4 is to predict the CDR future change from the established model relating WM PAD to CDR future change.
- a linear regression model is applied to a dataset of a group of people whose WM PAD and the records of the CDR 2 to 3 years after WM PAD measurement are known.
- such a model is a brain age model.
- the CDR change is defined as the difference between the CDR which is taken at the same time as WM PAD measurement and the CDR taken 2 to 3 years later.
- Step 8 . 5 is to obtain predicted CDR change.
- the CDR change of a person is predicted from the same person's WM PAD.
- a pre-established prediction model includes both the dMRI-brain age model being used in calculating the WM PAD from the extracted FA and
- step 7 MD value in step 7 , as well as the models relating WM PAD to the CDR and CDR change in step 8 .
- the medical brain images of a number of patients are processed to extract at least one feature of each patient.
- this pre-established prediction model is constructed by associating the features with the conditions of cognitive impairment using machine-learning methods.
- the model can be used to predict the conditions of cognitive impairment by inputting the brain image features.
- FIG. 24 is a conceptual data flow diagram illustrating the data flow between different components/means in an exemplary apparatus 2400 .
- one or more image acquiring device e.g. MRI scanner(s)
- collect patient's brain image data and transmits the data to a reception component 2402 for being further processing.
- the reception component 2402 then transmits the image data to an image process component 2403 .
- the image acquiring device(s) may directly transmit the image data to the image process component 2403 , without using the reception component 2402 .
- the image process component 2403 processes the steps 2 . 1 - 2 . 6 to obtain pseudo b 0 image and GM and WM segments information. It then transmits the GM and WM segments information to a registration component 2406 for step 3 . 1 - 3 . 3 to obtain the deformation map.
- the pseudo b 0 image information and DTI data were transmitted to an artefact correction component 2405 for step 4 . 1 - 4 . 4 , during which the artefact-corrected DTI image is obtained.
- a prediction component 2407 then receives the deformation map from the registration component 2406 , and artefact-corrected DTI data from the artefact correction component 2405 .
- the prediction component 2407 may then proceed steps 5 - 8 .
- the steps 6 . 1 - 6 . 4 may take place at the registration component 2406 for obtaining FA and MD values of WM.
- FIG. 25 is a diagram 2500 illustrating an example of a hardware implementation for a processing system 2400 .
- the processing system 2500 may be implemented with a bus architecture, represented generally by a bus 2503 .
- the bus 2503 may include any number of interconnecting buses and bridges depending on the specific application of the processing system 2500 and the overall design constraints.
- the bus 2503 links together various circuits including one or more processors and/or hardware components, represented by one or more processors 2501 , the image process component 2403 , the artefact correction component 2405 , the registration component 2406 , the prediction component 2407 , and a computer-readable medium/memory 2502 .
- the bus 2503 may also link various other circuits such as timing sources, peripherals, voltage regulators, and power management circuits, etc.
- the processing system 2500 may be coupled to an image acquiring device 2401 , which may be a MRI scanner or other clinical image acquiring device.
- the processing system 2500 includes one or more processors 2501 coupled to a computer-readable medium/memory 2502 .
- the one or more processors 2501 are responsible for general processing, including the execution of software stored on the computer-readable medium/memory 2502 .
- the software when executed by the one or more processors 2501 , causes the processing system 2500 to perform the various functions described supra for any particular apparatus.
- the computer-readable medium/memory 2502 may also be used for storing data that is manipulated by the one or more processors 2501 when executing software.
- the processing system 2500 further includes at least one of the image process component 2403 , the artefact correction component 2405 , the registration component 2406 , the prediction component 2407 .
- the components may be software components running in the one or more processors 2501 , resident/stored in the computer readable medium/memory 2502 , one or more hardware components coupled to the one or more processors 2501 , or some combination thereof.
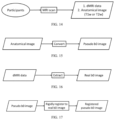
- This artifact correction steps 4 . 1 - 4 . 3 and FIG. 5 is presented in a more detailed manner in FIG. 14 - 20 .
- the participant's brain is scanned by a MRI scanner.
- the dMRI data and the anatomical image (T1w or T2w) are acquired.
- FIG. 14 . The anatomical image is converted to the pseudo b 0 image, which has similar image contrast to the real b 0 image.
- FIG. 15 The real b 0 image is extracted from the dMRI data.
- FIG. 16 The pseudo b 0 image is rigidly registered to the real b 0 image. This registered image is denoted as f 0 : ⁇ ⁇ f 0 : ⁇ ⁇ and the real b 0 b 0 image is f 1 : ⁇ ⁇ f 1 : ⁇ ⁇ .
- ⁇ 3 ⁇ 3 denotes the image domain.
- the coordinate of f 0 f 0 is r ⁇ r ⁇ .
- the PE direction of f 1 f 1 is p ⁇ 2 p ⁇ 2 .
- FIG. 17 The PE direction of f 1 f 1 is
- the distortion corrected image is
- FIG. 19 shows the process to estimate ⁇ and v.
- the cost function to be minimized is E 1 +E d +E ⁇ +E v , where
- E d 1 2 ⁇ ⁇ d ⁇ ⁇ r ⁇ ⁇ ⁇ " ⁇ [LeftBracketingBar]” D ⁇ ⁇ ⁇ " ⁇ [RightBracketingBar]” - 1 ⁇ ( e ⁇ ⁇ f 0 - ⁇ " ⁇ [LeftBracketingBar]” D ⁇ ⁇ ⁇ " ⁇ [RightBracketingBar]” ⁇ f 1 ⁇ ⁇ ) 2 ⁇ d ⁇ r ( 2 )
- E ⁇ 1 2 ⁇ ⁇ ⁇ ⁇ L ⁇ ⁇ ⁇ 2
- E v 1 2 ⁇ ⁇ v ⁇ ⁇ L v ⁇ v ⁇ 2 .
- A ivec(b)
- the differential operator L ⁇ is implemented through L ⁇ ⁇
- ⁇ 2 ⁇ ⁇ ,1 ⁇ ( r ) ⁇ 2 + ⁇ ⁇ ,2 ⁇ 2 ⁇ ( r ) ⁇ 2 dr, (6) where the first term in the integral is the membrane energy and the second is the bending energy, ⁇ ⁇ ,1 and ⁇ ⁇ ,2 control their strength of regularization, respectively. Practically, this differential operator is expressed in the matrix form L ⁇ ⁇ n xyz ⁇ n xyz .
- Gauss-Newton approach is used to update the initial velocity field v.
- g v e ⁇ f 0 ⁇ p (
- H v
- ⁇ p is the gradient along the p direction.
- the differential operator L v is defined with the same form as L ⁇ , where the strength of membrane energy and that of bending energy are controlled by ⁇ v,1 and ⁇ v,2 , respectively.
- This differential operator is encoded in the matrix L v ⁇ n xyz ⁇ n xyz .
- the current registration method is dedicated for the susceptibility-induced distortions, which is a 1D deformation along the PE direction. While the first derivative (g v ) has been shown previously, the Hessian (H v ) which is an approximation to the second derivative is our invention. Therefore, this method estimates the field map using a Gauss-Newton optimization scheme, which is more efficient as compared to existing methods.
- bias field is introduced to model the contrast discrepancy between the real b 0 image and the pseudo b 0 image.
- existing anatomical image-base methods do not explicitly consider the contrast discrepancy in the estimation procedures.
- FIG. 20 shows an example of using the proposed method.
- the raw b 0 image FIG. 20 ( a )
- the method falls into local minima, rendering the distortions not adequately corrected, such as those regions indicated by the green arrows in the b 0 image ( FIG. 20 ( b ) ) and the fractional anisotropy (FA) map ( FIG. 20 ( c ) ).
- the bias field FIG.
- the algorithm would attempt to reduce the cost function (i.e., SSD) by spatially aligning the registered images. It is well known that registration, particularly non-linear, is an ill-posed problem. In this manner, registering regions with large intensity biases is easy to result in wrong point-by-point correspondence and wrong field map.
- SSD cost function
- the participants in OASIS-3 were enrolled by different projects related to Knight ADRC.
- the exclusion criteria included medical conditions that precluded longitudinal participation, e.g. end-stage renal disease requiring dialysis or contraindications for the MRI study, e.g. pacemaker implantation. All participants gave informed consent following procedures approved by the Institutional Review Board of Washington University School of Medicine.
- MRI data acquired from the same scanner model (TIM Trio) using the same acquisition scheme for T1w imaging and diffusion tensor imaging (DTI) were selected for the analysis. Since the analysis required acceptable image quality of T1w and DTI data, participants whose images presented severe image artefact such as motion blurring on T1w or failed artefact correction on DTI were excluded. Consequently, a total of 529 participants in 575 MRI scanning sessions were enrolled for subsequent analysis.
- T1w data were acquired using the 3-dimensional magnetization prepared rapid gradient echo sequence.
- DTI data were acquired using diffusion-weighted 2-dimensional single shot spin-echo echo planar imaging using 24 different magnitudes of diffusion sensitivity (b-values) corresponding to 24 different directions (b-vectors), repeated twice. The b-values and b-vectors are listed in the Supplementary File 1.
- TR 14500 ms
- TE 112 ms
- the two DTI acquisitions were concatenated to form a single DTI dataset, and so there were one T1w data and one DTI data in each MR session for each participant.
- the T1w image was processed using the Segment toolbox in the SPM12 software (Wellcome Trust Centre for Neuroimaging, University College London, London, UK).
- the outputs of the Segment toolbox were six TPMs, each represented a brain tissue component, and the T1w image with intensity inhomogeneity being corrected.
- the corrected T1w image were used in the subsequent artefact correction on DTI data, and the TPMs of GM and WM were used for spatial normalization of the images to the MNI space.
- Diffusion tensor estimation According to FIG. 6 , the artefact-corrected DTI data was processed to estimate the diffusion tensor using the approach proposed by (Koay et al., 2007). Briefly, the weighted linear least squares method was first conducted, the results were then employed as the initial estimation for the constrained nonlinear least squares method to obtain the diffusion tensors, which were ensured to be positive-definite (i.e., the eigenvalues of the diffusion tensors were all positive). The associated fractional anisotropy (FA) and mean diffusivity (MD) were derived from the estimated diffusion tensor at each pixel.
- FA fractional anisotropy
- MD mean diffusivity
- the FA and MD maps in the native space were normalized to the MNI space through the deformation map derived from the LDDMM registration.
- the FA and MD values in the WM pixels were extracted using the mask created from the WM TPM of the ICBM152 template. Since FA and MD were DTI indices representing white matter microstructural property, these values were used as the features in modeling the dMRI-brain age.
- the participants enrolled in the study were grouped into 9 groups according to the track records of their CDR values.
- the 9 groups were named as follow: [CN]-Modeling, [CN1]-to-CN2, CN1-to-[CN2], [CN]-to-D1, D1-to-[CN], [D1]-to-CN, [nD1], [D1]-to-D2, and [nD2]. All groups were mutually exclusive except [CN1]-to-CN2 and CN1-to-[CN2] which recruited the same participants, undertaking the first and second MRI scanning, respectively. The characteristics of the 9 groups were described below. There were 475 people included in the analysis after grouping, 258 participants in the CN-Modeling group and 217 participants in the rest of the groups.
- the CDR was 0 in all clinical records and had at least one such record within 1 year before or after the MRI scanning.
- the data in this group served as the training data to build the dMRI-brain age model.
- [CN] denoted the cognitive status of CN around the time of MR scanning.
- This group comprised 46 participants who were cognitively normal and stable.
- the screening criteria were the same as the [CN]-Modeling group.
- the data in this group served as the testing data of the dMRI-brain age modeling.
- [CN1] denoted that the participants were CN around the time of the first MR scanning.
- Table 1 lists the demographics of the people in the analysis and Table 2 summarizes the statistical results of the pairwise comparison among the seven groups.
- the elapsed time here represents the inter-scan interval between [CN1]-to-CN2 and CN1-to-[CN2] ⁇ APOE e4 means the percentage in the group population that poses either one or two e4 alleles.
- the CN-Modeling group were used to train the dMRI-brain age model.
- the Gaussian process regression method was used to regress the chronological age of the participants against the FA and MD values inside the WM region.
- this model was applied to each MRI data in other groups to estimate the dMRI-brain age.
- the predicted age difference (PAD) was calculated by subtracting the chronological age from the dMRI-brain age.
- the performance of the model was tested in the CN1 group and quantified by the mean absolute error (MAE) and the Pearson's correlation coefficient (r) between the dMRI-brain age and chronological age.
- MAE mean absolute error
- r Pearson's correlation coefficient
- PAD values were compared between any two of the seven groups, namely CN1-to-[CN2], [CN]-to-D1, D1-to-[CN], [D1]-to-CN, [nD1], [D1]-to-D2, and [nD2]; amounting to 21 pairwise comparisons.
- two sample t-test was conducted.
- the Benjamini-Hochberg procedure with a false discovery rate (FDR) of 0.05 was used to determine if a test was considered statistically significant.
- FIG. 10 shows the groups with different CDR levels, i.e., CN1-to-[CN2], [nD1], and [nD2].
- the mean and standard deviation of PAD values of CN1-to-[CN2], [nD1], and [nD2] were ⁇ 0.75 ⁇ 5.53, 5.48 ⁇ 6.68, and 12.33 ⁇ 10.89 years, respectively. All comparisons on the three pairs of groups showed statistically significant differences (Table 2, #4, #6, #20). The results indicated that the higher the CDR level, the higher the PAD values.
- FIG. 11 shows the participants who had the CDR of 0.5 at the time of MRI scanning who reverted to CN ([D1]-to-CN), stayed relatively stable ([nD1]), or converted to D2 ([D1]-to-D2) in 2 to 3 years ( FIG. 11 ).
- the mean and standard deviation of PAD values of [D1]-to-CN, [nD1], and [D1]-to-D2 were 2.99 ⁇ 7.16, 5.48 ⁇ 6.68, 9.21 ⁇ 6.14 years, respectively.
- FIG. 12 shows the participants who were in CN at the time of MRI scanning but presented relatively stable (CN1-to-[CN2]) or unstable states ([CN]-to-D1 and D1-to-[CN]) in 1 to 2 years.
- the mean and standard deviation of PAD values of CN1-to-[CN2], [CN]-to-D1, and D1-to-[CN] were ⁇ 0.75 ⁇ 5.53, 3.10 ⁇ 7.72, and 2.90 ⁇ 7.19 years, respectively.
- FIG. 13 shows the seven groups sorted by their mean PAD values, and we can observe five sub-groups as follow.
- the first sub-group comprised the participants with relatively stable normal cognition (CN1-to-[CN2]), and the mean PAD of which was approximately 0 years.
- the second sub-group included those exhibiting transitions between CN and D1 (i.e. [CN]-to-D1, D1-to-[CN], and [D1]-to-CN), and the mean PADs were approximately 3 years.
- the third, fourth and fifth sub-groups were the participants with [nD1], [D1]-to-D2, and [nD2], with the mean PAD of 5.48, 9.21 and 12.33 years, respectively.
- DTI-derived PAD corresponds to the CDR scores
- PAD differs between people with relatively stable CDR and those with the CDR changed to higher scores in a couple of years.
- the results produced by the present invention suggest that PAD is essential in grading the dementia severity and predicting the change of severity in a few years.
- the capability of PAD can solve the current limitations of the CDR which is subjected to inaccurate information obtained from unreliable informants and inability to predict CDR change in the coming years. Therefore, the solution in the present invention can be a surrogate marker of the concomitant CDR and, furthermore, a prediction marker of the CDR change 2 to 3 years from the baseline.
- PAD derived from white matter microstructural property was associated with the CDR of 0, 0.5 and 1 ( FIG. 10 ).
- PAD cardiovascular risk
- lifestyle factors such as physical exercise, alcohol and tobacco consumption and interpersonal relationship
- cardiovascular risks such as blood pressure, diabetes and body mass index
- the present invention found that some of the groups in the study population exhibited relatively stable CDR scores in 2 to 3 years, i.e., CN1-to-[CN2], [nD1] and [nD2], while some groups presented relatively rapid transitions of the CDR, i.e., [CN]-to-D1, D1-to-[CN], [D1]-to-CN, and [D1]-to-D2 (Table 2). Notably, when labeling each group with PAD, a continuum of PAD revealed across the relatively stable and meta-stable groups ( FIG. 13 ).
- the computer based program reads the specified brain image data of an individual as inputs and estimates the person's PAD, and according to the predefined cutoff value of PAD, the program determines whether the person is likely/or unlikely to be cognitively normal if he/she were assessed by the CDR.
- Example 3 participants in OASIS-3 of Example 3 undertook one to multiple sessions of brain MRI scanning on three 3T MRI scanners (Siemens, Er Weg, Germany) including two scanner models, i.e., Biograph and TIM Trio.
- MRI data acquired from the same scanner model (TIM Trio) using the same acquisition scheme for T1-weighted (T1w) imaging and diffusion tensor imaging (DTI) were selected for the analysis. Since the analysis required acceptable image quality of T1w and DTI data, participants whose images presented severe image artefact such as motion blurring on T1w or failed artefact correction on DTI were excluded.
- a total of 529 participants in 575 MRI scanning sessions were enrolled for subsequent analysis met the selection criteria.
- the participants enrolled in the study were grouped into 5 groups according to the track records of their CDR values.
- the 5 groups were named as follow: [CN]-Modeling, [CN1]-to-CN2, CN1-to-[CN2], [nD1], and [nD2]. All groups were mutually exclusive except [CN1]-to-CN2 and CN1-to-[CN2] which recruited the same participants, undertaking the first and second MRI scanning, respectively.
- the characteristics of the 5 groups were described below.
- [CN1]-to-CN2 This group comprised 46 participants who were cognitively normal and stable. The screening criteria were the same as the [CN]-Modeling group. The data in this group served as the testing data of the dMRI-brain age modeling. [CN1] denotes that the participants were CN around the time of the first MR scanning.
- Brain age modeling Data in the [CN]-Modeling group were used to train the dMRI-brain age model.
- the Gaussian Process Regression method was used to regress the chronological age of the participants against the DTI indices of the brain.
- the model was applied to each MRI data in other groups to estimate the dMRI-brain age.
- the predicted age difference (PAD) was calculated by subtracting the chronological age from the dMRI-brain age.
- the performance of the model was tested in the [CN1]-to-CN2 group and quantified by the mean absolute error (MAE) and the Pearson's correlation coefficient (r) between the dMRI-brain age and chronological age.
- MAE mean absolute error
- r Pearson's correlation coefficient
- Group comparison PAD values were compared between any two of the three groups, namely CN1-to-[CN2], [nD1], and [nD2], amounting to 3 pairwise comparisons. For each pair of groups, two sample t-test was conducted. The Benjamin-Hochberg procedure with a false discovery rate (FDR) of 0.05 was used to determine if a test was considered statistically significant.
- FDR false discovery rate
- Performance of the intended use To evaluate the performance of PAD in ruling out cognitively normal condition, we pooled the [nD1] and [nD2] groups to form a new group (named [nD1]+[nD2]) to represent the group with CDR >0 which is to be ruled out by our intended use.
- Table 3 summarizes the demographics of the 5 groups including [CN]-Modeling (training data), [CN1]-to-CN2 (testing data) and 3 comparison groups, namely CN1-to-[CN2], [nD1], and [nD2].
- [CN]-Modeling training data
- [CN1]-to-CN2 testing data
- 3 comparison groups namely CN1-to-[CN2], [nD1], and [nD2].
- FIG. 21 shows the groups with different CDR levels, i.e., CN1-to-[CN2], [nD1], and [nD2].
- the mean and standard deviation of PAD values of CN1-to-[CN2], [nD1], and [nD2] were ⁇ 0.75 ⁇ 5.53, 5.48 ⁇ 6.68, and 12.33 ⁇ 10.89 years, respectively. All comparisons on the three pairs of groups showed statistically significant differences. The results indicated that the higher the CDR level, the higher the PAD values.
- FIG. 22 shows the results of the ROC curve analysis.
- Area under the curve (AUC) was 0.82.
- FIG. 23 shows the confusion matrix of the results using the cutoff PAD of 6, and the distribution of the two populations (i.e.
- the present invention is pioneering in the field of CDR estimation and prediction with respect to at least three aspects.
- the brain age model being built by the present invention is based on the white matter microstructural metrics, named dMRI-brain age and the resulting WM PAD.
- dMRI-brain age the white matter microstructural metrics
- WM PAD the white matter microstructural metrics
- the existing method for estimating the CDR either built the brain age model on the basis of morphometric features of gray matter obtained from T1M MRI, named GM brain age and the resulting GM PAD, and found associations between GM PAD and concomitant measures of the CDR (Beheshti et al., 2018); or calculated FW content from diffusion MRI and found that FW was associated with concomitant measures of the CDR and future status of the CDR (Maillard et al., 2019).
- WM PAD has the advantages over prior solutions due to (1) better sensitivity to the CDR than GM brain age, and (2) less susceptibility to the cerebrospinal fluid (CSF) partial volume effect than the FW metric.
- CSF cerebrospinal fluid
- WM PAD is more sensitive than GM brain age in distinguishing CDR scores.
- they only showed the correlation between GM brain age and the CDR scores (from 0, 0.5 to 1). They did not show the results of comparison between brain age and the CDR, probably due to null results owing to marked overlaps between CDR scores ( FIG. 7 b in Beheshti's paper).
- dMRI-brain age maybe less susceptible to the CSF partial volume effect induced by brain atrophy than is FW metric.
- FW content is mainly attributed by the CSF partial volume effect in white matter neighboring the ventricles or cerebral sulci. The FW content would be likely to increase as the brain becomes atrophic with age. In other words, FW content is confounded by brain atrophy.
- WM PAD is derived from FA and MD in the whole brain white matter. Although FA and MD values are likely to be altered in the white matter pixels adjacent to the ventricles and cerebral sulci, the effect is negligible because the number of pixels with the partial volume effect is substantially small as compared with the whole brain white matter pixels.
- references cited in the instant application which may include patents, patent applications and various publications, are cited and discussed in the description of this invention. The citation and/or discussion of such references is provided merely to clarify the description of the present invention and is not an admission that any such reference is “prior art” to the invention described herein. All references cited and discussed in the description of this invention, are incorporated herein by reference in their entireties and to the same extent as if each reference was individually incorporated by reference.
Landscapes
- Health & Medical Sciences (AREA)
- Engineering & Computer Science (AREA)
- Life Sciences & Earth Sciences (AREA)
- Physics & Mathematics (AREA)
- Medical Informatics (AREA)
- General Health & Medical Sciences (AREA)
- Public Health (AREA)
- Biomedical Technology (AREA)
- Pathology (AREA)
- Molecular Biology (AREA)
- Heart & Thoracic Surgery (AREA)
- Veterinary Medicine (AREA)
- Animal Behavior & Ethology (AREA)
- Biophysics (AREA)
- Surgery (AREA)
- Neurology (AREA)
- Nuclear Medicine, Radiotherapy & Molecular Imaging (AREA)
- Physiology (AREA)
- Computer Vision & Pattern Recognition (AREA)
- Psychiatry (AREA)
- Artificial Intelligence (AREA)
- Radiology & Medical Imaging (AREA)
- Signal Processing (AREA)
- Theoretical Computer Science (AREA)
- High Energy & Nuclear Physics (AREA)
- General Physics & Mathematics (AREA)
- Child & Adolescent Psychology (AREA)
- Developmental Disabilities (AREA)
- Hospice & Palliative Care (AREA)
- Quality & Reliability (AREA)
- Psychology (AREA)
- Neurosurgery (AREA)
- Evolutionary Computation (AREA)
- Fuzzy Systems (AREA)
- Mathematical Physics (AREA)
- Data Mining & Analysis (AREA)
- Databases & Information Systems (AREA)
- Epidemiology (AREA)
- Primary Health Care (AREA)
- Magnetic Resonance Imaging Apparatus (AREA)
Priority Applications (6)
| Application Number | Priority Date | Filing Date | Title |
|---|---|---|---|
| US17/704,287 US11589800B2 (en) | 2021-06-29 | 2022-03-25 | Method of evaluating concomitant clinical dementia rating and its future outcome using predicted age difference and program thereof |
| US17/992,005 US11751798B2 (en) | 2021-06-29 | 2022-11-22 | Method of evaluating concomitant clinical dementia rating and its future outcome using predicted age difference and program thereof |
| US18/225,312 US11883184B1 (en) | 2021-06-29 | 2023-07-24 | Use of brain age in prediction of cognitive decline of patients with mild cognitive impairment treated with cholinesterase inhibitor |
| US18/539,555 US12133739B2 (en) | 2021-06-29 | 2023-12-14 | Use of brain age model in prediction of brain atrophy |
| US18/903,123 US20250017516A1 (en) | 2021-06-29 | 2024-10-01 | Method for evaluation of chemotherapy effects on cognitive function of cancer patients using brain age model |
| US19/366,690 US20260041368A1 (en) | 2021-06-29 | 2025-10-23 | Method for evaluation of ischemic stroke effects on cognitive function of patients using brain age model |
Applications Claiming Priority (2)
| Application Number | Priority Date | Filing Date | Title |
|---|---|---|---|
| US202163216028P | 2021-06-29 | 2021-06-29 | |
| US17/704,287 US11589800B2 (en) | 2021-06-29 | 2022-03-25 | Method of evaluating concomitant clinical dementia rating and its future outcome using predicted age difference and program thereof |
Related Child Applications (1)
| Application Number | Title | Priority Date | Filing Date |
|---|---|---|---|
| US17/992,005 Continuation US11751798B2 (en) | 2021-06-29 | 2022-11-22 | Method of evaluating concomitant clinical dementia rating and its future outcome using predicted age difference and program thereof |
Publications (2)
| Publication Number | Publication Date |
|---|---|
| US20230000424A1 US20230000424A1 (en) | 2023-01-05 |
| US11589800B2 true US11589800B2 (en) | 2023-02-28 |
Family
ID=84693414
Family Applications (2)
| Application Number | Title | Priority Date | Filing Date |
|---|---|---|---|
| US17/704,287 Active 2042-03-25 US11589800B2 (en) | 2021-06-29 | 2022-03-25 | Method of evaluating concomitant clinical dementia rating and its future outcome using predicted age difference and program thereof |
| US17/992,005 Active US11751798B2 (en) | 2021-06-29 | 2022-11-22 | Method of evaluating concomitant clinical dementia rating and its future outcome using predicted age difference and program thereof |
Family Applications After (1)
| Application Number | Title | Priority Date | Filing Date |
|---|---|---|---|
| US17/992,005 Active US11751798B2 (en) | 2021-06-29 | 2022-11-22 | Method of evaluating concomitant clinical dementia rating and its future outcome using predicted age difference and program thereof |
Country Status (8)
| Country | Link |
|---|---|
| US (2) | US11589800B2 (https=) |
| EP (1) | EP4362778A4 (https=) |
| JP (1) | JP2024524497A (https=) |
| KR (1) | KR102873399B1 (https=) |
| CN (2) | CN120732391A (https=) |
| AU (1) | AU2022304526B2 (https=) |
| CA (1) | CA3221182A1 (https=) |
| WO (1) | WO2023277980A1 (https=) |
Cited By (1)
| Publication number | Priority date | Publication date | Assignee | Title |
|---|---|---|---|---|
| US20230089375A1 (en) * | 2020-04-30 | 2023-03-23 | The Board Of Regents Of The University Of Texas System | 3d image analysis platform for neurological conditions |
Families Citing this family (9)
| Publication number | Priority date | Publication date | Assignee | Title |
|---|---|---|---|---|
| AU2023257288A1 (en) * | 2022-04-22 | 2024-08-22 | NeuroGeneces Inc. | Sensing system with features for determining physiological metrics of a subject and for predicting electrophysiological events of a subject |
| CN117788897B (zh) * | 2023-12-20 | 2024-07-12 | 首都医科大学附属北京友谊医院 | 大脑年龄预测方法、装置、设备及存储介质 |
| WO2025188294A1 (en) * | 2024-03-05 | 2025-09-12 | National Yang Ming Chiao Tung University | Method of brain age prediction for bipolar disorder patients using multimodal mri and machine learning |
| WO2025191273A1 (en) * | 2024-03-14 | 2025-09-18 | Oxcitas Ltd | Method for processing images of a brain |
| WO2025207770A1 (en) * | 2024-03-26 | 2025-10-02 | Linus Health, Inc. | Machine-learning enabled clinical decision support system for cognitive and movement disorders |
| CN118749944B (zh) * | 2024-06-26 | 2026-02-10 | 首都医科大学附属北京友谊医院 | 认知状态检测方法、模型训练方法、装置、设备和介质 |
| CN118691906B (zh) * | 2024-07-18 | 2025-09-26 | 首都医科大学附属北京友谊医院 | 认知状态分类方法、装置、设备和存储介质 |
| CN119379626A (zh) * | 2024-10-11 | 2025-01-28 | 西安交通大学 | 一种脑龄预测方法、装置、设备及存储介质 |
| CN119601247B (zh) * | 2024-11-14 | 2026-01-02 | 中国人民解放军空军军医大学 | 一种2型糖尿病认知功能减退预测系统及方法 |
Citations (2)
| Publication number | Priority date | Publication date | Assignee | Title |
|---|---|---|---|---|
| US20170039708A1 (en) * | 2014-04-25 | 2017-02-09 | The Regents Of The University Of California | Quantitating disease progression from the mri images of multiple sclerosis patients |
| US11263749B1 (en) * | 2021-06-04 | 2022-03-01 | In-Med Prognostics Inc. | Predictive prognosis based on multimodal analysis |
Family Cites Families (17)
| Publication number | Priority date | Publication date | Assignee | Title |
|---|---|---|---|---|
| US6581048B1 (en) * | 1996-06-04 | 2003-06-17 | Paul J. Werbos | 3-brain architecture for an intelligent decision and control system |
| CA2570539A1 (en) * | 2004-06-18 | 2006-01-26 | Banner Health | Evaluation of a treatment to decrease the risk of a progressive brain disorder or to slow brain aging |
| US8626264B1 (en) * | 2008-04-09 | 2014-01-07 | James T. Beran | Obtaining information about brain activity |
| US20100249573A1 (en) * | 2009-03-30 | 2010-09-30 | Marks Donald H | Brain function decoding process and system |
| US8742754B2 (en) * | 2010-02-16 | 2014-06-03 | Board Of Regents Of The University Of Texas System | Method and system for diffusion tensor imaging |
| US20110301431A1 (en) * | 2010-06-05 | 2011-12-08 | The Board Of Trustees Of The Leland Stanford Junior University | Methods of classifying cognitive states and traits and applications thereof |
| WO2017190029A1 (en) * | 2016-04-29 | 2017-11-02 | Washington University | System and method for multi-modality quantification of neuroinflammation in central nervous system diseases |
| WO2018106713A1 (en) * | 2016-12-06 | 2018-06-14 | Darmiyan, Inc. | Methods and systems for identifying brain disorders |
| WO2019070745A1 (en) * | 2017-10-02 | 2019-04-11 | Blackthorn Therapeutics, Inc. | METHODS AND SYSTEMS FOR COMPUTER-GENERATED PREDICTIVE APPLICATION OF NEURO-IMAGING MAPPING DATA AND GENE EXPRESSION |
| US10365340B1 (en) * | 2018-03-01 | 2019-07-30 | Siemens Medical Solutions Usa, Inc. | Monitoring dynamics of patient brain state during neurosurgical procedures |
| US12232843B2 (en) * | 2018-03-07 | 2025-02-25 | Institut National De La Sante Et De La Recherche Medicale (Inserm) | Method for early prediction of neurodegenerative decline |
| CN112292691B (zh) * | 2018-06-18 | 2024-06-04 | 谷歌有限责任公司 | 用于使用深度学习提高癌症检测的方法与系统 |
| CN109147941A (zh) * | 2018-10-17 | 2019-01-04 | 上海交通大学 | 基于结构磁共振影像数据的大脑健壮性评估方法 |
| CN110689536B (zh) * | 2019-09-30 | 2023-07-18 | 深圳大学 | 基于多模态磁共振影像的大脑灰质及白质追踪方法及装置 |
| CN111631715B (zh) * | 2020-07-08 | 2023-03-14 | 上海海事大学 | 一种阿尔茨海默症早期认知功能下降预测方法 |
| US12354256B2 (en) * | 2020-10-19 | 2025-07-08 | Northwestern University | Brain feature prediction using geometric deep learning on graph representations of medical image data |
| CN112674720B (zh) * | 2020-12-24 | 2022-03-22 | 四川大学 | 基于3d卷积神经网络的阿尔茨海默症的预判断方法 |
-
2022
- 2022-03-25 CA CA3221182A patent/CA3221182A1/en active Pending
- 2022-03-25 WO PCT/US2022/021873 patent/WO2023277980A1/en not_active Ceased
- 2022-03-25 KR KR1020247002437A patent/KR102873399B1/ko active Active
- 2022-03-25 US US17/704,287 patent/US11589800B2/en active Active
- 2022-03-25 CN CN202510847802.4A patent/CN120732391A/zh active Pending
- 2022-03-25 JP JP2023581059A patent/JP2024524497A/ja active Pending
- 2022-03-25 CN CN202280038961.4A patent/CN118175954B/zh active Active
- 2022-03-25 EP EP22833843.0A patent/EP4362778A4/en active Pending
- 2022-03-25 AU AU2022304526A patent/AU2022304526B2/en active Active
- 2022-11-22 US US17/992,005 patent/US11751798B2/en active Active
Patent Citations (2)
| Publication number | Priority date | Publication date | Assignee | Title |
|---|---|---|---|---|
| US20170039708A1 (en) * | 2014-04-25 | 2017-02-09 | The Regents Of The University Of California | Quantitating disease progression from the mri images of multiple sclerosis patients |
| US11263749B1 (en) * | 2021-06-04 | 2022-03-01 | In-Med Prognostics Inc. | Predictive prognosis based on multimodal analysis |
Non-Patent Citations (80)
| Title |
|---|
| Akbaraly, T.N., Singh-Manoux, A., Dugravot, A., Brunner, E.J., Kivimaki, M., Sabia, S., 2019. Association of Midlife Diet With Subsequent Risk for Dementia JAMA 321, 957-968. |
| Andersson, J.L., S. Skare, and J. Ashbumer, How to correct susceptibility distortions in spin-echo echo-planar images: application to diffusion tensor imaging. Neuroimage, 2003. 20(2): p. 870-88. |
| Andersson, J.L.R. and S.N. Sotiropoulos, An integrated approach to correction for off-resonance effects and subject movement in diffusion MR imaging. Neuroimage, 2016.125: p. 1063-1078. |
| Andersson, J.L.R., et al., Incorporating outlier detection and replacement into a non-parametric framework for movement and distortion correction of diffusion MR images. Neuroimage, 2016. 141: p. 556-572. |
| Andersson, J.L.R., et al., Susceptibility-induced distortion that varies due to motion: Correction in diffusion MR without acquiring additional data. Neuroimage, 2018. 171: p. 277-295. |
| Andersson, J.L.R., et al., Towards a comprehensive framework for movement and distortion correction of diffusion MR images: Within volume movement. Neuroimage, 2017. 152: p. 450-466. |
| Ashbumer, J. and K.J. Friston, Diffeomorphic registration using geodesic shooting and Gauss-Newton optimisation. Neuroimage, 2011. 55(3): p. 954-67. |
| Ashbumer, J. and K.J. Friston, Unified segmentation. Neuroimage, 2005. 26(3): p. 839-51. |
| Ashbumer, J., A fast diffeomorphic image registration algorithm. Neuroimage, 2007. 38(1): p. 95-113. |
| Avants, B.B., et al., Symmetric diffeomorphic image registration with cross-correlation: evaluating automated labeling of elderly and neurodegenerative brain Med Image Anal, 2008. 12(1): p. 26-41. |
| Basser, P.J. and C. Pierpaoli, Microstructural and physiological features of tissues elucidated by quantitative-diffusion-tensor MRI. J Magn Reson B, 1996.111(3): p. 209-19. |
| Basser, P.J., et al., In vivo fiber fractography using DT-MRI data. Magn Reson Med, 2000. 44(4): p. 625-32. |
| Basser, P.J., J. Mattiello, and D. LeBihan, Estimation of the effective self-diffusion tensor from the NMR spin echo. J Magn Reson B, 1994. 103(3): p. 247-54. |
| Beg, M.F., et al., Computing Large Deformation Metric Mapping via Geodesic Flows of Diffeomorphisms. International Journal of Computer Vision, 2005. 61(2): p. 139-157. |
| Beg, M.F., Miller, M.L, Trouve, A., Younes, L., 2005. Computing Large Deformation Metric Mapping via Geodesic Flows of Diffeomorphisms. International Journal of Computer Vision 61, 139-157. |
| Beheshti, L, Maikusa, N., Matsuda, H., 2018. The association between "Brain-Age Score" (BAS) and traditional neuropsychological screening tools in Alzheimer's disease Brain Behav 8, e01020. |
| Bhushan, C., et al., Co-registration and distortion correction of diffusion and anatomical images based on inverse contrast normalization. Neuroimage, 2015. 115: p. 269-80. |
| Bhushan, C., et al., Correcting Susceptibility-Induced Distortion in Diffusion-Weighted MRI using Constrained Nonrigid Registration. Signal Inf Process Assoc Annu Summit Conf APSIPA Asia Pac, 2012. 2012. |
| Boegle, R., J. Maclaren, and M. Zaitsev, Combining prospective motion correction and distortion correction for EPI towards a comprehensive correction of motion and susceptibility-induced artifacts. MAGMA, 2010. 23(4): p. 263-73. |
| Boyle, R., Jollans, L., Rueda-Delgado, L.M., Rizzo, R., Yener, G.G., McMorrow, J.P., Knight, S.P., Carey, D., Robertson, I.H., Emek-Sava§, D.D., 2020. Brain-predicted age difference score is related to specific cognitive functions: A multi-site replication analysis. Brain Imaging and Behavior, 1-19. |
| Cations, M., Withall, A., Low, L.F., Draper, B., 2016. What is the role of modifiable environmental and lifestyle risk factors in young onset dementia? Eur J Epidemiol 31, 107-124. |
| Cole, J.H., 2020. Multimodality neuroimaging brain-age in UK biobank: relationship to biomedical, lifestyle, and cognitive factors Neurobiol Aging 92, 34-42. |
| Cole, J.H., Franke, K., 2017. Predicting Age Using Neuroimaging: Innovative Brain Ageing Biomarkers. Trends Neurosci 40, 681-690. |
| Cole, J.H., Ritchie, S.J., Bastin, M.E., Valdes Hernandez, M.C., Munoz Maniega, S., Royle, N., Corley, J., Pattie, A., Harris, S.E., Zhang, Q., Wray, N.R., Redmond, P., Marioni, R.E., Starr, J.M., Cox, S.R., Wardlaw, J.M., Sharp, D.J., Deary, I.J., 2018. Brain age predicts mortality. Mol Psychiatry 23, 1385-1392. |
| Daly, E., Zaitchik, D., Copeland, M., Schmahmann, J., Gunther, J., Albert, M., 2000. Predicting conversion to Alzheimer disease using standardized clinical information. Arch Neurol 57, 675-680. |
| Fayosse, A., Nguyen, D.P., Dugravot, A., Dumurgier, J., Tabak, A.G., Kivimaki, M., Sabia, S., Singh-Manoux, A., 2020. Risk prediction models for dementia: role of age and cardiometabolic risk factors. BMC Med 18, 107. |
| Glasser, M.F., et al., The minimal preprocessing pipelines for the Human Connectome Project. Neuroimage, 2013. 80 p. 105-24. |
| Gonzalez, R.C. and W. R.E., Digital image processing. 2001: Prentice Hall. |
| Hatton, S.N., Franz, C.E., Elman, J.A., Panizzon, M.S., Hagler, D.J., Jr., Fennema-Notestine, C., Eyler, L.T., McEvoy, L.K., Lyons, M.J., Dale, A.M., Kremen, W.S., 2018. Negative fateful life events in midlife and advanced predicted brain aging. Neurobiol Aging 67, 1-9. |
| Hedouin, R., et al., Block-Matching Distortion Correction of Echo-Planar Images With Opposite Phase Encoding Directions. IEEE Trans Med Imaging, 2017. 36(5): p. 1106-1115. |
| Hsu, Y.-C. and W.-Yi Tseng. An Efficient Regularization Method for Diffusion MAP-MRI Estimation, in Proc. Intl. Soc. Mag. Reson. Med. 2018. Paris, France. |
| Hsu, Y.C., et al., NTU-DSI-122: A diffusion spectrum imaging template with high anatomical matching to the ICBM-152 space. Hum Brain Mapp, 2015. 36(9): p. 3528-41. |
| Hsu, Y.C., Hsu, C.H., Tseng, W.Y., 2012. A large deformation diffeomorphic metric mapping solution for diffusion spectrum imaging datasets. Neuroimage 63, 818-834. |
| Hsu, Y.C., Lo, Y.C., Chen, Y.J., Wedeen, V.J., Isaac Tseng, W.Y., 2015. NTU-DSI-122: A diffusion spectrum imaging template with high anatomical matching to the ICBM-152 space. Hum Brain Mapp 36, 3528-3541. |
| Huang, H., et al., Correction of BO susceptibility induced distortion in diffusion-weighted images using large-deformation diffeomorphic metric mapping. Magn Reson Imaging, 2008. 26(9): p. 1294-302. |
| Hughes, C.P., Berg, L., Danziger, W., Coben, L.A., Martin, R.L., 1982. A new clinical scale for the staging of dementia. The British journal of psychiatry 140, 566572. |
| Hutton, C., et al., Image distortion correction in fMRI: A quantitative evaluation Neuroimage, 2002.16(1): p. 217-40. |
| In, M.H. and O. Speck, Highly accelerated PSF-mapping for EPI distortion correction with improved fidelity. MAGMA, 2012 25(3): p. 183-92. |
| Irfanoglu, M.O., et al., DR-BUDDI (Diffeomorphic Registration for Blip-Up blip-Down Diffusion Imaging) method for correcting echo planar imaging distortions. Neuroimage, 2015. 106: p. 284-99. |
| Jezzard, P., A.S. Barnett, and C. Pierpaoli, Characterization of and correction for eddy current artifacts in echo planar diffusion imaging. Magn Reson Med, 1998. 39(5): p. 801-12. |
| Jones, D.K. and M. Cercignani, Twenty-five pitfalls in the analysis of diffusion MRI data. NMR Biomed, 2010. 23(7): p. 803-20. |
| Kang, Li ("Identifying Early Mild Cognitive Impairment by Multi-Modality MRI-Based Deep Learning") Frontiers in Aging Neuroscience. 2020. (Year: 2020). * |
| Kazui, H., Yoshiyama, K., Kanemoto, H., Suzuki, Y., Sato, S., Hashimoto, M., Ikeda, M., Tanaka, H., Hatada, Y., Matsushita, M., 2016. Differences of behavioral and psychological symptoms of dementia in disease severity in four major dementias. PLoS One 11, e0161092. |
| Kim, J.W., Byun, M.S., Sohn, B.K., Yi, D., Seo, E.H., Choe, Y.M., Kim, S.G., Choi, H.J., Lee, J.H., Chee, I S., Woo, J.L, Lee, D.Y., 2017. Clinical Dementia Rating Orientation Score as an Excellent Predictor of the Progression to Alzheimer's Disease in Mild Cognitive Impairment. Psychiatry Investig 14, 420-426. |
| Kivipelto, M., Ngandu, T., Laatikainen, T., Winblad, B., Soininen, H., Tuomilehto, J., 2006. Risk score for the prediction of dementia risk in 20 years among middle aged people: a longitudinal, population-based study. The Lancet Neurology 5, 735-741. |
| Koay, C.G., Chang, L.C., Pierpaoli, C., Basser, P.J., 2007. Error propagation framework for diffusion tensor imaging via diffusion tensor representations. IEEE Trans Med Imaging 26, 1017-1034. |
| Koay, C.G., et al., A unifying theoretical and algorithmic framework for least squares methods of estimation in diffusion tensor imaging. J Magn Reson, 2006. 182(1): p. 115-25. |
| Kolbeinsson, A., Filippi, S., Panagakis, Y., Matthews, P.M., Elliott, P., Dehghan, A., Tzoulaki, I., 2020. Accelerated MRI-predicted brain ageing and its associations with cardiometabolic and brain disorders. Sci Rep 10, 19940. |
| LaMontagne, P.J., Benzinger, T.L., Morris, J.C., Keefe, S., Hornbeck, R., Xiong, C., Grant, E., Hassenstab, J., Moulder, K., Vlassenko, A.G., Raichle, M.E., Cruchaga, C., Marcus, D., 2019. OASIS-3: Longitudinal Neuroimaging, Clinical, and Cognitive Dataset for Normal Aging and Alzheimer Disease. medRxiv, 2019.2012.2013.19014902. |
| LaMontagne, P.J., et al., OASIS-3: Longitudinal Neuroimaging, Clinical, and Cognitive Dataset for Normal Aging and Alzheimer Disease medRxiv, 2019. |
| Lee, D.Y., Youn, J.C., Choo, I.H., Kim, K.W., Jhoo, J.H., Pak, Y.S., Suh, K.W., Woo, J.I., 2006. Combination of clinical and neuropsychologic information as a better predictor of the progression to Alzheimer disease in questionable dementia individuals. Am J Geriatr Psychiatry 14, 130-138. |
| Liem, F., Varoquaux, G , Kynast, J., Beyer, F , Kharabian Masouleh, S., Huntenburg, J M., Lampe, L., Rahim, M., Abraham, A., Craddock, R.C., Riedel-Heller, S., Luck, T., Loeffler, M., Schroeter, M.L., Witte, A.V., Villringer, A., Margulies, D.S., 2017. Predicting brain-age from multimodal imaging data captures cognitive impairment. Neuroimage 148, 179-188. |
| Lim, W.S., Chong, M.S., Sahadevan, S., 2007. Utility of the clinical dementia rating in Asian populations. Clinical medicine & research 5, 61-70. |
| Maillard, P., Fletcher, E., Singh, B., Martinez, O., Johnson, D.K., Olichney, J.M., Farias, S.T., DeCarli, C., 2019. Cerebral white matter free water: A sensitive biomarker of cognition and function. Neurology 92, e2221-e2231. |
| McVeigh, E.R., M.J. Bronskill, and R.M. Henkelman, Phase and sensitivity of receiver coils in magnetic resonance imaging. Med Phys, 1986. 13(6): p. 806-14. |
| Miller, A., A. Trouve, and L. Younes, Geodesic Shooting for Computational Anatomy. Journal of Mathematical Imaging and Vision, 2006 24: p. 209-228. |
| Miller, A., Trouve, A., Younes, L., 2006. Geodesic Shooting for Computational Anatomy. Journal of Mathematical Imaging and Vision 24, 209-228. |
| Morris, J.C., 1993. The Clinical Dementia Rating (CDR): current version and scoring rules. Neurology 43, 2412-2414. |
| Mukadam, N., Sommerlad, A., Huntley, J., Livingston, G., 2019. Population attributable fractions for risk factors for dementia in low-income and middle-income countries: an analysis using cross-sectional survey data. The Lancet Global Health 7, e596-e603. |
| Ning, K., Zhao, L., Matloff, W., Sun, F., Toga, A.W., 2020. Association of relative brain age with tobacco smoking, alcohol consumption, and genetic variants. Sci Rep 10, 10. |
| O'Bryant, S.E., Waring, S.C., Cullum, C.M., Hall, J., Lacritz, L., Massman, P.J., Lupo, P.J., Reisch, J.S., Doody, R., 2008. Staging dementia using Clinical Dementia Rating Scale Sum of Boxes scores: a Texas Alzheimer's research consortium study. Arch Neurol 65, 1091-1095. |
| Oh, S.H., et al., Distortion correction in EPI at ultra-high-field MRI using PSF mapping with optimal combination of shift detection dimension. Magn Reson Med, 2012. 68(4): p. 1239-46. |
| Ozarslan, E., et al., Mean apparent propagator (MAP) MRI: a novel diffusion imaging method for mapping tissue microstructure. Neuroimage, 2013 78: p. 16-32. |
| Pasternak, O., Sochen, N., Gur, Y., Intrator, N., Assaf, Y., 2009. Free water elimination and mapping from diffusion MRI. Magn Reson Med 62, 717-730. |
| Petersen, R.C., Lopez, O., Armstrong, M.J , Getchius, T.S.D., Ganguli, M., Gloss, D., Gronseth, G.S., Marson, D., Pringsheim, T., Day, G.S., Sager, M., Stevens, J., Rae-Grant, A., 2018. Practice guideline update summary: Mild cognitive impairment: Report of the Guideline Development, Dissemination, and Implementation Subcommittee of the American Academy of Neurology. Neurology 90, 126-135. |
| Power, J.D., et al., Methods to detect, characterize, and remove motion artifact in resting state fMRI. Neuroimage, 2014 84: p. 320-41. |
| Press, W.H. and S. Numerical Recipes, Numerical recipes: the art of scientific computing. 2007, Cambridge University Press: [Cambridge]. |
| Reese, T.G., et al., Reduction of eddy-current-induced distortion in diffusion MRI using a twice-refocused spin echo. Magn Reson Med, 2003.49(1): p. 177-82. |
| Richard, G., Kolskar, K., Sanders, A.M., Kaufmann, T., Petersen, A., Doan, N.T., Monereo Sanchez, J., Alnaes, D., Ulrichsen, K.M., Dorum, E.S., Andreassen, O.A., Nordvik, J.E., Westlye, L.T., 2018. Assessing distinct patterns of cognitive aging using tissue-specific brain age prediction based on diffusion tensor imaging and brain morphometry. PeerJ 6, e5908. |
| Ronan, L., Alexander-Bloch, A.F., Wagstyl, K., Farooqi, S., Brayne, C., Tyler, L.K., Cam, C.A.N., Fletcher, P.C., 2016. Obesity associated with increased brain age from midlife Neurobiol Aging 47, 63-70. |
| Sabuncu, Mert R. ("Clinical Prediction from Structural Brain MRI Scans: A Large-Scale Empirical Study") Neuroinformatics. 2014 (Year: 2014). * |
| Sled, J.G., A.P. Zijdenbos, and A.C. Evans, A nonparametric method for automatic correction of intensity nonuniformity in MRI data. IEEE Trans Med Imaging, 1998.17(1): p. 87-97. |
| Sotiropoulos, S.N., et al., Advances in diffusion MRI acquisition and processing in the Human Connectome Project. Neuroimage, 2013. 80: p. 125-43. |
| Steffener, J., Habeck, C., O'Shea, D., Razlighi, Q., Bherer, L., Stern, Y., 2016. Differences between chronological and brain age are related to education and self reported physical activity. Neurobiol Aging 40, 138-144. |
| Studholme, C., D.L.G. Hill, and D.J. Hawkes, An overlap invariant entropy measure of 3D medical image alignment. Pattern Recognition, 1999 32(1): p. 71-86. |
| Van Essen, D.C., et al., The Human Connectome Project: a data acquisition perspective. Neuroimage, 2012. 62(4): p. 2222-31. |
| WHO, W.H.O., 2019. Risk reduction of cognitive decline and dementia: WHO guidelines. |
| Wicks, D.A., G.J. Barker, and P.S. Tofts, Correction of intensity nonuniformity in MR images of any orientation. Magn Reson Imaging, 1993. 11(2): p. 183-96. |
| Yeh, F.C., et al., Deterministic diffusion fiber tracking improved by quantitative anisotropy. PLoS One, 2013. 8(11): p. e80713. |
| Younes, L., Shapesand Diffeomorphisms. 2019. |
Cited By (2)
| Publication number | Priority date | Publication date | Assignee | Title |
|---|---|---|---|---|
| US20230089375A1 (en) * | 2020-04-30 | 2023-03-23 | The Board Of Regents Of The University Of Texas System | 3d image analysis platform for neurological conditions |
| US12471853B2 (en) * | 2020-04-30 | 2025-11-18 | The Board Of Regents Of The University Of Texas System | 3D image analysis platform for neurological conditions |
Also Published As
| Publication number | Publication date |
|---|---|
| CA3221182A1 (en) | 2023-01-05 |
| US20230000424A1 (en) | 2023-01-05 |
| CN120732391A (zh) | 2025-10-03 |
| CN118175954B (zh) | 2025-06-03 |
| CN118175954A (zh) | 2024-06-11 |
| WO2023277980A9 (en) | 2023-08-17 |
| US20230086483A1 (en) | 2023-03-23 |
| AU2022304526A1 (en) | 2023-12-07 |
| US11751798B2 (en) | 2023-09-12 |
| JP2024524497A (ja) | 2024-07-05 |
| EP4362778A4 (en) | 2025-01-08 |
| WO2023277980A1 (en) | 2023-01-05 |
| EP4362778A1 (en) | 2024-05-08 |
| KR102873399B1 (ko) | 2025-10-17 |
| AU2022304526B2 (en) | 2025-04-17 |
| KR20240027714A (ko) | 2024-03-04 |
Similar Documents
| Publication | Publication Date | Title |
|---|---|---|
| US11589800B2 (en) | Method of evaluating concomitant clinical dementia rating and its future outcome using predicted age difference and program thereof | |
| Cohen-Adad et al. | Open-access quantitative MRI data of the spinal cord and reproducibility across participants, sites and manufacturers | |
| De Vis et al. | Arterial‐spin‐labeling (ASL) perfusion MRI predicts cognitive function in elderly individuals: a 4‐year longitudinal study | |
| Miller et al. | Multimodal population brain imaging in the UK Biobank prospective epidemiological study | |
| Gullett et al. | The association of white matter free water with cognition in older adults | |
| Nguyen et al. | Brain structure ages—a new biomarker for multi‐disease classification | |
| Melloni et al. | Effects of illness duration on cognitive performances in bipolar depression are mediated by white matter microstructure | |
| US12133739B2 (en) | Use of brain age model in prediction of brain atrophy | |
| Chen et al. | Validation of neuroimaging-based brain age gap as a mediator between modifiable risk factors and cognition | |
| Yu et al. | The individualized prediction of cognitive test scores in mild cognitive impairment using structural and functional connectivity features | |
| Knopman et al. | Evolution of neurodegeneration-imaging biomarkers from clinically normal to dementia in the Alzheimer disease spectrum | |
| Kai et al. | Aberrant frontal lobe “U”-shaped association fibers in first-episode schizophrenia: A 7-Tesla Diffusion Imaging Study | |
| US20250017516A1 (en) | Method for evaluation of chemotherapy effects on cognitive function of cancer patients using brain age model | |
| Gandia‑Ferrero et al. | Relationship between neuroimaging and emotion recognition in mild cognitive impairment patients | |
| McNulty et al. | Visualisation of the medial longitudinal fasciculus using fibre tractography in multiple sclerosis patients with internuclear ophthalmoplegia | |
| CN118039129A (zh) | 一种基于局部脑影像特征的脑肿瘤幸存者辅助诊断方法及系统 | |
| Yao et al. | Associations Between Glymphatic Dysfunction, White Matter Injury, and Cognitive Decline in Parkinson’s Disease | |
| Pishghadam et al. | Single vs. multi-slice assessments of in vivo placental T2∗ measurements | |
| US20260041368A1 (en) | Method for evaluation of ischemic stroke effects on cognitive function of patients using brain age model | |
| Gao et al. | Geodesic shape regression based deep learning segmentation for assessing longitudinal hippocampal atrophy in dementia progression | |
| Hojjati et al. | Tau Progression Index (TPI): An individualized, clinically applicable, multimodally-derived score to predict AD progression | |
| Hedouin et al. | Microstructural brain assessment in late-life depression and apathy using diffusion MRI multi-compartments models associated with tractometry | |
| Shahrampour | Multiparametric MRI of the Pediatric Spinal Cord: Application, Development, and Quantitative Measurements of Normal and Pediatric Subjects With Spinal Cord Injury | |
| Mohamed et al. | The ASPIRE Research Institute Dataset: Building a Foundation for Brain Health Research in the United Arab Emirates | |
| Lawrence | Imaging biomarkers in the hyper-acute phase following traumatic brain injury |
Legal Events
| Date | Code | Title | Description |
|---|---|---|---|
| AS | Assignment |
Owner name: ACROVIZ USA INC., CALIFORNIA Free format text: ASSIGNMENT OF ASSIGNORS INTEREST;ASSIGNORS:TSENG, WEN-YIH;HSU, YUNG-CHIN;REEL/FRAME:059400/0273 Effective date: 20220319 |
|
| FEPP | Fee payment procedure |
Free format text: ENTITY STATUS SET TO UNDISCOUNTED (ORIGINAL EVENT CODE: BIG.); ENTITY STATUS OF PATENT OWNER: SMALL ENTITY |
|
| FEPP | Fee payment procedure |
Free format text: ENTITY STATUS SET TO SMALL (ORIGINAL EVENT CODE: SMAL); ENTITY STATUS OF PATENT OWNER: SMALL ENTITY |
|
| STCF | Information on status: patent grant |
Free format text: PATENTED CASE |