US11486694B2 - Chromatic range sensor system for measuring workpiece thickness - Google Patents
Chromatic range sensor system for measuring workpiece thickness Download PDFInfo
- Publication number
- US11486694B2 US11486694B2 US17/126,191 US202017126191A US11486694B2 US 11486694 B2 US11486694 B2 US 11486694B2 US 202017126191 A US202017126191 A US 202017126191A US 11486694 B2 US11486694 B2 US 11486694B2
- Authority
- US
- United States
- Prior art keywords
- workpiece
- measurement
- crs
- spectral profile
- distance
- Prior art date
- Legal status (The legal status is an assumption and is not a legal conclusion. Google has not performed a legal analysis and makes no representation as to the accuracy of the status listed.)
- Active, expires
Links
Images


Classifications
-
- G—PHYSICS
- G01—MEASURING; TESTING
- G01B—MEASURING LENGTH, THICKNESS OR SIMILAR LINEAR DIMENSIONS; MEASURING ANGLES; MEASURING AREAS; MEASURING IRREGULARITIES OF SURFACES OR CONTOURS
- G01B11/00—Measuring arrangements characterised by the use of optical techniques
- G01B11/02—Measuring arrangements characterised by the use of optical techniques for measuring length, width or thickness
- G01B11/06—Measuring arrangements characterised by the use of optical techniques for measuring length, width or thickness for measuring thickness ; e.g. of sheet material
- G01B11/0608—Height gauges
-
- G—PHYSICS
- G01—MEASURING; TESTING
- G01B—MEASURING LENGTH, THICKNESS OR SIMILAR LINEAR DIMENSIONS; MEASURING ANGLES; MEASURING AREAS; MEASURING IRREGULARITIES OF SURFACES OR CONTOURS
- G01B11/00—Measuring arrangements characterised by the use of optical techniques
- G01B11/02—Measuring arrangements characterised by the use of optical techniques for measuring length, width or thickness
- G01B11/06—Measuring arrangements characterised by the use of optical techniques for measuring length, width or thickness for measuring thickness ; e.g. of sheet material
-
- G—PHYSICS
- G02—OPTICS
- G02B—OPTICAL ELEMENTS, SYSTEMS OR APPARATUS
- G02B21/00—Microscopes
- G02B21/0004—Microscopes specially adapted for specific applications
- G02B21/002—Scanning microscopes
- G02B21/0024—Confocal scanning microscopes (CSOMs) or confocal "macroscopes"; Accessories which are not restricted to use with CSOMs, e.g. sample holders
- G02B21/0052—Optical details of the image generation
- G02B21/0064—Optical details of the image generation multi-spectral or wavelength-selective arrangements, e.g. wavelength fan-out, chromatic profiling
-
- G—PHYSICS
- G01—MEASURING; TESTING
- G01B—MEASURING LENGTH, THICKNESS OR SIMILAR LINEAR DIMENSIONS; MEASURING ANGLES; MEASURING AREAS; MEASURING IRREGULARITIES OF SURFACES OR CONTOURS
- G01B2210/00—Aspects not specifically covered by any group under G01B, e.g. of wheel alignment, caliper-like sensors
- G01B2210/50—Using chromatic effects to achieve wavelength-dependent depth resolution
Definitions
- the invention relates to precision measurement instruments, and more particularly to chromatic range sensors and similar optical distance determining devices, and their use.
- an optical element having axial chromatic aberration also referred to as axial or longitudinal chromatic dispersion
- axial or longitudinal chromatic dispersion may be used to focus a broadband light source such that the axial distance to the focus varies with the wavelength.
- a broadband light source such that the axial distance to the focus varies with the wavelength.
- the surface height or distance relative to the focusing element determines which wavelength is best focused.
- the light is refocused onto a small detector aperture, such as a pinhole or the end of an optical fiber.
- the signal level will be greatest for the wavelength corresponding to the surface height or distance to the surface.
- a spectrometer-type detector measures the signal level for each wavelength, in order to determine the surface height.
- CRS chromatic range sensing
- CPS chromatic point sensors
- chromatic line sensors or the like.
- a compact chromatically-dispersive optical assembly used with such systems is referred to as an “optical pen,” or a “pen.”
- the optical pen is connected through an optical fiber to an electronic portion of the chromatic range sensor.
- the electronic portion includes a light source that transmits light through the fiber to be output from the optical pen, and also provides a spectrometer that detects and analyzes the returned light.
- the returned light forms a wavelength-dispersed intensity profile received by the spectrometer's detector array.
- Pixel data corresponding to the wavelength-dispersed intensity profile is analyzed to determine the “dominant wavelength position coordinate” as indicated by a peak or centroid of the intensity profile, and the resulting pixel coordinate of the peak and/or centroid is used with a lookup table to determine the distance to the surface.
- This pixel coordinate may be determined with sub-pixel resolution, and may be referred to as the “distance-indicating coordinate” or “distance indicating pixel coordinate.”
- CRS line sensor
- Prior art CRS systems have exhibited certain issues (e.g., measurement errors, etc.) in relation to thickness measurements, which have typically involved determining measurement distances to two opposing surfaces of a workpiece and determining a difference between the two measurement distances. For example, when measuring a thickness of a transparent workpiece, like glass (e.g., fused silica), the CRS illumination will reflect from both the top surface and the bottom surface of the glass, resulting in two corresponding wavelength peaks. Certain measurement errors arise from difficulties associated with isolating the two peaks of the intensity profile indicative of the two respective measurement distances, for which the two peaks tend to merge together for thin workpieces.
- certain issues arise from difficulties associated with isolating the two peaks of the intensity profile indicative of the two respective measurement distances, for which the two peaks tend to merge together for thin workpieces.
- the widths of the two peaks may be such that the peaks at least partially overlap/merge due to an insufficient separation between the two peaks (e.g., as illustrated, for example, in the dotted-line measurement profile signals 510 a of FIG. 5A , and in FIGS. 10A, 10B, 10D, 10E and 10G , as will be described in more detail below).
- FIGS. 10A-10G seven corresponding intensity profiles are illustrated, each including two measurement peaks (e.g., merging to a single peak in FIG. 10A ) which are indicative of measurement distances to top and bottom surfaces of workpieces having varying thicknesses.
- FIGS. 10A and 10D correspond to a workpiece with a thickness of 25 ⁇ m
- FIGS. 10B and 10E correspond to a workpiece with a thickness of 50 ⁇ m
- FIGS. 10C and 10F correspond to a workpiece with a thickness of 100 ⁇ m.
- 10A-10G comprise intensity or “signal level” (vertical axis) as a function of pixel coordinates or “pixel positions” (horizontal axis) of a CRS wavelength detector, wherein the pixel positions correspond to wavelengths measured by the CRS wavelength detector and the CRS system is calibrated to convert the wavelength peaks to CRS measurement distances.
- a thickness of a workpiece may be determined in accordance with a difference between the measurement distances to the two workpiece surfaces.
- the merging of two peaks may become more severe in the blue part (i.e., blue light wavelengths part) of the Z range of the CRS system, which is closer to the optics of an optical pen of the CRS system along the distance measurement optical axis (Z axis), than in the red part (i.e., red light wavelengths part) of the Z range, as illustrated in the examples of FIGS. 10D-10F .
- one possible technique to provide some amount of improvement in relation to the merging issue is to place a workpiece to be measured in the red part of the Z range of the CRS system (i.e., at a sufficient distance from the optical pen). Also, as best shown in FIG.
- another technique to provide some amount of improvement in relation to the wavelength peaks merging issue is to set a higher signal level threshold (e.g., Threshold B) to thereby isolate and detect two peaks, as opposed to a lower signal level threshold (e.g., Threshold A) which does not isolate the two peaks and thus can detect only one (merged) peak.
- Threshold B a higher signal level threshold
- Threshold A a lower signal level threshold
- Certain related concepts will also be described in more detail below with respect to FIG. 5A .
- Such techniques have certain limitations (e.g., it is not always easy to place a particular workpiece in the red part of the Z range of the CRS system, more signal levels become undetectable when a detection threshold is set too high, etc.).
- One aspect of the invention is to achieve more accurate thickness measurements (e.g., for smaller thicknesses where wavelength peak merging may be present, and over an increased range of possible distances between the optical pen and the workpiece, etc.).
- a chromatic range sensor (CRS) system configured to determine a workpiece thickness.
- the CRS system includes:
- an optical pen comprising a confocal optical path including an optics portion providing axial chromatic dispersion and configured to focus different wavelengths at different distances proximate to a workpiece;
- an illumination source configured to generate multi-wavelength input light comprising an input spectral profile that is input to the optical pen
- a CRS wavelength detector comprising a plurality of pixels with respective pixel positions distributed along a measurement axis of the CRS wavelength detector, wherein the CRS system is configured such that, when the optical pen is operably positioned relative to the workpiece to perform measurement operations, the optical pen inputs the input spectral profile and outputs corresponding radiation to first and second workpiece surfaces of the workpiece and receives reflected radiation from the first and second workpiece surfaces and outputs the reflected radiation to the CRS wavelength detector which provides output spectral profile data;
- a processing portion configured to process the output spectral profile data to determine a thickness of the workpiece which corresponds to a spacing between the first and second workpiece surfaces of the workpiece, wherein the processing to determine the thickness comprises utilization of transform processing.
- the transform processing comprises at least one of Fourier transform processing or Fourier-related transform processing.
- the utilization of the transform processing includes: determining a transform of the output spectral profile data; and determining the thickness of the workpiece based at least in part on a first characteristic of the transform of the output spectral profile data.
- the first characteristic corresponds to a first dip of the transform of the output spectral profile data.
- the output spectral profile data comprises distance-dependent profile components having first and second wavelength peaks that correspond to the first and second workpiece surfaces, respectively, and the determining of the thickness of the workpiece is not dependent on processing the output spectral profile data to determine corresponding first and second measurement distances to the first and second workpiece surfaces.
- the first and second wavelength peaks visually appear as a single peak in a representation of the output spectral profile data that is provided by the CRS wavelength detector.
- the utilization of the transform processing enables the processing portion to accurately determine the thickness of the workpiece with less than 10 percent error.
- the processing portion is further configured to process the output spectral profile data to determine a measurement distance to the workpiece.
- the processing to determine the measurement distance to the workpiece comprises processing the output spectral profile data to determine a centroid that is indicative of the measurement distance to the workpiece, while the processing to determine the thickness of the workpiece is not dependent on a determination of the centroid.
- the determined measurement distance is to a point inside the workpiece that is between the first and second workpiece surfaces.
- the determined measurement distance is determined according to a distance indicating coordinate that corresponds to an average of first and second wavelength peaks that correspond to the respective first and second workpiece surfaces.
- the processing portion is further configured to utilize the determined measurement distance and the determined thickness of the workpiece to determine at least one of the first measurement distance to the first workpiece surface or the second measurement distance to the second workpiece surface.
- the utilization of the transform processing comprises:
- determining the thickness of the workpiece based at least in part on a difference between the respective measurement distances to the first and second workpiece surfaces.
- the CRS system is operable in a plurality of modes including a thickness measurement mode, for which the processing portion performs the processing to determine the thickness as part of the thickness measurement mode.
- the plurality of modes further include a distance measurement mode for measuring a distance to a workpiece; the CRS system is configured such that, during the distance measurement mode, when the optical pen is operably positioned relative to the workpiece to perform measurement operations, the optical pen inputs the input spectral profile and outputs corresponding radiation to the workpiece and receives reflected radiation from the workpiece and outputs the reflected radiation to the CRS wavelength detector which provides the output spectral profile data; and the output spectral profile comprises a distance-dependent profile component having a wavelength peak that indicates a measurement distance to the workpiece.
- the thickness measurement mode is only operable to determine thicknesses as corresponding to spacings between first and second workpiece surfaces and is not operable to determine spacings between three or more workpiece surfaces.
- the CRS system is at least one of a chromatic point sensor system or a chromatic line sensor system.
- a method for operating a chromatic range sensor (CRS) system to determine a workpiece thickness.
- the CRS system includes: an optical pen comprising a confocal optical path including an optics portion providing axial chromatic dispersion and configured to focus different wavelengths at different distances proximate to a workpiece; an illumination source configured to generate multi-wavelength input light comprising an input spectral profile that is input to the optical pen; and a CRS wavelength detector comprising a plurality of pixels with respective pixel positions distributed along a measurement axis of the CRS wavelength detector, the plurality of pixels receiving respective wavelengths and providing output spectral profile data.
- the method includes:
- the measurement operations including the optical pen inputting the input spectral profile and outputting corresponding radiation to first and second workpiece surfaces of the workpiece and receiving reflected radiation from the first and second workpiece surfaces and outputting the reflected radiation to the CRS wavelength detector which provides the output spectral profile data, and
- a method for operating a chromatic range sensor (CRS) system includes: an optical pen comprising a confocal optical path including an optics portion providing axial chromatic dispersion and configured to focus different wavelengths at different distances proximate to a workpiece; an illumination source configured to generate multi-wavelength input light comprising an input spectral profile that is input to the optical pen; and a CRS wavelength detector comprising a plurality of pixels with respective pixel positions distributed along a measurement axis of the CRS wavelength detector, the plurality of pixels receiving respective wavelengths and providing output spectral profile data.
- the method includes:
- the CRS system operating the CRS system with the optical pen operably positioned relative to the workpiece to perform measurement operations, the measurement operations including the optical pen inputting the input spectral profile and outputting corresponding radiation to first and second workpiece surfaces of the workpiece and receiving reflected radiation from the first and second workpiece surfaces and outputting the reflected radiation to the CRS wavelength detector which provides the output spectral profile data;
- processing the output spectral profile data to determine a measurement distance to the workpiece includes determining a distance indicating coordinate corresponding to a pixel position of the CRS wavelength detector that indicates the measurement distance;
- processing the output spectral profile data to determine a thickness of the workpiece which corresponds to a spacing between the first and second workpiece surfaces of the workpiece, wherein the processing to determine the thickness is not dependent on a determined measurement distance to the workpiece.
- FIG. 1 is a block diagram of one embodiment of an exemplary CRS system.
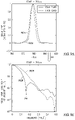
- FIG. 2 is a diagram of a system noise (bias) profile from a CRS system illustrating wavelength-dependent voltage offset signal levels for the pixels in a detector array when no measurement surface is present.
- FIG. 3 is a diagram of an intensity profile from a CRS system illustrating a valid wavelength peak produced by a wavelength reflected by a top surface of a workpiece (e.g., a non-transparent workpiece), wherein the pixel position of the peak corresponds to a measurement distance to the top surface.
- a workpiece e.g., a non-transparent workpiece
- FIG. 4A is a diagram of CRS distance calibration data, which correlates distance-indicating pixel coordinates with known measurement distances to a measured workpiece surface.
- FIG. 4B is an example CRS distance calibration lookup table, which references distance-indicating coordinates (DIC) to corresponding measurement distances of a CRS system.
- DIC distance-indicating coordinates
- FIG. 5A is a diagram of an intensity profile from a CRS system illustrating two valid wavelength peaks produced by wavelengths reflected by top and bottom surfaces of a transparent workpiece, wherein the pixel positions of the peaks correspond to measurement distances to the surfaces.
- FIG. 5B is a diagram illustrating measurement distances to top and bottom surfaces of a transparent workpiece, including actual and apparent measurement distances to the bottom surface.
- FIG. 6 is a flow diagram illustrating a method of operating a CRS system to determine a workpiece thickness.
- FIGS. 7A-7D illustrate a process for workpiece thickness measurement using transform processing.
- FIG. 8 illustrates a workpiece thickness measurement process using Fast Fourier Transform (FFT) processing as part of a deconvolution method.
- FFT Fast Fourier Transform
- FIGS. 9A-9H illustrate examples for which, regardless of the position of the workpiece within the operable measurement range relative to the optical pen, the FFT processing method of FIG. 8 determines a location of a first dip in the Fourier transform of the signal that can be used to determine the thickness of the workpiece.
- FIGS. 10A-10G are graphs depicting intensity profiles of workpieces having varying thicknesses (e.g., 25 ⁇ m, 50 ⁇ m, and 100 ⁇ m) measured by a CRS system, illustrating varying degrees of two wavelength peaks merging together depending on the thickness of a the workpiece and the distance from the optical pen.
- thicknesses e.g. 25 ⁇ m, 50 ⁇ m, and 100 ⁇ m
- FIG. 1 is a block diagram of one exemplary embodiment of a chromatic range sensor (CRS) system 100 , including an optical element 120 (e.g., an optical pen), an electronics portion 160 , and a user interface portion 171 .
- the embodiment of the electronics portion 160 includes a signal processor 166 , a memory portion 168 and a source and detector subsystem 161 comprising a wavelength detector 162 and a broadband light source 164 .
- the CRS system 100 shown in FIG. 1 is a chromatic point sensor (CPS) system which measures a single measurement point at a time, although it will be appreciated that in other implementations other sensor systems (e.g., a chromatic line sensor, etc.) may be utilized.
- CPS chromatic point sensor
- the wavelength detector 162 includes a detector array 163 of a spectrometer.
- the detector array 163 may comprise a plurality of pixels distributed along a measurement axis of the wavelength detector 162 , wherein the respective pixels receive respective wavelength signals and provide corresponding output spectral profile data.
- the electronics portion 160 is coupled to the optical element 120 through an optical path including a fiber optic cable 112 .
- a fiber optic cable 112 Optional or alternative aspects of the optical path are shown, including the fiber optic cable 112 having first and second segments 112 A and 112 B joined at a connector CONNECT-D in the fiber optic segment 112 B, and a coupler COUPLER-O which joins the segment 112 B to a segment 112 C which is coupled to the electronics portion 160 .
- the light source 164 which is controlled by the signal processor 166 , is connected to input multi-wavelength light comprising an input spectral profile to the optical element 120 through a path including the illumination fiber segment 165 I, the 2 ⁇ 1 coupler COUPLER-E, CONNECT-E, and the fiber optic cable 112 .
- the optical element 120 includes an in/out fiber optic sub-assembly 105 , a housing 130 , and an optics portion 150 .
- the in/out fiber optic sub-assembly 105 comprises an in/out optical fiber 113 carried through the fiber optic cable 112 , and a fiber optic connector 108 .
- the in/out optical fiber 113 outputs an output beam through an aperture 195 , and receives reflected measurement signal light through the aperture 195 .
- the optics portion 150 which includes a lens that provides an axial chromatic dispersion such that the focal point along the optical axis OA is at different distances depending on the wavelength of the light, as is known for CRS systems.
- the light is focused proximate to a workpiece 170 which has first and second workpiece surfaces 190 - 1 and 190 - 2 (i.e., top and bottom workpiece surfaces).
- the workpiece 170 may be transparent or otherwise include material such that the bottom surface 190 - 2 may be at least partially visible through the top surface 190 - 1 (i.e., some of the light from the optical element 120 is able to pass through the top surface 190 - 1 to reach the bottom surface 190 - 2 ).
- the workpiece 170 is non-transparent or otherwise has characteristics such that only the top surface 190 - 1 reflects light to the CRS system 100 .
- the light is focused by the optics portion 150 on the top surface 190 - 1 (i.e., as opposed to light also being focused on the bottom surface 190 - 2 , such as will be described with respect to other examples below).
- Light reflected from the top surface 190 - 1 is refocused by the optics portion 150 onto the aperture 195 . Due to its axial chromatic dispersion, only one wavelength will have the focus distance that matches the measurement distance “Z 1 ”, which is the distance from a reference position RP that is fixed relative to the optical element 120 to the location on the workpiece surface 190 - 1 .
- the wavelength that is best focused at the location on the workpiece surface 190 - 1 is the best focused wavelength at the aperture 195 .
- the fiber optic cable 112 routes the signal light to the wavelength detector 162 that is utilized for determining the wavelength having the dominant intensity, which corresponds to the measurement distance Z 1 to the location on the workpiece surface 190 - 1 .
- the reflected wavelength-dependent light intensity passes back to the electronics portion 160 through the fiber optic path including the coupler COUPLER-E such that a percentage (e.g., in some implementations approximately 50%) of the light is directed through the signal fiber segment 165 S to the wavelength detector 162 .
- the wavelength detector 162 receives the wavelength-dependent light intensity as an output spectral intensity profile (also referred to simply as an output spectral profile) distributed over an array of pixels along a measurement axis of the detector array 163 , and operates to provide corresponding output spectral profile data based on pixel data output from the detector array 163 .
- the subpixel-resolution distance-indicating coordinate (DIC) of the profile data (e.g., see FIG. 3 ) is calculated by the signal processor 166 , and the DIC (in subpixels) indicates the measurement distance Z 1 to the location on the workpiece surface 190 - 1 (in microns) via a distance calibration lookup table or the like, which is stored in a calibration portion 173 of the memory portion 168 , as described below with respect to FIGS. 4A and 4B .
- the DIC may be determined in accordance with the centroid of the intensity profile data included in a peak region.
- the profile data may be used to determine the DIC with subpixel resolution as described in more detail below.
- the fiber optic cable 112 routes the signal light to a wavelength detector 162 that is utilized for determining the wavelengths having the dominant intensities, which correspond to measurement distances to the respective locations on the workpiece surfaces 190 - 1 and 190 - 2 .
- the indicated measurement distance to the workpiece surface 190 - 2 may be an apparent measurement distance Z 2 ′, which is related to the measurement distance Z 2 (e.g., as illustrated by EQUATIONS 3-5, etc.).
- the reflected wavelength-dependent light intensity passes back to the electronics portion 160 through the fiber optic path including the coupler COUPLER-E such that a percentage (e.g., in some implementations approximately 50%) of the light is directed through the signal fiber segment 165 S to the wavelength detector 162 .
- the wavelength detector 162 receives the wavelength-dependent light intensity as an output spectral intensity profile (also referred to simply as an output spectral profile) distributed over an array of pixels along a measurement axis of the detector array 163 , and operates to provide corresponding output spectral profile data based on pixel data output from the detector array 163 .
- the two corresponding subpixel-resolution distance-indicating coordinates (DICs) of the profile data are calculated by the signal processor 166 , and the two DICs (in subpixels) indicate respective measurement distances (in microns) via a distance calibration lookup table or the like, which is stored in the calibration portion 173 of the memory portion 168 , as described below with respect to FIGS. 4A and 4B .
- the two DICs may be determined in accordance with the centroid of the intensity profile data included in each of the two corresponding peak regions.
- the profile data may be used to determine each of the two DICs with subpixel resolution as described in more detail below.
- a DIC may also or alternatively be determined (e.g., resulting from a centroid calculation of two merged wavelength peaks) which corresponds to an apparent measurement distance Z 3 ′, which is related to an actual measurement distance Z 3 (e.g., as illustrated by EQUATIONS 6-10, etc.).
- the distance Z 3 may be between the distances Z 1 and Z 2 and may correspond to a distance to a position inside the workpiece 170 , such as at a midpoint between the workpiece surfaces 190 - 1 and 190 - 2 .
- the user interface portion 171 is coupled to the electronics portion 160 and is configured to receive user input used for the operation of the CRS system 100 , such as a user command to select various operating parameters, via any suitable means such as a keyboard, touch sensor, mouse, etc.
- the user interface portion 171 may include one or more operation mode selecting elements (e.g., user-selectable buttons) operable by a user to select one of a plurality of operation modes of the CRS system 100 (e.g., such as a thickness measurement mode and/or a distance measurement mode, etc.).
- the user interface portion 171 is also configured to display information on a screen, such as a distance and/or thickness successfully determined/measured by the CRS system 100 .
- the memory portion 168 may include a thickness measurement portion 169 and a distance measurement portion 172 , such as may implement corresponding modes and/or otherwise provide corresponding operations. Such corresponding modes and/or operations may be for measuring thicknesses of workpieces (e.g., as corresponding to a spacing between first and second workpiece surfaces) and/or distances to workpiece surfaces, etc.
- the thickness measurement portion 169 and the distance measurement portion 172 and/or the operations associated therewith may be merged and/or otherwise indistinguishable.
- FIG. 1 includes orthogonal XYZ coordinate axes, as a frame of reference.
- the Z direction is defined to be parallel to the optical axis (OA), which is the distance-measurement axis, of the optical element 120 .
- OA optical axis
- the workpiece 170 is placed along the optical axis OA, and may be mounted on a translation stage 175 which may be advantageously aligned such that it translates along the Z axis direction constrained by guide bearings 175 A.
- FIG. 2 is a diagram 200 of a system noise (bias) profile from a CRS system, illustrating voltage offset signal levels Voffset(p) for the pixels in a detector array 163 when no measurement surface is present within the nominal total measurement range of the CRS system. In such a case, there is no intentionally reflected light and hence no significant or dominant wavelength peak in the resulting intensity profile.
- the voltage offset signal Voffset(p) is plotted in normalized volts, for each of 1,024 pixels along the “wavelength” measurement axis. “Normalized volts” assigns a value of 1.0 to the saturation voltage of the detector array 163 .
- the voltage offset signal Voffset(p) includes a bias signal level Vbias, which is relatively consistent across the detector array, and a background signal component Vback(p), which is shown as varying across the detector array.
- FIGS. 3, 4A, 4B, 5A and 5B outlines certain signal processing operations that determine distance-indicating coordinates (DIC) with subpixel resolution based on valid wavelength peaks produced in wavelength-dispersed intensity profiles from the CRS system and determine measurement distances to workpiece surfaces (e.g., in microns) based on the determined DICs.
- DIC distance-indicating coordinates
- workpiece surfaces e.g., in microns
- Certain of the operations outlined here are described in more detail in the '456 patent. The purpose of this description is to provide additional background information which is useful for an overall understanding of certain CRS measurement operations as described herein.
- FIG. 3 is a diagram 300 of a wavelength-dispersed intensity profile from a CRS system illustrating a valid wavelength peak 302 produced by a subset of measurement profile signals MS(p) indicative of a wavelength focused on and reflected by a single measurement surface of a workpiece (e.g., that is not transparent).
- the diagram 300 includes a single wavelength peak 302 corresponding to a single reflection surface (e.g., the top surface) of a non-transparent workpiece.
- Each of the measurement profile signals MS(p) has the signal level (shown in normalized volts) associated with each pixel p of the detector array (e.g., the detector array 163 ).
- the wavelength peak 302 has more than sufficient height (a good signal to noise ratio), is relatively symmetric, and allows a good estimation of the peak location or measurement distance-indicating coordinate (DIC) 304 along the measurement axis of the detector array.
- FIG. 3 also shows a bias signal level MVbias (in normalized volts), a peak pixel coordinate (ppc), and a data threshold MVthreshold that defines the lower limit of a distance-indicating subset of measurement profile signals MS(p) forming the wavelength peak 302 . All values (e.g., including “MV” values) are in normalized volts.
- measurement operations for determining a distance-indicating coordinate (DIC) (in pixels) and determining a corresponding measurement distance (in microns) based on the determined DIC may include the following:
- a DIC may be determined with sub-pixel resolution, based on the distance-indicating subset of measurement profile signals MS(p) above the data threshold MVthreshold.
- a DIC may be determined as the subpixel-resolution coordinate of a centroid Xc of the distance-indicating subset of signals MS(p). For example, for a detector with 1024 pixels (i.e., each having a corresponding pixel number (p) from 1 to 1024), the centroid Xc may be determined according to:
- n 2 in EQUATION 1. It will be appreciated that EQUATION 2 restricts the signals MS(p) used in the centroid calculation to a distance-indicating subset.
- FIG. 4A is a diagram 400 A of CRS measurement distance calibration data 410 A which correlates distance-indicating coordinates (DIC) with sub-pixel resolution to known measurement distances (ZOUT) in microns along the optical axis (OA) of the CRS (e.g., as stored in the calibration portion 173 of FIG. 3 ).
- DIC distance-indicating coordinates
- ZOUT known measurement distances
- OA optical axis
- FIG. 4A is for an optical element (e.g., optical pen) having a nominal total measurement range MR of 300 microns, which corresponds to DICs in the range of approximately 150 pixels-490 pixels.
- the CRS system may be calibrated over a larger pixel range of the detector array 163 , if desired.
- One exemplary laboratory calibration method to determine the CRS measurement distance calibration data 410 A employs a mirror (e.g., substituting for the surface 190 - 1 of FIG. 1 ) moved along the optical axis OA (e.g., in approximately 0.1 or 0.2 micron steps). For each actual mirror position, the corresponding calibration DIC of the CRS system is determined based on the corresponding intensity profile data as described above with respect to FIG. 3 .
- the calibration DIC and the corresponding actual position (in microns along the optical axis OA) are then recorded to provide the calibration data 410 A.
- a measurement DIC obtained by a CRS system is referenced to the stored calibration data 410 A to determine the measurement distance ZOUT corresponding to the measurement DIC.
- the distance calibration data 410 A appears to form a smooth curve, it will be appreciated that in some instances the distance calibration data and/or output spectral profile data for a typical CRS system, particularly for economical CRS systems, may exhibit certain short range variations/irregularities (e.g., as described in part in U.S. Pat. No. 7,876,456, which is hereby incorporated herein by reference in its entirety).
- FIG. 4B is a diagram 400 B of a CRS distance calibration lookup table 410 B for referencing distance-indicating coordinates to measurement distances for a chromatic point sensor (e.g., as stored in the calibration portion 173 of FIG. 3 ).
- the table values of FIG. 4B are intended to be illustrative only, and may not correspond to specific values indicated in other examples, such as those of FIG. 4A , although for which it will be appreciated that the concepts are analogous.
- the calibration DICs entries cover the pixel coordinates from 1 to 1,024, in increments of 0.1 pixel steps, and in the right column the corresponding measurement distances (in microns) (ZOUT) are entered.
- the measurement DIC calculated by the CRS system is referenced to the stored calibration lookup table in order to determine the corresponding measurement distance (in microns). If the measurement DIC falls between adjacent calibration DIC values, then the measurement distance may be determined by interpolation. In the example of FIG. 4B , some specific example values are shown for some small ranges near DICs with pixel positions of approximately 104, 604 and 990, with corresponding measurement distances in ranges near 37 microns, 381 microns and 486 microns.
- the optical pen 120 is connected to the CRS electronics portion 160 and operably positioned relative to the workpiece surface 190 - 1 to perform measurement operations.
- the measurement operations include the optical pen 120 inputting an input spectral profile from the illumination source 164 and outputting corresponding radiation to the workpiece surface 190 - 1 and receiving reflected radiation from the workpiece surface 190 - 1 and outputting the reflected radiation to provide an output spectral profile to the CRS wavelength detector 162 , which then provides output spectral profile data.
- the output spectral profile includes a distance-dependent profile component and a distance-independent profile component.
- the distance-dependent profile component has a wavelength peak (e.g., peak 302 in FIG. 3 ) that indicates a measurement distance (e.g., measurement distance Z 1 ) from the optical pen 120 to the workpiece surface 190 - 1 .
- the measurement DIC that is determined in accordance with a centroid calculation by the CRS system is referenced to the stored calibration data (e.g., FIG. 4A or 4B ) in order to determine the measurement distance (e.g., measurement distance Z 1 ) corresponding to the measurement DIC. If the measurement DIC falls between adjacent calibration DIC values, then the measurement distance corresponding to the measurement DIC may be determined by interpolation (e.g., between the measurement distances corresponding to the adjacent calibration DIC values).
- FIG. 5A illustrates an example for determining measurement distances to first and second workpiece surfaces (e.g., measurement distances Z 1 and Z 2 to top and bottom workpiece surfaces 190 - 1 and 190 - 2 , respectively, of FIG. 1 ).
- Such techniques e.g., which are sometimes referenced as “centroid type techniques” herein
- may be utilized to determine a thickness of a workpiece e.g., based at least in part on a difference between measurement distances Z 1 and Z 2 ′ as corresponding to DICs determined from centroid calculations).
- certain alternative techniques may be utilized for determining a workpiece thickness, which have certain advantages (e.g., including more accurate thickness determinations for certain workpieces, etc.).
- FIG. 5A is a diagram 500 A of a wavelength-dispersed intensity profile from a CRS system illustrating valid wavelength peaks 502 - 1 and 502 - 2 .
- the wavelength peak 502 - 1 is produced by a first subset of measurement profile signals MS(p) indicative of a first wavelength focused on and reflected by a first measurement surface (e.g., surface 190 - 1 of workpiece 170 ).
- the valid wavelength peak 502 - 2 is produced by a second subset of measurement profile signals MS(p) indicative of a second wavelength focused on and reflected by a second measurement surface (e.g., surface 190 - 2 of workpiece 170 ).
- the workpiece e.g., workpiece 170
- the workpiece may be transparent, thus allowing the second measurement surface 190 - 2 to be viewed through the first measurement surface 190 - 1 (e.g., for which some of the light from the optical pen 120 passes through the first measurement surface 190 - 1 to be reflected by the second measurement surface 190 - 2 ).
- Each of the measurement profile signals MS(p) has the signal level (shown in normalized volts) associated with each pixel p of the detector array (e.g., the detector array 163 ).
- Each of the valid wavelength peaks 502 - 1 and 502 - 2 has more than sufficient height (a good signal to noise ratio), is relatively symmetric, and allows a good estimation of the respective peak location and a determination of a distance-indicating coordinate (DIC) 504 - 1 or 504 - 2 (i.e., utilizing a centroid calculation) along the measurement axis of the detector array.
- DIC distance-indicating coordinate
- 5A shows a bias signal level MVbias (in normalized volts), peak pixel coordinates (ppc 1 and ppc 2 ), and a data threshold MVthreshold that defines the lower limit of a distance-indicating subset of measurement profile signals MS(p) forming the corresponding wavelength peaks 502 - 1 and 502 - 2 . All values (e.g., including “MV” values) are in normalized volts.
- the optical pen 120 is connected to the CRS electronics portion 160 and operably positioned relative to the workpiece 170 (i.e., including the workpiece surfaces 190 - 1 and 190 - 2 ) to perform measurement operations.
- the measurement operations include the optical pen 120 inputting an input spectral profile from the illumination source 164 and outputting corresponding radiation to the workpiece surfaces 190 - 1 and 190 - 2 and receiving reflected radiation from the workpiece surfaces 190 - 1 and 190 - 2 and outputting the reflected radiation to provide an output spectral profile to the CRS wavelength detector 162 , which then provides output spectral profile data.
- the output spectral profile includes distance-dependent profile components and distance-independent profile components.
- the distance-dependent profile components have wavelength peaks (e.g., peaks 502 - 1 and 502 - 2 in FIG. 5A ) that indicate measurement distances from the optical pen 120 to the workpiece surfaces 190 - 1 and 190 - 2 , respectively.
- the measurement DICs 504 - 1 and 504 - 2 calculated by the CRS system are referenced to the stored calibration data (e.g., FIG. 4A or 4B ) in order to determine the measurement distances (e.g., measurement distances Z 1 and Z 2 ′) corresponding to the measurement DICs.
- the measurement distance corresponding to the measurement DIC may be determined by interpolation.
- a thickness d of the workpiece 170 may be determined in accordance with a difference between the determined measurement distances, as will be described in more detail below with respect to FIG. 5B .
- FIG. 5B is a diagram 500 B illustrating measurement distances to the top surface 190 - 1 and the bottom surface 190 - 2 of the transparent workpiece 170 , including an actual measurement distance Z 2 and an apparent measurement distance Z 2 ′ to the bottom surface 190 - 2 .
- rays R 1 A and R 1 B e.g., from the optics portion 150
- FIG. 5A result in the wavelength peak 502 - 1 with the corresponding DIC 504 - 1 which indicates the measurement distance Z 1 .
- FIG. 5B is a diagram 500 B illustrating measurement distances to the top surface 190 - 1 and the bottom surface 190 - 2 of the transparent workpiece 170 , including an actual measurement distance Z 2 and an apparent measurement distance Z 2 ′ to the bottom surface 190 - 2 .
- rays R 1 A and R 1 B e.g., from the optics portion 150
- FIG. 5A result in the wavelength peak 502 - 1 with the corresponding DIC 504 - 1 which indicates the
- rays R 2 A and R 2 B are shown to focus at the workpiece surface 190 - 2 (i.e., corresponding to a wavelength that is best in focus at the workpiece surface 190 - 2 ), and which in FIG. 5A result in the wavelength peak 502 - 2 with the corresponding DIC 504 - 2 which indicates an apparent measurement distance Z 2 ′.
- the apparent measurement distance Z 2 ′ is different than the actual measurement distance Z 2 , due to the index of refraction of the workpiece material at the corresponding wavelength (i.e., corresponding to the wavelength peak 502 - 2 ).
- the above equations enable a workpiece thickness d to be determined based on measurement profile signals MS(p) such as those of FIG. 5A . More specifically, the determined DICs 504 - 1 and 504 - 2 of FIG.
- 5A indicate the respective measurement distances Z 1 and Z 2 ′ via a distance calibration lookup table or the like, which is stored in the calibration portion 173 of the memory portion 168 , as described above with respect to FIGS. 4A and 4B .
- the measurement distances Z 1 and Z 2 ′ can be used to determine the measurement of the apparent workpiece thickness d′ in accordance with calculations such as those of EQUATION 4.
- the measurement of the apparent workpiece thickness d′ can then be used to determine the measurement of the actual workpiece thickness d in accordance with calculations such as those of EQUATION 5.
- a distance Z 3 may be between the distances Z 1 and Z 2 (e.g., may be an average of the distances Z 1 and Z 2 and may extend to a midpoint of the actual thickness d), and a related distance Z 3 ′ may be between the distances Z 1 and Z 2 ′ (e.g., may be an average of the distances Z 1 and Z 2 ′ and may extend to a midpoint of the apparent thickness d′).
- FIG. 5A also illustrates a dotted-line representation of a wavelength-dispersed intensity profile from a CRS system with wavelength peaks 502 - 1 a and 502 - 2 a with corresponding peak pixel coordinates ppc 1 a and ppc 2 a .
- the wavelength peaks 502 - 1 a and 502 - 2 a are similar to the wavelength peaks 502 - 1 and 502 - 2 , except are closer together such that the peaks and corresponding first and second subsets of measurement profile signals 510 a have partially merged.
- this example may correspond to a version of a workpiece 170 that is relatively thin (i.e., for which there is little spacing between the top and bottom surfaces which are relatively close together).
- this may present certain issues for the determination of the measurement distances to the respective surfaces, and for determining a workpiece thickness as corresponding to a difference between the determined measurement distances.
- the processing as described above may result in an evaluation of the partially merged wavelength peaks 502 - 1 a and 502 - 2 a which (e.g., in accordance with a centroid calculation such as described above with respect to EQUATIONS 1 and 2) may result in a determination of a single DIC 504 a , as corresponding to only a single determined measurement distance to the workpiece.
- the processing may result in a determination of two DICs, but for which it will be appreciated that the partial merging of the wavelength peaks 502 - 1 a and 502 - 2 a may in some instances result in inaccurate determinations of corresponding DICs and/or for which an error message may in some instances be provided (e.g., as indicating an issue with the determination of a corresponding DIC).
- a corresponding determination of the thickness of the workpiece may be problematic (e.g., may have certain inaccuracies or may not otherwise be able to be determined, etc.).
- a CRS system is equipped with a novel approach to determine a workpiece thickness, which results in high accuracy even for relatively thin workpieces (e.g., in various implementations, having a thickness as little as 7 microns, or 5 microns, or 3 microns).
- the CRS electronics portion 160 FIG. 1
- the CRS electronics portion 160 includes a thickness measurement portion 169 which may be utilized by the CRS system to perform a thickness measurement of a workpiece in accordance with principles disclosed herein, and a distance measurement portion 172 which may be utilized by the CRS system 100 is to perform one or more distance measurements to one or more surfaces of a workpiece (e.g., in accordance with previously known techniques).
- selection of a thickness measurement mode or operation may be made in response to a user input received via the user interface 171 , or automatically.
- a thickness operation or mode may be automatically or manually selected for determining the thickness of the workpiece.
- the signal processor 166 may execute an algorithm (e.g., comprising transform or other processing) as stored in the thickness measurement portion 169 of the memory portion 168 .
- the algorithm e.g., utilizing transform processing
- the optical pen 120 is connected to the CRS electronics portion 160 and operably positioned relative to the workpiece 170 to perform the thickness measurement operations.
- the thickness measurement operations include the optical pen 120 inputting an input spectral profile from the illumination source 164 and outputting corresponding radiation to the two surfaces 190 - 1 and 190 - 2 (i.e., “surface 1 ” and “surface 2 ”) of the workpiece 170 .
- the optical pen 120 receives reflected radiation from the two surfaces and outputs the reflected radiation to the CRS wavelength detector 162 , which then provides output spectral profile data, for which the workpiece thickness is determined based on processing of the output spectral profile data (e.g., utilizing transform processing such as Fourier transform processing or Fourier-related transform processing, etc.).
- FIG. 6 is a flow diagram illustrating an exemplary method 600 of operating the CRS system 100 to determine a workpiece thickness.
- a CRS system comprising: an optical pen 120 comprising a confocal optical path including an optics portion 150 providing axial chromatic dispersion and configured to focus different wavelengths at different distances proximate to a workpiece 170 ; an illumination source 164 ; and a CRS wavelength detector 162 comprising a plurality of pixels with respective pixel positions distributed along a measurement axis of the CRS wavelength detector, wherein the plurality of pixels receive respective wavelengths and provide output spectral profile data.
- the CRS system 100 is operated with the optical pen operably positioned relative to a workpiece to perform measurement operations, the measurement operations including the optical pen inputting the input spectral profile and outputting corresponding radiation to first and second workpiece surfaces of the workpiece and receiving reflected radiation from the first and second workpiece surfaces and outputting the reflected radiation to the CRS wavelength detector which provides the output spectral profile data.
- the method proceeds to block 650 , where the output spectral profile data is processed to determine a thickness of the workpiece which corresponds to a spacing between the first and second workpiece surfaces of the workpiece (e.g., wherein the processing to determine the thickness is not dependent on a determined measurement distance to the workpiece and/or may utilize transform processing such as Fourier transform processing or other Fourier-related transform processing, etc.).
- Fourier-related transform processing may include linear transformations of functions related to Fourier analysis (e.g., which may map a function to a set of coefficients of basis functions, where the basis functions may be sinusoidal and may be strongly localized in the frequency spectrum). Some examples include cosine transforms, sine transforms, Laplace transforms, etc.
- the wavelength peaks may be merged to an extent for which only a single distance indicating coordinate (e.g., DIC 504 a of FIG. 5A ) may be determined.
- two distance indicating coordinates may be determined, but for which there may be inaccuracies and/or processing issues due to the merging of the wavelength peaks (e.g., for which a centroid calculation for a first wavelength peak to determine a corresponding first distance indicating coordinate may be partially skewed or otherwise affected by a merged second wavelength peak, and vice versa). Due to such potential issues, it is desirable in some instances to be able to determine a thickness of a workpiece, without requiring distance determinations using centroid calculations such as those of the previously known techniques as described above. As will be described in more detail below, alternative techniques for determining a workpiece thickness (e.g., utilizing transform processing) are disclosed herein.
- a distance and/or distances determined by previously known techniques may still provide useful information (e.g., which may in some instances be utilized in combination with a thickness that is determined in accordance with principles disclosed herein).
- a measurement distance to a workpiece that is determined e.g., at block 640
- a thickness of the workpiece that is determined in accordance with principles disclosed herein e.g., at block 650 .
- wavelength peaks corresponding to two opposing workpiece surfaces may be merged to an extent for which only a single distance indicating coordinate (e.g., DIC 504 a of FIG. 5A ) may be determined.
- a distance indicating coordinate e.g., DIC 504 a of FIG. 5A
- the distance Z 3 ′ is between the distances Z 1 and Z 2 ′ (e.g., and may correspond to an average of the distances Z 1 and Z 2 ′ and may extend to a midpoint of the apparent thickness d′).
- the distance Z 3 ′ is related to the distance Z 3 , which is similarly to a point inside the workpiece 170 that is between the first and second workpiece surfaces 190 - 1 and 190 - 2 .
- the point inside the workpiece corresponding to the distance Z 3 may be at a midpoint between the first and second workpiece surfaces 190 - 1 and 190 - 2 , for which the distance Z 3 corresponds to an average of first and second distances Z 1 and Z 2 to the respective first and second workpiece surfaces 190 - 1 and 190 - 2 (e.g., for which the distance Z 3 extends to a midpoint of the actual thickness d).
- a centroid or similar calculation may result in a distance indicating coordinate (e.g., DIC 504 a ) that is approximately/nominally at a midpoint between the two wavelength peaks.
- the corresponding measurement distance (e.g., distance Z 3 ′) is approximately an average of the first and second distances Z 1 and Z 2 ′.
- a determined measurement distance (e.g., distance Z 3 ′) may be utilized in combination with the determined thickness d of the workpiece (e.g., as determined at block 650 ) to determine the first and/or second measurement distances Z 1 and Z 2 to the first and second workpiece surfaces 190 - 1 and 190 - 2 .
- a determined workpiece thickness d may be utilized in combination with a determined distance (e.g., distance Z 3 ′ as an average of distances Z 1 and Z 2 ′) in order to determine a distance to a workpiece surface (e.g., distance Z 1 to workpiece surface 190 - 1 ).
- a determined distance e.g., distance Z 3 ′ as an average of distances Z 1 and Z 2 ′
- a distance to a workpiece surface e.g., distance Z 1 to workpiece surface 190 - 1
- the processing may produce two DICs that correspond to two wavelength peaks that are partially merged.
- the two determined DICs may have inaccuracies (e.g., due to the merged peaks).
- the two measurement distances corresponding to the two DICs may be averaged in order to determine an approximate mid-point measurement distance (e.g., similar to distance Z 3 ′), which may then be utilized in combination with a determined thickness d of the workpiece (e.g., as determined at block 650 ) to provide more accurate determinations of the distances Z 1 and Z 2 (e.g., through utilization of processing such as EQUATION 10, etc.).
- a selection may be made and/or processing may be performed to determine if a thickness of a workpiece should be determined in accordance with principles disclosed herein, or alternatively in accordance with previously known methods (e.g., utilizing centroid calculations to determine distance indicating coordinates and a corresponding difference between measurement distances, such as described above with respect to the DICs 504 - 1 and 504 - 2 of FIG. 5A and EQUATIONS 4 and 5).
- a user may select and/or processing may be performed (e.g., automatically) to determine that techniques as disclosed herein should be utilized for determining the thickness.
- a user may select and/or processing may be performed (e.g., automatically) to determine that previously known methods should be utilized for determining the thickness.
- such determinations may be made based at least in part on processing the output spectral profile data utilizing both the previously known methods and the techniques disclosed herein, and comparing/analyzing the different results to determine which thickness determination technique may be preferred/utilized (e.g., most accurate, practical, etc.) for a given implementation (e.g., which may also depend on additional factors, such as the measurement range of the particular optical pen/CRS system that is being utilized, etc.).
- FIGS. 7A-7D illustrate a thickness measurement process using transform processing as part of a deconvolution method.
- Deconvolution is used to improve the determination of the locations of two wavelength peaks which may not be well defined and/or well separated from each other. Specifically, in one aspect, deconvolution is used to reduce the peak widths such that a distance between the two peaks can be better and more accurately determined (e.g., in accordance with a corresponding calculation, etc.).
- FIG. 7A illustrates an intensity profile (or “output spectral profile data”) 701 outputted from the wavelength detector 162 comprising signal level or intensity (vertical axis) as a function of pixel coordinates or “pixel positions” (horizontal axis), similar to FIGS. 3, 5A and 10A-10F as described above.
- the intensity profile 701 includes first and second wavelength peaks 702 - 1 and 702 - 2 , as corresponding to first and second workpiece surfaces (e.g., workpiece surfaces 190 - 1 and 190 - 2 of FIG. 1 ).
- transform processing that is performed to determine the thickness of the workpiece may include computing a transform (e.g., a Fourier transform) of the output spectral profile data 701 , as in FIG. 7B . Then, the Fourier transform of the output spectral profile data may be divided by a Fourier transform of a reference (e.g., as illustrated in FIG. 7C ) to thereby obtain a Fourier transform of target spectral profile data.
- the reference may be a mathematical reference function (e.g., a Lorentzian reference, etc.).
- the reference may be obtained, for example, as output spectral profile data obtained for a “reference” workpiece (e.g., for which the top surface is located at the same distance from the optical pen as the workpiece surface 190 - 1 ), which may be a thick glass workpiece such that the reflection from only the top surface is represented in the output spectral profile data (e.g., for which the bottom surface of the thick glass workpiece may be out of the range of the optical pen or otherwise such that reflections from the bottom surface are not included in the output spectral profile data).
- a “reference” workpiece e.g., for which the top surface is located at the same distance from the optical pen as the workpiece surface 190 - 1
- the output spectral profile data e.g., for which the top surface is located at the same distance from the optical pen as the workpiece surface 190 - 1
- the output spectral profile data e.g., for which the top surface is located at the same distance from the optical pen as the workpiece surface 190
- an inverse Fourier transform of the Fourier transform of the target spectral profile data is computed, to recover first and second wavelength peaks 702 - 1 x and 702 - 2 x as in FIG. 7D , for which the pixel locations are more easily/accurately determined and which thereby enable an enhanced and improved determination of the corresponding pixel locations of the original two peaks 702 - 1 and 702 - 2 included in the output spectral profile data 701 of FIG. 7A .
- the locations of the peaks as indicated by the pixel locations may then be referenced to a distance calibration lookup table or the like (e.g., as described above with respect to FIGS. 4A and 4B ) to determine the distances Z 1 and Z 2 ′, for which the thickness d of the workpiece may be determined according to calculations such as those of EQUATIONS 4 and 5.
- FIGS. 7A-7D additional techniques are further disclosed herein, which in some implementations may have certain advantages over the techniques such as those illustrated in relation to FIGS. 7A-7D .
- the deconvolution type technique described in reference to FIGS. 7A-7D may improve and enhance the determination of the pixel locations of the two peaks in output spectral profile data, but for which in some implementations the dividing by the reference (e.g., FIG. 7C ) may cause the signal portions associated with the high frequency noise in the Fourier transform of the profile data to increase.
- FIG. 8 illustrates certain aspects of a thickness measurement process using transform processing (e.g., including Fast Fourier Transform (FFT) processing). Certain curves illustrated in FIG. 8 are similar and/or related to certain curves illustrated in FIGS. 7A-7D , as will be described in more detail below.
- FIG. 8 illustrates an original data Fourier transform curve 801 which is the Fourier transform of the intensity profile (or “output spectral profile data”), comprising signal level (log scale of absolute value) (vertical axis) as a function of frequency (pixel ⁇ 1 ) (horizontal axis), and for which the determining of the Fourier transform as curve 801 is similar to the determining of the Fourier transform curve of FIG. 7B .
- FFT Fast Fourier Transform
- a deconvolution output curve 802 illustrates a result of a process similar to that described above with respect to FIG. 7C , for which the Fourier transform curve 801 is divided by a Fourier transform of a reference, and for which, in this example, a low pass filter is not utilized to mitigate high frequency noise and as a result the noise component in the curve 802 is illustrated as increasing (e.g., exponentially or otherwise) for the higher frequency components.
- a technique that avoids such issues is described in more detail below with respect to the curve 803 .
- the process of FIGS. 7A-7D may be characterized as attempting to recover a cosine curve similar to the cosine curve 803 of FIG. 8 , but for which as noted above a low pass filter is required to mitigate increasing high frequency noise as illustrated in curve 802 and for which there may be certain challenges for fine tuning the low pass filter.
- EQUATION 12 EQUATION 12
- ⁇ z/ ⁇ k is related to a rate of change of z in relation to pixel position/wavelength, for which as partially illustrated in FIG. 4A by the curve of the CRS measurement distance calibration data 410 A, the change in z for a unit of pixel change is higher for lower wavelengths/pixel positions (e.g., closer to a blue wavelength part of the range) and is lower for higher wavelengths/pixel positions (e.g., closer to a red wavelength part of the range).
- This is similarly illustrated by the example values in the distance calibration lookup table 410 B of FIG.
- the portion of the range that is being utilized is in accordance with the distance of the workpiece from the optical pen (e.g., in accordance with the wavelength that is best in focus at the aperture 195 as described above with respect to FIGS. 1-3 ).
- the portion of the range that is being utilized is in accordance with the distance of the workpiece from the optical pen (e.g., in accordance with the wavelength that is best in focus at the aperture 195 as described above with respect to FIGS. 1-3 ).
- the portion of the range that is being utilized is in accordance with the distance of the workpiece from the optical pen (e.g., in accordance with the wavelength that is best in focus at the aperture 195 as described above with respect to FIGS. 1-3 ).
- transform processing e.g., utilizing a Fast Fourier Transform (FFT)
- FFT Fast Fourier Transform
- a value of f dip may be determined in accordance with a dip finding algorithm (e.g., which in some implementations may be similar to or include a peak finding algorithm that has been repurposed as a dip finding algorithm).
- a dip finding algorithm e.g., which in some implementations may be similar to or include a peak finding algorithm that has been repurposed as a dip finding algorithm.
- such algorithms may include operations such as taking a derivative and searching for zero crossings (e.g., such as a first zero crossing as corresponding to a first dip, etc.).
- false peaks/dips that may otherwise occur due to noise or similar factors may be suppressed or otherwise addressed by smoothing and/or thresholding operations, etc.
- certain of the techniques disclosed herein may enable accurate thickness measurements/determinations for thinner workpieces than can be measured utilizing previously known techniques.
- some calculations of minimum thicknesses measurable with previously known techniques will be described in more detail below and will be compared to minimum thicknesses measurable with techniques disclosed herein.
- FWHM full-width half-maximum
- FIGS. 9A-9D certain additional examples of a first dip being determined are illustrated in FIGS. 9A-9D .
- the workpiece 170 may be placed on the stage 175 of the CRS system 100 (see FIG. 1 ), for which the top surface 190 - 1 is at 300 ⁇ m, 400 ⁇ m, 500 ⁇ m, and 800 ⁇ m, respectively, from a measurement reference position RP of the optical pen 120 of the CRS system 100 (i.e., for which the wavelength peaks are illustrated as being located at different corresponding relative positions along the pixel/wavelength range of the detector as illustrated by the corresponding x-axis positions).
- a measurement reference position RP of the optical pen 120 of the CRS system 100 i.e., for which the wavelength peaks are illustrated as being located at different corresponding relative positions along the pixel/wavelength range of the detector as illustrated by the corresponding x-axis positions.
- FIGS. 9A-9D illustrate corresponding intensity profiles 902 A, 905 A, 908 A, 911 A outputted from the wavelength detector 162 comprising signal level or intensity (vertical axis) as a function of pixel coordinates or “pixel positions” (horizontal axis), similar to FIGS. 3, 5A, 7A and 10A-10F described above. It is noted that in a blue wavelength part of the Z range of the CRS system 100 closer to the optical pen 120 , the two wavelength peaks of the intensity profile appear to have fully merged together as in FIGS.
- FIGS. 9A-9D also illustrate intensity profiles 903 A, 906 A, 909 A, 912 A corresponding to a “reference” workpiece, which may be a thick glass workpiece such that the reflection from only the top surface of the reference workpiece is represented in the intensity profiles, as described above with respect to FIG. 7C .
- FIG. 9E illustrates the Fourier transforms 902 B/ 903 B of the intensity profiles 902 A/ 903 A of FIG. 9A .
- FIG. 9F illustrates the Fourier transforms 905 B/ 906 B of the intensity profiles 905 A/ 906 A of FIG. 9B .
- FIG. 9G illustrates the Fourier transforms 908 B/ 909 B of the intensity profiles 908 A/ 909 A of FIG. 9C .
- FIG. 9H illustrates the Fourier transforms 911 B/ 912 B of the intensity profiles 911 A/ 912 A of FIG. 9D .
- FIGS. 9E-9H illustrate that the Fourier transforms 902 B, 905 B, 908 B, 911 B of the intensity profiles of the workpiece being measured, regardless of the location of the workpiece relative to the optical pen 120 of the CRS system 100 , include a first dip 904 , 907 , 910 , 913 , which can be used to determine the workpiece thickness, as described above. It is noted that the Fourier transforms 903 B, 906 B, 909 B, 912 B of the intensity profiles of the reference workpiece, on the other hand, do not include any prominent dip.
- a thickness of a workpiece e.g., a 25 micron workpiece
- a thickness of a workpiece e.g., a 25 micron workpiece
- little or no error e.g., error less than 10%, or 5%, etc.
- most e.g., 90%, or 75%, etc.
- the wavelength peaks have merged (e.g., and in particular in FIGS. 9A and 9B where the two peaks visually appear as a single peak).
- first dip type techniques as disclosed herein operate (e.g., including utilization of transforms such as Fourier transforms which are sums of sinusoidals), as noted above, such techniques may be particularly effective for determining workpiece thicknesses as corresponding to spacings between first and second workpiece surfaces, although in some implementations may be less effective for simultaneously determining thicknesses between multiple layers of a workpiece (i.e., which may include top and bottom workpiece surfaces as well as additional middle workpiece surfaces as separating layers).
- corresponding thickness measurement operations and/or modes as implemented according to principles disclosed herein may only be operable to determine thicknesses as corresponding to spacings between first and second workpiece surfaces and may not be operable to determine spacings between three or more workpiece surfaces (e.g., of multiple layers).
- a thickness of a workpiece that is determined in accordance with techniques disclosed herein may be utilized in combination with a distance to the workpiece that is determined in accordance with previously known methods. For example, given the illustrations of the two merged wavelength peaks in FIGS. 9A-9D (e.g., particularly in FIGS.
- centroid type techniques for determining DICs may not be able to accurately determine the two distances to the two surfaces, they can be used to accurately determine a distance (e.g., distance Z 3 ′) to an approximate midpoint (e.g., between the distances Z 1 and Z 2 ′ in accordance with determining a centroid of the merged peaks).
- the distance (e.g., distance Z 3 ′) calculated in this manner may be referenced or otherwise used in combination with the thickness measurement performed in accordance with techniques disclosed herein (e.g., as described above with respect to EQUATION 10 for determining the distance Z 1 , etc.).
- the CRS system 100 may be included and/or otherwise utilized in a machine system (e.g., in a vision inspection system or a coordinate measuring machine, etc.). In some instances, corresponding functions such as measuring a workpiece thickness along the optical axis OA of the CRS system 100 may be performed automatically in the machine system.
- suitable machine vision inspection systems are described in U.S. Pat. Nos. 8,085,295 and 7,454,053, which are hereby incorporated herein by reference in their entireties.
- a CRS system including a chromatic line sensor may be configured to operate according to the systems and methods disclosed herein. It will be appreciated that these and various other alternative forms may be used to implement the principles disclosed herein.
- the various implementations described above can be combined to provide further implementations. All of the U.S. patents and U.S. patent applications referred to in this specification are incorporated herein by reference, in their entirety. Aspects of the implementations can be modified, if necessary to employ concepts of the various patents and applications to provide yet further implementations.
Abstract
Description
-
- Position the target surface along the optical axis OA, and capture the resulting wavelength-dispersed intensity profile as in the diagram 300.
- Determine the peak pixel coordinate (ppc), which is the pixel that has the highest signal.
- Determine the measurement bias signal level MVbias at a given sampling rate.
- Determine the data threshold MVthreshold (e.g., as a percentage of the peak height).
- Determine the distance-indicating coordinate (DIC) with sub-pixel resolution, based on the distance-indicating subset of measurement profile signals MS(p) forming the wavelength peak that has a value greater than MVthreshold.
- Determine the measurement distance by correlating the DIC with a corresponding distance in the stored distance calibration data (e.g., a distance calibration curve as in
FIG. 4A or a lookup table as inFIG. 4B , etc.).
where,
d=Z2−Z1 (Eq. 3)
d′=Z2′−Z1 (Eq. 4)
d=(d′)(n) (Eq. 5)
where n is the index of refraction of the workpiece material at the corresponding wavelength (e.g., corresponding to the wavelength peak 502-2). The above equations enable a workpiece thickness d to be determined based on measurement profile signals MS(p) such as those of
Z1=Z3−(d/2) (Eq. 6)
Z2=Z3+(d/2) (Eq. 7)
Z1=Z3′−(d′/2) (Eq. 8)
Z2′=Z3′+(d′/2) (Eq. 9)
Z1=Z3′−(d/2n) (Eq. 10)
and for which Z2 can then also be determined (e.g., in accordance with EQUATION 3).
F(δ(x−d′/2)+δ(x+d′/2))=2 cos(k(d′/2)) (Eq. 11)
where d′ is the apparent thickness of the workpiece and k is the spatial frequency.
d=n(∂z/∂λ)/(2f dip) (Eq. 12)
where d is the thickness of the workpiece, n is the index of refraction of the workpiece material at the corresponding wavelength (i.e., for which in accordance with
Claims (24)
Priority Applications (4)
| Application Number | Priority Date | Filing Date | Title |
|---|---|---|---|
| US17/126,191 US11486694B2 (en) | 2020-12-18 | 2020-12-18 | Chromatic range sensor system for measuring workpiece thickness |
| DE102021133260.5A DE102021133260A1 (en) | 2020-12-18 | 2021-12-15 | Chromatic distance sensor system for measuring workpiece thickness |
| CN202111540823.XA CN114646267A (en) | 2020-12-18 | 2021-12-16 | Colorimetric range sensor system for measuring workpiece thickness |
| JP2021205784A JP2022097472A (en) | 2020-12-18 | 2021-12-20 | Chromatic range sensor system |
Applications Claiming Priority (1)
| Application Number | Priority Date | Filing Date | Title |
|---|---|---|---|
| US17/126,191 US11486694B2 (en) | 2020-12-18 | 2020-12-18 | Chromatic range sensor system for measuring workpiece thickness |
Publications (2)
| Publication Number | Publication Date |
|---|---|
| US20220196388A1 US20220196388A1 (en) | 2022-06-23 |
| US11486694B2 true US11486694B2 (en) | 2022-11-01 |
Family
ID=81847024
Family Applications (1)
| Application Number | Title | Priority Date | Filing Date |
|---|---|---|---|
| US17/126,191 Active 2041-05-25 US11486694B2 (en) | 2020-12-18 | 2020-12-18 | Chromatic range sensor system for measuring workpiece thickness |
Country Status (4)
| Country | Link |
|---|---|
| US (1) | US11486694B2 (en) |
| JP (1) | JP2022097472A (en) |
| CN (1) | CN114646267A (en) |
| DE (1) | DE102021133260A1 (en) |
Citations (42)
| Publication number | Priority date | Publication date | Assignee | Title |
|---|---|---|---|---|
| US6542180B1 (en) | 2000-01-07 | 2003-04-01 | Mitutoyo Corporation | Systems and methods for adjusting lighting of a part based on a plurality of selected regions of an image of the part |
| US7030351B2 (en) | 2003-11-24 | 2006-04-18 | Mitutoyo Corporation | Systems and methods for rapidly automatically focusing a machine vision inspection system |
| US7324682B2 (en) | 2004-03-25 | 2008-01-29 | Mitutoyo Corporation | System and method for excluding extraneous features from inspection operations performed by a machine vision inspection system |
| US7443413B2 (en) | 2005-10-21 | 2008-10-28 | Hewlett-Packard Development Company, L.P. | Laser diode modulator and method of controlling laser diode modulator |
| US7454053B2 (en) | 2004-10-29 | 2008-11-18 | Mitutoyo Corporation | System and method for automatically recovering video tools in a vision system |
| US7477401B2 (en) | 2004-11-24 | 2009-01-13 | Tamar Technology, Inc. | Trench measurement system employing a chromatic confocal height sensor and a microscope |
| US7570795B2 (en) | 2006-07-18 | 2009-08-04 | Mitutoyo Corporation | Multi-region autofocus tool and mode |
| US7626705B2 (en) | 2007-03-30 | 2009-12-01 | Mitutoyo Corporation | Chromatic sensor lens configuration |
| US7627162B2 (en) | 2005-01-31 | 2009-12-01 | Mitutoyo Corporation | Enhanced video metrology tool |
| US20100097779A1 (en) | 2008-10-21 | 2010-04-22 | Mitutoyo Corporation | High intensity pulsed light source configurations |
| US20100284025A1 (en) | 2009-05-11 | 2010-11-11 | Mitutoyo Corporation | Intensity compensation for interchangeable chromatic point sensor components |
| US7990522B2 (en) | 2007-11-14 | 2011-08-02 | Mitutoyo Corporation | Dynamic compensation of chromatic point sensor intensity profile data selection |
| US8085295B2 (en) | 2007-10-26 | 2011-12-27 | Mitutoyo Corporation | Controllable micro light assembly |
| US8111938B2 (en) | 2008-12-23 | 2012-02-07 | Mitutoyo Corporation | System and method for fast approximate focus |
| US8111905B2 (en) | 2009-10-29 | 2012-02-07 | Mitutoyo Corporation | Autofocus video tool and method for precise dimensional inspection |
| US8142050B2 (en) | 2010-06-24 | 2012-03-27 | Mitutoyo Corporation | Phosphor wheel configuration for high intensity point source |
| US8194251B2 (en) | 2010-08-26 | 2012-06-05 | Mitutoyo Corporation | Method for operating a dual beam chromatic point sensor system for simultaneously measuring two surface regions |
| US8212997B1 (en) | 2011-02-23 | 2012-07-03 | Mitutoyo Corporation | Chromatic confocal point sensor optical pen with extended measuring range |
| US8317347B2 (en) | 2010-12-22 | 2012-11-27 | Mitutoyo Corporation | High intensity point source system for high spectral stability |
| US8456637B2 (en) | 2010-08-26 | 2013-06-04 | Mitutoyo Corporation | Multiple measuring point configuration for a chromatic point sensor |
| US8581162B2 (en) | 2009-12-08 | 2013-11-12 | Mitutoyo Corporation | Weighting surface fit points based on focus peak uncertainty |
| US8587772B2 (en) | 2011-12-21 | 2013-11-19 | Mitutoyo Corporation | Chromatic point sensor configuration including real time spectrum compensation |
| US8587789B2 (en) | 2011-12-21 | 2013-11-19 | Mitutoyo Corporation | Chromatic point sensor compensation including workpiece material effects |
| US8736817B2 (en) | 2012-05-25 | 2014-05-27 | Mitutoyo Corporation | Interchangeable chromatic range sensor probe for a coordinate measuring machine |
| US8773757B2 (en) | 2009-01-23 | 2014-07-08 | National Taipei University Of Technology | Slit-scan multi-wavelength confocal lens module and slit-scan microscopic system and method using the same |
| US8817240B2 (en) | 2012-05-25 | 2014-08-26 | Mitutoyo Corporation | Interchangeable optics configuration for a chromatic range sensor optical pen |
| US8860931B2 (en) | 2012-02-24 | 2014-10-14 | Mitutoyo Corporation | Chromatic range sensor including measurement reliability characterization |
| US8928874B2 (en) | 2012-02-24 | 2015-01-06 | Mitutoyo Corporation | Method for identifying abnormal spectral profiles measured by a chromatic confocal range sensor |
| US9060117B2 (en) | 2011-12-23 | 2015-06-16 | Mitutoyo Corporation | Points from focus operations using multiple light settings in a machine vision system |
| US9068822B2 (en) | 2013-07-03 | 2015-06-30 | Mitutoyo Corporation | Chromatic range sensor probe detachment sensor |
| US9143674B2 (en) | 2013-06-13 | 2015-09-22 | Mitutoyo Corporation | Machine vision inspection system and method for performing high-speed focus height measurement operations |
| US20160018213A1 (en) * | 2014-07-18 | 2016-01-21 | Mitutoyo Corporation | Thickness measurement apparatus and thickness measurement method |
| US9261351B1 (en) | 2015-03-04 | 2016-02-16 | Mitutoyo Corporation | Chromatic range sensor including high sensitivity measurement mode |
| US9329026B2 (en) | 2013-12-06 | 2016-05-03 | Mitutoyo Corporation | Hole-measurement systems and methods using a non-rotating chromatic point sensor (CPS) pen |
| US9651764B2 (en) | 2014-01-30 | 2017-05-16 | Mitutoyo Corporation | Interchangeable reflective assembly for a chromatic range sensor optical pen |
| US9774765B2 (en) | 2015-09-15 | 2017-09-26 | Mitutoyo Corporation | Chromatic aberration correction in imaging system including variable focal length lens |
| US9829312B2 (en) | 2015-07-09 | 2017-11-28 | Mituloyo Corporation | Chromatic confocal range sensor comprising a camera portion |
| US9830694B2 (en) | 2015-08-31 | 2017-11-28 | Mitutoyo Corporation | Multi-level image focus using a tunable lens in a machine vision inspection system |
| US9958266B2 (en) | 2015-07-09 | 2018-05-01 | Mitutoyo Corporation | Chromatic range sensor including dynamic intensity compensation function |
| US9958294B2 (en) | 2016-06-30 | 2018-05-01 | Mitutoyo Corporation | Absolute position encoder including scale with varying spatial characteristic and utilizing Fourier transform or other signal processing |
| US20180364028A1 (en) * | 2015-12-22 | 2018-12-20 | Unity Semiconductor | Device and method for measuring height in the presence of thin layers |
| US20220176513A1 (en) * | 2020-11-24 | 2022-06-09 | Ebara Corporation | Polishing method, polishing monitoring method and polishing monitoring apparatus for workpiece |
-
2020
- 2020-12-18 US US17/126,191 patent/US11486694B2/en active Active
-
2021
- 2021-12-15 DE DE102021133260.5A patent/DE102021133260A1/en active Pending
- 2021-12-16 CN CN202111540823.XA patent/CN114646267A/en active Pending
- 2021-12-20 JP JP2021205784A patent/JP2022097472A/en active Pending
Patent Citations (44)
| Publication number | Priority date | Publication date | Assignee | Title |
|---|---|---|---|---|
| US6542180B1 (en) | 2000-01-07 | 2003-04-01 | Mitutoyo Corporation | Systems and methods for adjusting lighting of a part based on a plurality of selected regions of an image of the part |
| US7030351B2 (en) | 2003-11-24 | 2006-04-18 | Mitutoyo Corporation | Systems and methods for rapidly automatically focusing a machine vision inspection system |
| US7324682B2 (en) | 2004-03-25 | 2008-01-29 | Mitutoyo Corporation | System and method for excluding extraneous features from inspection operations performed by a machine vision inspection system |
| US7454053B2 (en) | 2004-10-29 | 2008-11-18 | Mitutoyo Corporation | System and method for automatically recovering video tools in a vision system |
| US7477401B2 (en) | 2004-11-24 | 2009-01-13 | Tamar Technology, Inc. | Trench measurement system employing a chromatic confocal height sensor and a microscope |
| US7627162B2 (en) | 2005-01-31 | 2009-12-01 | Mitutoyo Corporation | Enhanced video metrology tool |
| US7443413B2 (en) | 2005-10-21 | 2008-10-28 | Hewlett-Packard Development Company, L.P. | Laser diode modulator and method of controlling laser diode modulator |
| US7570795B2 (en) | 2006-07-18 | 2009-08-04 | Mitutoyo Corporation | Multi-region autofocus tool and mode |
| US7626705B2 (en) | 2007-03-30 | 2009-12-01 | Mitutoyo Corporation | Chromatic sensor lens configuration |
| US8085295B2 (en) | 2007-10-26 | 2011-12-27 | Mitutoyo Corporation | Controllable micro light assembly |
| US7990522B2 (en) | 2007-11-14 | 2011-08-02 | Mitutoyo Corporation | Dynamic compensation of chromatic point sensor intensity profile data selection |
| US20100097779A1 (en) | 2008-10-21 | 2010-04-22 | Mitutoyo Corporation | High intensity pulsed light source configurations |
| US8111938B2 (en) | 2008-12-23 | 2012-02-07 | Mitutoyo Corporation | System and method for fast approximate focus |
| US8773757B2 (en) | 2009-01-23 | 2014-07-08 | National Taipei University Of Technology | Slit-scan multi-wavelength confocal lens module and slit-scan microscopic system and method using the same |
| US20100284025A1 (en) | 2009-05-11 | 2010-11-11 | Mitutoyo Corporation | Intensity compensation for interchangeable chromatic point sensor components |
| US7876456B2 (en) * | 2009-05-11 | 2011-01-25 | Mitutoyo Corporation | Intensity compensation for interchangeable chromatic point sensor components |
| US8111905B2 (en) | 2009-10-29 | 2012-02-07 | Mitutoyo Corporation | Autofocus video tool and method for precise dimensional inspection |
| US8581162B2 (en) | 2009-12-08 | 2013-11-12 | Mitutoyo Corporation | Weighting surface fit points based on focus peak uncertainty |
| US8142050B2 (en) | 2010-06-24 | 2012-03-27 | Mitutoyo Corporation | Phosphor wheel configuration for high intensity point source |
| US8194251B2 (en) | 2010-08-26 | 2012-06-05 | Mitutoyo Corporation | Method for operating a dual beam chromatic point sensor system for simultaneously measuring two surface regions |
| US8456637B2 (en) | 2010-08-26 | 2013-06-04 | Mitutoyo Corporation | Multiple measuring point configuration for a chromatic point sensor |
| US8317347B2 (en) | 2010-12-22 | 2012-11-27 | Mitutoyo Corporation | High intensity point source system for high spectral stability |
| US8212997B1 (en) | 2011-02-23 | 2012-07-03 | Mitutoyo Corporation | Chromatic confocal point sensor optical pen with extended measuring range |
| US8587772B2 (en) | 2011-12-21 | 2013-11-19 | Mitutoyo Corporation | Chromatic point sensor configuration including real time spectrum compensation |
| US8587789B2 (en) | 2011-12-21 | 2013-11-19 | Mitutoyo Corporation | Chromatic point sensor compensation including workpiece material effects |
| US9060117B2 (en) | 2011-12-23 | 2015-06-16 | Mitutoyo Corporation | Points from focus operations using multiple light settings in a machine vision system |
| US8860931B2 (en) | 2012-02-24 | 2014-10-14 | Mitutoyo Corporation | Chromatic range sensor including measurement reliability characterization |
| US8928874B2 (en) | 2012-02-24 | 2015-01-06 | Mitutoyo Corporation | Method for identifying abnormal spectral profiles measured by a chromatic confocal range sensor |
| US8817240B2 (en) | 2012-05-25 | 2014-08-26 | Mitutoyo Corporation | Interchangeable optics configuration for a chromatic range sensor optical pen |
| US9115982B2 (en) | 2012-05-25 | 2015-08-25 | Mitutoyo Corporation | Interchangeable chromatic range sensor probe for a coordinate measuring machine |
| US8736817B2 (en) | 2012-05-25 | 2014-05-27 | Mitutoyo Corporation | Interchangeable chromatic range sensor probe for a coordinate measuring machine |
| US9143674B2 (en) | 2013-06-13 | 2015-09-22 | Mitutoyo Corporation | Machine vision inspection system and method for performing high-speed focus height measurement operations |
| US9068822B2 (en) | 2013-07-03 | 2015-06-30 | Mitutoyo Corporation | Chromatic range sensor probe detachment sensor |
| US9329026B2 (en) | 2013-12-06 | 2016-05-03 | Mitutoyo Corporation | Hole-measurement systems and methods using a non-rotating chromatic point sensor (CPS) pen |
| US9651764B2 (en) | 2014-01-30 | 2017-05-16 | Mitutoyo Corporation | Interchangeable reflective assembly for a chromatic range sensor optical pen |
| US20160018213A1 (en) * | 2014-07-18 | 2016-01-21 | Mitutoyo Corporation | Thickness measurement apparatus and thickness measurement method |
| US9261351B1 (en) | 2015-03-04 | 2016-02-16 | Mitutoyo Corporation | Chromatic range sensor including high sensitivity measurement mode |
| US9829312B2 (en) | 2015-07-09 | 2017-11-28 | Mituloyo Corporation | Chromatic confocal range sensor comprising a camera portion |
| US9958266B2 (en) | 2015-07-09 | 2018-05-01 | Mitutoyo Corporation | Chromatic range sensor including dynamic intensity compensation function |
| US9830694B2 (en) | 2015-08-31 | 2017-11-28 | Mitutoyo Corporation | Multi-level image focus using a tunable lens in a machine vision inspection system |
| US9774765B2 (en) | 2015-09-15 | 2017-09-26 | Mitutoyo Corporation | Chromatic aberration correction in imaging system including variable focal length lens |
| US20180364028A1 (en) * | 2015-12-22 | 2018-12-20 | Unity Semiconductor | Device and method for measuring height in the presence of thin layers |
| US9958294B2 (en) | 2016-06-30 | 2018-05-01 | Mitutoyo Corporation | Absolute position encoder including scale with varying spatial characteristic and utilizing Fourier transform or other signal processing |
| US20220176513A1 (en) * | 2020-11-24 | 2022-06-09 | Ebara Corporation | Polishing method, polishing monitoring method and polishing monitoring apparatus for workpiece |
Non-Patent Citations (5)
| Title |
|---|
| Chanbai, "Development of a Confocal Line Scanning Sensor," Dissertation, University of Siegen, Oct. 22, 2012, 171 pages. (English text with German introduction). |
| Kagawa et al., "Multi-beam confocal microscopy based on a custom image sensor with focal-plane pinhole array effect," Optics Express 21(2), pp. 1417-1429 Jan. 28, 2013, (14 pages). |
| Mitutoyo Corporation & Micro Encoder Inc. "QVPAK® 3D CNC Vision Measuring Machine," User's Guide, Version 7, 2003, 329 pages. |
| Molesini et al., "Pseudocolor Effects of Longitudinal Chromatic Aberration," J. Optics (Paris), 1986, 17(6), pp. 279-282 (4 pages). |
| O' Haver, Tom. "Fourier Deconvolution," <https://terpconnect.umd.edu/˜toh/spectrum/Deconvolution.html>, available 2008, accessed Jul. 18, 2022. (Year: 2008). * |
Also Published As
| Publication number | Publication date |
|---|---|
| US20220196388A1 (en) | 2022-06-23 |
| DE102021133260A1 (en) | 2022-06-23 |
| JP2022097472A (en) | 2022-06-30 |
| CN114646267A (en) | 2022-06-21 |
Similar Documents
| Publication | Publication Date | Title |
|---|---|---|
| JP6126375B2 (en) | Operation method of chromatic point sensor system | |
| US8928874B2 (en) | Method for identifying abnormal spectral profiles measured by a chromatic confocal range sensor | |
| US7990522B2 (en) | Dynamic compensation of chromatic point sensor intensity profile data selection | |
| US8587772B2 (en) | Chromatic point sensor configuration including real time spectrum compensation | |
| US8860931B2 (en) | Chromatic range sensor including measurement reliability characterization | |
| US9958266B2 (en) | Chromatic range sensor including dynamic intensity compensation function | |
| US8947673B2 (en) | Estimating thickness based on number of peaks between two peaks in scanning white light interferometry | |
| US7876456B2 (en) | Intensity compensation for interchangeable chromatic point sensor components | |
| US9261351B1 (en) | Chromatic range sensor including high sensitivity measurement mode | |
| US20160069672A1 (en) | Surface roughness measurement device | |
| US11486694B2 (en) | Chromatic range sensor system for measuring workpiece thickness | |
| EP1677093B1 (en) | Near-field film-thickness measurement apparatus | |
| CN111998782A (en) | Optical measuring device and method | |
| Weng et al. | Measuring the thickness of transparent objects using a confocal displacement sensor | |
| US20230113768A1 (en) | Chromatic range sensor system with spherical calibration object and method | |
| KR102596779B1 (en) | Method and Apparatus for measuring optical property characterization of 3D printing structures with micro-optic Mach-Zehnder interferometer | |
| CN109997010A (en) | For optimizing the method and apparatus of the optical property of interferometer |
Legal Events
| Date | Code | Title | Description |
|---|---|---|---|
| FEPP | Fee payment procedure |
Free format text: ENTITY STATUS SET TO UNDISCOUNTED (ORIGINAL EVENT CODE: BIG.); ENTITY STATUS OF PATENT OWNER: LARGE ENTITY |
|
| AS | Assignment |
Owner name: MITUTOYO CORPORATION, JAPAN Free format text: ASSIGNMENT OF ASSIGNORS INTEREST;ASSIGNOR:LAMAN, NORMAN;REEL/FRAME:057069/0811 Effective date: 20210709 |
|
| STPP | Information on status: patent application and granting procedure in general |
Free format text: DOCKETED NEW CASE - READY FOR EXAMINATION |
|
| STPP | Information on status: patent application and granting procedure in general |
Free format text: NOTICE OF ALLOWANCE MAILED -- APPLICATION RECEIVED IN OFFICE OF PUBLICATIONS |
|
| STPP | Information on status: patent application and granting procedure in general |
Free format text: PUBLICATIONS -- ISSUE FEE PAYMENT RECEIVED |
|
| STPP | Information on status: patent application and granting procedure in general |
Free format text: PUBLICATIONS -- ISSUE FEE PAYMENT VERIFIED |
|
| STCF | Information on status: patent grant |
Free format text: PATENTED CASE |