US11372875B2 - Using a single-entry access point to archive data in and out of an electronic document review and reporting system - Google Patents
Using a single-entry access point to archive data in and out of an electronic document review and reporting system Download PDFInfo
- Publication number
- US11372875B2 US11372875B2 US16/355,291 US201916355291A US11372875B2 US 11372875 B2 US11372875 B2 US 11372875B2 US 201916355291 A US201916355291 A US 201916355291A US 11372875 B2 US11372875 B2 US 11372875B2
- Authority
- US
- United States
- Prior art keywords
- data
- reporting
- access system
- client device
- request
- Prior art date
- Legal status (The legal status is an assumption and is not a legal conclusion. Google has not performed a legal analysis and makes no representation as to the accuracy of the status listed.)
- Active
Links
Images


Classifications
-
- G—PHYSICS
- G06—COMPUTING; CALCULATING OR COUNTING
- G06F—ELECTRIC DIGITAL DATA PROCESSING
- G06F16/00—Information retrieval; Database structures therefor; File system structures therefor
- G06F16/20—Information retrieval; Database structures therefor; File system structures therefor of structured data, e.g. relational data
- G06F16/24—Querying
- G06F16/248—Presentation of query results
-
- G—PHYSICS
- G06—COMPUTING; CALCULATING OR COUNTING
- G06F—ELECTRIC DIGITAL DATA PROCESSING
- G06F16/00—Information retrieval; Database structures therefor; File system structures therefor
- G06F16/20—Information retrieval; Database structures therefor; File system structures therefor of structured data, e.g. relational data
- G06F16/25—Integrating or interfacing systems involving database management systems
- G06F16/252—Integrating or interfacing systems involving database management systems between a Database Management System and a front-end application
-
- G—PHYSICS
- G06—COMPUTING; CALCULATING OR COUNTING
- G06F—ELECTRIC DIGITAL DATA PROCESSING
- G06F3/00—Input arrangements for transferring data to be processed into a form capable of being handled by the computer; Output arrangements for transferring data from processing unit to output unit, e.g. interface arrangements
- G06F3/01—Input arrangements or combined input and output arrangements for interaction between user and computer
- G06F3/048—Interaction techniques based on graphical user interfaces [GUI]
- G06F3/0484—Interaction techniques based on graphical user interfaces [GUI] for the control of specific functions or operations, e.g. selecting or manipulating an object, an image or a displayed text element, setting a parameter value or selecting a range
Definitions
- Embodiments relate generally to an approach for providing electronic document retrieval, reviewing, and reporting.
- An approach is provided for using a single-entry access point for client devices to archive, retrieve, review and report data stored in a document review and reporting system.
- Examples of the document review and reporting systems include a full-feature RelativityTM e-Discovery platform that has extensive and robust capabilities for storing, reviewing, sorting and searching data, but that, due to its complexity, may be difficult to navigate or use.
- a data access system may be implemented in a computer-based system such as a cloud computer-based system or a main-frame system.
- Examples of the data access systems include an AcumenTM system developed by the Ricoh Corporation.
- a data access system may be configured as an advanced proxy or an advanced portal configured to retrieve, from a document review and reporting system, data requested by a client device.
- the data access system may make a copy of the data retrieved from the document review and reporting system and store the copy in storage devices that are local to the data access system. Because the requested data is usually small in size, accessing the requested data from the data access system is more efficient and faster than accessing a huge repository of data stored at a document review and reporting system.
- an approach uses a data access system to facilitate reviewing, reporting and archiving of data quickly and efficiently. Because the data is stored locally with respect to the data access system, accessing the data from the data access system is more efficient and faster than accessing the data from an external document review and reporting system.
- a data access system may be configured to receive requests, from client devices, for data that is stored either at a document review and reporting system or at a local storage unit of the data access system.
- the data access system may be configured to efficiently process the requests, quickly retrieve the requested data, and provide the requested data to the client devices relatively fast.
- a data access system may be configured to receive requests from client devices for reviewing and reporting data.
- the data access system may receive requests to provide statistical and performance-related information about individual data-reviewers, or groups of reviewers, who reviewed electronic documents that pertained to particular legal matters.
- the data access system may receive requests for providing performance statistics determined for all reviewers who reviewed evidence documents pertaining to particular matters and on particular days.
- the requests for the performance statistics may also include the requests for review analysis data, such as review progress information that may include document review rates, review ratios per reviewers, total counts of the documents reviewed by reviewers, counts of documents reviewed by reviewers hourly, counts of errors made by reviewers, and the like.
- a data access system is configured to receive requests for providing information about global and local trends observed in reviewing e-Discovery data, individual projects and groups of projects. For example, the data access system may receive requests for providing daily, monthly and/or yearly statistical information for the ongoing, completed or partially completed review projects.
- a data access system may retrieve pertinent data from either a local storage unit or a document review and reporting system, and based on the retrieved data, determine the requested performance-related and/or statistical information. The resulting information is transmitted to a client device that requested the information.
- a client device may generate a graphical user interface and use the graphical user interface to generate one or more graphs and charts to graphically represent the received information.
- the client device may use the graphical user interface to display the graphs and charts on a computer display device of the client device.
- a data access system may receive additional requests for additional information from client devices. In response to the requests, the data access system may determine responses based on the locally stored data and transmit the responses to the client devices.
- FIG. 1A is a block diagram that depicts an example arrangement for using a single-entry access point to archive data in and out of an electronic document review and reporting system.
- FIG. 1B is a block diagram that depicts an example arrangement for retrieving, reporting and querying data using a single-entry access point system.
- FIG. 2 is an example time chart for retrieving, reporting and querying data using a single-entry access point system.
- FIG. 3 is an example flow chart for retrieving, reporting and querying data using a single-entry access point system.
- FIG. 4A is a block diagram that depicts example requests for data.
- FIG. 4B is a block diagram that depicts example requests for review analysis data.
- FIG. 4C is a block diagram that depicts example requests for reporting data.
- FIG. 5 is an example graph depicting review analysis data.
- FIG. 6 is an example graph depicting document review rate data.
- FIG. 7 is an example pie-chart depicting document review ratio data.
- FIG. 8 is an example pie-chart depicting total documents reviewed ratio data.
- FIG. 9 is an example graph depicting user document review rate data.
- FIG. 10 is an example graph depicting reviewer documents reviewed hourly data.
- FIG. 11 is an example graph depicting average native size review rate data.
- FIG. 12 is an example graph depicting review ratio data.
- FIG. 13 is an example graph depicting total documents reviewed data.
- FIG. 14 is an example graph depicting user document review rate data.
- FIG. 15 is an example graph depicting reviewer documents reviewed hourly data.
- FIG. 16 is an example pie-chart depicting total native size reviewed data.
- FIG. 17 is an example pie-chart depicting total text size reviewed data.
- FIG. 18 is an example graph depicting review progress data.
- FIG. 19 is an example graph depicting review report data.
- FIG. 20 is an example graph depicting review session data.
- FIG. 21 is an example graph depicting files size trend data.
- FIG. 22 is an example graph depicting environment size trend data.
- FIG. 23 is an example graph depicting indexes size trend data.
- FIG. 24 is an example graph depicting database size trend data.
- FIG. 25 is an example graph depicting modified indexes size trend data.
- FIG. 26 is an example graph depicting modified environment size trend data.
- FIG. 27 is an example graph depicting modified indexes size trend data.
- FIG. 28 is an example graph depicting modified database size trend data.
- FIG. 29 is an example graph depicting document growth trend data.
- FIG. 30 is an example graph depicting natives trend data.
- FIG. 31 is an example graph depicting files growth trend data.
- FIG. 32 is an example pie-chart depicting top workspaces files data.
- FIG. 33 is an example pie-chart depicting top workspaces-databases data.
- FIG. 34 is an example pie-chart depicting top workspaces sizes data.
- FIG. 35 is an example pie-chart depicting top workspaces-databases data.
- FIG. 36 is an example graph depicting daily statistics data.
- FIG. 37 is an example graph depicting monthly statistics data.
- FIG. 38 is an example executive summary graph.
- FIG. 39 is an example executive summary bar-graph.
- FIG. 40 is a block diagram of a computer system on which embodiments of the approach may be implemented.
- An approach is provided for using a single-entry access point to archive, retrieve, review and report data stored in a document review and reporting system.
- the approach uses a data access system to facilitate the single-entry access point to the data stored in the document review and reporting system, to store the accessed data locally at the data access system, and to facilitate reviewing, reporting and archiving of the data stored locally at the data access system.
- a data access system may be configured with interfaces for accessing data stored at a document review and reporting system and interfaces for accessing data stored at the data access system.
- the data access system may also be configured with interfaces for providing the data retrieved from either the document review and reporting system or the local storage to client devices.
- a data access system may be configured to receive requests from client devices for data.
- the data access system may receive requests to provide statistical and performance-related information about individual reviewers, or groups of reviewers, who reviewed electronic documents that pertained to various legal matters and that have been stored in the document review and reporting system.
- the data access system may also receive reporting requests for providing information about global and local trends in review process of individual projects and/or group of projects, and/or providing daily, monthly and/or yearly statistical information for the ongoing, completed or partially completed review projects.
- a data access system may be configured to process requests received from client devices, determine responses to requests, and provide the responses to the client devices.
- FIG. 1A is a block diagram that depicts an example arrangement for using a single-entry access point to archive data in and out of an electronic document review and reporting system. Embodiments are not limited to the example arrangement 100 depicted in FIG. 1A and other example arrangements are described hereinafter.
- arrangement 100 includes a data access system 110 , a document review and reporting system 120 , and one or more client devices 152 - 154 .
- Data access system 110 may be configured to receive, from client devices 152 - 154 , requests for review analysis data and/or reporting data.
- Data access system 110 may be configured to retrieve the requested data from document review and reporting system 120 , generate, based on the retrieved data, responses to the requests, and provide the responses to client devices 152 - 154 so that client devices 152 - 154 may display the responses using, for example, their own graphical user interfaces.
- data access system 110 may communicate with document review and reporting system 120 via a communications link 187 . Furthermore, data access system 110 may communicate with a client device 152 via a communications link 189 and communicate with client device 154 via a communications link 188 . Communications links 187 , 189 , 188 may be established across one or more computer networks such as a network 140 .
- Network 140 may include any number of computer-based networks, including one or more Local Area Networks (“LANs”), Wide Area Networks (“WANs”), Ethernet networks, Internet networks, satellite networks, or wireless networks.
- LANs Local Area Networks
- WANs Wide Area Networks
- Ethernet networks Internet networks
- satellite networks satellite networks
- wireless networks wireless networks.
- the elements depicted in arrangement 100 may also have direct communications links, configurations and types of which may vary and depend upon a particular implementation.
- Data access system 110 may be configured to provide, to client devices 152 - 154 , a single-entry access point to archive data in and out of document review and reporting system 120 .
- data access system 110 is configured to communicate with document review and reporting system 120 and one or more client devices 152 - 154 . The communications may be facilitated via one or more computer networks 140 .
- Configurations of data access system 110 may vary.
- data access system 110 includes a manager module 114 , a client interface 138 , a backend interface 132 , and a storage unit configured to store electronic data 116 .
- data access system 110 may include additional elements.
- Manager 114 of data access system 110 may be configured to establish communications connections with document review and reporting system 120 , and with one or more client devices 152 - 154 .
- the communications with document review and reporting system 120 may be established using backend interface 132
- communications with client devices 152 - 154 may be established using interface 138 .
- Manager 114 of data access system 110 may be also configured to receive requests from devices 152 - 154 , process the requests, retrieve the requested data, generate responses to the requests based on the retrieved data, and transmit the responses to client devices 152 - 154 .
- Document review and reporting system 120 may be configured to store and provide data including, for example, e-Discovery related data. It may also be configured to provide enhanced and robust data collection capabilities, data review capabilities, data reporting capability, and search capabilities.
- document review and reporting system 120 includes an interface 122 , a manager 124 , and one or more storage units for storing electronic document data 126 .
- Document review and reporting system 120 may be equipped with a console (not depicted in FIG. 1A ) for entering data, querying the stored data, and receiving the commands for generating review summaries and reporting data.
- Document review and reporting system 120 may be implemented by hardware, computer software, or any combination of hardware and computer software configured to manage electronic documents.
- One non-limiting example implementation of document review and reporting system 120 is a full-feature, RelativityTM e-Discovery management platform.
- Document review and reporting system 120 may be configured to store electronic document data 126 .
- Document data 126 may be any type of electronic data and may be stored in any form, including structured data and unstructured data. The data may be stored in any of the native formats, image formats, document formats, and the like.
- a native document is a document that is in its original, non-translated, not converted version or format. Examples of electronic document data 126 include, without limitation, word processing documents, image files, emails, spreadsheet documents, source code files, and the like.
- document review and reporting system 120 is configured as an interactive system for storing data and supporting reviews of the data, an analysis of the data, processing of the data, searching of the data, and archiving of the data.
- the document review and reporting system may be configured to support the document tagging, document tracking, and document editing.
- the document review and reporting system may be implemented in a cloud computer-based system, a main-frame system, one or more networks of computer servers, and the like.
- Client devices 152 - 154 may be configured to generate requests for data, transmitting the requests to data access system 110 , receiving responses to the requests, and providing the responses to users of client devices 152 - 154 .
- Client devices 152 - 154 may be any type of client devices that can be used to communicate with data access system 110 .
- Client device 152 may be equipped with an application programming interface (“API”) 152 A, a web browser application (not depicted in FIG. 1A ), and/or any other application configured to receive, request, and search, or browse data.
- client device 154 may be configured with an API 154 A, a web browser application (not depicted in FIG. 1A ), and/or any other application configured to receive, request, and search, or browse data.
- Client device 152 / 154 may be any type of computer device, and the type of the computer device depends upon a particular implementation.
- Example client devices include, without limitation, personal or laptop computers, workstations, tablet computers, personal digital assistants (“PDAs”) and smart phones.
- Client devices 152 - 154 may include other elements, such as user interfaces, computer processors and memory units, including volatile memory and non-volatile memory.
- FIG. 1B is a block diagram that depicts an example arrangement for retrieving, reporting and querying data.
- the arrangement depicted in FIG. 1B shows communications exchanged via communications connections established between data access system 110 , document review and reporting system 120 , and client device 152 .
- client device 152 generates a data request 170 , referred to as (1).
- Data request 170 may be any type of request for performance/statistical information about reviewers, reviewing processes, reviewed documents, reviewed matters, as well as requests for reports on global trends observed in reviewing processes, statistical information about the pending and/or processes matters, executive summaries, and the like.
- Data request 170 may include, for example, a specification of type of data that is requested, a workspace for which the data request pertains, a time period that describes a range of the data that is requested, or any other identification of the requested data.
- Data request 170 may be communicated from API 152 A of client device 152 to manager 114 of data access system 110 .
- manager 114 of data access system 110 Upon receiving data request 170 , manager 114 of data access system 110 processes the request and generates a data request 171 (referred to as (2)). Data request 171 is sent to document review and reporting system 120 .
- document review and reporting system 120 Upon receiving data request 171 , document review and reporting system 120 processes the request, determines the data that is requested, and retrieves that requested data from document review and reporting system 120 . Furthermore, document review and reporting system 120 transmits requested data 126 A as requested data 172 (referred to as (3)) to data access system 110 .
- Data access system 110 stores the requested data as requested data 126 AA, which is a portion of electronic data 116 in data access system 110 .
- GUI graphical user interface
- data-specific request 174 may include a request for additional data for a particular data point depicted or included in a graph displayed using GUI 152 AA.
- manager 114 may process data-specific request 174 , determine additional data for the particular data point, and return a data-specific response 175 (referred to as (6)) to client device 152 .
- Manager 114 may determine the additional data for the particular data point based on requested data 126 AA stored locally at data access system 110 or may determine the additional data by retrieving the additional data from document review and reporting system 120 .
- the process of exchanging requests and responses between client device 152 and data access system 110 may be repeated multiple times and may involve requesting and obtaining additional information. It may also involve obtaining different types of information either directly from data access system 110 , or indirectly from document review and reporting system 120 , or both.
- FIG. 2 is an example time chart for retrieving, reporting and querying data using a single-entry access point system.
- the depicted example illustrates communications exchanged between client device 152 , data access system 110 , and document review and reporting system 120 .
- client device 152 In step 202 , client device 152 generates a request for data.
- the request may pertain to requesting performance/statistical information about reviewers, reviewing processes, reviewed documents, reviewed matters, as well as requests for reports on global trends in reviewing processes, statistical information about the pending and/or processes matters, executive summaries, and the like.
- client device 152 transmits the request for data to data access system 110 . This may be facilitated by sending an API request, a command, or a hyperlink pointing to a file containing the request.
- step 206 data access system 110 receives the request from client device 152 , parses the request to determine a type of data that is requested, a location of the requested data, and the like. If the requested data is not stored locally, then data access system 110 transmits the request for data from data access system 110 to document review and reporting system 120 to retrieve the requested data from document review and reporting system 120 and to copy the retrieved data to a local storage unit.
- document review and reporting system 120 retrieves the requested data from document review and reporting system. This may include retrieving data from a cloud computer-based system maintained by document review and reporting system 120 , issuing a query for the requested data to a data repository maintained by document review and reporting system 120 , and the like.
- document review and reporting system 120 transmits the requested data from document review and reporting system 120 to data access system 110 .
- data access system 110 may store the data locally. For example, data access system 110 may store the requested data in a storage unit that is local with respect to data access system 110 .
- step 212 data access system 110 transmits the requested data from data access system 110 to client device 152 .
- client device 152 receives the requested data, which now may be referred to as received data.
- client device 152 may generate a GUI, and display the received data using the GUI.
- the received data may be displayed as charts, graphs and other graphical representations. For example, if the received data includes statistical information about counts of documents that have been reviewed by certain reviewers and within a certain time period, then the GUI may present the received data using one or more graphs showing plots of counts of documents that had been reviewed by each of the reviewer within a given time period, showing plots of reviewing rates for each of the reviewer within a given time period, showing plots of relative efficiency of each of the reviewer, and the like.
- the user may decide to request additional data or request new data. For example, the user may generate, in step 216 , a data specific request for providing additional information for a particular data point of a plurality of data points included in a graph displayed using the GUI.
- An example of data-specific request may be a request for additional information associated with a particular data point shown in one of the graphs provided as part of the received data.
- step 218 client device 152 transmits a data-specific request from client device 152 to data access system 110 .
- data access system 110 receives the data-specific request and obtains additional data in response to receiving the data-specific request.
- data access system 110 may, for example, access the requested data stored locally at the data access system and determine additional information for the particular data point.
- data access system 110 may access document review and reporting system 120 to retrieve the additional information for the particular data point from document review and reporting system.
- the additional information associated with the particular data point may indicate some additional details pertaining to the particular data point, such an exact efficiency rate for a particular reviewer, an exact date/time when a particular reviewer completed his/her task, an exact count of reviewer that working on a particular reviewing project on a particular date/time, and the like.
- step 222 data access system 110 transmits the additional data to client device 152 .
- client device 152 receives the additional data, updates the GUI, and displays the additional data using the updated GUI. For example, if the additional data provides some additional details about the particular data point, then, upon receiving the additional data, client device 152 may refine the depiction of the received data in the GUI by overlaying the additional data over the previously displayed received data or may add additional graphical elements depicting the additional data to the already displayed received data.
- client device 152 may proceed to step 216 as shown by an arrow labeled with 226 or may proceed to step 202 as show with an arrow labeled with 228 .
- FIG. 3 is an example flow chart for retrieving, reporting and querying data using a single-entry access point system.
- the depicted steps are executed by a data access system, such as data access system 110 shown in FIG. 1A .
- the depicted steps may be executed by a manager, such as manager 114 , of data access system 110 .
- a data access system receives from a client device a request for data.
- the request may specify a type of data that is requested, a location of the requested data, a manner in which the requested data is to be presented, and the like.
- the request may specify, for example, a workspace for which the data is requested, a reviewer or a group of reviewers whose performance and efficiency data is requested, a type of report or a time period for which the report is requested, and so forth.
- step 304 the data access system transmits the request and the specification of the requested data to a document review and reporting system.
- step 306 the data access system tests whether the data access system received the requested data. If the requested data is received, then the data access system proceeds to step 308 . Otherwise, the data access system awaits the requested data in step 306 or awaits another request from the client device in step 302 .
- step 308 the data access system processes the requested data to conform them to the type, format, and so forth, requested by a user of the client device. Then, the data access system transmits the received and conformed data to the client device. In addition, the data access system stores the received data locally. For example, the data access system may store the received data in a local storage unit.
- step 310 the data access system tests whether it has received a request for additional data. If such a request has been received, then the data access system proceeds to step 312 . Otherwise, the data access system awaits a request in step 310 or awaits a request for new data in step 302 .
- the data access system retrieves the additional data. If the requested additional data has been already stored locally, then the data access system may retrieve the data from a local storage; otherwise, the data access system may retrieve the additional data from the document review and reporting system.
- the additional data is retrieved in response to receiving a request for additional data. If the request for the additional data pertained to additional information for a particular data point of the data point displayed in one of the charts shown in the GUI, then, in step 312 , the data access system may retrieve the additional data for that particular data point and transmit the additional data for the particular data point to the client device.
- step 314 the data access system tests whether it has received another request, such as an interactive request.
- An interactive request may include a request for additional information for a given chart, additional information for a different chart, a request for a new chart, or a request for another report, another review data, or an executive summary data. If such a request is received, then the data access system proceeds to performing step 316 . Otherwise, the data access system awaits a new request in step 314 or in step 310 or in step 302 .
- step 316 the data access system obtains a response to the interactive request and transmits the response to the client device causing the client device to generate or updating the GUI and displaying the updated response data using the GUI.
- FIG. 4A is a block diagram that depicts example requests for data.
- a request for data 402 includes a specification of the type of data that is requested.
- request for data 402 may include a specification 404 , which may specify a workspace for which the data is requested, a user or a group of users for whom the data is requested, a reviewer or a group of reviewers for whom the data is requested, error rates made by reviewers for projects for which the data is requested, and so forth.
- FIG. 4B is a block diagram that depicts example requests for review analysis data.
- a request for review analysis data 406 may include requests for performance and statistical data pertaining to efficiency, completeness, accuracy, and so forth, of work performed by reviewers, group of reviewers, users, groups of users, and so forth.
- request for review analysis data 406 is a request for indicators of the quality of reviews performed by reviewers who review e-Discovery data.
- the indicators may capture performance data pertaining to reviews of the e-Discovery data by individual reviewers, updates per project, updates per groups of reviewers and so forth.
- request for review analysis data 406 includes a specification 408 that specifies whether the request is for any one or more of: progress data, data pertaining to the hourly summaries performed by reviewers, report data pertaining to reviewed documents, sessions data pertaining to beginning and end of the sessions, errors made during the review sessions, summaries of jobs performed and/or currently running or performed by the reviewers, and so forth.
- specification 408 specifies a request for progress data.
- Examples of graphs and charts that may be provided or generated in response to such a request include charts for a review progress, charts depicting document review rates, charts depicting review ratios per reviewers, charts depicting total documents reviewed by reviewers, user document review rates, charts pertaining to document reviewed hourly, charts pertaining or depicting average native sizes of reviewed documents and the reviews rate, charts depicting total native sizes of reviewed documents and the reviews rates, charts depicting total text sizes reviewed, and so forth.
- specification 408 is a request for data indicating hourly summaries per reviewers including rates, charts for text review rates, charts for native review rates, charts for total text reviewed, charts showing error counts, and so forth.
- specification 408 is a request for report data pertaining to reviewers and/or review processes. This may include a request for data for generating charts per reviewer including counts of reviewer documents, charts for document review rates, charts for text review rates, charts for native review rates, charts for total native summary, and so forth.
- specification 408 includes a request for data pertaining to reviewing sessions data.
- the reviewing sessions data may be used to generate charts per matters and/or per environment identifiers, charts depicting the session start times and the session end times, charts depicting session errors, charts depicting session lengths, charts depicting user artifacts identifiers, charts depicting reviewers' names, charts depicting users/reviewers addresses, charts depicting case artifacts identifiers, and so forth.
- specification 408 includes a request for jobs data.
- the jobs data may be used to generate charts such as summary charts of currently running jobs, jobs completed, jobs ready to be performed, and so forth.
- FIG. 4C is a block diagram that depicts example requests for reporting data.
- a request for reporting data 422 may be any type of request for data that can be used to generate reports pertaining to review processes, statistical reviews, and so forth. This may include reports pertaining to review processes of e-Discovery data, and the like.
- a specification of the requested reported data 424 comprises requests for global trends, statistical information, executive summary, and so forth.
- specification 424 for global trends is a request for providing data that can be used to generate charts for selected environments.
- the charts may include review reports for the environments, such as workspaces, projects, matters, cases, and the like.
- the charts may also include depictions of start dates of the reviews, end dates of the reviews, and so forth.
- the requested data may be used to generate a file size trend chart, an environment size trend chart, an indexes size trend chart, a database size trend chart, a document growth trend chart, a native trend chart, an image trend chart, a production images trend chart, a files growth trend chart, a workspace growth trend chart, and so forth.
- specification 424 is a request for statistical data pertaining to data review processes.
- the statistical data may be used to generate charts depicting daily statistics, monthly statistics, top workspace statistics, document review progress statistics, and so forth.
- specification 424 is a request for an executive summary.
- the executive summary may provide data that can be used to generate charts depicting one-line representations of monthly total size of reviewed documents, active-archived-deleted documents in the past 30 days or almost deleted, near-deleted, tested, and so forth.
- the executive summary may also include requests for data that can be used to generate charts for depicting block representations of monthly total sizes of reviewed documents. It may also include active-archived-deleted matters in the 30 days, deleted matters, nearline, tested matters, and so forth. Furthermore, it may also include requests for data to be used to generate monthly new cases reports, monthly new case reports in gigabyte sizes, and monthly total users reports, and so forth.
- FIG. 5 is an example graph depicting review analysis data.
- FIG. 5 includes a two-dimensional chart labeled by a Y axis 501 and a X axis 502 , where Y axis 501 shows a number of documents that have been reviewed, while X axis 502 is a time axis, and shows a range labeled by dates and times.
- the plot shows the number of documents being reviewed on a given day.
- a user of a client device may request additional data. For example, a user may use a pointing device, and position that pointing device to the plot, and upon selecting a particular point 503 on the plot, the client device may generate a request for additional data for the particular data point. That request may be communicated to an access data system, and the additional data may be retrieved from a local storage by the access data system and provided to the user.
- the additional data shows a total count of documents that have been reviewed on a given day at a given time.
- FIG. 6 is an example graph depicting document review rate data.
- the chart is a two-dimensional chart showing along a Y axis 504 a document review rate within last seven days and showing along a X axis 505 the time range labeled by the date, and the time of day.
- the chart is a plot, and a user may request additional information by pointing a pointing device to a particular data point 506 on a plot and requesting additional data such as data indicating a count of documents reviewed per hour on a given day and on a given time.
- FIG. 7 is an example pie-chart depicting document review ratio data.
- FIG. 7 shows review ratios for two groups of documents. The first group includes the documents that have been already reviewed. The second group includes the documents that have not been reviewed. The pie-chart in FIG. 7 shows that pretty much all documents have been already reviewed, and only very few documents have not been reviewed.
- FIG. 8 is an example pie-chart depicting total documents reviewed ratio data.
- a pie-chart shows a total document review share of the top 15 reviewers and performed by the top 15 reviewers.
- Each reviewer is identified by the reviewer's identifier and the count of document the reviewer reviewed.
- the data is color-coded or color-shaded according to a certain color scheme.
- FIG. 8 shows a relative ratio between the documents reviewed by the individual reviewers.
- FIG. 9 is an example graph depicting user document review rate data.
- the plot illustrates the relationship between the review rates (a Y axis 507 ) and individual reviewers plotted against a time axis 508 labeled by dates and times.
- a user may request additional data by pointing to a data point 509 and requesting additional data for that particular data point.
- FIG. 10 is an example graph depicting counts of document reviewed hourly data. Specifically, FIG. 10 depicts several plots, each of them is generated for a different reviewer, and the plots show the relationship between a count (a Y axis 510 ) of documents reviewed by a given reviewer within an hour, and a time axis 511 labeled by the date and the time. By inspecting the graph, one can identify the reviewers that are the most efficient and most productive. As in previous examples, a user of a client device may request additional data for any data point 512 shown in a graph by selecting any of the data points depicted in FIG. 10 .
- FIG. 11 is an example graph depicting average native size review rate data.
- the graphs shown in FIG. 11 depict relationships between native size review rates and individual reviewers. For example, for each reviewer from a list of reviewers, the graph may depict the count (a Y axis 5122 ) of native size review rate plotted along a time axis 513 .
- the native size review rate that was determined for a given reviewer.
- a user of a client device may request additional data for a given data point 514 .
- FIG. 12 is an example graph depicting review ratio data.
- FIG. 12 is an example pie-chart depicting review analysis data, and in particular, review ratios.
- FIG. 12 depicts a relationship of the review ratios between the reviewed documents and not reviewed documents. In this example, it appears that all the documents or almost all the documents have been reviewed, and almost none have not been reviewed.
- FIG. 13 is an example graph depicting total documents reviewed data.
- FIG. 13 is an example pie-chart depicting data showing counts of total documents that have been reviewed per individual reviewers. In a depicted chart, each individual pie-chart portion is associated with a different reviewer.
- a user of a client device may request additional information about either a particular reviewer or a count of the total document reviewed for the particular reviewer.
- FIG. 14 is an example graph depicting user document review rate data.
- FIG. 14 is an example graph depicting data indicating user document review rates.
- the graph includes several plots. Each of the plots is associated with a different reviewer.
- the plot shows the relationship between a user document review rate (a Y axis 515 ) of a particular reviewer within a particular timeframe (a X axis 516 ).
- a user of a client device may request additional data for a data point 517 depicted in the graph shown in FIG. 14 .
- FIG. 15 is an example graph depicting reviewer documents reviewed hourly data.
- the graph depicted in FIG. 15 includes several graphs. Each of them is associated with a different reviewer. For a given data point of a given plot represents a relationship between a count of documents (a Y axis 518 ) reviewed hourly by the given reviewer at a given time (a X axis 519 ).
- a user of a client device may request additional data for a data point 520 .
- FIG. 16 is an example pie-chart depicting total native size reviewed data.
- each of a pie-chart portion is associated with a different reviewer, and the chart itself shows a relation between the native size reviewed by individual reviewers.
- FIG. 17 is an example pie-chart depicting total text size reviewed data.
- the depicted pie-chart shows review analysis data pertaining to a total text size reviewed per individual reviewers.
- the pie-chart shown in FIG. 17 depicts a relative relationship between the text size of reviewed documents by the individual reviewers.
- FIG. 18 is an example graph depicting review progress data.
- the graph shows two reviewers 530 - 531 , review rates for each of the reviewers, text review rates for each of the reviewers, and times at which the reviewers performed their reviews.
- the summary shown in FIG. 18 indicates that reviewer 530 reviewed at least eight documents on Oct. 3, 2018 and had a text review rate of 84.44 kilobytes per hour.
- FIG. 19 is an example graph depicting review report data.
- information determined for each reviewer 532 - 533 is organized differently than it was in FIG. 18 .
- the information is organized by a reviewer, and provides data pertaining to the document, a count of reviewed document, a time of reviewed documents, and a text review ratio.
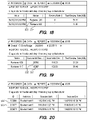
- FIG. 20 is an example graph depicting review session data.
- Data in FIG. 20 is organized by job identifiers, including identifiers 534 - 535 .
- a job identifier may be a matter identifier, a task identifier, and so forth.
- a summary window provides additional information such as an environment instance, a session start-date and a session start-time, a session end-date and time, and so forth.
- FIG. 21 is an example graph depicting files size trend data.
- Data depicted in FIG. 21 shows a relationship between a count (a Y axis 540 ) of gigabytes of files that are being reviewed at a given time (a X axis 541 ).
- the data in FIG. 21 may include a plot corresponding to the native files, image files, and production files.
- a user of a client device may request additional information for a particular data point 542 on the graphs.
- FIG. 22 is an example graph depicting environment size trend data. This graph shows a relationship between a size of the environment (a Y axis 543 ) being reviewed and a time and date range (a X axis 544 ). For example, for a given data point 545 in the graph, one can determine a total size of the environment related documents reviewed by reviewers by a given date and time corresponding to pint 545 .
- FIG. 23 is an example graph depicting indexes size trend data.
- the graph may include several plots such as a data research plot, an analytics plot, an extracted text plot, and so forth.
- the plots are two-dimensional plots where a Y axis 546 indicates gigabytes of data, and a X axis 547 indicates time and date ranges.
- a user of a client device may request additional data for a particular data point 548 shown in the graph.
- FIG. 24 is an example graph depicting database size trend data.
- the depicted graph is a two-dimensional graph labeled by gigabytes (a Y axis 549 ) for reviewed data and a time and date range (a X axis 550 ). For a given data point 551 on the graph, one can determine a date associated with that point and a storage space of the database that was used to store the reviewed document up to that date.
- FIG. 25 is an example graph depicting modified indexes size trend data.
- FIG. 25 depicts three plots. A first plot is for a data search, a second plot is for analytics, and a third plot is for extracted text data. The plots show relationships between gigabytes of sizes (a Y axis 552 ) of reviewed data and time and date ranges (a X axis 553 ). For a given data point 554 on the graph, one can determine additional data for data point 554 .
- FIG. 26 is an example graph depicting modified indexes size trend data.
- FIG. 26 is an example chart showing a relationship between environment sizes (a Y axis 555 ) measured in gigabytes and time and date ranges (a X axis 556 ) during which the documents are reviewed. For a given data point 557 on the graph, one may obtain an information pertaining to the total amount of size of reviewed data on a given date and at a given time.
- FIG. 27 is an example graph depicting modified indexes size trend data.
- FIG. 27 is an example graph that depicts modified indexes size trends. It is similar to FIG. 23 , however, it shows different relationships for each of the graphs including a data search graph, an analytics graph, and an extracted text graph. The trends are plotted along a Y axis 558 and a X axis 559 . As in previous examples, a user of a client device may request additional data for a particular data point 560 shown in the graph.
- FIG. 28 is an example graph depicting modified database size trend data. Graphs in FIG. 28 are similar to the graphs depicted in FIG. 24 . However, relationships between counts (a Y axis 561 ) of the gigabytes corresponding to sizes of data reviewed by reviewers on a given date or within a given time range (a X axis 562 ) are different than in the previous figures. As in previous examples, a user of a client device may request additional data for a particular data point 563 shown in the graph.
- FIG. 29 is an example graph depicting document growth trend data.
- each data point corresponds to, or represents, a relationship between a count (a Y axis 564 ) of documents reviewed by reviewers by a particular date (a X axis 565 ).
- a user of a client device may request additional data for a particular data point 566 shown in the graph.
- FIG. 30 is an example graph depicting natives trend data.
- a native document is a document that is in its original, non-translated, not converted version or format.
- FIG. 30 is an example graph depicting a relationship between native trends (a Y axis 567 ) and time and date ranges (a X axis 568 ).
- each point in the graph represents a relationship between a count of native documents reviewed by a particular time and date.
- a user of a client device may request additional data for a particular data point 569 shown in the graph.
- FIG. 31 is an example graph depicting files growth trend data.
- the depicted graph shows a relationship between a count (a Y axis 570 ) of files that are being reviewed or have been reviewed and a time range (a X axis 571 ).
- a given data point 572 on the graph represents a relationship between a total count of files reviewed by the given date.
- FIG. 32 is an example pie-chart depicting top workspaces files data.
- the depicted pie-chart shows relative counts of files reviewed by reviewers and pertaining to different matters.
- each different piece of the pie-chart corresponds to a different workspace.
- workspaces may include different matters, different cases, different law suits, different projects, and so forth.
- a user of a client device may point into any point on the pie-chart and obtain additional information for the selected point.
- a user of a client device may point into any point on the pie-chart and obtain additional information for the selected point.
- FIG. 33 is an example pie-chart depicting top workspaces-databases data.
- the depicted pie-chart shows a relationship of the database usage between different matters and different workspaces.
- a user of a client device may point into any point on the pie-chart and obtain additional information for the selected point.
- FIG. 34 is an example pie-chart depicting top workspaces sizes data.
- Each pie-chart piece depicted in the pie-chart corresponds to a different matter and represents a relative size of the workspace-database space that is being used or dedicated to the particular matter.
- a user of a client device may point into any point on the pie-chart and obtain additional information for the selected point.
- FIG. 35 is an example pie-chart depicting top workspaces-databases data.
- each of the pie-chart pieces corresponds to a different matter and shows a relative percentage of the database space that is dedicated to that matter.
- a user of a client device may point into any point on the pie-chart and obtain additional information for the selected point.
- FIG. 36 is an example graph depicting daily statistics data.
- the graph shown in FIG. 36 depicts a relationship between a size of data (a Y axis 575 ) reviewed on a given date (a X axis 576 ).
- the relationship may be exported in any type of output files and additional information for the report may also be obtained.
- a user of a client device may point into any point on the graph and obtain additional information for the selected point.
- FIG. 37 is an example graph depicting monthly statistics data.
- the graph shown in FIG. 37 depicts statistical data organized per months.
- a user of a client device may point into any point on the graph and obtain additional information for the selected point.
- FIG. 38 is an example executive summary graph.
- the depicted executive summary graph shows a relationship between amounts (a Y axis 580 ) of data that has been reviewed at a given date (a X axis 581 ).
- the summary graph plots the amounts of reviewed documents on a per monthly basis.
- a user of a client device may obtain additional information such a data associated with the selected data point, and a count of active documents that are being reviewed on a given date, and so forth.
- FIG. 39 is an example executive summary bar-graph.
- each portion of a bar corresponds to a different type of documents.
- one bar may include bar-portions that correspond to active reviewed document, archived document, deleted documents, documents deleted within 30 days, nearline documents, and testing documents, respectively.
- a user of a client device may obtain additional information such a data associated with the selected data point, and a count of active/archived/deleted/nearline/testing documents for a given date.
- the techniques described herein are implemented by one or more special-purpose computing devices.
- the special-purpose computing devices may be hard-wired to perform the techniques, or may include digital electronic devices such as one or more application-specific integrated circuits (ASICs) or field programmable gate arrays (FPGAs) that are persistently programmed to perform the techniques, or may include one or more general purpose hardware processors programmed to perform the techniques pursuant to program instructions in firmware, memory, other storage, or a combination.
- ASICs application-specific integrated circuits
- FPGAs field programmable gate arrays
- Such special-purpose computing devices may also combine custom hard-wired logic, ASICs, or FPGAs with custom programming to accomplish the techniques.
- the special-purpose computing devices may be desktop computer systems, portable computer systems, handheld devices, networking devices or any other device that incorporates hard-wired and/or program logic to implement the techniques.
- FIG. 40 is a block diagram that depicts an example computer system 4000 upon which embodiments may be implemented.
- Computer system 4000 includes a bus 4002 or other communication mechanism for communicating information, and a processor 4004 coupled with bus 4002 for processing information.
- Computer system 4000 also includes a main memory 4006 , such as a random-access memory (RAM) or other dynamic storage device, coupled to bus 4002 for storing information and instructions to be executed by processor 4004 .
- Main memory 4006 also may be used for storing temporary variables or other intermediate information during execution of instructions to be executed by processor 4004 .
- Computer system 4000 further includes a read only memory (ROM) 4008 or other static storage device coupled to bus 4002 for storing static information and instructions for processor 4004 .
- ROM read only memory
- a storage device 4010 such as a magnetic disk or optical disk, is provided and coupled to bus 4002 for storing information and instructions.
- Computer system 4000 may be coupled via bus 4002 to a display 4012 , such as a cathode ray tube (CRT), for displaying information to a computer user.
- a display 4012 such as a cathode ray tube (CRT)
- bus 4002 is illustrated as a single bus, bus 4002 may comprise one or more buses.
- bus 4002 may include without limitation a control bus by which processor 4004 controls other devices within computer system 4000 , an address bus by which processor 4004 specifies memory locations of instructions for execution, or any other type of bus for transferring data or signals between components of computer system 4000 .
- An input device 4014 is coupled to bus 4002 for communicating information and command selections to processor 4004 .
- cursor control 4016 is Another type of user input device
- cursor control 4016 such as a mouse, a trackball, or cursor direction keys for communicating direction information and command selections to processor 4004 and for controlling cursor movement on display 4012 .
- This input device typically has two degrees of freedom in two axes, a first axis (e.g., x) and a second axis (e.g., y), that allows the device to specify positions in a plane.
- Computer system 4000 may implement the techniques described herein using customized hard-wired logic, one or more ASICs or FPGAs, firmware and/or program logic or computer software which, in combination with the computer system, causes or programs computer system 4000 to be a special-purpose machine. According to one embodiment, those techniques are performed by computer system 4000 in response to processor 4004 executing one or more sequences of one or more instructions contained in main memory 4006 . Such instructions may be read into main memory 4006 from another computer-readable medium, such as storage device 4010 . Execution of the sequences of instructions contained in main memory 4006 causes processor 4004 to perform the process steps described herein. In alternative embodiments, hard-wired circuitry may be used in place of or in combination with software instructions to implement the embodiments. Thus, embodiments are not limited to any specific combination of hardware circuitry and software.
- Non-volatile media includes, for example, optical or magnetic disks, such as storage device 4010 .
- Volatile media includes dynamic memory, such as main memory 4006 .
- Computer-readable media include, for example, a floppy disk, a flexible disk, hard disk, magnetic tape, or any other magnetic medium, a CD-ROM, any other optical medium, a RAM, a PROM, and EPROM, a FLASH-EPROM, any other memory chip or memory cartridge, or any other medium from which a computer can read.
- Various forms of computer-readable media may be involved in carrying one or more sequences of one or more instructions to processor 4004 for execution.
- the instructions may initially be carried on a magnetic disk of a remote computer.
- the remote computer can load the instructions into its dynamic memory and send the instructions over a telephone line using a modem.
- a modem local to computer system 4000 can receive the data on the telephone line and use an infrared transmitter to convert the data to an infra-red signal.
- An infra-red detector can receive the data carried in the infra-red signal and appropriate circuitry can place the data on bus 4002 .
- Bus 4002 carries the data to main memory 4006 , from which processor 4004 retrieves and executes the instructions.
- the instructions received by main memory 4006 may optionally be stored on storage device 4010 either before or after execution by processor 4004 .
- Computer system 4000 also includes a communication interface 4018 coupled to bus 4002 .
- Communication interface 4018 provides a two-way data communication coupling to a network link 4020 that is connected to a local network 4022 .
- communication interface 4018 may be an integrated service digital network (ISDN) card or a modem to provide a data communication connection to a corresponding type of telephone line.
- ISDN integrated service digital network
- communication interface 4018 may be a local area network (LAN) card to provide a data communication connection to a compatible LAN.
- LAN local area network
- Wireless links may also be implemented.
- communication interface 4018 sends and receives electrical, electromagnetic or optical signals that carry digital data streams representing various types of information.
- Network link 4020 typically provides data communication through one or more networks to other data devices.
- network link 4020 may provide a connection through local network 4022 to a host computer 4024 or to data equipment operated by an Internet Service Provider (ISP) 4026 .
- ISP 4026 in turn provides data communication services through the world-wide packet data communication network now commonly referred to as the “Internet” 4028 .
- Internet 4028 uses electrical, electromagnetic or optical signals that carry digital data streams.
- Computer system 4000 can send messages and receive data, including program code, through the network(s), network link 4020 and communication interface 4018 .
- a server 4030 might transmit a requested code for an application program through Internet 4028 , ISP 4026 , local network 4022 and communication interface 4018 .
- the received code may be executed by processor 4004 as it is received, and/or stored in storage device 4010 , or other non-volatile storage for later execution.
Abstract
Description
-
- A. Data Access System
- B. Document Review and Reporting System
- C. Client Devices
-
- A. Example Arrangement for Retrieving, Reporting and Querying Data
- B. Example Time Chart for Retrieving, Reporting and Querying Data
- C. Example Flow Chart for Retrieving, Reporting and Querying Data
-
- A. Review Progress Graphs
- B. Document Review Rate Pie-Charts
- C. Document Review Ratio Pie-Charts
- D. Total Documents Reviewed Ratio Charts
- E. User Document Review Rate Graphs
- F. Reviewer Documents Reviewed Hourly Graphs
- G. Average Native Size Review Rate Graphs
- H. Review Ratio Pie-Charts
- I. Total Documents Reviewed Pie-Charts
- J. User Document Review Rate Graphs
- K. Reviewer Documents reviewed Hourly Graphs
- L. Total Native Size Reviewed Pie-Charts
- M. Total Text Size Reviewed Pie-Charts
-
- A. Review Progress Graphs
- B. Review Report Graphs
- C. Review Session Graphs
- D. Files Size Trend Graphs
- E. Environment Size Trend Graphs
- F. Indexes Size Trend Graphs
- G. Database Size Trend Graphs
- H. Modified Indexes Size Trend Graphs
- I. Modified Environment Size Trend Graphs
- J. Modified Indexes Size Trend Graphs
- K. Modified Database Size Trend Graphs
- L. Document Growth Trend Graphs
- M. Natives Trend Graphs
- N. Files Growth Trend Graphs
- O. Top Workspaces Pie-Charts
- P. Top Workspaces-Databases Pie-Charts
- Q. Top Workspaces Size Pie-Charts
- R. Modified Top Workspaces-Databases Pie-Charts
- S. Daily Statistics Graphs
- T. Monthly Statistics Graphs
- U. Executive Summary Graphs
- V. Executive Summary Bar-Graphs
Claims (20)
Priority Applications (1)
| Application Number | Priority Date | Filing Date | Title |
|---|---|---|---|
| US16/355,291 US11372875B2 (en) | 2019-03-15 | 2019-03-15 | Using a single-entry access point to archive data in and out of an electronic document review and reporting system |
Applications Claiming Priority (1)
| Application Number | Priority Date | Filing Date | Title |
|---|---|---|---|
| US16/355,291 US11372875B2 (en) | 2019-03-15 | 2019-03-15 | Using a single-entry access point to archive data in and out of an electronic document review and reporting system |
Publications (2)
| Publication Number | Publication Date |
|---|---|
| US20200293518A1 US20200293518A1 (en) | 2020-09-17 |
| US11372875B2 true US11372875B2 (en) | 2022-06-28 |
Family
ID=72423375
Family Applications (1)
| Application Number | Title | Priority Date | Filing Date |
|---|---|---|---|
| US16/355,291 Active US11372875B2 (en) | 2019-03-15 | 2019-03-15 | Using a single-entry access point to archive data in and out of an electronic document review and reporting system |
Country Status (1)
| Country | Link |
|---|---|
| US (1) | US11372875B2 (en) |
Families Citing this family (2)
| Publication number | Priority date | Publication date | Assignee | Title |
|---|---|---|---|---|
| US11238110B2 (en) | 2019-03-15 | 2022-02-01 | Ricoh Company, Ltd. | Using a single-entry access point to archive data in and out of an electronic documents review and reporting system |
| US11463255B2 (en) | 2021-01-04 | 2022-10-04 | Bank Of America Corporation | Document verification system |
Citations (33)
| Publication number | Priority date | Publication date | Assignee | Title |
|---|---|---|---|---|
| US5940843A (en) | 1997-10-08 | 1999-08-17 | Multex Systems, Inc. | Information delivery system and method including restriction processing |
| US20010010329A1 (en) * | 1998-09-10 | 2001-08-02 | Tadashi Ohashi | Document review apparatus, a document review system, and a computer product |
| US20030193502A1 (en) | 2002-03-29 | 2003-10-16 | Patel Himesh G. | Computer-implemented system and method for generating data graphical displays |
| US20060037019A1 (en) * | 2004-07-23 | 2006-02-16 | Austin Mark A | Tree-to-graph folding procedure for systems engineering requirements |
| US20090077008A1 (en) * | 2004-01-12 | 2009-03-19 | Lightfoot Solutions Limited | System and method for extracting user selected data from a database |
| US20090300544A1 (en) * | 2008-05-30 | 2009-12-03 | Mike Psenka | Enhanced user interface and data handling in business intelligence software |
| US20100169137A1 (en) | 2008-12-31 | 2010-07-01 | Ebay Inc. | Methods and systems to analyze data using a graph |
| US20110167066A1 (en) * | 2008-09-25 | 2011-07-07 | Motorola, Inc. | Content item review management |
| US20120215804A1 (en) * | 2011-02-18 | 2012-08-23 | Microsoft Corporation | Data-programming environment |
| US20130132814A1 (en) | 2009-02-27 | 2013-05-23 | Adobe Systems Incorporated | Electronic content editing process |
| US20130185252A1 (en) | 2012-01-17 | 2013-07-18 | Jeffrey J. Palmucci | Document Revision Manager |
| US20140043337A1 (en) | 2008-06-20 | 2014-02-13 | New BIS Safe Luxco S.a.r.I | Data visualization system and method |
| US20140173501A1 (en) * | 2012-12-07 | 2014-06-19 | Lithium Technologies, Inc. | Device, Method and User Interface for Presenting Analytic Data |
| US20140280630A1 (en) * | 2013-03-15 | 2014-09-18 | Telmate Llc | Method and system for efficient review of exchanged content |
| US20140280300A1 (en) | 2013-03-15 | 2014-09-18 | Aktiebolaget Skf | Guided data collection management system |
| US8856662B2 (en) | 2005-09-27 | 2014-10-07 | Morgan Stanley | Company and contact information system and method |
| US20140317147A1 (en) * | 2013-04-22 | 2014-10-23 | Jianqing Wu | Method for Improving Document Review Performance |
| US8994732B2 (en) | 2011-03-07 | 2015-03-31 | Microsoft Corporation | Integration of sketch-based interaction and computer data analysis |
| US20150170382A1 (en) * | 2010-10-19 | 2015-06-18 | Izenda, Inc. | Systems and methods for automatic interactive visualizations |
| US20150178366A1 (en) * | 2013-12-23 | 2015-06-25 | Roozbeh Farahbod | Data generation for performance evaluation |
| US20150370467A1 (en) | 2014-06-18 | 2015-12-24 | Alfresco Software, Inc. | Configurable and self-optimizing business process applications |
| US20160307276A1 (en) | 2015-01-13 | 2016-10-20 | Timothy J. Young | System and method for insuring against unrecoverable litigation costs |
| US20160358101A1 (en) | 2015-06-05 | 2016-12-08 | Facebook, Inc. | Machine learning system interface |
| US20160378748A1 (en) * | 2015-06-25 | 2016-12-29 | One Hour Translation, Ltd. | System and method for ensuring the quality of a human translation of content through real-time quality checks of reviewers |
| US20180089717A1 (en) | 2016-09-28 | 2018-03-29 | Robert L. Morin | Digital Content Management and Delivery System for Digital Electronic Displays |
| US20190026848A1 (en) | 2017-07-19 | 2019-01-24 | Transactency LLC | Systems and methods for contract negotiation and drafting |
| US20190164070A1 (en) | 2017-11-29 | 2019-05-30 | Adobe Inc. | Self-trained content management system for automatically classifying execution modes for user requests |
| US20190324980A1 (en) * | 2018-04-23 | 2019-10-24 | Verso Biosciences, Inc. | Data analytics systems and methods |
| US10459939B1 (en) * | 2016-07-31 | 2019-10-29 | Splunk Inc. | Parallel coordinates chart visualization for machine data search and analysis system |
| US20190333256A1 (en) * | 2018-04-30 | 2019-10-31 | Robert Bosch Gmbh | Methods and Systems For Simplified Graphical Depictions of Bipartite Graphs |
| US20200089818A1 (en) | 2018-09-17 | 2020-03-19 | Servicenow, Inc. | System and method dashboard selection |
| US20200293577A1 (en) | 2019-03-15 | 2020-09-17 | Ricoh Company, Ltd. | Using a single-entry access point to archive data in and out of an electronic document review and reporting system |
| US20200293578A1 (en) | 2019-03-15 | 2020-09-17 | Ricoh Company, Ltd. | Using a single-entry access point to archive data in and out of an electronic documents review and reporting system |
-
2019
- 2019-03-15 US US16/355,291 patent/US11372875B2/en active Active
Patent Citations (33)
| Publication number | Priority date | Publication date | Assignee | Title |
|---|---|---|---|---|
| US5940843A (en) | 1997-10-08 | 1999-08-17 | Multex Systems, Inc. | Information delivery system and method including restriction processing |
| US20010010329A1 (en) * | 1998-09-10 | 2001-08-02 | Tadashi Ohashi | Document review apparatus, a document review system, and a computer product |
| US20030193502A1 (en) | 2002-03-29 | 2003-10-16 | Patel Himesh G. | Computer-implemented system and method for generating data graphical displays |
| US20090077008A1 (en) * | 2004-01-12 | 2009-03-19 | Lightfoot Solutions Limited | System and method for extracting user selected data from a database |
| US20060037019A1 (en) * | 2004-07-23 | 2006-02-16 | Austin Mark A | Tree-to-graph folding procedure for systems engineering requirements |
| US8856662B2 (en) | 2005-09-27 | 2014-10-07 | Morgan Stanley | Company and contact information system and method |
| US20090300544A1 (en) * | 2008-05-30 | 2009-12-03 | Mike Psenka | Enhanced user interface and data handling in business intelligence software |
| US20140043337A1 (en) | 2008-06-20 | 2014-02-13 | New BIS Safe Luxco S.a.r.I | Data visualization system and method |
| US20110167066A1 (en) * | 2008-09-25 | 2011-07-07 | Motorola, Inc. | Content item review management |
| US20100169137A1 (en) | 2008-12-31 | 2010-07-01 | Ebay Inc. | Methods and systems to analyze data using a graph |
| US20130132814A1 (en) | 2009-02-27 | 2013-05-23 | Adobe Systems Incorporated | Electronic content editing process |
| US20150170382A1 (en) * | 2010-10-19 | 2015-06-18 | Izenda, Inc. | Systems and methods for automatic interactive visualizations |
| US20120215804A1 (en) * | 2011-02-18 | 2012-08-23 | Microsoft Corporation | Data-programming environment |
| US8994732B2 (en) | 2011-03-07 | 2015-03-31 | Microsoft Corporation | Integration of sketch-based interaction and computer data analysis |
| US20130185252A1 (en) | 2012-01-17 | 2013-07-18 | Jeffrey J. Palmucci | Document Revision Manager |
| US20140173501A1 (en) * | 2012-12-07 | 2014-06-19 | Lithium Technologies, Inc. | Device, Method and User Interface for Presenting Analytic Data |
| US20140280630A1 (en) * | 2013-03-15 | 2014-09-18 | Telmate Llc | Method and system for efficient review of exchanged content |
| US20140280300A1 (en) | 2013-03-15 | 2014-09-18 | Aktiebolaget Skf | Guided data collection management system |
| US20140317147A1 (en) * | 2013-04-22 | 2014-10-23 | Jianqing Wu | Method for Improving Document Review Performance |
| US20150178366A1 (en) * | 2013-12-23 | 2015-06-25 | Roozbeh Farahbod | Data generation for performance evaluation |
| US20150370467A1 (en) | 2014-06-18 | 2015-12-24 | Alfresco Software, Inc. | Configurable and self-optimizing business process applications |
| US20160307276A1 (en) | 2015-01-13 | 2016-10-20 | Timothy J. Young | System and method for insuring against unrecoverable litigation costs |
| US20160358101A1 (en) | 2015-06-05 | 2016-12-08 | Facebook, Inc. | Machine learning system interface |
| US20160378748A1 (en) * | 2015-06-25 | 2016-12-29 | One Hour Translation, Ltd. | System and method for ensuring the quality of a human translation of content through real-time quality checks of reviewers |
| US10459939B1 (en) * | 2016-07-31 | 2019-10-29 | Splunk Inc. | Parallel coordinates chart visualization for machine data search and analysis system |
| US20180089717A1 (en) | 2016-09-28 | 2018-03-29 | Robert L. Morin | Digital Content Management and Delivery System for Digital Electronic Displays |
| US20190026848A1 (en) | 2017-07-19 | 2019-01-24 | Transactency LLC | Systems and methods for contract negotiation and drafting |
| US20190164070A1 (en) | 2017-11-29 | 2019-05-30 | Adobe Inc. | Self-trained content management system for automatically classifying execution modes for user requests |
| US20190324980A1 (en) * | 2018-04-23 | 2019-10-24 | Verso Biosciences, Inc. | Data analytics systems and methods |
| US20190333256A1 (en) * | 2018-04-30 | 2019-10-31 | Robert Bosch Gmbh | Methods and Systems For Simplified Graphical Depictions of Bipartite Graphs |
| US20200089818A1 (en) | 2018-09-17 | 2020-03-19 | Servicenow, Inc. | System and method dashboard selection |
| US20200293577A1 (en) | 2019-03-15 | 2020-09-17 | Ricoh Company, Ltd. | Using a single-entry access point to archive data in and out of an electronic document review and reporting system |
| US20200293578A1 (en) | 2019-03-15 | 2020-09-17 | Ricoh Company, Ltd. | Using a single-entry access point to archive data in and out of an electronic documents review and reporting system |
Non-Patent Citations (12)
| Title |
|---|
| Greetham, U.S. Appl. No. 16/35,278, filed Mar. 15, 2019, Final Office Action, dated Jun. 26, 2020. |
| Greetham, U.S. Appl. No. 16/355,278, filed Mar. 15, 2019, Advisory Action dated Feb. 22, 2022. |
| Greetham, U.S. Appl. No. 16/355,278, filed Mar. 15, 2019, Final Office Action, dated Dec. 28, 2020. |
| Greetham, U.S. Appl. No. 16/355,278, filed Mar. 15, 2019, Final Rejection, dated Nov. 2, 2021. |
| Greetham, U.S. Appl. No. 16/355,278, filed Mar. 15, 2019, Office Action, dated Mar. 31, 2021. |
| Greetham, U.S. Appl. No. 16/355,336, filed Mar. 15, 2019, Final Office Action, dated Jan. 15, 2021. |
| Greetham, U.S. Appl. No. 16/355,336, filed Mar. 15, 2019, Final Rejection, dated Sep. 23, 2021. |
| Greetham, U.S. Appl. No. 16/355,336, filed Mar. 15, 2019, Interview Summary, dated Jun. 29, 2021. |
| Greetham, U.S. Appl. No. 16/355,336, filed Mar. 15, 2019, Notice of Allowance and Fees Due, dated Dec. 1, 2021. |
| Greetham, U.S. Appl. No. 16/355,336, filed Mar. 15, 2019, Office Action, dated Apr. 28, 2021. |
| Greetham, U.S. Appl. No. 16/355,336, filed Mar. 15, 2019, Office Action, dated Aug. 10, 2020. |
| Greetham, U.S. Appl. No. No. 16/355,336, filed Mar. 15, 2019, Notice of Allowance and Fees Due, dated Nov. 10, 2021. |
Also Published As
| Publication number | Publication date |
|---|---|
| US20200293518A1 (en) | 2020-09-17 |
Similar Documents
| Publication | Publication Date | Title |
|---|---|---|
| US20200293577A1 (en) | Using a single-entry access point to archive data in and out of an electronic document review and reporting system | |
| US20210011955A1 (en) | Systems and methods for graphical exploration of forensic data | |
| US20180349482A1 (en) | Automatic triage model execution in machine data driven monitoring automation apparatus with visualization | |
| US20180309807A1 (en) | Apparatus and Method for Acquiring, Managing, Sharing, Monitoring, Analyzing and Publishing Web-Based Time Series Data | |
| AU2009238294B2 (en) | Data transformation based on a technical design document | |
| US9348917B2 (en) | Electronic document retrieval and reporting using intelligent advanced searching | |
| US20110040600A1 (en) | E-discovery decision support | |
| US20150227608A1 (en) | System and method for performing set operations with defined sketch accuracy distribution | |
| US10565221B2 (en) | Systems and methods for graphical exploration of forensic data | |
| KR20040088366A (en) | Computer searching with associations | |
| US9600479B2 (en) | Electronic document retrieval and reporting with review cost and/or time estimation | |
| US10515069B2 (en) | Utilization of a concept to obtain data of specific interest to a user from one or more data storage locations | |
| EP3547145A2 (en) | Systems and methods for reducing storage required for code coverage results | |
| US20150220644A1 (en) | Electronic document retrieval and reporting using tagging analysis and/or logical custodians | |
| US11372875B2 (en) | Using a single-entry access point to archive data in and out of an electronic document review and reporting system | |
| EP3062243A1 (en) | Legal discovery tool | |
| US20150128022A1 (en) | Electronic document retrieval and reporting | |
| US11238110B2 (en) | Using a single-entry access point to archive data in and out of an electronic documents review and reporting system | |
| US20100030616A1 (en) | Apparatus and method for conducting surveys | |
| US20160217218A1 (en) | Automatic Workflow For E-Discovery | |
| US10235781B2 (en) | Visualization of provenance data | |
| US11100045B2 (en) | Legal discovery tool implemented in a mobile device | |
| CN116594683A (en) | Code annotation information generation method, device, equipment and storage medium | |
| US9230011B1 (en) | Index-based querying of archived data sets | |
| CN113010208B (en) | Version information generation method, device, equipment and storage medium |
Legal Events
| Date | Code | Title | Description |
|---|---|---|---|
| AS | Assignment |
Owner name: RICOH COMPANY, LTD., JAPAN Free format text: ASSIGNMENT OF ASSIGNORS INTEREST;ASSIGNOR:GREETHAM, DAVID;REEL/FRAME:048616/0540 Effective date: 20190315 |
|
| FEPP | Fee payment procedure |
Free format text: ENTITY STATUS SET TO UNDISCOUNTED (ORIGINAL EVENT CODE: BIG.); ENTITY STATUS OF PATENT OWNER: LARGE ENTITY |
|
| STPP | Information on status: patent application and granting procedure in general |
Free format text: RESPONSE TO NON-FINAL OFFICE ACTION ENTERED AND FORWARDED TO EXAMINER |
|
| STPP | Information on status: patent application and granting procedure in general |
Free format text: FINAL REJECTION MAILED |
|
| STPP | Information on status: patent application and granting procedure in general |
Free format text: DOCKETED NEW CASE - READY FOR EXAMINATION |
|
| STPP | Information on status: patent application and granting procedure in general |
Free format text: NON FINAL ACTION MAILED |
|
| STPP | Information on status: patent application and granting procedure in general |
Free format text: RESPONSE TO NON-FINAL OFFICE ACTION ENTERED AND FORWARDED TO EXAMINER |
|
| STPP | Information on status: patent application and granting procedure in general |
Free format text: FINAL REJECTION MAILED |
|
| STPP | Information on status: patent application and granting procedure in general |
Free format text: DOCKETED NEW CASE - READY FOR EXAMINATION |
|
| STPP | Information on status: patent application and granting procedure in general |
Free format text: NOTICE OF ALLOWANCE MAILED -- APPLICATION RECEIVED IN OFFICE OF PUBLICATIONS |
|
| STPP | Information on status: patent application and granting procedure in general |
Free format text: AWAITING TC RESP., ISSUE FEE NOT PAID |
|
| STPP | Information on status: patent application and granting procedure in general |
Free format text: NOTICE OF ALLOWANCE MAILED -- APPLICATION RECEIVED IN OFFICE OF PUBLICATIONS |
|
| STPP | Information on status: patent application and granting procedure in general |
Free format text: PUBLICATIONS -- ISSUE FEE PAYMENT RECEIVED |
|
| STPP | Information on status: patent application and granting procedure in general |
Free format text: PUBLICATIONS -- ISSUE FEE PAYMENT VERIFIED |
|
| STCF | Information on status: patent grant |
Free format text: PATENTED CASE |
|
| CC | Certificate of correction |