US11302425B2 - Test server, communication terminal, test system, and test method - Google Patents
Test server, communication terminal, test system, and test method Download PDFInfo
- Publication number
- US11302425B2 US11302425B2 US15/103,958 US201415103958A US11302425B2 US 11302425 B2 US11302425 B2 US 11302425B2 US 201415103958 A US201415103958 A US 201415103958A US 11302425 B2 US11302425 B2 US 11302425B2
- Authority
- US
- United States
- Prior art keywords
- test
- result
- diagnosis
- prevalence rate
- positive
- Prior art date
- Legal status (The legal status is an assumption and is not a legal conclusion. Google has not performed a legal analysis and makes no representation as to the accuracy of the status listed.)
- Active, expires
Links
Images


Classifications
-
- G—PHYSICS
- G16—INFORMATION AND COMMUNICATION TECHNOLOGY [ICT] SPECIALLY ADAPTED FOR SPECIFIC APPLICATION FIELDS
- G16H—HEALTHCARE INFORMATICS, i.e. INFORMATION AND COMMUNICATION TECHNOLOGY [ICT] SPECIALLY ADAPTED FOR THE HANDLING OR PROCESSING OF MEDICAL OR HEALTHCARE DATA
- G16H10/00—ICT specially adapted for the handling or processing of patient-related medical or healthcare data
- G16H10/40—ICT specially adapted for the handling or processing of patient-related medical or healthcare data for data related to laboratory analysis, e.g. patient specimen analysis
-
- G—PHYSICS
- G16—INFORMATION AND COMMUNICATION TECHNOLOGY [ICT] SPECIALLY ADAPTED FOR SPECIFIC APPLICATION FIELDS
- G16H—HEALTHCARE INFORMATICS, i.e. INFORMATION AND COMMUNICATION TECHNOLOGY [ICT] SPECIALLY ADAPTED FOR THE HANDLING OR PROCESSING OF MEDICAL OR HEALTHCARE DATA
- G16H10/00—ICT specially adapted for the handling or processing of patient-related medical or healthcare data
- G16H10/60—ICT specially adapted for the handling or processing of patient-related medical or healthcare data for patient-specific data, e.g. for electronic patient records
-
- G—PHYSICS
- G16—INFORMATION AND COMMUNICATION TECHNOLOGY [ICT] SPECIALLY ADAPTED FOR SPECIFIC APPLICATION FIELDS
- G16H—HEALTHCARE INFORMATICS, i.e. INFORMATION AND COMMUNICATION TECHNOLOGY [ICT] SPECIALLY ADAPTED FOR THE HANDLING OR PROCESSING OF MEDICAL OR HEALTHCARE DATA
- G16H40/00—ICT specially adapted for the management or administration of healthcare resources or facilities; ICT specially adapted for the management or operation of medical equipment or devices
- G16H40/60—ICT specially adapted for the management or administration of healthcare resources or facilities; ICT specially adapted for the management or operation of medical equipment or devices for the operation of medical equipment or devices
- G16H40/67—ICT specially adapted for the management or administration of healthcare resources or facilities; ICT specially adapted for the management or operation of medical equipment or devices for the operation of medical equipment or devices for remote operation
-
- G—PHYSICS
- G16—INFORMATION AND COMMUNICATION TECHNOLOGY [ICT] SPECIALLY ADAPTED FOR SPECIFIC APPLICATION FIELDS
- G16H—HEALTHCARE INFORMATICS, i.e. INFORMATION AND COMMUNICATION TECHNOLOGY [ICT] SPECIALLY ADAPTED FOR THE HANDLING OR PROCESSING OF MEDICAL OR HEALTHCARE DATA
- G16H70/00—ICT specially adapted for the handling or processing of medical references
- G16H70/60—ICT specially adapted for the handling or processing of medical references relating to pathologies
-
- G—PHYSICS
- G16—INFORMATION AND COMMUNICATION TECHNOLOGY [ICT] SPECIALLY ADAPTED FOR SPECIFIC APPLICATION FIELDS
- G16H—HEALTHCARE INFORMATICS, i.e. INFORMATION AND COMMUNICATION TECHNOLOGY [ICT] SPECIALLY ADAPTED FOR THE HANDLING OR PROCESSING OF MEDICAL OR HEALTHCARE DATA
- G16H50/00—ICT specially adapted for medical diagnosis, medical simulation or medical data mining; ICT specially adapted for detecting, monitoring or modelling epidemics or pandemics
- G16H50/20—ICT specially adapted for medical diagnosis, medical simulation or medical data mining; ICT specially adapted for detecting, monitoring or modelling epidemics or pandemics for computer-aided diagnosis, e.g. based on medical expert systems
-
- G—PHYSICS
- G16—INFORMATION AND COMMUNICATION TECHNOLOGY [ICT] SPECIALLY ADAPTED FOR SPECIFIC APPLICATION FIELDS
- G16H—HEALTHCARE INFORMATICS, i.e. INFORMATION AND COMMUNICATION TECHNOLOGY [ICT] SPECIALLY ADAPTED FOR THE HANDLING OR PROCESSING OF MEDICAL OR HEALTHCARE DATA
- G16H50/00—ICT specially adapted for medical diagnosis, medical simulation or medical data mining; ICT specially adapted for detecting, monitoring or modelling epidemics or pandemics
- G16H50/70—ICT specially adapted for medical diagnosis, medical simulation or medical data mining; ICT specially adapted for detecting, monitoring or modelling epidemics or pandemics for mining of medical data, e.g. analysing previous cases of other patients
Definitions
- the present technology relates to a test system using statistical information, to a communication terminal and a test server that configure the test system, and to a test method used in the test system.
- test system can also be established as a network compatible client server system.
- an intelligence module 105 configured by a computer, for example, receives patient test results from a data acquisition module such as a test system 150 through a direct connection or over a network 140 .
- the intelligence module executes a disease classification process for analyzing patient test results to determine whether a patient sample is associated with an inflammatory bowel disease or a clinical subtype thereof. The determination made by the process is then provided to a client system 130 .
- Patent Document 1 Japanese Patent Application Laid-open No. 2012-508383
- test system an analysis is just performed based on the patient test results collected from a test terminal (test system) to provide a diagnosis thereof to a client.
- test system test terminal
- the above-mentioned test system is not a test system that preliminarily presents, before a doctor performs a clinical test, a positive predictive value and a negative predictive value (that will be described later) of the test to the doctor, to assist the doctor to determine whether to perform or stop the test.
- test systems that acquire test results or diagnoses from other test terminals, which are dispersed in many countries and regions, via a network, and calculates a prevalence rate (that will be described later), a positive predictive value, and a negative predictive value for each region that are changed with time, to provide them to a doctor.
- test server In view of the circumstances as described above, it is an object of the present technology to provide a test server, a communication terminal, a test system, and a test method that improve a clinical test or treatment in various aspects such as quality and cost.
- a test server including: a communication unit that communicates with a plurality of communication terminals via a network, the plurality of communication terminals each being connectable to a test device capable of executing a test on the presence or absence of a disease and each being capable of inputting a diagnosis on the presence or absence of the disease, the diagnosis being related to the test and made by a doctor; and a control unit that acquires at least one of a result of the test and the diagnosis as a test information item from each of the plurality of communication terminals via the communication unit, causes a storage unit to store the plurality of acquired test information items therein, performs statistical processing on the plurality of stored test information items, and causes the communication unit to return a result of the statistical processing according to a demand given from each of the communication terminals before the doctor makes a diagnosis.
- the test device used here includes test agents in addition to an original test device.
- the control unit may cause the communication unit to return at least one of a prevalence rate, a positive predictive value, and a negative predictive value that are calculated as the result of the statistical processing, based on the number of test information items in which the result of the test and the diagnosis are positive, the number of test information items in which the result of the test is negative and the diagnosis is positive, the number of test information items in which the result of the test is positive and the diagnosis is negative, and the number of test information items in which the result of the test and the diagnosis are negative, in the plurality of stored test information items.
- control unit may cause the communication unit to return the positive predictive value and the negative predictive value, in addition to the prevalence rate, the positive predictive value and the negative predictive value being calculated based on the prevalence rate, a sensitivity of the test device, and a specificity of the test device.
- the control unit may acquire, from each of the communication terminals, an elapsed time from the development of a disease of a patient who is to be subjected to the test, acquire a sensitivity and a specificity that correspond to the elapsed time from the development of the disease, and calculate the positive predictive value and the negative predictive value based on the acquired sensitivity and specificity.
- the control unit may cause the test device to execute various types of tests for testing the disease, the test device being connected to each of the communication terminals, acquire results of the executed various types of tests from the test device, and determine a result of the test indicating the presence or absence of the disease, based on the acquired results of the various types of tests.
- the test device may be capable of executing various types of tests, and the control unit may calculate, after causing the test device to execute one of the various types of tests, posttest odds in the one test based on at least one of a positive likelihood ratio and a negative likelihood ratio on the one test, transmit the posttest odds to each of the communication terminals, and acquire information on whether a subsequent test is performed or not from each of the communication terminals.
- the test information items acquired from the communication terminals may each include patient attribute information indicating an attribute of a patient who is subjected to the test, and the control unit may perform, when receiving a demand to narrow down statistical information from each of the communication terminals, the statistical processing by performing narrowing-down for test information items each having the attribute of the patient attribute information, the demand specifying any patient attribute information.
- the test information items acquired from the communication terminals may each include terminal attribute information indicating an attribute of each of the communication terminals that performs the test, and the control unit may perform, when receiving a demand to narrow down statistical information from each of the communication terminals, the statistical processing by performing narrowing-down for test information items each having the attribute of the terminal attribute information, the demand specifying any terminal attribute information.
- control unit may perform weighting on the result of the statistical processing, the weighting being based on the terminal attribute information, the result of the statistical processing being calculated based on the test information items obtained by narrowing-down.
- control unit may be capable of using a positive rate instead of the prevalence rate.
- the test information item may include information for identifying a method of performing the test
- the control unit may be capable of using the positive rate instead of the prevalence rate in each of the methods of performing the test for an identical disease, the positive rate being the result of the statistical processing performed on a plurality of test information items acquired by one of the methods, the method satisfying preliminarily demanded predetermined values of a sensitivity and a specificity, out of sensitivities and specificities preliminarily provided to the respective methods, the prevalence rate being the result of the statistical processing performed on each of a plurality of test information items acquired by another one of the methods.
- control unit may evaluate effectiveness of the test based on the positive predictive value, transmit an evaluation result to each of the communication terminals, and cause each of the communication terminals to present a message of recommendation or non-recommendation for the test.
- the test information items acquired from the communication terminals may each include information of a region in which each of the communication terminals is located, as terminal attribute information indicating an attribute of each of the communication terminals that performs the test, and the control unit may estimate the prevalence rate in a first region in which the test is not implemented, based on prevalence rates obtained in one or more second regions that are different from the first region, and based on a factor having an influence on infection between each of the second regions and the first region.
- control unit may periodically perform the statistical processing and create history information of the prevalence rate, and predict a future prevalence rate based on the history information.
- control unit may return a result of the statistical processing acquired from outside, instead of performing the statistical processing on the plurality of stored test information items.
- the control unit may transmit a list of medicines to each of the communication terminals, the medicines being based on at least one of the result of the test, the diagnosis, and the result of the statistical processing, and cause each of the communication terminals to present the list as medicines recommended for medication, or the control unit may cause each of the communication terminals to present a list of methods for the test capable of being performed in the test device, a recommendation mark indicating a method for a test recommended in the list, and a user interface for starting the test.
- a communication terminal including: a communication unit that communicates with a test server via a network, the test server collecting a plurality of sets of at least one of a result of a test on the presence or absence of a disease and a diagnosis on the presence or absence of the disease as test information items, and providing a result of statistical processing performed on the plurality of collected test information items, the diagnosis being related to the test and made by a doctor; an input unit that receives an input from a user or the doctor; and a control unit that causes the communication unit to transmit a demand of the result of the statistical processing to the test server, causes a test device to execute the test, presents the result of the statistical processing and a result of the executed test to the user, the result of the statistical processing being received via the communication unit from the test server, causes the user to input the diagnosis on the executed test, using the input unit, and causes the communication unit to transmit at least one of the result of the executed test and the input diagnosis as the test
- a test system including: a test server; and a plurality of communication terminals, the test server including a first communication unit that communicates with the plurality of communication terminals via a network, and a first control unit that acquires at least one of a result of a test on the presence or absence of a disease and a diagnosis on the presence or absence of the disease as a test information item from each of the plurality of communication terminals via the communication unit, the diagnosis being related to the test and made by a doctor, causes a storage unit to store the plurality of acquired test information items therein, performs statistical processing on the plurality of stored test information items, and causes the communication unit to return a result of the statistical processing according to a demand given from each of the communication terminals before the doctor makes a diagnosis, the plurality of communication terminals each including a second communication unit that communicates with the test server via the network, an input unit that receives an input from a user or the doctor, and a second
- a test method including: by a control unit, acquiring, from a plurality of communication terminals each being connectable to a test device capable of executing a test on the presence or absence of a disease and each being capable of inputting a diagnosis on the presence or absence of the disease, at least one of a result of the test and the diagnosis as a test information item via the communication unit, the diagnosis being related to the test and made by a doctor; causing a storage unit to store the plurality of acquired test information items therein; performing statistical processing on the plurality of stored test information items; and causing the communication unit to return a result of the statistical processing according to a demand given from each of the communication terminals before the doctor makes a diagnosis.
- a test method including: by a control unit, causing a communication unit to transmit a demand of a result of statistical processing to a test server, the communication unit communicating with the test server via a network, the test server collecting a plurality of sets of at least one of a result of a test on the presence or absence of a disease and a diagnosis on the presence or absence of the disease as test information items, and providing the result of the statistical processing performed on the plurality of collected test information items, the diagnosis being related to the test and made by a doctor; causing the communication unit to transmit the demand of the result of the statistical processing to the test server; causing a test device to execute the test; presenting the result of the statistical processing and a result of the executed test to a user or the doctor, the result of the statistical processing being received via the communication unit from the test server; causing the user to input the diagnosis on the executed test, using an input unit that receives an input from the user; and causing the communication
- FIG. 1 is a diagram showing a state where a clinical test of a certain disease is performed by a certain test method.
- FIG. 2 is a graph showing a relationship between a positive predictive value and a negative predictive value, and a prevalence rate.
- FIG. 3 is a diagram showing a configuration in which a test system 10 that adopts the present technology connects test terminals 20 with a test server 40 via a network.
- FIG. 4 is a block diagram of a case where the test server 40 is configured by a general computer.
- FIG. 5 is a diagram showing an example of fields (items) in each record that configures a database 47 a.
- FIG. 6 is a block diagram of a case where the test terminal 20 is configured by a test device and a general computer.
- FIG. 7 is a flowchart for describing the overall processing flow in the test system 10 .
- FIG. 8 is a flowchart for describing the details of processing to count and calculate a prevalence rate.
- FIG. 9 is a flowchart for describing the details of the implementation of a test.
- FIG. 10 is a flowchart for describing processing using a sensitivity and a specificity that are based on an elapsed time from the development of a disease, in processing to implement a test.
- FIG. 11 is a flowchart for describing processing in which various tests are performed and results of the tests are comprehensively used in the processing to implement a test.
- FIG. 12 is a flowchart for describing processing in which a plurality of tests are executed one by one and each time one test result is obtained, whether the test is continued or not is determined, in the processing to implement a test.
- FIG. 13 is a flowchart for describing processing to count and calculate a prevalence rate after narrowing down count target data based on an administrative district and a physical distance, in processing to count and calculate a prevalence rate.
- FIG. 14 is a flowchart for describing the processing to count and calculate a prevalence rate after narrowing down count target data based on gender and an age category of patients, in the processing to count and calculate a prevalence rate.
- FIG. 15 is a flowchart of processing to calculate, in the case where the number of registered patients is small in the database 47 a and narrowing-down according to a genetic polymorphism is meaningless, a prevalence rate of that genetic polymorphism by correcting the overall prevalence rate using a predetermined sensitivity.
- FIG. 16 is a block diagram showing a configuration example of a test server 40 a that can correct the prevalence rate using sensitivity information.
- FIG. 17 is a flowchart of processing to perform weighting correction on the prevalence rate (diagnosis prevalence rate) calculated by count of the database 47 a in a certain administrative district, based on an immunization penetration rate in that administrative district, to predict a true prevalence rate.
- FIG. 18 is a flowchart for describing processing using an approximate index to be a substitute for the prevalence rate, instead of the prevalence rate.
- FIG. 19 is a graph showing a relationship between a prevalence rate and a positive rate when the sensitivity and the specificity are changed.
- FIG. 20 is a graph showing a relationship between a prevalence rate or a positive rate as a substitute for the prevalence rate, and the positive predictive value and the negative predictive value.
- FIG. 21 is a flowchart for describing processing to count and calculate a prevalence rate in the case where the configuration of a modified example is adopted.
- FIG. 22 is a flowchart of processing to recommend implementation of tests or implementation of no tests depending on the level of a calculated positive predictive value.
- FIG. 23 is a diagram showing prevalence rates of a plurality of regions for which test results are already accumulated, and a state where a prevalence rate of a region where a test is not yet performed is predicted in accordance with distances from the plurality of regions.
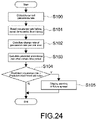
- FIG. 24 is a flowchart for describing a processing flow to provide a future predicted prevalence rate as well, in addition to a current prevalence rate.
- FIG. 25 is a flowchart showing processing on a predetermined certain-time-period basis and processing in each implementation of test.
- FIG. 26 is a diagram showing a configuration for uploading a diagnosis etc. using the LIS.
- FIG. 27 is a diagram showing a specific example in which a list of test methods feasible by the test device 28 of the test terminal 20 is presented on the test terminal 20 in addition to a name of a disease, a prevalence rate, a positive predictive value, and a negative predictive value, and a recommended test method is further displayed thereon.
- indices of a positive predictive value and a negative predictive value that serve as indices representing a probability on whether a patient is actually affected with a disease or not.
- the positive predictive value and the negative predictive value are very important indices, which represent a probability of a test result, for a doctor who uses the test device in clinical practice to determine a diagnosis of a disease. The reason why it is important will be described later.
- the positive predictive value and the negative predictive value can be calculated from the sensitivity and the specificity of the test device, and a prevalence rate. Conversely, in the case where the prevalence rate varies from hour to hour in infectious diseases and the like, the values of those indices also vary from hour to hour.
- the prevalence rate which varies from hour to hour, is adequately handled to assist a doctor to determine a more definite diagnosis using a test terminal in pandemic of an infectious disease, for example. This is one object to develop this test system.
- FIG. 1 shows a state where a clinical test of a certain disease is performed by a certain test method.
- the number of persons who apply to a case (true positive) is “a”, in which a positive result is obtained by a test device and a doctor makes a final determination for a certainty that the patient is affected with a disease.
- the number of persons who apply to a case (false positive) is “c”, in which a positive result is obtained by the test device but the doctor makes a final determination that the patient is not affected with the disease.
- the number of persons who apply to a case (false negative) is “b”, in which a negative result is obtained by the test device but the doctor makes a final determination that the patient is affected with the disease.
- the number of persons who apply to a case (true negative) is “d”, in which a negative result is obtained by the test device and the doctor makes a final determination that the patient is not affected with the disease.
- the prevalence rate is obtained by an expression (a+b)/(a+b+c+d). Further, the definitions of indices related to the prevalence rate (positive, negative, positive rate, negative rate, positive predictive value, negative predictive value, number of diseases, number of non-diseases, total number, sensitivity, specificity, and accuracy) are as shown in the figure. It should be noted that in the case where there are a plurality of diseases or test methods, a table like this figure can be created for each combination of the diseases and the test methods.
- a probability (odds) that a patient is subjected to a certain test and determined to be actually affected with a disease is represented as the following mathematical expression (1), using pretest odds in which a positive result is obtained in a test before the test is performed, and a likelihood ratio.
- posttest odds pretest odds ⁇ likelihood ratio (1)
- posttest negative odds that will be described later
- posttest negative odds are represented by the following mathematical expression (5) using the pretest odds and a negative likelihood ratio (that will be described later).
- posttest negative odds pretest odds ⁇ negative likelihood ratio (5)
- the positive predictive value and the negative predictive value are represented by the following mathematical expressions (12) and (13) using the sensitivity, the specificity, and the prevalence rate.
- positive predictive value sensitivity ⁇ prevalence rate/(sensitivity ⁇ prevalence rate+(1 ⁇ prevalence rate)(1 ⁇ specificity))
- negative predictive value specificity ⁇ (1 ⁇ prevalence rate)/(specificity ⁇ (1 ⁇ prevalence rate)+prevalence rate ⁇ (1 ⁇ sensitivity))
- FIG. 2 is a graph showing a relationship between the positive predictive value and the negative predictive value, and the prevalence rate. It should be noted that in a test device to be used in this test, a sensitivity is 90%, and a specificity is 90%.
- the positive predictive value and the negative predictive value are each approximately 90%, and it is found that a test result can be trusted.
- the prevalence rate is approximately 5%, that is, when 100 persons are subjected to diagnoses and there are approximately 5 persons affected with a disease
- the positive predictive value is approximately 30%, and it is found that a test result is difficult to trust.
- the prevalence rate is very important index for a doctor who makes a diagnosis of a disease based on clinical test results.
- MRSA Metal-resistant Staphylococcus aureus
- test method include a genetic test, immunoassay, and a cultivation test. If the presence or absence of infection of MRSA is tested by those tests and a MRSA-uninfected person can be correctly diagnosed to be MRSA negative, the number of affected persons to be individually managed can be reduced, and the expense for infection prevention measures can be reduced. From this viewpoint, the negative predictive value is important regarding MRSA infection.
- test terminal thus presents a recommendation for implementation of the test.
- the test terminal thus does not recommend this test, and presents a recommendation for implementation of another test method with a higher sensitivity or a recommendation for implementation of individual management of patients without performing a test.
- the test terminal thus does not recommend implementation of this test, and presents a recommendation for implementation of another test method with a higher sensitivity or a recommendation for implementation of individual management of patients.
- the test terminal thus does not recommend the test, and recommends another test method with a higher sensitivity or recommends individual management of patients.
- test method can be recommended to a doctor by the test terminal based on the prevalence rate.
- the negative predictive value is intended to be 90% or more when the prevalence rate is 30%, it is found that a test method with the sensitivity of 77% and the specificity of 90% or more only needs to be used.
- the negative predictive value is intended to be 90% or more when the prevalence rate is 40%, it is found that a test method with the sensitivity of 85% and the specificity of 90% or more only needs to be used.
- the negative predictive value is intended to be 90% or more when the prevalence rate is 50%, it is found that a test method with the sensitivity of 90% and the specificity of 90% or more only needs to be used.
- the negative predictive value is intended to be 90% or more when the prevalence rate is 60%, it is found that a test method with the sensitivity of 93% and the specificity of 90% or more only needs to be used.
- the test terminal recommends a test method to be executed to a doctor as follows. Specifically, when the prevalence rate is 30%, use of an immunochromatographic test kit is recommended.
- the immunochromatographic test kit provides a low sensitivity but can suppress costs.
- the prevalence rate is 50%, it is conceived that a genetic test kit that is expensive but provides a high sensitivity or a cultivation test that takes a long test time but provides a high sensitivity is recommended.
- test system a list of test methods that are feasible in healthcare facilities in which tests are performed may be held, and an optimum test method may be recommended to a doctor based on the sensitivity, the specificity, the prevalence rate, and the negative predictive value.
- MRSA Methicillin-resistant Staphylococcus aureus
- FQRP Fluoroquinolone-resistant Pseudomonas Aeruginosa
- the proportion of VRE to enterococci in 2007 is 30% or more in Ireland and Greece, 30 to 20% in the United Kingdom, 20 to 10% in Czech Republic, 10 to 5% in Italy, Germany, and Portugal, 5 to 1% in Spain, France, Switzerland, Austria, and other countries, and 1% or less in Norway, Sweden, Finland, Tru, and other countries.
- the prevalence rate of influenza virus tends to be low in June and July, whereas it tends to be high in February and March every year.
- an epidemic start period differs yearly, and its prevalence rate also largely differs.
- pandemic strains H1pdm
- IASR Infectious Agents Surveillance Report
- the prevalence rate of the influenza virus largely differs depending on years, periods, and types of viruses. Therefore, in order to enhance the degree of accuracy of a diagnosis, a test system that can collect prevalence rate information very quickly and continuously when a test is performed is effective.
- the prevalence rate of influenza virus in the ages of 0 to 14, particularly in the ages of 5 to 9 tends to be higher than the other age groups. In other words, the prevalence rate largely changes depending on the age groups.
- the prevalence rate also differs depending on communities to which patients belong.
- the “Status of Pandemic Influenza in the season of 2012 to 2013”, which is reported by the Koriyama health department of Nara Prefecture provides a report example in which the prevalence rate of influenza virus in early elementary school years is high.
- the prevalence rate in the first year grade of a certain elementary school in the season of 2011 to 2012 is 30% or more.
- the prevalence rate of influenza-like virus in the season of 2011 to 2012 in Japan is estimated as 16,480,000 persons. Assuming that the population of Japan is 128 million persons based on the result of the census in 2010, the prevalence rate of influenza virus is 12.9% at a maximum, which differs from the example of Nara Prefecture. In other words, this suggests that the prevalence rate of influenza virus differs depending on communities.
- FIG. 3 is a diagram showing a configuration in which a test system 10 that adopts the present technology connects test terminals 20 with a test server 40 via a network.
- a plurality of test terminals 20 serving as clients are dispersedly disposed in countries, regions, and facilities and are connected to the test server 40 via the network 30 .
- test system 10 that adopts the present technology has to have a client server configuration
- a client server configuration formed of the test server 40 and the plurality of test terminals 20 is adopted as a configuration of the test system 10 .
- Adopting this configuration allows the number of test terminals 20 serving as clients to be increased as much as possible. This can improve the degree of accuracy of the prevalence rate provided from the test server 40 to the test terminals 20 .
- the test server 40 may be configured by dedicated hardware or software or may be configured by a general computer.
- FIG. 4 is a block diagram of a case where the test server 40 is configured by a general computer.
- the test server 40 includes a CPU (Central Processing Unit, control unit, first control unit) 41 , a ROM (Read Only Memory) 42 , a RAM (Random Access Memory) 43 , an operation input unit 44 , a network interface unit (communication unit, first communication unit) 45 , a display unit 46 , and a storage unit 47 , and those blocks are connected to one another via a bus 48 .
- CPU Central Processing Unit, control unit, first control unit
- ROM Read Only Memory
- RAM Random Access Memory
- the ROM 42 fixedly stores a plurality of programs and data such as firmware to execute various types of processing.
- the RAM 43 is used as a work area of the CPU 41 and temporarily holds an OS (Operating System), various applications being executed, and various types of data being processed.
- OS Operating System
- the storage unit 47 is, for example, an HDD (Hard Disk Drive), a flash memory, or another non-volatile memory such as a solid-state memory.
- a database 47 a that will be described later is stored in addition to the OS, the various applications, and the various types of data.
- the network interface unit 45 is connected to the network 30 for exchanging information with the test terminals 20 , and collects information from the test terminals 20 or provides processed information to the test terminals 20 .
- the CPU 41 develops a program corresponding to a command provided from the operation input unit 44 , in a plurality of programs stored in the ROM 42 and the storage unit 47 , to the RAM 43 and appropriately controls the display unit 46 and the storage unit 47 according to the developed program.
- the CPU 41 updates the database 47 a based on information collected from the test terminals 20 via the network 30 and the network interface unit 45 .
- the CPU 41 then extracts necessary information from the database 47 a based on a condition specified by a demand of the information received from the test terminals 20 , counts and returns the information to the test terminals 20 .
- the operation input unit 44 is, for example, a pointing device such as a mouse, a keyboard, a touch panel, or another operating device.
- the display unit 46 is, for example, a liquid crystal display, an EL (Electro-Luminescence) display, a plasma display, or a CRT (Cathode Ray Tube) display.
- the display unit 46 may be incorporated in the test server 40 or may be externally connected.
- test server 40 has been described.
- FIG. 5 is a diagram showing an example of fields (items) in each record that configures the database 47 a . It should be noted that those items are referred to as test information items.
- Those items are examples. More items may be provided, or those items may be narrowed down to less items depending on the types of information to be collected, extracted, and counted by the test server 40 . In the case where the number of items is increased, for example, Disease ID, Test method ID, and the like may be added. The addition of those Disease ID and Test method ID allows this test system to correspond to a plurality of disease or a plurality of test methods. It should be noted that a method of using those items is described later.
- the test terminal 20 may be configured by dedicated hardware or software or may be configured by a test device and a general computer.
- FIG. 6 is a block diagram of a case where the test terminal 20 is configured by a test device and a general computer.
- the test terminal (communication terminal) 20 includes a CPU (control unit, second control unit) 21 , a ROM 22 , a RAM 23 , an operation input unit (input unit) 24 , a network interface unit (communication unit, second communication unit) 25 , a display unit 26 , a storage unit 27 , and a test device 28 , and those blocks are connected to one another via a bus 29 .
- a CPU control unit, second control unit
- ROM 22 read-only memory
- RAM 23 random access memory
- an operation input unit input unit
- network interface unit communication unit, second communication unit
- display unit 26 display unit
- storage unit 27 storage unit
- test device 28 test device 28
- the network interface unit 25 is connected to the network 30 for exchanging information with the test server 40 , and transmits information to the test server 40 or receives information processed in the test server 40 .
- the CPU 21 presents information, which is received from the test server 40 via the network 30 and the network interface unit 25 , to a user or a doctor via the display unit 26 , or performs various types of processing based on the received information. The various types of processing will be described later. Further, the CPU 21 transmits a test result in the test device 28 or a final diagnosis of a doctor who made a diagnosis of a disease to the test server 40 via the network 30 and the network interface unit 25 .
- the test device 28 is a device with which a disease is actually tested. A test result is read by the CPU 41 , and then presented to a doctor who performed the test via the display unit 26 or transmitted to the test server 40 via the network 30 . It should be noted that in the case where a test kit is used as the test device, the test terminal 20 may automatically read a test result, or a test result may be input to the test terminal 20 manually.
- FIG. 7 is a flowchart for describing the overall processing flow in the test system 10 .
- the CPU 41 of the test server 40 counts and calculates a prevalence rate for one disease and one test method using the database 47 a in the test server 40 (Step S 10 ). It should be noted that details of this count and calculation processing are described later. It should be noted that the count and calculation processing may be started on a certain-time-period basis (for example, every hour or every day) or may be started using, as a trigger, a request (demand) from a test terminal 20 with which a doctor will implement a test.
- the CPU 21 of the test terminal 20 downloads the prevalence rate calculated in the test server 40 (Step S 20 ). It should be noted that downloading may be performed by pull communication from the test terminal 20 or by push communication from the test server 40 .
- the CPU 21 calculates a positive predictive value and a negative predictive value according to the mathematical expressions (12) and (13) described above (Step S 30 ). It should be noted that the mathematical expressions are shown below again. Further, it is assumed that the values of the sensitivity and the specificity are preliminarily held by the test terminal 20 .
- positive predictive value sensitivity ⁇ prevalence rate/(sensitivity ⁇ prevalence rate+(1 ⁇ prevalence rate)(1 ⁇ specificity)) (12)
- negative predictive value specificity ⁇ (1 ⁇ prevalence rate)/(specificity ⁇ (1 ⁇ prevalence rate)+prevalence rate ⁇ (1 ⁇ sensitivity)) (13)
- the positive predictive value and the negative predictive value may be directly obtained from expressions a/(a+c) and d/(b+d), respectively, without using the prevalence rate.
- the CPU 21 presents the prevalence rate, the positive predictive value, and the negative predictive value to a user or a doctor via the display unit 26 (Step S 40 ).
- Step S 50 a test is implemented according to an instruction of the user. Details of the processing of the test will be described later.
- test information which is input to the test terminal 20 , to the test server 40 (Step S 60 ).
- test information may be the same as the items that configure records of the database 47 a described above. Further, uploading may be directly performed from the test terminal 20 or may be performed via a laboratory information system (LIS) or a smartphone. Details of an uploading method will be described later.
- LIS laboratory information system
- the CPU 41 registers the uploaded test information such as a diagnosis in the database 47 a (Step S 70 ).
- Step S 70 After the registration in the database 47 a in Step S 70 , the processing returns to Step S 10 and the processing described above is repeated.
- FIG. 8 is a flowchart for describing the details of the processing to count and calculate the prevalence rate.
- the CPU 41 of the test server 40 clears the total number of diagnoses and the number of diseases to zero for initialization.
- the total number of diagnoses and the number of diseases are variables used for count up at the time of count (Step S 11 ).
- Step S 12 the CPU 41 determines whether all records of the database 47 a are read or not. It should be noted that whether all records are read or not is determined in the case where the database 47 a is constituted by records related to one disease and one test method. In the case where the records related to a plurality of diseases and a plurality of test methods are included in the database 47 a , whether all records related to diseases or test methods to be counted are read or not may be determined.
- Step S 13 the CPU 41 then reads one record from the database 47 a (Step S 13 ).
- Step S 14 the CPU 41 counts up the total number of diagnoses by 1 (Step S 14 ).
- Step S 15 the CPU 41 determines whether “Diagnosis” of the doctor, which is one field of the read record, is positive or not.
- Step S 16 Only in the case where the result is positive (Y of Step S 15 ), the CPU 41 counts up the number of diseases by 1 (Step S 16 ).
- Step S 15 N of Step S 15
- the CPU 41 returns to the processing of Step S 12 and continues the processing.
- Step S 12 in the case where all records of the database 47 a are read (Y of Step S 12 ), the CPU 41 then calculates a prevalence rate from the total number of diagnoses and the number of diseases according to the mathematical expression (6) (Step S 17 ).
- a value of the prevalence rate is acquired from outside the test system 10 .
- An acquisition method may be a method passing through the network 30 or may be a method of extracting a numerical value of the prevalence rate from a research paper and the like and manually inputting the numerical value to the test server 40 .
- a numerical value from a research paper and the like is manually input to the test server 40 , it is desirable to have a standard to simplify the input.
- FIG. 9 is a flowchart for describing the details of the implementation of a test.
- the user inputs patient information via the operation input unit 24 or the like of the test terminal 20 (Step S 51 ).
- Step S 52 a test is executed in the test device 28 (Step S 52 ).
- the CPU 21 reads a test result in the test device 28 and presents the test result to the user or the doctor via the display unit 26 (Step S 53 ).
- the doctor inputs a final diagnosis to the test terminal 20 , based on the prevalence rate, the positive predictive value, the negative predictive value, and the test result that are displayed in the test terminal 20 (Step S 54 ).
- the doctor can determine a final diagnosis with higher degree of accuracy by referring to the prevalence rate, the positive predictive value, and the negative predictive value.
- test terminal 20 has information of the test terminal's sensitivity and specificity, and downloads only the prevalence rate from the test server 40 to calculate the positive predictive value and the negative predictive value on the test terminal 20 side.
- the test server 40 holds information on the sensitivities and specificities of various types of test devices 28 . It should be noted that for values of the sensitivity and the specificity used here, values that are specific to the test devices 28 and provided as performance of the test devices 28 by manufacturers of the test devices 28 can be used. Before demanding information such as the prevalence rate, the test terminal 20 notifies the test server 40 of the device ID and the like of the test terminal 20 . The test server 40 calculates a positive predictive value and a negative predictive value in the test server 40 using the values of the sensitivity and the specificity, which are associated with the notified device ID. The test terminal 20 downloads the prevalence rate, the positive predictive value, and the negative predictive value from the test server 40 and presents them to the user.
- Adopting this configuration allows the test terminal to omit the processing to calculate the positive predictive value and the negative predictive value. Further, the sensitivity and the specificity of each test terminal 20 can be arbitrarily adjusted on the test server 40 side.
- the prevalence rate is downloaded or three of the prevalence rate, the positive predictive value, and the negative predictive value are downloaded from the test server 40 to the test terminals 20 .
- more information may be downloaded and presented to the user. Examples of the more information include the total number of diagnoses and the number of diseases. By presentation of such information to the user, the adequacy of the calculated positive predictive value and negative predictive value can be determined.
- the sensitivity and the specificity are uniquely determined in the test device 28 .
- a configuration will be described in which the sensitivity and the specificity are changed based on the elapsed time from the development of a disease such as an infection disease.
- the number of pathogens in the nasal cavity or pharynx fluctuates with the elapsed time from the development of a disease.
- the sensitivity and the specificity of a test also fluctuate.
- the degree of accuracy of the positive predictive value and negative predictive value to be obtained can be improved using adequate values of the sensitivity and the specificity.
- FIG. 10 is a flowchart for describing processing using a sensitivity and a specificity that are based on an elapsed time from the development of a disease, in the above-mentioned processing to implement a test.
- the user inputs patient information to the test terminal 20 (Step S 51 a ).
- patient information is input, an elapsed time from the development of a disease is also input.
- the CPU 21 of the test terminal 20 acquires a sensitivity and a specificity based on the input elapsed time from the development of a disease (Step S 51 b ). It should be noted that a sensitivity and a specificity to be acquired may be preliminarily held in the test terminal 20 or may be downloaded from the test server 40 that holds the sensitivity and specificity.
- test device 28 it may also be possible to establish a database on the sensitivity and the specificity of each test device 28 in the test system 10 and acquire, based on a medical-device identification number of the test device 28 , the sensitivity and specificity of the test device 28 , a sensitivity and specificity on an disease-development-time basis, a sensitivity and specificity on a patient's age basis, and the like.
- the CPU 21 calculates a positive predictive value and a negative predictive value using the acquired prevalence rate, sensitivity, and specificity (Step S 51 c ).
- the CPU 21 presents the calculated positive predictive value and negative predictive value to the user (Step S 51 d ). It should be noted that when the positive predictive value and the negative predictive value are presented to the user, the acquired prevalence rate, sensitivity, and specificity may also be presented together.
- Step S 51 d Processing of Step S 51 d and steps subsequent thereto are the same as those described above, and thus description thereof will be omitted.
- FIG. 11 is a flowchart for describing processing in which various tests are performed and results of the tests are comprehensively used in the above-mentioned processing to implement a test.
- Step S 51 the user inputs patient information. This step is the same as the step described above.
- the test terminal 20 executes various types of tests (in this example, three types of tests A, B, and C) (Step S 52 a , 52 b , and 52 c ).
- the tests may be executed simultaneously and parallel or executed sequentially one by one. It should be noted that the determination of test results is performed after all test results are obtained.
- Step S 52 d the CPU 21 of the test terminal 20 determines whether all the test results of the respective tests are positive or not (determines test results showing the presence of disease)
- Step S 52 e the CPU 21 determines a final test result to be positive.
- a final test result is determined to be positive in the case where all the test results are positive, there may be a case where the CPU 21 determines a final test result to be positive when all the results are not necessarily positive, depending on conditions such as the sensitivity of each test.
- Step S 52 f the CPU 21 determines a final test result to be negative (determines test results showing the absence of disease) (Step S 52 f ).
- Step 53 Processing of Step 53 and steps subsequent thereto are the same as those described above, and thus description thereof will be omitted. It should be noted that the following processing is performed using the “final test result” obtained here as the “test result” described above.
- FIG. 12 is a flowchart for describing processing in which a plurality of tests are executed one by one and each time one test result is obtained, whether the test is continued or not is determined, in the above-mentioned processing to implement a test.
- a configuration in which tests A, B, and C are sequentially performed as a plurality of tests is provided.
- the CPU 21 of the test terminal 20 calculates pretest odds based on the prevalence rate downloaded from the test server 40 , using the mathematical expression (7) (Step S 49 a ).
- the CPU 21 presents the calculated pretest odds to the user or the doctor via the display unit 26 (Step S 53 a ).
- Step S 55 the doctor determines whether the test A is needed to be executed or not.
- the operation input unit 24 receives an input of patient information from the user (Step S 51 ).
- test device 28 of the test terminal 20 executes the test A (Step S 52 a ).
- the CPU 21 calculates posttest positive odds in the test A based on a result of the test A and on pretest odds and a positive likelihood ratio related to the test A, using the mathematical expression (4) (Step S 49 b ).
- the positive likelihood ratio is used here, but the present technology is not limited thereto. A configuration in which at least one of the positive likelihood ratio and the negative likelihood ratio is used may be adopted.
- the CPU 21 presents the posttest positive odds to the user (Step S 53 b ).
- Step S 56 the doctor determines whether an additional test is needed or not by referring to the presented posttest positive odds.
- Step S 56 the test B and the test C are not performed.
- the processing proceeds to the input of the diagnosis of the doctor (Step S 54 ).
- Step S 56 the CPU 21 then causes the test device 28 to execute the test B (Step S 52 b ).
- the CPU 21 calculates posttest positive odds in the test B, as in Step S 49 b , based on the test result of the test A, a test result of the test B, and pretest odds and a positive likelihood ratio related to the test B (Step S 49 c ).
- the CPU 21 presents the calculated posttest positive odds to the user or the doctor (Step S 53 c ).
- Step S 57 the doctor determines whether a further additional test is needed or not.
- Step S 57 the test C is not performed.
- the processing proceeds to the input of the diagnosis of the doctor (Step S 54 ).
- Step S 52 c the CPU 21 then causes the test device 28 to execute the test C.
- the CPU 21 presents a test result of the test C to the user (Step S 53 d ).
- Step S 54 the doctor inputs a final diagnosis to the test terminal 20 by referring to the test result (Step S 54 ).
- the prevalence rate is counted and calculated for all records stored in the database 47 a , that is, all the test results.
- a configuration will be described in which test results to be the basis for counting and calculating the prevalence rate are narrowed down based on an attribute of the test terminal 20 (terminal attribute information).
- test results used to calculate the prevalence rate are narrowed down to only results of tests performed in an administrative district (for example, Tokyo) to which a test terminal 20 that demands a prevalence rate belongs, or to only test results acquired within the range of a physical distance (for example, 50 km) from the test terminal 20 .
- the narrowing-down is performed based on the attribute of the test terminal 20 . It should be noted that the narrowing-down used here refers to using only test results matched with a certain condition to count the prevalence rate.
- FIG. 13 is a flowchart for describing processing to count and calculate the prevalence rate after narrowing down count target data based on an administrative district and a physical distance, in the above-mentioned processing to count and calculate the prevalence rate.
- the CPU 41 of the test server 40 acquires, from a test terminal 20 to be an information-provided destination of the prevalence rate or the like, an administrative district to which the test terminal 20 belongs, a current position, and a physical distance (radius) of a desired range (Step S 9 a ).
- the CPU 41 clears the total number of diagnoses and the number of diseases in an identical administrative district, and the total number of diagnoses of test results in the range of a specified distance and the number of diseases, to zero for initialization (Step S 11 a ).
- the total number of diagnoses and the number of diseases in an identical administrative district, and the total number of diagnoses of test results in the range of a specified distance and the number of diseases are variables used for count up at the time of count.
- Step S 12 the CPU 41 determines whether all records of the database 47 a are read or not.
- Step S 13 the CPU 41 then reads one record from the database 47 a (Step S 13 ).
- the CPU 41 determines whether the administrative district of the read record is identical to the administrative district of the test terminal 20 or not (Step S 18 a ). It should be noted that the item “Administrative District” used here can be derived as a part of the item “Address” in the database 47 a.
- Step S 14 a the CPU 41 then counts up the total number of diagnoses in the identical administrative district by 1 (Step S 14 a ).
- Step S 15 the CPU 41 determines whether “Diagnosis” of the doctor, which is one field of the read record, is positive or not.
- Step S 16 a Only in the case where the result is positive (Y of Step S 15 ), the CPU 41 counts up the number of diseases in the identical administrative district by 1 (Step S 16 a ).
- Step S 18 a In the case where the administrative district of the read record is different from the administrative district of the test terminal 20 in Step 18 a (N of Step S 18 a ), in the case where the result is negative in Step S 15 (N of Step S 15 ), or after the number of diseases is counted up in Step S 16 a , the CPU 41 advances the processing to Step S 18 b and continues the processing.
- the CPU 41 determines whether a distance between a position at which a test in the read record is performed and the current position of the test terminal 20 falls within the specified range or not (Step S 18 b ).
- Step S 14 b the CPU 41 then counts up the total number of diagnoses within the specified distance by 1 (Step S 14 b ).
- Step S 15 the CPU 41 determines whether “Diagnosis” of the doctor, which is one field of the read record, is positive or not.
- Step S 16 b Only in the case where the result is positive (Y of Step S 15 ), the CPU 41 counts up the number of diseases within the specified distance by 1 (Step S 16 b ).
- Step S 18 b In the case where the distance does not fall within the specified range in Step 18 b (N of Step S 18 b ), in the case where the result is negative in Step S 15 (N of Step S 15 ), or after the number of diseases is counted up in Step S 16 b , the CPU 41 returns the processing back to Step S 12 and continues the processing.
- Step S 12 in the case where all the records of the database 47 a are completely read (Y of Step S 12 ), according to the mathematical expression (6), the CPU 41 then calculates the prevalence rate in the identical administrative district from the total number of diagnoses and the number of diseases in the identical administrative district, and calculates the prevalence rate within the specified range from the total number of diagnoses and the number of diseases within the specified range (Step S 17 a ).
- test results to be the basis for counting and calculating the prevalence rate are narrowed down based on the attribute of the test terminal 20.
- test results to be the basis for counting and calculating the prevalence rate are narrowed down based on the attribute of the test terminal 20 .
- a configuration will be described in which test results to be the basis for counting and calculating the prevalence rate are narrowed down based on the attribute of a patient who is subjected to a test (patient attribute information), instead of the attribute of the test terminal 20 .
- test results to be counted are narrowed down based on the gender or age of a patient who is subjected to a test with the test terminal 20 that demands a prevalence rate, to count and calculate the prevalence rate.
- an example of narrowing-down to be described here is different from the above-mentioned narrowing-down based on the attribute of the test terminal 20 , and is exactly a sorting on an attribute content basis.
- test server 40 collects the prevalence rates of males and females and provides the prevalence rates to the test terminal 20 .
- FIG. 14 is a flowchart for describing processing to count and calculate the prevalence rate after narrowing down count target data based on gender and an age category (for example, categories on a ten-year basis, such as the ages of 0 to 9 and the ages of 10 to 19) of patients, in the processing to count and calculate the prevalence rate described above. It should be noted that in the description of this flowchart, processing similar to the above-mentioned narrowing-down based on the attribute of the test terminal 20 will not be described.
- an age category for example, categories on a ten-year basis, such as the ages of 0 to 9 and the ages of 10 to 19
- the CPU 41 of the test server 40 clears variables of the total number of diagnoses and the number of diseases, on an attribute category basis, to zero for initialization (Step S 11 b ).
- the variables are used for count up at the time of count.
- Step S 12 the CPU 41 determines whether all records of the database 47 a are read or not.
- Step S 13 the CPU 41 then reads one record from the database 47 a (Step S 13 ).
- the CPU 41 counts up the total number of diagnoses and the number of cases determined to be positive, on a gender category basis (Step S 18 a ).
- Step S 18 b the CPU 41 counts up the total number of diagnoses and the number of cases determined to be positive, on an age category basis.
- the CPU 41 then returns the processing back to Step S 12 and continues the processing.
- Step S 12 in the case where all the records of the database 47 a are completely read (Y of Step S 12 ), the CPU 41 then calculates the prevalence rate on an attribute category basis, from the total number of diagnoses and the number of diseases on an attribute category basis (Step S 17 b ).
- the gender and the age are exemplified as the attributes of patients, but the narrowing-down may be performed using an attribute other than those above attributes.
- an item corresponding to that attribute is provided in the records of the database 47 a and data corresponding to that item is accumulated.
- Examples of other attributes of patients include (1) medical interview information, (2) current and past medication information, (3) previous disease, (4) physical information such as a body temperature, a blood pressure, and a body weight, (5) information on lifestyle habits, such as an exercise volume, a volume or kinds of food, and a sleep length.
- examples of still other attributes of patients include (6) genotypes of germline and somatic line genes, including Genomic Variants, SNPs (Single Nucleotide Polymorphism), GWAS (Genome-wide Association Study), indel (insertion-deletion), CNV (Copy Number Variation), mRNA (messenger RNA), Epigenetics, miRNA (micro-RNA), and the like of the genes.
- Genomic Variants SNPs (Single Nucleotide Polymorphism)
- GWAS Gene-wide Association Study
- indel insertion-deletion
- CNV Copy Number Variation
- mRNA messenger RNA
- Epigenetics miRNA (micro-RNA), and the like of the genes.
- attributes such as (7) microbial flora (intestinal bacteria and the like) of patients and (8) race can also be used.
- test results to be the basis for counting and calculating the prevalence rate are narrowed down based on the attribute of a patient who is subjected to a test, instead of the attribute of the test terminal 20 .
- the narrowing-down is performed using the attribute of the test terminal 20 or the attribute of patients.
- the narrowing-down is performed using the attribute of the test terminal 20 or the attribute of patients.
- a prevalence rate that is obtained from all cases in the database 47 a before narrowing-down is performed is corrected based on correction information acquired from outside the test system 10 , and thus a prevalence rate in the case of narrowing-down under a target condition is calculated.
- FIG. 15 is a flowchart of processing to calculate, in the case where the number of registered patients is small in the database 47 a and narrowing-down according to a genetic polymorphism is meaningless, a prevalence rate for that genetic polymorphism by correcting the overall prevalence rate using a predetermined sensitivity.
- a prevalence rate for that genetic polymorphism is calculated from the overall prevalence rate by correction.
- the CPU 41 of the test server 40 acquires genetic polymorphism information of patients, which is input to the test terminal 20 as an information-provided destination (Step S 9 b ). It should be noted that the genetic polymorphism information of patients may be directly input to the test terminal 20 or may be acquired from outside, such as another server, based on a Patient ID received from the test terminal.
- the CPU 41 clears variables of the total number of diagnoses and the number of diseases in an identical genetic polymorphism to zero for initialization (Step S 11 c ).
- the variables are used for count up at the time of count.
- Step S 12 the CPU 41 determines whether all records of the database 47 a are read or not.
- Step S 13 the CPU 41 then reads one record from the database 47 a (Step S 13 ).
- the CPU 41 determines whether a genetic polymorphism of the read record and a genetic polymorphism acquired from the test terminal 20 are identical or not (Step S 18 c ).
- Step S 18 c the CPU 41 then counts up the total number of diagnoses in the identical genetic polymorphism by 1 (Step S 14 c ).
- Step S 15 the CPU 41 determines whether “Diagnosis” of the doctor, which is one field of the read record, is positive or not.
- Step S 16 c Only in the case where the result is positive (Y of Step S 15 ), the CPU 41 counts up the number of diseases in the identical genetic polymorphism by 1 (Step S 16 c ).
- Step S 18 c In the case where the genetic polymorphisms are different from each other in Step 18 c (N of Step S 18 c ), in the case where the result is negative in Step S 15 (N of Step S 15 ), or after the number of diseases is counted up in Step S 16 c , the CPU 41 returns the processing back to Step S 12 and continues the processing.
- Step S 12 in the case where all the records of the database 47 a are completely read (Y of Step S 12 ), the CPU 41 then determines whether the total number of diagnoses in the identical genetic polymorphism is sufficient or not (Step S 19 a ).
- the CPU 41 calculates a prevalence rate in an identical genetic polymorphism based on the total number of diagnoses and the number of diseases in the identical genetic polymorphism (Step S 17 b ).
- Step S 19 a the CPU 41 determines whether there is information for prevalence rate correction, which corresponds to the genetic polymorphism of patients (Step S 19 b ).
- Step S 19 c the CPU 41 determines that a calculation of a prevalence rate corresponding to the genetic polymorphism of patients is impossible, and then returns an error (Step S 19 c ).
- the CPU 41 calculates a prevalence rate (general prevalence rate) in the case where test results are not narrowed down to an identical genetic polymorphism (Step S 21 ).
- the CPU 41 corrects the calculated general prevalence rate using the information for prevalence rate correction (sensitivity information), to calculate the prevalence rate in the genetic polymorphism of patients (Step S 17 c ).
- the corrected prevalence rate can be returned to the test terminal.
- the correction value for correcting a general prevalence rate is acquired from outside, but the present technology is not limited thereto.
- a prevalence rate corresponding to each category of a terminal attribute and a patient attribute may be acquired from outside.
- prevalence rate information on a gender or age category basis may be acquired from outside in the format of XML (eXtended Markup Language) or the like.
- FIG. 16 is a block diagram showing a configuration example of the test server 40 a that can correct the prevalence rate using the sensitivity information described above.
- the difference from the test server 40 described above is an external data interface unit 49 additionally provided.
- the sensitivity information used for correction based on a disease and a genetic polymorphism is input by the user via the operation input unit 44 or acquired from a memory card or the like storing the sensitivity information, via the external data interface unit 49 . It should be noted that the sensitivity information may be acquired via the network interface unit 45 over the network 30 .
- Acquiring the sensitivity information for correction allows the test server 40 a to correct a prevalence rate and provide a prevalence rate corresponding to a specific genetic polymorphism during operation of a service for providing a prevalence rate and the like.
- the configuration has been described in which the weight of one test result is counted as 1 (the number of positive cases is simply counted) when the count for calculating a prevalence rate is performed.
- the following configuration will be described in which the number of counted-up positive cases is weighted for correction, to predict a true prevalence rate, in consideration of an environmental condition where a test is performed (for example, immunization penetration rate in a specific region).
- the weighting is performed by multiplication of a coefficient according to a predetermined condition, for example.
- FIG. 17 is a flowchart of processing to perform weighting correction on the prevalence rate (diagnosis prevalence rate) calculated by the count of the database 47 a in a certain administrative district, based on the immunization penetration rate in that administrative district, to predict a true prevalence rate.
- diagnosis prevalence rate the prevalence rate calculated by the count of the database 47 a in a certain administrative district, based on the immunization penetration rate in that administrative district, to predict a true prevalence rate.
- a specific value of the immunization penetration rate f(k) is assumed to be calculated based on a relationship between a true prevalence rate determined in the past and a diagnosis prevalence rate calculated in the past, using the mathematical expression (14).
- the CPU 41 of the test server 40 acquires, from a test terminal 20 to be a destination provided with information such as a prevalence rate, an administrative district to which that test terminal 20 belongs (Step S 9 c ).
- the CPU 41 clears the total number of diagnoses and the number of diseases in an identical administrative district to zero for initialization (Step S 11 d ).
- the total number of diagnoses and the number of diseases in an identical administrative district are variables used for count up at the time of count.
- Step S 12 the CPU 41 determines whether all records of the database 47 a are read or not.
- Steps S 13 , S 18 a , S 14 a , S 15 , and S 16 a which is performed by the time all the records of the database are completely read, is the same as the processing described above and is for calculating the total number of diagnoses and the number of diseases in an identical administrative district. Description of the processing will thus be omitted.
- Step S 12 in the case where all the records of the database 47 a are completely read (Y of Step S 12 ), the CPU 41 then calculates a prevalence rate (diagnosis prevalence rate) in the identical administrative district from the total number of diagnoses and the number of diseases in the identical administrative district according to the mathematical expression (6) (Step S 17 d ).
- a prevalence rate diagnosis prevalence rate
- the CPU 41 acquires an immunization penetration rate f(k) in the administrative district to which the test terminal 20 belongs (Step S 9 d ). It should be noted that the CPU 41 may preliminarily hold information of the immunization penetration rate f(k) in the test server 40 or acquire the information from outside the test system 10 . Further, the value of the immunization penetration rate f(k) may be updated in the test server 40 as needed.
- the CPU 41 calculates a predicted true prevalence rate using the mathematical expression (14) (Step S 17 e ).
- the predicted true prevalence rate calculated here is replaced with the prevalence rate described above, and the following processing is performed.
- the administrative district is used as a condition of weighting.
- characteristics of the region as a condition of weighting include a country, a population, a population density, a position of the test terminal 20 , a distance from the test terminal 20 , uniqueness of an environment, a poverty level, a traffic situation around the test terminal 20 , and a population change per day around the test terminal 20 .
- conditions such as an administrative district can be used for narrowing-down and weighting.
- the weighting based on the attribute of the test terminal 20 has been described, but the weighting may be performed based on patient attributes, for example, attributes such as a body temperature, a blood pressure, and a gene type of a patient.
- a diagnosis of a doctor is also certainly obtained in the past test result in order to calculate a prevalence rate.
- a final diagnosis of a doctor may not be sometimes input when a test is performed with the test terminal 20 .
- a blank is generated in the “Diagnosis” column of the database 47 a , and the degree of accuracy of a prevalence rate to be collected and obtained is reduced.
- an approximate index to serve as a substitute for the prevalence rate is used instead of the prevalence rate.
- the positive rate is used as the approximate index.
- the positive rate can be obtained from the number of test positive cases, which can be automatically acquired, when a test is performed with the test terminal 20 . For that reason, even in the case where a record in which a final diagnosis of a doctor is not input exists in the database 47 a and a calculation for a prevalence rate is not appropriately performed, using an index substituted by the positive rate allows an approximate value of an adequate prevalence rate to be provided to the test terminal 20 .
- (positive rate) (number of test positive cases)/(total number of diagnoses) (15)
- a point of the following processing is that even when the number of records in which a diagnosis of a doctor is input to the database 47 a is insufficient, when the prevalence rate falls within a range capable of being replaced with the positive rate and the number of records having positive test results is enough, the positive rate is substituted for the prevalence rate.
- FIG. 18 is a flowchart for describing processing using an approximate index to be a substitute for the prevalence rate, instead of the prevalence rate.
- the CPU 41 of the test server 40 clears the total number of diagnoses, the number of diseases, the number of diagnosis inputs, and the number of positive test results to zero for initialization (Step S 11 e ).
- the total number of diagnoses, the number of diseases, the number of diagnosis inputs, and the number of positive test results are variables used for count up at the time of count.
- Step S 12 the CPU 41 determines whether all records of the database 47 a are read or not.
- Step S 13 the CPU 41 then reads one record from the database 47 a (Step S 13 ).
- Step S 14 the CPU 41 then counts up the total number of diagnoses by 1 (Step S 14 ).
- the CPU 41 determines whether the “Diagnosis” column of a doctor, which is one field of the read record, is filled or not (Step S 18 d ).
- Step S 18 d the CPU 41 then counts up the number of diagnosis inputs by 1 (Step S 14 d ).
- the CPU 41 determines whether the “Diagnosis” of the doctor, which is one field of the read record, is positive or not (Step S 15 ).
- Step S 16 the CPU 41 counts up the number of diseases by 1 (Step S 16 ).
- Step S 18 d In the case where the “Diagnosis” column is not filled in Step S 18 d (N of Step S 18 d ), in the case where the diagnosis is negative in Step S 15 (N of Step S 15 ), or after the number of diseases is counted up in Step S 16 , the CPU 41 advances the processing to Step S 18 e and continues the processing.
- Step S 18 e the CPU 41 determines whether a test result of the test device 28 is positive or not.
- Step S 16 d Only in the case where the test result is positive (Y of Step S 18 e ), the CPU 41 counts up the number of positive test results by 1 (Step S 16 d ).
- Step S 18 e N of Step S 18 e
- the CPU 41 returns the processing back to Step S 12 and continues the processing.
- Step S 12 in the case where all the records of the database 47 a are completely read (Y of Step S 12 ), the CPU 41 calculates a prevalence rate from the total number of diagnoses and the number of diseases according to the mathematical expression (6) (Step S 17 ).
- the CPU 41 determines whether the number of diagnosis inputs is a predetermined threshold value or more (Step S 19 d ).
- the prevalence rate calculated in Step S 17 is considered as an adequate value and used in the following processing.
- Step S 19 d the prevalence rate calculated in Step S 17 is considered as an inadequate value for use in the following processing.
- the CPU 41 determines whether the calculated prevalence rate falls within a range capable of being replaced with the positive rate or not (Step S 19 e ).
- Step S 19 f the CPU 41 determines whether the number of positive test results is a predetermined threshold value or more.
- Step S 17 d the CPU 41 then calculates a positive rate using the mathematical expression (15) (Step S 17 d ).
- the CPU 41 substitutes the positive rate for the prevalence rate (Step S 17 e ).
- the positive rate is substituted for the value of the prevalence rate and used in the following processing.
- Step S 19 g the CPU 41 determines that a substitution of the positive rate for the prevalence rate is impossible, and then returns an error (Step S 19 g ).
- FIG. 19 is a graph showing the relationship between the prevalence rate and the positive rate when the sensitivity and the specificity are changed. This figure shows the relationship between the prevalence rate and the positive rate, when the sensitivity and the specificity of the diagnosis device 28 are changed, by 5%, from 80% (line indicated by a positive rate 1) to 85% (line indicated by a positive rate 2), 90% (line indicated by a positive rate 3), 95% (line indicated by a positive rate 4), and 100% (line indicated by a positive rate 5).
- a positive rate based on a test result of a higher sensitivity/high specificity test can present a more correct positive predictive value and negative predictive value to the user.
- FIG. 20 is a graph showing a relationship between a prevalence rate or a positive rate as a substitute for the prevalence rate, and the positive predictive value and the negative predictive value.
- Lines of a positive predictive value 2 and a negative predictive value 2 represent a positive predictive value and a negative predictive value that are calculated in the case of using a positive rate of another test with a sensitivity of 80% and a specificity of 80% instead of the prevalence rate.
- lines of a positive predictive value 3 and a negative predictive value 3 represent a positive predictive value and a negative predictive value that are calculated in the case of using a positive rate of another test with a sensitivity of 95% and a specificity of 95% instead of the prevalence rate.
- a line of a positive predictive value 3 (sensitivity/specificity of 95%) is approximate to the line of the positive predictive value 1 as an original positive predictive value, compared with the line of the positive predictive value 2 (sensitivity/specificity of 80%).
- a positive rate obtained by a certain test method is used instead of a prevalence rate for the test method.
- using a positive rate based on a diagnosis device having a higher sensitivity and a higher specificity leads to obtaining a positive predictive value and a negative predictive value that are more approximate to the positive predictive value and negative predictive value calculated from the original prevalence rate.
- a higher sensitivity and a higher specificity used here mean that they are sufficiently high enough to be credible, in other words, mean that a predetermined value preliminarily demanded is satisfied.
- test of influenza virus is exemplified.
- test method for influenza virus include immunochromatography of a low sensitivity/specificity and a PCR (Polymerase Chain Reaction) method of a high sensitivity/specificity.
- a positive rate by the PCR method is used as a substitute for the prevalence rate. This allows a calculation of values that are more approximate to the original positive predictive value and negative predictive value even in the case where the prevalence rate is difficult to calculate by the immunochromatography.
- positive predictive value and the negative predictive value to be calculated are represented by the following mathematical expressions (16) and (17), using a sensitivity (sensitivity i) and a specificity (specificity i) by the immunochromatography and a positive rate (positive rate p) by the PCR method.
- positive predictive value sensitivity i ⁇ positive rate p /(sensitivity i ⁇ positive rate p +(1 ⁇ positive rate p )(1 ⁇ specificity i ))
- negative predictive value specificity i ⁇ (1 ⁇ positive rate p )/(specificity i ⁇ (1 ⁇ positive rate p )+positive rate p ⁇ (1 ⁇ sensitivity i )) (17)
- FIG. 21 is a flowchart for describing processing to count and calculate a prevalence rate in the case where the configuration of this modified example is adopted.
- this flowchart is almost the same as the flowchart in the modified example described above (identical thereto from Step S 11 e to Step S 19 f ), in which a positive rate of a certain test method is substituted for a prevalence rate of the test method.
- a positive rate of a certain test method is substituted for a prevalence rate of the test method.
- the flowchart in this modified example shows processing in which a positive rate of a test method is substituted for a prevalence rate of a certain test method, the test method for the positive rate being more highly accurate (having higher sensitivity, higher specificity) than the test method for the prevalence rate.
- Step S 19 f the CPU 41 then acquires a positive rate based on a highly accurate test method (Step S 17 f ).
- the CPU 41 substitutes the positive rate for the prevalence rate (Step S 17 e ).
- the positive rate based on a more highly accurate test method is substituted for the value of the prevalence rate and used in the following processing.
- the modified example has been described in which a positive rate of a test method is substituted for a prevalence rate of a certain test method, the test method for the positive rate being more highly accurate (having higher sensitivity, higher specificity) than the test method for the prevalence rate.
- a sensitivity and a specificity may be subjected to weighted average to obtain a comprehensive sensitivity and specificity, based on the number of registered records of the respective test methods. Further, a sensitivity and a specificity of one test method may be applied to all test methods registered in the database 47 a . Further, test methods may be grouped and weighting may be performed for each of the groups, to obtain a comprehensive sensitivity and specificity. Furthermore, another index as a substitute for the prevalence rate has been described above, but a prevalence rate in an institution that is representative of its region can also be used instead of the prevalence rate based on the database 47 a.
- the test terminal 20 presents information to a doctor who performs a test, the information being the prevalence rate, the positive predictive value, and the negative predictive value, that is, being a reference for the doctor who makes a final diagnosis.
- the test terminal 20 determines whether a calculated positive predictive value is a realistic value or not (evaluates the effectiveness) and if it is realistic (effective), the test terminal 20 recommends a doctor to perform a test.
- Tests are always performed depending on a trade-off between side effects due to the execution of tests and costs of tests. For example, in the case where the prevalence rate is extremely low and the calculated positive predictive value is also too low to be realistic, a choice to perform no tests can be made.
- the test terminal 20 can recommend execution of no tests, or in the case where the positive predictive value is sufficiently high, the test terminal 20 can recommend execution of tests, before performing tests.
- FIG. 22 is a flowchart of processing to recommend execution of tests or execution of no tests depending on the level of the calculated positive predictive value.
- the CPU 41 of the test server 40 counts and calculates a prevalence rate for one disease and one test method using the database 47 a in the test server 40 (Step S 10 ).
- the CPU 21 of the test terminal 20 downloads the prevalence rate calculated in the test server 40 (Step S 20 ).
- the CPU 21 calculates a positive predictive value and a negative predictive value (Step S 30 ).
- the CPU 21 presents the prevalence rate, the positive predictive value, and the negative predictive value to a user or a doctor via the display unit 26 (Step S 40 ).
- the CPU 21 acquires a threshold value A of the positive predictive value, with which implementation of a test does not become realistic (Step S 41 ).
- the CPU 21 acquires a threshold value B of the positive predictive value, with which implementation of a test becomes realistic (Step S 42 ).
- the threshold value A and the threshold value B may be preliminarily held in the test terminal 20 , may be downloaded from the test server 40 , or may be acquired from outside by another method.
- the CPU 21 determines whether the calculated positive predictive value is the threshold value A or less (Step S 43 ).
- the CPU 21 displays a recommendation for implementation of no tests to the user or doctor via the display unit 26 (Step S 44 ).
- Step S 43 the CPU 21 determines whether the calculated positive predictive value is the threshold value B or more (Step S 45 ).
- the CPU 21 displays a recommendation for implementation of a test to the user or doctor via the display unit 26 (Step S 46 ).
- Step S 50 a test is then implemented in the test device 28 of the test terminal 20 (Step S 50 ).
- the CPU 21 uploads a diagnosis etc., which is input to the test terminal 20 , to the test server 40 (Step S 60 ).
- the CPU 41 registers the uploaded information such as a diagnosis in the database 47 a (Step S 70 ).
- Step S 70 After the registration in the database 47 a in Step S 70 or in the case where it is determined in Step S 47 that a test is not implemented (N of Step S 47 ), the processing returns back to Step S 10 and the processing described above is repeated.
- test terminal 20 determines whether the calculated positive predictive value is a realistic value or not, and if it is realistic, recommends the doctor to implement a test.
- FIG. 23 is a diagram showing prevalence rates of a plurality of regions for which test results are already accumulated, and a state where a prevalence rate of a region where a test is not yet performed is predicted in accordance with distances from the plurality of regions.
- the prevalence rates of the cities A, B, and C are obtained using the test terminal 20 , distances between the cities are input to the test terminal 20 , and the test terminal 20 is caused to perform a calculation based on the mathematical expression shown in the figure. This allows the prevalence rate of the city D to be predicted.
- a prevalence rate of a region where a test is not implemented can be predicted, for example, a guideline showing a region in which a mobile hospital or the like should perform a diagnosis or treatment next can be obtained.
- a prevalence rate of a certain region is assumed to be inversely proportional to the square of a distance from another region.
- the weighting correction may be performed based on a factor having an influence on infection, that is, at least one of a traffic situation between cities or a distance considering geographic features, a measurement time, a population density, and a medical level.
- the test system 10 provides a current prevalence rate.
- a future predicted prevalence rate is also provided in addition to the current prevalence rate. It should be noted that processing to provide a future predicted prevalence rate may be performed in the test server 40 or in the test terminal 20 , or may be shared between them. Here, description will be given on the assumption that the processing is performed in the test server 40 .
- FIG. 24 is a flowchart for describing a processing flow to provide a future predicted prevalence rate as well, in addition to a current prevalence rate.
- a future predicted prevalence rate after a certain time period is calculated based on a change rate of the prevalence rate during a certain time period up to the present. Further, in this processing, when a predicted prevalence rate exceeds a predetermined threshold value, warning is displayed. It should be noted that in this flowchart, only a part on processing to be described here is shown, and the step of storing a past prevalence rate, which is to be a precondition for the processing, as history information in the storage unit 47 is not described.
- the CPU 41 of the test server 40 calculates a current prevalence rate (Step S 100 ). This processing is performed by the method described above.
- the CPU 41 reads a prevalence rate before a certain time period, from history information of the storage unit 47 (Step S 101 ).
- “Before certain time period” means before 24 hours, for example.
- the CPU 41 calculates a change rate of a prevalence rate per unit time, based on the prevalence rate before a certain time period and the current prevalence rate (Step S 102 ).
- the CPU 41 calculates a predicted prevalence rate after a certain time period, based on the current prevalence rate and the change rate of the prevalence rate per unit time (Step S 103 ).
- the CPU 41 determines whether the predicted prevalence rate exceeds a predetermined threshold value or not (Step S 104 ).
- the CPU 41 gives a warning of future infection spread to the user (Step S 105 ).
- the warning given here may be given by any method.
- the warning may be displayed on the display unit 26 of the test terminal 20 or may be given via e-mails, web pages on the Internet, and various types of SNS (Social Networking Service).
- the configuration has been described in which information such as the prevalence rate is downloaded from the test server 40 each time a test is performed on the test terminal 20 side.
- the downloaded information such as the prevalence rate is cached in the test terminal 20 .
- the test terminal 20 does not demand the test server 40 to provide information such as the prevalence rate each time a test is performed, but uses the information such as the prevalence rate cached in the test terminal 20 during a certain time period.
- the whole processing is roughly divided into two processing groups according to a frequency of the processing.
- One processing group is for processing performed on a predetermined certain-time-period basis, from count of the prevalence rate in the test server 40 to downloading of the prevalence rate, caching of the prevalence rate, and the like.
- the other processing group is for processing performed each time a test is performed, from reading of a cached prevalence rate and the like, to implementation of a test and reflection of a test result on the database 47 a .
- the predetermined certain-time-period basis may be, for example, 30 minutes, 3 hours, or one day.
- FIG. 25 is a flowchart showing processing on a predetermined certain-time-period basis and processing in each implementation of test.
- Steps S 10 to S 30 are the same as those described above, and thus simply described.
- the CPU 41 of the test server 40 counts and calculates a prevalence rate using the database 47 a in the test server 40 (Step S 10 ).
- the CPU 21 of the test terminal 20 downloads the prevalence rate calculated in the test server 40 (Step S 20 ).
- the CPU 21 calculates a positive predictive value and a negative predictive value (Step S 30 ).
- the CPU 21 stores (caches) the downloaded prevalence rate and the calculated positive predictive value and negative predictive value in the storage unit 27 (Step S 31 ).
- Step S 31 After the processing of Step S 31 is completed and a predetermined certain time period is elapsed, the processing is returned to Step S 10 and repeated.
- Steps S 40 to S 70 are the same as those described above, and thus simply described.
- the CPU 21 of the test terminal 20 reads a prevalence rate, a positive predictive value, and a negative predictive value from the cache in the storage unit 27 (Step S 32 ).
- the CPU 21 presents the prevalence rate, the positive predictive value, and the negative predictive value to a user or a doctor via the display unit 26 (Step S 40 ).
- Step S 50 a test is implemented according to an instruction of the user.
- the CPU 21 uploads a diagnosis etc., which is input to the test terminal 20 , to the test server 40 (Step S 60 ).
- the CPU 41 registers the uploaded information such as a diagnosis in the database 47 a (Step S 70 ).
- the configuration of this modified example is effective because the cache size of the storage unit 27 is suppressed to be low. Further, also in the case where the modified example described above in which target data is narrowed down by patient attributes is applied, it is effective because of the same reason when the number of categories in a certain attribute is small. For example, in the case where a prevalence rate on a gender basis is cached, a prevalence rate to be stored includes only two types.
- using the configuration of the modified example allows a reduction of a load of the test server 40 or a reduction of communication charges between the test server 40 and the test terminals 20 , as compared with a configuration in which the prevalence rate and the like are counted in the test server 40 in each implementation of test and a count result is downloaded.
- the test terminal 20 downloads information such as a prevalence rate on a certain-time-period basis, but the present technology is not limited thereto.
- a configuration may be adopted, in which the test server 40 distributes a count result such as a prevalence rate to the test terminal 20 on a certain-time-period basis.
- the configuration has been described in which the doctor inputs a final diagnosis etc. to the test terminal 20 and the test terminal 20 uploads the final diagnosis etc. to the test server 40 .
- a configuration will be described in which information such as a diagnosis is uploaded to the test server 40 via a local system such as an LIS (Laboratory Information System) in a hospital or a cloud system on the Internet.
- LIS Laboratory Information System
- FIG. 26 is a diagram showing a configuration for uploading a diagnosis etc. using the LIS.
- the left part of the diagram shows a configuration in which a prevalence rate etc. are downloaded from the test server 40 and directly uploads a diagnosis etc. from the test terminal 20 to the test server 40 .
- the configuration is described above.
- the center part of the diagram shows a configuration in which a doctor inputs a diagnosis to an LIS and the LIS uploads the diagnosis etc. to the test server 40 .
- the right part of the diagram shows a configuration in which a doctor inputs a diagnosis to an LIS, the LIS transfers the diagnosis to the test terminal 20 , and the test terminal 20 uploads the diagnosis to the test server 40 .
- a configuration may be adopted in which a doctor inputs a final diagnosis to a system capable of accessing a wide range, such as a cloud system over the Internet, using a smartphone or a tablet PC, for example.
- the diagnosis etc. are transferred from the cloud system to the test server 40 .
- the modified example has been described in which the information such as a diagnosis is uploaded to the test server 40 via the local system such as an LIS in a hospital or the cloud system over the Internet.
- test terminal 20 recommends medication to the user.
- the recommendation for medication may be performed based on the level of the prevalence rate, the positive predictive value, and the negative predictive value, based on a result of an implemented test, or based on a final diagnosis of the doctor.
- the recommendation for medication specifically refers to display of, for example, the presence or absence of the necessity of medication, a name of a medicine to be given, and a list of medicines to be medication candidates, on the display unit 26 .
- the configurations for displaying, on the display unit 26 of the test terminal 20 a general prevalence rate, a prevalence rate as a result of narrowing-down by an attribute, a prevalence rate as a result of weighting, a positive rate as a substitute for the prevalence rate, recommendation for test implementation/non-implementation, a predicted prevalence rate, a recommendation for medication, a recommendation for individual management of patients, and the like have been individually described.
- a configuration in which those displays are integrated will be described, for example.
- FIG. 27 is a diagram showing a specific example in which a list of test methods feasible by the test device 28 of the test terminal 20 is presented on the test terminal 20 in addition to a name of a disease, a prevalence rate, a positive predictive value, and a negative predictive value, and a recommended test method is further displayed thereon.
- a PCR method is displayed with highlight together with a recommendation mark 26 a .
- a UI User Interface
- a test start button 26 b for instructing the test terminal 20 to start testing directly from this display screen is displayed.
- a UI for instructing a start of a test may have a configuration to give an instruction by a tracing operation or the like, in addition to a button.
- a screen displaying UIs for performing the following operations may be provided.
- a UI for giving an instruction to upload a test result to the test server 40 may be displayed on a screen displayed when a test is ended.
- a UI for giving an instruction to upload a diagnosis to the test server 40 may be displayed on a screen indicating the input completion of the diagnosis.
- a UI for giving an instruction to start the next test may be displayed on the screen.
- a UI for transferring to a screen for viewing statistical information such as the prevalence rate, the positive predictive value, and the negative predictive value may be provided on a screen displayed when the test is ended.
- test terminal 20 After a final diagnosis of the doctor is input, it may be possible to display a screen on which various conditions for treatment desired by patients are input to the test terminal 20 , to introduce hospitals and pharmacies corresponding to those conditions.
- test system 10 adopts a client server configuration and the test terminal 20 as a client and the test server 40 as a server share processing.
- test terminal 20 is limited to minimum processing, and most processing is performed by the test server 40 .
- the function of the test terminal 20 may be limited to display of information received from a test server, input of patient information etc., transmission of input data to the test server 40 , execution of a test, display of a test result and transmission thereof to the test server 40 , and input of a diagnosis of a doctor and transmission thereof to the test server 40 .
- the count, the calculation processing, the determination processing, and the like are performed by the test server 40 , and thus the configuration of the test terminal 20 can be simplified and costs can be reduced.
- test terminal 20 in the case where a new function is added, only the configuration of the test server 40 may be changed.
- the test terminal 20 does not need any change. Consequently, it is possible to omit time and effort for modifying many test terminals 20 .
- the modified example has been described in which the processing performed by the test terminal 20 is limited to minimum processing, and most processing is performed by the test server 40 .
- test system 10 the test system 10
- test server 40 the test terminal 20
- test terminal 20 the outline of the configurations and functions of the test system 10 , the test server 40 , and the test terminal 20 according to the present technology will be summarized.
- the test server 40 includes the network interface unit 45 and the CPU 41 .
- the network interface unit 45 communicates with the plurality of test terminals 20 via the network 30 , the plurality of test terminals 20 each being connectable to a test device capable of executing a test on the presence or absence of a disease and each being capable of inputting a diagnosis on the presence or absence of the disease, the diagnosis being related to the test and made by a doctor.
- the CPU 41 acquires at least one of a result of the test and the diagnoses as a test information item from each of the plurality of test terminals 20 via the network interface unit 45 , causes the storage unit 47 to store the plurality of acquired test information items therein, performs statistical processing on the plurality of stored test information items, and causes the network interface unit 45 to return a result of the statistical processing according to a demand given from each of the plurality of test terminals 20 before the doctor makes a diagnosis.
- the test terminal 20 of the present technology includes the network interface unit 25 , the operation input unit 24 , and the CPU 21 .
- the network interface unit 25 communicates with the test server 40 via the network 30 , the test server 40 collecting a plurality of sets of at least one of a result of a test on the presence or absence of a disease and a diagnosis on the presence or absence of the disease as test information items, and providing a result of statistical processing performed on the plurality of collected test information items, the diagnosis being related to the test and made by a doctor.
- the operation input unit 24 receives an input from a user or the doctor.
- the CPU 21 causes the network interface unit 25 to transmit a demand of the result of the statistical processing to the test server 40 , causes the test device 28 to execute the test, presents the result of the statistical processing and a result of the executed test to the user, the result of the statistical processing being received via the network interface unit 25 from the test server 40 , causes the user to input the diagnosis on the executed test, using the operation input unit 24 , and causes the network interface unit 25 to transmit at least one of the result of the executed test and the input diagnosis as the test information item to the test server 40 .
- the test system 10 of the present technology includes the test server 40 and the plurality of test terminals 20 .
- the test server 40 includes the network interface unit 45 and the CPU 41 .
- the network interface unit 45 communicates with the plurality of test terminals 20 via the network 30 .
- the CPU 41 acquires at least one of a result of a test on the presence or absence of a disease and a diagnosis on the presence or absence of the disease as a test information item from each of the plurality of test terminals 20 via the network interface unit 45 , the diagnosis being related to the test and made by a doctor, causes the storage unit 47 to store the plurality of acquired test information items therein, performs statistical processing on the plurality of stored test information items, and causes the network interface unit 45 to return a result of the statistical processing according to a demand given from each of the plurality of test terminals 20 before the doctor makes a diagnosis.
- the plurality of test terminals 20 each include the network interface unit 25 , the operation input unit 24 , and the CPU 21 .
- the network interface unit 25 communicates with the test server 40 via the network 30 .
- the operation input unit 24 receives an input from a user or the doctor.
- the CPU 21 causes the network interface unit 25 to transmit the demand of the result of the statistical processing to the test server 40 , causes a test device to execute the test, presents the result of the statistical processing and a result of the executed test to the user, the result of the statistical processing being received via the network interface unit 25 from the test server 40 , causes the user to input the diagnosis on the executed test, using the operation input unit 24 , and causes the network interface unit 25 to transmit at least one of the result of the executed test and the input diagnosis as the test information item to the test server 40 .
- test system 10 for example, the following effects can be obtained.
- present technology is not limited to the above embodiments and can be variously modified without departing from the gist of the present technology as a matter of course.
- a test server including:
- the communication unit that communicates with a plurality of communication terminals via a network, the plurality of communication terminals each being connectable to a test device capable of executing a test on the presence or absence of a disease and each being capable of inputting a diagnosis on the presence or absence of the disease, the diagnosis being related to the test and made by a doctor;
- control unit causes the communication unit to return at least one of a prevalence rate, a positive predictive value, and a negative predictive value that are calculated as the result of the statistical processing, based on the number of test information items in which the result of the test and the diagnosis are positive, the number of test information items in which the result of the test is negative and the diagnosis is positive, the number of test information items in which the result of the test is positive and the diagnosis is negative, and the number of test information items in which the result of the test and the diagnosis are negative, in the plurality of stored test information items.
- control unit causes the communication unit to return the positive predictive value and the negative predictive value, in addition to the prevalence rate, the positive predictive value and the negative predictive value being calculated based on the prevalence rate, a sensitivity of the test device, and a specificity of the test device.
- test server according to any one of (1) to (4), in which
- the test device is capable of executing various types of tests
- control unit calculates, after causing the test device to execute one of the various types of tests, posttest odds in the one test based on at least one of a positive likelihood ratio and a negative likelihood ratio on the one test, transmits the posttest odds to each of the communication terminals, and acquires information on whether a subsequent test is performed or not from each of the communication terminals
- test server according to any one of (1) to (6), in which
- the test information items acquired from the communication terminals each include patient attribute information indicating an attribute of a patient who is subjected to the test, and
- control unit performs, when receiving a demand to narrow down statistical information from each of the communication terminals, the statistical processing by performing narrowing-down for test information items each having the attribute of the patient attribute information, the demand specifying any patient attribute information.
- test information items acquired from the communication terminals each include terminal attribute information indicating an attribute of each of the communication terminals that performs the test, and
- control unit performs, when receiving a demand to narrow down statistical information from each of the communication terminals, the statistical processing by performing narrowing-down for test information items each having the attribute of the terminal attribute information, the demand specifying any terminal attribute information
- control unit performs weighting on the result of the statistical processing, the weighting being based on the terminal attribute information, the result of the statistical processing being calculated based on the test information items obtained by narrowing-down.
- control unit is capable of using a positive rate instead of the prevalence rate.
- the test information item includes information for identifying a method of performing the test
- control unit is capable of using the positive rate instead of the prevalence rate in each of the methods of performing the test for an identical disease, the positive rate being the result of the statistical processing performed on a plurality of test information items acquired by one of the methods, the method satisfying preliminarily demanded predetermined values of a sensitivity and a specificity, out of sensitivities and specificities preliminarily provided to the respective methods, the prevalence rate being the result of the statistical processing performed on each of a plurality of test information items acquired by another one of the methods.
- test server according to any one of (2) to (4), in which
- control unit evaluates effectiveness of the test based on the positive predictive value, transmits an evaluation result to each of the communication terminals, and causes each of the communication terminals to present a message of recommendation or non-recommendation for the test.
- the test information items acquired from the communication terminals each include information of a region in which each of the communication terminals is located, as terminal attribute information indicating an attribute of each of the communication terminals that performs the test, and
- control unit estimates the prevalence rate in a first region in which the test is not implemented, based on prevalence rates obtained in one or more second regions that are different from the first region, and based on a factor having an influence on infection between each of the second regions and the first region.
- control unit periodically performs the statistical processing and creates history information of the prevalence rate, and predicts a future prevalence rate based on the history information.
- test server according to any one of (1) to (14), in which
- control unit returns a result of the statistical processing acquired from outside, instead of performing the statistical processing on the plurality of stored test information items.
- test server according to any one of (1) to (15), in which
- control unit transmits a list of medicines to each of the communication terminals, the medicines being based on at least one of the result of the test, the diagnosis, and the result of the statistical processing, and causes each of the communication terminals to present the list as medicines recommended for medication, or
- control unit causes each of the communication terminals to present a list of methods for the test capable of being performed in the test device, a recommendation mark indicating a method for a test recommended in the list, and a user interface for starting the test.
- a communication terminal including:
- a communication unit that communicates with a test server via a network, the test server collecting a plurality of sets of at least one of a result of a test on the presence or absence of a disease and a diagnosis on the presence or absence of the disease as test information items, and providing a result of statistical processing performed on the plurality of collected test information items, the diagnosis being related to the test and made by a doctor;
- a test system including:
- test server including
- the plurality of communication terminals each including
- a test method including:
- acquiring from a plurality of communication terminals each being connectable to a test device capable of executing a test on the presence or absence of a disease and each being capable of inputting a diagnosis on the presence or absence of the disease, at least one of a result of the test and the diagnosis as a test information item via the communication unit, the diagnosis being related to the test and made by a doctor;
- the communication unit causing the communication unit to return a result of the statistical processing according to a demand given from each of the communication terminals before the doctor makes a diagnosis.
- a test method including:
- a communication unit to transmit a demand of a result of statistical processing to a test server, the communication unit communicating with the test server via a network, the test server collecting a plurality of sets of at least one of a result of a test on the presence or absence of a disease and a diagnosis on the presence or absence of the disease as test information items, and providing the result of the statistical processing performed on the plurality of collected test information items, the diagnosis being related to the test and made by a doctor;
- the communication unit to transmit at least one of the result of the executed test and the input diagnosis as the test information item to the test server.
Abstract
Description
posttest odds=pretest odds×likelihood ratio (1)
Ω=p/(1−p) (2)
p=Ω/(1+Ω) (3)
posttest positive odds=pretest odds×positive likelihood ratio (4)
posttest negative odds=pretest odds×negative likelihood ratio (5)
positive predictive value=sensitivity×prevalence rate/(sensitivity×prevalence rate+(1−prevalence rate)(1−specificity)) (12)
negative predictive value=specificity×(1−prevalence rate)/(specificity×(1−prevalence rate)+prevalence rate×(1−sensitivity)) (13)
positive predictive value=sensitivity×prevalence rate/(sensitivity×prevalence rate+(1−prevalence rate)(1−specificity)) (12)
negative predictive value=specificity×(1−prevalence rate)/(specificity×(1−prevalence rate)+prevalence rate×(1−sensitivity)) (13)
prevalence rate=number of diseases/total number (6)
(predicted true prevalence rate)=f(k)×(diagnosis prevalence rate) (14)
(positive rate)=(number of test positive cases)/(total number of diagnoses) (15)
positive predictive value=sensitivity i×positive rate p/(sensitivity i×positive rate p+(1−positive rate p)(1−specificity i)) (16)
negative predictive value=specificity i×(1−positive rate p)/(specificity i×(1−positive rate p)+positive rate p×(1−sensitivity i)) (17)
(change rate of prevalence rate per unit time)=((current prevalence rate)−(prevalence rate before 24 hours))/24 (18)
- (a) use an average of a plurality of prevalence rates that are acquired on a finer time basis (for example, every one hour) to serve as a current prevalence rate or a prevalence rate before a certain time period; and
- (b) calculate change rates on a shorter time basis and obtain an average of those change rates.
(predicted prevalence rate after 24 hours)=(current prevalence rate)+(change rate per unit time)×24 (19)
- (1) Providing information to be indices for diagnosis, such as a prevalence rate, based on information acquired from
many test terminals 20 can improve the degree of accuracy of a final diagnosis made by a doctor. - (2) Narrowing down and weighting information accumulated in the
database 47 a can further enhance the degree of accuracy of provided information such as a prevalence rate. - (3) Acquiring information that is not present in the
test system 10 from outside can provide more useful information to a doctor, in addition to a prevalence rate and the like. - (4) Change only on the
test server 40 side can provide new information based on a new function to a doctor. - (5) Unlike a typical test system, it is possible to cope with an infection and the like with instantaneity.
[Supplementary Note]
-
- acquires at least one of a result of the test and the diagnosis as a test information item from each of the plurality of communication terminals via the communication unit,
- causes a storage unit to store the plurality of acquired test information items therein,
- performs statistical processing on the plurality of stored test information items, and
- causes the communication unit to return a result of the statistical processing according to a demand given from each of the communication terminals before the doctor makes a diagnosis.
-
- acquires, from each of the communication terminals, an elapsed time from the development of a disease of a patient who is to be subjected to the test,
- acquires a sensitivity and a specificity that correspond to the elapsed time from the development of the disease, and
- calculates the positive predictive value and the negative predictive value based on the acquired sensitivity and specificity.
-
- causes the test device to execute various types of tests for testing the disease, the test device being connected to each of the communication terminals,
- acquires results of the executed various types of tests from the test device, and
- determines a result of the test indicating the presence or absence of the disease, based on the acquired results of the various types of tests.
-
- causes the communication unit to transmit a demand of the result of the statistical processing to the test server,
- causes a test device to execute the test,
- presents the result of the statistical processing and a result of the executed test to the user, the result of the statistical processing being received via the communication unit from the test server,
- causes the user to input the diagnosis on the executed test, using the input unit, and
- causes the communication unit to transmit at least one of the result of the executed test and the input diagnosis as the test information item to the test server.
-
- a first communication unit that communicates with the plurality of communication terminals via a network, and
- a first control unit that
- acquires at least one of a result of a test on the presence or absence of a disease and a diagnosis on the presence or absence of the disease as a test information item from each of the plurality of communication terminals via the communication unit, the diagnosis being related to the test and made by a doctor,
- causes a storage unit to store the plurality of acquired test information items therein,
- performs statistical processing on the plurality of stored test information items, and
- causes the communication unit to return a result of the statistical processing according to a demand given from each of the communication terminals before the doctor makes a diagnosis,
-
- a second communication unit that communicates with the test server via the network,
- an input unit that receives an input from a user or the doctor, and
- a second control unit that
- causes the communication unit to transmit the demand of the result of the statistical processing to the test server,
- causes a test device to execute the test,
- presents the result of the statistical processing and a result of the executed test to the user, the result of the statistical processing being received via the communication unit from the test server,
- causes the user to input the diagnosis on the executed test, using the input unit, and
- causes the communication unit to transmit at least one of the result of the executed test and the input diagnosis as the test information item to the test server.
Claims (15)
Applications Claiming Priority (4)
| Application Number | Priority Date | Filing Date | Title |
|---|---|---|---|
| JPJP2013-265133 | 2013-12-24 | ||
| JP2013-265133 | 2013-12-24 | ||
| JP2013265133 | 2013-12-24 | ||
| PCT/JP2014/005778 WO2015097977A1 (en) | 2013-12-24 | 2014-11-18 | Inspection server, communication terminal, inspection system, and inspection method |
Related Parent Applications (1)
| Application Number | Title | Priority Date | Filing Date |
|---|---|---|---|
| PCT/JP2014/005778 A-371-Of-International WO2015097977A1 (en) | 2013-12-24 | 2014-11-18 | Inspection server, communication terminal, inspection system, and inspection method |
Related Child Applications (1)
| Application Number | Title | Priority Date | Filing Date |
|---|---|---|---|
| US17/694,022 Division US20220208316A1 (en) | 2013-12-24 | 2022-03-14 | Test server, communication terminal, test system, and test method |
Publications (2)
| Publication Number | Publication Date |
|---|---|
| US20160314254A1 US20160314254A1 (en) | 2016-10-27 |
| US11302425B2 true US11302425B2 (en) | 2022-04-12 |
Family
ID=53477892
Family Applications (2)
| Application Number | Title | Priority Date | Filing Date |
|---|---|---|---|
| US15/103,958 Active 2037-11-25 US11302425B2 (en) | 2013-12-24 | 2014-11-18 | Test server, communication terminal, test system, and test method |
| US17/694,022 Pending US20220208316A1 (en) | 2013-12-24 | 2022-03-14 | Test server, communication terminal, test system, and test method |
Family Applications After (1)
| Application Number | Title | Priority Date | Filing Date |
|---|---|---|---|
| US17/694,022 Pending US20220208316A1 (en) | 2013-12-24 | 2022-03-14 | Test server, communication terminal, test system, and test method |
Country Status (5)
| Country | Link |
|---|---|
| US (2) | US11302425B2 (en) |
| EP (1) | EP3040938A4 (en) |
| JP (3) | JP6465033B2 (en) |
| CN (1) | CN105849769A (en) |
| WO (1) | WO2015097977A1 (en) |
Cited By (1)
| Publication number | Priority date | Publication date | Assignee | Title |
|---|---|---|---|---|
| US20200118692A1 (en) * | 2014-03-20 | 2020-04-16 | Quidel Corporation | System for collecting and displaying diagnostics from diagnostic instruments |
Families Citing this family (8)
| Publication number | Priority date | Publication date | Assignee | Title |
|---|---|---|---|---|
| US11087860B2 (en) * | 2015-10-27 | 2021-08-10 | Koninklijke Philips N.V. | Pattern discovery visual analytics system to analyze characteristics of clinical data and generate patient cohorts |
| US11164680B2 (en) | 2016-12-14 | 2021-11-02 | Reliant Immune Diagnostics, Inc. | System and method for initiating telemedicine conference using self-diagnostic test |
| US11295859B2 (en) | 2016-12-14 | 2022-04-05 | Reliant Immune Diagnostics, Inc. | System and method for handing diagnostic test results to telemedicine provider |
| US11915810B2 (en) * | 2016-12-14 | 2024-02-27 | Reliant Immune Diagnostics, Inc. | System and method for transmitting prescription to pharmacy using self-diagnostic test and telemedicine |
| AU2018368735A1 (en) * | 2017-11-20 | 2020-04-30 | Siemens Healthcare Diagnostics Inc. | Multiple diagnostic engine environment |
| CN109831513A (en) * | 2019-02-28 | 2019-05-31 | 广州达安临床检验中心有限公司 | Data processing method, system and device |
| WO2021207553A1 (en) * | 2020-04-10 | 2021-10-14 | GE Precision Healthcare LLC | Systems and methods for determining patient disease load |
| KR102580404B1 (en) * | 2021-02-15 | 2023-09-19 | (주)아이쿱 | Lab connect service method and system |
Citations (15)
| Publication number | Priority date | Publication date | Assignee | Title |
|---|---|---|---|---|
| JP2002117139A (en) | 2000-10-05 | 2002-04-19 | Matsushita Electric Ind Co Ltd | Managing method for examination information |
| JP2003263507A (en) | 2002-03-12 | 2003-09-19 | Nippon Colin Co Ltd | Method and device for providing statistical medical information |
| US20040059215A1 (en) * | 2001-10-22 | 2004-03-25 | Olympus Optical Co., Ltd. | Diagnostic support apparatus |
| JP2006501534A (en) | 2002-02-27 | 2006-01-12 | イメージング セラピューティクス,インコーポレーテッド | System and method for building and operating a centralized measurement database |
| US20060059015A1 (en) * | 2004-09-15 | 2006-03-16 | Van Kalken Coenraad K | Computer installation for establishing a diagnosis |
| US20080021288A1 (en) | 2006-07-24 | 2008-01-24 | Brad Bowman | Method and system for generating personalized health information with accommodation for consumer health terminology |
| JP2009009396A (en) | 2007-06-28 | 2009-01-15 | Health Insurance Society For Photonics Group | Medical examination information management system and management method |
| JP2009005940A (en) | 2007-06-28 | 2009-01-15 | Health Insurance Society For Photonics Group | Medical checkup information management system, and management method |
| US20090094063A1 (en) | 2006-03-13 | 2009-04-09 | Koninklijke Philips Electronics, N.V. | Display and method for medical procedure selection |
| JP2009095649A (en) | 2007-09-26 | 2009-05-07 | Fujifilm Corp | Medical information processing system, medical information processing method, and program |
| US20110020785A1 (en) | 2007-07-26 | 2011-01-27 | T2 Biosystems, Inc. | Diagnostic Information Generation and Use |
| JP2011128935A (en) | 2009-12-18 | 2011-06-30 | Noriaki Aoki | Infection disease prediction system |
| JP2012508383A (en) | 2008-11-11 | 2012-04-05 | プロメテウス ラボラトリーズ インコーポレイテッド | Method for predicting inflammatory bowel disease (IBD) using serological markers |
| JP2013093019A (en) | 2011-10-05 | 2013-05-16 | A & T Corp | Medical decision-making support database and medical decision-making support method |
| US20130316374A1 (en) * | 2010-09-22 | 2013-11-28 | Imba - Institut Fur Molekulare Biotechnologie Gmbh | Breast cancer diagnostics |
Family Cites Families (4)
| Publication number | Priority date | Publication date | Assignee | Title |
|---|---|---|---|---|
| US9746985B1 (en) * | 2008-02-25 | 2017-08-29 | Georgetown University | System and method for detecting, collecting, analyzing, and communicating event-related information |
| AU2010308329B2 (en) * | 2009-10-19 | 2016-10-13 | Labrador Diagnostics Llc | Integrated health data capture and analysis system |
| EP2365456B1 (en) * | 2010-03-11 | 2016-07-20 | CompuGroup Medical SE | Data structure, method and system for predicting medical conditions |
| US9075909B2 (en) * | 2011-11-20 | 2015-07-07 | Flurensics Inc. | System and method to enable detection of viral infection by users of electronic communication devices |
-
2014
- 2014-11-18 WO PCT/JP2014/005778 patent/WO2015097977A1/en active Application Filing
- 2014-11-18 CN CN201480068700.2A patent/CN105849769A/en active Pending
- 2014-11-18 US US15/103,958 patent/US11302425B2/en active Active
- 2014-11-18 JP JP2015554514A patent/JP6465033B2/en active Active
- 2014-11-18 EP EP14875561.4A patent/EP3040938A4/en not_active Ceased
-
2019
- 2019-01-10 JP JP2019002649A patent/JP6747529B2/en active Active
-
2020
- 2020-08-06 JP JP2020134080A patent/JP7074165B2/en active Active
-
2022
- 2022-03-14 US US17/694,022 patent/US20220208316A1/en active Pending
Patent Citations (15)
| Publication number | Priority date | Publication date | Assignee | Title |
|---|---|---|---|---|
| JP2002117139A (en) | 2000-10-05 | 2002-04-19 | Matsushita Electric Ind Co Ltd | Managing method for examination information |
| US20040059215A1 (en) * | 2001-10-22 | 2004-03-25 | Olympus Optical Co., Ltd. | Diagnostic support apparatus |
| JP2006501534A (en) | 2002-02-27 | 2006-01-12 | イメージング セラピューティクス,インコーポレーテッド | System and method for building and operating a centralized measurement database |
| JP2003263507A (en) | 2002-03-12 | 2003-09-19 | Nippon Colin Co Ltd | Method and device for providing statistical medical information |
| US20060059015A1 (en) * | 2004-09-15 | 2006-03-16 | Van Kalken Coenraad K | Computer installation for establishing a diagnosis |
| US20090094063A1 (en) | 2006-03-13 | 2009-04-09 | Koninklijke Philips Electronics, N.V. | Display and method for medical procedure selection |
| US20080021288A1 (en) | 2006-07-24 | 2008-01-24 | Brad Bowman | Method and system for generating personalized health information with accommodation for consumer health terminology |
| JP2009009396A (en) | 2007-06-28 | 2009-01-15 | Health Insurance Society For Photonics Group | Medical examination information management system and management method |
| JP2009005940A (en) | 2007-06-28 | 2009-01-15 | Health Insurance Society For Photonics Group | Medical checkup information management system, and management method |
| US20110020785A1 (en) | 2007-07-26 | 2011-01-27 | T2 Biosystems, Inc. | Diagnostic Information Generation and Use |
| JP2009095649A (en) | 2007-09-26 | 2009-05-07 | Fujifilm Corp | Medical information processing system, medical information processing method, and program |
| JP2012508383A (en) | 2008-11-11 | 2012-04-05 | プロメテウス ラボラトリーズ インコーポレイテッド | Method for predicting inflammatory bowel disease (IBD) using serological markers |
| JP2011128935A (en) | 2009-12-18 | 2011-06-30 | Noriaki Aoki | Infection disease prediction system |
| US20130316374A1 (en) * | 2010-09-22 | 2013-11-28 | Imba - Institut Fur Molekulare Biotechnologie Gmbh | Breast cancer diagnostics |
| JP2013093019A (en) | 2011-10-05 | 2013-05-16 | A & T Corp | Medical decision-making support database and medical decision-making support method |
Non-Patent Citations (16)
| Title |
|---|
| Akiyuki Okubo, "Kyokaichi towa", The Japanese Journal of Clinical and Experimental Medicine, ISSN0021-4965, vol. 72, No. 9, Sep. 1995, pp. 7. |
| Akiyuki Okubo, "Regarding Boundary Values", The Japanese Journal of Clinical and Experimental Medicine,vol. 72, No. 9, Sep. 1995, 2119-2123 pages. |
| Akiyuki Okubo, "What Is Boundary Value? Clinical Operation and Research", The Japanese Journal of Clinical and Experimental Medicine, vol. 72, No. 9, Sep. 20, 1995, pp. 2119-2123. |
| Alba, Davey; "This Device Diagnoses Hundreds of Diseases Using a Single Drop of Blood;" Nov. 10, 2014; WIRED, 4 pages https://www.wired.com/2014/11/device-diagnoses-hundreds-diseases-using-single-drop-blood/(Year: 2014). * |
| Anthony Kwaku Akobeng, "Understanding diagnostic tests 1 : sensitivity, specificity and predictive values", Acta Paediatrica, vol. 96, No. 3, Mar. 2007, pp. 338-341. |
| Anthony Kwaku Akobeng, "Understanding diagnostic tests 2: Likelihood ratios, pre- and post-test probabilities and their use in clinical practice", Acta Paediatrica, vol. 96, No. 4, Apr. 2007, pp. 487-491. |
| Anthony Kwaku Akobeng, "Understanding diagnostic tests 3: receiver operating characteristic curves", Acta Paediatrica, vol. 96, No. 5, May 2007, pp. 644-647. |
| International preliminary report on patentability for PCT Application No. PCT/JP2014/005778, dated Jun. 28, 2016, 5 pages. |
| International Search report on patentability received for PCT Application No. PCT/JP2014/005778, dated Jan. 20, 2015, pp. 1. |
| Office Action for CN Patent Application No. 201480068700.2, dated Mar. 11, 2019, 06 pages of Office Action and 09 pages of English Translation. |
| Office Action for JP Patent Application No. 2015-554514, dated Sep. 25, 2018, 03 pages of Office Action and 03 pages of English Translation. |
| Office Action for JP Patent Application No. 2019-002649, dated Apr. 21, 2020, 03 pages of Office Action and 04 pages of English Translation. |
| Office Action for JP Patent Application No. 2020-134080, dated Sep. 14, 2021, 4 pages of Office Action and 1 pages of English Translation. |
| The Japanese Journal of Clinical and Experimental Medicine, ISSN0021-4965, vol. 72, No. 9, Sep. 1995, pp. 7. |
| Watase, et al., "Geospatial Analysis Of Tuberculosis In Tokyo", Tokyo, Japan, vol. 81, No. 7, Jul. 15, 2006, pp. 481-485. |
| Written Opinion received for PCT Application No. PCT/JP2014/005778, dated Jan. 20, 2015, pp. 5. |
Cited By (1)
| Publication number | Priority date | Publication date | Assignee | Title |
|---|---|---|---|---|
| US20200118692A1 (en) * | 2014-03-20 | 2020-04-16 | Quidel Corporation | System for collecting and displaying diagnostics from diagnostic instruments |
Also Published As
| Publication number | Publication date |
|---|---|
| JPWO2015097977A1 (en) | 2017-03-23 |
| JP7074165B2 (en) | 2022-05-24 |
| WO2015097977A1 (en) | 2015-07-02 |
| CN105849769A (en) | 2016-08-10 |
| EP3040938A4 (en) | 2017-05-10 |
| US20160314254A1 (en) | 2016-10-27 |
| JP6747529B2 (en) | 2020-08-26 |
| JP6465033B2 (en) | 2019-02-06 |
| US20220208316A1 (en) | 2022-06-30 |
| JP2019053789A (en) | 2019-04-04 |
| JP2020177710A (en) | 2020-10-29 |
| EP3040938A1 (en) | 2016-07-06 |
Similar Documents
| Publication | Publication Date | Title |
|---|---|---|
| US20220208316A1 (en) | Test server, communication terminal, test system, and test method | |
| Hay et al. | Estimating epidemiologic dynamics from cross-sectional viral load distributions | |
| Vos et al. | Rapid molecular tests for influenza, respiratory syncytial virus, and other respiratory viruses: a systematic review of diagnostic accuracy and clinical impact studies | |
| Riffe et al. | Data resource profile: COVerAGE-DB: a global demographic database of COVID-19 cases and deaths | |
| Henderson et al. | Rising incidence of pediatric inflammatory bowel disease in Scotland | |
| Crepaz et al. | Durable viral suppression and transmission risk potential among persons with diagnosed HIV infection: United States, 2012–2013 | |
| US11250934B2 (en) | Test server, test method, and test system | |
| Jones et al. | Trends in antibiotic use and nosocomial pathogens in hospitalized veterans with pneumonia at 128 medical centers, 2006–2010 | |
| Antoniou et al. | Validation of case-finding algorithms derived from administrative data for identifying adults living with human immunodeficiency virus infection | |
| Wiens et al. | Learning data-driven patient risk stratification models for Clostridium difficile | |
| Berkowitz et al. | Multilevel small-area estimation of colorectal cancer screening in the United States | |
| Ehrenstein et al. | Medical databases in studies of drug teratogenicity: methodological issues | |
| Brinkman et al. | A comparison of the performance of a model based on administrative data and a model based on clinical data: effect of severity of illness on standardized mortality ratios of intensive care units | |
| Nakken et al. | Assessing amyotrophic lateral sclerosis prevalence in Norway from 2009 to 2015 from compulsory nationwide health registers | |
| Kadatz et al. | Predicting progression in CKD: perspectives and precautions | |
| Michelson et al. | Timing and location of emergency department revisits | |
| Lesko et al. | Critical review: Measuring the HIV care continuum using public health surveillance data in the United States | |
| Do et al. | Area-level variation and human papillomavirus vaccination among adolescents and young adults in the United States: a systematic review | |
| Tetzlaff et al. | Identifying time trends in multimorbidity—defining multimorbidity in times of changing diagnostic practices | |
| Manrai et al. | Signals among signals: prioritizing nongenetic associations in massive data sets | |
| Lisspers et al. | Developing a short-term prediction model for asthma exacerbations from Swedish primary care patients’ data using machine learning-Based on the ARCTIC study | |
| Feng et al. | A model-based meta-analysis of willingness to participate in cancer screening | |
| Rasmussen et al. | Use of risk-adjusted CUSUM charts to monitor 30-day mortality in Danish hospitals | |
| Barnes et al. | Emergency department testing patterns for sexually transmitted diseases in North Texas | |
| Zhu et al. | Patient preferences on general health and colorectal cancer screening decision-making: Results from a national survey |
Legal Events
| Date | Code | Title | Description |
|---|---|---|---|
| AS | Assignment |
Owner name: SONY CORPORATION, JAPAN Free format text: ASSIGNMENT OF ASSIGNORS INTEREST;ASSIGNORS:NAKAMURA, TOMOHIKO;MORIMOTO, NAOKI;SIGNING DATES FROM 20160222 TO 20160224;REEL/FRAME:038969/0726 |
|
| STPP | Information on status: patent application and granting procedure in general |
Free format text: NON FINAL ACTION MAILED |
|
| STPP | Information on status: patent application and granting procedure in general |
Free format text: RESPONSE TO NON-FINAL OFFICE ACTION ENTERED AND FORWARDED TO EXAMINER |
|
| STPP | Information on status: patent application and granting procedure in general |
Free format text: FINAL REJECTION MAILED |
|
| STPP | Information on status: patent application and granting procedure in general |
Free format text: RESPONSE AFTER FINAL ACTION FORWARDED TO EXAMINER |
|
| STPP | Information on status: patent application and granting procedure in general |
Free format text: ADVISORY ACTION MAILED |
|
| STPP | Information on status: patent application and granting procedure in general |
Free format text: DOCKETED NEW CASE - READY FOR EXAMINATION |
|
| STPP | Information on status: patent application and granting procedure in general |
Free format text: NON FINAL ACTION MAILED |
|
| STPP | Information on status: patent application and granting procedure in general |
Free format text: RESPONSE TO NON-FINAL OFFICE ACTION ENTERED AND FORWARDED TO EXAMINER |
|
| STPP | Information on status: patent application and granting procedure in general |
Free format text: NOTICE OF ALLOWANCE MAILED -- APPLICATION RECEIVED IN OFFICE OF PUBLICATIONS |
|
| STPP | Information on status: patent application and granting procedure in general |
Free format text: NOTICE OF ALLOWANCE MAILED -- APPLICATION RECEIVED IN OFFICE OF PUBLICATIONS |
|
| STPP | Information on status: patent application and granting procedure in general |
Free format text: PUBLICATIONS -- ISSUE FEE PAYMENT VERIFIED |
|
| STCF | Information on status: patent grant |
Free format text: PATENTED CASE |