US11222038B2 - Generating an outside-in hierarchical tree visualization - Google Patents
Generating an outside-in hierarchical tree visualization Download PDFInfo
- Publication number
- US11222038B2 US11222038B2 US15/235,824 US201615235824A US11222038B2 US 11222038 B2 US11222038 B2 US 11222038B2 US 201615235824 A US201615235824 A US 201615235824A US 11222038 B2 US11222038 B2 US 11222038B2
- Authority
- US
- United States
- Prior art keywords
- program instructions
- concentric rings
- tree data
- data
- node
- Prior art date
- Legal status (The legal status is an assumption and is not a legal conclusion. Google has not performed a legal analysis and makes no representation as to the accuracy of the status listed.)
- Active, expires
Links
Images


Classifications
-
- G—PHYSICS
- G06—COMPUTING; CALCULATING OR COUNTING
- G06F—ELECTRIC DIGITAL DATA PROCESSING
- G06F16/00—Information retrieval; Database structures therefor; File system structures therefor
- G06F16/20—Information retrieval; Database structures therefor; File system structures therefor of structured data, e.g. relational data
- G06F16/26—Visual data mining; Browsing structured data
-
- G—PHYSICS
- G06—COMPUTING; CALCULATING OR COUNTING
- G06F—ELECTRIC DIGITAL DATA PROCESSING
- G06F16/00—Information retrieval; Database structures therefor; File system structures therefor
- G06F16/90—Details of database functions independent of the retrieved data types
- G06F16/904—Browsing; Visualisation therefor
Definitions
- Embodiments of the inventive subject matter generally relate to the field of computers, and, more particularly, to generating a data visualization.
- Data visualization also referred to as information visualization, involves visually representing abstracted information.
- Data visualization can utilize various types of techniques, including graph drawings, plots, information graphics, tables, charts, histograms, networks, treemaps, sunbursts, etc.
- current data visualization techniques have challenges, such as presenting hierarchical data compactly, uniformly, and in a way that emphasizes any given level of a hierarchy in a confined space for easy comparison.
- a data visualization tool configured to generate a visualization for tree data.
- the tool can calculate a number of hierarchical levels of the tree data.
- the tool can further subdivide a presentation area for the data visualization into a number of concentric parts.
- the concentric parts are equivalent to the number of hierarchical levels.
- Each of the concentric parts corresponds to one of the hierarchical levels.
- the tool can graphically generate the data visualization for presentation via an electronic display.
- a first of the concentric parts that corresponds to a highest of the hierarchal levels is an outermost one of the concentric parts in the presentation area.
- Each successive concentric part inward corresponds to a next lower hierarchical level.
- FIG. 1A depicts an example of an outside-in hierarchical tree visualization (tree tunnel 100 ).
- FIG. 1B depicts an example tree 160 associated with tree tunnel 100 .
- FIG. 1C further depicts the tree tunnel 100 .
- FIG. 1D further depicts the tree tunnel 100 having nodes with modified sizes.
- FIG. 2 depicts an example tree tunnel 200 with some nodes having variable sized dimensions and visual indicators.
- FIG. 3A depicts an example of using tree tunnels in a node-link diagram.
- FIG. 3B depicts an example of using tree tunnels in a graph.
- FIG. 4 is an example flow diagram of generating a tree tunnel.
- FIG. 5A depicts constructing a tree tunnel 500 .
- FIG. 5B depicts a tree 560 corresponding to tree tunnel 500 .
- FIG. 6 depicts an example computer system 600 .
- FIG. 7 depicts an example computer network 700 .
- the bounded space is a shape that can be divided into concentric parts, such as a circle, a regular polygon, a regular polyhedral, etc.
- the outermost concentric part of the shape comprises the highest-level node (e.g., a root node) of a hierarchical data set.
- Each successive concentric part inward corresponds to a next lower hierarchical depth level.
- Each of the successive concentric parts subdivides and compresses child nodes in an inward fashion.
- the lowest level nodes are compressed into the inner most portion of the bounded space.
- This structure for the new type of visualization may be referred to as an outside-in hierarchical tree visualization.
- the inward, compressed visualization of successive nodes can constrain the complexity and size of data visualization.
- the new visualization can further provide a compact and scalable representation of the data and convey a uniform sense of depth direction and distance in a hierarchy.
- the new visualization can preserve a linear path from each parent through all descendent nodes.
- the new visualization can place leaf nodes close together for easy comparison.
- the new visualization can also compress deep hierarchies into a fixed space, thus preventing them from expanding beyond constrained boundaries.
- the new visualization allows levels in the hierarchy to be variably sized via interaction or algorithm to highlight different depth levels in the tree.
- FIG. 1A depicts an example of a specific outside-in hierarchical tree visualization called a tree tunnel 100 .
- a data visualization tool (“tool”) 150 generates the tree tunnel 100 and provides it for presentation via an electronic display device 155 .
- the tool 100 is associated with information graphics software.
- an outside border 125 represents a root node 10 of a tree 160 (shown in FIG. 1B ).
- Nodes 101 and 102 are positioned in an outermost concentric ring 121 of the tree tunnel 100 .
- the outside border 125 defines an outside boundary for the outermost concentric ring 121 .
- the outermost concentric ring 121 represents the next level of nodes at the base of the tree 160 after the root node 10 , Each ring inward from there shows a subdivision of subsequent depth levels of the tree 160 .
- the root node 10 may represent all inventory data for a particular store in a chain of stores (e.g., the root node 10 represents all inventory for a store in a particular city and state of the United States).
- Node 101 may be a first type of inventory data (e.g., groceries).
- Node 102 may be a second type of inventory data (e.g., non-groceries).
- Nodes 103 and 104 are sub-divisions (e.g., sub-categories, sub-classifications, etc.) of the first type of inventory associated with node 101 (e.g., node 103 represents produce and node 104 represents packaged goods).
- Leaf node 108 and leaf node 109 are sub-divisions of the type of data from node 103 (e.g., node 108 represents organic produce and node 109 represents non-organic produce).
- Leaf node 110 is a subdivision of the type of data from node 104 (e.g., node 110 represents canned goods).
- Nodes 105 , 106 , and 107 are sub-divisions of the second type of inventory data (e.g., node 105 represents clothing, node 106 represents home and beauty products, and node 107 represents seasonal items).
- Leaf node 111 may represent a type of data of node 105 (e.g., node 11 represents children's clothing).
- Leaf nodes 112 and 113 may represent types of data from node 106 (e.g., node 112 represents cleaning products and node 113 represents cosmetics).
- Node 114 may represent a type of data of node 107 (e.g., node 114 represents lawn furniture).
- each node has an outside border, an inside border, and two side borders.
- the outside border of a node is the curved border furthest from the center point 130 .
- the inside border of a node is the curved border closest to center point 130 .
- node 101 has the outside border 170 (from point 128 to point 129 ), an inside border 121 (from point 173 to point 174 ), a side border 115 (from point 171 to point 173 ) and a side border 117 (from point 172 to point 174 ).
- the tool 150 causes each outside border of any child node in the tree tunnel 100 to touch the inside border of its respective parent node.
- the inside border 121 of the node 101 touches the outside border 123 of node 103 and also touches the outside border 124 of node 104 .
- the tool 150 can size any tree depth level for the tree tunnel 100 by adjusting the height or thickness of the rings (i.e., by adjusting the distance between the inside and outside borders of some or all nodes) to allow for more levels of the hierarchy.
- the tool 150 visually compresses all nodes within the tree tunnel 100 .
- node 101 and all of its descendants i.e., all branch nodes and leaf nodes that originate from node 101
- the children nodes of each parent node are compressed with each successive subdivision of the tree 160 to fit within the sector 140 and within the respective concentric ring of the tree tunnel 100 .
- each arc sector that corresponds to each successive branch of the tree 160 is smaller than the parent node from which the branch originated so that all siblings nodes within the branch fit between the sector lines 142 and 143 .
- the descendants of node 101 are sized so that they stay between the sector line 142 and the sector line 143 .
- the tool 150 can be configured to cause at least some descendant nodes to be even smaller in dimension (e.g., smaller in width) such that each set of child nodes still remains within given sector lines of the parent node, but in some instances would not extend to or touch sector lines.
- a height 190 of the nodes 108 and 109 are the same as in FIGS. 1A and 1C , however, a width 191 of the nodes 108 and 109 are smaller.
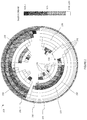
- FIG. 2 is an illustration of a tree tunnel 200 with some nodes having variable sized dimensions and visual indicators.
- a data visualization tool generates and assigns an outermost ring of the tree tunnel structure 200 to a root node 201 .
- the next outermost ring which includes nodes 202 and 203 , are the level of nodes at the base of the tree after the root node 201 .
- the tool can be configured to display some nodes with smaller heights (i.e., thicknesses) than other nodes. For example, rings associated with nodes 201 , 202 , and 203 are thinner than some other rings.
- the thinner nodes can be visually deemphasized, and the visual emphasis can be shifted to the nodes in thicker rings, such as the nodes closer to the middle of the tree tunnel 200 .
- the tool can make certain rings smaller based on user input, such as in response to activation of a zoom feature that focuses the view away from the outer rings toward the inner rings. This can cause the inner nodes to appear larger.
- the tool can automatically determine whether to cause certain rings to be thinner.
- the tool can analyze the hierarchy data based on a certain criterion and determine which levels in the hierarchy are significant based on the criterion. For example, the tool can determine which parts of the hierarchy have significant densities and/or variations in the values of the nodes (e.g., high cost values, high profit values, etc.).
- the tool automatically determines that a certain corresponding section, or sections, of the tree tunnel 200 may be more significant or of greater potential interest.
- the tool can automatically cause the corresponding sections of the tree tunnel 200 (e.g., the rings that are more significant or of potential interest) to be visually thicker than other sections.
- the tool determines the criterion (or criteria) based on user input that indicates a preference for a certain portion(s) of the tree data. For instance, the tool can present a user input control (e.g., a search control, a slider control, etc.) within a user interface, which the user can utilize to indicate a portion of the hierarchy data of interest.
- the tool automatically determines the section of the tree tunnel 200 that corresponds to the indicated portion of the hierarchy data, and the tool automatically emphasizes that portion of the tree tunnel 200 , such as using thicker rings.
- the tool can utilize other visual indicators to emphasize the sections of the tree tunnel 200 that may be more significant or of greater interest, such as colors, three-dimensional effects, textures, etc. For instance, the tool applies certain colors to the nodes of the tree tunnel 200 based on certain properties, variables, characteristics, metrics, etc. of the tree data (e.g., parts of the hierarchy having significant densities and/or variations in the values of the nodes, high or low values based on a certain criterion, increases in a data type over a certain time period, etc.). In some instances, the tool can also hide certain sections of the tree tunnel 200 , such as hiding certain circle sectors, hiding certain rings, hiding certain branches or leafs, etc. In some instances, certain portions of the tree tunnel 200 may be hidden based on a portion or portions of the hierarchy data selected for exclusion, such as for filtered trees where the smallest nodes may be visually excluded.
- certain properties, variables, characteristics, metrics, etc. of the tree data e.g., parts of the hierarchy having significant densities and/or variations
- the tool can be configured to dynamically position within a tree ring some sibling nodes that have no children so that they create a separation between certain branches. For example, the tool positions a set of nodes 215 , which have no children, on the outside edges of certain branches within certain tree rings. This causes a separation 220 to form, creating a negative space that helps to visually distinguish the branches. Furthermore, the tool positions another set of nodes 225 between certain branches to create additional negative space, and further visual distinction, between branches.
- FIG. 3A depicts an example of using tree tunnels in a node-link diagram.
- the node-link diagram has certain levels of a first hierarchy, such as geographic divisions.
- the tree tunnel 301 may include hierarchical sales data for a first level geographical division (e.g., United States (US) sales).
- the tree tunnels 302 , 303 , and 304 may include separate sales data hierarchies for second level geographical divisions (e.g., Eastern Region of the US, Pacific North West Region of the US, and South West Region of the US).
- Tree tunnels 306 , 307 , 308 , and 309 show hierarchical sales data for additional geographic subdivisions.
- tree tunnels can be used in any type of visualization, whether the visualization has a hierarchical structure or not.
- the tree tunnels can show a hierarchical visualization of sets of data points or sets of data points in the visualization, such as in a table or graph, such as the graph shown in FIG. 3B .
- a graph shows an amount of quarterly profit generated for an organization based on the amounts of marketing costs and an age of a consumer.
- a tree tunnel 322 can be presented to show a related hierarchical set of data.
- the set of data may be degrees of sales per inventory type, where the inventory type is shown as the nodes of the tree tunnel 322 and each node is color coded to show the degree of sales for that inventory type.
- FIG. 4 is an example flow diagram (“flow”) 400 of generating a tree tunnel.
- FIGS. 5A and 5B show the example tree tunnel 100 and a corresponding tree 560 .
- FIG. 4 and FIGS. 5A and 5B will be described concurrently to describe the flow 400 .
- the description of FIG. 4 may also refer to other figures already discussed.
- the flow 400 begins at processing block 402 where a data visualization tool (“tool”) determines tree data. For instance, the tool reads from a computer memory data for a tree, which includes a hierarchical relationship between various nodes of the tree.
- FIG. 5B shows an example of a tree 560 .
- the flow 400 continues at processing block 404 where the tool calculates a depth of the tree.
- the tool counts the depth levels in the tree 560 and determines that there are four depth levels.
- Node 50 is in the root level (e.g., depth level “0”).
- Nodes 501 and 502 are in the next depth level (e.g., depth level “1”).
- Nodes 503 , 504 , 505 , 506 , and 507 are in the next depth level (e.g., depth level “2”).
- Nodes 508 , 509 , 510 , 511 , 512 , 513 , and 514 are in the final depth level (e.g., depth level “3”).
- the numerical depth levels “0,” “1,” “2,” and “3” are used in this example to follow a nomenclature convention for tree data structures to define a level of a node by the value of “1” plus the number of connections between the node and the root.
- the root node is considered the “zero” level node.
- the root level (or zero level) is considered the “highest” or “top” level, and each successive depth level, though increasing by one in numerical value (according to the convention), is considered a successively “lower” level.
- the flow 400 continues at processing block 406 where the tool subdivides a graphical drawing area for the tree tunnel into a number of concentric rings equivalent to the depth level.
- the graphical drawing area may be a plotting area that corresponds to a portion of a visualization graphic that will be presented on an electronic display device. For instance, in FIG. 5A , the tool subdivides a plotting area for the tree tunnel 500 into the rings 520 , 521 , 522 , and 523 illustrated by different textures.
- the plotting area is the area contained within the circle 525 .
- the flow 400 continues at processing block 408 which begins a loop (e.g. a “for” loop) that repeats for each incrementing depth level of the tree.
- a loop e.g. a “for” loop
- the tool begins at an initial increment value for the loop (e.g., “0”).
- the increment value can increase (e.g., increase by “1” for each iteration).
- Each successive iteration corresponds to a next concentric ring inward from the last.
- the loop begins with the first ring 520 .
- the flow 400 continues at processing block 410 , where the tool determines whether the current depth level is for the root node of the tree. If the depth level corresponds to the root node, the flow 400 continues at processing block 414 wherein the tool determines presentation attributes for the node(s) in the level. Otherwise, the flow 400 continues at processing block 412 where the tool subdivides arc segments for the ring according to a number of child nodes defined by a parent. For instance, in the example of FIG. 5A , the root node is depicted as the first ling 520 . No portion of the first ring 520 is subdivided because there is only one root node.
- the tool determines that the current depth level corresponded to the root node and, hence, skipped over processing block 412 , and did not subdivide the first ring 520 .
- the tool performs the operations for processing block 412 .
- the tool subdivides the ring 521 into two circular segments that correspond to nodes 501 and 502 .
- the tool subdivides the ring 522 into five circle segments that correspond to nodes 503 , 504 , 505 , 506 and 507 .
- the tool subdivides the ring 523 into seven circle segments.
- the circle segments are portions of the ring that fit within the circular arc sector defined by an arc of a border of the parent node.
- the flow 400 continues at processing block 414 , where the tool determines presentation attributes for the nodes within the depth level. For example, the tool may determine whether certain colors, textures, three-dimensional (3D) depth, etc. should be applied to certain nodes. The tool may further determine whether a ring, or nodes within a ring, should be a certain height or thickness based on analysis of the tree data, as mentioned previously in the discussion of FIG. 2 . For example, as shown in FIGS. 1A, 1C and 1D , the thickness of a ring for the root node 10 was shrunk to a circle that coincides with the outermost border 125 . In FIG. 2 , three outermost rings of the tree tunnel 200 have a smaller thickness than other rings of the tree tunnel 200 .
- the tool may further set node spacing and/or dimensions. For example, the tool can determine to shorten the width of certain nodes, as mentioned previously in the discussion of FIG. 1D . In some examples, the tool can set the widths of node subdivisions within a depth level proportional to an amount of children that the node will have. For instance, in FIG. 5A , when the loop is in the second iteration, the tool can analyze the tree data and determine that the node 501 has only two children whereas node 502 has three children.
- the tool can size the two subdivisions of the ring 521 so that the node 501 has a width that is two-fifths of the entire ring 521 and the node 502 has a width that is three-fifths of the entire ring 521 .
- the tool can also set the widths of the nodes within the depth level, and/or strategically position nodes, based on an analysis of all descendants for a given node within the layer. For example, referring back to FIG. 2 , the tool subdivides the sixth ring 230 into nine different subdivisions because there are nine nodes within the sixth ring 230 . However, the tool can also assess the total number of descendants of each of those nine nodes to determine the widths of each of the nodes. For instance, node 231 has twenty-nine descendants in total. Nodes 232 and 233 have fourteen descendants each. Node 233 has eleven descendants. All other nodes in the sixth ring 230 have no descendants.
- tool causes the size of node 231 to take up the most amount of space in the sixth ring 230 of all of the nodes in that depth level. Nodes 232 and 233 would take up the next most amount of space, followed by node 234 . Finally, all of the non-child nodes in the sixth ring 230 are sized much smaller to create negative or empty spaces between branches.
- the tool can set the size of the nodes based on other information, such as certain metrics associated with the nodes. For example, the width of a given node may be based on an amount of sales for a category, a degree of inventory for a classification, etc. For instance, if a particular branch of data has a greater significance or degree of relevance than other branches, then the tool can size some of the nodes from that particular branch to be greater than nodes for other branches regardless of the number of descendants in the branch.
- the tool can determine presentation attributes before the loop begins. For instance, the tool can determine, concurrently with processing block 406 , a thickness for some, or all, of the concentric rings and set the ring widths for the tree tunnel before the loop begins.
- the flow 400 then continues at processing block 416 , where the tool presents the tree tunnel.
- the tool graphically generates and presents the tree tunnel via an electronic display device according to the concentric rings within the plotting area, the subdivided arc segments for the children nodes, and the presentation attributes for each node.
- the flow 400 continues at processing block 418 where the tool determines whether user input is received regarding the tree tunnel. For instance, as mentioned previously, a user may utilize a user input control to zoom inward or outward on the tree tunnel and/or to specify a certain portion of the tree data on which to focus. If the tool detects the user input, the flow 400 continues at processing block 420 , wherein the tool adjusts the presentation attributes, such as the ring thicknesses, node dimensions, node coloring, etc.
- presentation attributes such as the ring thicknesses, node dimensions, node coloring, etc.
- aspects of the present inventive subject matter may be embodied as a system, method or computer program product. Accordingly, aspects of the present inventive subject matter may take the form of an entirely hardware embodiment, an entirely software embodiment (including firmware, resident software, micro-code, etc.) or an embodiment combining software and hardware aspects that may all generally be referred to herein as a “circuit,” “module” or “system.” Furthermore, aspects of the present inventive subject matter may take the form of a computer program product embodied in one or more computer readable medium(s) having computer readable program code embodied thereon.
- the computer readable medium may be a computer readable signal medium or a computer readable storage medium.
- a computer readable storage medium may be, for example, but not limited to, an electronic, magnetic, optical, electromagnetic, infrared, or semiconductor system, apparatus, or device, or any suitable combination of the foregoing.
- a computer readable storage medium may be any tangible medium that can contain, or store a program for use by or in connection with an instruction execution system, apparatus, or device.
- a computer readable signal medium may include a propagated data signal with computer readable program code embodied therein, for example, in baseband or as part of a carrier wave. Such a propagated signal may take any of a variety of forms, including, but not limited to, electro-magnetic, optical, or any suitable combination thereof.
- a computer readable signal medium may be any computer readable medium that is not a computer readable storage medium and that can communicate, propagate, or transport a program for use by or in connection with an instruction execution system, apparatus, or device.
- Program code embodied on a computer readable medium may be transmitted using any appropriate medium, including but not limited to wireless, wireline, optical fiber cable, RF, etc., or any suitable combination of the foregoing.
- Computer program code for carrying out operations for aspects of the present inventive subject matter may be written in any combination of one or more programming languages, including an object oriented programming language such as Java, Smalltalk, C++ or the like and conventional procedural programming languages, such as the “C” programming language or similar programming languages.
- the program code may execute entirely on the user's computer, partly on the user's computer, as a stand-alone software package, partly on the user's computer and partly on a remote computer or entirely on the remote computer or server.
- the remote computer may be connected to the user's computer through any type of network, including a local area network (LAN) or a wide area network (WAN), or the connection may be made to an external computer (for example, through the Internet using an Internet Service Provider).
- LAN local area network
- WAN wide area network
- Internet Service Provider for example, AT&T, MCI, Sprint, EarthLink, MSN, GTE, etc.
- These computer program instructions may also be stored in a computer readable medium that can direct a computer, other programmable data processing apparatus, or other devices to function in a particular manner, such that the instructions stored in the computer readable medium produce an article of manufacture including instructions which implement the function/act specified in the flowchart and/or block diagram block or blocks.
- the computer program instructions may also be loaded onto a computer, other programmable data processing apparatus, or other devices to cause a series of operational steps to be performed on the computer, other programmable apparatus or other devices to produce a computer implemented process such that the instructions which execute on the computer or other programmable apparatus provide processes for implementing the functions/acts specified in the flowchart and/or block diagram block or blocks.
- FIG. 6 is an example illustration of a computer system 600 .
- the computer system 600 includes a processor unit 601 (possibly including multiple processors, multiple cores, multiple nodes, and/or implementing multi-threading, etc.).
- the computer system includes memory 607 .
- the memory 607 may be system memory (e.g., one or more of cache, SRAM, DRAM, zero capacitor RAM, Twin Transistor RAM, eDRAM, EDO RAM, DDR RAM, EEPROM, NRAM, RRAM, SONOS, PRAM, etc.) or any one or more of the above already described possible realizations of machine-readable media.
- the computer system also includes a bus 603 (e.g., PCI, ISA, PCI-Express, HyperTransport®, InfiniBand®, NuBus, etc.), a network interface 605 (e.g., an ATM interface, an Ethernet interface, a Frame Relay interface, SONET interface, wireless interface, etc.), and a storage device(s) 609 (e.g., optical storage, magnetic storage, etc.).
- the memory 607 embodies functionality to implement embodiments described above.
- the memory 607 may include one or more functionalities that facilitate establishing significance of static analysis results as described above.
- the memory 607 may include, or have access to, a data visualization tool 606 .
- the data visualization tool 606 generates an outside-in hierarchical data visualization as described herein. Any one of the functionalities may be partially (or entirely) implemented in hardware and/or on the processing unit 601 . For example, the functionality may be implemented with an application specific integrated circuit, in logic implemented in the processing unit 601 , in a co-processor on a peripheral device or card, etc. Further, realizations may include fewer or additional components not illustrated in FIG. 6 (e.g., video cards, audio cards, additional network interfaces, peripheral devices, etc.).
- the processor unit 601 , the storage device(s) 609 , and the network interface 605 are coupled to the bus 603 . Although illustrated as being coupled to the bus 603 , the memory 607 may be coupled to the processor unit 601 . Some, or all, portions of the computer system 600 may comprise a data visualization tool.
- FIG. 7 is a block diagram of an example network environment 700 , according to some embodiments of the invention.
- the network environment 700 can include multiple client devices (“clients”) 702 and 704 connected to multiple servers 708 , 712 and 716 via a network 714 .
- the network 714 can be a local area network (LAN), a wide area network (WAN), a telephone network, such as the Public Switched Telephone Network (PSTN), an intranet, the Internet, or a combination of networks.
- PSTN Public Switched Telephone Network
- the network environment 700 shows only two clients 702 and 704 and three servers 708 , 712 , and 716 connected to the network 714 .
- a data visualization tool comprising a data visualization tool component 706 and/or data visualization tool component 710 may be embodied in one or more of the devices, possibly including one or more of the clients 702 and 704 or in a server, such as the server 708 .
- the data visualization tool (one or more of data visualization tool component 706 and/or data visualization tool component 710 ) generates an outside-in hierarchical data visualization as described herein.
- a client may perform the functions of a server and a server may perform the functions of a client.
- any one of the clients 702 , 704 and servers 708 , 712 , and 716 can be embodied as the computer system 600 described in FIG. 6 .
- the clients 702 and 704 can be mainframes, minicomputers, personal computers, laptops, personal digital assistants, or the like. Additionally, the clients 702 and 704 may be capable of connecting to the network 714 .
- the clients 702 and 704 may transmit data over the network 714 or receive data from the network 714 via a wired, wireless, optical, or other connection.
Abstract
Description
Claims (20)
Priority Applications (1)
| Application Number | Priority Date | Filing Date | Title |
|---|---|---|---|
| US15/235,824 US11222038B2 (en) | 2016-08-12 | 2016-08-12 | Generating an outside-in hierarchical tree visualization |
Applications Claiming Priority (1)
| Application Number | Priority Date | Filing Date | Title |
|---|---|---|---|
| US15/235,824 US11222038B2 (en) | 2016-08-12 | 2016-08-12 | Generating an outside-in hierarchical tree visualization |
Publications (2)
| Publication Number | Publication Date |
|---|---|
| US20180046690A1 US20180046690A1 (en) | 2018-02-15 |
| US11222038B2 true US11222038B2 (en) | 2022-01-11 |
Family
ID=61158972
Family Applications (1)
| Application Number | Title | Priority Date | Filing Date |
|---|---|---|---|
| US15/235,824 Active 2037-12-28 US11222038B2 (en) | 2016-08-12 | 2016-08-12 | Generating an outside-in hierarchical tree visualization |
Country Status (1)
| Country | Link |
|---|---|
| US (1) | US11222038B2 (en) |
Families Citing this family (4)
| Publication number | Priority date | Publication date | Assignee | Title |
|---|---|---|---|---|
| US9678635B2 (en) | 2011-12-31 | 2017-06-13 | Quest Diagnostics Investments Incorporated | Visual presentation of multi-dimensional data sets |
| US10402094B2 (en) * | 2017-10-17 | 2019-09-03 | Seagate Technology Llc | Mapping system for data storage devices |
| US10574538B1 (en) * | 2018-04-20 | 2020-02-25 | Amazon Technologies, Inc. | Network visualization user interface |
| CN113176975B (en) * | 2021-03-30 | 2023-10-31 | 东软集团股份有限公司 | Method and device for processing monitoring data, storage medium and electronic equipment |
Citations (6)
| Publication number | Priority date | Publication date | Assignee | Title |
|---|---|---|---|---|
| US6549219B2 (en) * | 1999-04-09 | 2003-04-15 | International Business Machines Corporation | Pie menu graphical user interface |
| US20080307369A1 (en) * | 2007-03-07 | 2008-12-11 | International Business Machines Corporation | Method, interaction method and apparatus for visualizing hierarchy data with angular chart |
| US7667701B2 (en) | 2003-09-19 | 2010-02-23 | International Business Machines Corporation | Intelligent positioning of items in a tree map visualization |
| US20120240064A1 (en) * | 2011-03-15 | 2012-09-20 | Oracle International Corporation | Visualization and interaction with financial data using sunburst visualization |
| US20140365389A1 (en) * | 2012-05-14 | 2014-12-11 | Macromicro Llc | Interactive Organization Visualization Tools For Use in Analyzing Multivariate Human-Resource Data of Organizations |
| US20150363051A1 (en) | 2014-06-15 | 2015-12-17 | Google Inc. | Radial display generation and interactive system |
-
2016
- 2016-08-12 US US15/235,824 patent/US11222038B2/en active Active
Patent Citations (8)
| Publication number | Priority date | Publication date | Assignee | Title |
|---|---|---|---|---|
| US6549219B2 (en) * | 1999-04-09 | 2003-04-15 | International Business Machines Corporation | Pie menu graphical user interface |
| US7667701B2 (en) | 2003-09-19 | 2010-02-23 | International Business Machines Corporation | Intelligent positioning of items in a tree map visualization |
| US20080307369A1 (en) * | 2007-03-07 | 2008-12-11 | International Business Machines Corporation | Method, interaction method and apparatus for visualizing hierarchy data with angular chart |
| US20120240064A1 (en) * | 2011-03-15 | 2012-09-20 | Oracle International Corporation | Visualization and interaction with financial data using sunburst visualization |
| US20130113820A1 (en) * | 2011-03-15 | 2013-05-09 | Oracle International Corporation | Galaxy views for visualizing large numbers of nodes |
| US9021397B2 (en) | 2011-03-15 | 2015-04-28 | Oracle International Corporation | Visualization and interaction with financial data using sunburst visualization |
| US20140365389A1 (en) * | 2012-05-14 | 2014-12-11 | Macromicro Llc | Interactive Organization Visualization Tools For Use in Analyzing Multivariate Human-Resource Data of Organizations |
| US20150363051A1 (en) | 2014-06-15 | 2015-12-17 | Google Inc. | Radial display generation and interactive system |
Non-Patent Citations (6)
| Title |
|---|
| "Tree tunnel visualization", Google Search, retrieved from the Internet on Sep. 14, 2020, 3 pages. |
| Nanni, Dan, "How to visualize disk usage on Linux", Xmodulod, Last updated on Oct. 7, 2013, 11 pages, retrieved from the Wayback Machine Internet Archive. |
| Shneideman, "Tree Visualization with Tree-Maps: 2-d Space-Filling Approach", ACM Transactions on graphics (TOG) 11.1, 1992, 8 pages. |
| Stasko, et al., "Focus+ context display and navigation techniques for enhancing radial, space-filling hierarchy visualizations". Information Visualization, 2000. InfoVis2000. IEEE Symposium, 2000, 13 pages. |
| Teelink, et al., "Improving the computer forensic analysis process through visualization", Communications of the ACM 49.2, 2006, 5 pages. |
| Webber, et al., "Space-filling Techniques in Visualizing Output from Computer Based Economic Models", obtained at http://ideas. repec. org/p/sce/scecfa/67. html, 2006, 7 pages. |
Also Published As
| Publication number | Publication date |
|---|---|
| US20180046690A1 (en) | 2018-02-15 |
Similar Documents
| Publication | Publication Date | Title |
|---|---|---|
| US11222038B2 (en) | Generating an outside-in hierarchical tree visualization | |
| US9329756B2 (en) | Navigation in a hierarchical node structure | |
| Kleiberg et al. | Botanical visualization of huge hierarchies | |
| Lin et al. | Structure-preserving retargeting of irregular 3d architecture | |
| Beck et al. | Generalized pythagoras trees: A fractal approach to hierarchy visualization | |
| Muelder et al. | Rapid graph layout using space filling curves | |
| Bittner et al. | Fast insertion‐based optimization of bounding volume hierarchies | |
| Archambault et al. | Grouse: Feature-Based, Steerable Graph Hierarchy Exploration. | |
| Governi et al. | 3D geometry reconstruction from orthographic views: A method based on 3D image processing and data fitting | |
| Zhang et al. | Shape segmentation by hierarchical splat clustering | |
| Jesus et al. | Layered shape grammars for procedural modelling of buildings | |
| Kwon et al. | User-assisted integrated method for controlling level of detail of large-scale B-rep assembly models | |
| US9208597B2 (en) | Generalized instancing for three-dimensional scene data | |
| Sharf et al. | Mobility‐trees for indoor scenes manipulation | |
| Micallef et al. | eulerforce: Force-directed layout for Euler diagrams | |
| Liang et al. | Visualizing large trees with divide & conquer partition | |
| Liang et al. | Angular treemaps-a new technique for visualizing and emphasizing hierarchical structures | |
| Borkiewicz et al. | Cinematic visualization of multiresolution data: Ytini for adaptive mesh refinement in houdini | |
| Wong et al. | Abstracting images into continuous-line artistic styles | |
| Bittner et al. | T‐SAH: Animation Optimized Bounding Volume Hierarchies | |
| Gansner et al. | Viewing abstract data as maps | |
| Kamakshidasan et al. | Mergemaps: Treemaps for scientific data | |
| Pinto et al. | Volume visualization and exploration through flexible transfer function design | |
| Weibel et al. | Measuring the sim2real gap in 3d object classification for different 3d data representation | |
| Kim et al. | Single image–based 3D tree and growth models reconstruction |
Legal Events
| Date | Code | Title | Description |
|---|---|---|---|
| AS | Assignment |
Owner name: INTERNATIONAL BUSINESS MACHINES CORPORATION, NEW YORK Free format text: ASSIGNMENT OF ASSIGNORS INTEREST;ASSIGNORS:KEAHEY, THOMAS ALAN;ROPE, DANIEL JAY;WILLS, GRAHAM JOHN;SIGNING DATES FROM 20160728 TO 20160810;REEL/FRAME:039670/0770 Owner name: INTERNATIONAL BUSINESS MACHINES CORPORATION, NEW Y Free format text: ASSIGNMENT OF ASSIGNORS INTEREST;ASSIGNORS:KEAHEY, THOMAS ALAN;ROPE, DANIEL JAY;WILLS, GRAHAM JOHN;SIGNING DATES FROM 20160728 TO 20160810;REEL/FRAME:039670/0770 |
|
| STPP | Information on status: patent application and granting procedure in general |
Free format text: RESPONSE TO NON-FINAL OFFICE ACTION ENTERED AND FORWARDED TO EXAMINER |
|
| STPP | Information on status: patent application and granting procedure in general |
Free format text: FINAL REJECTION MAILED |
|
| STPP | Information on status: patent application and granting procedure in general |
Free format text: DOCKETED NEW CASE - READY FOR EXAMINATION |
|
| STPP | Information on status: patent application and granting procedure in general |
Free format text: FINAL REJECTION MAILED |
|
| STPP | Information on status: patent application and granting procedure in general |
Free format text: RESPONSE AFTER FINAL ACTION FORWARDED TO EXAMINER |
|
| STPP | Information on status: patent application and granting procedure in general |
Free format text: ADVISORY ACTION MAILED |
|
| STPP | Information on status: patent application and granting procedure in general |
Free format text: DOCKETED NEW CASE - READY FOR EXAMINATION |
|
| STPP | Information on status: patent application and granting procedure in general |
Free format text: NON FINAL ACTION MAILED |
|
| STPP | Information on status: patent application and granting procedure in general |
Free format text: RESPONSE TO NON-FINAL OFFICE ACTION ENTERED AND FORWARDED TO EXAMINER |
|
| STPP | Information on status: patent application and granting procedure in general |
Free format text: FINAL REJECTION MAILED |
|
| STPP | Information on status: patent application and granting procedure in general |
Free format text: ADVISORY ACTION MAILED |
|
| STPP | Information on status: patent application and granting procedure in general |
Free format text: DOCKETED NEW CASE - READY FOR EXAMINATION |
|
| STPP | Information on status: patent application and granting procedure in general |
Free format text: NOTICE OF ALLOWANCE MAILED -- APPLICATION RECEIVED IN OFFICE OF PUBLICATIONS |
|
| STPP | Information on status: patent application and granting procedure in general |
Free format text: PUBLICATIONS -- ISSUE FEE PAYMENT RECEIVED |
|
| STPP | Information on status: patent application and granting procedure in general |
Free format text: PUBLICATIONS -- ISSUE FEE PAYMENT VERIFIED |
|
| STCF | Information on status: patent grant |
Free format text: PATENTED CASE |