US11131663B2 - Analyte detection method - Google Patents
Analyte detection method Download PDFInfo
- Publication number
- US11131663B2 US11131663B2 US16/604,293 US201816604293A US11131663B2 US 11131663 B2 US11131663 B2 US 11131663B2 US 201816604293 A US201816604293 A US 201816604293A US 11131663 B2 US11131663 B2 US 11131663B2
- Authority
- US
- United States
- Prior art keywords
- aptamer
- nucleic acid
- analyte
- carrier nucleic
- dna
- Prior art date
- Legal status (The legal status is an assumption and is not a legal conclusion. Google has not performed a legal analysis and makes no representation as to the accuracy of the status listed.)
- Active
Links
Images


Classifications
-
- G—PHYSICS
- G01—MEASURING; TESTING
- G01N—INVESTIGATING OR ANALYSING MATERIALS BY DETERMINING THEIR CHEMICAL OR PHYSICAL PROPERTIES
- G01N33/00—Investigating or analysing materials by specific methods not covered by groups G01N1/00 - G01N31/00
- G01N33/48—Biological material, e.g. blood, urine; Haemocytometers
- G01N33/50—Chemical analysis of biological material, e.g. blood, urine; Testing involving biospecific ligand binding methods; Immunological testing
- G01N33/53—Immunoassay; Biospecific binding assay; Materials therefor
- G01N33/5308—Immunoassay; Biospecific binding assay; Materials therefor for analytes not provided for elsewhere, e.g. nucleic acids, uric acid, worms, mites
-
- C—CHEMISTRY; METALLURGY
- C12—BIOCHEMISTRY; BEER; SPIRITS; WINE; VINEGAR; MICROBIOLOGY; ENZYMOLOGY; MUTATION OR GENETIC ENGINEERING
- C12N—MICROORGANISMS OR ENZYMES; COMPOSITIONS THEREOF; PROPAGATING, PRESERVING, OR MAINTAINING MICROORGANISMS; MUTATION OR GENETIC ENGINEERING; CULTURE MEDIA
- C12N15/00—Mutation or genetic engineering; DNA or RNA concerning genetic engineering, vectors, e.g. plasmids, or their isolation, preparation or purification; Use of hosts therefor
- C12N15/09—Recombinant DNA-technology
- C12N15/11—DNA or RNA fragments; Modified forms thereof; Non-coding nucleic acids having a biological activity
- C12N15/115—Aptamers, i.e. nucleic acids binding a target molecule specifically and with high affinity without hybridising therewith ; Nucleic acids binding to non-nucleic acids, e.g. aptamers
-
- G—PHYSICS
- G01—MEASURING; TESTING
- G01N—INVESTIGATING OR ANALYSING MATERIALS BY DETERMINING THEIR CHEMICAL OR PHYSICAL PROPERTIES
- G01N33/00—Investigating or analysing materials by specific methods not covered by groups G01N1/00 - G01N31/00
- G01N33/48—Biological material, e.g. blood, urine; Haemocytometers
- G01N33/483—Physical analysis of biological material
- G01N33/487—Physical analysis of biological material of liquid biological material
-
- C—CHEMISTRY; METALLURGY
- C12—BIOCHEMISTRY; BEER; SPIRITS; WINE; VINEGAR; MICROBIOLOGY; ENZYMOLOGY; MUTATION OR GENETIC ENGINEERING
- C12N—MICROORGANISMS OR ENZYMES; COMPOSITIONS THEREOF; PROPAGATING, PRESERVING, OR MAINTAINING MICROORGANISMS; MUTATION OR GENETIC ENGINEERING; CULTURE MEDIA
- C12N2310/00—Structure or type of the nucleic acid
- C12N2310/10—Type of nucleic acid
- C12N2310/16—Aptamers
Definitions
- the present invention provides methods for the detection of analytes, including but not limited to biological molecules such as proteins or peptides, via the use of aptamers.
- the methods find particular utility in detecting analytes in complex biological samples such as serum or plasma.
- the methods described provide for the multiplexed detection of multiple different biological molecules.
- the methods utilise nanopore detection, which relies on monitoring changes in ionic current as molecules pass through the pore under the influence of an applied potential.
- Nanopores 1-4 have been proven to be a promising tool for the detection of DNA 5-7 , RNA 8 , proteins 9-10 and other molecules 8, 11 as they allow the possibility of single molecular level and rare event analysis which is normally masked by ensemble averaging in classical measurement methods.
- the simple nanopore detection method relies on modulations of the ionic current as molecules pass through the pore under the influence of an applied potential. The change in the ionic current will depend on the presence, location and conformation of a single molecule in the pore.
- biological nanopores Although the use of biological nanopores have proven successful, there remains a number of limitations with them such as stability issues with an embedded lipid bilayer, non-tuneable pore size and difficulty of multiplex detection in the same nanopore.
- An alternative to biological nanopores is to use solid state nanopores. They can be fabricated with a high degree of control of pore size 19-20 , allowing proteins of various size to translocate through the pore. While nanopores have been shown in the detection of variable size of proteins 10 , peptides and DNA binding proteins 21-24 , recent results have indicated that the fast translocation speeds of most proteins lead to poor detection limits at typical experimental bandwidths. 9 While advances in the use of high bandwidth amplifiers have led to improvements in resolution, protein translocation selectivity through nanopores still remains a limitation due to the stochastic nature of nanopore sensing.
- the present invention provides a method of detecting one or more analytes in a sample, the method comprising:
- each analyte-specific aptamer having a single-stranded portion complementary to a different single-stranded region on the same carrier nucleic acid.
- aptamers specific for the same analyte are provided, but with each analyte-specific aptamer having a single-stranded portion complementary to a different single-stranded region on the same carrier nucleic acid.
- the aptamers may all have the same analyte-binding portion, differing only in their single-stranded portions.
- the aptamers may bind the same analyte but have different analyte-binding portions and different single-stranded portions.
- the carrier molecule is either DNA or RNA.
- the carrier nucleic acid molecule is either single or double-stranded. Where the carrier nucleic acid molecule is double-stranded, it will have at least one single-stranded region. Typically, the single-stranded regions of a double-stranded nucleic acid molecule take the form of 3′ or 5′ overhangs, but single stranded sections can be created at any point along the double-stranded molecule.
- the at least one aptamer comprises a single-stranded portion at least partially complementary to a single-stranded portion of the carrier nucleic acid and partially complementary to the single-stranded portion of an additional aptamer (the second aptamer).
- the second aptamer will have a single-stranded portion complementary to a portion of the single-stranded portion of first aptamer.
- the second aptamer forms a complex with the carrier nucleic acid via the first aptamer.
- the detection of the carrier nucleic acid/aptamer/analyte complex may be by any suitable means.
- the detection of the carrier nucleic acid/aptamer/analyte complex is by voltage-driven translocation through a nanopore.
- a change in nanopore conductance versus control indicates the presence of an analyte. More preferably, the location of the change in nanopore conductance versus control in the time frame of translocation is indicative of the position of the aptamer along the carrier nucleic acid. In preferred embodiments, the change in nanopore conductance is an increase in nanopore conductance.
- the nanopore when detection is achieved by voltage-driven translocation through a nanopore, the nanopore may be located at the tip of a nanopipette.
- detection is achieved by fluorescence detection.
- detection is achieved by confocal microscopy, preferably fluorescence confocal microscopy.
- an additional analyte-specific binding molecule is contacted with the sample, forming a carrier nucleic acid/aptamer/analyte/analyte-specific binding molecule complex.
- a sandwich assay is sometimes termed a sandwich assay and may be useful where the analyte has a high molecular weight.
- the detection of particularly low molecular weight analytes is achieved by adding to the sample a known quantity of the analyte conjugated to a high molecular weight label.
- a change in signal compared to the sample containing only the labelled analyte.
- the presence of the analyte is therefore indicated by a change in the signal.
- Such an arrangement is sometimes termed a competitive assay.
- a method of detecting one or more analytes in a sample comprising:
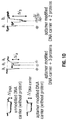
- FIG. 1 A 2D Schematic of the ⁇ -DNA (48.5 kbp) template with 12 base oligonucleotides overhangs on both the 5′ and 3′ termini.
- the specific detection probe (27 mer) was formulated through the addition of the complementary sequence [in green] of the 5′ of the ⁇ -DNA and the TBA sequence [in light blue].
- the system was designed to allow spatial separation between the three probes i.e. long distance between the 1 st and 3 rd target while the 2 nd and 3 rd probes are on the opposite strands upon binding to the target.
- the sub-levels can be used to differentiate between proteins both in terms of location and magnitude.
- FIG. 2 Schematic of (a) bare ⁇ -DNA, (b) ⁇ -DNA with two aptamer probes and associated thrombin targets, (c) ⁇ -DNA with three aptamer probes and associated thrombin targets.
- concentration of 100 ⁇ M in 100 mM KCl was used and the voltage was set to ⁇ 200 mV. All current-time traces were re-filtered to 5 kHz.
- Typical individual translocation events are shown with the sub-peaks labelled 1 st step associated to the DNA carrier and 2 nd step, due to protein binding, superimposed on the signal attributed to the DNA carrier. In all cases the amplitudes from the sub-peaks on average ranged between 45-62 pA depending on nanopore used.
- Histograms of the representative dwell times are shown for the three conditions with the mean and median represented by a solid and dashed line respectively.
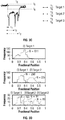
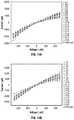
- FIG. 3 Statistics on the translocation of a DNA carrier with 3 aptamer targets.
- concentration of 100 pM in 100 mM KCl was used and applied voltage was varied between ⁇ 100 to ⁇ 200 mV.
- (c) A typical translocation event with three distinct spikes highlighting how the ratio of the fractional position calculated.
- N total no. of events)
- the relative location (or fractional position) can be determined for each sub-peak.
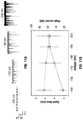
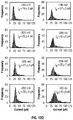
- FIG. 5 ( a ) Typical current-time traces are shown for a serial dilution of human serum spiked with 0.1 M KCl at voltages of ⁇ 250, 0, and +250 mV. A dilution of 1:20 consists of a sufficiently stable baseline to be used in nanopore sensing and was used for further studies (b) DNA carrier with 3 TBA probes were incubated in HS with the current-time traces clearly showing sub-peaks associated with thrombin binding at ⁇ 250 mV. (c) Similar to FIG. 3 , the sub-peaks could easily be distinguished based on location. (d) The current amplitude for all three sub-peaks, obtained at an applied voltage of ⁇ 250 mV, ⁇ 400 mV and ⁇ 450 mV was determined via Gaussian fitting and were all showing similar trend among the three targets at each voltage dependence.
- FIG. 6 Electrical characterisation of (a) 18 quartz nanopores with conductance 2.8 ⁇ 0.5 nS and inset show the SEM image of the intended pore diameter ⁇ 20 nm (with scale bar 50 nm) for experimental performed in FIGS. 2, 3 and 5 ( b ) 20 quartz nanopore with conductance of 5.8 ⁇ 0.8 nS and inset show the SEM image of the intended pore diameter ⁇ 42 nm (with scale bar 50 nm) for experimental in FIG. 4 with 0.1 M KCl Tris-EDTA buffer.
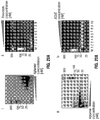
- FIG. 7 A 0.65% agarose gel electrophoresis image confirming the detection probes were hybridized to the ⁇ -DNA carrier. Analyte from left to right (i) Extended DNA ladder (ii) bare ⁇ -DNA (iii) ⁇ -DNA with detection probes at 5.7V/cm for 1 hr. The gel was then stained with Sybr Gold and imaged under UV. B Electrophoretic mobility shift assay to show the binding of Thrombin to TBA with binding buffer: 50 mM Tris, 140 mM NaCl, 1 mM MgCl 2 Tris-EDTA buffer at pH 7.4 and incubate for 45 minutes.
- the thrombin concentration used was 500, 250, 150, 100, 75, 50, 20 and 0 nM (from left to right) was incubated with 200 nM of TBA. The sample were then run on a native polyacrylamide gel for 85 minutes at 85V and stained with Sybr Gold and imaged. A shift by the thrombin binding, only observed when correct combination of aptamer and thrombin binds.
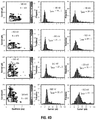
- FIG. 8 Table 1 Control experiments using non-specific aptamers bound to the DNA carrier. (a) unmodified ⁇ -DNA, (b) aptamer modified ⁇ -DNA and (c) ⁇ -DNA+non-specific probe+thrombin. In all cases the DNA carrier concentration was 100 pM and no sub-peaks were observed (as shown in FIG. 2 ) with exception of folded DNA.
- FIG. 9 (a) Optical detection of the carrier/aptamer/analyte complex. i) Carrier only; due to no fluorophore on the carrier/aptamer complex, only electrical signal was observed. ii) Protein only, streptavidin labeled with Atto 488; due to the small and fast streptavidin translocation, only optical signal was observed. iii) Carrier-protein complex; both electrical and optical observed when streptavidin is binding to the aptamer/DNA carrier forming DNA-protein complexes. (b) Typical traces from both optical and electrical signals, with synchronized detection was highlighted in pale pink.
- FIG. 10 Current-time trace and statistics for sensing proteins bound to a modified carrier. Translocation and statistics for (a) 100 pM of unmodified ⁇ -DNA, (b) 100 pM aptamer modified ⁇ -DNA (1:1 ratio after filtration), (c) 100 pM aptamer modified ⁇ -DNA with two probes for the detection of thrombin (1.6 nM each), (d) 100 pM aptamer modified ⁇ -DNA with three probes for the detection of three thrombin targets (1.6 nM each). All experiments were performed in 100 mM KCl and at a voltage of ⁇ 200 mV, taken using 4 different nanopipettes for each sample and re-filtered to 5 kHz.
- FIG. 11 DNA carrier with 3 aptamer targets.
- a concentration of 100 pM in 100 mM KCl was used at an applied voltage ranging between ⁇ 100 to ⁇ 200 mV.
- a typical translocation event with three distinct sub-peaks is shown with a description of how the fraction position (i.e., relative location) of the bound protein is determined.
- (d) As can be clearly seen, it is possible to differentiate between DNA carriers with 1, 2 and 3 protein targets attached. N total number of protein events within the same carrier.
- FIG. 12 Nanopore sensing of multiple protein targets on a single DNA carrier.
- FIG. 13 Sensing of protein targets in human serum.
- Typical current-time traces are shown for a serial dilution of human serum spiked with 100 mM KCl at applied voltages of ⁇ 250, 0 and +250 mV. In all cases the serum was inserted inside the nanopipette. As is shown a dilution of 1:20 consists of a sufficiently stable baseline to be used in nanopore sensing.
- DNA carrier with 3 TBA probes were incubated in HS with the current-time traces clearly showing sub-peaks associated with thrombin binding at ⁇ 250 mV.
- FIG. 14 Electrical nanopipette characterisation from a total of 38 Quartz nanopores.
- the quartz nanopores were fabricated with a quartz capillary inserted into a laser-based pipette puller yielding two asymmetric pores. The pores were then characterised electrically and optically.
- (a) Current-voltage curves from quartz nanopores with conductance 2.8 ⁇ 0.5 nS (n 18), used for experiments shown in FIGS. 10, 11, and 13 .
- (b) Current-voltage curves from quartz nanopores with conductance of 5.8 ⁇ 0.8 nS (n 20) used for experiments shown in FIG. 12 . All measurements were performed in 0.1 M KCL Tris-EDTA buffer.
- FIG. 15 Optical and SEM imaging of the nanopipette.
- (c-e) Representative SEMs of nanopipettes used in experiments. The average diameters and 1 standard deviation as measured by SEM were 16 ⁇ 2, 19 ⁇ 2 nm, and 16 ⁇ 2 nm (in all cases n 4), respectively. Scale bars are 50 nm.
- FIG. 16 Schematic and sequences used for detecting three thrombin protein targets.
- the sequences used for the modification of the DNA carrier with aptamer probes are as follows:
- Target i (27 bases): (SEQ ID NO: 5) 5′- GGTTGG TGTGGTTGG AGGTCGCCGCC-3′, Target ii (51 bases): (SEQ ID NO: 6) 5′- GGTTGGTGTGGTTGG GGGCGGCGACCTAAGGTGTCGTGCGTAAGTTT TTAA-3′, Target iii (69 bases): (SEQ ID NO: 7) 5′- GGTTGGTGTGGTTGG TTTTTTTGTCTTTTTTTTTTTTTTCTGTTTTTTT AAAAACTTACGCACGACACCTT-3′. In all cases the aptamer sequences are shown is shown in black and underlined.
- FIG. 17 Schematic of the designed aptamer detection probes used for thrombin and AChE.
- the sequences used for the modification of the DNA carrier with aptamer probes specific to thrombin and AChE are as follows:
- Target i (27 bases, thrombin): (SEQ ID NO: 9) 5′-G GTTGGTGTGGTTGGA GGTCGCCGCCC-3′, Target ii (75 bases, AChE): (SEQ ID NO: 8) 5′- GGTTGACTGTAGCTCTGGCAGACGTAGTGTGAAGGTACC GGGCGGCG ACCTAAGGTGTCGTGCGTAAGTTTTTAA-3′. In all cases the aptamer sequences are shown is shown in black and underlined.
- FIG. 18 Scatter plots for both aptamer modified and unmodified DNA carrier. Negligible change in the current and dwell time distributions were observed when comparing aptamer modified and unmodified DNA at ⁇ 180 and ⁇ 200 mV.
- FIG. 19 Gel electrophoresis image for the unmodified and aptamer modified DNA carrier. From left to right (i) Extended 1 kb DNA ladder (ii) unmodified ⁇ -DNA (iii) aptamer modified ⁇ -DNA. A 0.65% agarose gel was used and separations were obtained at a voltage of 5.7V/cm for 1 hr in TBE buffer. The gel was then stained with SYBR Gold and imaged under UV light. The modified carrier shows that the majority of the aptamers are bound to the carrier causing a very small shift in the gel.
- FIG. 20 Electrophoretic mobility shift assay (EMSA) to confirm the binding of the aptamers to thrombin and AChE targets. All gels shown above include a 25 bp ladder and indicated as M in the gel.
- the 7 lanes on the gel represent the following concentrations of aptamer (from left to right): 0, 50, 100, 250, 500, 1000 and 5000 nM.
- modified TBA 200 nM was then incubated with different concentration of thrombin in the same binding buffer as (i) for 45 min.
- the 9 lanes consist of different thrombin concentration from left to right: 0, 250, 500, 1000, 1500, 2500, 5000 and 7500 nM.
- AChE (660 nM) was incubated with different concentration of modified AChE aptamer ranging from 0-5000 nM in 2.7 mM KCl, 4 mM MgCl2 PBS buffer pH 7.4 for 1 hour.
- the 9 lanes consist of different aptamer concentration from (left to right) 5000, 2500, 1000, 500, 250, 100, 50, 25 and 0 nM and placed in a 8% polyacrylamide cast gel and ran at 90 V for 75 min. The gel was then stained and imaged.
- AChE aptamer was fixed at 100 nM with a range of AChE concentration from left to right 0, 10, 50, 100, 250, 660, 1000, 2000 nM in the same binding buffer and placed in a 8% polyacrylamide gel and ran at 90V for 75 min. The gel was then stained with SYBR gold and imaged.
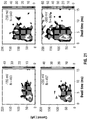
- FIG. 21 Current and dwell time scatter plots for two proteins, thrombin and AChE bound to the same DNA carrier. This corresponding to the data shown in FIG. 12 .
- FIG. 22 Algorithm used for sub-peak thresholding.
- the method we use to differentiate between different molecular populations is as follows: 1) By using an all points current histogram we fit a Poisson distribution to define the background current. 2) The remaining peaks are fit to Gaussian distributions, and in the case of this data set we use a three-sigma confidence level to differentiate between free and protein bound DNA as shown below. 3) Each individuate translocation is assessed to confirm they exhibit multilevel behaviour. Only translocations with a minimum of 2 steps are defined as originating from a modified DNA carrier with bound protein. 4) Finally, the sub-peaks are analysed to remove the small underlying population due to folded DNA.
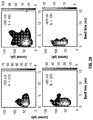
- FIG. 23 Representative examples of unfolded and folded DNA for both the unmodified and aptamer modified DNA carrier. Continuous current-time trace and zoomed individual translocation events for both unmodified and aptamer modified DNA carrier. Events #8 and #9 in top trace #7 and #8 in the bottom show representative translocation events in folded configuration. On average 10% of all translocation events were observed to have a folded component. The applied voltage was ⁇ 150 mV. The traces were filtered with a low pass filter with a cut-off frequency of 5 kHz for visualisation.
- FIG. 24 Sub-peak comparison for thrombin and AChE bound to a DNA carrier. Scatter plots are shown for thrombin, AChE, and and the sub-peak associated with folded DNA for reference. All measurements were taken at ⁇ 200 mV. There is less than 1% overlap between AChE and folded DNA based on the sub-peak amplitude and dwell time and less than 10% overlap between thrombin and folded DNA.
- FIG. 25 Control experiments for unmodified DNA carrier in serum. Examples of typical current-voltage traces along with voltage dependant scatter plots are shown for ⁇ 150, ⁇ 200 and ⁇ 250 mV respectively. In all cases statistics are similar to detection of unmodified DNA in buffer alone.
- FIG. 26 Current and dwell time scatter plots corresponding to the data shown in FIG. 13 .
- DNA concentration was 100 pM and voltage was varied between ⁇ 250 to 450 mV.
- the present inventors have developed a fully flexible and selective approach allowing the accurate detection of multiple proteins utilising aptamers.
- the method can be used in complex samples such as human serum.
- Aptamers are ssDNA or ssRNA oligonucleotides that have the ability to non-covalently bind to a target molecule with high affinity and selectivity. Aptamers sequences can be selected in vitro by SELEX (systematic evolution of ligands by exponential enrichment) 32-33 and their subsequent synthesis is less expensive with little to no inconsistency between batches compared with antibodies. 34 They have been widely use in diagnostics and as therapeutics agents in the last few years.
- aptamers as small recognition sequences that can be hybridised to complementary sequences of a larger carrier nucleic acid via single-stranded sections engineered into the aptamer sequence, leading to the formation of specific detection probes.
- the engineered aptamers may herein be described as single-strand tagged aptamers, thought should also be noted that the use of the term “aptamer” herein is intended to include a single-stranded tag region unless otherwise specified.
- the presence or absence of a specific target in solution can then be identified by detecting the presence of the aptamer in complex with the carrier nucleic acid and the analyte.
- the complex of these components is sometimes described as the carrier nucleic acid/aptamer/analyte complex.
- the physical properties of the carrier nucleic acid can be utilised to allow for the detection of the carrier nucleic acid/aptamer/analyte complex.
- Such physical properties include, but are not limited to, molecular weight and charge.
- the particular physical property of interest will depend in part on the detection method employed.
- the presence of the carrier nucleic acid may allow the complex to be detected by voltage-driven translocation through a nanopore.
- the additional steric hindrance caused by a very large carrier nucleic acid molecule in the carrier nucleic acid/aptamer/analyte complex may assist in detection.
- the carrier nucleic acid may typically be a double-stranded nucleic acid molecule with single-stranded overhangs at its 3′ and/or 5′ ends. Alternatively or in addition to overhangs, the carrier molecule may have one or more a single-stranded regions elsewhere along its length. In particularly preferred embodiments, the carrier nucleic acid has multiple single-stranded regions to which multiple different single-strand tagged aptamers may bind. In this way the present method can be easily designed to detect multiple analytes simultaneously.
- the carrier molecule will typically be DNA or RNA.
- any detection method that can differentiate between the carrier nucleic acid/aptamer complex and the carrier nucleic acid/aptamer/analyte complex may be used with the present method.
- One method of detection involves studying the characteristic transient change in current during the dsDNA level translocation, see FIG. 1D .
- Alternative detection methods are also contemplated, including but not limited to fluorescence detection and confocal microscopy.
- the present method is not dependent upon attaching antigens or detection moieties (such as antibodies) to the carrier nucleic acid via conjugation chemistry. Instead, hybridisation between the single-strand tagged aptamer and carrier molecule is utilised. This leads to several advantages, including but not limited to simplified manufacture and use.
- the simplified carrier nucleic acid and aptamer set up avoids the possibility of conjugated antigens becoming denatured, which would cause the detection precision and location to fail, as the translocation peak in the nanopore would still occur due to the relatively large size of antigens along the DNA occupying the pore leading to a sub-level peak current. It would also be hard to differentiate whether the translocation event was caused by specifically binding of antibodies or just the denatured antigen along the carrier nucleic acid.
- a further advantage of the present method is that neither the analytes, carrier nucleic acids nor the aptamers need to be immobilised (such as to a surface) at any stage. Detection can instead be conducted in solution, greatly open up the detection capability and simplifying the procedure.
- aptamers can be generated for any analyte with relative ease.
- Certain prior art methods have relied upon the construction of aptamers that undergo conformational changes upon target binding. This, however, greatly complicates the development of aptamers for new targets.
- the methods described herein no conformational changes in the aptamers is required, which leads to a more simplified system that can be applied to a wide range of target analytes.
- ⁇ -DNA which consisted of 12 base overhangs was purchased from (New England Biolabs, UK) and all designed aptamer probes were obtained from (Invitrogen custom oligonucleotides, UK). All the sequence information of detection probes used in this work are listed below.
- ⁇ -thrombin was obtained from (Cambridge Biosciences, UK). Acetylcholinesterase and human serum (from clotted human whole blood) were purchased from (Sigma-Aldrich, UK).
- ⁇ -DNA [500 ⁇ g/mL] and 1 ⁇ L related aptamer probes [5 ⁇ M] were mixed in a total volume of 20 ⁇ L of 150 mM NaCl, 10 mM MgCl 2 Tris-EDTA buffer at pH 7.4 followed by 5 mins heating to 95° C., 10 mins annealing to 65° C. and cooling to room temperature for 10 mins.
- the excess aptamer probes were then removed by 100 kDa MWCO Amicon Ultra filter (Millipore, UK) before incubating with targets allowing approximate 1:1 ratio of the DNA carrier to aptamer probe.
- Quartz capillaries (Intracel Ltd, UK) length 75 mm with 0.5 mm filament was placed inside a plasma cleaner to remove any organic contaminants.
- Nanopipettes were fabricated using a P-2000 laser-based pipette puller (Sutter Instrument, US). The pipettes used in FIGS. 2,3 and 5 were fabricated from previous protocol reported. 12-13 The pipettes used in FIG. 4 were fabricated using a two-line program: (1) HEAT: 775; FIL: 4; VEL: 30; DEL: 170; Pul: 80, (2) HEAT: 825; FIL: 3; VEL: 20; DEL: 165; Pul: 180 to yield a conductance of 5.8 ⁇ 0.8 nS. It should be noted that the above parameters are instrument specific and might have slight variations due to local temperature and humidity.
- the ionic current detection and translocation experiments were carried out with an Axopatch 200B patch clamp amplifier (Molecular Devices, USA).
- the analyte was placed inside the negative charged quartz nanopore and the headstage was connected via Ag/AgCl electrodes and applied with negative potential for translocation studies.
- Quartz nanopore dimensions were measured by SEM and by ionic conductance indicating nanopore diameters between ⁇ 15-40 nm.
- the signal was filtered using a low pass Bessel filter at 10 kHz and digitized with a Digidata 1440A at a sampling rate of 100 kHz. Data was processed using a custom written Matlab script.
- ⁇ -DNA was chosen as a template due to its rigidity and well-defined current blockade behaviour as well as the presence of 12 base overhangs on both the 5′ and 3′ end termini enabling hybridisation of a complementary oligonucleotide.
- the complementary oligonucleotide was further extended with aptamer sequences leading to the formation of a specific detection probe.
- Thrombin binding aptamer TBA
- TBA Thrombin binding aptamer
- GGTTGGTGTGGTTGG SEQ ID NO: 1 was selected for the model system as its structure has been extensively studied by solution NMR 35-36 .
- TBA interacts with human alpha thrombin ( ⁇ -thrombin) selectively with a K d ⁇ 35-100 nM in solid phase assays.
- ⁇ -Thrombin M.W. of 37.5 kDa; pI of 7.0-7.6
- a trypsin like serine protease is the only enzyme capable of catalysing the conversion of soluble fibrinogen into insoluble fibrin.
- a high pM range of thrombin in blood is known to be associated with thrombotic diseases so that it is important to detect this protein at trace level with high sensitivity and so prevent thrombosis.
- Nanopore experiments were performed using quartz nanopipettes with conductance of 2.8 ⁇ 0.5 and 5.8 ⁇ 0.8 nS at 0.1 M KCl. Electrical and optical characterisation (Scanning electron microscopy) of the pipettes can be found in FIG. 6 . Nanopipettes were chosen due to their ease of fabrication, low capacitance and low levels of high frequency noise.
- the ionic current signals of unmodified ⁇ -DNA can be seen in FIG. 2A with i) schematic of the molecule ii) representative and current-time trace, iii) expanded current blockades when 100 pM of linear DNA is added to the nanopore and iv) scatter plot of dwell time and current with an applied potential of ⁇ 200 mV.
- the negatively charged DNA molecules inside the nanopipette migrate toward the end of the tip resulting in an overall increase in the conductance.
- the highly negatively charged complex (negatively charged aptamer and presence of negatively charged residues on the surface of bound thrombin at pH 8) enhances further the ion flow in the pore resulting in two distinct current blockades within the dsDNA current blockade level, which we correspond to the thrombin, with magnitude up to 45-62 pA depending on the nanopore used and voltage applied see FIG. 2 c .
- These events are caused by the individual thrombin molecules binding to the aptamer probe as they were not observed when performing translocation to unmodified ⁇ -DNA.
- the initial 27mer design (15 aptamer sequence+12 base overhang) allowed the rapid and distinct detection of two targets as seen by two peaks on either size of the translocation blockade.
- the 2 nd binding domain can be extended to 51 bases.
- Hybridisation of the second binding domain with an additional oligos (24 mers) allows formation of a third target region with a total length of 69 nucleotides.
- the 2 nd and 3 rd probes were designed to be on the opposite strands to provide spatial resolution and avoid steric hindrance clashes upon binding to two targets.
- Three aptamer probes were incubated with three fold excess of thrombin for 45 mins before electrophoretic translocation through a nanopore.
- a larger protein target acetylcholinesterase (AchE) was chosen as it can easily differentiate the blockade level for ease of differentiating the blockade level.
- AchE M.W. of 280 kDa and pl of 5
- TBA sequence were attached to the 3′ and 5′ termini of the DNA molecule, as shown in FIG. 4A .
- FIG. 4B A typical ionic current trace and expanded version of translocation events for thrombin binding to the TBA and acetylcholinesterase binding to the DNA aptamer at ⁇ 200 mV were shown in FIG. 4B .
- the translocation events clearly show two distinct peaks within the dsDNA level, one with smaller peak current ( ⁇ 22+12 pA) and the other with larger peak current ( ⁇ 78 ⁇ 17 pA) corresponding to Thrombin and AchE respectively.
- the larger peak current can be explained by the massive AchE trying to get through to the confined geometry of the nanopipette in a linear fashion.
- the present design allows easy and controlled positioning of any specific aptamer probe along the dsDNA.
- nanopores can not only count the targets bound to its specific aptamer probes, but can also be used to accurately determine the location between different aptamer probes/targets along a DNA molecule the translocation times were normalized with 0 being defined as the translocation onset and 1 being defined as the end of the translocation. This is needed to take into account the differences in dwell time from translocation to translocation so that the fractional position of the bound protein to the DNA carrier can be determined, FIG. 3( c ) .
- the translocations could be broken down into sub-populations consisting of 1, 2, and 3 proteins bound to the DNA carrier labelled target i.
- Different targets along the DNA carrier were able to identify, one of the binding domains is dependent on hybridising to the second domain and this could easily be overcome by ligation of the relevant sequences in future experiments. In all cases the fractional position corresponded well to the spacing between the different targets.
- the same approach can in principle be used for the identification and positional mapping of specific sequence motifs in a carrier with unknown sequence.
- FCS Fluorescence Correlation Spectroscopy
- FCS optical
- the aptamer sequences comprise a single stranded portion complementary to the DNA carrier via hybridization, with the other end of the aptamer sequence biotinylated.
- the complex was then incubated with protein target (in this case streptavidin), which has a fluorophore (Atto 488), enabling optical protein detection.
- protein target in this case streptavidin
- Altto 488 protein target
- the method enable multiplexing by implementing specific sequences along the DNA carrier.
- FIG. 9 shows the results of this validation work. Optical detection of the carrier/aptamer/analyte complex. In FIG. 9 a , the three different signals observed due to carrier only, protein only and carrier-protein complex can be seen. In FIG. 9 b typical traces from both optical and electrical signals are shown, with synchronized detection visible on several occasions. This work demonstrates that simultaneous electrical and optical detection is possible.
- FIGS. 10, 15, 18, 20, 22 and 23 Further control experiments were carried out as demonstrated in FIGS. 10, 15, 18, 20, 22 and 23 .
- the data from FIGS. 10, 11, 12, 13 and 22 were further re-analysed, including in light of further control experiments carried out. Results are shown in FIGS. 14 to 26 .
- the methods were carried out as set out above.
- a fully flexible yet efficient sensing method able to selectively detect multiple proteins via the grafting of the aptamer sequence recognition in solid-state nanopore system.
- the method has accurately demonstrate differentiation of different protein sizes and the precise location of targets binding to the detection probes as seen by the multiple sub-level signatures obtained within the DNA carrier.
- the platform has been able to successfully isolate and identify targets without the need for repeated wash steps, expensive oligomers modification or using high reported concentration of incubated antibodies, hence significantly reducing the operation time and the cost.
- Aptamers are small, highly negatively charged and can be engineered to enhance their target selectivity and binding affinity (from low nM to pM), allowing further reduction in non-specific binding analyte interactions as well as the prevention of pore clogging which commonly reported.
- the excellent selectivity and affinity of biosensor is particularly vital in diagnostics detecting and identifying rare biomolecules/diseases in clinical sample or other biological fluids.
- majority of the nanopore studies only work with specific proteins incubating with their specific counterpart in buffer based electrolyte. This contrasts with the real scenario of detecting proteins in actual samples such as non-specific binding to background proteins, environmental/reagent contamination from sample collections.
Landscapes
- Health & Medical Sciences (AREA)
- Life Sciences & Earth Sciences (AREA)
- Engineering & Computer Science (AREA)
- Biomedical Technology (AREA)
- Molecular Biology (AREA)
- Chemical & Material Sciences (AREA)
- Immunology (AREA)
- Physics & Mathematics (AREA)
- Hematology (AREA)
- Urology & Nephrology (AREA)
- General Health & Medical Sciences (AREA)
- Biochemistry (AREA)
- Biotechnology (AREA)
- Genetics & Genomics (AREA)
- General Physics & Mathematics (AREA)
- Pathology (AREA)
- Medicinal Chemistry (AREA)
- Food Science & Technology (AREA)
- Analytical Chemistry (AREA)
- Microbiology (AREA)
- Biophysics (AREA)
- Tropical Medicine & Parasitology (AREA)
- Cell Biology (AREA)
- General Engineering & Computer Science (AREA)
- Bioinformatics & Cheminformatics (AREA)
- Wood Science & Technology (AREA)
- Zoology (AREA)
- Organic Chemistry (AREA)
- Plant Pathology (AREA)
- Measuring Or Testing Involving Enzymes Or Micro-Organisms (AREA)
Abstract
Description
-
- a. providing a carrier nucleic acid molecule with at least one single-stranded region;
- b. providing one or more aptamers specific for the analyte, wherein the aptamers additionally comprise a single-stranded portion complementary to at least one single-stranded region on the carrier nucleic acid;
- c. contacting the carrier nucleic acid and one or more aptamers with the sample, forming a carrier nucleic acid/aptamer/analyte complex;
- d. detecting the presence of the carrier nucleic acid/aptamer/analyte complex.
-
- a. providing a carrier nucleic acid molecule with at least one single-stranded region;
- b. providing one or more aptamers specific for the analyte, wherein the aptamers additionally comprise a single-stranded portion complementary to at least one single-stranded region on the carrier nucleic acid;
- c. providing a known quantity of the analyte conjugated to a high molecular weight label, forming a known quantity of carrier nucleic acid/aptamer/labelled-analyte complex;
- d. contacting the carrier nucleic acid/aptamer/labelled-analyte complex with the sample; and
- e. detecting the change of the presence of the carrier nucleic acid/aptamer/labelled-analyte complex.
| Target i (27 bases): |
| (SEQ ID NO: 5) |
| 5′-GGTTGG TGTGGTTGGAGGTCGCCGCC-3′, |
| Target ii (51 bases): |
| (SEQ ID NO: 6) |
| 5′-GGTTGGTGTGGTTGGGGGCGGCGACCTAAGGTGTCGTGCGTAAGTTT |
| TTAA-3′, |
| Target iii (69 bases): |
| (SEQ ID NO: 7) |
| 5′-GGTTGGTGTGGTTGGTTTTTTTTTGTCTTTTTTTTTTTTCTGTTTTT |
| AAAAACTTACGCACGACACCTT-3′. |
In all cases the aptamer sequences are shown is shown in black and underlined.
| Target i (27 bases, thrombin): |
| (SEQ ID NO: 9) |
| 5′-GGTTGGTGTGGTTGGAGGTCGCCGCCC-3′, |
| Target ii (75 bases, AChE): |
| (SEQ ID NO: 8) |
| 5′-GGTTGACTGTAGCTCTGGCAGACGTAGTGTGAAGGTACCGGGCGGCG |
| ACCTAAGGTGTCGTGCGTAAGTTTTTAA-3′. |
In all cases the aptamer sequences are shown is shown in black and underlined.
- 1. Dekker, C., Solid-state nanopores.
Nature nanotechnology 2007, 2, 209-215. - 2. Miles, B. N.; Ivanov, A. P.; Wilson, K. A.; Dogan, F.; Japrung, D.; Edel, J. B., Single molecule sensing with solid-state nanopores: novel materials, methods, and applications. Chemical Society reviews 2013, 42 (1), 15-28.
- 3. Shi, W.; Friedman, A. K.; Baker, L. A., Nanopore Sensing. Analytical chemistry 2017, 89 (1), 157-188.
- 4. Howorka, S.; Siwy, Z., Nanopore analytics: sensing of single molecules. Chemical Society reviews 2009, 38 (8), 2360-2384.
- 5. Meller, A.; Nivon, L.; Branton, D., Voltage-Driven DNA Translocations through a Nanopore. Physical Review Letters 2001, 86 (15), 3435-3438.
- 6. Li, J.; Gershow, M.; Stein, D.; Brandin, E.; Golovchenko, J. A., DNA molecules and configurations in a solid-state nanopore microscope. Nature materials 2003, 2 (9), 611-5.
- 7. Storm, A. J.; Storm, C.; Chen, J.; Zandbergen, H.; Joanny, J.-F.; Dekker, C., Fast DNA Translocation through a Solid-State Nanopore. Nano letters 2005, 5 (7), 1193-1197.
- 8. John. J. Kasianowicz, E. B., Daniel Branton, and David W. Deamer, Characterization of individual polynucleotide molecules using a membrane channel. PNAS 1996, 93.
- 9. Plesa, C.; Kowalczyk, S. W.; Zinsmeester, R.; Grosberg, A. Y.; Rabin, Y.; Dekker, C., Fast translocation of proteins through solid state nanopores. Nano letters 2013, 13 (2), 658-63.
- 10. Li, W.; Bell, N. A. W.; Hernandez-Ainsa, S.; Thacker, V. V.; Thackray, A. M.; Bujdoso, R.; Keyser, U. F., Single Protein Molecule Detection by Glass Nanopores. ACS Nano 2013, 7 (5), 4129-4134.
- 11. Wanunu, M.; Dadosh, T.; Ray, V.; Jin, J.; McReynolds, L.; Drndic, M., Rapid electronic detection of probe-specific microRNAs using thin nanopore sensors. Nature nanotechnology 2010, 5 (11), 807-14.
- 12. Gu, L.-Q.; Braha, O.; Conlan, S.; Cheley, S.; Bayley, H., Stochastic sensing of organic analytes by a pore-forming protein containing a molecular adapter. Nature 1999, 398 (6729), 686-690.
- 13. Maglia, G.; Henricus, M.; Wyss, R.; Li, Q.; Cheley, S.; Bayley, H., DNA Strands from Denatured Duplexes are Translocated through Engineered Protein Nanopores at Alkaline pH. Nano letters 2009, 9 (11), 3831-3836.
- 14. Oukhaled, G.; Mathé, J.; Biance, A. L.; Bacri, L.; Betton, J. M.; Lairez, D.; Pelta, J.; Auvray, L., Unfolding of Proteins and Long Transient Conformations Detected by Single Nanopore Recording. Physical Review Letters 2007, 98 (15), 158101.
- 15. Rodriguez-Larrea, D.; Bayley, H., Multistep protein unfolding during nanopore translocation. Nat Nano 2013, 8 (4), 288-295.
- 16. Rosen, C. B.; Rodriguez-Larrea, D.; Bayley, H., Single-molecule site-specific detection of protein phosphorylation with a nanopore. Nat Biotech 2014, 32 (2), 179-181.
- 17. Nivala, J.; Marks, D. B.; Akeson, M., Unfoldase-mediated protein translocation through an alpha-hemolysin nanopore. Nature biotechnology 2013, 31 (3), 247-50.
- 18. Nivala, J.; Mulroney, L.; Li, G.; Schreiber, J.; Akeson, M., Discrimination among Protein Variants Using an Unfoldase-Coupled Nanopore. ACS Nano 2014.
- 19. A. J. Storm, J. H. C., X. S. Ling, H. W. Zandbergen and C. Dekker Fabrication of solid-state nanopores with single-nanometre precision.
Nature Mat 2003, 2, 537-540. - 20. Ayub, M.; Ivanov, A.; Hong, J.; Kuhn, P.; Instuli, E.; Edel, J. B.; Albrecht, T., Precise electrochemical fabrication of sub-20 nm solid-state nanopores for single-molecule biosensing. Journal of physics. Condensed matter: an Institute of Physics journal 2010, 22 (45), 454128.
- 21. Kowalczyk, S. W.; Hall, A. R.; Dekker, C., Detection of local protein structures along DNA using solid-state nanopores. Nano letters 2010, 10 (1), 324-8.
- 22. Spiering, A.; Getfert, S.; Sischka, A.; Reimann, P.; Anselmetti, D., Nanopore translocation dynamics of a single DNA-bound protein. Nano letters 2011, 11 (7), 2978-82.
- 23. Squires, A.; Atas, E.; Meller, A., Nanopore sensing of individual transcription factors bound to DNA.
Sci Rep 2015, 5, 11643. - 24. Smeets, R. M. M.; Kowalczyk, S. W.; Hall, A. R.; Dekker, N. H.; Dekker, C., Translocation of RecA-Coated Double-Stranded DNA through Solid-State Nanopores. Nano letters 2009, 9 (9), 3089-3095.
- 25. Erik C. Yusko, J. M. J., Sheereen Majd, Panchika Prangkio, Ryan C. Rollings, Jiali Li, Jerry Yang and Michael Mayer, Controlling protein translocation through nanopores with bio-inspired fluid walls.
Nature nanotechnology 2011, 6, 253-260. - 26. Yusko, E. C.; Bruhn, B. R.; Eggenberger, O. M.; Houghtaling, J.; Rollings, R. C.; Walsh, N. C.; Nandivada, S.; Pindrus, M.; Hall, A. R.; Sept, D.; Li, J.; Kalonia, D. S.; Mayer, M., Real-time shape approximation and fingerprinting of single proteins using a nanopore. Nature nanotechnology 2016.
- 27. Singer, A.; Wanunu, M.; Morrison, W.; Kuhn, H.; Frank-Kamenetskii, M.; Meller, A., Nanopore based sequence specific detection of duplex DNA for genomic profiling.
Nano letters 2010, 10, 738-742. - 28. Singer, A.; Rapireddy, S.; Ly, D. H.; Meller, A., Electronic barcoding of a viral gene at the single-molecule level. Nano letters 2012, 12 (3), 1722-8.
- 29. Bell, N. A.; Keyser, U. F., Specific protein detection using designed DNA carriers and nanopores. Journal of the American Chemical Society 2015, 137 (5), 2035-41.
- 30. Bell, N. A.; Keyser, U. F., Digitally encoded DNA nanostructures for multiplexed, single-molecule protein sensing with nanopores. Nature nanotechnology 2016, 11 (7), 645-51.
- 31. Kong, J.; Bell, N. A.; Keyser, U. F., Quantifying Nanomolar Protein Concentrations Using Designed DNA Carriers and Solid-State Nanopores. Nano letters 2016, 16 (6), 3557-62.
- 32. Tuerk, C.; Gold, L., Systematic evolution of ligands by exponential enrichment: RNA ligands to bacteriophage T4 DNA polymerase. Science (New York, N.Y.) 1990, 249 (4968), 505-510.
- 33. Ellington, A. D.; Szostak, J. W., In vitro selection of RNA molecules that bind specific ligands. Nature 1990, 346 (6287), 818-822.
- 34. Smith, J. E.; Medley, C. D.; Tang, Z.; Shangguan, D.; Lofton, C.; Tan, W., Aptamer-conjugated nanoparticles for the collection and detection of multiple cancer cells. Analytical chemistry 2007, 79 (8), 3075-82.
- 35. Kelly, J. A.; Feigon, J.; Yeates, T. O., Reconciliation of the X-ray and NMR Structures of the Thrombin-Binding Aptamer d(GGTTGGTGTGGTTGG). Journal of Molecular Biology 1996, 256 (3), 417-422.
- 36. Russo Krauss, I.; Merlino, A.; Giancola, C.; Randazzo, A.; Mazzarella, L.; Sica, F., Thrombin-aptamer recognition: a revealed ambiguity. Nucleic acids research 2011.
- 37. Pasternak, A.; Hernandez, F. J.; Rasmussen, L. M.; Vester, B.; Wengel, J., Improved thrombin binding aptamer by incorporation of a single unlocked nucleic acid monomer. Nucleic acids research 2011, 39 (3), 1155-64.
- 38. Russo Krauss, I.; Merlino, A.; Randazzo, A.; Novellino, E.; Mazzarella, L.; Sica, F., High-resolution structures of two complexes between thrombin and thrombin-binding aptamer shed light on the role of cations in the aptamer inhibitory activity. Nucleic acids research 2012, 40 (16), 8119-8128.
- 39. Le, T. T.; Chumphukam, O.; Cass, A. E. G., Determination of minimal sequence for binding of an aptamer. A comparison of truncation and hybridization inhibition methods. RSC Adv. 2014, 4 (88), 47227-47233.
- 40. Chumphukam, O.; Le, T. T.; Cass, A. E., High efficiency acetylcholinesterase immobilization on DNA aptamer modified surfaces. Molecules 2014, 19 (4), 4986-96.
Claims (10)
Applications Claiming Priority (4)
| Application Number | Priority Date | Filing Date | Title |
|---|---|---|---|
| GB1705764 | 2017-04-10 | ||
| GB1705764.7 | 2017-04-10 | ||
| GBGB1705764.7A GB201705764D0 (en) | 2017-04-10 | 2017-04-10 | Analyte detection method |
| PCT/GB2018/050956 WO2018189530A1 (en) | 2017-04-10 | 2018-04-10 | Analyte detection method |
Publications (2)
| Publication Number | Publication Date |
|---|---|
| US20200041497A1 US20200041497A1 (en) | 2020-02-06 |
| US11131663B2 true US11131663B2 (en) | 2021-09-28 |
Family
ID=58744665
Family Applications (1)
| Application Number | Title | Priority Date | Filing Date |
|---|---|---|---|
| US16/604,293 Active US11131663B2 (en) | 2017-04-10 | 2018-04-10 | Analyte detection method |
Country Status (4)
| Country | Link |
|---|---|
| US (1) | US11131663B2 (en) |
| EP (1) | EP3610257A1 (en) |
| GB (1) | GB201705764D0 (en) |
| WO (1) | WO2018189530A1 (en) |
Cited By (1)
| Publication number | Priority date | Publication date | Assignee | Title |
|---|---|---|---|---|
| US20230220451A1 (en) * | 2020-05-27 | 2023-07-13 | Imperial College Innovations Limited | Analyte detection method |
Families Citing this family (1)
| Publication number | Priority date | Publication date | Assignee | Title |
|---|---|---|---|---|
| GB201902630D0 (en) * | 2019-02-27 | 2019-04-10 | Imperial Innovations Ltd | Analyte detection method |
Citations (10)
| Publication number | Priority date | Publication date | Assignee | Title |
|---|---|---|---|---|
| US20070166741A1 (en) | 1998-12-14 | 2007-07-19 | Somalogic, Incorporated | Multiplexed analyses of test samples |
| US20100021899A1 (en) | 2006-09-27 | 2010-01-28 | National University Corporation Tokyo University Of Agriculture And Technology | Method of assaying target substance in sample, aptamer molecule and method of constructing the same |
| WO2013016280A2 (en) | 2011-07-22 | 2013-01-31 | Mediomics, Llc | Compositions and methods for selecting aptamers |
| WO2013121201A1 (en) | 2012-02-15 | 2013-08-22 | Oxford Nanopore Technologies Limited | Aptamer method |
| US20140246317A1 (en) | 2013-02-25 | 2014-09-04 | The Regents Of The University Of Michigan | Nanopore-based determination of protein charge, shape, volume, rotational diffusion coefficient, and dipole moment |
| WO2014160192A1 (en) * | 2013-03-13 | 2014-10-02 | Meso Scale Technologies, Llc. | Improved assay methods |
| US20150080242A1 (en) | 2013-07-22 | 2015-03-19 | University Of Massachusetts | Nanopore sensors and uses thereof |
| WO2015121394A1 (en) | 2014-02-14 | 2015-08-20 | Ecole Polytechnique Federale De Lausanne (Epfl) | Molecular sensing device |
| US20150354001A1 (en) | 2013-02-07 | 2015-12-10 | Yissum Research Development Company Of The Hebrew University Of Jerusalem Ltd. | Hybrid nanopores and uses thereof for detection of analytes |
| US20160053300A1 (en) | 2013-03-25 | 2016-02-25 | Katholieke Universiteit Leuven | Nanopore biosensors for detection of proteins and nucleic acids |
-
2017
- 2017-04-10 GB GBGB1705764.7A patent/GB201705764D0/en not_active Ceased
-
2018
- 2018-04-10 WO PCT/GB2018/050956 patent/WO2018189530A1/en not_active Ceased
- 2018-04-10 EP EP18719630.8A patent/EP3610257A1/en active Pending
- 2018-04-10 US US16/604,293 patent/US11131663B2/en active Active
Patent Citations (10)
| Publication number | Priority date | Publication date | Assignee | Title |
|---|---|---|---|---|
| US20070166741A1 (en) | 1998-12-14 | 2007-07-19 | Somalogic, Incorporated | Multiplexed analyses of test samples |
| US20100021899A1 (en) | 2006-09-27 | 2010-01-28 | National University Corporation Tokyo University Of Agriculture And Technology | Method of assaying target substance in sample, aptamer molecule and method of constructing the same |
| WO2013016280A2 (en) | 2011-07-22 | 2013-01-31 | Mediomics, Llc | Compositions and methods for selecting aptamers |
| WO2013121201A1 (en) | 2012-02-15 | 2013-08-22 | Oxford Nanopore Technologies Limited | Aptamer method |
| US20150354001A1 (en) | 2013-02-07 | 2015-12-10 | Yissum Research Development Company Of The Hebrew University Of Jerusalem Ltd. | Hybrid nanopores and uses thereof for detection of analytes |
| US20140246317A1 (en) | 2013-02-25 | 2014-09-04 | The Regents Of The University Of Michigan | Nanopore-based determination of protein charge, shape, volume, rotational diffusion coefficient, and dipole moment |
| WO2014160192A1 (en) * | 2013-03-13 | 2014-10-02 | Meso Scale Technologies, Llc. | Improved assay methods |
| US20160053300A1 (en) | 2013-03-25 | 2016-02-25 | Katholieke Universiteit Leuven | Nanopore biosensors for detection of proteins and nucleic acids |
| US20150080242A1 (en) | 2013-07-22 | 2015-03-19 | University Of Massachusetts | Nanopore sensors and uses thereof |
| WO2015121394A1 (en) | 2014-02-14 | 2015-08-20 | Ecole Polytechnique Federale De Lausanne (Epfl) | Molecular sensing device |
Non-Patent Citations (61)
Cited By (1)
| Publication number | Priority date | Publication date | Assignee | Title |
|---|---|---|---|---|
| US20230220451A1 (en) * | 2020-05-27 | 2023-07-13 | Imperial College Innovations Limited | Analyte detection method |
Also Published As
| Publication number | Publication date |
|---|---|
| EP3610257A1 (en) | 2020-02-19 |
| GB201705764D0 (en) | 2017-05-24 |
| US20200041497A1 (en) | 2020-02-06 |
| WO2018189530A1 (en) | 2018-10-18 |
Similar Documents
| Publication | Publication Date | Title |
|---|---|---|
| Sze et al. | Single molecule multiplexed nanopore protein screening in human serum using aptamer modified DNA carriers | |
| Cai et al. | Small molecule electro-optical binding assay using nanopores | |
| US10273527B2 (en) | Nanopore-facilitated single molecule detection of nucleic acids | |
| Gu et al. | Single molecule sensing by nanopores and nanopore devices | |
| EP2537026B1 (en) | High-resolution analysis devices and related methods | |
| US9121823B2 (en) | High-resolution analysis devices and related methods | |
| US20190300947A1 (en) | Dna sequencing by nanopore using modified nucleotides | |
| US20190187031A1 (en) | Concentration of analytes | |
| EP2521796A4 (en) | DNA SEQUENCING METHODS AND DETECTORS AND SYSTEMS FOR IMPLEMENTING SAME | |
| Sethi et al. | Direct detection of conserved viral sequences and other nucleic acid motifs with solid-state nanopores | |
| US20140087390A1 (en) | Method and system for analysis of protein and other modifications on dna and rna | |
| Reynaud et al. | Discrimination of α-thrombin and γ-thrombin using aptamer-functionalized nanopore sensing | |
| Fang et al. | Unambiguous discrimination of multiple protein biomarkers by nanopore sensing with double-stranded DNA-based probes | |
| US20180363035A1 (en) | Methods and Compositions for Target Detection in a Nanopore Using a Labelled Polymer Scaffold | |
| WO2017165647A1 (en) | Rapid and sensitive detection and quantification of analytes in complex samples using polymer-based methods | |
| WO2018069484A2 (en) | Molecular detection and counting using nanopores | |
| Henley et al. | Studies of RNA sequence and structure using nanopores | |
| Loh et al. | Electric single-molecule hybridization detector for short DNA fragments | |
| US11131663B2 (en) | Analyte detection method | |
| Luchian et al. | Single‐molecule, hybridization‐based strategies for short nucleic acids detection and recognition with nanopores | |
| Bahrami et al. | Solid-state nanopores for biosensing with submolecular resolution | |
| JP2021536261A (en) | Sensing compositions, methods, and devices for detecting molecules using nanopore devices | |
| Balagurusamy et al. | Detection of DNA hybridizations using solid-state nanopores | |
| CN115176029A (en) | Analyte detection | |
| Gu et al. | Aptamer-encoded nanopore for ultrasensitive detection of bioterrorist agent ricin at single-molecule resolution |
Legal Events
| Date | Code | Title | Description |
|---|---|---|---|
| AS | Assignment |
Owner name: IMPERIAL COLLEGE INNOVATIONS LIMITED, UNITED KINGDOM Free format text: ASSIGNMENT OF ASSIGNORS INTEREST;ASSIGNORS:CASS, ANTHONY EDWARD GEORGE;EDEL, JOSHUA BENNO;SZE, JASMINE Y Y;SIGNING DATES FROM 20190918 TO 20190919;REEL/FRAME:050678/0389 |
|
| FEPP | Fee payment procedure |
Free format text: ENTITY STATUS SET TO UNDISCOUNTED (ORIGINAL EVENT CODE: BIG.); ENTITY STATUS OF PATENT OWNER: SMALL ENTITY |
|
| FEPP | Fee payment procedure |
Free format text: ENTITY STATUS SET TO SMALL (ORIGINAL EVENT CODE: SMAL); ENTITY STATUS OF PATENT OWNER: SMALL ENTITY |
|
| STPP | Information on status: patent application and granting procedure in general |
Free format text: NON FINAL ACTION MAILED |
|
| STPP | Information on status: patent application and granting procedure in general |
Free format text: RESPONSE TO NON-FINAL OFFICE ACTION ENTERED AND FORWARDED TO EXAMINER |
|
| STPP | Information on status: patent application and granting procedure in general |
Free format text: NOTICE OF ALLOWANCE MAILED -- APPLICATION RECEIVED IN OFFICE OF PUBLICATIONS |
|
| STPP | Information on status: patent application and granting procedure in general |
Free format text: PUBLICATIONS -- ISSUE FEE PAYMENT RECEIVED |
|
| STPP | Information on status: patent application and granting procedure in general |
Free format text: PUBLICATIONS -- ISSUE FEE PAYMENT VERIFIED |
|
| STCF | Information on status: patent grant |
Free format text: PATENTED CASE |
|
| MAFP | Maintenance fee payment |
Free format text: PAYMENT OF MAINTENANCE FEE, 4TH YR, SMALL ENTITY (ORIGINAL EVENT CODE: M2551); ENTITY STATUS OF PATENT OWNER: SMALL ENTITY Year of fee payment: 4 |