US11042474B2 - Scheduled tests for endpoint agents - Google Patents
Scheduled tests for endpoint agents Download PDFInfo
- Publication number
- US11042474B2 US11042474B2 US16/848,723 US202016848723A US11042474B2 US 11042474 B2 US11042474 B2 US 11042474B2 US 202016848723 A US202016848723 A US 202016848723A US 11042474 B2 US11042474 B2 US 11042474B2
- Authority
- US
- United States
- Prior art keywords
- endpoint
- agents
- tests
- endpoint agents
- network
- Prior art date
- Legal status (The legal status is an assumption and is not a legal conclusion. Google has not performed a legal analysis and makes no representation as to the accuracy of the status listed.)
- Expired - Fee Related
Links
Images


Classifications
-
- H—ELECTRICITY
- H04—ELECTRIC COMMUNICATION TECHNIQUE
- H04L—TRANSMISSION OF DIGITAL INFORMATION, e.g. TELEGRAPHIC COMMUNICATION
- H04L43/00—Arrangements for monitoring or testing data switching networks
- H04L43/50—Testing arrangements
-
- G—PHYSICS
- G06—COMPUTING OR CALCULATING; COUNTING
- G06F—ELECTRIC DIGITAL DATA PROCESSING
- G06F11/00—Error detection; Error correction; Monitoring
- G06F11/36—Prevention of errors by analysis, debugging or testing of software
- G06F11/3668—Testing of software
- G06F11/3672—Test management
- G06F11/3688—Test management for test execution, e.g. scheduling of test suites
-
- G—PHYSICS
- G06—COMPUTING OR CALCULATING; COUNTING
- G06F—ELECTRIC DIGITAL DATA PROCESSING
- G06F11/00—Error detection; Error correction; Monitoring
- G06F11/36—Prevention of errors by analysis, debugging or testing of software
- G06F11/3668—Testing of software
- G06F11/3672—Test management
- G06F11/3692—Test management for test results analysis
-
- H—ELECTRICITY
- H04—ELECTRIC COMMUNICATION TECHNIQUE
- H04L—TRANSMISSION OF DIGITAL INFORMATION, e.g. TELEGRAPHIC COMMUNICATION
- H04L41/00—Arrangements for maintenance, administration or management of data switching networks, e.g. of packet switching networks
- H04L41/04—Network management architectures or arrangements
- H04L41/046—Network management architectures or arrangements comprising network management agents or mobile agents therefor
-
- H—ELECTRICITY
- H04—ELECTRIC COMMUNICATION TECHNIQUE
- H04L—TRANSMISSION OF DIGITAL INFORMATION, e.g. TELEGRAPHIC COMMUNICATION
- H04L41/00—Arrangements for maintenance, administration or management of data switching networks, e.g. of packet switching networks
- H04L41/08—Configuration management of networks or network elements
- H04L41/0803—Configuration setting
- H04L41/0806—Configuration setting for initial configuration or provisioning, e.g. plug-and-play
-
- H—ELECTRICITY
- H04—ELECTRIC COMMUNICATION TECHNIQUE
- H04L—TRANSMISSION OF DIGITAL INFORMATION, e.g. TELEGRAPHIC COMMUNICATION
- H04L43/00—Arrangements for monitoring or testing data switching networks
- H04L43/08—Monitoring or testing based on specific metrics, e.g. QoS, energy consumption or environmental parameters
-
- G—PHYSICS
- G06—COMPUTING OR CALCULATING; COUNTING
- G06F—ELECTRIC DIGITAL DATA PROCESSING
- G06F11/00—Error detection; Error correction; Monitoring
- G06F11/07—Responding to the occurrence of a fault, e.g. fault tolerance
- G06F11/0703—Error or fault processing not based on redundancy, i.e. by taking additional measures to deal with the error or fault not making use of redundancy in operation, in hardware, or in data representation
- G06F11/0706—Error or fault processing not based on redundancy, i.e. by taking additional measures to deal with the error or fault not making use of redundancy in operation, in hardware, or in data representation the processing taking place on a specific hardware platform or in a specific software environment
- G06F11/0709—Error or fault processing not based on redundancy, i.e. by taking additional measures to deal with the error or fault not making use of redundancy in operation, in hardware, or in data representation the processing taking place on a specific hardware platform or in a specific software environment in a distributed system consisting of a plurality of standalone computer nodes, e.g. clusters, client-server systems
-
- G—PHYSICS
- G06—COMPUTING OR CALCULATING; COUNTING
- G06F—ELECTRIC DIGITAL DATA PROCESSING
- G06F11/00—Error detection; Error correction; Monitoring
- G06F11/07—Responding to the occurrence of a fault, e.g. fault tolerance
- G06F11/0703—Error or fault processing not based on redundancy, i.e. by taking additional measures to deal with the error or fault not making use of redundancy in operation, in hardware, or in data representation
- G06F11/0751—Error or fault detection not based on redundancy
-
- G—PHYSICS
- G06—COMPUTING OR CALCULATING; COUNTING
- G06F—ELECTRIC DIGITAL DATA PROCESSING
- G06F11/00—Error detection; Error correction; Monitoring
- G06F11/30—Monitoring
- G06F11/3003—Monitoring arrangements specially adapted to the computing system or computing system component being monitored
- G06F11/3006—Monitoring arrangements specially adapted to the computing system or computing system component being monitored where the computing system is distributed, e.g. networked systems, clusters, multiprocessor systems
-
- G—PHYSICS
- G06—COMPUTING OR CALCULATING; COUNTING
- G06F—ELECTRIC DIGITAL DATA PROCESSING
- G06F11/00—Error detection; Error correction; Monitoring
- G06F11/30—Monitoring
- G06F11/3003—Monitoring arrangements specially adapted to the computing system or computing system component being monitored
- G06F11/302—Monitoring arrangements specially adapted to the computing system or computing system component being monitored where the computing system component is a software system
-
- G—PHYSICS
- G06—COMPUTING OR CALCULATING; COUNTING
- G06F—ELECTRIC DIGITAL DATA PROCESSING
- G06F11/00—Error detection; Error correction; Monitoring
- G06F11/30—Monitoring
- G06F11/34—Recording or statistical evaluation of computer activity, e.g. of down time, of input/output operation ; Recording or statistical evaluation of user activity, e.g. usability assessment
- G06F11/3409—Recording or statistical evaluation of computer activity, e.g. of down time, of input/output operation ; Recording or statistical evaluation of user activity, e.g. usability assessment for performance assessment
-
- G—PHYSICS
- G06—COMPUTING OR CALCULATING; COUNTING
- G06F—ELECTRIC DIGITAL DATA PROCESSING
- G06F2201/00—Indexing scheme relating to error detection, to error correction, and to monitoring
- G06F2201/865—Monitoring of software
-
- H—ELECTRICITY
- H04—ELECTRIC COMMUNICATION TECHNIQUE
- H04L—TRANSMISSION OF DIGITAL INFORMATION, e.g. TELEGRAPHIC COMMUNICATION
- H04L41/00—Arrangements for maintenance, administration or management of data switching networks, e.g. of packet switching networks
- H04L41/22—Arrangements for maintenance, administration or management of data switching networks, e.g. of packet switching networks comprising specially adapted graphical user interfaces [GUI]
-
- H—ELECTRICITY
- H04—ELECTRIC COMMUNICATION TECHNIQUE
- H04L—TRANSMISSION OF DIGITAL INFORMATION, e.g. TELEGRAPHIC COMMUNICATION
- H04L43/00—Arrangements for monitoring or testing data switching networks
- H04L43/08—Monitoring or testing based on specific metrics, e.g. QoS, energy consumption or environmental parameters
- H04L43/0805—Monitoring or testing based on specific metrics, e.g. QoS, energy consumption or environmental parameters by checking availability
- H04L43/0817—Monitoring or testing based on specific metrics, e.g. QoS, energy consumption or environmental parameters by checking availability by checking functioning
Definitions
- Web services can be used to provide communications between electronic/computing devices over a network, such as the Internet.
- a web site is an example of a type of web service.
- a web site is typically a set of related web pages that can be served from a web domain.
- a web site can be hosted on a web server.
- a publicly accessible web site can generally be accessed via a network, such as the Internet.
- the publicly accessible collection of web sites is generally referred to as the World Wide Web (WW).
- WWW World Wide Web
- Cloud computing generally refers to the use of computing resources (e.g., hardware and software) that are delivered as a service over a network (e.g., typically, the Internet). Cloud computing includes using remote services to provide a user's data, software, and computation.
- computing resources e.g., hardware and software
- a network e.g., typically, the Internet
- Distributed applications can generally be delivered using cloud computing techniques.
- distributed applications can be provided using a cloud computing model, in which users are provided access to application software and databases over a network.
- the cloud providers generally manage the infrastructure and platforms (e.g., servers/appliances) on which the applications are executed.
- Various types of distributed applications can be provided as a cloud service or as a Software as a Service (SaaS) over a network, such as the Internet.
- SaaS Software as a Service
- FIG. 1 illustrates a functional block diagram of a platform for providing enterprise network monitoring using scheduled tests for endpoint agents in accordance with some embodiments.
- FIG. 2 is a network layer diagram illustrating that the data collected from endpoints is segmented into different network layers in accordance with some embodiments.
- FIG. 3 is a graphical visualization of a network topology generated using endpoint agents in accordance with some embodiments.
- FIG. 4 is a functional block diagram of an architecture of an endpoint agent for an end-user device in accordance with some embodiments.
- FIG. 5 is a graphical visualization that illustrates a path tracing from endpoints in accordance with some embodiments.
- FIG. 6 is an example network environment that shows example endpoint agent deployments in accordance with some embodiments.
- FIG. 7 is a graphical visualization that illustrates a high latency problem from an endpoint to a gateway via a wireless link that is identified using the disclosed techniques in accordance with some embodiments.
- FIG. 8 is a graphical visualization that illustrates a packet loss problem from an endpoint to a gateway via a wireless link that is identified using the disclosed techniques in accordance with some embodiments.
- FIG. 9 is a graphical visualization that illustrates incomplete components on a web page problem that is identified using the disclosed techniques in accordance with some embodiments.
- FIG. 10 illustrates an overview of a scheduled test process for endpoint agents in accordance with some embodiments.
- FIG. 11 is a functional block diagram of an architecture of a test scheduler for endpoint agents in accordance with some embodiments.
- FIG. 12 is a screen diagram for adding a new label for dynamic assignment of scheduled tests to endpoint agents in accordance with some embodiments.
- FIG. 13 is a screen diagram of a new endpoint agent label creation dialog for configuring labels for dynamic assignment of scheduled tests to endpoint agents in accordance with some embodiments.
- FIG. 14 is a screen diagram of dialog for creating a new test for dynamic assignment to endpoint agents in accordance with some embodiments.
- FIG. 15 is a screen diagram of dialog for creating an agent to server (network layer) test for dynamic assignment to endpoint agents in accordance with some embodiments.
- FIG. 16 is a screen diagram of dialog for creating an HTTP server (web layer) test for dynamic assignment to endpoint agents in accordance with some embodiments.
- FIG. 17 illustrates a screen diagram of endpoint agent views for scheduled tests in accordance with some embodiments.
- FIG. 18 illustrates a screen diagram of an endpoint scheduled test results view with an HTTP server test selected in accordance with some embodiments.
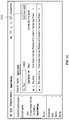
- FIG. 19 illustrates a screen diagram of an endpoint scheduled test results view with a network test selected in accordance with some embodiments.
- FIG. 20 illustrates a screen diagram of a map view for network tests in accordance with some embodiments.
- FIG. 21 illustrates a screen diagram of a network path visualization view for network tests in accordance with some embodiments.
- FIG. 22 illustrates a screen diagram of data filtering in the network path visualization view for network tests in accordance with some embodiments.
- FIG. 23 illustrates a flow diagram for monitoring enterprise networks with endpoint agents in accordance with some embodiments.
- FIG. 24 illustrates a flow diagram for monitoring enterprise networks with endpoint agents in accordance with some embodiments.
- FIG. 25 illustrates a flow diagram for monitoring enterprise networks with endpoint agents in accordance with some embodiments.
- FIG. 26 illustrates a flow diagram for monitoring enterprise networks with scheduled tests for endpoint agents in accordance with some embodiments.
- FIG. 27 illustrates another flow diagram for monitoring enterprise networks with scheduled tests for endpoint agents in accordance with some embodiments.
- the invention can be implemented in numerous ways, including as a process; an apparatus; a system; a composition of matter; a computer program product embodied on a computer readable storage medium; and/or a processor, such as a processor configured to execute instructions stored on and/or provided by a memory coupled to the processor.
- these implementations, or any other form that the invention may take, may be referred to as techniques.
- the order of the steps of disclosed processes may be altered within the scope of the invention.
- a component such as a processor or a memory described as being configured to perform a task may be implemented as a general component that is temporarily configured to perform the task at a given time or a specific component that is manufactured to perform the task.
- the term ‘processor’ refers to one or more devices, circuits, and/or processing cores configured to process data, such as computer program instructions.
- Distributed applications can generally be delivered using cloud computing techniques.
- distributed applications can be provided using a cloud computing model, in which users are provided access to application software and databases over a network.
- the cloud providers generally manage the infrastructure and platforms (e.g., servers/appliances) on which the applications are executed.
- Various types of distributed applications can be provided as a cloud service or as a software as a service (SaaS) over a network, such as the Internet.
- SaaS software as a service
- a distributed application can be implemented as a SaaS-based web service available via a web site that can be accessed via the Internet.
- a distributed application can be implemented using a cloud provider to deliver a cloud-based service.
- cloud-based/web-based services e.g., distributed applications accessible via the Internet
- a web browser e.g., a light-weight desktop
- a mobile application e.g., mobile app
- cloud-based/web-based services can allow enterprises to get their applications up and running faster, with improved manageability and less maintenance, and can enable enterprise IT to more rapidly adjust resources to meet fluctuating and unpredictable business demand.
- using cloud-based/web-based services can allow a business to reduce Information Technology (IT) operational costs by outsourcing hardware and software maintenance and support to the cloud provider.
- IT Information Technology
- cloud-based/web-based services e.g., distributed applications and SaaS-based solutions available as web services via web sites and/or using other cloud-based implementations of distributed applications
- determining whether performance problems are the result of the cloud-based/web-based service provider, the customer's own internal IT network (e.g., the customer's enterprise IT network), a user's client device, and/or intermediate network providers between the user's client device/internal IT network and the cloud-based/web-based service provider of a distributed application and/or web site can present significant challenges.
- agents for clients present additional technical challenges for deploying the performing of scheduled tests to such endpoint agents executed on clients (e.g., client/endpoint devices).
- endpoint agents are not as stable as compared to enterprise/cloud agents (e.g., clients can go offline).
- targeting endpoint agents for testing should be performed to avoid burdening or overloading a network (e.g., enterprise network) or service (e.g., to avoid flooding a service, which can bring down the service).
- Another technical challenge for deploying scheduled tests to such agents executed on clients is that it may not be known where client agents (e.g., also referred to as endpoint agents) are located at any given time.
- an example implementation of the agent is referred to as an endpoint agent.
- the endpoint agent can be implemented as a software package that can be executed on end-user devices (e.g., desktops, laptops, tablets, smart phones, and/or other devices) and monitors network activity associated with the user activities (e.g., the user browser activity) to capture user experience and infrastructure performance metrics as further described below.
- an endpoint agent can generally refer to a functional component (e.g., software implemented as a software package executed on client/user devices) that is configured to perform one or more of the disclosed techniques.
- An endpoint can generally refer to the device where the endpoint agent is installed and/or executed, in which the endpoint is a data source for monitored network activity (e.g., monitored using the endpoint agent), as further described below.
- a Network Monitoring Service Provider (NMSP) cloud e.g., provided by a network monitoring service provider, such as ThousandEyes, Inc.
- a data subscriber e.g., an NMSP cloud subscriber
- an account e.g., a ThousandEyes account
- An endpoint owner can generally refer to the account (e.g., ThousandEyes account) to which the endpoint (e.g., endpoint device) belongs, as further described below.
- a current network can generally refer to the network where the endpoint is connected to and using the Internet, as further described below.
- a data subscriber's configuration identifies one or more networks that are owned by the data subscriber and/or one or more networks that are associated with the data subscriber (e.g., networks to be monitored using the disclosed techniques for network monitoring using scheduled tests for endpoint agents).
- owned networks can generally refer to networks that are owned by data subscribers, as further described below.
- Monitored networks can generally refer to a range of IP addresses of endpoints of interest to the data subscriber, as further described below.
- Whitelisted domains can generally refer to domain names specified by the data subscriber, as further described below.
- Example periodic scheduled tests can include network path tests, HTTP tests, and/or other network infrastructure tests as further described below.
- Endpoint agents can be configured to perform scheduled tests based on a matching label in which agents check-in periodically (e.g., at which point the agent control plane can determine if the current state of the endpoint agent matches the existing scheduled tests labels and if there are slots available to schedule).
- Test data e.g., test results data, also referred to herein as test data points
- test data points can be collected and/or received from endpoint agents that were configured to perform periodic scheduled tests (e.g., transmitted to the agent ingress and subsequently processed and stored).
- the test data can be used to generate a graphical visualization of an application delivery state for one or more application delivery layers based on the test results, generating an alert based on the test results and a set of alert rules, and/or generating a report based on the test results.
- a system/process/computer program product for providing scheduled tests for endpoint agents includes receiving a test configuration for scheduled tests that includes a set of conditions for dynamically selecting endpoint agents that match the set of conditions in the test configuration, wherein a plurality of endpoint agents is deployed to a plurality of endpoint devices; identifying one or more of the plurality of endpoint agents that match the set of conditions in the test configuration; assigning the scheduled tests associated with the test configuration to the matching endpoint agents for execution of the scheduled tests based on the test configuration, wherein test results are based on the scheduled tests executed on each of the matching endpoint agents for monitoring network activity; and receiving uploaded results of the scheduled tests executed on the matching endpoint agents, wherein the uploaded results of the scheduled tests executed on the matching endpoint agents are processed for generating graphical visualizations and/or alerts of the monitored network activity.
- a system/process/computer program product for providing scheduled tests for endpoint agents further includes deploying a plurality of endpoint agents to a plurality of endpoint devices.
- a plurality of endpoint agents can be distributed to a plurality of endpoint devices using the platform described above.
- an endpoint agent can be implemented using the endpoint architecture described above to perform the disclosed techniques for monitoring enterprise networks using endpoint agents.
- a system/process/computer program product for providing scheduled tests for endpoint agents further includes receiving a label for scheduled tests that includes a set of conditions for dynamically selecting endpoint agents that match the set of conditions in the test configuration. For example, a plurality of endpoint agents are deployed to a plurality of endpoint devices, and the endpoint agents can be selected for execution of one or more scheduled tests based on the set of conditions as similarly described above.
- the test configuration can also include a test type (e.g., a network layer test, a web layer test, etc.), a target (e.g., a server, website, etc.), and an interval (e.g., every 1 minute, 5 minutes, or some other time interval) for executing the scheduled tests as similarly described above.
- a system/process/computer program product for providing scheduled tests for endpoint agents further includes receiving a configuration input for setting a maximum number of endpoint agents that are to be selected for concurrently performing the scheduled tests.
- a system/process/computer program product for providing scheduled tests for endpoint agents further includes periodically receiving check-ins from each of the plurality of endpoint agents.
- the agents can check-in to provide current state information as similarly described above.
- a system/process/computer program product for providing scheduled tests for endpoint agents further includes dynamically selecting a subset of the plurality of endpoint agents that match the label based on their current state information.
- the subset of the plurality of endpoint agents does not exceed the maximum number of endpoint agents that are to be selected for performing the scheduled tests.
- the selected endpoint agents will then receive the scheduled tests and execute the scheduled tests based on a configured interval as similarly described above.
- a system/process/computer program product for providing scheduled tests for endpoint agents further includes generating an alert or a report based on the uploaded results of the scheduled tests executed on the matching endpoint agents.
- an alert based on the test results can be generated and output (e.g., a GUI alert, an email/text/phone call alert, and/or other alert notification can be provided based on a configuration for alert notifications and/or based on the alert).
- a report can be generated that includes aggregated test data results, such as over a period of time (e.g., 30 days, 90 days, and/or some other configurable period of time).
- the alert or report can include an event that is determined based on the test results (e.g., events can be based on results from one endpoint agent and/or based on results from two or more endpoint agents (collective intelligence based on endpoint agent data collection, which can also include test results from other agents executed on network infrastructure elements/devices, destination sites, and/or cloud agents)).
- Example events that can be detected using the disclosed techniques can include detection of traffic outages, network infrastructure outages, application outages, and Internet Intelligence.
- an endpoint agent is deployed to an endpoint via an installation package.
- an endpoint owner Alice can download a customized installer, and when installed on an endpoint, this device can be associated with endpoint owner Alice.
- Configurations and updates can be automatically downloaded from an NMSP Cloud (e.g., periodically, on demand, and/or as needed).
- no configurations would need to be performed by the end user.
- installation of the endpoint agent on the endpoint can be automated (e.g., using Windows Group Policies and/or other commercially available solutions for such automated installations of software packages on end-user devices).
- such an automated installation would not require involvement by end users (e.g., providing for an easy and seamless deployment and execution of the endpoint agent on the endpoints that is transparent to the end users).
- the customized installers are generated on-demand by backend services.
- the build system creates a non-activated package, and when requested by the endpoint owner, the package is customized with a globally unique account token and the package is activated on the endpoint.
- performance data collected from end-users is processed to determine how users are experiencing different applications, troubleshooting performance degradation, and establishing trends and patterns across physically distributed points in the network.
- FIG. 1 An example of a system architecture of a platform for providing enterprise network monitoring using scheduled tests for endpoint agents is shown in FIG. 1 as described below.
- FIG. 1 illustrates a functional block diagram of a platform for providing enterprise network monitoring using scheduled tests for endpoint agents in accordance with some embodiments.
- FIG. 1 illustrates an environment in which a platform for cross-layer visibility and troubleshooting of distributed applications 100 includes endpoint agents 116 - 120 (e.g., which can be configured to perform certain tests, have labels, and/or perform on demand, event/context triggered, and/or scheduled tests, such as similarly described herein) that collect data based on configured tests, and the endpoint agents 116 - 120 send this data to a controller(s) 114 (e.g., agent controller(s)).
- a controller(s) 114 e.g., agent controller(s)
- Controller 114 stores the data in a storage tier 112 (e.g., providing permanent storage) that can be used by a web tier 104 to generate visualizations, alerts, and/or reports to users accessing the platform 100 using client/endpoint devices (e.g., computers, laptops, smartphones, and/or various other computing devices).
- a storage tier 112 e.g., providing permanent storage
- client/endpoint devices e.g., computers, laptops, smartphones, and/or various other computing devices.
- a report can be output to a user to present the collected and analyzed cross-layer application delivery information of a distributed application.
- Example reports can include various visualizations and/or diagnostic information as further described herein with respect to various embodiments.
- the report can facilitate troubleshooting application delivery associated with the distributed application to determine whether performance problems are the result of the cloud provider of the distributed application, the customer's own internal IT network, a user's client device, and/or intermediate network providers between the user's client device and the cloud provider.
- the report can also include recommendations to the user to resolve any such determined application delivery problems associated with the distributed application.
- the report can also be provided to a third party, such as the Software as a Service (SaaS) provider of the distributed application and/or a network provider, which can be provided as information to indicate the source of such determined application delivery problems associated with the distributed application.
- SaaS Software as a Service
- the user of client/endpoint device 106 (hereinafter referred to as “Bob”) is employed as an IT manager of a distributed application company (“SaaS Company”).
- the user of client device 108 (hereinafter referred to as “Alice”) is employed as an IT manager of a national company (“ACME Company”).
- Alice is employed as an IT manager of a national company (“ACME Company”).
- Bob and Alice can each access the services of platform 100 (e.g., platform for cross-layer visibility and troubleshooting of distributed applications) via web tier 104 over a network, such as the Internet.
- platform 100 e.g., platform for cross-layer visibility and troubleshooting of distributed applications
- the techniques described herein can work with a variety of client devices 106 - 108 including, for example, personal computers, tablet computers, smartphones, and/or other computing devices.
- platform 100 generates various reports based on results of the network performance tests to facilitate cross-layer visibility and troubleshooting of application delivery associated with a distributed application(s), as further described herein.
- platform 100 includes a data store, such as storage tier 112 , for storing results of the network performance tests and/or the reports.
- a set of agent controllers 114 is provided as shown to send various tests (e.g., such as the various scheduled tests described herein with respect to various embodiments) to the endpoint agents for execution by the endpoint agents.
- endpoint agents can be executed on client/endpoint devices, which are controlled by agent controllers to perform one or more scheduled tests as further described herein, in which the test results can be collected for correlation and analysis, as further described herein with respect to various embodiments.
- the tests are configured through a web interface by a user (e.g., an IT/network admin for ACME Corporation).
- typical parameters can include the frequency of various tests (e.g., periodic, scheduled, on demand, and/or triggered based on events/context information associated with the agents/endpoints or other context information), the target of the tests, and the agents (e.g., based on labels and/or other criteria/context information associated with the agents/endpoints or other context information) where the tests are to be performed.
- the test parameters can be sent from the controller (e.g., agent controllers 114 ) to the endpoint agents after an endpoint agent checks-in (e.g., using a pull mechanism and/or additional techniques as will be further described below).
- the endpoint agent can export the test result(s) back to the controller.
- the controller can then provide the results back to a data store (e.g., storage tier 112 ) for permanent storage (e.g., or temporary storage).
- a controller can also send on-demand tests, scheduled, and/or triggered tests to an agent(s) through, for example, a Remote Procedure Call (RPC) for immediate or on-demand execution.
- RPC Remote Procedure Call
- platform 100 is a scalable, elastic architecture and may comprise several distributed components, including components provided by one or more third parties. Further, when platform 100 is referred to as performing a task, such as storing data or processing data, it is to be understood that a sub-component or multiple sub-components of platform 100 (whether individually or in cooperation with third party components) may cooperate to perform that task.
- tests include various types of tests to facilitate cross-layer visibility and troubleshooting of application delivery associated with a distributed application(s), as further described herein.
- Example network tests include data path measurement tests, routing path measurement tests, and end-to-end network metrics tests.
- Example DNS tests include per name server testing and Domain Name System Security Extensions (DNSSEC) bottom-up validation tests.
- Example HTTP tests include testing of steps of a Uniform Resource Locator (URL) fetch.
- Example page load tests include testing of a load of an entire web page using a web browser (e.g., a typical web browser).
- Example transaction tests include performing a multi-step scripted transaction from a web browser (e.g., a typical web browser). These and various other tests are described herein.
- FIG. 2 is a network layer diagram illustrating that the data collected from endpoints is segmented into different network layers in accordance with some embodiments. In one embodiment, the data collected from endpoints is segmented into different layers as shown in FIG. 2 .
- the data can be collected in the following ways: (1) user triggered; (2) periodic network access and system data; and/or (3) scheduled tests, as further described below.
- User triggered data collection can be triggered by user activity, such as triggered by user activity in the browser executed on the endpoint, and can collect data from all layers below the dashed line (i.e., below user experience layer 240 ), including a system layer 210 , a network layer 220 , and an application layer 230 as shown in FIG. 2 .
- Periodic network access and system data can be used to collect periodic active network measurements to network infrastructure and capture a system resource snapshot of the endpoint.
- scheduled tests can be used to perform active probing from endpoints to predefined targets by an endpoint owner, including, for example, an HTTP server (e.g., a web server, such as a site associated with a cloud service, distributed application, or other network/distributed service/application), network and path trace, and/or other tests can be performed to collect data/measurements relevant to/from all the layers below the dashed line as shown in FIG. 2 .
- HTTP server e.g., a web server, such as a site associated with a cloud service, distributed application, or other network/distributed service/application
- the data collected includes a combination of passive and active monitoring.
- network access tests, system tests, and scheduled tests are periodic whereas the user session data (e.g., web application metrics that include network metrics towards the visited site, such as a web site) is triggered by user activity.
- user session data e.g., web application metrics that include network metrics towards the visited site, such as a web site
- periodically collecting such data can provide a better representation of the local environment and a cleaner baseline to detect anomalies and compute trends associated with, for example, network activities and performance.
- Data collection from end-user devices has several technical challenges, such as due to mobility of end-user devices, limited resources of end-user devices, and privacy/security concerns for users/owners of end-user devices. Because end-user devices can move, the disclosed system and techniques are provided to handle moving between networks with different owners, technologies, set-ups, and/or other similar variables for mobile devices when collecting data from deployed endpoint agents. For example, assume that an end-user Bob is inside an enterprise environment and data collection is being performed by the endpoint agent executed on Bob's endpoint that includes monitoring network activities/performance on the local IT network (e.g., enterprise network). At the end of the day, Bob returns home and transitions to his privately owned network (e.g., home network).
- the local IT network e.g., enterprise network
- This example presents technical challenges for implementing the disclosed techniques using endpoint agents, such as for the following questions. Should data collection continue? Or should just a subset of the metrics be collected? If the data (or a subset of the data) is collected, who should be allowed access to this data? How to detect that the user is moving between networks (e.g., from an enterprise network to a home network or other networks)?
- a DCP Data Collection Profile
- a DCP describes the domains that should trigger automatic recording (e.g., automatic data collection using the endpoint agent) when the user visits the domain in his/her browser; it defines if and how often periodic tests towards local network resources should be performed and/or other policies/rules can be configured based on the DCP.
- the DCP can be associated with a set of networks defined by the IP range of the public IP assigned to the end-user device.
- the DCP can be used to facilitate defining different behavior as users move between various networks (e.g., from an enterprise network to a home network and/or to other networks).
- the DCP can be configured such that the endpoint agent can monitor domain set A and perform gateway/wireless periodic network tests.
- the DCP can be configured such that the endpoint agent can only gather system information associated with his laptop.
- an active DCP is determined by a check-in request to the NMSP cloud that responds with the current DCP based on the public IP address of the check-in request. For example, this can include all information used to collect data until a network change is detected (e.g., the endpoint is associated with a different current network).
- networkId hash(publicIpRange+localPrefix)
- publicIpRange is the public prefix of the public IP address of the endpoint device based on, for example, WHOIS data (e.g., a WHOIS lookup)
- localPrefix is the prefix of the local IP address of the device.
- the networkId facilitates correlating data within the same network across devices as described herein.
- an IT/network administrator can associate a DCP to any network range (e.g., in this example implementation, assuming that it is not verified by any other accounts at the NMSP).
- An account e.g., subscriber of the NMSP
- An account can verify a network range, ensuring that no other account can collect performance or network information from within the specific network.
- an endpoint belonging to Alice visits the offices of the ACME Company.
- ACME Company has an endpoint agent that is configured to monitor on all networks.
- the endpoint agent is disabled as BIGCO Company verified its network range (e.g., with the NMSP for the endpoint agent as described above).
- only endpoint agents associated with BIGCO Company can collect data from within the verified network(s) associated with BIGCO Company.
- network validation of range R by company X can be performed using various techniques. Example techniques for performing network validation will now be described.
- network validation is performed using a WHOIS-based confirmation email.
- range R can be looked up in WHOIS, and an email can then be sent to the email contact listed in the WHOIS look-up result.
- the email can include a unique validation token (e.g., provided by the NMSP) and a link that the recipient of the email can click on to validate ownership of range R. As such, once the recipient of the email clicks the link in the email, it validates ownership of the range R.
- network validation is performed using a DNS-based validation.
- a user can insert a TXT entry pegged to the PTR entry they own (e.g., if they want to validate 192.168.2.0/24, then they can have a 192.168.2.verify_te TXT record with a unique validation token provided by the NMSP).
- network validation is performed using a manual validation.
- a request can be sent to the NMSP (e.g., ThousandEyes) containing the IP range R that is to be validated and the requester.
- NMSP e.g., ThousandEyes
- the endpoint agent performs periodic active measurements to access points, gateways, proxies, DNS servers, and VPN termination servers. For example, by performing such active measurements periodically, the agents can discover the topology of the network access and build a baseline of performance over time. In this example, each agent discovers the local environment using active measurements and information collected directly from the endpoints, such as wireless network quality to the access point, network performance to the gateway/proxy, DNS response time, and VPN performance metrics.
- a dynamic target list is deployed that is updated according to the user activity.
- the dynamic target list can define which proxies and/or VPN servers should be targeted in the active network tests.
- a dynamic target list is a bounded list with a time expiration on each entry.
- the target is added to the list with the current timestamp (e.g., if only select traffic is routed through the VPN/proxy, and/or multiple VPNs/proxies exist dependent on the destination, this can produce multiple VPN/proxy targets; if the user never generated the specific traffic, the VPNs/proxies may not even be used).
- the timestamp is simply updated to the current. If the list exceeds its maximum size, then the entry with the lowest timestamp is removed.
- the periodic network prober uses this list and performs network tests against entries that have not expired. By maintaining a list per network, this facilitates the endpoint agent to continuously/periodically perform local network tests even when the user is moving between different networks.
- the endpoint agent can be periodically probing the default gateway and measuring the wireless properties if it connects to the default gateway through a wireless interface.
- FIG. 3 is a graphical visualization of a network topology generated using endpoint agents in accordance with some embodiments.
- endpoint agent groups 302 , 304 , and 306 can be utilized to facilitate a visualization of the access network for each of the agents over time, in this case including access points 308 , 310 , and 312 , and which gateways are being used as shown at 314 a - c , 316 , and 318 (e.g., as well as a path(s) to VPN servers and proxies (not shown in this example in FIG. 3 )).
- metrics collected can include one or more of the following listed metrics: transmission rate, wireless signal quality, gateway loss and latency, proxy loss and latency, and VPN server loss and latency.
- a workflow for routing of collected data from deployed endpoint agents is performed as will now be described. Assume that an endpoint agent owned by ACME Company is inside a network R. Example scenarios of routing of the collected data (e.g., endpoint agent collected/aggregated data) are provided below.
- ACME Company subscribes to R or monitor all networks is enabled, then the collected data (e.g., collected by the endpoint agent) is routed to ACME Company.
- the collected data (e.g., collected by the endpoint agent) is discarded.
- VDI Virtual Desktop Infrastructure
- a workflow for routing of collected data from deployed endpoint agents is performed to facilitate live sharing of the collected data with one or more other entities as will now be described.
- an endpoint agent owned by ACME Company is inside a network R.
- Example scenarios of routing of the collected data (e.g., endpoint agent collected/aggregated data) to facilitate such live sharing techniques are provided below.
- C-CORP requests to access the collected data from ACME Company and is approved by ACME Company (e.g., a pull request for live sharing, which may also include requesting that the entity/user authenticates that they are authorized for sharing such collected data as it is associated with their network domain and both entities/users approve of such live sharing), then the collected data (e.g., collected by the endpoint agent) is routed to C-CORP.
- a pull request for live sharing which may also include requesting that the entity/user authenticates that they are authorized for sharing such collected data as it is associated with their network domain and both entities/users approve of such live sharing
- ACME Corporation desires to provide access to the collected data from ACME Company (e.g., a pull request for live sharing, which may also include requesting that the entity/user authenticates that they are authorized for sharing such collected data as it is associated with their network domain and both entities/users approve of such live sharing), then the collected data (e.g., collected by the endpoint agent) is routed to C-CORP.
- a pull request for live sharing which may also include requesting that the entity/user authenticates that they are authorized for sharing such collected data as it is associated with their network domain and both entities/users approve of such live sharing
- such live sharing techniques for sharing the collected data can facilitate troubleshooting information to be shared by ACME Corporation with their Software as a Service (SaaS) provider (e.g., Microsoft for Office365 or another service/provider).
- SaaS Software as a Service
- FIG. 4 is a functional block diagram of an architecture of an endpoint agent for an end-user device in accordance with some embodiments.
- an endpoint agent e.g., software package installable on end-user devices
- end-user device 402 is in network communication with NMSP cloud 420 , such as via the Internet (not shown).
- the endpoint agent can include multiple components, which can be executed at different system layers (e.g., a system/kernel, a user space, and/or an application layer).
- an agent DCP component 414 executes in the system layer and includes/stores the DCP for endpoint 402 received from NMSP cloud 420 .
- Agent DCP 414 is in communication with Browser Helper Objects (BHO) 408 and 410 , which can communicate with browser applications, such as a Google Chrome® browser 404 and a Microsoft Internet Explorer® browser 406 as shown.
- BHO Browser Helper Objects
- BHO 410 can be configured to monitor user browser activity on the endpoint, and as similarly described above, network activity monitoring/tests can be triggered/performed based on the site accessed by the user using IE browser 406 and based on the DCP configuration for endpoint 402 as provided via agent DCP 414 (e.g., based on the current network, network domain, and/or other DCP policies/rules as similarly described above).
- agent DCP 414 e.g., based on the current network, network domain, and/or other DCP policies/rules as similarly described above.
- a User Space Proxy (USP) component 412 executed in the user space is provided and is in communication with agent DCP 414 (e.g., the USP can be used for enterprise environments that have all HTTP traffic routed through an authenticated HTTP proxy to access the Internet, such as further described below in the User Space Proxy section).
- the endpoint agent can be configured to perform system monitoring/tests as well as network monitoring/tests using these various components executed on the endpoint.
- the system and network monitoring/tests data/results can be communicated to NMSP cloud 420 (e.g., periodically, on demand, and/or as needed).
- the endpoint agent includes a te-agent component and a te-browserhelper component. These components can be installed automatically by the software installer package.
- the te-agent component is responsible for performing active network measurements, communication with the NMSP cloud, and performing periodic network/system measurements.
- the browser activity is gathered using a te-browserhelper component, which communicates with the browser via JavaScript Object Notation (JSON) Remote Procedure Call (RPC) and uses a te-agent to perform network measurements.
- JSON JavaScript Object Notation
- RPC Remote Procedure Call
- a custom extension EXT
- BHO Browser Helper Object
- BHO Browser Helper Object
- Additional helper components can be utilized to facilitate automatic update and optional user interactions.
- the endpoint agent periodically checks in with the NMSP cloud, which includes its current network and system profile as well as internal usage statistics.
- the NMSP cloud responds with a set of configurations that determines what data should be collected from the current network.
- response provided by the NMSP cloud can include a domain whitelist (e.g., encoded using a Bloom filter).
- this whitelist can be consulted to determine if a given domain should automatically be recorded.
- the check-in can be performed periodically or when a network change is detected (e.g., or based on other configurations or events).
- FIG. 1 An example system architecture of a platform for providing the NMSP cloud is described above with respect to FIG. 1 .
- sample data is collected from the web browser and BHO working together.
- the endpoint agents can be implemented to support one or more commercially available web browsers, such as Google Chrome® and Microsoft Internet Explorer®.
- Google Chrome a standard Chrome extension can be used that uses the “chrome.webRequest” and “chrome.debugger” APIs of Chrome to extract timing and page information.
- custom JavaScript can be injected into the page to extract the timing information.
- samples can be original or extended.
- a sample is original if a new page object triggered that sample (e.g., the first page in a session or if the user has been inactive for a configurable period and then browses to a new page).
- An extended sample is a sample that is triggered by a long running page that continuously generates entries (e.g., a one page website that refreshes its data every 30 seconds). After a configurable period of time, these periodic entries will trigger a new sample that is said to be extending the original sample.
- recording extended samples using the endpoint agent facilitates collecting network data for long running sessions. For example, some sessions may span multiple hours or another extended period of time (e.g., a user may keep a browser open for a given site, such as Facebook, Salesforce.com, or another site/service for one or more days/weeks or another period of extended time). As such, recording extended samples can trigger samples periodically to augment the entries as they are collected (e.g., for predetermined time intervals, such as every 5 minutes, 1 hour, or some other time interval).
- the format is further designed to facilitate separation of responsibility.
- the browser-based data collection software e.g., such as for Google Chrome and Microsoft Internet Explorer as described above
- the browser-based data collection software can be configured to be aware of Session, Page, and Entry objects. This makes the monitoring process more efficient as no processing is needed in the browsers.
- the BHO component can manage the samples and when to create extended samples, how the data for the sample is gathered, and/or other such operations.
- RPC Remote Procedure Call
- UpdatePage( ) is used to send updated information about a page if such becomes available (e.g., page title changed, updated page timings are available, etc.).
- the sample object includes additional network information captured during a session.
- Example additional network information captured during a session can include one or more of the following: host, protocol, and port of HTTP connection; positional coordinates (e.g., resolved using GPS, Wi-Fi location, or network location services); TCP connectivity test towards destination; loss/latency/jitter/traceroute to destination (ICMP); loss/latency/jitter to gateway (ICMP); loss/latency/jitter/traceroute to VPN (ICMP) if configured on the device; loss/latency/jitter/traceroute to HTTP proxy (ICMP) if configured on the device; network configuration profile of network interfaces including IP addresses, DNS servers, gateways, and potential next hop interfaces (in the case of VPNs); physical network information including wireless quality, bssid/ssid, channel, link speed, and/or similar physical network information; proxy configuration profile; and system information including CPU usage, network usage, memory, and disk.
- positional coordinates e.g., resolved using GPS, Wi-Fi
- FIG. 5 is a graphical visualization that illustrates a path tracing from endpoints in accordance with some embodiments.
- the path taken from a multitude of endpoints towards applications used in the browser can be reconstructed.
- the web app Github is actually being served from two different servers as shown at 502 and 504 .
- a 1-hour time aggregation is used, in which the time aggregation can be configured by the user (e.g., from 5 minutes to 1 hour).
- known devices can be annotated in the path, such as in this example the first hop is a VPN server as shown at 506 in FIG. 5 . This helps users to understand how their network is used by different applications and which network elements are associated with each user over time.
- communication with the backend/NMSP cloud is performed using HTTPS and JSON encoded body (e.g., or other (secure) protocols and encodings can be used).
- Gzip compression e.g., or other compression algorithms can be used
- data entries can be batched where a batch can be uploaded when either of the following conditions is satisfied: 1) batch size exceeds configurable threshold; or 2) batch has not been changed within the last predetermined period of time (e.g., X seconds).
- all communication with the NMSP cloud is performed over the HTTPS or another secure protocol and authenticated.
- the authentication can be performed using a globally unique machineId and authentication token generated by the endpoint agent itself.
- HTTP body content and cookies can be removed from the HTTP Archive (HAR) data before leaving the browser memory space (e.g., metadata is retained).
- the domain whitelist downloaded during the check-in is encoded using a Bloom filter (e.g., false positives can be filtered in the NMSP cloud during upload) to prevent a potential attacker from retrieving a list of NMSP customers with verified domains.
- a Bloom filter e.g., false positives can be filtered in the NMSP cloud during upload
- USB User Space Proxy
- the endpoint agent When one comes online, it contacts the endpoint agent and negotiates that it is able to proxy HTTP requests for the endpoint agent.
- the endpoint agent when the endpoint agent is to access the backend (e.g., NMSP cloud), the following checks are performed: (1) can the agent connect to the NMSP cloud directly or (if configured) via a network proxy; and (2) can the agent connect to the NMSP cloud via one of the USPs which will use the proxy and authentication configured on the user.
- the agent is configured to prefer the above-described option for the agent to connect to the NMSP cloud directly or (if configured) via a network proxy, if possible. Further requests can be routed as determined by the above steps without checking the connectivity again. When the network state changes, the checks can be performed again.
- endpoint agents are configured to also perform process monitoring on endpoints.
- endpoint agents can be configured to monitor for certain new processes (e.g., based on an association with a new socket open on the endpoint, which can be used to monitor various network connections including for non-web applications, such as connections between thin clients and a VDI server based on a process executed on the thin client for attaching to the VDI server).
- endpoint agents can be configured to monitor a specific type of process (e.g., a Skype process or another process), which can be performed to facilitate additional network layer-4 testing using endpoint agents.
- scheduled testing techniques as further described below can also be applied to perform these process monitoring techniques using endpoint agents.
- endpoint agents are associated with labels (e.g., configurable and/or dynamic tags, such as to identify agents based on a current network, geographical location, and/or other criteria/state information associated with the endpoint or endpoint agent).
- labels e.g., configurable and/or dynamic tags, such as to identify agents based on a current network, geographical location, and/or other criteria/state information associated with the endpoint or endpoint agent.
- endpoint agents can be dynamically associated/tagged with labels based on a current network, location/geography, operating system (OS), current state information, and/or other runtime/state information associated with an agent/device, which can be used to schedule tests, visualization, live sharing, searching, and/or filtering data collected from the agents, in which labels are often associated with one or more network/endpoint properties.
- OS operating system
- scheduled tests can be directed to endpoint agents with a specified label (e.g., a scheduled HTTP test targeting SalesForce.com from agents associated with the San Francisco office (based on that label/tag), which will then be executed by endpoint agents if a given endpoint is in the San Francisco office at the specified time for the scheduled test, but would not be executed by endpoint agents if the endpoint is not currently connected to the network in the San Francisco office, such as for remote users who are working at home and/or users who are working from other offices of ACME Corporation).
- a specified label e.g., a scheduled HTTP test targeting SalesForce.com from agents associated with the San Francisco office (based on that label/tag)
- alerts are generated using the disclosed techniques for enterprise network monitoring using endpoint agents.
- a wireless gateway latency or packet loss event can be detected using the disclosed techniques as further described below with respect to example use case scenario A.
- alerts can be configured to be generated based on one or more trigger notifications when a set of properties match a predefined criteria.
- trigger notification criteria can also be based on endpoint agent labels (e.g., a configured alert can select to generate an alert if a signal quality drops below 65% based on aggregated agents/endpoints in a San Francisco office for ACME Corporation by selecting criteria for endpoint agents with a label of San Francisco endpoints, and automatic deactivation of alert logic, such as if returns to above 65%).
- event detection is performed using the disclosed techniques for enterprise network monitoring using endpoint agents.
- a wireless gateway latency or packet loss event can be detected using the disclosed techniques as further described below with respect to example use case scenario A.
- reports are generated using the disclosed techniques for enterprise network monitoring using endpoint agents.
- reports can provide aggregated data, such as over a period of time (e.g., 30 days, 90 days, and/or some other configurable period of time).
- reports include summaries of agent performance data that is aggregated, such as network performance over time for capacity planning purposes or other network management purposes, and/or to monitor latency and network performance for access to a cloud service, such as Microsoft Office 365 or another cloud service, in which different report templates can be provided for different IT/network users (e.g., network admin users, IT help desk users, IT system admin users, and/or other types/categories of users).
- IT/network users e.g., network admin users, IT help desk users, IT system admin users, and/or other types/categories of users.
- FIG. 6 is an example network environment that shows example endpoint agent deployments in accordance with some embodiments.
- the endpoint agents can be deployed in endpoints that access various networks as shown by an endpoint agent deployed on an endpoint accessing an enterprise branch network as shown at 602 and as shown by another endpoint agent deployed on another endpoint accessing a home network/public Hotspot network as shown at 604 .
- ACME Corporation uses Salesforce.com and Office365 to manage its customers and internal documents. Some employees have reported long response times and sporadic unavailability issues with the external services. The IT/network administrator(s) are not able to reproduce the problem on their machine(s), but the employees keep complaining about these performance problems. Each of Salesforce.com and Microsoft (for Office365) reports that their respective services/systems are in good health and are not having any performance problems.
- ACME Corporation can deploy endpoint agents on the employees' machines (e.g., if not already deployed) and collect an aggregate view of the user experiences.
- endpoint agents e.g., Salesforce.com and Office365
- the IT/network administrators are able to pinpoint the problem(s).
- the problem(s) can be related to a wireless signal, a local gateway, a high CPU and/or memory usage on the end-user devices/endpoints, a proxy issue, a routing issue to the external service (e.g., Salesforce.com and Office365), a third-party service that Salesforce.com or Office365 is dependent on (e.g., a Content Distribution Network (CDN) provider), a packet loss between the organization network and the SaaS, and/or various other network and/or system related problems as similarly described above.
- CDN Content Distribution Network
- FIG. 7 is a graphical visualization that illustrates a high latency problem from an endpoint to a gateway via a wireless link that is identified using the disclosed techniques in accordance with some embodiments.
- the endpoint agent testing indicates that there is a high latency from an endpoint 702 via a wireless link 704 to a gateway 706 as shown in FIG. 7 .
- the endpoint agent collected data results can be used by IT/network admin(s) for ACME Corporation to identify/troubleshoot the performance problems (e.g., as due at least in part to this packet loss problem) experienced by users for various services, such as Salesforce.com and/or Microsoft Office365.
- FIG. 8 is a graphical visualization that illustrates a packet loss problem from an endpoint to a gateway via a wireless link that is identified using the disclosed techniques in accordance with some embodiments.
- the endpoint agent testing indicates that there is a high packet loss from an endpoint 802 via a wireless link 804 to a gateway 806 as shown in FIG. 8 .
- the endpoint agent collected data results can be used by IT/network admin(s) for ACME Corporation to identify/troubleshoot the performance problems (e.g., as due at least in part to this packet loss problem) experienced by users for various services, such as Salesforce.com and/or Microsoft Office365.
- FIG. 9 is a graphical visualization that illustrates incomplete components on a web page problem that is identified using the disclosed techniques in accordance with some embodiments.
- the endpoint agent testing indicates that there are incomplete components on a web page problem as shown at 902 in FIG. 9 .
- the endpoint agent collected data results can be used by IT/network admin(s) for ACME Corporation to identify/troubleshoot the performance problems (e.g., as due at least in part to this incomplete components on a web page problem) experienced by users for various services, such as Salesforce.com and/or Microsoft Office365.
- ACME Corporation has branch offices in different geographical locations across the United States (e.g., in Miami, Fla. and in the San Francisco Bay Area in California), and is hosting an internal system at the headquarters.
- the branch offices are connected to the headquarters via VPN network connections.
- ACME Corporation can have multiple employees working from home and working remote while on the road/business travel who are also connecting via VPN network connections.
- employees working from home are reporting that the internal system/service is unavailable at times and it is affecting their productivity.
- each home office is unique and uses a variety of ISPs, it is difficult for the IT/network administrator(s) to pinpoint the problem(s).
- ACME Corporation can deploy endpoint agents to the employees' machines (e.g., if not already deployed) for the employees who are working from home and can collect an aggregate view of the user experiences for each of these remote users.
- the IT/network administrator(s) can collect data reporting the system and network performance associated with each of these endpoints and their respective connectivity to the internal system/service.
- this collected performance data from the endpoint agents can include home wireless signal quality, VPN connection to the headquarters, system load for each of the endpoints, Internet Service Provider (ISP) issues (e.g., packet loss, routing, high latency, and/or other network performance issues associated with the ISP's network), and the availability of the internal system/service itself.
- ISP Internet Service Provider
- endpoint agents are configured to perform scheduled tests using various techniques further described below.
- scheduled tests can be configured by an IT/network admin and distributed to deployed agents using an agent controller, such as further described herein.
- endpoint agents can be configured to perform scheduled tests based on user triggered events, and, in this example, agents can perform extra tests and capture data for test results based on the user triggered events.
- endpoint agents can be configured to perform scheduled tests in order to perform periodic network infrastructure tests.
- Example periodic network infrastructure tests can include path network tests, DNS tests, HTTP tests, and/or other network infrastructure tests.
- endpoint agents can be configured to perform scheduled tests based on a label(s) in which agents check-in periodically and/or based on network change at which point the agent controller can determine labels for such agents and which if any tests to be scheduled based on labels.
- scheduled tests for endpoint agents can be configured to execute tests (e.g., scheduled tests) in specific intervals from each end-user's environment directly (e.g., from the desktop/laptops where the endpoint agents have been deployed).
- the set of endpoint agents where those tests are executed is dynamically assigned based on a set of conditions provided by, for example, the customer, in a test configuration as will be further described below.
- the endpoint agents that have both a capacity and a state that match the specified condition(s) in the test configuration will be assigned to execute the scheduled test(s).
- the set of agents that execute the scheduled test(s) can fluctuate over time based on several factors, such as agent availability (e.g., agent online availability) and a reported state of such agents, as will be further described below.
- FIG. 10 illustrates an overview of a scheduled test process for endpoint agents in accordance with some embodiments. As shown, FIG. 10 provides a high-level view of an example process for configuring and executing scheduled tests on endpoint agents.
- an endpoint agent 1002 performs a check-in to a Network Monitoring Service Provider (NMSP) backend 1004 with its current state (e.g., periodically or when the endpoint agent detects a state change(s)) as shown at 1006 .
- NMSP Network Monitoring Service Provider
- the NMSP polls one or more of the endpoint agents to request/obtain a current state or other information associated with the endpoint agents (e.g., push and/or pull notification mechanisms can be implemented for communicating the current availability/state updates between the endpoint agents and the NMSP backend).
- the endpoint agent can be implemented as similarly described above with respect to FIG.
- the endpoint agent can be implemented as an agent executed that does not require a browser extension implementation (e.g., in contrast to a mode of endpoint agent operation where data collection is triggered by a user browsing with a web browser, such as the Google Chrome web browser or the Microsoft Internet Explorer® web browser, the disclosed scheduled endpoint tests do not require such a browser extension for the endpoint agent to be installed).
- the NMSP backend can be implemented as similarly described above with respect to FIG. 1 .
- the check-in of the endpoint agent with its current state check-in communication with the NMSP backend triggers a scheduling process 1008 as shown in this example infrastructure implementation.
- a scheduling process 1008 as shown in this example infrastructure implementation.
- one or more tests are assigned to the endpoint agent as shown at 1010 .
- the endpoint agent performs test executions at 1012 of each of the assigned tests based on the test configuration and then returns the test results to the NMSP backend as shown at 1014 a , 1014 b , and 1014 c (e.g., after the test results are obtained from the execution of each of the assigned tests, they can then be pushed to the NMSP backend, in which test results of one or more tests can be pushed to the NSMP backend).
- a test remains assigned to the endpoint agent until either (i) a new check-in event occurs that triggers another scheduling process to remove the test assignment from the agent or (ii) if the agent fails to check-in after a predetermined period of time (e.g., which can be a configured timeout period).
- a predetermined period of time e.g., which can be a configured timeout period
- their computing environment includes a collection of individual endpoints whose environment and connectivity generally can change over time and may be highly volatile.
- specifying a set of endpoint agents for executing scheduled tests can be technically challenging given that the environment of various individual endpoints and their connectivity can generally change over time as similarly discussed above.
- performing scheduled tests for endpoint agents includes receiving a test configuration that includes a set of conditions for matching one or more endpoint agents, receiving state information for a set of endpoint agents, determining which (if any) of the set of endpoint agents match the set of conditions in the test configuration to select one or more matching endpoint agents, and assigning one or more tests to the matching endpoint agents for execution of the scheduled tests based on the test configuration.
- the set of conditions in the test configuration can include various static properties associated with the endpoint agents (e.g., version of the agent, operating system (OS) installed on the endpoint, OS version installed on the endpoint, applications installed on the endpoint, versions of the applications installed on the endpoint, agent ID, and/or various other static properties associated with the endpoint agents) as well as dynamic properties associated with the endpoint agents (e.g., wireless network connected to the endpoint, public IP being used by the endpoint to access the Internet, geographical location of the endpoint, and/or various other dynamic properties associated with the endpoint agents).
- OS operating system
- the set of conditions is referred to as a label that can be applied for selecting the subset of matching endpoint agents based on the set of conditions.
- the label is the assignment criteria that the customer uses to specify the subset of endpoint agents to be selected for executing the scheduled tests.
- customers can also configure an upper bound on the number of endpoint agents that can be assigned to a particular test (e.g., setting such a limit on the number of endpoint agents that will be selected to execute the scheduled tests can be implemented to avoid having, for example, all of the endpoint agents perform the scheduled tests in a scenario in which all of the endpoint agents match the label/assignment criteria).
- the individuality of agents is effectively superseded by a group of matching agents that are automatically selected based on the label/assignment criteria in the configured test conditions to facilitate an efficient and effective solution for performing scheduled tests using endpoint agents as will now be further described below.
- the assignment of scheduled tests to agents is performed for an endpoint agent using an assignment mechanism to facilitate an efficient and effective solution for performing scheduled tests using endpoint agents as will now be further described.
- the assignment mechanism e.g., implemented by the NMSP backend, such as shown in FIG. 10
- processes endpoint agent state information at a given time e.g., periodically
- the current system's state e.g., the current assignment table, test configurations, etc.
- a given scheduled test is a candidate test that will potentially be assigned to one or more of the set of agents based on the label/assignment criteria.
- the assignment mechanism for scheduled tests for endpoint agents is an event-driven mechanism.
- there are several trigger events e.g., and fewer and/or additional combinations of triggers can be similarly implemented) that lead to changes in the scheduled test assignment set as will now be described.
- the check-in event is triggered after the endpoint agent performs the following operations: (i) communicate to the NMSP backend that the endpoint agent is alive and executing; and (ii) communicate the current state it has detected while executing on the endpoint.
- the NMSP backend generally receives the relevant information from the endpoint agent to determine the assignment conditions that can be processed and applied to trigger the potential assignments of one or more of the scheduled tests to the endpoint agent.
- the check-in events are driven by the endpoint agents and are based on the following criteria: (i) at the endpoint agent's startup; (ii) at a specific time interval (e.g., a configurable period of time/interval, such as every 3 minutes, 30 minutes, 1 hour, or some other time period); and (iii) when the endpoint agent detects that there has been a change in its current state.
- a specific time interval e.g., a configurable period of time/interval, such as every 3 minutes, 30 minutes, 1 hour, or some other time period
- the machine offline event is triggered after a predetermined amount of time has passed since an endpoint agent has last checked in to the NMSP backend (e.g., a configurable time-out period, such as 3 minutes, 30 minutes, 1 hour, or some other period of time).
- the machine offline event is used to detect that a given endpoint agent is offline (e.g., the endpoint agent is unavailable, which can be the result of the endpoint being powered down, the endpoint is not in communication with the Internet, the agent is not executing on the endpoint, etc.) and triggers the de-assignment of scheduled tests for that given endpoint agent.
- test configuration change event is triggered when, for example, a customer changes the configuration for a particular scheduled test.
- the consequence of the test configuration change event is to remove all the agents assigned to the scheduled test that has changed.
- the label definition change event is triggered.
- the consequence of the label definition change event is to remove all assignments from the scheduled tests that are associated with the label that has changed.
- FIG. 11 is a functional block diagram of an architecture of a test scheduler for endpoint agents in accordance with some embodiments.
- the test assignment process includes a test scheduler, such as shown in FIG. 11 as will now be described.
- the test scheduler receives the following elements as input: (i) an endpoint agent's check-in (e.g., current agent state) as shown at 1102 (e.g., an agent periodically performs a check-in that provides information associated with the endpoint agent's state that can be processed and stored as similarly described above and further described below, otherwise, the machine offline event is triggered as also similarly described above); (ii) current test assignment(s) are joined with a machineTasks data store 1104 ; (iii) tests configurations including the label that is used to match for potential tests based on tests configurations are joined with an accountTasks data store 1106 (e.g., including the number of agents to be assigned to each test); and (iv) a system's label information is joined with an accountLabels data store 1108 (e.g., the labels include the various criteria that can be used as a test assignment condition as similarly described above).
- an endpoint agent's check-in e.g., current agent state
- the test scheduler generates as output a new test assignment(s) for the endpoint agent as shown at potential assignments 1110 .
- the test scheduler processing output result can be either new tests assigned to the endpoint agent or tests de-assigned from the endpoint agent, or in some cases, no new tests are assigned to the endpoint agent and no tests are de-assigned from the endpoint agent. In this example, any new test assignment(s) will conform to the restrictions that are expected from the test assignment set.
- test's assignment condition is true for the agent's current state.
- the test scheduler uses the stream of check-in events generated by each of the endpoint agents (e.g., as shown at 1102 ), performs the matching between the label assigned to the test and the current agent state retrieved from the endpoint agents' check-in state information, and creates a list of potential test assignments (e.g., as shown at 1114 ). After this phase the scheduler checks if test execution slots are still available for the given test (e.g., as shown at 1112 and 116 ), and if so, the final assignment of a matching scheduled test to a given endpoint agent is performed as shown at 1120 .
- the NMSP backend e.g., the control plane of the NMSP backend
- the NMSP backend will use the assigned tasks data store (e.g., machineTasks data store 1118 ) created by the test scheduler to generate the list of tests that should be executed by the endpoint.
- the assigned tasks data store e.g., machineTasks data store 1118
- the execution of the assigned scheduled tests is performed in each of the endpoint agents that were assigned to execute a given scheduled test (e.g., and such test executions are isolated across the endpoint agents (either of different or a same customer account)).
- the endpoint agent internally schedules the tests to be executed at the intervals specified in their metadata. As these deadlines happen, the scheduled tests are executed in the way specified in their configuration.
- each execution can generate a single data-point that has information to facilitate the following: (i) identify the test it belongs to; (ii) determine what exact version of the test configuration was used to execute the test; and (iii) determine which time slot or round the data point belongs to.
- a data-point is generated, it is then uploaded to the NMSP backend (e.g., an endpoint agent Ingress subsystem, such as further described below) for ingestion leading to the data point being displayed in different ways from the disclosed NMSP platform (e.g., as shown in FIG. 1 ).
- the NMSP backend e.g., an endpoint agent Ingress subsystem, such as further described below
- the ingress subsystem is responsible for processing and storing data-points produced by the endpoint agents.
- This subsystem implements a decoupled event-driven architecture that uses a messaging streaming platform to connect each subcomponent to perform the following operations: (i) enrich each data-point with additional information about the IPs collected by querying external services like WHOIS and DNS records; (ii) determine the endpoint agent location using the list of wireless access points; (iii) store the processed data-point in a long term storage component/element; and (iiii) index the processed data-point for fast querying on a secondary storage.
- test configuration in the case of an endpoint agent resides completely in memory (e.g., there is no permanent storage of this type of data on the endpoint).
- avoiding permanent storage of the test configuration data on the endpoint facilitates the following: (i) test configurations may contain sensitive information and, as this type of agent deployment does not guarantee the customer full control of where they are deployed, this test configuration information could be leaked more easily if it were to be stored on the endpoint; and (ii) as the tests to run from an endpoint agent are generally related to its current state, permanent storage of the test configuration data could lead to consistency issues between the tests that should be executed with the stored tests.
- the configuration retrieval is implemented using an event-driven mechanism. As such, new scheduled test assignments are triggered after the agent has checked-in with its current state (e.g., in the above-described implementation, the endpoint agent retrieves the test configuration assigned to it after some time has passed since its last check-in event).
- the endpoint agent is configured to wait a predetermined amount of time before retrying.
- the endpoint agent discards the current test configuration assigned to it in the following scenarios: (i) the agent's conditions change, thus making the current test configuration potentially invalid; and (ii) a predetermined period of time (e.g., one hour or another configurable period of time) has passed since the last check-in event.
- an endpoint agent when an endpoint agent receives the tests (e.g., including metadata for the tests) that it has been assigned to execute, the endpoint agent distributes the assigned tests to different sets, each set corresponding to a different execution interval (e.g., 60-second, 120-second, etc.). Each of the sets is scheduled to execute at their respective interval.
- an evaluation is performed to determine whether the endpoint agent is able to execute that set of tests (e.g., if the endpoint agent is still executing and in communication with the Internet, etc.). This evaluation also includes calculating an estimate of the time to execute that set of tests.
- the endpoint agent determines that the estimate of the time to execute that set of tests is longer than the interval time (e.g., executing that set of tests, if start execution start execution at X ⁇ tolerance, will take longer than the frequency that they should be executed, such as a 60-second interval or another configured interval, such as a set of tests that would not be able to finish within that round if that set of tests generally requires about 30 seconds to execute but does not start execution within 30 seconds in that given round), then the execution of that set of tests for that round will be skipped.
- the interval time e.g., executing that set of tests, if start execution start execution at X ⁇ tolerance, will take longer than the frequency that they should be executed, such as a 60-second interval or another configured interval, such as a set of tests that would not be able to finish within that round if that set of tests generally requires about 30 seconds to execute but does not start execution within 30 seconds in that given round
- Managing the scheduled tests to perform at the configured interval can present technical challenges as well given the computing and network availability resources on a given endpoint machine.
- Each execution at a configured interval is associated with a round. For example, this can be problematic, because the endpoint agent attempts to associate the execution to a round, which is the previous interval delimitation mark. (e.g., a 60-second test executed at 12:11:30 is associated with the 12:11:00 round). If a test was scheduled to execute at the beginning of the round, it can actually start at the end of the previous round generating incorrect data.
- the endpoint agent includes controls to detect such cases and re-schedule the execution at a later time when the round has actually started.
- test results are considered successful if they finish executing within the round they are associated with. Otherwise, the test results are discarded. As such, this means that a 60-second interval test should start and finish in each bounded period (e.g., 00:00:00-00:01:00).
- the NMSP backend will send his current UNIX timestamp, if a configurable time difference is recorded, the endpoint agent will apply the difference between the UNIX timestamp sent by the NMSP backend and the current time reported by endpoint agent's operating system (e.g., the OS executing on that endpoint device). After all of the tests for an interval are executed and validated, the test results (e.g., data points that are generated) are forwarded to the uploading mechanism for eventual upload to the NMSP backend as will now be further described.
- the upload mechanism (e.g., upload subsystem of the endpoint agent) includes a buffer with a permanent storage backed up subsystem implemented by the endpoint agent.
- the upload subsystem stores the test results to permanent storage on the endpoint (e.g., disk or other permanent storage on the endpoint machine). Storing the test results to permanent storage on the endpoint generally ensures that independent of the network and server-side conditions at the time, the test results (e.g., data points) will eventually be uploaded (e.g., or in some cases, discarded due to being too old as further described below).
- test results e.g., data points
- the upload subsystem of the endpoint agent will attempt to upload the test results to the NMSP backend through a particular endpoint whose purpose is to receive scheduled test results.
- the available test results e.g., data points
- the test results are uploaded in batches of a configurable size(s).
- the test results are uploaded in the chronological order that they were generated (i.e., older data points are uploaded first).
- test results e.g., data points
- the upload subsystem of the endpoint agent e.g., and its permanent storage.
- the first way is due to a successful upload. For example, after a data point is deemed to have been successfully uploaded, it is removed from the upload subsystem.
- the second way is that the data point was not successfully uploaded after a certain period of time. For example, data points that could not be uploaded after 24 hours (e.g., or another configurable period of time) from being generated are deemed too old and discarded by the upload subsystem.
- the pending uploads will be loaded from permanent storage when the system is restarted, and the upload subsystem will then attempt to complete such pending uploads unless they are deemed too old in which case such will be discarded by the upload subsystem.
- the endpoint agents can perform various types of tests using the disclosed techniques for scheduled tests for endpoint agents.
- the endpoint agents can perform various network tests (e.g., the network test can include several components that provide information regarding the network topology, its state, and health regarding the given target) as described herein.
- the endpoint agents can perform various HTTP tests (e.g., the HTTP tests can send a request to an HTTP server whose characteristics are configured by the client on a per-test basis) as described herein.
- a network test can be issued at the same time to gather data points from the connectivity domain.
- endpoint tests are tests that execute on endpoint agents at regularly scheduled intervals.
- users e.g., NMSP customers, such as network administrators and/or Information Technology (IT) administrators of such customers
- HTTP server tests and network tests e.g., agent to server tests
- endpoint agents are not typically online at all times; as such, to address this technical challenge and to maximize the amount of test data to be collected and evaluated, test assignment to specific endpoint agents is a dynamic assignment process as disclosed herein with respect to various embodiments).
- creating a scheduled endpoint agent test includes the following operations. First, select which endpoint agents, and how many endpoint agents should perform the test. Second, create a label that includes the desired endpoint agents. Third, assign the label to your test and specify the maximum number of endpoint agents that may perform the test concurrently. Fourth, select the test type, target, and interval. Fifth, review advanced settings prior to completion. Each of these operations will be further described below.
- FIG. 12 is a screen diagram for adding a new label for dynamic assignment of scheduled tests to endpoint agents in accordance with some embodiments.
- a scheduled endpoint agent test is assigned to endpoint agents using an endpoint label whose filter criteria match the endpoint agents.
- test assignment is dynamically performed.
- endpoint agents e.g., machines, such as workstations or other types of network capable computing devices
- the criteria of each endpoint agent label is compared to the agent's information, such as network and geographic location. If the agent matches a label, any test configured with that label is assigned to the agent, up to a configurable maximum number of tests.
- FIG. 13 is a screen diagram of a new endpoint agent label creation dialog for configuring labels for dynamic assignment of scheduled tests to endpoint agents in accordance with some embodiments.
- a user can enter the Label Name (1) as shown at 1302 , select the Label Color (2) as shown at 1304 , and use the Filter (3) setting as shown at 1306 to select the criteria that will determine which endpoint agents execute a test with this label.
- the endpoint agent matches the label if the endpoint agent matches all criteria (logical AND), and if so, the endpoint agent will be assigned this label.
- FIG. 14 is a screen diagram of dialog for creating a new test for dynamic assignment to endpoint agents in accordance with some embodiments.
- a user can select the Add New Test button as shown at 1402 to start the process for creating a new test for dynamic assignment of scheduled tests to endpoint agents as further described below.
- a user can create two types of tests: (1) an agent to server test (e.g., a network layer test), and (2) an HTTP server test (e.g., a web layer test).
- an agent to server test e.g., a network layer test
- HTTP server test e.g., a web layer test
- FIG. 15 is a screen diagram of dialog for creating an agent to server (network layer) test for dynamic assignment to endpoint agents in accordance with some embodiments.
- a user can select to create a Network Layer test (1) as shown at 1502 and, specifically, an Agent to Server test type (2) as shown at 1504 .
- a user can configure a Test Name (3).
- the Test Name is an optional parameter that gives the test a name. When no name is provided, then the value from the Target field will be used as a test name.
- a user can configure a Target (4).
- the target can be configured with a Domain name or an IP address.
- a user can configure a Protocol (5).
- the protocol can be configured with the Internet Control Message Protocol (ICMP).
- a user can configure an Interval (6) for performing the scheduled test (e.g., this value configures how frequently this test will be executed by the assigned endpoint agents).
- a user can configure an Agent Label (7).
- endpoint tests are dynamically assigned to endpoint agents through labels.
- a user can configure a Max No. of Agents (8), which specifies the maximum of endpoint agents within the Agent Label to run the test from.
- a helper graph (9) as shown at 1518 indicates how many agents matching the label were available throughout the last 24 hours.
- FIG. 16 is a screen diagram of dialog for creating an HTTP server (web layer) test for dynamic assignment to endpoint agents in accordance with some embodiments.
- a user can select to create a Web Layer test (1) as shown at 1602 and, specifically, an HTTP Server test type (2) as shown at 1604 .
- a user can configure a Test Name (3).
- the Test Name is an optional parameter that gives the test a name. When no name is provided, then the value in the URL field will be used as a test name, prepended with a protocol (“http://” by default).
- a user can configure a URL (4), such as a URL, domain name, or IP address, including the TCP port. If a domain name or IP address is used (i.e., protocol specification is not provided), then “http://” protocol is assumed.
- a user can configure an Interval (5) for performing the scheduled test (e.g., this value configures how frequently this test will be executed by the assigned endpoint agents).
- a user can configure an Agent Label (6).
- endpoint tests are dynamically assigned to endpoint agents through labels.
- a user can configure Alerts (7) to select Alert Rules to assign to the test.
- a user can configure a Proxy (8) to select a Proxy configuration to assign to the test. The default of “System Proxy” uses the system's settings.
- a user can configure a Max No.
- Agents which specifies the maximum of endpoint agents within the Agent Label to run the test from.
- a helper graph (10) as shown at 1620 indicates how many agents matching the label were available throughout the last 24 hours.
- An HTTP Server Timing section includes a timeout for configuring the time period (e.g., number of seconds) until the test terminates due to an unresponsive target server, and a target time for view for configuring/setting the color legend on the global map, and the corresponding font colors for the Agent results table. For example, Response Time for an HTTP Server test sets the range of the legend from 0 seconds (e.g., green end) to two times the Target Time for View (e.g., red end).
- a Network section is provided that includes a data collection configuration for checking a box to collect network metrics and to perform path visualization.
- An HTTP Authentication section includes fields for configuring a username (e.g., the username for the account being accessed by the HTTP request(s)), a password (e.g., the password for the account being accessed by the HTTP request(s)), and a scheme (e.g., HTTP Basic Authentication or New Technology LAN Manager (NTLM)).
- a username e.g., the username for the account being accessed by the HTTP request(s)
- a password e.g., the password for the account being accessed by the HTTP request(s)
- NTLM New Technology LAN Manager
- An HTTP Request section is provided for configuring a Request Method to select the HTTP request method (e.g., either GET or POST, and if POST is selected, then the user may specify data in the POST Body field), an SSL Version for selecting the version of the SSL/TLS protocol to offer in the SSL/TLS Client Hello (e.g., this setting will set the maximum version of SSL/TLS that the connection can use, but a lower version may be negotiated by the server), a Verify SSL certificate (e.g., by default, certificate-related errors will result in a test error, and users can uncheck this box to ignore certificate errors during SSL/TLS negotiation), a Customer Headers for entering one or more HTTP header strings (e.g., in the form “ ⁇ stringname>: ⁇ value>” (without quotes)), and an Override DNS that instead of using standard DNS resolution, allows a user to specify the IP address to which the target's domain name will resolve (e.g., this setting can be useful for targeting a specific server within a cluster, or when
- An HTTP Response section is also provided that allows a user to configure a Desired Status Code (e.g., for setting the HTTP status code returned by the server that is defined as a successful test (i.e., no errors will be displayed in the test table results, no response code-based alerts generated etc.)), a Verify Content (e.g., for searching the HTTP headers and body for text that matches the expression in the Verify Content field), and a Limit Download Size (e.g., for loading only the first number of kilobytes (kB) specified in the field below the Enable box).
- Desired Status Code e.g., for setting the HTTP status code returned by the server that is defined as a successful test (i.e., no errors will be displayed in the test table results, no response code-based alerts generated etc.)
- a Verify Content e.g., for searching the HTTP headers and body for text that matches the expression in the Verify Content field
- a Limit Download Size e.g., for loading only the first number
- endpoint agents can execute various types of scheduled tests at regular intervals.
- the types of scheduled tests include a network layer's agent to server test type and a web layer's HTTP Server test type as described above. In this section, views of the scheduled tests will now be described.
- FIG. 17 illustrates a screen diagram of endpoint agent views for scheduled tests in accordance with some embodiments.
- This example screen diagram is an endpoint agent view of results for a network test as shown at 1702 .
- FIG. 18 illustrates a screen diagram of an endpoint scheduled test results view with an HTTP server test selected in accordance with some embodiments.
- the endpoint agent scheduled test results view (e.g., in this example view, an HTTP Server test results view) includes various components that will now be described.
- a test selector component (1) is provided for selecting the test to display in the view.
- a layer selector component (2) is provided for selecting the layer to display.
- the HTTP Server tests have a Network layer available when a Perform network measurements setting is enabled in the test's Advanced Settings tab.
- a data filters component (3) is provided for filtering the displayed data (e.g., the data displayed in the time slide (5, 6) as shown at 1810 and 1812 and data view (10) as shown at 1820 is affected by this filtering component).
- a metric selector component (4) is provided for selecting the metric to be displayed on the time slide (5) as shown at 1810 .
- a colored line (5) on the timeline provides a time series visualization of the selected metric.
- a grey area (6) on the timeline provides a time series of the number of endpoint agents that provide test results data.
- a time interval selector component (7) provides the data from the selected time interval, which is displayed in the data view (10) as shown at 1820 .
- a time range selector component (8) provides a colored section that defines the displayed data (5, 6) as shown at 1810 and 1812 and the data view (10) as shown at 1820 (e.g., in this example, the remaining data is shown in grey).
- a selected time component (9) is provided for a user to choose a selected time interval for the test results data to be displayed in this test results view.
- a data view pane for the selected time interval component (10) is provided for displaying data submitted by the endpoint agents that match the configured filters (3) as shown at 1806 in the selected time interval (7, 9) as shown at 1814 and 1818 .
- the HTTP Server test view collects the following metrics: availability (e.g., a percentage of time that the site is available, aggregated across all displayed agents), response time (e.g., also referred to as time-to-first-byte, this is the time elapsed from the beginning of the request (before DNS request) until the client receives the first byte of the response from the server), and throughput (e.g., this metric is calculated by dividing the total wire size by the received time and expressed in MB/s).
- availability e.g., a percentage of time that the site is available, aggregated across all displayed agents
- response time e.g., also referred to as time-to-first-byte, this is the time elapsed from the beginning of the request (before DNS request) until the client receives the first byte of the response from the server
- throughput e.g., this metric is calculated by dividing the total wire size by the received time and expressed in MB/s.
- a map view 1822 shows the geolocation of the agents in a map and a breakdown of the connection status by different phases.
- An informational message 1824 below the status bars shows the number of agents that collected data out of the total checked-in agents for the selected test time interval.
- a table view provides a breakdown of the selected metrics collected per agent for the selected time interval.
- FIG. 19 illustrates a screen diagram of an endpoint scheduled test results view with a network test selected in accordance with some embodiments.
- a network test results view timeline is provided for a selected Network (1) tests view as shown at 1902 .
- a user can select a metric (2) as shown at 1904 to view various collected metrics (e.g., loss, latency, and jitter) as described below.
- the network (Agent to Server) test on an endpoint agent measures the following metrics: end-to-end packet loss (e.g., the percentage of packets lost is calculated by subtracting the number of reply packets the agent receives from the target (responses) from the number of packets sent by the agent, then dividing by the number of packets sent, then multiplying by 100), latency (e.g., the average of the round-trip packet time, in which the round-trip packet time is the time from which a packet is sent by the agent to the time the agent receives a reply), and jitter (e.g., the standard deviation of latency, in which the standard deviation indicates how widely spread the measurements are around the average, such that a larger standard deviation indicates a wider spread of the measurements).
- end-to-end packet loss e.g., the percentage of packets lost is calculated by subtracting the number of reply packets the agent receives from the target (responses) from the number of packets sent by the agent, then dividing by the number of packets
- FIG. 20 illustrates a screen diagram of a map view for network tests in accordance with some embodiments.
- a map tab (1) as shown at 2002 of the network test view is provided that includes details for 9 of 37 agents as shown at 2004 (e.g., this shows the number of agents that collected data out of the total checked-in agents for the selected test time interval).
- the selected metric in this example, loss (3) is shown at 2006 .
- a map view (5) as shown at 2010 shows the geographical location and status of the reporting agents for the selected metric, in this case, loss metric.
- the available metrics can be selected for display in the Metrics drop-down menu. Additionally, metrics are also represented and clickable on the left side of the Map tab content.
- FIG. 21 illustrates a screen diagram of a network path visualization view for network tests in accordance with some embodiments. As shown in FIG. 21 , a path visualization tab 2102 is selected to provide a network path visualization for network tests.
- the bottom pane on the Network view includes three tabs.
- a Path Visualization tab shows a network layer-3 (L3) hop-by-hop topology view from the source endpoint agent to the test target, such as shown in FIG. 21 .
- a Map view shows the geolocation of the agents in a map view and the collected metrics, such as shown in FIG. 20 .
- a Table view provides a breakdown of the metrics collected per agent for the selected time interval.
- FIG. 22 illustrates a screen diagram of data filtering in the network path visualization view for network tests in accordance with some embodiments.
- endpoint agent views provide extensive data filtering capabilities that enable users to drill down the data and present it in the most useful manner.
- the filtering controls are indicated.
- Example filtering controls will now be described as shown in FIG. 22 .
- configured filters (1) shows currently configured filters. Clicking the X icon removes the corresponding filter.
- a new filter dialogue (2) as shown at 2204 applies a new filter to the data shown.
- One or more filters can be configured. Filters are combined using the logical operator “AND.”
- Available filters (3) as shown at 2206 includes a list of available filters.
- Path Visualization-specific configured filters (4) as shown at 2208 shows currently configured filters ((3) as shown at 2206 path visualization only). Clicking the X icon removes the corresponding filter.
- Path Visualization-specific new filter dialogue (5) as shown at 2210 applies a new filter to the data shown ((3) as shown at 2206 path visualization only).
- One or more filters can be configured.
- Filters are combined using the logical operator “AND.” Apply to the entire view (6) as shown at 2212 is a component that a user can utilize such that if a filter set configured specifically for the path visualization seems useful, clicking this link will apply the same filter to the entire view (e.g., the filters will be copied into the configured filters section at the top of the view).
- FIG. 23 illustrates a flow diagram for monitoring enterprise networks with endpoint agents in accordance with some embodiments.
- process 2300 is performed using platform 100 as shown in FIG. 23 .
- deploying a plurality of endpoint agents to a plurality of endpoint devices is performed.
- a plurality of endpoint agents can be distributed to a plurality of endpoint devices using the platform described above.
- an endpoint agent can be implemented using the endpoint architecture described above to perform the disclosed techniques for monitoring enterprise networks using endpoint agents.
- each of the plurality of endpoint agents performs network monitoring tests and system monitoring tests.
- the endpoint agents can perform network monitoring tests and system monitoring tests (e.g., including process monitoring) as similarly described above.
- each of the plurality of endpoint agents is controlled by an agent controller.
- the agent controller can facilitate deployment, configuration, and data collection operations with each of the plurality of endpoint agents.
- the tests that can be performed by the endpoint agents on the endpoint devices are configurable.
- the tests can be configured to be performed based on a schedule, periodically, on demand, and/or based on a trigger as similarly described above.
- the test can be configured to be performed based on labels associated with the endpoint agents as similarly described above.
- test results from each of the plurality of endpoint agents is performed, wherein the test results are based on tests executed on each of the plurality of endpoint devices for monitoring network activity.
- test results from each of the plurality of endpoint agents can be collected using the platform described above.
- endpoint agents can provide user experience monitoring to facilitate diagnosis and troubleshooting of network performance and/or endpoint device system performance problems.
- generating a graphic visualization based on the test results is performed.
- a graphical visualization of an application delivery state for one or more application delivery layers based on the test results can be generated and output using the disclosed platform (e.g., generated by a web tier of the platform described above).
- the graphical visualization of the application delivery state facilitates troubleshooting of network performance problems associated with one or more of the plurality of endpoint devices.
- Example graphical visualizations that can be generated include the GUI visualizations similarly described above (e.g., including node grouping, node pagination, and network infrastructure visualizations as similarly described above).
- FIG. 24 illustrates another flow diagram for monitoring enterprise networks with endpoint agents in accordance with some embodiments.
- process 2400 is performed using platform 100 as shown in FIG. 24 .
- deploying a plurality of endpoint agents to a plurality of endpoint devices is performed.
- a plurality of endpoint agents can be distributed to a plurality of endpoint devices using the platform described above.
- an endpoint agent can be implemented using the endpoint architecture described above to perform the disclosed techniques for monitoring enterprise networks using endpoint agents.
- test results from each of the plurality of endpoint agents is performed, wherein the test results are based on tests executed on each of the plurality of endpoint devices for monitoring network activity.
- test results from each of the plurality of endpoint agents can be collected using the platform described above.
- endpoint agents can provide user experience monitoring to facilitate diagnosis and troubleshooting of network performance and/or endpoint device system performance problems.
- an alert based on the test results can be generated and output (e.g., a GUI alert, an email/text/phone call alert, and/or other alert notification can be provided based on a configuration for alert notifications and/or based on the alert).
- a report can be generated that includes aggregated test data results, such as over a period of time (e.g., 30 days, 90 days, and/or some other configurable period of time).
- the alert or report can include an event that is determined based on the test results (e.g., events can be based on results from one endpoint agent and/or based on results from two or more endpoint agents (collective intelligence based on endpoint agent data collection, which can also include test results from other agents executed on network infrastructure elements/devices, destination sites, and/or cloud agents)).
- Example events that can be detected using the disclosed techniques can include detection of traffic outages, network infrastructure outages, application outages, and Internet Intelligence.
- FIG. 25 illustrates another flow diagram for monitoring enterprise networks with endpoint agents in accordance with some embodiments.
- process 2500 is performed using platform 100 as shown in FIG. 25 .
- deploying a plurality of endpoint agents to a plurality of endpoint devices is performed.
- a plurality of endpoint agents can be distributed to a plurality of endpoint devices using the platform described above.
- an endpoint agent can be implemented using the endpoint architecture described above to perform the disclosed techniques for monitoring enterprise networks using endpoint agents.
- test results from each of the plurality of endpoint agents is performed, wherein the test results are based on tests executed on each of the plurality of endpoint devices for monitoring network activity.
- test results from each of the plurality of endpoint agents can be collected using the platform described above.
- endpoint agents can provide user experience monitoring to facilitate diagnosis and troubleshooting of network performance and/or endpoint device system performance problems.
- routing the collected test results to authorized subscribers is performed.
- the routing of collected test results to authorized subscribers can be performed as similarly described above (e.g., as similarly described above in the section entitled, Data Routing Workflow for Data Collected from Endpoint Agents).
- routing the collected test results to another entity for live sharing is performed.
- the routing of collected test results to another entity for live sharing can be performed as similarly described above (e.g., as similarly described above in the section entitled, Data Routing Workflow for Live Sharing for Data Collected from Endpoint Agents).
- live sharing techniques for sharing the collected data can facilitate troubleshooting information to be shared by ACME Corporation with their Software as a Service (SaaS) provider (e.g., Microsoft for Office365 or another service/provider).
- SaaS Software as a Service
- FIG. 26 illustrates a flow diagram for monitoring enterprise networks with scheduled tests for endpoint agents in accordance with some embodiments.
- process 2600 is performed using platform 100 as shown in FIG. 26 .
- a test configuration for scheduled tests that includes a set of conditions for dynamically selecting endpoint agents that match the set of conditions in the test configuration is received. For example, a plurality of endpoint agents are deployed to a plurality of endpoint devices, and the endpoint agents can be selected for execution of one or more scheduled tests based on the set of conditions as similarly described above.
- identifying one or more of the plurality of endpoint agents that match the set of conditions in the test configuration is performed.
- the endpoint agents can be selected based on the labels as similarly described above.
- assigning the scheduled tests associated with the test configuration to the matching endpoint agents for execution of the scheduled tests based on the test configuration is performed.
- the test results are based on the scheduled tests executed on each of the matching endpoint agents for monitoring network activity as similarly described above.
- uploaded results of the scheduled tests executed on the matching endpoint agents are received for processing.
- the uploaded results of the scheduled tests executed on the matching endpoint agents are processed for generating graphical visualizations and/or alerts of the monitored network activity as similarly described above.
- FIG. 27 illustrates another flow diagram for monitoring enterprise networks with scheduled tests for endpoint agents in accordance with some embodiments.
- process 2700 is performed using platform 100 as shown in FIG. 27 .
- deploying a plurality of endpoint agents to a plurality of endpoint devices is performed.
- a plurality of endpoint agents can be distributed to a plurality of endpoint devices using the platform described above.
- an endpoint agent can be implemented using the endpoint architecture described above to perform the disclosed techniques for monitoring enterprise networks using endpoint agents.
- a label for scheduled tests that includes a set of conditions for dynamically selecting endpoint agents that match the set of conditions in the test configuration is received.
- a plurality of endpoint agents are deployed to a plurality of endpoint devices, and the endpoint agents can be selected for execution of one or more scheduled tests based on the set of conditions as similarly described above.
- the test configuration can also include a test type (e.g., a network layer test, a web layer test, etc.), a target (e.g., a server, website, etc.), and an interval (e.g., every 1 minute, 5 minutes, or some other time interval) for executing the scheduled tests as similarly described above.
- a configuration input for setting a maximum number of endpoint agents that are to be selected for concurrently performing the scheduled tests is received.
- check-ins from each of the plurality of endpoint agents are periodically received.
- the agents can check in to provide current state information as similarly described above.
- a subset of the plurality of endpoint agents that match the label based on their current state information is dynamically selected.
- the subset of the plurality of endpoint agents does not exceed the maximum number of endpoint agents that are to be selected for performing the scheduled tests.
- the selected endpoint agents will then receive the scheduled tests and execute the scheduled tests based on a configured interval as similarly described above.
- an alert based on the test results can be generated and output (e.g., a GUI alert, an email/text/phone call alert, and/or other alert notification can be provided based on a configuration for alert notifications and/or based on the alert).
- a report can be generated that includes aggregated test data results, such as over a period of time (e.g., 30 days, 90 days, and/or some other configurable period of time).
- the alert or report can include an event that is determined based on the test results (e.g., events can be based on results from one endpoint agent and/or based on results from two or more endpoint agents (collective intelligence based on endpoint agent data collection, which can also include test results from other agents executed on network infrastructure elements/devices, destination sites, and/or cloud agents)).
- Example events that can be detected using the disclosed techniques can include detection of traffic outages, network infrastructure outages, application outages, and Internet Intelligence.
Landscapes
- Engineering & Computer Science (AREA)
- Theoretical Computer Science (AREA)
- Computer Networks & Wireless Communication (AREA)
- Signal Processing (AREA)
- Computer Hardware Design (AREA)
- Quality & Reliability (AREA)
- Physics & Mathematics (AREA)
- General Engineering & Computer Science (AREA)
- General Physics & Mathematics (AREA)
- Environmental & Geological Engineering (AREA)
- Data Exchanges In Wide-Area Networks (AREA)
- Debugging And Monitoring (AREA)
Abstract
Description
networkId=hash(publicIpRange+localPrefix)
networkId=hash(24.51.61.0/24+10.0.0.0/24)
Claims (20)
Priority Applications (2)
| Application Number | Priority Date | Filing Date | Title |
|---|---|---|---|
| US16/848,723 US11042474B2 (en) | 2016-06-15 | 2020-04-14 | Scheduled tests for endpoint agents |
| US17/355,097 US11755467B2 (en) | 2016-06-15 | 2021-06-22 | Scheduled tests for endpoint agents |
Applications Claiming Priority (4)
| Application Number | Priority Date | Filing Date | Title |
|---|---|---|---|
| US201662350632P | 2016-06-15 | 2016-06-15 | |
| US15/622,535 US10659325B2 (en) | 2016-06-15 | 2017-06-14 | Monitoring enterprise networks with endpoint agents |
| US16/528,247 US10671520B1 (en) | 2016-06-15 | 2019-07-31 | Scheduled tests for endpoint agents |
| US16/848,723 US11042474B2 (en) | 2016-06-15 | 2020-04-14 | Scheduled tests for endpoint agents |
Related Parent Applications (1)
| Application Number | Title | Priority Date | Filing Date |
|---|---|---|---|
| US16/528,247 Continuation US10671520B1 (en) | 2016-06-15 | 2019-07-31 | Scheduled tests for endpoint agents |
Related Child Applications (1)
| Application Number | Title | Priority Date | Filing Date |
|---|---|---|---|
| US17/355,097 Continuation US11755467B2 (en) | 2016-06-15 | 2021-06-22 | Scheduled tests for endpoint agents |
Publications (2)
| Publication Number | Publication Date |
|---|---|
| US20200242019A1 US20200242019A1 (en) | 2020-07-30 |
| US11042474B2 true US11042474B2 (en) | 2021-06-22 |
Family
ID=70856129
Family Applications (3)
| Application Number | Title | Priority Date | Filing Date |
|---|---|---|---|
| US16/528,247 Active US10671520B1 (en) | 2016-06-15 | 2019-07-31 | Scheduled tests for endpoint agents |
| US16/848,723 Expired - Fee Related US11042474B2 (en) | 2016-06-15 | 2020-04-14 | Scheduled tests for endpoint agents |
| US17/355,097 Active US11755467B2 (en) | 2016-06-15 | 2021-06-22 | Scheduled tests for endpoint agents |
Family Applications Before (1)
| Application Number | Title | Priority Date | Filing Date |
|---|---|---|---|
| US16/528,247 Active US10671520B1 (en) | 2016-06-15 | 2019-07-31 | Scheduled tests for endpoint agents |
Family Applications After (1)
| Application Number | Title | Priority Date | Filing Date |
|---|---|---|---|
| US17/355,097 Active US11755467B2 (en) | 2016-06-15 | 2021-06-22 | Scheduled tests for endpoint agents |
Country Status (1)
| Country | Link |
|---|---|
| US (3) | US10671520B1 (en) |
Cited By (1)
| Publication number | Priority date | Publication date | Assignee | Title |
|---|---|---|---|---|
| US20220158912A1 (en) * | 2020-11-16 | 2022-05-19 | Juniper Networks, Inc. | Active assurance of network slices |
Families Citing this family (32)
| Publication number | Priority date | Publication date | Assignee | Title |
|---|---|---|---|---|
| US9825834B2 (en) * | 2015-03-30 | 2017-11-21 | Airwatch Llc | Network speed detection |
| US10896286B2 (en) | 2016-03-18 | 2021-01-19 | Audioeye, Inc. | Modular systems and methods for selectively enabling cloud-based assistive technologies |
| US10444934B2 (en) | 2016-03-18 | 2019-10-15 | Audioeye, Inc. | Modular systems and methods for selectively enabling cloud-based assistive technologies |
| US10671520B1 (en) * | 2016-06-15 | 2020-06-02 | Thousandeyes, Inc. | Scheduled tests for endpoint agents |
| US10728113B2 (en) * | 2016-10-26 | 2020-07-28 | Zscaler, Inc. | Systems and methods for troubleshooting and performance analysis of cloud based services |
| DE102018130289A1 (en) * | 2018-11-29 | 2020-06-04 | Dspace Digital Signal Processing And Control Engineering Gmbh | Process for displaying messages from a messaging system |
| US11489730B2 (en) * | 2018-12-18 | 2022-11-01 | Storage Engine, Inc. | Methods, apparatuses and systems for configuring a network environment for a server |
| US10877867B1 (en) | 2019-12-17 | 2020-12-29 | CloudFit Software, LLC | Monitoring user experience for cloud-based services |
| US11012326B1 (en) | 2019-12-17 | 2021-05-18 | CloudFit Software, LLC | Monitoring user experience using data blocks for secure data access |
| US11263120B2 (en) * | 2020-02-12 | 2022-03-01 | Capital One Services, Llc | Feature-based deployment pipelines |
| US11356332B1 (en) * | 2020-05-04 | 2022-06-07 | Cybercube Analytics Inc. | Method and system for monitoring a network resource |
| US11616708B1 (en) * | 2020-06-01 | 2023-03-28 | Amazon Technologies, Inc. | Estimating end-to-end network traffic demand and loss |
| US11075803B1 (en) * | 2020-06-02 | 2021-07-27 | Cisco Technology, Inc. | Staging configuration changes with deployment freeze options |
| CN112099807B (en) * | 2020-07-28 | 2024-01-26 | 福建天泉教育科技有限公司 | Method for checking whether proprietary deployment is complete and storage medium |
| WO2022086872A1 (en) * | 2020-10-19 | 2022-04-28 | Audioeye, Inc. | Distributed systems and methods for facilitating website remediation and promoting assistive technologies and detecting compliance issues |
| CN112433908B (en) * | 2020-10-29 | 2022-07-12 | 苏州浪潮智能科技有限公司 | Method, system, device and medium for determining interval time of detection server |
| US11561885B2 (en) * | 2021-02-09 | 2023-01-24 | Bank Of America Corporation | Automated end-to-end testing platform with dynamic container configuration |
| US11621893B2 (en) * | 2021-02-09 | 2023-04-04 | Keysight Technologies, Inc. | Methods, systems, and computer readable media for establishing dynamic agent associations in a cloud computing environment |
| US11650892B1 (en) * | 2021-04-08 | 2023-05-16 | Spirent Communications, Inc. | Resilient coordination, command, and control of widely distributed test agents |
| WO2023009408A1 (en) * | 2021-07-30 | 2023-02-02 | Cisco Technology, Inc. | Enriched application outage insights |
| WO2023009851A1 (en) * | 2021-07-30 | 2023-02-02 | Cisco Technology, Inc. | Multi-service views for network monitoring visualization |
| US11716275B1 (en) * | 2021-08-05 | 2023-08-01 | U.S. Bank National Association | Assistant for automatic generation of server load test scripts |
| US12210443B2 (en) * | 2021-09-03 | 2025-01-28 | Charter Communications Operating, Llc | Multi-client orchestrated automated testing platform |
| US11734153B2 (en) * | 2021-09-20 | 2023-08-22 | Salesforce, Inc. | Automated discovery of API endpoints for health check and automated health check generation |
| US12184528B2 (en) | 2022-05-25 | 2024-12-31 | Ennetix Inc. | Methods and apparatus for adaptive and holistic network measurements |
| US12255869B2 (en) * | 2022-08-29 | 2025-03-18 | Cisco Technology, Inc. | Name resolution triggered monitoring agent selection |
| US12063140B2 (en) | 2022-10-31 | 2024-08-13 | Keysight Technologies, Inc. | Methods, systems, and computer readable media for test system agent deployment in a smartswitch computing environment |
| US12182008B2 (en) * | 2022-12-14 | 2024-12-31 | International Business Machines Corporation | Labelling web traffic routing to support software testing |
| US12038993B1 (en) * | 2023-01-31 | 2024-07-16 | Splunk Inc. | Techniques for showing matched URLs for a URL grouping rule |
| US12284105B2 (en) * | 2023-06-28 | 2025-04-22 | Cisco Technology, Inc. | Cloud native observability migration and assessment |
| CN117234951B (en) * | 2023-11-13 | 2024-01-30 | 建信金融科技有限责任公司 | Function test method and device of application system, computer equipment and storage medium |
| US12423174B2 (en) * | 2024-02-02 | 2025-09-23 | Capital One Services, Llc | Tag-facilitated testing for cloud infrastructure |
Citations (128)
| Publication number | Priority date | Publication date | Assignee | Title |
|---|---|---|---|---|
| US5655081A (en) | 1995-03-08 | 1997-08-05 | Bmc Software, Inc. | System for monitoring and managing computer resources and applications across a distributed computing environment using an intelligent autonomous agent architecture |
| US5881237A (en) | 1996-09-10 | 1999-03-09 | Ganymede Software, Inc. | Methods, systems and computer program products for test scenario based communications network performance testing |
| US5940376A (en) | 1997-01-29 | 1999-08-17 | Cabletron Systems, Inc. | Method and apparatus to establish a tap-point in a switched network using self-configuring switches having distributed configuration capabilities |
| US20020031087A1 (en) | 2000-09-08 | 2002-03-14 | Tomonori Gotoh | Intensive management apparatus for checking path validity in time-sharing multiplexing network |
| US6397359B1 (en) | 1999-01-19 | 2002-05-28 | Netiq Corporation | Methods, systems and computer program products for scheduled network performance testing |
| US20020120727A1 (en) | 2000-12-21 | 2002-08-29 | Robert Curley | Method and apparatus for providing measurement, and utilization of, network latency in transaction-based protocols |
| US20020141400A1 (en) | 2001-04-02 | 2002-10-03 | Demartino Kevin A. | Wide area multi-service communications network based on dynamic channel switching |
| US20020198985A1 (en) | 2001-05-09 | 2002-12-26 | Noam Fraenkel | Post-deployment monitoring and analysis of server performance |
| US20020199016A1 (en) | 2001-06-22 | 2002-12-26 | Freedman Avraham T. | Automated control of outbound transist links in a multi-homed BGP routing environment |
| US20030056140A1 (en) | 2000-05-05 | 2003-03-20 | Taylor David K. | Help desk systems and methods for use with communications networks |
| US6611955B1 (en) | 1999-06-03 | 2003-08-26 | Swisscom Ag | Monitoring and testing middleware based application software |
| US20030174650A1 (en) | 2002-03-15 | 2003-09-18 | Broadcom Corporation | Weighted fair queuing (WFQ) shaper |
| US6625648B1 (en) | 2000-01-07 | 2003-09-23 | Netiq Corporation | Methods, systems and computer program products for network performance testing through active endpoint pair based testing and passive application monitoring |
| US20030236844A1 (en) | 2002-06-25 | 2003-12-25 | Kaler Christopher G. | Testing distributed applications |
| US20040046785A1 (en) * | 2002-09-11 | 2004-03-11 | International Business Machines Corporation | Methods and apparatus for topology discovery and representation of distributed applications and services |
| EP1402355A1 (en) | 2001-05-23 | 2004-03-31 | Tekelec | Methods and systems for automatically configuring network monitoring system |
| US6744739B2 (en) | 2001-05-18 | 2004-06-01 | Micromuse Inc. | Method and system for determining network characteristics using routing protocols |
| US20040126840A1 (en) | 2002-12-23 | 2004-07-01 | Affymetrix, Inc. | Method, system and computer software for providing genomic ontological data |
| US20040221296A1 (en) | 2003-03-18 | 2004-11-04 | Renesys Corporation | Methods and systems for monitoring network routing |
| US20050036487A1 (en) | 2003-08-13 | 2005-02-17 | Devabhaktuni Srikrishna | Method and apparatus for monitoring and displaying routing metrics of a network |
| US6892227B1 (en) | 2001-12-21 | 2005-05-10 | Networks Associates Technology, Inc. | Enterprise network analyzer host controller/zone controller interface system and method |
| US20050114500A1 (en) | 2003-11-24 | 2005-05-26 | Monk John M. | Graphical user interface for adding measurements to existing distributed network troubleshooting system |
| US20050198269A1 (en) | 2004-02-13 | 2005-09-08 | Champagne Andrew F. | Method and system for monitoring border gateway protocol (BGP) data in a distributed computer network |
| US20050222815A1 (en) | 2004-03-31 | 2005-10-06 | Kevin Tolly | System and method for testing and certifying products |
| US20050243729A1 (en) | 2004-04-16 | 2005-11-03 | Apparent Networks, Inc. | Method and apparatus for automating and scaling active probing-based IP network performance monitoring and diagnosis |
| US6990101B1 (en) | 2001-03-23 | 2006-01-24 | Advanced Micro Devices, Inc. | System and method for performing layer 3 switching in a network device |
| US6993686B1 (en) * | 2002-04-30 | 2006-01-31 | Cisco Technology, Inc. | System health monitoring and recovery |
| US20060023638A1 (en) | 2004-07-29 | 2006-02-02 | Solutions4Networks | Proactive network analysis system |
| US20060074946A1 (en) | 2004-09-27 | 2006-04-06 | Performance It | Point of view distributed agent methodology for network management |
| US20060098586A1 (en) | 2001-03-09 | 2006-05-11 | Farrell Craig A | Method and apparatus for application route discovery |
| US20060291446A1 (en) | 2005-06-24 | 2006-12-28 | Donald Caldwell | Systems, methods, and devices for managing routing |
| US20070043861A1 (en) | 2005-08-19 | 2007-02-22 | Opnet Technologies, Inc. | Capture, analysis, and visualization of concurrent system and network behavior of an application |
| WO2007038953A1 (en) | 2005-09-30 | 2007-04-12 | Telecom Italia S.P.A. | A method and system for automatically testing performance of applications run in a distributed processing structure and corresponding computer program product |
| US7209963B2 (en) | 2002-07-11 | 2007-04-24 | International Business Machines Corporation | Apparatus and method for distributed monitoring of endpoints in a management region |
| US7231555B2 (en) | 2002-08-22 | 2007-06-12 | Agilent Technologies, Inc. | Method and apparatus to coordinate groups of heterogeneous measurements |
| US20070162595A1 (en) | 2006-01-11 | 2007-07-12 | Cisco Technology, Onc. | System and method for tracking network resources |
| US20070250902A1 (en) | 2006-04-19 | 2007-10-25 | Ravichander Vaidyanathan | System and method for statistical analysis of border gateway protocol (BGP) configurations |
| US7299277B1 (en) | 2002-01-10 | 2007-11-20 | Network General Technology | Media module apparatus and method for use in a network monitoring environment |
| US20080049777A1 (en) | 2006-08-22 | 2008-02-28 | Morrill Robert J | System and method for using distributed network performance information tables to manage network communications |
| US20080089347A1 (en) | 2003-08-29 | 2008-04-17 | End Ii End Communications Inc. | Systems and methods for broadband network optimization |
| CN100388695C (en) | 2006-06-07 | 2008-05-14 | 北京邮电大学 | Internet inter-domain routing monitoring and analysis system and its working method |
| US20080155093A1 (en) | 2006-12-20 | 2008-06-26 | Cisco Technology, Inc., A California Corporation | Measuring delays from content servers to network devices on paths to a client such as for use in selecting a content server based on a common network device |
| US20080222287A1 (en) | 2007-03-06 | 2008-09-11 | Microsoft Corporation | Constructing an Inference Graph for a Network |
| US20080222068A1 (en) * | 2007-03-06 | 2008-09-11 | Microsoft Corporation | Inferring Candidates that are Potentially Responsible for User-Perceptible Network Problems |
| US20080263188A1 (en) | 2007-04-20 | 2008-10-23 | Verizon Business Network Services Inc. | Method and system for monitoring and analyzing of routing in ip networks |
| US7487240B2 (en) | 2003-04-15 | 2009-02-03 | Alcatel Lucent | Centralized internet protocol/multi-protocol label switching connectivity verification in a communications network management context |
| US20090055522A1 (en) | 2007-04-13 | 2009-02-26 | Scott Shen | Website load testing using a plurality of remotely operating agents distributed over a wide area |
| US7529192B2 (en) | 2003-07-21 | 2009-05-05 | Arbor Networks | System and method for correlating traffic and routing information |
| US7549309B2 (en) | 2003-08-29 | 2009-06-23 | Sap Ag | Method and system for restructuring a visualization graph so that entities linked to a common node are replaced by the common node in response to a predetermined stimulus |
| US20090161556A1 (en) | 2007-12-19 | 2009-06-25 | Zhiqiang Qian | Methods and Apparatus for Fault Identification in Border Gateway Protocol Networks |
| US20090276771A1 (en) | 2005-09-15 | 2009-11-05 | 3Tera, Inc. | Globally Distributed Utility Computing Cloud |
| US7616579B2 (en) | 2005-07-21 | 2009-11-10 | Netcordia, Inc. | Voice over IP analysis system and method |
| US7636305B1 (en) | 2005-06-17 | 2009-12-22 | Cisco Technology, Inc. | Method and apparatus for monitoring network traffic |
| US20100002578A1 (en) | 2006-10-09 | 2010-01-07 | Raoul Fiorone | Resiliency Schemes in Communications Networks |
| US7660290B2 (en) | 2004-04-16 | 2010-02-09 | Cloud Scope Technologies, Inc. | System and method for visualizing traffic and path in network |
| US20100080129A1 (en) | 2008-09-26 | 2010-04-01 | Robert Strahan | Network troubleshooting using path topology |
| US7698396B2 (en) | 2000-01-31 | 2010-04-13 | Hitachi Software Engineering Co., Ltd. | Method of automatically recognizing network configuration including intelligent packet relay equipment, method of displaying network configuration chart, and system thereof |
| US20100100627A1 (en) | 2006-05-31 | 2010-04-22 | Qurio Holdings, Inc. | System and method for bypassing an access point in a local area network for p2p data transfers |
| US20100132039A1 (en) | 2008-11-25 | 2010-05-27 | At&T Intellectual Property I, L.P. | System and method to select monitors that detect prefix hijacking events |
| EP2222025A1 (en) | 2009-02-19 | 2010-08-25 | Fluke Corporation | Methods and apparatus for determining and displaying WAN optimization attributes for individual transactions |
| US7804781B2 (en) | 2008-11-20 | 2010-09-28 | At&T Intellectual Property I, L.P. | Methods and apparatus to detect border gateway protocol session failures |
| US7822837B1 (en) | 2004-12-30 | 2010-10-26 | Packeteer, Inc. | Adaptive correlation of service level agreement and network application performance |
| US7860016B1 (en) | 2004-08-25 | 2010-12-28 | Emc Corporation | Method and apparatus for configuration and analysis of network routing protocols |
| US7894461B2 (en) | 2008-11-20 | 2011-02-22 | At&T Intellectual Property I, L.P. | Methods and apparatus to infer the status of border gateway protocol sessions |
| US7945658B1 (en) | 2005-12-05 | 2011-05-17 | Narus, Inc. | Method for real-time visualization of BGP analysis and trouble-shooting |
| US20110145434A1 (en) | 2009-12-14 | 2011-06-16 | At&T Intellectual Property I, L.P. | System and Method to Manage Static Internet Protocol Addresses |
| US7975045B2 (en) | 2007-12-26 | 2011-07-05 | Verizon Patent And Licensing Inc. | Method and system for monitoring and analyzing of IP networks elements |
| US20110170402A1 (en) | 2010-01-14 | 2011-07-14 | Fujitsu Limited | Apparatus and method for generating topology tree |
| US7990892B2 (en) | 2006-04-21 | 2011-08-02 | France Telecom | Method of selecting a telephony route within an IP telephony domain, and corresponding apparatus and computer program |
| US8032646B2 (en) | 2000-07-28 | 2011-10-04 | Prom KS Limited Liability Company | Administering a communication network |
| US20110286418A1 (en) | 2009-02-03 | 2011-11-24 | Hang Liu | Method and apparatus for dynamic channel assignment and stream control in multi-hop wireless networks |
| US20120017165A1 (en) | 2010-07-19 | 2012-01-19 | Soasta, Inc. | Apparatus and method for combining / correlating data sets |
| US8130767B2 (en) | 2005-06-17 | 2012-03-06 | Cisco Technology, Inc. | Method and apparatus for aggregating network traffic flows |
| US8170552B2 (en) | 2006-03-10 | 2012-05-01 | Cisco Technology, Inc. | Mobile network device multi-link optimizations |
| US8185619B1 (en) | 2006-06-28 | 2012-05-22 | Compuware Corporation | Analytics system and method |
| US20120151041A1 (en) | 2010-12-14 | 2012-06-14 | At&T Intellectual Property I, L.P. | Intelligent mobility application profiling tool |
| US8208377B2 (en) | 2009-03-26 | 2012-06-26 | Force10 Networks, Inc. | MAC-address based virtual route aggregation |
| US8228815B2 (en) | 2006-11-14 | 2012-07-24 | The Trustees Of Columbia University In The City Of New York | Systems and methods for computing data transmission characteristics of a network path based on single-ended measurements |
| US20120191826A1 (en) | 2011-01-26 | 2012-07-26 | Rony Gotesdyner | Device-Health-Based Dynamic Configuration of Network Management Systems Suited for Network Operations |
| US20120207161A1 (en) | 2009-10-07 | 2012-08-16 | Raghavendra Uppalli | Network multi-path discovery |
| US8254273B2 (en) | 2007-03-02 | 2012-08-28 | Cisco Technology, Inc. | Tracing connection paths through transparent proxies |
| US20120239799A1 (en) | 2011-03-17 | 2012-09-20 | Chengwei Wang | Network system management |
| US8325720B2 (en) | 2008-07-17 | 2012-12-04 | NETBRAIN Technologies, Inc | System and method for simulating IP network routing |
| US8438427B2 (en) | 2011-04-08 | 2013-05-07 | Ca, Inc. | Visualizing relationships between a transaction trace graph and a map of logical subsystems |
| US8458301B1 (en) * | 2009-10-30 | 2013-06-04 | Bradford Networks, Inc. | Automated configuration of network devices administered by policy enforcement |
| US8484374B2 (en) | 1998-07-15 | 2013-07-09 | Radware, Ltd. | Load balancing |
| US8490055B2 (en) | 2010-09-17 | 2013-07-16 | Ca, Inc. | Generating dependency maps from dependency data |
| US8521904B1 (en) | 2008-12-16 | 2013-08-27 | At&T Intellectual Property I, L.P. | Devices, systems, and/or methods for determining internet topology |
| US8542612B1 (en) | 2005-12-28 | 2013-09-24 | At&T Intellectual Property Ii, L.P. | Method and apparatus for providing a wide area network infrastructure |
| US8549405B2 (en) | 2006-08-22 | 2013-10-01 | Centurylink Intellectual Property Llc | System and method for displaying a graphical representation of a network to identify nodes and node segments on the network that are not operating normally |
| US8549124B2 (en) | 2009-05-27 | 2013-10-01 | International Business Machines Corporation | Network management discovery tool |
| US20130275854A1 (en) | 2010-04-19 | 2013-10-17 | Suk Hwan Lim | Segmenting a Web Page into Coherent Functional Blocks |
| US20130283148A1 (en) | 2010-10-26 | 2013-10-24 | Suk Hwan Lim | Extraction of Content from a Web Page |
| US8572281B1 (en) | 2006-03-24 | 2013-10-29 | Ciena Corporation | Leaking routes among routing engines in a highly scalable router |
| US20130311832A1 (en) * | 2012-05-21 | 2013-11-21 | Thousands Eyes, Inc. | Cross-layer troubleshooting of application delivery |
| US20140029443A1 (en) | 2012-07-30 | 2014-01-30 | Hewlett-Packard Development Company Lp | Interprovider virtual private network path identification |
| US8675672B1 (en) | 2011-12-30 | 2014-03-18 | Emc Corporation | Hierarchical cluster tree overlay network |
| US8751619B2 (en) | 2011-05-31 | 2014-06-10 | Cisco Technology, Inc. | Autonomous performance probing |
| US20140181292A1 (en) | 2012-12-20 | 2014-06-26 | Dell Products L.P. | Systems and methods for topology discovery and application in a border gateway protocol based data center |
| US20140245163A1 (en) | 2013-02-26 | 2014-08-28 | Research In Motion Limited | System and methods for navigating social networks |
| US20140282027A1 (en) | 2013-03-15 | 2014-09-18 | Lingping Gao | Graphic user interface based network management system to define and execute troubleshooting procedure |
| US20140304407A1 (en) | 2012-12-21 | 2014-10-09 | Boundary, Inc. | Visualizing Ephemeral Traffic |
| US20140344926A1 (en) * | 2013-03-15 | 2014-11-20 | Sean Cunningham | System and method employing structured intelligence to verify and contain threats at endpoints |
| US20140351564A1 (en) | 2013-05-22 | 2014-11-27 | International Business Machines Corporation | Simplification of large networks and graphs |
| US8971323B2 (en) | 2012-06-15 | 2015-03-03 | Citrix Systems, Inc. | Systems and methods for dynamic routing in a cluster |
| US20150103672A1 (en) | 2013-10-14 | 2015-04-16 | Hewlett-Packard Development Company, L.P | Data flow path determination |
| US9014012B2 (en) | 2009-10-07 | 2015-04-21 | Riverbed Technology, Inc. | Network path discovery and analysis |
| US20150142490A1 (en) * | 2013-11-15 | 2015-05-21 | Apple Inc. | Schedule manager |
| US20150156077A1 (en) | 2013-03-15 | 2015-06-04 | NetBrain Technologies, Inc. | System and method for automating network management tasks |
| US20150370445A1 (en) | 2014-06-18 | 2015-12-24 | Vmware, Inc. | Connection paths for application topology |
| US9277044B2 (en) | 2013-05-09 | 2016-03-01 | Steven P. Kahn | Transportable wireless loudspeaker and system and method for managing multi-user wireless media playback over a media playback system |
| US20160080244A1 (en) | 2013-04-29 | 2016-03-17 | Alvaro Entrique RETANA | Host mobility messaging |
| US9411787B1 (en) | 2013-03-15 | 2016-08-09 | Thousandeyes, Inc. | Cross-layer troubleshooting of application delivery |
| US20170134957A1 (en) | 2012-10-16 | 2017-05-11 | Mcafee, Inc. | System and method for correlating network information with subscriber information in a mobile network environment |
| US9729414B1 (en) | 2012-05-21 | 2017-08-08 | Thousandeyes, Inc. | Monitoring service availability using distributed BGP routing feeds |
| US20170249781A1 (en) | 2016-02-25 | 2017-08-31 | Intel Corporation | Method and Apparatus for In-Place Construction of Left-Balanced and Complete Point K-D Trees |
| US9781008B1 (en) | 2014-04-11 | 2017-10-03 | Cisco Technology, Inc. | Visualization of dynamic fabric automation network topology |
| US20170353243A1 (en) | 2016-06-07 | 2017-12-07 | Ciena Corporation | Optical network visualization and planning |
| US9886445B1 (en) | 2014-08-20 | 2018-02-06 | Vmware, Inc. | Datacenter entity information system |
| US9939289B1 (en) | 2015-04-29 | 2018-04-10 | State Farm Mutual Automobile Insurance Company | Method and system for providing speed limit alerts |
| US20180121032A1 (en) | 2016-10-31 | 2018-05-03 | Appdynamics Llc | Displaying a complex service topology for monitoring |
| US20180189320A1 (en) | 2016-12-29 | 2018-07-05 | Sap Se | Clustering for geo-enriched data |
| US10037617B2 (en) | 2015-02-27 | 2018-07-31 | Cisco Technology, Inc. | Enhanced user interface systems including dynamic context selection for cloud-based networks |
| US20180337842A1 (en) | 2015-12-18 | 2018-11-22 | International Business Machines Corporation | Method and system for temporal sampling in evolving network |
| US20180375953A1 (en) | 2016-04-21 | 2018-12-27 | Hewlett Packard Enterprise Development Lp | Determining a persistent network identity of a networked device |
| US20190065563A1 (en) | 2017-08-25 | 2019-02-28 | Microsoft Technology Licensing, Llc | Efficient display of data points in a user interface |
| US20190149419A1 (en) | 2017-11-15 | 2019-05-16 | Fujitsu Limited | Information processing device and information processing method |
| US20200044940A1 (en) | 2018-08-03 | 2020-02-06 | Red Hat, Inc. | Targeted network discovery and visualizations |
Family Cites Families (12)
| Publication number | Priority date | Publication date | Assignee | Title |
|---|---|---|---|---|
| US6195584B1 (en) * | 1999-04-30 | 2001-02-27 | Medtronic, Inc. | Method and apparatus for determining atrial lead dislocation |
| US7777777B2 (en) * | 2002-04-30 | 2010-08-17 | Tandberg Telecom As | System and method for active call monitoring |
| GB0400883D0 (en) * | 2004-01-15 | 2004-02-18 | Nokia Corp | Controlling communication sessions in a communication system |
| US8878833B2 (en) * | 2006-08-16 | 2014-11-04 | Barco, Inc. | Systems, methods, and apparatus for recording of graphical display |
| US8930577B2 (en) * | 2011-09-13 | 2015-01-06 | Microsoft Corporation | Synchronizing streaming video between viewers over a network |
| US9104313B2 (en) * | 2012-09-14 | 2015-08-11 | Cellco Partnership | Automatic adjustment of selectable function presentation on electronic device display |
| US10425293B2 (en) * | 2014-07-30 | 2019-09-24 | Hewlett Packard Enterprise Development Lp | Network resource allocation proposals |
| AU2014101209A4 (en) * | 2014-09-18 | 2014-11-13 | Tech Mahindra Ltd. | System and method for orchestrating dynamic recovery actions for business services across traditional and sdn supporting openflow protocol |
| WO2016123617A1 (en) * | 2015-01-30 | 2016-08-04 | Arris Enterprises, Inc. | Consolidated management of home network elements |
| US10671520B1 (en) * | 2016-06-15 | 2020-06-02 | Thousandeyes, Inc. | Scheduled tests for endpoint agents |
| US10587479B2 (en) * | 2017-04-02 | 2020-03-10 | Nicira, Inc. | GUI for analysis of logical network modifications |
| US10957153B2 (en) * | 2019-03-15 | 2021-03-23 | Ags Llc | Technician input-free reconfiguration of secured gaming system |
-
2019
- 2019-07-31 US US16/528,247 patent/US10671520B1/en active Active
-
2020
- 2020-04-14 US US16/848,723 patent/US11042474B2/en not_active Expired - Fee Related
-
2021
- 2021-06-22 US US17/355,097 patent/US11755467B2/en active Active
Patent Citations (145)
| Publication number | Priority date | Publication date | Assignee | Title |
|---|---|---|---|---|
| US5655081A (en) | 1995-03-08 | 1997-08-05 | Bmc Software, Inc. | System for monitoring and managing computer resources and applications across a distributed computing environment using an intelligent autonomous agent architecture |
| US5881237A (en) | 1996-09-10 | 1999-03-09 | Ganymede Software, Inc. | Methods, systems and computer program products for test scenario based communications network performance testing |
| US5940376A (en) | 1997-01-29 | 1999-08-17 | Cabletron Systems, Inc. | Method and apparatus to establish a tap-point in a switched network using self-configuring switches having distributed configuration capabilities |
| US8484374B2 (en) | 1998-07-15 | 2013-07-09 | Radware, Ltd. | Load balancing |
| US6397359B1 (en) | 1999-01-19 | 2002-05-28 | Netiq Corporation | Methods, systems and computer program products for scheduled network performance testing |
| US6611955B1 (en) | 1999-06-03 | 2003-08-26 | Swisscom Ag | Monitoring and testing middleware based application software |
| US6625648B1 (en) | 2000-01-07 | 2003-09-23 | Netiq Corporation | Methods, systems and computer program products for network performance testing through active endpoint pair based testing and passive application monitoring |
| US7698396B2 (en) | 2000-01-31 | 2010-04-13 | Hitachi Software Engineering Co., Ltd. | Method of automatically recognizing network configuration including intelligent packet relay equipment, method of displaying network configuration chart, and system thereof |
| US20030056140A1 (en) | 2000-05-05 | 2003-03-20 | Taylor David K. | Help desk systems and methods for use with communications networks |
| US8032646B2 (en) | 2000-07-28 | 2011-10-04 | Prom KS Limited Liability Company | Administering a communication network |
| US20020031087A1 (en) | 2000-09-08 | 2002-03-14 | Tomonori Gotoh | Intensive management apparatus for checking path validity in time-sharing multiplexing network |
| US20020120727A1 (en) | 2000-12-21 | 2002-08-29 | Robert Curley | Method and apparatus for providing measurement, and utilization of, network latency in transaction-based protocols |
| US20060098586A1 (en) | 2001-03-09 | 2006-05-11 | Farrell Craig A | Method and apparatus for application route discovery |
| US6990101B1 (en) | 2001-03-23 | 2006-01-24 | Advanced Micro Devices, Inc. | System and method for performing layer 3 switching in a network device |
| US20020141400A1 (en) | 2001-04-02 | 2002-10-03 | Demartino Kevin A. | Wide area multi-service communications network based on dynamic channel switching |
| US20020198985A1 (en) | 2001-05-09 | 2002-12-26 | Noam Fraenkel | Post-deployment monitoring and analysis of server performance |
| US7423979B2 (en) | 2001-05-18 | 2008-09-09 | International Business Machines Corporation | Method and system for determining network characteristics using routing protocols |
| US6744739B2 (en) | 2001-05-18 | 2004-06-01 | Micromuse Inc. | Method and system for determining network characteristics using routing protocols |
| EP1402355A1 (en) | 2001-05-23 | 2004-03-31 | Tekelec | Methods and systems for automatically configuring network monitoring system |
| US20020199016A1 (en) | 2001-06-22 | 2002-12-26 | Freedman Avraham T. | Automated control of outbound transist links in a multi-homed BGP routing environment |
| US6892227B1 (en) | 2001-12-21 | 2005-05-10 | Networks Associates Technology, Inc. | Enterprise network analyzer host controller/zone controller interface system and method |
| US7299277B1 (en) | 2002-01-10 | 2007-11-20 | Network General Technology | Media module apparatus and method for use in a network monitoring environment |
| US20030174650A1 (en) | 2002-03-15 | 2003-09-18 | Broadcom Corporation | Weighted fair queuing (WFQ) shaper |
| US6993686B1 (en) * | 2002-04-30 | 2006-01-31 | Cisco Technology, Inc. | System health monitoring and recovery |
| US20030236844A1 (en) | 2002-06-25 | 2003-12-25 | Kaler Christopher G. | Testing distributed applications |
| US7209963B2 (en) | 2002-07-11 | 2007-04-24 | International Business Machines Corporation | Apparatus and method for distributed monitoring of endpoints in a management region |
| US7231555B2 (en) | 2002-08-22 | 2007-06-12 | Agilent Technologies, Inc. | Method and apparatus to coordinate groups of heterogeneous measurements |
| US7240325B2 (en) * | 2002-09-11 | 2007-07-03 | International Business Machines Corporation | Methods and apparatus for topology discovery and representation of distributed applications and services |
| US20040046785A1 (en) * | 2002-09-11 | 2004-03-11 | International Business Machines Corporation | Methods and apparatus for topology discovery and representation of distributed applications and services |
| US20040126840A1 (en) | 2002-12-23 | 2004-07-01 | Affymetrix, Inc. | Method, system and computer software for providing genomic ontological data |
| US8161152B2 (en) | 2003-03-18 | 2012-04-17 | Renesys Corporation | Methods and systems for monitoring network routing |
| US20040221296A1 (en) | 2003-03-18 | 2004-11-04 | Renesys Corporation | Methods and systems for monitoring network routing |
| US7487240B2 (en) | 2003-04-15 | 2009-02-03 | Alcatel Lucent | Centralized internet protocol/multi-protocol label switching connectivity verification in a communications network management context |
| US7529192B2 (en) | 2003-07-21 | 2009-05-05 | Arbor Networks | System and method for correlating traffic and routing information |
| US20100118714A1 (en) | 2003-07-21 | 2010-05-13 | Arbor Networks | System and method for correlating traffic and routing information |
| US20050036487A1 (en) | 2003-08-13 | 2005-02-17 | Devabhaktuni Srikrishna | Method and apparatus for monitoring and displaying routing metrics of a network |
| US20080089347A1 (en) | 2003-08-29 | 2008-04-17 | End Ii End Communications Inc. | Systems and methods for broadband network optimization |
| US7549309B2 (en) | 2003-08-29 | 2009-06-23 | Sap Ag | Method and system for restructuring a visualization graph so that entities linked to a common node are replaced by the common node in response to a predetermined stimulus |
| US20050114500A1 (en) | 2003-11-24 | 2005-05-26 | Monk John M. | Graphical user interface for adding measurements to existing distributed network troubleshooting system |
| US20050198269A1 (en) | 2004-02-13 | 2005-09-08 | Champagne Andrew F. | Method and system for monitoring border gateway protocol (BGP) data in a distributed computer network |
| US20050222815A1 (en) | 2004-03-31 | 2005-10-06 | Kevin Tolly | System and method for testing and certifying products |
| US7660290B2 (en) | 2004-04-16 | 2010-02-09 | Cloud Scope Technologies, Inc. | System and method for visualizing traffic and path in network |
| US20050243729A1 (en) | 2004-04-16 | 2005-11-03 | Apparent Networks, Inc. | Method and apparatus for automating and scaling active probing-based IP network performance monitoring and diagnosis |
| US20060023638A1 (en) | 2004-07-29 | 2006-02-02 | Solutions4Networks | Proactive network analysis system |
| US7860016B1 (en) | 2004-08-25 | 2010-12-28 | Emc Corporation | Method and apparatus for configuration and analysis of network routing protocols |
| US20060074946A1 (en) | 2004-09-27 | 2006-04-06 | Performance It | Point of view distributed agent methodology for network management |
| US7822837B1 (en) | 2004-12-30 | 2010-10-26 | Packeteer, Inc. | Adaptive correlation of service level agreement and network application performance |
| US8130767B2 (en) | 2005-06-17 | 2012-03-06 | Cisco Technology, Inc. | Method and apparatus for aggregating network traffic flows |
| US7636305B1 (en) | 2005-06-17 | 2009-12-22 | Cisco Technology, Inc. | Method and apparatus for monitoring network traffic |
| US20060291446A1 (en) | 2005-06-24 | 2006-12-28 | Donald Caldwell | Systems, methods, and devices for managing routing |
| US7616579B2 (en) | 2005-07-21 | 2009-11-10 | Netcordia, Inc. | Voice over IP analysis system and method |
| US20070043861A1 (en) | 2005-08-19 | 2007-02-22 | Opnet Technologies, Inc. | Capture, analysis, and visualization of concurrent system and network behavior of an application |
| US20090276771A1 (en) | 2005-09-15 | 2009-11-05 | 3Tera, Inc. | Globally Distributed Utility Computing Cloud |
| US20090204795A1 (en) | 2005-09-30 | 2009-08-13 | Telecom Italia S.P.A. | Method and System for Automatically Testing Performance of Applications run in a Distributed Processing Structure and Corresponding Computer Program Product |
| WO2007038953A1 (en) | 2005-09-30 | 2007-04-12 | Telecom Italia S.P.A. | A method and system for automatically testing performance of applications run in a distributed processing structure and corresponding computer program product |
| US7945658B1 (en) | 2005-12-05 | 2011-05-17 | Narus, Inc. | Method for real-time visualization of BGP analysis and trouble-shooting |
| US8542612B1 (en) | 2005-12-28 | 2013-09-24 | At&T Intellectual Property Ii, L.P. | Method and apparatus for providing a wide area network infrastructure |
| US20070162595A1 (en) | 2006-01-11 | 2007-07-12 | Cisco Technology, Onc. | System and method for tracking network resources |
| US8170552B2 (en) | 2006-03-10 | 2012-05-01 | Cisco Technology, Inc. | Mobile network device multi-link optimizations |
| US8572281B1 (en) | 2006-03-24 | 2013-10-29 | Ciena Corporation | Leaking routes among routing engines in a highly scalable router |
| US8214876B2 (en) | 2006-04-19 | 2012-07-03 | Telcordia Technologies, Inc. | System and method for statistical analysis of border gateway protocol (BGP) configurations |
| US20070250902A1 (en) | 2006-04-19 | 2007-10-25 | Ravichander Vaidyanathan | System and method for statistical analysis of border gateway protocol (BGP) configurations |
| US7990892B2 (en) | 2006-04-21 | 2011-08-02 | France Telecom | Method of selecting a telephony route within an IP telephony domain, and corresponding apparatus and computer program |
| US20100100627A1 (en) | 2006-05-31 | 2010-04-22 | Qurio Holdings, Inc. | System and method for bypassing an access point in a local area network for p2p data transfers |
| CN100388695C (en) | 2006-06-07 | 2008-05-14 | 北京邮电大学 | Internet inter-domain routing monitoring and analysis system and its working method |
| US8185619B1 (en) | 2006-06-28 | 2012-05-22 | Compuware Corporation | Analytics system and method |
| US8549405B2 (en) | 2006-08-22 | 2013-10-01 | Centurylink Intellectual Property Llc | System and method for displaying a graphical representation of a network to identify nodes and node segments on the network that are not operating normally |
| US20080049777A1 (en) | 2006-08-22 | 2008-02-28 | Morrill Robert J | System and method for using distributed network performance information tables to manage network communications |
| US20100002578A1 (en) | 2006-10-09 | 2010-01-07 | Raoul Fiorone | Resiliency Schemes in Communications Networks |
| US8228815B2 (en) | 2006-11-14 | 2012-07-24 | The Trustees Of Columbia University In The City Of New York | Systems and methods for computing data transmission characteristics of a network path based on single-ended measurements |
| US20080155093A1 (en) | 2006-12-20 | 2008-06-26 | Cisco Technology, Inc., A California Corporation | Measuring delays from content servers to network devices on paths to a client such as for use in selecting a content server based on a common network device |
| US8254273B2 (en) | 2007-03-02 | 2012-08-28 | Cisco Technology, Inc. | Tracing connection paths through transparent proxies |
| US8015139B2 (en) | 2007-03-06 | 2011-09-06 | Microsoft Corporation | Inferring candidates that are potentially responsible for user-perceptible network problems |
| US20080222068A1 (en) * | 2007-03-06 | 2008-09-11 | Microsoft Corporation | Inferring Candidates that are Potentially Responsible for User-Perceptible Network Problems |
| US20080222287A1 (en) | 2007-03-06 | 2008-09-11 | Microsoft Corporation | Constructing an Inference Graph for a Network |
| US20090055522A1 (en) | 2007-04-13 | 2009-02-26 | Scott Shen | Website load testing using a plurality of remotely operating agents distributed over a wide area |
| US20080263188A1 (en) | 2007-04-20 | 2008-10-23 | Verizon Business Network Services Inc. | Method and system for monitoring and analyzing of routing in ip networks |
| US20090161556A1 (en) | 2007-12-19 | 2009-06-25 | Zhiqiang Qian | Methods and Apparatus for Fault Identification in Border Gateway Protocol Networks |
| US7975045B2 (en) | 2007-12-26 | 2011-07-05 | Verizon Patent And Licensing Inc. | Method and system for monitoring and analyzing of IP networks elements |
| US8325720B2 (en) | 2008-07-17 | 2012-12-04 | NETBRAIN Technologies, Inc | System and method for simulating IP network routing |
| US20100080129A1 (en) | 2008-09-26 | 2010-04-01 | Robert Strahan | Network troubleshooting using path topology |
| US7894461B2 (en) | 2008-11-20 | 2011-02-22 | At&T Intellectual Property I, L.P. | Methods and apparatus to infer the status of border gateway protocol sessions |
| US7804781B2 (en) | 2008-11-20 | 2010-09-28 | At&T Intellectual Property I, L.P. | Methods and apparatus to detect border gateway protocol session failures |
| US20100132039A1 (en) | 2008-11-25 | 2010-05-27 | At&T Intellectual Property I, L.P. | System and method to select monitors that detect prefix hijacking events |
| US8521904B1 (en) | 2008-12-16 | 2013-08-27 | At&T Intellectual Property I, L.P. | Devices, systems, and/or methods for determining internet topology |
| US20110286418A1 (en) | 2009-02-03 | 2011-11-24 | Hang Liu | Method and apparatus for dynamic channel assignment and stream control in multi-hop wireless networks |
| EP2222025A1 (en) | 2009-02-19 | 2010-08-25 | Fluke Corporation | Methods and apparatus for determining and displaying WAN optimization attributes for individual transactions |
| US8208377B2 (en) | 2009-03-26 | 2012-06-26 | Force10 Networks, Inc. | MAC-address based virtual route aggregation |
| US8549124B2 (en) | 2009-05-27 | 2013-10-01 | International Business Machines Corporation | Network management discovery tool |
| US9014012B2 (en) | 2009-10-07 | 2015-04-21 | Riverbed Technology, Inc. | Network path discovery and analysis |
| US20120207161A1 (en) | 2009-10-07 | 2012-08-16 | Raghavendra Uppalli | Network multi-path discovery |
| US8458301B1 (en) * | 2009-10-30 | 2013-06-04 | Bradford Networks, Inc. | Automated configuration of network devices administered by policy enforcement |
| US20110145434A1 (en) | 2009-12-14 | 2011-06-16 | At&T Intellectual Property I, L.P. | System and Method to Manage Static Internet Protocol Addresses |
| US20110170402A1 (en) | 2010-01-14 | 2011-07-14 | Fujitsu Limited | Apparatus and method for generating topology tree |
| US20130275854A1 (en) | 2010-04-19 | 2013-10-17 | Suk Hwan Lim | Segmenting a Web Page into Coherent Functional Blocks |
| US20120017165A1 (en) | 2010-07-19 | 2012-01-19 | Soasta, Inc. | Apparatus and method for combining / correlating data sets |
| US8490055B2 (en) | 2010-09-17 | 2013-07-16 | Ca, Inc. | Generating dependency maps from dependency data |
| US20130283148A1 (en) | 2010-10-26 | 2013-10-24 | Suk Hwan Lim | Extraction of Content from a Web Page |
| US20120151041A1 (en) | 2010-12-14 | 2012-06-14 | At&T Intellectual Property I, L.P. | Intelligent mobility application profiling tool |
| US20120191826A1 (en) | 2011-01-26 | 2012-07-26 | Rony Gotesdyner | Device-Health-Based Dynamic Configuration of Network Management Systems Suited for Network Operations |
| US20120239799A1 (en) | 2011-03-17 | 2012-09-20 | Chengwei Wang | Network system management |
| US8438427B2 (en) | 2011-04-08 | 2013-05-07 | Ca, Inc. | Visualizing relationships between a transaction trace graph and a map of logical subsystems |
| US8751619B2 (en) | 2011-05-31 | 2014-06-10 | Cisco Technology, Inc. | Autonomous performance probing |
| US8675672B1 (en) | 2011-12-30 | 2014-03-18 | Emc Corporation | Hierarchical cluster tree overlay network |
| US20130311832A1 (en) * | 2012-05-21 | 2013-11-21 | Thousands Eyes, Inc. | Cross-layer troubleshooting of application delivery |
| US10230603B2 (en) | 2012-05-21 | 2019-03-12 | Thousandeyes, Inc. | Cross-layer troubleshooting of application delivery |
| US9985858B2 (en) | 2012-05-21 | 2018-05-29 | Thousandeyes, Inc. | Deep path analysis of application delivery over a network |
| US20140280917A1 (en) | 2012-05-21 | 2014-09-18 | Thousand Eyes, Inc. | Deep path analysis of application delivery over a network |
| US9729414B1 (en) | 2012-05-21 | 2017-08-08 | Thousandeyes, Inc. | Monitoring service availability using distributed BGP routing feeds |
| US20170026262A1 (en) | 2012-05-21 | 2017-01-26 | Thousandeyes, Inc. | Deep path analysis of application delivery over a network |
| US9455890B2 (en) | 2012-05-21 | 2016-09-27 | Thousandeyes, Inc. | Deep path analysis of application delivery over a network |
| US8971323B2 (en) | 2012-06-15 | 2015-03-03 | Citrix Systems, Inc. | Systems and methods for dynamic routing in a cluster |
| US20140029443A1 (en) | 2012-07-30 | 2014-01-30 | Hewlett-Packard Development Company Lp | Interprovider virtual private network path identification |
| US20170134957A1 (en) | 2012-10-16 | 2017-05-11 | Mcafee, Inc. | System and method for correlating network information with subscriber information in a mobile network environment |
| US20140181292A1 (en) | 2012-12-20 | 2014-06-26 | Dell Products L.P. | Systems and methods for topology discovery and application in a border gateway protocol based data center |
| US20140304407A1 (en) | 2012-12-21 | 2014-10-09 | Boundary, Inc. | Visualizing Ephemeral Traffic |
| US20140245163A1 (en) | 2013-02-26 | 2014-08-28 | Research In Motion Limited | System and methods for navigating social networks |
| US20140282027A1 (en) | 2013-03-15 | 2014-09-18 | Lingping Gao | Graphic user interface based network management system to define and execute troubleshooting procedure |
| US20150156077A1 (en) | 2013-03-15 | 2015-06-04 | NetBrain Technologies, Inc. | System and method for automating network management tasks |
| US9800478B2 (en) | 2013-03-15 | 2017-10-24 | Thousandeyes, Inc. | Cross-layer troubleshooting of application delivery |
| US9411787B1 (en) | 2013-03-15 | 2016-08-09 | Thousandeyes, Inc. | Cross-layer troubleshooting of application delivery |
| US20140344926A1 (en) * | 2013-03-15 | 2014-11-20 | Sean Cunningham | System and method employing structured intelligence to verify and contain threats at endpoints |
| US20160080244A1 (en) | 2013-04-29 | 2016-03-17 | Alvaro Entrique RETANA | Host mobility messaging |
| US9277044B2 (en) | 2013-05-09 | 2016-03-01 | Steven P. Kahn | Transportable wireless loudspeaker and system and method for managing multi-user wireless media playback over a media playback system |
| US20140351564A1 (en) | 2013-05-22 | 2014-11-27 | International Business Machines Corporation | Simplification of large networks and graphs |
| US20180322219A1 (en) | 2013-05-22 | 2018-11-08 | International Business Machines Corporation | Simplification of large networks and graphs |
| US10042958B2 (en) | 2013-05-22 | 2018-08-07 | International Business Machines Corporation | Simplification of large networks and graphs |
| US20150103672A1 (en) | 2013-10-14 | 2015-04-16 | Hewlett-Packard Development Company, L.P | Data flow path determination |
| US20160197818A1 (en) | 2013-10-14 | 2016-07-07 | Hewlett Packard Enterprise Development Lp | Data flow path determination |
| US20150142490A1 (en) * | 2013-11-15 | 2015-05-21 | Apple Inc. | Schedule manager |
| US9781008B1 (en) | 2014-04-11 | 2017-10-03 | Cisco Technology, Inc. | Visualization of dynamic fabric automation network topology |
| US20150370445A1 (en) | 2014-06-18 | 2015-12-24 | Vmware, Inc. | Connection paths for application topology |
| US9886445B1 (en) | 2014-08-20 | 2018-02-06 | Vmware, Inc. | Datacenter entity information system |
| US10037617B2 (en) | 2015-02-27 | 2018-07-31 | Cisco Technology, Inc. | Enhanced user interface systems including dynamic context selection for cloud-based networks |
| US9939289B1 (en) | 2015-04-29 | 2018-04-10 | State Farm Mutual Automobile Insurance Company | Method and system for providing speed limit alerts |
| US20180337842A1 (en) | 2015-12-18 | 2018-11-22 | International Business Machines Corporation | Method and system for temporal sampling in evolving network |
| US20170249781A1 (en) | 2016-02-25 | 2017-08-31 | Intel Corporation | Method and Apparatus for In-Place Construction of Left-Balanced and Complete Point K-D Trees |
| US20180375953A1 (en) | 2016-04-21 | 2018-12-27 | Hewlett Packard Enterprise Development Lp | Determining a persistent network identity of a networked device |
| US20180278330A1 (en) | 2016-06-07 | 2018-09-27 | Ciena Corporation | Optical network visualization and planning |
| US20170353243A1 (en) | 2016-06-07 | 2017-12-07 | Ciena Corporation | Optical network visualization and planning |
| US20180121032A1 (en) | 2016-10-31 | 2018-05-03 | Appdynamics Llc | Displaying a complex service topology for monitoring |
| US20180189320A1 (en) | 2016-12-29 | 2018-07-05 | Sap Se | Clustering for geo-enriched data |
| US20190065563A1 (en) | 2017-08-25 | 2019-02-28 | Microsoft Technology Licensing, Llc | Efficient display of data points in a user interface |
| US20190149419A1 (en) | 2017-11-15 | 2019-05-16 | Fujitsu Limited | Information processing device and information processing method |
| US20200044940A1 (en) | 2018-08-03 | 2020-02-06 | Red Hat, Inc. | Targeted network discovery and visualizations |
Non-Patent Citations (12)
| Title |
|---|
| Author Unknown, BGPlay @ Route Views, Apr. 14, 2015 retrieved from https://web.archive.org/web/20150414123115/http://bgplay.routeviews.org/main.html. |
| Author Unknown, Bgplay.js, What is BGPlay.js? Printed on Apr. 7, 2015. |
| Author Unknown, RIPE Network Coordination Centre, printed on Apr. 7, 2015. |
| Author Unknown, Route View 6447, Route Views Project Page, University of Oregon Route Views Project, Jan. 27, 2005. |
| Author Unknown, Routing Information Service (RIS), Oct. 7, 2013. |
| Blunk et al., Multi-Threaded Routing Toolkit (MRT) Routing Information Export Format, Oct. 2011. |
| Hong et al., An Online Monitoring Solution for Complex Distributed Systems Based on Hierarchical Monitoring Agents, Knolwdge and Systems Engineering, vol. 1, Advances in Intelligent Systems and Computing 244, pp. 187-198, 2014. |
| Lougheed et al., A Border Gateway Protocol (BGP), Jun. 1989. |
| Patent Cooperation Treaty PCT International Search Report for Application No. PCT/US2020/032535, 3 pages. |
| Rekhter et al., A Border Gateway Protocol 4 (BGP-4), Jan. 2006. |
| Tonn et al., ASGARD—A Graphical Monitoring Tool for Distributed Agent Infrastructures, Advances in PAAMS, AISC 70, pp. 163-173, 2010. |
| Vazquez et al., Internet Topology at the Router and Autonomous System Level, 2002. |
Cited By (5)
| Publication number | Priority date | Publication date | Assignee | Title |
|---|---|---|---|---|
| US20220158912A1 (en) * | 2020-11-16 | 2022-05-19 | Juniper Networks, Inc. | Active assurance of network slices |
| US11936548B2 (en) | 2020-11-16 | 2024-03-19 | Juniper Networks, Inc. | Active assurance for virtualized services |
| US12074780B2 (en) * | 2020-11-16 | 2024-08-27 | Juniper Networks, Inc. | Active assurance of network slices |
| US20240422090A1 (en) * | 2020-11-16 | 2024-12-19 | Juniper Networks, Inc. | Active assurance of network slices |
| US12255802B2 (en) | 2020-11-16 | 2025-03-18 | Juniper Networks, Inc. | Active assurance for virtualized services |
Also Published As
| Publication number | Publication date |
|---|---|
| US20210390039A1 (en) | 2021-12-16 |
| US11755467B2 (en) | 2023-09-12 |
| US20200242019A1 (en) | 2020-07-30 |
| US10671520B1 (en) | 2020-06-02 |
Similar Documents
| Publication | Publication Date | Title |
|---|---|---|
| US11755467B2 (en) | Scheduled tests for endpoint agents | |
| US11582119B2 (en) | Monitoring enterprise networks with endpoint agents | |
| US12197529B2 (en) | Real user monitoring statistics from end users via plugin or browser extension | |
| US12137023B2 (en) | Automatic analysis of user experience issues to reduce resolution time | |
| US11894993B2 (en) | Systems and methods for troubleshooting and performance analysis of cloud-based services | |
| US10892964B2 (en) | Systems and methods for monitoring digital user experience | |
| US10938686B2 (en) | Systems and methods for analyzing digital user experience | |
| US11863409B2 (en) | Systems and methods for alerting administrators of a monitored digital user experience | |
| US10728117B1 (en) | Systems and methods for improving digital user experience | |
| US11089047B1 (en) | Systems and methods for monitoring and displaying security posture and risk | |
| US12137108B2 (en) | Live log analysis for real-time data manipulation and visualization of a large data set | |
| EP3699766A1 (en) | Systems and methods for monitoring, analyzing, and improving digital user experience | |
| US11811623B2 (en) | Deep tracing of user experience | |
| US11290482B2 (en) | Mobile application notification system for monitoring security posture and risk | |
| US12088628B2 (en) | Cross-plane monitoring intent and policy instantiation for network analytics and assurance | |
| US12438785B2 (en) | Advanced machine learning techniques for internet outage detection | |
| WO2021021267A1 (en) | Scheduled tests for endpoint agents | |
| US20240420057A1 (en) | Systems and methods for collecting and displaying business insights in a cloud-based system | |
| US20220350923A1 (en) | Managing and routing of endpoint telemetry using realms | |
| US12500824B2 (en) | Multi-path monitoring of application instances using DNS-based reachability information | |
| US20250279945A1 (en) | Supplementation of active probing with infrastructure telemetry data | |
| US20260044807A1 (en) | Utilizing cloud-based data for determining and recommending organization office site locations | |
| US20250362990A1 (en) | Dynamic Invocation of Synthetic Probes Based on Real User Monitoring Agents |
Legal Events
| Date | Code | Title | Description |
|---|---|---|---|
| FEPP | Fee payment procedure |
Free format text: ENTITY STATUS SET TO UNDISCOUNTED (ORIGINAL EVENT CODE: BIG.); ENTITY STATUS OF PATENT OWNER: LARGE ENTITY |
|
| FEPP | Fee payment procedure |
Free format text: ENTITY STATUS SET TO SMALL (ORIGINAL EVENT CODE: SMAL); ENTITY STATUS OF PATENT OWNER: LARGE ENTITY |
|
| AS | Assignment |
Owner name: THOUSANDEYES, INC., CALIFORNIA Free format text: ASSIGNMENT OF ASSIGNORS INTEREST;ASSIGNORS:RODRIGUES, NELSON;ALESSANDRI, SANTIAGO;FREITAS, SERGIO;AND OTHERS;SIGNING DATES FROM 20190909 TO 20190911;REEL/FRAME:052795/0342 |
|
| STPP | Information on status: patent application and granting procedure in general |
Free format text: NON FINAL ACTION MAILED |
|
| AS | Assignment |
Owner name: THOUSANDEYES LLC, DELAWARE Free format text: CHANGE OF NAME;ASSIGNOR:THOUSANDEYES, INC.;REEL/FRAME:054476/0337 Effective date: 20200811 |
|
| FEPP | Fee payment procedure |
Free format text: ENTITY STATUS SET TO UNDISCOUNTED (ORIGINAL EVENT CODE: BIG.); ENTITY STATUS OF PATENT OWNER: LARGE ENTITY |
|
| STPP | Information on status: patent application and granting procedure in general |
Free format text: NOTICE OF ALLOWANCE MAILED -- APPLICATION RECEIVED IN OFFICE OF PUBLICATIONS |
|
| STPP | Information on status: patent application and granting procedure in general |
Free format text: AWAITING TC RESP., ISSUE FEE NOT PAID |
|
| STPP | Information on status: patent application and granting procedure in general |
Free format text: NOTICE OF ALLOWANCE MAILED -- APPLICATION RECEIVED IN OFFICE OF PUBLICATIONS |
|
| STPP | Information on status: patent application and granting procedure in general |
Free format text: PUBLICATIONS -- ISSUE FEE PAYMENT RECEIVED |
|
| STPP | Information on status: patent application and granting procedure in general |
Free format text: PUBLICATIONS -- ISSUE FEE PAYMENT VERIFIED |
|
| AS | Assignment |
Owner name: CISCO TECHNOLOGY, INC., CALIFORNIA Free format text: ASSIGNMENT OF ASSIGNORS INTEREST;ASSIGNOR:THOUSANDEYES LLC;REEL/FRAME:056348/0993 Effective date: 20210519 |
|
| STCF | Information on status: patent grant |
Free format text: PATENTED CASE |
|
| FEPP | Fee payment procedure |
Free format text: MAINTENANCE FEE REMINDER MAILED (ORIGINAL EVENT CODE: REM.); ENTITY STATUS OF PATENT OWNER: LARGE ENTITY |
|
| LAPS | Lapse for failure to pay maintenance fees |
Free format text: PATENT EXPIRED FOR FAILURE TO PAY MAINTENANCE FEES (ORIGINAL EVENT CODE: EXP.); ENTITY STATUS OF PATENT OWNER: LARGE ENTITY |
|
| STCH | Information on status: patent discontinuation |
Free format text: PATENT EXPIRED DUE TO NONPAYMENT OF MAINTENANCE FEES UNDER 37 CFR 1.362 |
|
| FP | Lapsed due to failure to pay maintenance fee |
Effective date: 20250622 |