US11030246B2 - Fast and accurate graphlet estimation - Google Patents
Fast and accurate graphlet estimation Download PDFInfo
- Publication number
- US11030246B2 US11030246B2 US15/179,724 US201615179724A US11030246B2 US 11030246 B2 US11030246 B2 US 11030246B2 US 201615179724 A US201615179724 A US 201615179724A US 11030246 B2 US11030246 B2 US 11030246B2
- Authority
- US
- United States
- Prior art keywords
- graph
- graphlet
- pattern
- subgraph
- sampled
- Prior art date
- Legal status (The legal status is an assumption and is not a legal conclusion. Google has not performed a legal analysis and makes no representation as to the accuracy of the status listed.)
- Expired - Fee Related, expires
Links
Images

Classifications
-
- G—PHYSICS
- G06—COMPUTING OR CALCULATING; COUNTING
- G06F—ELECTRIC DIGITAL DATA PROCESSING
- G06F16/00—Information retrieval; Database structures therefor; File system structures therefor
- G06F16/90—Details of database functions independent of the retrieved data types
- G06F16/901—Indexing; Data structures therefor; Storage structures
- G06F16/9024—Graphs; Linked lists
-
- G—PHYSICS
- G06—COMPUTING OR CALCULATING; COUNTING
- G06N—COMPUTING ARRANGEMENTS BASED ON SPECIFIC COMPUTATIONAL MODELS
- G06N5/00—Computing arrangements using knowledge-based models
- G06N5/02—Knowledge representation; Symbolic representation
- G06N5/022—Knowledge engineering; Knowledge acquisition
-
- G06N7/005—
-
- G—PHYSICS
- G06—COMPUTING OR CALCULATING; COUNTING
- G06N—COMPUTING ARRANGEMENTS BASED ON SPECIFIC COMPUTATIONAL MODELS
- G06N7/00—Computing arrangements based on specific mathematical models
- G06N7/01—Probabilistic graphical models, e.g. probabilistic networks
Definitions
- the present disclosure relates to graphlet estimation. More specifically, this disclosure relates to a method and system for estimating graphlet statistics in a graph based on neighborhood sampling and combinatorial relations.
- Graphs are representations of edges, also known as links or connections, that connect a set of vertices, also known as nodes.
- Graphs also called networks
- Graphs are important for many applications, including analysis of large data sets such as social networks or consumer-product relationships, and applications in biology and computer science.
- Graphs are also frequently used to represent relationships between objects in a wide range of domains.
- the vertices may represent computers, proteins in a biological network, or road intersections
- the edges may represent communications, interactions, or roads between intersections in a road network.
- Many graph-computation methods exist, for various purposes, such as predicting relationships and making recommendations.
- large-scale graphs are difficult and time-consuming to analyze, understand, and model.
- graphs are generally analyzed in terms of their topological properties, it is useful to analyze graphs into smaller subgraph patterns called graphlets, defined by the number of vertices and the pattern of edges between them.
- graphlets are induced subgraphs of a large network and are important for understanding and modeling complex networks. Computing subgraph statistics, including counts of particular graphlets, is important, with applications across a wide variety of domains (e.g., bioinformatics, cheminformatics). Recently, graphlets have been shown to improve classification accuracy in domains with relatively small networks representing interactions between proteins and chemical molecules.
- One embodiment of the present invention provides a system and method for graphlet estimation.
- the system obtains a data structure indicating vertices and edges of a graph.
- the system may sample a portion of the graph.
- the system may count a number of graph features in the sampled portion of the graph.
- the system may then compute, based on applying a combinatorial relationship to the counted number of graph features, an occurrence frequency of a graphlet pattern in the sampled portion of the graph.
- the system may then compute, based on the computed occurrence frequency, a total number of graphlets associated with the graphlet pattern in the graph.
- the system may computing a related local or global subgraph statistic, including a connected graphlet frequency distribution (GFD), a disconnected GFD, a GFD with both connected and disconnected graphlets, a univariate statistic, a probability density function (PDF) for the graphlet pattern, a cumulative distribution function (CDF) for the graphlet pattern, or a complementary cumulative distribution function (CCDF) for the graphlet pattern.
- GFD connected graphlet frequency distribution
- CDF cumulative distribution function
- CCDF complementary cumulative distribution function
- the system may use adaptive graphlet estimation.
- the system may compute an objective function based on minimizing a loss function.
- the system may then update an error estimate based on the computed objective function.
- the system may compare the updated error estimate to a pre-specified error bound. Responsive to determining the error estimate exceeds the pre-specified error bound, the system may adjust the sampled portion of the graph to a minimal portion necessary to satisfy the pre-specified error bound.
- the sampled portion of the graph may comprise an edge neighborhood associated with an edge that connects a first vertex to a second vertex.
- the number of graph features in the sampled portion of the graph may comprise a number of triangles including the first and second vertices and a third vertex within the edge neighborhood.
- Computing the total number of graphlets may involve scaling up the occurrence frequency of the graphlet pattern to obtain an unbiased statistical estimator of the total number of graphlets.
- scaling up the occurrence frequency may involve scaling by a ratio relating a total number of edges in the graph to a number of sampled edge neighborhoods. Scaling up the occurrence frequency may further involve subtracting a second number of graphlets associated with a second graphlet pattern.
- the system may implement graphlet estimation in parallel, taking advantage of the independence of edge neighborhoods.
- the sampled portion of the graph may comprise a set of multiple sampled edge neighborhoods. Sampling the portion of the graph may involve assigning a respective sampled edge neighborhood to a respective processor in the set of processors. Counting the number of graph features in the sampled portion of the graph may involve independently counting, by a respective processor, a respective number of triangles within its respective assigned edge neighborhood. Computing the occurrence frequency of the graphlet pattern in the sampled portion of the graph may then involve summing partial occurrence frequencies among the multiple sampled edge neighborhoods.
- the graphlet pattern includes three or fewer vertices, and applying the combinatorial relationship is a constant-time computation.
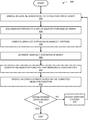
- FIG. 1A illustrates an example of a graph including graphlet patterns.
- FIG. 2 presents a block diagram illustrating an exemplary architecture of a graph computation system utilizing the graphlet estimation method, according to embodiments of the present invention.
- FIG. 3 presents a block diagram illustrating a method for graphlet estimation according to embodiments of the present invention.
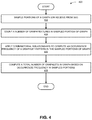
- FIG. 4 presents a block diagram illustrating a method for graphlet estimation according to embodiments of the present invention.
- FIG. 5 presents a block diagram illustrating a method for adaptive graphlet estimation within a pre-specified error bound, according to embodiments of the present invention.
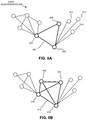
- FIG. 6A illustrates an exemplary edge neighborhood, including a triangle graphlet pattern.
- FIG. 6B illustrates an exemplary edge neighborhood, including a 4-clique graphlet pattern.
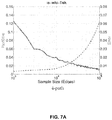
- FIG. 7A illustrates runtime and error performance of the present invention, based on experimental results.
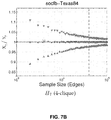
- FIG. 7B illustrates confidence intervals for graphlet estimates obtained by the present invention, based on experimental results.
- FIG. 8 presents a block diagram illustrating an exemplary apparatus for graphlet estimation, in accordance with embodiments of the present invention.
- FIG. 9 presents a block diagram illustrating an exemplary computer system for graphlet estimation, in accordance with embodiments of the present invention.
- Embodiments of the present invention solve the problem of fast, accurate, and scalable unbiased graphlet estimation by utilizing neighborhood sampling and combinatorial relations.
- the methods and systems disclosed herein can accurately estimate graphlet counts, statistics, and frequency distributions, operating in a small fraction of the computing time of existing systems.
- the obtained unbiased estimates are highly accurate, and have a wide variety of applications in the analysis, mining, and predictive modeling of massive real-world networks. These applications include anomaly detection, role discovery, classification, relational learning, graph similarity, and understanding and exploring large networks.
- the system obtains data indicating vertices and edges of a graph.
- the system samples a portion of the graph and counts a number of graph features in the sampled portion of the graph.
- the system then computes an occurrence frequency of a graphlet pattern and a total number of graphlets associated with the graphlet pattern in the graph.
- FIG. 1A illustrates an example of a graph including graphlet patterns.
- a graph 100 can include vertices such as 102 , also called nodes, and edges such as 104 , also called links or connections. Because graphs may frequently be analyzed in terms of their topological properties, it is useful to analyze graphs into smaller subgraph patterns defined by the number of vertices and the pattern of edges between them.
- a graph can include smaller vertex-induced subgraphs, also called graphlets.
- 112 is the 2-node-independent graphlet pattern, as formed by vertices 106 and 108 in FIG. 1A .
- 114 is the triangle, as participated in by vertex 102 .
- 116 is the 3-star, as participated in by vertex 110 . Note that the methods disclosed herein may be generalized to estimate statistics of graphlets of an arbitrary size k, including k>4, as discussed later.
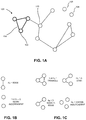
- a graphlet may be referred to as connected if there is a path from any vertex to any other vertex in the graphlet, either direct (single-edge) or indirect (multiple edges). Otherwise, the graphlet may be referred to as disconnected. Specifically, graphlets H 1 of FIG. 1B , H 3 and H 4 of FIG. 1C , and H 7 through H 12 of FIG. 1D are connected.
- FIG. 2 presents a block diagram illustrating an exemplary architecture of a graph computation system 200 utilizing the graphlet estimation method, according to an embodiment of the present invention.
- a graph computation system 200 may divide the vertices of a graph and estimate graphlet statistics in a graph, according to embodiments, in parallel with multiple processors. In standard systems, system 200 would require very significant computational cost and space to compute graphlet statistics. However, using the methods disclosed herein, system 200 enables the user to estimate graphlet statistics accurately in far less time and space, and scalably.
- Graph computation system 200 may include a graphlet estimation module 202 installed on a storage device 204 coupled to a server 206 .
- graph management module 202 may include a graph-sampling module or other components of graphlet estimation system 200 to perform the techniques described herein.
- System 200 may receive data describing vertices and edges, and store such data in storage device 204 .
- System 200 may read the code for graph management module 202 and the data for vertices and edges 208 from storage device 204 .
- System 200 may divide graph neighborhoods or portions of graphs, and assign them to processors, such as processors 210 A- 210 H, which operate on the assigned neighborhoods or portions.
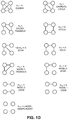
- FIG. 3 presents a flowchart 300 illustrating a method to estimate graphlet statistics based on sampling a graph, according to embodiments of the present invention.
- the system samples an edge neighborhood or other portion of a graph (operation 302 ).
- the system samples portions of a graph via uniform discrete sampling, according to a sampling probability.
- the system may sample edge neighborhoods by uniformly sampling edges from the set of all edges in the graph, according to a probability p.
- p may be specified by a user.
- the system uses weighted sampling or an arbitrary sampling probability distribution p i for graphlet pattern H i .
- the system uses weighted sampling to bias estimation towards certain properties or characteristics.
- the system uses other sampling criteria, for example sampling edges via a k-core distribution or triangle-core distribution, in ascending or descending order.
- the system samples a predetermined number of edge neighborhoods or other portions of a graph.
- the system may adjust the sampling criteria adaptively in order to satisfy a desired error bound, as described later in this disclosure.
- the system may perform sampling with replacement (i.e., allowing the same edge neighborhood to be sampled multiple times within the graphlet estimation computation) or without replacement (i.e., sampling an edge no more than once within the graphlet estimation).
- the system may then add the sampled portion to a set of sampled portions of the graph (operation 304 ).
- the system may then determine whether sufficient portions have been sampled (operation 306 ). This determination may proceed, for example, by sampling every edge neighborhood or other portion of the graph according to a sampling probability. In some embodiments, determination 306 may proceed by sampling until a predetermined number of edge neighborhoods or portions have been sampled. In some embodiments, determination 306 may proceed according to an adaptive estimation method, such as method 500 described below. Responsive to determining that insufficient portions have been sampled, the system may then repeat the process starting from sampling operation 302 .
- the system may compute graphlet statistics in the sampled portions (operation 308 ). The system may then estimate graphlet statistics or distributions for the graph as a whole based on the computed statistics in the sampled portions (operation 310 ).
- Exemplary graphlet statistics computed according to embodiments of the present invention may include counts of a specific graphlet pattern.
- the system may compute graphlet frequency distributions (GFD) including the connected GFD, disconnected GFD, and GFD with both connected and disconnected graphlets.
- GFD graphlet frequency distributions
- the system computes univariate statistics for a graphlet pattern, such as mean, median, minimum, maximum, range, variance, standard deviation, median deviation, a quartile (such as Q1 or Q3) or other quantile, interquartile range (IQR), etc.
- the system may compute probability distributions such as a probability density function (PDF), cumulative distribution function (CDF), or complementary cumulative distribution function (CCDF) for a particular graphlet pattern. For instance, based on the number of 4-cliques per edge: for each edge e in the graph, the system may compute the number of 4-cliques centered at edge e, denoted C i .
- the system may add 1 to bin[C i ] where bin[C i ] represents the number of edges with C i 4-cliques.
- the system may receive a specification of the graphlet statistics to estimate as input from a user.
- FIG. 4 presents a flowchart 400 illustrating details of a method to estimate graphlet statistics given sampled portions of a graph, according to embodiments of the present invention.
- the system samples an edge neighborhood or other portion of a graph (operation 402 ).
- the system may receive the sampled portions of the graph from method 300 .
- the system may then count a number of graph features in the sampled portions of the graph (operation 404 ).
- the counted graph features are triangles and 2-stars.
- the counted graph features are 4-cliques and 4-cycles.
- the methods disclosed here may be generalized to estimate graphlets of an arbitrary size k, including k>4.
- the system may directly compute the k-graphlets by leveraging k ⁇ 1 graphlet patterns (lower order subgraph counts). From this small set, k-cliques and/or k-cycles may be computed and combinatorial relationships may be used to compute the other k-graphlet counts directly in constant time.
- This method is significantly faster (by an order of magnitude) than prior approaches and counts all graphlets of size k by directly enumerating only graphlets of size k ⁇ 1. This method systematically builds a system of equations, that is, it derives linear relationships between the counts of various graphlet patterns.
- the counts of the k-graphlets are computed directly through a system of equations representing the dependencies between various k-graphlets using counts for the k ⁇ 1 graphlets. Note that given a vertex v belonging to a k-vertex graphlet g i , it also participates in a k ⁇ 1 graphlet. Thus, every k-vertex graphlet can be constructed by adding a vertex to a k ⁇ 1 graphlet.
- the system may apply combinatorial relationships to compute an occurrence frequency of a graphlet pattern in the sampled portions of the graph (operation 406 ).
- the system may then compute a total number of graphlets associated with the graphlet pattern in the graph based on the computed occurrence frequency in the sampled portions of the graph (operation 408 ).
- the system may compute other graphlet statistics associated with the graphlet pattern.
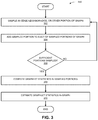
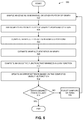
- FIG. 5 presents a flowchart 500 illustrating a method to estimate graphlet statistics adaptively within a pre-specified error bound, according to embodiments of the present invention.
- method 500 may be understood as providing more detail of decision 306 , i.e. the decision whether sufficient portions have been sampled from the graph, during method 300 .
- method 500 uses a variance between successive graphlet estimates as a proxy for the error in an estimate.
- the system samples an edge neighborhood or other portion of a graph (operation 502 ).
- the system then adds the sampled portion to a set of sampled portions of the graph (operation 504 ).
- the system may then compute graphlet statistics in the sampled portions of the graph (operation 506 ) and estimate graphlet counts, statistics, or distributions in the full graph (operation 508 ).
- the system may then compute an objective function to minimize an arbitrary loss function (operation 510 ).
- the loss function may be a Kolmogorov-Smirnov (KS) statistic quantifying the distance between two cumulative distribution functions (CDF).
- KS Kolmogorov-Smirnov
- the loss function may be a KL divergence between a first distribution P and a second distribution P′.
- the loss function may be a Skew-divergence (SD) approximating KL divergence by smoothing a first distribution P with respect to a second distribution P′.
- smoothing may be determined by a parameter 0 ⁇ 1.
- the loss function may be a normalized L 1 distance, which is a relative error between the estimated graphlet statistics and the true values, averaged over graphlet patterns.
- the loss function may be a squared loss, which is a sum over graphlet patterns of squared error between the estimated graphlet statistics and the true values.
- the system may then update an error estimate based on the computed objective function (operation 512 ).
- the system may then determine whether the error estimate is within a desired error bound (operation 514 ).
- the desired error bound may be pre-specified by a user. Responsive to determining that the error estimate is not within the desired error bound, the system may adjust the sampling criteria (operation 516 ) and return to operation 502 , i.e. sampling additional portions of the graph.
- adjusting the sampling criteria may involve adjusting a total number
- of samples may further involve increasing
- the system may then return the estimated graphlet statistics.
- An edge neighborhood (also called an edge-induced neighborhood) is defined as an edge e, the two vertices u and v connected by the edge, and the subgraph induced by these two vertices. That is, the edge neighborhood includes all neighbors of the two vertices u and v and all edges connecting them.
- the system samples the graph by sampling edges and their associated edge neighborhoods.
- FIG. 6A illustrates an exemplary edge neighborhood 600 based on edge 602 connecting vertices 604 and 606 .
- Exemplary edge neighborhood 600 is the subgraph induced by vertices 604 and 606 , i.e. neighborhood 600 includes all neighbors of vertices 604 and 606 and all the edges connecting them.
- the system may sample edge-induced s-neighborhoods, where s represents the distance (in number of edges or ‘hops’) of vertices from u and v to be included in the neighborhood.
- s represents the distance (in number of edges or ‘hops’) of vertices from u and v to be included in the neighborhood.
- a sampled edge neighborhood may contain a number of graphlets.
- the system counts triangles and 2-stars that are located in a sampled edge neighborhood, and that contain both vertices u and v defining the edge.
- edge neighborhood 600 is defined by vertices 604 and 606 .
- neighborhood 600 includes vertex 608 , which is connected to both vertices 604 and 606 , and therefore completes a triangle with these vertices.
- vertices 610 , 612 , and 614 all complete 2-stars with vertices 604 and 606 , as shown.
- the system would count all of these graphlets belonging to neighborhood 600 .
- the system may count triangles by identifying vertices, such as 608 , connected to both vertices u and v defining the edge neighborhood. In some embodiments, the system may store a set T e of such vertices in memory or non-transitory storage. In some embodiments, the system may count 2-stars by identifying vertices, such as 610 , connected to one vertex u or v defining the edge neighborhood, but not the other. In some embodiments, the system may store sets S u and S v of such vertices in memory or non-transitory storage.
- the system may also count 4-cliques and 4-cycles in the edge neighborhood that contain both vertices defining the edge.
- FIG. 6B illustrates an exemplary edge neighborhood defined by edge 616 connecting vertices 618 and 620 . As shown by dark lines in the figure, vertices 622 and 624 complete a 4-clique graphlet with vertices 618 and 620 . In some embodiments, the system would count all such 4-clique graphlets as well as 4-cycle graphlets belonging to a sampled edge neighborhood.
- the system makes use of previously-counted triangles and 2-stars in order to expedite counting the 4-cliques and 4-cycles.
- the system may pre-compute triangle-core numbers, numbers of triangles or 2-stars, or the sets T e , S u , and S v for all needed portions of the graph (for example all sampled edges), and store these results in memory or non-transitory storage.
- the system may compute the number of 4-cliques by identifying vertices in the set T e (i.e. vertices completing triangles with u and v) that are connected to each other.
- the system computes the number of 4-cycles by identifying vertices in the set S u (i.e. those completing 2-stars with u) that are connected to vertices in the set S v (i.e. those completing 2-stars with v). In some embodiments, the system parallelizes these computations via edge neighborhoods (which can be computed entirely independently of each other). In some embodiments, the system parallelizes these computations within the edge neighborhoods or other sampled portions of the graph.
- the system computes numbers of all patterns of graphlets containing k or fewer vertices in the sampled portions of the graph, for example in sampled edge neighborhoods.
- k 4, but note that the methods disclosed herein may be generalized to estimate graphlets of an arbitrary size k (by leveraging k ⁇ 1 graphlet patterns).
- the graphlet counts in the sampled portions are herein referred to as C i , where the subscript i refers to a particular graphlet pattern, as illustrated in FIGS. 1B, 1C, and 1D .
- the system may also obtain the 2-star counts through direct counting.
- the system uses the following combinatorial relations to obtain exact graphlet counts within an edge neighborhood.
- the relations listed below include both connected and disconnected graphlet patterns. (Note that here
- S u and S v refer to the sets of vertices completing 2-stars centered at u and v, respectively;
- ⁇ (u) and ⁇ (v) are the sets of vertices connected to u and v, but excluding u and v, respectively;
- d u and d v are the degrees of u and v, respectively; and
- n and m are the numbers
- the counts C i obtained from these combinatorial formulas are not counts of the corresponding graphlet pattern i. Instead, they may be intermediate values that must be processed further to obtain the graphlet counts.
- the total count of chordal-cycle graphlets (type H 8 in FIG. 1D ) is related to C 8 ⁇ C 7 , rather than C 8 directly.
- substituting the C i as computed here into the scaling-up formulas given below will result in estimates X i of numbers of graphlets in the full graph.
- the graphlet counts in the sampled portions are herein referred to as C i , where the subscript i refers to a graphlet type, as in FIGS. 1B, 1C, and 1D .
- the scaled-up graphlet count estimates are herein referred to as X i
- the true full-graph counts as Y i .
- the system obtains the exact counts C i by direct counting for the triangles, 4-cliques, and 4-cycles, whereas the 2-stars and 3-node-1-edge counts may be obtained through combinatorial relations, as described above. In some embodiments, the system may also obtain the 2-star counts through direct counting.
- scaling up the graphlet counts C i to full-graph estimates X i may be more complex.
- the remaining graphlet patterns are not counted directly in the sampled portions of the graphs. Instead, as described above, in some embodiments, the system applies combinatorial relations to infer these remaining graphlet counts C i from already-computed ones in constant time.
- the system may estimate the remaining full-graph statistics, such as X i , directly from already-computed values in constant time.
- the remaining graphlet patterns the following formulas may be used for scaling-up the graphlet counts.
- FIG. 7A shows exemplary runtime and error performance of the present invention, based on experimental results obtained by the inventors using adaptive estimation methods like in method 500 .
- the system can trade off greater accuracy in exchange for better computational speed, while still performing very well with respect to both of these criteria. As illustrated, greater accuracy was obtained by increasing the sample size, whereas faster computation time was achieved by decreasing the sample size.
- the inventors also performed a large trial of estimating graphlet statistics in a variety of large sparse graphs and dense graphs, including networks with millions or even over a billion edges.
- the accuracy of the disclosed method relative to the true graphlet statistics was generally found to be 0.1% or better.
- the disclosed method was found (averaged over 300 graphs) to be over 200,000 times faster than prior methods. In many instances, the disclosed method took less than one second to obtain estimates with better than 0.1% accuracy for each graphlet pattern, whereas prior methods exceeded a day to process the same graphs.
- the disclosed methods may parallelize extremely well because the sampled portions, such as edge neighborhoods, may be sampled and processed independently by separate processing units.
- the inventors' experimental results for several large networks showed very good parallel scaling, with parallel speedup (decrease in elapsed computational time) of 12 to 15 times on 16 cores.
- the system may provide an unbiased statistical estimator X i of graphlet statistics Y i in the full graph. Therefore, confidence intervals may be given as: X i ⁇ ⁇ Y i ⁇ X i +
- the inventors' experimental results for numerous large networks showed that the confidence intervals were centered and balanced over the true graph statistic. Upper and lower bounds always contained the true value. As the sample size increased, the bounds converged to the actual value of the graphlet statistic. Confidence bounds were within ⁇ 5% of the true value for all graphs and subgraph patterns.
- FIG. 7B illustrates confidence intervals for graphlet estimates obtained by the present invention, based on experimental results.
- FIG. 7B shows typical exemplary results, with 95% confidence bounds within approximately ⁇ 2.5% of the true value for a sample size of just 40,000 sampled edge neighborhoods (vertical dashed line).
- the circles show the estimated full-graph number of 4-cliques relative to the exact number, X 7 /Y 7 , and the downward- and upward-facing triangles represent the upper and lower bounds of the 95% confidence interval, respectively.
- the system disclosed herein is useful for a wide variety of applications including anomaly detection, role discovery, classification, relational learning, graph similarity, and as a tool for understanding and exploring large networks.
- the present invention can support real-time interactive queries for visual graph mining, learning and extracting roles, exploratory analysis, and predictive modeling tasks (such as relational classification and anomaly detection).
- the estimated local graphlets may be used to quickly spot large cliques and stars based on the 4-vertex graphlets.
- these large cliques and stars can often be used to spot and visually identify the largest possible clique and star in the graph. This is particularly remarkable since the maximum clique problem is well-known as an NP-hard problem with many applications.
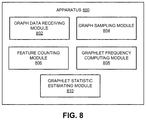
- FIG. 8 presents a block diagram illustrating an exemplary apparatus 800 that facilitates graphlet estimation, in accordance with some embodiments.
- Apparatus 800 can comprise a plurality of modules which may communicate with one another via a wired or wireless communication channel.
- Apparatus 800 may be realized using one or more integrated circuits, and may include fewer or more modules than those shown in FIG. 8 .
- apparatus 800 may be integrated in a computer system, or realized as a separate device which is capable of communicating with other computer systems and/or devices.
- apparatus 800 can comprise a graph data-receiving module 802 , a graph-sampling module 804 , a feature-counting module 806 , a graphlet frequency-computing module 808 , and a graphlet statistic-estimating module 810 .
- apparatus 800 may also include additional modules not depicted in FIG. 8 .
- graph data-receiving module 802 can receive data comprising a representation of vertices and edges of a graph.
- Graph-sampling module 804 may sample edge neighborhoods or other portions of the graph.
- Feature-counting module 806 may obtain an exact count of graph features in the sampled portions of the graph, for example, k-graphlets such as triangles, 2-stars, 4-cliques, or 4-cycles.
- Graphlet frequency-computing module 808 may compute, based on applying combinatorial relationships to the counted graph features, the occurrence frequency of graphlet patterns in the sampled portions of the graph.
- Graphlet statistic-estimating module 810 may compute a total number of graphlets in the graph, or other graphlet statistics or distributions. Note that graphlet estimation module 202 illustrated in FIG. 2 may provide any and all functions of the various modules depicted in FIG. 8 .
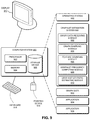
- FIG. 9 illustrates an exemplary graphlet estimation computer system 900 , in accordance with some embodiments.
- computer system 900 may be a server.
- system 900 includes a processor 902 , a memory 904 , and a storage device 906 .
- 902 may include a set of processors.
- Storage device 906 may store a number of applications, such as applications 914 and 916 , which may make use of graphlet estimation according to embodiments of the present invention, and operating system 922 .
- Storage device 906 also stores graphlet estimation system 908 that may include a graph data-receiving module 802 , a graph-sampling module 804 , a feature-counting module 806 , a graphlet frequency-computing module 808 , and a graphlet statistic-estimating module 810 .
- System 900 and/or graph data-receiving module 802 may receive or generate graph data 930 comprising vertices and edges data and may copy graph data to a memory section accessible to graphlet estimation system 908 .
- one or more applications such as graphlet estimation system 908 , are loaded from storage device 906 into memory 904 and then executed by processor set 902 . While executing the program, processor set 902 performs the aforementioned functions.
- System 900 may be coupled to a display 910 , a keyboard 918 , and a pointing device 920 .
- graph data-receiving module 802 can receive data comprising a representation of vertices and edges of a graph.
- Graph-sampling module 804 may sample edge neighborhoods or other portions of the graph.
- Feature-counting module 806 may obtain an exact count of graph features in the sampled portions of the graph, for example, k-graphlets such as triangles, 2-stars, 4-cliques, or 4-cycles.
- Graphlet frequency-computing module 808 may compute, based on applying combinatorial relationships to the counted graph features, the occurrence frequency of graphlet patterns in the sampled portions of the graph.
- Graphlet statistic-estimating module 810 may compute a total number of graphlets in the graph, or other graphlet statistics or distributions. Note that graphlet estimation module 202 illustrated in FIG. 2 may provide any and all functions of the various modules depicted in FIG. 9 .
- the data structures and code described in this detailed description are typically stored on a computer-readable storage medium, which may be any device or medium that can store code and/or data for use by a computer system.
- the computer-readable storage medium includes, but is not limited to, volatile memory, non-volatile memory, magnetic and optical storage devices such as disk drives, magnetic tape, CDs (compact discs), DVDs (digital versatile discs or digital video discs), or other media capable of storing computer-readable media now known or later developed.
- the methods and processes described in the detailed description section can be embodied as code and/or data, which can be stored in a computer-readable storage medium as described above.
- a computer system reads and executes the code and/or data stored on the computer-readable storage medium, the computer system performs the methods and processes embodied as data structures and code and stored within the computer-readable storage medium.
- modules or apparatus may include, but are not limited to, an application-specific integrated circuit (ASIC) chip, a field-programmable gate array (FPGA), a dedicated or shared processor that executes a particular software module or a piece of code at a particular time, and/or other programmable-logic devices now known or later developed.
- ASIC application-specific integrated circuit
- FPGA field-programmable gate array
- the hardware modules or apparatus When activated, they perform the methods and processes included within them.
Landscapes
- Engineering & Computer Science (AREA)
- Theoretical Computer Science (AREA)
- Physics & Mathematics (AREA)
- General Engineering & Computer Science (AREA)
- General Physics & Mathematics (AREA)
- Data Mining & Analysis (AREA)
- Software Systems (AREA)
- Artificial Intelligence (AREA)
- Evolutionary Computation (AREA)
- Databases & Information Systems (AREA)
- Mathematical Physics (AREA)
- Computing Systems (AREA)
- Computational Linguistics (AREA)
- Computational Mathematics (AREA)
- Pure & Applied Mathematics (AREA)
- Mathematical Optimization (AREA)
- Mathematical Analysis (AREA)
- Algebra (AREA)
- Probability & Statistics with Applications (AREA)
- Complex Calculations (AREA)
- Computer Vision & Pattern Recognition (AREA)
Abstract
Description
is the binomial coefficient:
Te refers to the set of vertices completing triangles with the edge e=(u, v) that defines the edge neighborhood; Su and Sv refer to the sets of vertices completing 2-stars centered at u and v, respectively; Γ(u) and Γ(v) are the sets of vertices connected to u and v, but excluding u and v, respectively; du and dv are the degrees of u and v, respectively; and n and m are the numbers |V| of vertices and |E| of edges in the graph, respectively).
X i=(C i |E|)/(|J|E i), with i=3, 4, 5, 7, or 10.
is the binomial coefficient
and Ci refer to the graphlet counts as obtained from the formulas given above).
X i −
Here
Claims (20)
Priority Applications (1)
| Application Number | Priority Date | Filing Date | Title |
|---|---|---|---|
| US15/179,724 US11030246B2 (en) | 2016-06-10 | 2016-06-10 | Fast and accurate graphlet estimation |
Applications Claiming Priority (1)
| Application Number | Priority Date | Filing Date | Title |
|---|---|---|---|
| US15/179,724 US11030246B2 (en) | 2016-06-10 | 2016-06-10 | Fast and accurate graphlet estimation |
Publications (2)
| Publication Number | Publication Date |
|---|---|
| US20170357905A1 US20170357905A1 (en) | 2017-12-14 |
| US11030246B2 true US11030246B2 (en) | 2021-06-08 |
Family
ID=60572913
Family Applications (1)
| Application Number | Title | Priority Date | Filing Date |
|---|---|---|---|
| US15/179,724 Expired - Fee Related US11030246B2 (en) | 2016-06-10 | 2016-06-10 | Fast and accurate graphlet estimation |
Country Status (1)
| Country | Link |
|---|---|
| US (1) | US11030246B2 (en) |
Cited By (2)
| Publication number | Priority date | Publication date | Assignee | Title |
|---|---|---|---|---|
| US11841904B1 (en) * | 2021-11-24 | 2023-12-12 | Government Of The United States, As Represented By The Director, National Security Agency | Detection of coactively linked topological structures in networks and databases |
| US11868916B1 (en) * | 2016-08-12 | 2024-01-09 | Snap Inc. | Social graph refinement |
Families Citing this family (8)
| Publication number | Priority date | Publication date | Assignee | Title |
|---|---|---|---|---|
| US10015182B1 (en) * | 2016-06-30 | 2018-07-03 | Symantec Corporation | Systems and methods for protecting computing resources |
| US11341138B2 (en) * | 2017-12-06 | 2022-05-24 | International Business Machines Corporation | Method and system for query performance prediction |
| US10877979B2 (en) * | 2018-01-16 | 2020-12-29 | Accenture Global Solutions Limited | Determining explanations for predicted links in knowledge graphs |
| US10728104B2 (en) * | 2018-11-15 | 2020-07-28 | Adobe Inc. | Time-dependent network embedding |
| US11068458B2 (en) * | 2018-11-27 | 2021-07-20 | Advanced Micro Devices, Inc. | Mechanism for distributed-system-aware difference encoding/decoding in graph analytics |
| US11170048B2 (en) * | 2019-06-25 | 2021-11-09 | Adobe Inc. | System for identifying typed graphlets |
| US11483408B2 (en) | 2019-07-10 | 2022-10-25 | Adobe Inc. | Feature-based network embedding |
| US11343325B2 (en) * | 2020-08-31 | 2022-05-24 | Adobe Inc. | Systems and methods for estimating typed graphlets in large data |
Citations (12)
| Publication number | Priority date | Publication date | Assignee | Title |
|---|---|---|---|---|
| US20040204925A1 (en) * | 2002-01-22 | 2004-10-14 | Uri Alon | Method for analyzing data to identify network motifs |
| US20070239694A1 (en) * | 2006-02-27 | 2007-10-11 | Singh Ambuj K | Graph querying, graph motif mining and the discovery of clusters |
| US7558768B2 (en) * | 2005-07-05 | 2009-07-07 | International Business Machines Corporation | Topological motifs discovery using a compact notation |
| US20090315890A1 (en) * | 2008-06-18 | 2009-12-24 | International Business Machines Corporation | Method for enumerating cliques |
| US20100198761A1 (en) * | 2009-01-30 | 2010-08-05 | Meng Teresa H | Systems, methods and circuits for learning of relation-based networks |
| US20120005238A1 (en) * | 2008-12-12 | 2012-01-05 | Tony Jebara | Machine optimization devices, methods, and systems |
| US8533182B1 (en) * | 2012-05-31 | 2013-09-10 | David P. Charboneau | Apparatuses, systems, and methods for efficient graph pattern matching and querying |
| US20140129320A1 (en) * | 2011-04-05 | 2014-05-08 | The Trustees Of Columbia University In The City Of New York | B-matching using sufficient selection belief propagation |
| US20140222506A1 (en) * | 2008-08-22 | 2014-08-07 | Fair Isaac Corporation | Consumer financial behavior model generated based on historical temporal spending data to predict future spending by individuals |
| US20140280224A1 (en) * | 2013-03-15 | 2014-09-18 | Stanford University | Systems and Methods for Recommending Relationships within a Graph Database |
| US20150026103A1 (en) * | 2013-07-22 | 2015-01-22 | International Business Machines Corporation | Automatic detection of anomalies in graphs |
| US20150178405A1 (en) * | 2013-12-23 | 2015-06-25 | Oracle International Corporation | Finding common neighbors between two nodes in a graph |
-
2016
- 2016-06-10 US US15/179,724 patent/US11030246B2/en not_active Expired - Fee Related
Patent Citations (12)
| Publication number | Priority date | Publication date | Assignee | Title |
|---|---|---|---|---|
| US20040204925A1 (en) * | 2002-01-22 | 2004-10-14 | Uri Alon | Method for analyzing data to identify network motifs |
| US7558768B2 (en) * | 2005-07-05 | 2009-07-07 | International Business Machines Corporation | Topological motifs discovery using a compact notation |
| US20070239694A1 (en) * | 2006-02-27 | 2007-10-11 | Singh Ambuj K | Graph querying, graph motif mining and the discovery of clusters |
| US20090315890A1 (en) * | 2008-06-18 | 2009-12-24 | International Business Machines Corporation | Method for enumerating cliques |
| US20140222506A1 (en) * | 2008-08-22 | 2014-08-07 | Fair Isaac Corporation | Consumer financial behavior model generated based on historical temporal spending data to predict future spending by individuals |
| US20120005238A1 (en) * | 2008-12-12 | 2012-01-05 | Tony Jebara | Machine optimization devices, methods, and systems |
| US20100198761A1 (en) * | 2009-01-30 | 2010-08-05 | Meng Teresa H | Systems, methods and circuits for learning of relation-based networks |
| US20140129320A1 (en) * | 2011-04-05 | 2014-05-08 | The Trustees Of Columbia University In The City Of New York | B-matching using sufficient selection belief propagation |
| US8533182B1 (en) * | 2012-05-31 | 2013-09-10 | David P. Charboneau | Apparatuses, systems, and methods for efficient graph pattern matching and querying |
| US20140280224A1 (en) * | 2013-03-15 | 2014-09-18 | Stanford University | Systems and Methods for Recommending Relationships within a Graph Database |
| US20150026103A1 (en) * | 2013-07-22 | 2015-01-22 | International Business Machines Corporation | Automatic detection of anomalies in graphs |
| US20150178405A1 (en) * | 2013-12-23 | 2015-06-25 | Oracle International Corporation | Finding common neighbors between two nodes in a graph |
Non-Patent Citations (3)
| Title |
|---|
| Ahmed et al., "Graphlet Decomposition: Framework, Algorithms, and Applications", Feb. 15, 2016. |
| Bordino, "Mining large network with subgraph count", 2008, 2008 International Eight IEEE Internation Conference on Data Mining (Year: 2008). * |
| Leskovec, "Sampling from Large Graphs", 2006, SIGKDD International Conference on Knowledge Discovery and Data Mining (Year : 2006). * |
Cited By (2)
| Publication number | Priority date | Publication date | Assignee | Title |
|---|---|---|---|---|
| US11868916B1 (en) * | 2016-08-12 | 2024-01-09 | Snap Inc. | Social graph refinement |
| US11841904B1 (en) * | 2021-11-24 | 2023-12-12 | Government Of The United States, As Represented By The Director, National Security Agency | Detection of coactively linked topological structures in networks and databases |
Also Published As
| Publication number | Publication date |
|---|---|
| US20170357905A1 (en) | 2017-12-14 |
Similar Documents
| Publication | Publication Date | Title |
|---|---|---|
| US11030246B2 (en) | Fast and accurate graphlet estimation | |
| Nunes et al. | On optimal selection of summary statistics for approximate Bayesian computation. | |
| Tan et al. | A convex formulation for high-dimensional sparse sliced inverse regression | |
| Vidaurre et al. | A survey of L1 regression | |
| Croux et al. | Robust and sparse estimation of the inverse covariance matrix using rank correlation measures | |
| US8458104B2 (en) | System and method for solving multiobjective optimization problems | |
| US20230281363A1 (en) | Optimal materials and devices design using artificial intelligence | |
| Kwak et al. | An incremental clustering-based fault detection algorithm for class-imbalanced process data | |
| US10067746B1 (en) | Approximate random number generator by empirical cumulative distribution function | |
| Guinness | Spectral density estimation for random fields via periodic embeddings | |
| US11343325B2 (en) | Systems and methods for estimating typed graphlets in large data | |
| EP3989087A1 (en) | Computational inference | |
| Sun et al. | Meta-learning control variates: Variance reduction with limited data | |
| Buckby et al. | Finding the number of latent states in hidden Markov models using information criteria | |
| Dayan et al. | Expressivity of geometric inhomogeneous random graphs—metric and non-metric | |
| Yang et al. | Covariance matrix estimation for high-throughput biomedical data with interconnected communities | |
| US11410749B2 (en) | Stable genes in comparative transcriptomics | |
| Thorsley et al. | Approximating stochastic biochemical processes with Wasserstein pseudometrics | |
| Mirzaei et al. | An empirical bernstein inequality for dependent data in hilbert spaces and applications | |
| Xu et al. | Inverse finite-size scaling for high-dimensional significance analysis | |
| Nakano | Hybrid algorithm of ensemble transform and importance sampling for assimilation of non-Gaussian observations | |
| He et al. | An incremental kernel density estimator for data stream computation | |
| Chatzinakos et al. | Optimization techniques for robust multivariate location and scatter estimation | |
| Cheng et al. | Online robust estimation and bootstrap inference for function-on-scalar regression | |
| Wang et al. | Multilevel Stochastic Optimization for Imputation in Massive Medical Data Records |
Legal Events
| Date | Code | Title | Description |
|---|---|---|---|
| AS | Assignment |
Owner name: PALO ALTO RESEARCH CENTER INCORPORATED, CALIFORNIA Free format text: ASSIGNMENT OF ASSIGNORS INTEREST;ASSIGNORS:ROSSI, RYAN A.;ZHOU, RONG;REEL/FRAME:038923/0602 Effective date: 20160608 |
|
| STPP | Information on status: patent application and granting procedure in general |
Free format text: DOCKETED NEW CASE - READY FOR EXAMINATION |
|
| STPP | Information on status: patent application and granting procedure in general |
Free format text: PRE-INTERVIEW COMMUNICATION MAILED |
|
| STPP | Information on status: patent application and granting procedure in general |
Free format text: RESPONSE TO NON-FINAL OFFICE ACTION ENTERED AND FORWARDED TO EXAMINER |
|
| STPP | Information on status: patent application and granting procedure in general |
Free format text: NON FINAL ACTION MAILED |
|
| STPP | Information on status: patent application and granting procedure in general |
Free format text: RESPONSE TO NON-FINAL OFFICE ACTION ENTERED AND FORWARDED TO EXAMINER |
|
| STPP | Information on status: patent application and granting procedure in general |
Free format text: FINAL REJECTION MAILED |
|
| STPP | Information on status: patent application and granting procedure in general |
Free format text: DOCKETED NEW CASE - READY FOR EXAMINATION |
|
| STPP | Information on status: patent application and granting procedure in general |
Free format text: NON FINAL ACTION MAILED |
|
| STPP | Information on status: patent application and granting procedure in general |
Free format text: RESPONSE TO NON-FINAL OFFICE ACTION ENTERED AND FORWARDED TO EXAMINER |
|
| STPP | Information on status: patent application and granting procedure in general |
Free format text: FINAL REJECTION MAILED |
|
| STPP | Information on status: patent application and granting procedure in general |
Free format text: NOTICE OF ALLOWANCE MAILED -- APPLICATION RECEIVED IN OFFICE OF PUBLICATIONS |
|
| STPP | Information on status: patent application and granting procedure in general |
Free format text: PUBLICATIONS -- ISSUE FEE PAYMENT RECEIVED |
|
| STPP | Information on status: patent application and granting procedure in general |
Free format text: PUBLICATIONS -- ISSUE FEE PAYMENT VERIFIED |
|
| STCF | Information on status: patent grant |
Free format text: PATENTED CASE |
|
| AS | Assignment |
Owner name: XEROX CORPORATION, CONNECTICUT Free format text: ASSIGNMENT OF ASSIGNORS INTEREST;ASSIGNOR:PALO ALTO RESEARCH CENTER INCORPORATED;REEL/FRAME:064038/0001 Effective date: 20230416 |
|
| AS | Assignment |
Owner name: CITIBANK, N.A., AS COLLATERAL AGENT, NEW YORK Free format text: SECURITY INTEREST;ASSIGNOR:XEROX CORPORATION;REEL/FRAME:064760/0389 Effective date: 20230621 |
|
| AS | Assignment |
Owner name: XEROX CORPORATION, CONNECTICUT Free format text: CORRECTIVE ASSIGNMENT TO CORRECT THE REMOVAL OF US PATENTS 9356603, 10026651, 10626048 AND INCLUSION OF US PATENT 7167871 PREVIOUSLY RECORDED ON REEL 064038 FRAME 0001. ASSIGNOR(S) HEREBY CONFIRMS THE ASSIGNMENT;ASSIGNOR:PALO ALTO RESEARCH CENTER INCORPORATED;REEL/FRAME:064161/0001 Effective date: 20230416 |
|
| AS | Assignment |
Owner name: JEFFERIES FINANCE LLC, AS COLLATERAL AGENT, NEW YORK Free format text: SECURITY INTEREST;ASSIGNOR:XEROX CORPORATION;REEL/FRAME:065628/0019 Effective date: 20231117 |
|
| AS | Assignment |
Owner name: XEROX CORPORATION, CONNECTICUT Free format text: TERMINATION AND RELEASE OF SECURITY INTEREST IN PATENTS RECORDED AT RF 064760/0389;ASSIGNOR:CITIBANK, N.A., AS COLLATERAL AGENT;REEL/FRAME:068261/0001 Effective date: 20240206 Owner name: CITIBANK, N.A., AS COLLATERAL AGENT, NEW YORK Free format text: SECURITY INTEREST;ASSIGNOR:XEROX CORPORATION;REEL/FRAME:066741/0001 Effective date: 20240206 |
|
| FEPP | Fee payment procedure |
Free format text: MAINTENANCE FEE REMINDER MAILED (ORIGINAL EVENT CODE: REM.); ENTITY STATUS OF PATENT OWNER: LARGE ENTITY |
|
| AS | Assignment |
Owner name: U.S. BANK TRUST COMPANY, NATIONAL ASSOCIATION, AS COLLATERAL AGENT, CONNECTICUT Free format text: FIRST LIEN NOTES PATENT SECURITY AGREEMENT;ASSIGNOR:XEROX CORPORATION;REEL/FRAME:070824/0001 Effective date: 20250411 |
|
| AS | Assignment |
Owner name: U.S. BANK TRUST COMPANY, NATIONAL ASSOCIATION, AS COLLATERAL AGENT, CONNECTICUT Free format text: SECOND LIEN NOTES PATENT SECURITY AGREEMENT;ASSIGNOR:XEROX CORPORATION;REEL/FRAME:071785/0550 Effective date: 20250701 |
|
| LAPS | Lapse for failure to pay maintenance fees |
Free format text: PATENT EXPIRED FOR FAILURE TO PAY MAINTENANCE FEES (ORIGINAL EVENT CODE: EXP.); ENTITY STATUS OF PATENT OWNER: LARGE ENTITY |
|
| STCH | Information on status: patent discontinuation |
Free format text: PATENT EXPIRED DUE TO NONPAYMENT OF MAINTENANCE FEES UNDER 37 CFR 1.362 |
|
| FP | Lapsed due to failure to pay maintenance fee |
Effective date: 20250608 |