US10983323B2 - Fluorescence observation device - Google Patents
Fluorescence observation device Download PDFInfo
- Publication number
- US10983323B2 US10983323B2 US16/394,857 US201916394857A US10983323B2 US 10983323 B2 US10983323 B2 US 10983323B2 US 201916394857 A US201916394857 A US 201916394857A US 10983323 B2 US10983323 B2 US 10983323B2
- Authority
- US
- United States
- Prior art keywords
- light
- intensity
- modulated
- frequency
- fluorescence
- Prior art date
- Legal status (The legal status is an assumption and is not a legal conclusion. Google has not performed a legal analysis and makes no representation as to the accuracy of the status listed.)
- Expired - Fee Related, expires
Links
Images


Classifications
-
- G—PHYSICS
- G01—MEASURING; TESTING
- G01N—INVESTIGATING OR ANALYSING MATERIALS BY DETERMINING THEIR CHEMICAL OR PHYSICAL PROPERTIES
- G01N21/00—Investigating or analysing materials by the use of optical means, i.e. using sub-millimetre waves, infrared, visible or ultraviolet light
- G01N21/62—Systems in which the material investigated is excited whereby it emits light or causes a change in wavelength of the incident light
- G01N21/63—Systems in which the material investigated is excited whereby it emits light or causes a change in wavelength of the incident light optically excited
- G01N21/636—Systems in which the material investigated is excited whereby it emits light or causes a change in wavelength of the incident light optically excited using an arrangement of pump beam and probe beam; using the measurement of optical non-linear properties
-
- G—PHYSICS
- G01—MEASURING; TESTING
- G01N—INVESTIGATING OR ANALYSING MATERIALS BY DETERMINING THEIR CHEMICAL OR PHYSICAL PROPERTIES
- G01N21/00—Investigating or analysing materials by the use of optical means, i.e. using sub-millimetre waves, infrared, visible or ultraviolet light
- G01N21/62—Systems in which the material investigated is excited whereby it emits light or causes a change in wavelength of the incident light
- G01N21/63—Systems in which the material investigated is excited whereby it emits light or causes a change in wavelength of the incident light optically excited
- G01N21/64—Fluorescence; Phosphorescence
- G01N21/645—Specially adapted constructive features of fluorimeters
- G01N21/6456—Spatial resolved fluorescence measurements; Imaging
- G01N21/6458—Fluorescence microscopy
-
- G—PHYSICS
- G02—OPTICS
- G02B—OPTICAL ELEMENTS, SYSTEMS OR APPARATUS
- G02B21/00—Microscopes
- G02B21/0004—Microscopes specially adapted for specific applications
- G02B21/002—Scanning microscopes
- G02B21/0024—Confocal scanning microscopes (CSOMs) or confocal "macroscopes"; Accessories which are not restricted to use with CSOMs, e.g. sample holders
- G02B21/0032—Optical details of illumination, e.g. light-sources, pinholes, beam splitters, slits, fibers
-
- G—PHYSICS
- G02—OPTICS
- G02B—OPTICAL ELEMENTS, SYSTEMS OR APPARATUS
- G02B21/00—Microscopes
- G02B21/0004—Microscopes specially adapted for specific applications
- G02B21/002—Scanning microscopes
- G02B21/0024—Confocal scanning microscopes (CSOMs) or confocal "macroscopes"; Accessories which are not restricted to use with CSOMs, e.g. sample holders
- G02B21/0036—Scanning details, e.g. scanning stages
- G02B21/0048—Scanning details, e.g. scanning stages scanning mirrors, e.g. rotating or galvanomirrors, MEMS mirrors
-
- G—PHYSICS
- G02—OPTICS
- G02B—OPTICAL ELEMENTS, SYSTEMS OR APPARATUS
- G02B21/00—Microscopes
- G02B21/06—Means for illuminating specimens
-
- G—PHYSICS
- G02—OPTICS
- G02B—OPTICAL ELEMENTS, SYSTEMS OR APPARATUS
- G02B21/00—Microscopes
- G02B21/16—Microscopes adapted for ultraviolet illumination ; Fluorescence microscopes
-
- G—PHYSICS
- G02—OPTICS
- G02B—OPTICAL ELEMENTS, SYSTEMS OR APPARATUS
- G02B26/00—Optical devices or arrangements for the control of light using movable or deformable optical elements
- G02B26/08—Optical devices or arrangements for the control of light using movable or deformable optical elements for controlling the direction of light
- G02B26/10—Scanning systems
-
- G—PHYSICS
- G01—MEASURING; TESTING
- G01N—INVESTIGATING OR ANALYSING MATERIALS BY DETERMINING THEIR CHEMICAL OR PHYSICAL PROPERTIES
- G01N2201/00—Features of devices classified in G01N21/00
- G01N2201/10—Scanning
- G01N2201/105—Purely optical scan
Definitions
- the present invention relates to a fluorescence observation device.
- Microscopes that construct an image by exciting a fluorescent substance with two photons, irradiating the fluorescent substance with a laser beam that induces stimulated emission, and acquiring reduced fluorescence have been known (see Non-Patent Literature 1, for example).
- a fluorescence observation device includes a first intensity-modulating unit that intensity-modulates, at a frequency f1, pump light that excites fluorescence of an observed subject; a second intensity-modulating unit that intensity-modulates, at a frequency f2 different from the frequency f1, probe light that induces stimulated emission of the observed subject; a light-receiving unit that receives the fluorescence from the observed subject irradiated with the intensity-modulated pump light and probe light; and a sensing unit that senses a component with a frequency of i ⁇ f1 ⁇ j ⁇ f2 (i and j are positive integers, at least one of which is equal to or larger than two) in a reception-light signal sensed at the light-receiving unit.
- a fluorescence observation device includes: a first intensity-modulating unit that intensity-modulates, at a frequency f1, pump light that excites fluorescence of an observed subject; a second intensity-modulating unit that intensity-modulates, at a frequency f2 different from the frequency f1, first probe light that induces stimulated emission of the observed subject; a third intensity-modulating unit that intensity-modulates, at a frequency f3 different from the frequencies f1 and f2, second probe light that induces stimulated emission of the observed subject, and has a wavelength different from the first probe light; a first light-receiving unit that receives fluorescence from the observed subject irradiated with the intensity-modulated pump light, first probe light, and second probe light, the fluorescence corresponding to the pump light and the first probe light; a first sensing unit that senses a component with a frequency of i ⁇ f1 ⁇ j ⁇ f2 (i and j are positive integers, at least one of which
- a fluorescence observation method includes: intensity-modulating, at a frequency f1, pump light that excites fluorescence of an observed subject; intensity-modulating, at a frequency f2 different from the frequency f1, probe light that induces stimulated emission of the observed subject; receiving, at a light-receiving unit, the fluorescence from the observed subject irradiated with the intensity-modulated pump light and probe light; and sensing a component with a frequency of i ⁇ f1 ⁇ j ⁇ f2 (i and j are positive integers, at least one of which is equal to or larger than two) in a reception-light signal sensed at the light-receiving unit.
- a fluorescence observation method includes: intensity-modulating, at a frequency f1, pump light that excites fluorescence of an observed subject; intensity-modulating, at a frequency f2 different from the frequency f1, first probe light that induces stimulated emission of the observed subject; intensity-modulating, at a frequency f3 different from the frequencies f1 and f2, second probe light that induces stimulated emission of the observed subject, and has a wavelength different from the first probe light; receiving, at a first light-receiving unit, fluorescence from the observed subject irradiated with the intensity-modulated pump light, first probe light, and second probe light, the fluorescence corresponding to the pump light and the first probe light; sensing a component with a frequency of i ⁇ f1 ⁇ j ⁇ f2 (i and j are positive integers, at least one of which is equal to or larger than two) in a reception-light signal sensed at the first light-receiving unit; receiving, at a
- FIG. 1 is a figure illustrating the configuration of a microscope device 10 according to the present embodiment.
- FIG. 2 is a state transition diagram.
- FIG. 3 is a figure for explaining principles of resolution enhancement.
- FIG. 4 illustrates a signal generation region simulation result.
- FIG. 5A is a conceptual diagram for explaining the scan speed and sensing speed.
- FIG. 5B is a conceptual diagram for explaining the scan speed and sensing speed.
- FIG. 6 illustrates another exemplary scanning unit 151 .
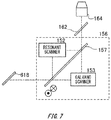
- FIG. 7 illustrates still another exemplary scanning unit 156 .
- FIG. 8 is a figure illustrating the configuration of another microscope device 12 .
- FIG. 9 is an exemplary GUI screen 300 used in the microscope device 12 .
- FIG. 10 is a flowchart illustrating an exemplary operation of the microscope device 12 .
- FIG. 11 is a flowchart of an operation of selecting a range of reduced fluorescence observation based on confocal observation.
- FIG. 12 is a flowchart of an operation of automatically selecting whether to perform confocal observation or to perform reduced fluorescence observation in the microscope device 12 .
- FIG. 13 illustrates a GUI screen 350 used in the operation.
- FIG. 14 is a figure illustrating the configuration of still another microscope device 14 .
- FIG. 15 is a state transition diagram.
- FIG. 16 is a figure for explaining principles of resolution enhancement.
- FIG. 17 illustrates a signal generation region simulation result.
- FIG. 18 is a figure illustrating the configuration of still another microscope device 16 .
- FIG. 19 is a figure illustrating the configuration of still another microscope device 18 .
- FIG. 20 illustrates a relationship among the excitation/fluorescence spectrum of each fluorescent substance, and the wavelengths of pump light, probe light, and sensing wavelength regions.
- FIG. 21 is a figure illustrating the configuration of still another microscope device 20 .
- FIG. 22 is a figure illustrating the configuration of still another microscope device 22 .
- FIG. 23 illustrates a relationship among the excitation/fluorescence spectrum of each fluorescent substance, and the wavelengths of pump light, probe light, and sensing wavelength regions.
- FIG. 24 is a figure illustrating the configuration of still another microscope device 24 .
- FIG. 25 is a figure illustrating the configuration of still another microscope device 26 .
- FIG. 26 is a state transition diagram.
- FIG. 27 illustrates a signal generation region simulation result.
- FIG. 1 is a figure illustrating the configuration of a microscope device 10 as an exemplary fluorescence observation device according to the present embodiment.
- the microscope device 10 irradiates an observed subject with pump light, and probe light to thereby make a fluorescent substance of the observed subject generate a signal of fluorescence (hereinafter, referred to as reduced fluorescence, a reduced fluorescence signal, etc.) produced by the fluorescent substance, and reduced due to stimulated emission.
- the reduced fluorescence signal can be sensed by intensity-modulating the pump light and the probe light. Specific methods therefor include lock-in sensing or the like.
- a reduced fluorescence signal having undergone stimulated absorption and stimulated emission induced by pump light multiple times can also be sensed by lock-in sensing.
- reduced fluorescence signals obtained by lock-in sensing are obtained as a result of multiple products of the pump light, and the probe light
- the signal generation region is restricted.
- a reduced fluorescence signal having undergone stimulated absorption and stimulated emission induced by pump light multiple times has a more restricted signal generation region than that of a reduced fluorescence signal having undergone stimulated absorption and stimulated emission once.
- spatial resolution can be enhanced.
- reduced fluorescence is collectively referred to as fluorescence in some cases.
- a microscope that acquires reduced fluorescence is referred to as a reduced fluorescence microscope.
- x, y, and z axes are illustrated in FIG. 1 for explanation.
- the microscope device 10 includes: a light source 100 that outputs pump light, and probe light; an illuminating optical system 140 that illuminates an observed subject 184 with pump light, and probe light; an observation optical system 160 for observing light emitted from the observed subject 184 ; and a sensing unit 136 that senses light through the observation optical system 160 .
- the microscope device 10 further includes a stage 180 that supports an observed subject 184 .
- the microscope device 10 further includes: a control unit 130 that performs overall control of the microscope device 10 ; and an input unit 220 , a display unit 224 , and a storage unit 226 that transmit and receive signals to and from the control unit 130 .
- the observed subject 184 , and a slide glass 182 on which the observed subject 184 is placed form a specimen 186 .
- the observed subject 184 is biological cells, for example.
- the observed subject 184 contains a fluorescent substance.
- the light source 100 has a laser light source 102 for pump light, and a laser light source 104 for probe light.
- a dichroic mirror that combines pump light and probe light may also be provided.
- the laser light sources 102 , 104 are both continuous wave laser light sources, for example, and moreover output laser light with wavelengths that are different from each other.
- Pump light excites a fluorescent substance, and makes the fluorescent substance generate fluorescence.
- Probe light induces stimulated emission from a fluorescent substance to thereby reduce fluorescence.
- the wavelength of the pump light is shorter than the wavelength of the probe light. For example, the wavelength of the pump light is 532 nm, and the wavelength of the probe light is 640 nm.
- wavelengths of the pump light and probe light are set as appropriate according to the absorption band (absorption spectrum) and fluorescence band (fluorescence spectrum) of a fluorescent substance. These wavelengths of the pump light, and probe light may be set automatically, or may be input by a user through the input unit 220 .
- the illuminating optical system 140 has, for pump light: a half-wave plate 600 ; a polarization beam splitter 602 ; mirrors 604 , 606 , 610 , 612 , 616 ; acousto-optic frequency shifters (hereinafter, also referred to as AOFSs) 514 , 524 ; and a polarizing plate 614 .
- the illuminating optical system 140 further has, for probe light: an acousto-optical modulator 534 (hereinafter, also referred to as an AOM), and a half-wave plate 620 .
- the illuminating optical system 140 has a dichroic mirror 618 , a scanning unit 150 , a lens pair 173 , a dichroic mirror 162 , and an object lens 164 .
- the observation optical system 160 has the object lens 164 , the dichroic mirror 162 , an optical filter 166 , and a lens pair 172 .
- the half-wave plate 600 rotates, by 45 degrees from the x axis on the xz plane, pump light which exited from the laser light source 102 , and is linearly polarized light having an electric field that vibrates in the x direction.
- the polarization beam splitter 602 splits, in two orthogonal polarization directions, the pump light which is linearly polarized light having an electric field that vibrates in a direction tilted by 45 degrees from the x axis on the xz plane.
- the polarization beam splitter 602 reflects linearly polarized light having an electric field that vibrates in the x direction, and transparently transmits therethrough linearly polarized light having an electric field that vibrates in the z direction.
- the AOFS 514 functions as a diffraction grating for light.
- a driver 512 drives the AOFS 514 , and shifts the frequency of positive first-order diffracted light by the acoustic wave frequency.
- the positive first-order diffracted light produced by the AOFS 514 is reflected off the mirror 606 , and guided to a polarization beam splitter 608 .
- the AOFS 524 function as a diffraction grating for light, and positive first-order diffracted light produced by the AOFS 524 is guided to the polarization beam splitter 608 .
- the optical intensity of pump light immediately after passing through each AOFS is not modulated yet, but is constant for a length of time.
- a difference f1 of several MHz is provided between the acoustic wave frequencies of the two AOFSs 514 , 524 .
- the acoustic wave frequency of the AOFS 514 is set to f0 MHz
- the acoustic wave frequency of the AOFS 524 is set to f0+f1 MHz.
- the frequencies of positive first-order diffracted light produced from both the AOFSs 514 , 534 are shifted by the acoustic wave frequencies. For example, if the wavelength of pump light is 532 nm, its light frequency is equivalent to 564 THz.
- the frequency of light diffracted at the AOFS 514 is 564+(f0 ⁇ 10 ⁇ 6) THz
- the frequency of light diffracted at the AOFS 524 is 564+((f0+f1) ⁇ 10 ⁇ 6) THz.
- the diffracted lights are combined coaxially by the polarization beam splitter 608 .
- the polarization beam splitter 608 can be said to function as a polarization beam combiner.
- the combined pump lights preserve their polarization directions
- mutually parallel polarization components for example polarization components having electric fields that vibrate in a direction tilted by 45 degrees from the x axis on the xz plane are transparently transmitted through the polarizing plate 614 .
- the pump lights interfere with each other, and the optical intensities are modulated at the above-mentioned difference f1 between the acoustic wave frequencies.
- AOFSs 514 , 524 , drivers 512 , 522 , half-wave plate 600 , polarization beam splitters 602 , 608 , mirrors 604 , 606 , 610 , 612 , and polarizing plate 614 constitute a first intensity-modulating unit 510 .
- first-order diffracted light of probe light is controlled. It is possible to maintain the state where first-order diffracted light is produced always (the ON-state, that is, the state where the intensity is the maximum), it is possible to maintain the state where first-order diffracted light is not produced always (the OFF-state, that is, the state where the intensity is the minimum), and it is possible to modulate the optical intensity. For example, if a constant voltage value is given from the driver 532 , the optical intensity has a constant value corresponding to the voltage value.
- the optical intensity also becomes zero.
- the voltage waveform of the driver 532 is a sine wave
- the intensity of light is modulated corresponding to the sine wave.
- probe light is intensity-modulated at a frequency f2 of several tens MHz, for example, by the AOM 534 based on oscillation from the oscillator 132 .
- An advantage of the AOM 534 is that it can perform intensity-modulation at a relatively high frequency of several tens MHz. Note that these AOM 534 , and driver 532 constitute a second intensity-modulating unit 530 .
- the dichroic mirror 618 combines the respectively intensity-modulated pump light, and probe light coaxially, and guides them to the scanning unit 150 .
- the scanning unit 150 is disposed at a position which is almost conjugate with the pupil plane of the object lens 164 . Because of this, the lens pair 173 is desirably placed between the scanning unit 150 and the dichroic mirror 162 .
- An example of the scanning unit 150 is a galvano scanner which has a pair of galvano mirrors that can be rotated in mutually orthogonal directions. The angles of those galvano mirrors are changed to scan a spot position of laser light in the observed subject 184 in the x and y directions.
- Another example of the scanning unit 150 is a resonant scanner (resonant scanner).
- the resonant scanner has a resonant mirror (resonant mirror) that operates resonantly.
- the resonant scanner includes a resonant mirror for main scanning, and a galvano mirror for sub-scanning, for example. Using a resonant scanner enables faster scanning.
- Laser light output from the scanning unit 150 is transparently transmitted through the dichroic mirror 162 , and is guided to the object lens 164 .
- the object lens 164 concentrates the laser light onto the observed subject 184 .
- Fluorescence produced from a fluorescent substance of the observed subject 184 passes through the object lens 164 , and is reflected off the dichroic mirror 162 , and the pump light, and probe light are removed from the fluorescence by the optical filter 166 . Due to the lens pair 172 , the fluorescence enters a light-receiving unit 174 placed at a position which is almost conjugate with the object lens pupil plane. Note that the dichroic mirror 162 may be placed between the lens pair 173 and the scanning unit 150 , or may be placed on the light source side of the scanning unit 150 .
- the sensing unit 136 includes the light-receiving unit 174 , and a lock-in amplifier 134 .
- the light-receiving unit 174 is disposed at a position which is almost conjugate with the pupil plane of the object lens 164 .
- An example of the light-receiving unit 174 is a photomultiplier.
- the light-receiving unit 174 performs photoelectric conversion to output an electrical signal corresponding to the intensity of the received fluorescence. Output of the light-receiving unit 174 is input to the lock-in amplifier 134 , and sensed by lock-in sensing. The lock-in sensing is described later.
- the input unit 220 , display unit 224 , storage unit 226 , and control unit 130 may be a PC or the like, for example.
- the input unit 220 is where input from a user to the control unit 130 is accepted, and for example is a keyboard, a touch panel, a mouse, or the like.
- the display unit 224 is a display that displays GUIs, sensing results, and observation images, for example.
- the storage unit 226 stores programs, parameters, or the like for controlling the microscope device 10 , and sensing results, observation images, or the like.
- the control unit 130 has a frequency control unit 229 , a scanner control unit 228 , and an image generating unit 222 .
- the frequency control unit 229 controls an oscillation frequency generated at the oscillator 132 .
- the scanner control unit 228 controls the scanning unit 150 .
- the image generating unit 222 generates an image based on a result of sensing by the sensing unit 136 , and displays the image on the display unit 224 .
- FIG. 2 is a state transition diagram.
- FIG. 4 illustrates a signal generation region simulation result.
- a fluorescent substance is irradiated with pump light that excites the fluorescent substance, and probe light that induces stimulated emission.
- I Probe ( t ) I 2 [1+ n cos( f 2 t )] (1.2)
- I1 and I2 are the intensities of the pump light and probe light, and m and n are the contrasts of modulation.
- step 1 Stimulated absorption induced by pump light ( 1 );
- step 2 Stimulated emission induced by pump light ( 2 );
- step 3 Second stimulated absorption induced by pump light ( 3 );
- step 4 Stimulated emission induced by probe light ( 4 );
- CERF Cyclic Excitation Reduced Fluorescence
- the demodulation frequency may be any of the sum of and the difference between two or more frequencies that are used for intensity-modulation. This is simply represented by “ ⁇ ”.
- An advantage of sensing these signals is that, since the sensing signals are obtained as a result of multiple products of pump light, and probe light, the signal generation region is restricted. This mechanism is described later.
- each of the signals is proportional to each of the third power of I1, and the first power of I2, the signal quantity is significantly increased by raising the pump light intensity I1, and an advantageous signal-to-noise ratio can also be attained.
- the above-mentioned demodulation frequency is input from the oscillator 132 to the lock-in amplifier 134 .
- the lock-in amplifier 134 extracts a signal that is synchronized with the demodulation frequency.
- the scanning unit 150 is scanning light spot positions in the observed subject 184
- the lock-in amplifier 134 performs lock-in sensing pixel by pixel, and stores results of the lock-in sensing in the storage unit 226 , associating a result about each pixel with positional information about the pixel.
- the image generating unit 222 reads out the sensing results associated with the positional information from the storage unit 226 , generates a reduced fluorescence observation image, and displays the image on the display unit 224 .
- FIG. 3 is a figure for explaining principles of resolution enhancement.
- S1, and S2 are defined as the intensity distributions of light spots of pump light, and probe light, respectively.
- the vertical axis corresponds to intensities
- the horizontal axis corresponds to spatial coordinates.
- FIG. 4 illustrates a signal generation region simulation result.
- signal generation regions of a typical confocal microscope (CM), and a reduced fluorescence (RF) microscope are illustrated. It can be known that, due to the effect attained by producing signals in the distribution as represented by the multiple products of pump light and probe light, the signal generation region of CERF becomes sharp in both the X direction, and Z direction.
- CM confocal microscope
- RF reduced fluorescence
- Step 4 reduced fluorescence signals produced by (Step 4) stimulated emission induced by probe light after (step 1) stimulated absorption induced by pump light, (step 2) stimulated emission induced by pump light, and (step 3) stimulated absorption induced by pump light are sensed
- reduced fluorescence signals produced by stimulated emission induced by probe light after further stimulated emission induced by pump light, and stimulated absorption induced by pump light after step 3 may be sensed.
- the demodulation frequencies are desirably 4f1 ⁇ f2, and 5f1 ⁇ f2.
- each of the signals is proportional to each of the fifth power of I1, and the first power of I2, the signal quantity is significantly increased by raising the pump light intensity I1, and the signal-to-noise ratio can also be enhanced.
- lock-in sensing is performed using a demodulation frequency of i ⁇ f1 ⁇ f2 (i is a positive integer which is equal to or larger than two), and this makes it possible to sense reduced fluorescence signals with higher spatial resolution.
- FIG. 5A and FIG. 5B are conceptual diagrams for explaining the scan speeds and sensing speeds of the scanning unit 150 . Since the length of time required for scanning in a main scanning (the x direction in the figure) of a galvano scanner is longer than that of a resonant scanner, it may be considered that the position of a beam will not change almost at all in the length of time required for sensing by demodulation using a difference frequency as illustrated in FIG. 5A . However, since the length of time required for scanning in a main scanning (the x direction in the figure) of a resonant scanner is shorter than that of the galvano scanner, the position of a beam changes as illustrated in FIG.
- a reason for using the two AOFSs 514 , 524 in the microscope device 10 is that higher harmonics due to modulation distortion can be suppressed thereby.
- signals having undergone repetitive stimulated absorption/stimulated emission produced by pump light are sensed. Since these signals are produced at integer multiples of the basic modulation frequency f1 for a length of time, the original modulation is desirably performed in a sine wave form with only the basic frequency f1.
- modulation with the use of only AOMs results in slight mixing of frequency components of integer multiples of f1.
- the use of AOFSs can suppress the influence significantly. That is, as compared with direct modulation with the use of AOMs, modulation distortion components can be reduced significantly, and so a more preferable configuration can be realized.
- FIG. 6 illustrates another exemplary scanning unit 151 .
- the scanning unit 151 has a resonant scanner 152 , a galvano scanner 153 , and a pair of mirrors 154 , 155 .
- the pair of mirrors 154 , 155 are individually movable in the directions of arrows in the figure, and the resonant scanner 152 or the galvano scanner 153 is selected for use based on the positions of the pair of mirrors 154 , 155 .
- FIG. 6 illustrates the state where the resonant scanner 152 is selected.
- the mirror 154 is disposed on the optical path of light exiting from the dichroic mirror 144
- the mirror 155 is disposed on the optical path of light exiting from the resonant scanner 152 .
- the light reflected off the mirror 154 enters the resonant scanner 152 .
- the light deflected in a predetermined direction at the resonant scanner 152 is reflected off the mirror 155 , is transparently transmitted through the dichroic mirror 162 , and enters the object lens 164 .
- the mirror 154 is moved aside out from the optical path of the light exiting from the dichroic mirror 618 , and moreover the mirror 155 is moved aside out from between the galvano scanner 153 and the dichroic mirror 162 .
- the light enters the galvano scanner 153 , and the light deflected at the galvano scanner 153 is transparently transmitted through the dichroic mirror 162 , and enters the object lens 164 .
- the scanning unit 151 allows a use of a different one of the resonant scanner 152 and the galvano scanner 153 depending on an intended purpose.
- examples of the means for moving the positions of the pair of mirrors 154 , 155 include linear motors, for example, but this is not the sole example.
- the pair of mirrors 154 , 155 may each be disposed on a corresponding turret, and the pair of mirrors 154 , 155 may be moved along with rotation of the turrets. Instead of the pair of mirrors 154 , 155 , a pair of dichroic mirrors may be disposed.
- the resonant scanner 152 can be used for light with a wavelength that is reflected off the pair of dichroic mirrors
- the galvano scanner 153 can be used for light with a wavelength that is transparently transmitted through the pair of dichroic mirrors. Note that the positions of the resonant scanner 152 and the galvano scanner 153 in FIG. 6 may be switched with one another.
- FIG. 7 illustrates still another exemplary scanning unit 156 . Configurations in FIG. 7 that are the same as those in FIG. 6 are given the same numbers, and explanations thereof are omitted.
- the scanning unit 156 has a mirror 157 formed by integrating the pair of mirrors 154 , 155 of the scanning unit 151 , instead of the separate mirrors 154 , 155 .
- the mirror 157 is movable in the direction perpendicular to the sheet of paper.
- the state illustrated in FIG. 7 corresponds to the state illustrated in FIG. 6 , and in the state, light is reflected off the mirror 157 , and so the resonant scanner 152 is used.
- the state illustrated in FIG. 7 corresponds to the state illustrated in FIG. 6
- the resonant scanner 152 is used.
- the mirror 157 is moved in the direction perpendicular to the sheet of paper, and moved aside out from the optical path between the dichroic mirror 618 and the galvano scanner 153 , and the optical path between the galvano scanner 153 and the dichroic mirror 162 simultaneously, the galvano scanner 153 becomes ready for use.
- FIG. 8 is a figure illustrating the configuration of another microscope device 12 .
- the microscope device 12 can be used as a reduced fluorescence microscope similar to the microscope device 10 , and moreover can be used also as a confocal microscope. Configurations of the microscope device 12 that are the same as the configurations in the microscope device 10 are given the same reference numerals, and explanations thereof are omitted.
- the microscope device 12 has a dichroic mirror 402 that reflects fluorescence, transparently transmits therethrough pump light and probe light, and is disposed on the optical path between the dichroic mirror 618 and the scanning unit 150 . Furthermore, the microscope device 12 has an optical filter 404 , a lens 406 , and a light-receiving unit 410 which light reflected off the dichroic mirror 402 enters. The optical filter 404 , and light-receiving unit 410 may have the same configurations as those of the optical filter 166 , and light-receiving unit 174 of the microscope device 10 .
- the microscope device 12 further has a pinhole 408 . The pinhole 408 is disposed at a position which is conjugate with the observed subject 184 .
- the lens 406 concentrates light onto the pinhole 408 .
- the light-receiving unit 410 is placed in proximity to the pinhole 408 . Alternatively, it may be placed at a position which is substantially conjugate with the pinhole using an unillustrated lens.
- the microscope device 12 further has a wavelength control unit 230 that controls the wavelengths of light of the laser light sources 102 , 104 .
- fluorescence from the observed subject 184 passes through the scanning unit 150 , is reflected off the dichroic mirror 402 , and is received by the light-receiving unit 410 after passing through the optical filter 404 , lens 406 , and pinhole 408 .
- the spot position at the pinhole 408 remains unchanged due to descanning by the scanning unit 150 .
- the hole size of the pinhole 408 is variable, and details thereof are described below.
- FIG. 9 is an exemplary GUI screen 300 used in the microscope device 12 .
- the GUI screen 300 is displayed on the display unit 224 , and input from a user is accepted using the input unit 220 .
- a check box 302 is an input field for selecting whether or not to acquire a confocal observation image.
- a check box 304 is an input field for specifying that pump light is to be modulated in confocal observation, and a check box 306 is an input field for specifying that the pump light is not to be modulated.
- An input field 308 is an input field for the modulation frequency for pump light, and includes a specified modulation frequency indicated by a vertical bold line, along with scales accompanied by numbers in the unit of MHz.
- An input field 310 is an input field for specifying the size of the pinhole. “OPEN” at the input field 310 indicates that the hole size is the maximum. Furthermore, a specified hole size is indicated by a vertical bold line, along with scales for the size, with “1” indicating the airy size.
- the airy size means the size of a light spot of diffraction limitation that is determined by a wavelength and a numerical aperture, and is a standardized value of pinhole diameter.
- a check box 312 is an input field for selecting whether or not to acquire time-lapse images of confocal observation.
- An input field 314 is an input field for time intervals for time-lapse image acquisition.
- a check box 316 is an input field for selecting whether or not to acquire a reduced fluorescence observation image.
- An input field 318 is an input field for the modulation frequency for pump light, and includes a specified modulation frequency indicated by a vertical bold line, along with scales accompanied by numbers in the unit of MHz.
- An input field 320 is an input field for the modulation frequency for probe light, and includes a specified modulation frequency indicated by a vertical bold line, along with scales accompanied by numbers in the unit of MHz.
- An input field 322 is an input field for the hole size of the pinhole 408 in reduced fluorescence observation, and has the same configuration as that of the input field 310 .
- a check box 324 and an input field 326 are input fields about time lapse in reduced fluorescence observation, and have the same configurations as those of the check box 312 , and input field 314 .
- Input fields 323 , 325 are fields where demodulation frequencies are input.
- One or more positive numbers can be input in the input field 323 .
- the positive sign or negative sign can be selected in the input field 325 .
- FIG. 9 illustrates a situation where “3” is input in the input field 323 , and the positive sign is selected in the input field 325 , meaning that 3f1+f2 is set as the demodulation frequency. Note that if “1” is input in the input field 323 , a typical reduced fluorescence microscope image can be acquired.
- the GUI screen 300 includes a confocal observation image 330 , and a reduced fluorescence observation image 332 that are displayed next to each other. Instead, the images may be displayed as a superimposed image. In addition, a link to the other may be given to each of the images, and, for example, by clicking a region of interest in the confocal observation image 330 , the reduced fluorescence observation image 332 may be displayed. Furthermore, if time-lapse image acquisition is selected for confocal observation, time-lapse images 334 are displayed next to each other in the order of time. Similarly, if time-lapse image acquisition is selected for reduced fluorescence observation, time-lapse images 335 are displayed next to each other in the order of time.
- FIG. 10 is a flowchart illustrating an exemplary operation (S 10 ) of the microscope device 12 .
- the control unit 130 determines, based on input in the check box 316 on the GUI screen 300 , whether or not to acquire a reduced fluorescence observation image (S 100 ). If the result of the determination at Step S 100 is Yes, the control unit 130 sets, in the oscillator 132 and based on input in the input fields 318 , 320 , the modulation frequencies for pump light and probe light for reduced fluorescence observation (S 102 ). Furthermore, the control unit 130 sets, in the oscillator 132 , the demodulation frequencies based on input in the input fields 323 , 325 (S 101 ).
- the control unit 130 sets the diameter of the pinhole 408 (S 104 ).
- the pinhole 408 is opened in the default setting, that is, “OPEN” is set in the input field 322 in FIG. 10 in the default setting. If a user altered the value of the input field 322 from the default setting, the size of the pinhole 408 is set based on the value after the alteration.
- a reduced fluorescence observation image is acquired (S 106 ).
- the method of acquiring a reduced fluorescence observation image is the same as that explained in relation to the microscope device 10 , and explanations thereof are omitted.
- Step S 106 After Step S 106 or if the result of the determination at Step S 100 is No, it is determined, based on input in the check box 302 , whether or not to acquire a confocal observation image (S 108 ). If it is determined to acquire a confocal observation image (S 108 : Yes), it is determined, based on the check boxes 304 , 306 , whether or not to modulate pump light used for confocal observation (S 112 ). If it is determined to perform the modulation (S 112 : Yes), a modulation frequency input in the input field 308 is set (S 114 ).
- Step S 114 After Step S 114 or if it is determined at Step S 112 not to modulate pump light (S 112 : No), the diameter of the pinhole 408 is set based on input by a user in the input field 310 (S 116 ).
- a confocal observation image is acquired based on the above-mentioned settings (S 118 ).
- S 118 A confocal observation image is acquired based on the above-mentioned settings.
- S 118 by setting the state of only one of the AOFS 514 , 524 to the ON-state for pump light or intensity-modulating pump light, and by setting the state of probe light to the OFF-state, fluorescence is sensed at the sensing unit 136 pixel by pixel while the scanning unit 150 is scanning the observed subject 184 .
- Results of the sensing are stored in the storage unit 226 in association with positional information. If pump light is not intensity-modulated, output from the light-receiving unit 410 is stored in the storage unit 226 in association with positional information without passing through the lock-in amplifier.
- the image generating unit 222 reads out the sensing results associated with the positional information from the storage unit 226 , generates the confocal observation image 330 and the reduced fluorescence observation image 332 , and displays the images on the display unit 224 (S 120 ).
- the microscope device 12 executes confocal observation at the time intervals set in the input field 314 , and generates individual observation images.
- the microscope device 12 executes reduced fluorescence observation at the time intervals set in the input field 326 , and generates individual observation images.
- an image of the observed subject 184 may be acquired through confocal observation over a large field of view, and a partial region in the confocal observation image may be specified to acquire a reduced fluorescence observation image.
- an image may be acquired through confocal observation, and a range suited for reduced fluorescence observation may be selected automatically.
- FIG. 11 is a flowchart of an operation (S 30 ) of selecting a range of reduced fluorescence observation based on confocal observation.
- an image is acquired through confocal observation (S 300 ).
- Steps S 112 to S 118 in the operation (S 10 ) in FIG. 10 are executed.
- it is determined, based on input from a user, whether or not to automatically select a range of reduced fluorescence observation (S 302 ).
- the confocal image undergoes image processing analysis, and a range suited for reduced fluorescence observation is selected. For example, the image may undergo differential filtering, and a region where many peaks are produced is selected.
- a region of reduced fluorescence observation is set based on selection by a user (S 308 ). In this case, selection of a region may be accepted on the confocal observation image 330 illustrated in FIG. 9 .
- Reduced fluorescence observation is executed in the region set at Step S 304 or S 308 to acquire an observation image (S 306 ).
- Steps S 102 to S 106 in the operation (S 10 ) in FIG. 10 are executed.
- FIG. 12 is a flowchart of an operation (S 20 ) of automatically selecting whether to perform confocal observation or to perform reduced fluorescence observation in the microscope device 12
- FIG. 13 illustrates a GUI screen 350 used in the operation.
- the storage unit 226 stores information that is associated with names of fluorescent substances, and indicates whether confocal observation is preferable or reduced fluorescence observation is preferable, and the wavelength of pump light in the case of confocal observation, or the wavelengths of pump light and probe light in the case of reduced fluorescence observation.
- the GUI screen 350 displays the names 353 of fluorescent substances stored in the storage unit 226 along with check boxes 352 .
- a check mark placed in a check box 352 by a user indicates a selected fluorescent substance (S 200 ).
- the control unit 130 determines whether confocal observation is preferable or reduced fluorescence observation is preferable depending on the selected fluorescent substance by referring to the storage unit 226 (S 202 ). If it is determined that confocal observation is preferable, a box 355 for pump light is colored on the GUI screen 350 , and the wavelength of pump light corresponding to the fluorescent substance is automatically selected, and displayed on a display field 354 (S 204 ). In this case, a box 357 for probe light is white, and a display field 356 for a wavelength is grayed out.
- the box 355 for pump light is colored on the GUI screen 350 , the wavelength of pump light corresponding to the fluorescent substance is automatically selected, and displayed in the display field 354 , moreover the box 357 for probe light is also colored, and the wavelength of probe light corresponding to the fluorescent substance is automatically selected, and displayed in the display field 356 (S 204 ).
- a relationship among the absorption band, and fluorescence band of the fluorescent substance, the wavelengths of the light sources, and a sensing region is illustrated in a display field 358 (S 206 ).
- the wavelength control unit 230 sets the wavelengths of light from the laser light sources 102 , 104 based on an instruction from a user about execution. Furthermore, the frequency control unit 229 sets modulation frequencies in the oscillator 132 . In this case, input of modulation frequencies may be accepted on the GUI screen 300 illustrated in FIG. 9 , or modulation frequencies may be stored in the storage unit 226 in association with fluorescent substances, and a modulation frequency may be automatically set according to selection of a fluorescent substance. Based on the above-mentioned settings, a reduced fluorescence observation image is acquired in a similar manner to Steps S 102 to S 106 in FIG. 10 .
- the wavelength control unit 230 sets the wavelengths of light from the laser light source 102 based on an instruction from a user about execution. Based on the above-mentioned settings, a confocal observation image is acquired in a similar manner to Steps S 112 to S 118 in FIG. 10 .
- FIG. 14 is a figure illustrating the configuration of still another microscope device 14 .
- Configurations of the microscope device 14 that are the same as the configurations in the microscope devices 10 , 12 are given the same reference numerals, and explanations thereof are omitted.
- the microscope device 14 senses a reduced fluorescence signal having undergone stimulated absorption and stimulated emission induced by probe light multiple times by lock-in sensing.
- a first intensity-modulating unit 540 that intensity-modulates pump light has a driver 542 , and an AOM 544 . Their functions are the same as corresponding ones of the second intensity-modulating unit 530 in the microscope device 10 , but pump light is intensity-modulated at the frequency f1 in the microscope device 14 .
- a second intensity-modulating unit 550 that intensity-modulates probe light has drivers 552 , 562 , AOFSs 554 , 564 , a half-wave plate 626 , polarization beam splitters 628 , 632 , mirrors 630 , 631 , and a polarizing plate 634 .
- Their functions are the same as corresponding ones of the first intensity-modulating unit 510 in the microscope device 10 , but probe light is intensity-modulated at the frequency f2 in the microscope device 14 .
- FIG. 15 is a state transition diagram.
- FIG. 17 illustrates a signal generation region simulation result.
- a fluorescent sample is irradiated with pump light that excites the sample, and probe light that induces stimulated emission.
- the pump light, and probe light are intensity-modulated at the frequencies f1, f2 for a length of time, and their time waveforms are represented by the formulae (1.1), (1.2) similar to the microscope device 10 .
- step 1 Stimulated absorption induced by pump light ( 1 );
- step 2 Stimulated emission induced by probe light ( 2 );
- step 3 Stimulated absorption induced by probe light ( 3 );
- step 4 Stimulated emission induced by probe light ( 4 );
- CSRF Cyclic Stimulated emission Reduced Fluorescence
- FIG. 16 is a figure for explaining principles of resolution enhancement using CSRF signals.
- S1, and S2 are defined as the intensity distributions of light spots of pump light, and probe light, respectively.
- FIG. 17 illustrates a signal generation region simulation result.
- signal generation regions of a typical confocal microscope (CM), and a reduced fluorescence (RF) microscope are illustrated. It can be known that, due to the effect attained by producing signals in the distribution as represented by the multiple products of pump light and probe light, the signal generation region of CSRF becomes sharp in both the X direction, and Z direction.
- CM confocal microscope
- RF reduced fluorescence
- Step 4 reduced fluorescence signals produced by (Step 4) stimulated emission induced by probe light after (step 1) stimulated absorption induced by pump light, (step 2) stimulated emission induced by probe light, and (step 3) stimulated absorption induced by probe light are sensed
- reduced fluorescence signals produced by stimulated emission induced by probe light after further stimulated emission induced by probe light, and stimulated absorption induced by probe light after step 3 may be sensed.
- the demodulation frequencies are desirably f1 ⁇ 4f2, f1 ⁇ 5f2.
- each of the signals is proportional to each of the first power of I1, and the fifth power of I2, the signal quantity is significantly increased by raising the probe light intensity I2, and the signal-to-noise ratio can also be enhanced.
- lock-in sensing is performed using a demodulation frequency of f1 ⁇ j ⁇ f2 (j is a positive integer which is equal to or larger than two), and this makes it possible to sense reduced fluorescence signals with higher spatial resolution.
- FIG. 18 is a figure illustrating the configuration of still another microscope device 16 .
- the microscope device 16 can be used as a reduced fluorescence microscope similar to the microscope device 14 , and moreover can be used also as a confocal microscope. Configurations of the microscope device 14 that are the same as the configurations in the microscope devices 10 , 12 , 14 are given the same reference numerals, and explanations thereof are omitted.
- the microscope device 16 has the dichroic mirror 402 that reflects fluorescence, transparently transmits therethrough pump light and probe light, and is disposed on the optical path between the dichroic mirror 624 and the scanning unit 150 . Furthermore, the microscope device 16 has the optical filter 404 , lens 406 , and light-receiving unit 410 which light reflected off the dichroic mirror 402 enters. The optical filter 404 , lens 406 , and light-receiving unit 410 may have the same configurations as those of the optical filter 166 , and light-receiving unit 174 of the microscope device 14 .
- the microscope device 16 further has the pinhole 408 .
- the pinhole 408 can be placed at a position which is conjugate with the specimen in the observation optical system.
- the light-receiving unit 410 is placed in proximity to the pinhole 408 .
- the lens 406 concentrates light onto the pinhole 408 .
- fluorescence from the observed subject 184 passes through the scanning unit 150 , is reflected off the dichroic mirror 402 , and is received by the light-receiving unit 410 after passing through the optical filter 404 , lens 406 , and pinhole 408 .
- the spot position at the light-receiving unit 410 remains unchanged due to descanning by the scanning unit 150 .
- the hole size of the pinhole 408 is variable, details thereof are the same as those for the microscope device 12 , and so explanations thereof are omitted.
- FIG. 19 is a figure illustrating the configuration of still another microscope device 18
- FIG. 20 illustrates a relationship among the excitation/fluorescence spectrum of each fluorescent substance, and the wavelengths of pump light, probe light, and sensing wavelength regions.
- the microscope device 18 is used for reduced fluorescence observation based on multicolor fluorescence. Particularly, the microscope device 18 is used when there are two types of fluorescent substances, and a common pump light is used, and different probe lights are used. Configurations of the microscope device 18 that are the same as the configurations in the microscope device 12 are given the same reference numerals, and explanations thereof are omitted.
- the microscope device 18 further has: a laser light source 500 for second probe light in addition to the laser light source 104 for first probe light; a third intensity-modulating unit 570 that intensity-modulates second probe light; a half-wave plate 640 that rotates the polarization direction of the second probe light; and a mirror 644 and a dichroic mirror 642 that combine the second probe light with the first probe light.
- the dichroic mirror 618 combines pump light with the first probe light, and second probe light.
- the third intensity-modulating unit 570 has a driver 572 , and an AOFS 574 .
- the wavelength of pump light is at an overlapping portion of the absorption spectrum C of a first fluorescent substance, and the absorption spectrum D of a second fluorescent substance, and excites both the fluorescent substances.
- the wavelength of the first probe light is in the fluorescence spectrum A of the first fluorescent substance, and induces stimulated emission of the first fluorescent substance.
- the wavelength of the second probe light is in the fluorescence spectrum B of the second fluorescent substance, and induces stimulated emission of the second fluorescent substance.
- the pump light, and the first probe light, and second probe light are intensity-modulated at different frequencies f1, f2, f3, respectively, by the two AOFSs 514 , 524 , and the AOMs 534 , 574 , respectively.
- the microscope device 18 has the dichroic mirror 402 between the dichroic mirror 618 and the scanning unit 150 .
- the dichroic mirror 402 reflects light in a wavelength region including the first sensing wavelength region where fluorescence from the first fluorescent substance is sensed, and the second sensing wavelength region where fluorescence from the second fluorescent substance is sensed.
- a dichroic mirror 412 is disposed further on the optical path of light reflected off the dichroic mirror 402 .
- the dichroic mirror 412 transparently transmits therethrough light in a wavelength region including the first sensing wavelength region, and reflects light in a wavelength region including the second sensing wavelength region. Note that, in another possible configuration, the dichroic mirror 412 may reflect light in the first sensing wavelength region, and transparently transmits therethrough light in the second sensing wavelength region.
- Light in wavelength regions other than the first sensing wavelength region are filtered out, by the optical filter 404 , from fluorescence from the first fluorescent substance having been transparently transmitted through the dichroic mirror 412 , and the remaining light passes through the lens 406 , and is received by the light-receiving unit 410 .
- a reception-light signal obtained by photoelectric conversion at the light-receiving unit 410 is sensed by lock-in sensing at the lock-in amplifier 134 .
- light in wavelength regions other than the second sensing wavelength region are filtered out, by an optical filter 414 , from fluorescence from the second fluorescent substance having been reflected off the dichroic mirror 412 , and the remaining light passes through a lens 416 , and is sensed at a light-receiving unit 420 .
- a reception-light signal obtained by photoelectric conversion at the light-receiving unit 420 is sensed by lock-in sensing at a lock-in amplifier 135 .
- FIG. 21 is a figure illustrating the configuration of still another microscope device 20 .
- the microscope device 18 has the AOMs 534 , 574 that are placed on the optical paths of probe lights for intensity-modulation of those lights
- the microscope device 20 may have a single acousto-optic tunable filter 594 (also referred to as an AOTF) that modulates both the first probe light, and second probe lights.
- the AOTF 594 intensity-modulates the first probe, and the second probe at f2, and f3, respectively. Since the AOTF 594 is capable of intensity-modulation at different frequencies for different wavelengths, multicolor observation can be realized with a simpler device configuration.
- FIG. 22 is a figure illustrating the configuration of still another microscope device 22
- FIG. 23 illustrates a relationship among the excitation/fluorescence spectrum of each fluorescent substance, the light source wavelengths, and the wavelengths of sensed fluorescence.
- the microscope device 22 is used for reduced fluorescence observation based on multicolor fluorescence.
- the microscope device 22 is used when there are two types of fluorescent substances, and a common probe light is used, and different pump lights are used. Configurations of the microscope device 22 that are the same as the configurations in the microscope devices 10 to 20 are given the same reference numerals, and explanations thereof are omitted.
- the microscope device 22 further has: a laser light source 502 for second pump light in addition to the laser light source 102 for first pump light; an intensity-modulating unit 580 that intensity-modulates second pump light; a half-wave plate 626 that rotates the polarization direction of second probe light; and a mirror 622 and a dichroic mirror 654 that combine the second pump light with the first pump light.
- the dichroic mirror 624 combines the first pump light, and second pump light with probe light.
- the intensity-modulating unit 580 has a driver 582 , and an AOM 584 .
- the wavelength of the first pump light is in the absorption spectrum H of the first fluorescent substance, and excites the first fluorescent substance.
- the wavelength of the second pump light is in the absorption spectrum G of the second fluorescent substance, and excites the second fluorescent substance.
- the wavelength of the probe light is in the overlapping portion of the fluorescence spectrum E of the first fluorescent substance and the fluorescence spectrum F of the second fluorescent substance, and induces stimulated emission of both the fluorescent substances.
- the first pump light, and second pump light, and the probe light are intensity-modulated at different frequencies f1, f2, f3, respectively, by the AOMs 544 , 584 , and the two AOFSs 554 , 564 , respectively.
- the microscope device 22 has the dichroic mirror 402 between the dichroic mirror 624 and the scanning unit 150 .
- the dichroic mirror 402 reflects light in a wavelength region including the first sensing wavelength region where fluorescence from the first fluorescent substance is sensed, and the second sensing wavelength region where fluorescence from the second fluorescent substance is sensed.
- the dichroic mirror 412 is disposed further on the optical path of light reflected off the dichroic mirror 402 .
- the dichroic mirror 412 transparently transmits therethrough light in a wavelength region including the first sensing wavelength region, and reflects light in a wavelength region including the second sensing wavelength region. Note that, in another possible configuration, the dichroic mirror 412 may reflect light in the first sensing wavelength region, and transparently transmits therethrough light in the second sensing wavelength region.
- Light in wavelength regions other than the first sensing wavelength region are filtered out, by the optical filter 404 , from fluorescence from the first fluorescent substance having been transparently transmitted through the dichroic mirror 412 , and the remaining light passes through the lens 406 , and is received by the light-receiving unit 410 .
- a reception-light signal obtained by photoelectric conversion at the light-receiving unit 410 is sensed by lock-in sensing at the lock-in amplifier 134 .
- light in wavelength regions other than the second sensing wavelength region are filtered out, by the optical filter 414 , from fluorescence from the second fluorescent substance having been reflected off the dichroic mirror 412 , and the remaining light passes through the lens 416 , and is sensed at the light-receiving unit 420 .
- a reception-light signal obtained by photoelectric conversion at the light-receiving unit 420 is sensed by lock-in sensing at a lock-in amplifier 135 .
- FIG. 24 is a figure illustrating the configuration of still another microscope device 24 .
- the microscope device 22 has the AOMs 544 , 584 that are placed on the optical paths of pump lights for intensity-modulation of those lights
- the microscope device 20 may have the single AOTF 594 that modulates both the first pump light, and second pump light.
- the AOTF 594 intensity-modulates the first pump light, and the second pump light at f1, and f2, respectively. Since the AOTF 594 is capable of intensity-modulation at different frequencies for different wavelengths, multicolor observation can be realized with a simpler device configuration.
- intensity-modulation is performed by optical interference using two AOFSs for first pump light, and second pump light, respectively, and intensity-modulation is performed using an AOM for first probe light, and second probe light.
- intensity-modulation is performed by optical interference using an AOM for first pump light, and second pump light, and intensity-modulation is performed using two AOFSs for first probe light, and second probe light, respectively.
- FIG. 25 is a figure illustrating the configuration of still another microscope device 26 .
- FIG. 26 is a state transition diagram
- FIG. 27 illustrates a signal generation region simulation result.
- the microscope device 26 is used for a technique to enhance spatial resolution (CES-RF, Cyclic Excitation and Stimulated emission Reduced Fluorescence) utilizing effects of both stimulated absorption/stimulated emission induced by pump light many times, and stimulated absorption/stimulated emission induced by probe light many times by acquiring reduced fluorescence signals generated if they are induced simultaneously.
- Configurations of the microscope device 26 that are the same as those of the microscope devices 10 to 24 are given the same reference numerals, and explanations thereof are omitted.
- the microscope device 26 uses the two AOFSs 514 , 524 for intensity-modulation of pump light similar to the microscope device 10 , and a difference f1 is provided between two acoustic wave frequencies.
- the microscope device 26 uses the two AOFSs 554 , 564 for modulation of the probe light intensity similar to the microscope device 14 , and a difference f2 is provided between two acoustic wave frequencies.
- the pump light, and probe light intensity-modulated at f1, and f2, respectively, are combined by the dichroic mirror 624 , and guided to the scanning unit 150 .
- the light used for scanning by the scanning unit 150 is concentrated onto the observed subject 184 by the object lens 164 .
- the optical system that senses fluorescence signals produced from the observed subject 184 is the same as that of the microscope device 10 , and so explanations thereof are omitted.
- FIG. 26 illustrates principles of the proposed technique.
- the pump light, and probe light are intensity-modulated at the frequencies f1, f2 for a length of time, and their time waveforms IPump, and IProbe are represented by the formulae (1.1), (1.2).
- step 1 Stimulated absorption induced by pump light ( 1 );
- step 2 Stimulated emission induced by pump light ( 2 );
- step 3 Stimulated absorption induced by pump light ( 3 );
- step 4 Stimulated emission induced by probe light ( 4 );
- step 5 stimulated absorption induced by probe light ( 5 );
- step 6 stimulated emission induced by probe light ( 6 )
- CES-RF signals can be sensed.
- An advantage of sensing these signals is that, since the sensing signals are obtained as a result of multiple products of pump light, and probe light, the signal generation region is restricted.
- the signals are proportional to each of the third power of I1, and the third power of I2, the signal quantity is significantly increased by raising the pump light intensity I1 or raising the probe light intensity I2, and the signal-to-noise ratio can also be enhanced.
- FIG. 27 illustrates a signal generation region simulation result.
- signal generation regions of a typical confocal microscope (CM), a reduced fluorescence (RF) microscope, CERF, and CSRF are illustrated. It can be known that, due to the effect attained by producing signals in the distribution as represented by the multiple products of pump light and probe light, the signal generation region of CES-RF becomes sharp in both the X direction, and Z direction.
- Steps 1 to 6 is an example, the order of stimulated absorption/stimulated emission induced by pump light, and stimulated absorption/emission induced by probe light can be reversed, and there are various combinations.
- signals with a larger number of times of repetition may be sensed, and in such a case, further resolution enhancement is expected.
- This can be generalized and represented as a formula of demodulation frequencies, i ⁇ f1 ⁇ j ⁇ f2 (i and j are positive integers, and any one of them is equal to or larger than two).
- the scanning unit 150 may be used in the microscope devices 12 to 26 .
- the scanning unit 151 illustrated in FIG. 6 may be used in the microscope devices 12 to 26 .
- the laser light sources 102 , and the like used are continuous wave laser light sources, but may be pulsed laser light sources.
- a pulsed laser provides an advantage of efficiently inducing stimulated emission, and producing reduced fluorescence signals efficiently since its peak intensity is high.
- it also provides an advantage of being able to acquire reduced fluorescence signals reflecting fluorescence lifetime by utilizing temporal differences between pulses. Note that the repetition frequency of pulses is desirably determined taking fluorescence lifetime or damages caused by peak power into consideration.
- CW lasers provide an advantage in terms of lower prices.
- the light-receiving unit 174 , and the like used are photomultipliers, but may be avalanche photodiodes (APDs).
- one-photon excitation is used for excitation in the above-mentioned embodiments
- multiphoton excitation such as two-photon excitation or three-photon excitation may be used.
- the pinhole 408 or the like in a configuration of sensing fluorescence by descanning at the time of reduced fluorescence observation, the pinhole 408 or the like may be narrowed.
- the point spread function of an imaging system also contributes to optical resolution enhancement, and so further resolution enhancement becomes possible.
- a bright fluorescent substance that gives a sufficient amount of light it is desirable to adopt a configuration in which the pinhole 408 or the like is narrowed.
- a dark fluorescent substance that does not give a sufficient amount of light it is desirable to adopt a configuration in which the pinhole 408 or the like is opened.
- a descan optical system may be used in the microscope device 26 , as in the microscope device 12 .
- descan optical systems may not be used in the microscope devices 18 to 24 . If a confocal observation image is acquired using a descan optical system in multicolor observation, first pump light, and second pump light (or first probe light, and second probe light) may be modulated at the frequencies f1, f2, and sensed by lock-in sensing. Thereby, the influence of crosstalk of fluorescence can be suppressed.
- stimulated emission induced by pump light or stimulated emission induced by probe light is utilized for a transition process from the excited state to the ground state
- the present invention is not limited to it, and may utilize contribution of other transition processes.
- contribution of spontaneous emission may also be utilized.
- a phenomenon in which fluorescence becomes not proportional linearly to pump light may be utilized to acquire high-resolution reduced fluorescence signals.
- demodulation is desirably performed at the frequency of i ⁇ f1 ⁇ f2 (i is an integer which is equal to or larger than two).
- the signals may be acquired.
- a phenomenon in which stimulated emission light becomes not proportional linearly to probe light may be utilized to acquire high-resolution reduced fluorescence signals.
- demodulation is desirably performed at the frequency of f1 ⁇ j ⁇ f2 (j is an integer which is equal to or larger than two). If they happen simultaneously, demodulation is desirably performed at i ⁇ f1 ⁇ j ⁇ f2 (i and j are integers which are equal to or larger than two).
- an EOM electro-optical element
- a polarizer may be used, and polarization directions may be switched at high speed to thereby realize optical intensity modulation.
- a mechanical shutter such as a chopper may be used.
- a phase plate (radial polarizer) may be inserted in any of the optical paths of light in the microscope devices 10 to 26 .
- the point spread function of light transparently transmitted through the phase plate becomes sharper in the in-plane direction, and the resolution enhancement effect is increased.
- a use of such a phase plate gives rise to drawbacks such as that (i) side lobes are produced, and (ii) the distribution in the optical-axis direction widens.
- drawbacks such as that (i) side lobes are produced, and (ii) the distribution in the optical-axis direction widens.
- the signal generation region is an overlapping region of multiple types of light, these drawbacks are overcome, and only a benefit of a sharper in-plane direction distribution can be enjoyed.
- phase plates may be inserted for different types of light, or a single phase plate may be inserted in a common optical path of the two types of light.
- a phase plate with another shape may be used.
- a mask may be inserted instead of a phase plate, and the shape of the point spread function may be controlled by making the amplitude of light have a distribution. For example, even if a zone plate is inserted, and a Bessel beam is generated, similar effects can be attained.
- both pump light and probe light may be modulated by independent AOMs.
- a single acousto-optic tunable filter may be used to modulate pump light and probe light.
- An AOTF allows modulation of optical intensities at different modulation frequencies for different wavelengths. If at the time of multicolor observation, there are a plurality of pump lights and probe lights, a single AOTF may be used to modulate the individual lights at different frequencies.
- the microscope devices 10 , 14 , 16 , 18 , 20 , 22 , 24 , 26 may also be provided with the wavelength control unit 230 to control the wavelengths of light from the laser light sources.
- the embodiments may be applied not only to a microscope, but to any fluorescence observation device capable of observing reduced fluorescence.
- dichroic mirrors 162 , 402 transparently transmit therethrough illuminating light, and reflect fluorescence, instead, they may reflect illuminating light, and transparently transmit therethrough fluorescence.
- lock-in amplifiers are explained as means for sensing signal components of particular frequencies, other methods may be utilized.
- signal components of particular frequencies may be sensed after Fourier transform of time signals.
- reference signals with the demodulation frequency may be multiplied with signal light by a frequency converter, and only DC components may be extracted.
- DC components mentioned here are equivalent to values obtained by converting components vibrating in a sine wave form into direct current.
- the voltage input to a driver that drives an AOFS may be a DC power source.
- only one of two AOFSs may have a variable acoustic frequency.
- the acoustic frequencies of two AOFSs may be fixed at different values in advance.
- a signal produced at a particular demodulation frequency is proportional depends on a dominant process that is producing the signal. For example, if demodulation is performed at the frequency of 2f1 ⁇ f2, it may be proportional to the second power of pump light, or may be proportional to the third power of pump light. It may be proportional to the first power of probe light, or may be proportional to the second power of probe light. In addition, for example, if demodulation is performed at the frequency at f1 ⁇ 2f2, it may be proportional to the first power of pump light, or may be proportional to the second power of pump light. It may be proportional to the second power of probe light, or may be proportional to the third power of probe light.
- pump light, and probe light desirably have the same polarization.
- they desirably have the same linear polarization or circular polarization.
- images based on reduced fluorescence may be acquired in the case where pump light and probe light have mutually orthogonal linear polarization, and in the case where pump light and probe light have mutually parallel linear polarization, and the images may be compared to thereby visualize the polarization characteristics of an observed subject. This is because the efficiency of stimulated emission depends on polarization.
Landscapes
- Physics & Mathematics (AREA)
- General Physics & Mathematics (AREA)
- Chemical & Material Sciences (AREA)
- Analytical Chemistry (AREA)
- Optics & Photonics (AREA)
- Health & Medical Sciences (AREA)
- Biochemistry (AREA)
- Life Sciences & Earth Sciences (AREA)
- Nuclear Medicine, Radiotherapy & Molecular Imaging (AREA)
- General Health & Medical Sciences (AREA)
- Immunology (AREA)
- Pathology (AREA)
- Nonlinear Science (AREA)
- Investigating, Analyzing Materials By Fluorescence Or Luminescence (AREA)
- Microscoopes, Condenser (AREA)
- Mechanical Optical Scanning Systems (AREA)
Abstract
Description
- [Non-Patent Literature 1] Lu Wei et. al., Biomedical Optics Express 1465-1475, vol. 3, No. 6, 1 Jun. 2012
[Formula 1]
I Pump(t)=I 1[1+m cos(f 1 t)] (1.1)
I Probe(t)=I 2[1+n cos(f 2 t)] (1.2)
Here, I1 and I2 are the intensities of the pump light and probe light, and m and n are the contrasts of modulation.
In the fluorescent sample, such an interaction between the light and the substance is constantly repeated.
[Formula 4]
A 1 =S 1 (1.5)
[Formula 5]
A 2 =S 1 2 (1.6)
[Formula 6]
A 3 =S 1 3 (1.7)
[Formula 7]
A 4 =S 1 3 S 2 (1.8)
This generation distribution A4 is equivalent to the generation distribution of CERF signals visualized by lock-in sensing. In this manner, by sensing reduced fluorescence signals produced through stimulated absorption and stimulated emission induced by pump light multiple times, it is possible to emphasize contribution of fluorescence generation from the center of a light spot, and to de-emphasize contribution of fluorescence generation from the perimeter of the light spot as illustrated in
In the fluorescent sample, such an interaction between the light and the substance is constantly repeated.
[Formula 9]
A 1 =S 1 (2.2)
[Formula 10]
A 2 =S 1 S 2 (2.3)
[Formula 11]
A 3 =S 1 S 2 2 (2.4)
[Formula 12]
A 4 =S 1 S 2 3 (2.5)
This generation distribution A4 is equivalent to the generation distribution of CSRF signals visualized by lock-in sensing. In this manner, by sensing reduced fluorescence signals produced through stimulated absorption and stimulated emission induced by probe light multiple times, it is possible to emphasize contribution of fluorescence generation from the center of a light spot, and to de-emphasize contribution of fluorescence generation from the perimeter of the light spot as illustrated in
[Formula 13]
I Pump(t)=I 1[1+cos(f 1 t)] (3.1)
I Probe1(t)=I 2[1+cos(f 2 t)] (3.2)
I Probe2(t)=I 3[1+cos(f 3 t)] (3.3)
[Formula 14]
I CERF1(t)∝I Pump a(t)I Probe1(t) (a≥3) (3.4)
I CERF2(t)∝I Pump a(t)I Probe2(t) (a≥3) (3.5)
Accordingly, according to the formula (3.4), a signal received at the light-receiving
[Formula 15]
f de1 =bf 1 ±f 2 (3.6)
On the other hand, according to the formula (3.5), a signal received at the light-receiving
[Formula 16]
f de2 =bf 1 ±f 3 (3.7)
[Formula 17]
I Pump1(t)=I 1[1+cos(f 1 t)] (3.8)
I Pump2(t)=I 2[1+cos(f 2 t)] (3.9)
I Probe(t)=I 3[1+cos(f 3 t)] (3.10)
[Formula 18]
I CSRF1(t)∝I Pump1(t)I Probe a(t) (a≥3) (3.11)
I CSRF2(t)∝I Pump2(t)I Probe a(t) (a≥3) (3.12)
Accordingly, according to the formula (3.11), a signal received at the light-receiving
[Formula 19]
f′ de1 =f 1 ±bf 3 (3.13)
On the other hand, according to the formula (3.12), a signal received at the light-receiving
[Formula 20]
f′ dc2 =f 2 ±bf 3 (3.14)
Here, a≥b≥a−1.
[Formula 21]
I CESRF(t)∝I Pump 3 I Probe 3 =I 1 3 I 2 3[1+cos f 1 t]3[1+cos f 2 t]3 (5.1)
| TABLE 1 |
| Spatial Frequency Components in Formula (5.1) |
| f2: 0 | f2: 1 | f2: 2 | f2: 3 | ||
| f1: 0 | f2 | 2f2 | 3f2 | |
| f1: 1 | f1 | f1 ± f2 | f1 ± 2f2 | f1 ± 3f2 |
| f1: 2 | 2f1 | 2f1 ± f2 | 2f1 ± 2f2 | 2f1 ± 3f2 |
| f1: 3 | 3f1 | 3f1 ± f2 | 3f1 ± 2f2 | 3f1 ± 3f2 |
Claims (13)
Applications Claiming Priority (4)
| Application Number | Priority Date | Filing Date | Title |
|---|---|---|---|
| JP2016-215694 | 2016-11-02 | ||
| JPJP2016-215694 | 2016-11-02 | ||
| JP2016215694 | 2016-11-02 | ||
| PCT/JP2017/039835 WO2018084271A1 (en) | 2016-11-02 | 2017-11-02 | Fluorescence observation device |
Related Parent Applications (1)
| Application Number | Title | Priority Date | Filing Date |
|---|---|---|---|
| PCT/JP2017/039835 Continuation WO2018084271A1 (en) | 2016-11-02 | 2017-11-02 | Fluorescence observation device |
Publications (2)
| Publication Number | Publication Date |
|---|---|
| US20190250386A1 US20190250386A1 (en) | 2019-08-15 |
| US10983323B2 true US10983323B2 (en) | 2021-04-20 |
Family
ID=62076087
Family Applications (1)
| Application Number | Title | Priority Date | Filing Date |
|---|---|---|---|
| US16/394,857 Expired - Fee Related US10983323B2 (en) | 2016-11-02 | 2019-04-25 | Fluorescence observation device |
Country Status (3)
| Country | Link |
|---|---|
| US (1) | US10983323B2 (en) |
| JP (1) | JP6777160B2 (en) |
| WO (1) | WO2018084271A1 (en) |
Families Citing this family (3)
| Publication number | Priority date | Publication date | Assignee | Title |
|---|---|---|---|---|
| DE112021002558T5 (en) * | 2020-05-01 | 2023-03-02 | Hamamatsu Photonics K.K. | Multi-ring mask, light irradiation device, optical microscope and photoacoustic microscope |
| JP2023106643A (en) * | 2020-06-10 | 2023-08-02 | 浜松ホトニクス株式会社 | Observation device and observation method |
| US20240035978A1 (en) * | 2022-07-28 | 2024-02-01 | Fei Deutschland Gmbh | Multi-spot confocal imaging system with spectral multiplexing |
Citations (5)
| Publication number | Priority date | Publication date | Assignee | Title |
|---|---|---|---|---|
| US20080019637A1 (en) | 2005-09-08 | 2008-01-24 | Little Brent E | Polarization Beam Splitter-Polarization Rotator Structure |
| US20100054753A1 (en) | 2008-09-01 | 2010-03-04 | Fujitsu Limited | Apparatus and method for stabilizing polarization state |
| WO2011099269A1 (en) | 2010-02-10 | 2011-08-18 | 国立大学法人大阪大学 | Microscope and observation method |
| JP2014097191A (en) | 2012-11-14 | 2014-05-29 | Canon Inc | Imaging apparatus, imaging method and program |
| US20160103307A1 (en) * | 2014-10-13 | 2016-04-14 | Robert David Frankel | Method and system for stokes interference stimulated fluorescent scattering for in-vivo imaging |
-
2017
- 2017-11-02 JP JP2018549087A patent/JP6777160B2/en not_active Expired - Fee Related
- 2017-11-02 WO PCT/JP2017/039835 patent/WO2018084271A1/en not_active Ceased
-
2019
- 2019-04-25 US US16/394,857 patent/US10983323B2/en not_active Expired - Fee Related
Patent Citations (8)
| Publication number | Priority date | Publication date | Assignee | Title |
|---|---|---|---|---|
| US20080019637A1 (en) | 2005-09-08 | 2008-01-24 | Little Brent E | Polarization Beam Splitter-Polarization Rotator Structure |
| JP2014157372A (en) | 2007-07-24 | 2014-08-28 | Infinera Corp | Polarization beam splitter-polarization rotator structure |
| US20100054753A1 (en) | 2008-09-01 | 2010-03-04 | Fujitsu Limited | Apparatus and method for stabilizing polarization state |
| JP2010060656A (en) | 2008-09-01 | 2010-03-18 | Fujitsu Ltd | Method and device for stabilizing polarization state, and optical signal processing system |
| WO2011099269A1 (en) | 2010-02-10 | 2011-08-18 | 国立大学法人大阪大学 | Microscope and observation method |
| US20120307238A1 (en) | 2010-02-10 | 2012-12-06 | Osaka University | Microscope and observation method |
| JP2014097191A (en) | 2012-11-14 | 2014-05-29 | Canon Inc | Imaging apparatus, imaging method and program |
| US20160103307A1 (en) * | 2014-10-13 | 2016-04-14 | Robert David Frankel | Method and system for stokes interference stimulated fluorescent scattering for in-vivo imaging |
Non-Patent Citations (5)
| Title |
|---|
| English Translation by WIPO of the International Preliminary Report on Patentability dated May 7, 2019 in corresponding International Patent Application No. PCT/JP2017/039835 (7 pages). |
| International Search Report dated Feb. 6, 2018 in corresponding International Application No. PCT/JP2017/039835. |
| Japanese Office Action dated Nov. 12, 2019 in corresponding Japanese Patent Application No. 2018-549087. |
| Wei, Lu et al., "Stimulated emission reduced fluorescence microscopy: a concept for extending the fundamental depth limit of two-photon fluorescence imaging", Biomedical Optics Express, vol. 3, No. 6, Jun. 2012. |
| Written Opinion of the International Searching Authority dated Feb. 6, 2018 in corresponding International Application No. PCT/JP2017/039835. |
Also Published As
| Publication number | Publication date |
|---|---|
| WO2018084271A1 (en) | 2018-05-11 |
| JPWO2018084271A1 (en) | 2019-07-18 |
| JP6777160B2 (en) | 2020-10-28 |
| US20190250386A1 (en) | 2019-08-15 |
Similar Documents
| Publication | Publication Date | Title |
|---|---|---|
| US8487271B2 (en) | Optical microscope configured to simultaneously irradiate the erase light and the stimulation light | |
| US9348127B2 (en) | Methods and apparatuses for structured illumination microscopy | |
| CN105973853B (en) | A kind of super-resolution microscopic method and device based on double mode competition excitation | |
| US9158100B2 (en) | Laser microscope using phase-modulation type spatial light modulator | |
| US6958470B2 (en) | Scanning microscope with a detector and light source for exciting an energy state in a specimen and module for a scanning microscope | |
| US9001321B2 (en) | Microscope and observation method | |
| DE102006056429B3 (en) | Microscope-type imaging device for examining biological and medical test samples, has spatially separating beam splitter for partly separating coherent detection light from incoherent light | |
| US10983323B2 (en) | Fluorescence observation device | |
| US11041760B2 (en) | Optical measurement device and optical measurement method | |
| US10222334B2 (en) | Observation device including illumination optical system and extraction unit and observation method | |
| Görlitz et al. | easySLM‐STED: stimulated emission depletion microscopy with aberration correction, extended field of view and multiple beam scanning | |
| JP7079509B2 (en) | Measuring device and irradiation device | |
| JP2015072462A (en) | Super-resolution observation device and super-resolution observation method | |
| EP2685239A1 (en) | Nonlinear microscope and nonlinear observation method | |
| US6975394B2 (en) | Method and apparatus for measuring the lifetime of an excited state in a specimen | |
| Tsyboulski et al. | Amplitude modulation of femtosecond laser pulses in the megahertz range for frequency-multiplexed two-photon imaging | |
| US10955349B2 (en) | Fluorescence observation device | |
| Wilke | Laser scanning in microscopy | |
| JP6806161B2 (en) | Microscope system | |
| SG182865A1 (en) | Flexible spatial-temporal phase modulator for focal modulation microscopy | |
| Saggau et al. | Review of acousto-optical devices in advanced microscopy: from 3D scanning via super-resolution to encoded multi-beams | |
| JPS6236624A (en) | Scanning type optical microscope | |
| JPH02148012A (en) | Optical heterodyne fluorescent microscope |
Legal Events
| Date | Code | Title | Description |
|---|---|---|---|
| FEPP | Fee payment procedure |
Free format text: ENTITY STATUS SET TO UNDISCOUNTED (ORIGINAL EVENT CODE: BIG.); ENTITY STATUS OF PATENT OWNER: LARGE ENTITY |
|
| AS | Assignment |
Owner name: NIKON CORPORATION, JAPAN Free format text: ASSIGNMENT OF ASSIGNORS INTEREST;ASSIGNOR:DAKE, FUMIHIRO;REEL/FRAME:049053/0799 Effective date: 20190422 |
|
| STPP | Information on status: patent application and granting procedure in general |
Free format text: NOTICE OF ALLOWANCE MAILED -- APPLICATION RECEIVED IN OFFICE OF PUBLICATIONS |
|
| STPP | Information on status: patent application and granting procedure in general |
Free format text: PUBLICATIONS -- ISSUE FEE PAYMENT RECEIVED |
|
| STPP | Information on status: patent application and granting procedure in general |
Free format text: PUBLICATIONS -- ISSUE FEE PAYMENT VERIFIED |
|
| STCF | Information on status: patent grant |
Free format text: PATENTED CASE |
|
| FEPP | Fee payment procedure |
Free format text: MAINTENANCE FEE REMINDER MAILED (ORIGINAL EVENT CODE: REM.); ENTITY STATUS OF PATENT OWNER: LARGE ENTITY |
|
| LAPS | Lapse for failure to pay maintenance fees |
Free format text: PATENT EXPIRED FOR FAILURE TO PAY MAINTENANCE FEES (ORIGINAL EVENT CODE: EXP.); ENTITY STATUS OF PATENT OWNER: LARGE ENTITY |
|
| STCH | Information on status: patent discontinuation |
Free format text: PATENT EXPIRED DUE TO NONPAYMENT OF MAINTENANCE FEES UNDER 37 CFR 1.362 |
|
| FP | Lapsed due to failure to pay maintenance fee |
Effective date: 20250420 |