US10527631B2 - Compositions and methods for programmable sensing and control through combinatorial molecular interactions - Google Patents
Compositions and methods for programmable sensing and control through combinatorial molecular interactions Download PDFInfo
- Publication number
- US10527631B2 US10527631B2 US15/847,909 US201715847909A US10527631B2 US 10527631 B2 US10527631 B2 US 10527631B2 US 201715847909 A US201715847909 A US 201715847909A US 10527631 B2 US10527631 B2 US 10527631B2
- Authority
- US
- United States
- Prior art keywords
- ligand
- bmp
- bmp4
- cell
- nmumg
- Prior art date
- Legal status (The legal status is an assumption and is not a legal conclusion. Google has not performed a legal analysis and makes no representation as to the accuracy of the status listed.)
- Active
Links
- YNEQKUWRFVQFPF-UHFFFAOYSA-N CC1C(C)=C(C)CC1 Chemical compound CC1C(C)=C(C)CC1 YNEQKUWRFVQFPF-UHFFFAOYSA-N 0.000 description 1
Images


Classifications
-
- G—PHYSICS
- G01—MEASURING; TESTING
- G01N—INVESTIGATING OR ANALYSING MATERIALS BY DETERMINING THEIR CHEMICAL OR PHYSICAL PROPERTIES
- G01N33/00—Investigating or analysing materials by specific methods not covered by groups G01N1/00 - G01N31/00
- G01N33/48—Biological material, e.g. blood, urine; Haemocytometers
- G01N33/50—Chemical analysis of biological material, e.g. blood, urine; Testing involving biospecific ligand binding methods; Immunological testing
- G01N33/68—Chemical analysis of biological material, e.g. blood, urine; Testing involving biospecific ligand binding methods; Immunological testing involving proteins, peptides or amino acids
- G01N33/6872—Intracellular protein regulatory factors and their receptors, e.g. including ion channels
-
- C—CHEMISTRY; METALLURGY
- C07—ORGANIC CHEMISTRY
- C07K—PEPTIDES
- C07K14/00—Peptides having more than 20 amino acids; Gastrins; Somatostatins; Melanotropins; Derivatives thereof
- C07K14/435—Peptides having more than 20 amino acids; Gastrins; Somatostatins; Melanotropins; Derivatives thereof from animals; from humans
- C07K14/705—Receptors; Cell surface antigens; Cell surface determinants
- C07K14/71—Receptors; Cell surface antigens; Cell surface determinants for growth factors; for growth regulators
-
- G—PHYSICS
- G01—MEASURING; TESTING
- G01N—INVESTIGATING OR ANALYSING MATERIALS BY DETERMINING THEIR CHEMICAL OR PHYSICAL PROPERTIES
- G01N33/00—Investigating or analysing materials by specific methods not covered by groups G01N1/00 - G01N31/00
- G01N33/48—Biological material, e.g. blood, urine; Haemocytometers
- G01N33/50—Chemical analysis of biological material, e.g. blood, urine; Testing involving biospecific ligand binding methods; Immunological testing
- G01N33/5005—Chemical analysis of biological material, e.g. blood, urine; Testing involving biospecific ligand binding methods; Immunological testing involving human or animal cells
- G01N33/5008—Chemical analysis of biological material, e.g. blood, urine; Testing involving biospecific ligand binding methods; Immunological testing involving human or animal cells for testing or evaluating the effect of chemical or biological compounds, e.g. drugs, cosmetics
- G01N33/502—Chemical analysis of biological material, e.g. blood, urine; Testing involving biospecific ligand binding methods; Immunological testing involving human or animal cells for testing or evaluating the effect of chemical or biological compounds, e.g. drugs, cosmetics for testing non-proliferative effects
- G01N33/5041—Chemical analysis of biological material, e.g. blood, urine; Testing involving biospecific ligand binding methods; Immunological testing involving human or animal cells for testing or evaluating the effect of chemical or biological compounds, e.g. drugs, cosmetics for testing non-proliferative effects involving analysis of members of signalling pathways
-
- G—PHYSICS
- G01—MEASURING; TESTING
- G01N—INVESTIGATING OR ANALYSING MATERIALS BY DETERMINING THEIR CHEMICAL OR PHYSICAL PROPERTIES
- G01N33/00—Investigating or analysing materials by specific methods not covered by groups G01N1/00 - G01N31/00
- G01N33/48—Biological material, e.g. blood, urine; Haemocytometers
- G01N33/50—Chemical analysis of biological material, e.g. blood, urine; Testing involving biospecific ligand binding methods; Immunological testing
- G01N33/53—Immunoassay; Biospecific binding assay; Materials therefor
- G01N33/566—Immunoassay; Biospecific binding assay; Materials therefor using specific carrier or receptor proteins as ligand binding reagents where possible specific carrier or receptor proteins are classified with their target compounds
-
- G—PHYSICS
- G01—MEASURING; TESTING
- G01N—INVESTIGATING OR ANALYSING MATERIALS BY DETERMINING THEIR CHEMICAL OR PHYSICAL PROPERTIES
- G01N33/00—Investigating or analysing materials by specific methods not covered by groups G01N1/00 - G01N31/00
- G01N33/48—Biological material, e.g. blood, urine; Haemocytometers
- G01N33/50—Chemical analysis of biological material, e.g. blood, urine; Testing involving biospecific ligand binding methods; Immunological testing
- G01N33/53—Immunoassay; Biospecific binding assay; Materials therefor
- G01N33/569—Immunoassay; Biospecific binding assay; Materials therefor for microorganisms, e.g. protozoa, bacteria, viruses
- G01N33/56966—Animal cells
-
- G—PHYSICS
- G06—COMPUTING; CALCULATING OR COUNTING
- G06F—ELECTRIC DIGITAL DATA PROCESSING
- G06F17/00—Digital computing or data processing equipment or methods, specially adapted for specific functions
- G06F17/10—Complex mathematical operations
- G06F17/18—Complex mathematical operations for evaluating statistical data, e.g. average values, frequency distributions, probability functions, regression analysis
-
- A—HUMAN NECESSITIES
- A01—AGRICULTURE; FORESTRY; ANIMAL HUSBANDRY; HUNTING; TRAPPING; FISHING
- A01K—ANIMAL HUSBANDRY; CARE OF BIRDS, FISHES, INSECTS; FISHING; REARING OR BREEDING ANIMALS, NOT OTHERWISE PROVIDED FOR; NEW BREEDS OF ANIMALS
- A01K2227/00—Animals characterised by species
- A01K2227/10—Mammal
- A01K2227/105—Murine
-
- G—PHYSICS
- G01—MEASURING; TESTING
- G01N—INVESTIGATING OR ANALYSING MATERIALS BY DETERMINING THEIR CHEMICAL OR PHYSICAL PROPERTIES
- G01N2333/00—Assays involving biological materials from specific organisms or of a specific nature
- G01N2333/435—Assays involving biological materials from specific organisms or of a specific nature from animals; from humans
- G01N2333/475—Assays involving growth factors
- G01N2333/51—Bone morphogenetic factor; Osteogenins; Osteogenic factor; Bone-inducing factor
-
- G—PHYSICS
- G01—MEASURING; TESTING
- G01N—INVESTIGATING OR ANALYSING MATERIALS BY DETERMINING THEIR CHEMICAL OR PHYSICAL PROPERTIES
- G01N2333/00—Assays involving biological materials from specific organisms or of a specific nature
- G01N2333/435—Assays involving biological materials from specific organisms or of a specific nature from animals; from humans
- G01N2333/705—Assays involving receptors, cell surface antigens or cell surface determinants
- G01N2333/71—Assays involving receptors, cell surface antigens or cell surface determinants for growth factors; for growth regulators
-
- G—PHYSICS
- G01—MEASURING; TESTING
- G01N—INVESTIGATING OR ANALYSING MATERIALS BY DETERMINING THEIR CHEMICAL OR PHYSICAL PROPERTIES
- G01N2500/00—Screening for compounds of potential therapeutic value
- G01N2500/02—Screening involving studying the effect of compounds C on the interaction between interacting molecules A and B (e.g. A = enzyme and B = substrate for A, or A = receptor and B = ligand for the receptor)
-
- G—PHYSICS
- G01—MEASURING; TESTING
- G01N—INVESTIGATING OR ANALYSING MATERIALS BY DETERMINING THEIR CHEMICAL OR PHYSICAL PROPERTIES
- G01N2500/00—Screening for compounds of potential therapeutic value
- G01N2500/10—Screening for compounds of potential therapeutic value involving cells
Definitions
- BMP Bone Morphogenetic Protein
- Wnt Wnt
- Notch Notch
- JAK-STAT JAK-STAT
- these systems comprise multiple ligand and receptor variants that interact promiscuously with one another to combinatorially generate a large set of distinct signaling complexes. These complexes activate the same intracellular targets, and therefore appear to operate redundantly.
- the use of redundant ligands and receptors has been thought to offer regulatory flexibility or provide robustness to genetic variation. However, redundancy does not appear to provide a complete understanding of these pathways. Methods to more specifically manipulate signaling pathways are desirable in many applications, including cell-based therapeutics and directed cell differentiation.
- a method of inducing a bone morphogenetic protein (BMP)-dependent response in a cell includes a mouse mammary gland (NMuMG)-like BMP receptor profile, an embryonic stem cell (ESC)-like BMP receptor profile, an overexpressed BMPR1B NMuMG-like BMP receptor profile, or an overexpressed ALK1 NMuMG-like BMP receptor profile, wherein the method includes exposing the cells having the NMuMG-like BMP receptor profile to heterologous BMPs selected from BMP4, BMP9, BMP10, or a mixture of BMP4 and BMP9; exposing the cells comprising the ESC-like BMP receptor profile to heterologous BMPs selected from a mixture of BMP4 and BMP9; exposing the cells having the overexpressed BMPR1B NMuMG-like BMP receptor profile to heterologous BMPs selected from BMP4, BMP9, BMP10, GDF5, a mixture of BMP4 and B
- NMuMG mouse ma
- a composition for inducing a bone morphogenetic protein (BMP)-dependent response in a cell includes a mouse mammary gland (NMuMG)-like BMP receptor profile, an embryonic stem cell (ESC)-like BMP receptor profile, an overexpressed BMPR1B NMuMG-like BMP receptor profile, or an overexpressed ALK1 NMuMG-like BMP receptor profile, the composition including: a mixture of heterologous BMP4 homodimers and heterologous BMP9 homodimers for inducing the BMP-dependent response in the cell comprising the NMuMG-like BMP receptor profile or the ESC-like BMP receptor profile; a mixture of heterologous BMP4 homodimers and heterologous BMP9 homodimers or a mixture of heterologous BMP4 homodimers and heterologous GDF5 homodimers for inducing the BMP-dependent response in the cell having the overexpressed BMPR1B-like BMP receptor profile
- NMuMG mouse ma
- FIG. 1A is a schematic depicting how promiscuous receptor-ligand interactions can be analyzed in terms of multi-dimensional ligand and receptor spaces with t bone morphogenetic protein (BMP) ligand variants depicted by different colors (dark blue, light blue, light green, dark green) and distinct BMP receptors depicted by different colors (purple, yellow, pink, orange), according to embodiments of the present invention.
- BMP bone morphogenetic protein
- FIG. 1B depicts the BMP signaling pathway with multiple ligand variants (blue, green) interacting promiscuously with multiple distinct type I (orange, yellow)-type II (purple, pink) receptor heterodimers, where ligands interact with multiple receptor complexes (arrows), but all active signaling complexes phosphorylate the same second messenger, SMAD1/5/8 (indicated by the yellow P), and phosphorylated SMAD1/5/8 in complex with SMAD4 activates endogenous targets (white) and a stably integrated fluorescent reporter gene (e.g., H2B-Citrine) (yellow), according to embodiments of the present invention.
- a stably integrated fluorescent reporter gene e.g., H2B-Citrine
- FIG. 1C shows how cellular environments and expression levels can be represented as points in multi-dimensional spaces where ligand concentration space of BMP4 (light green), BMP9 (dark green), and BMP10 (light blue)) represents the possible local environments of cells, where only these 3 ligands are plotted for simplicity, but the full space includes dimensions for each ligand species with zoomed circles indicating examples of two environments with distinct concentrations of ligands, according to embodiments of the present invention.
- BMP4 light green
- BMP9 dark green
- BMP10 light blue
- FIG. 1D shows how cellular environments and expression levels can be represented as points in multi-dimensional spaces where receptor space represents the space of possible receptor expression profiles with 3 of 7 dimensions shown—BMPR2 (orange), ACVR2B (yellow), and BMPR1A (purple)—with two example cell types with distinct receptor expression profiles indicated by small circles at the respective loci and in the magnified circles, according to embodiments of the present invention.
- FIG. 1E is a schematic representing the question of how multiple ligands combine to determine pathway activity in a given cell type, according to embodiments of the present invention.
- FIG. 1F is a schematic representing the question of how different cell types respond to the same ligand combination, according to embodiments of the present invention.
- FIG. 2A is a graph of NMuMG BMP reporter cells analyzed by flow cytometry for both reporter H2B-Citrine expression (x-axis), and immunostaining of phosphorylated SMAD1/5/8 (y-axis) after treatment (e.g., stimulation) with different concentrations of BMP4 (from 0 ng/ml up to 250 ng/ml represented by variously colored dots as indicated), with a strong correlation both within (scatter) and between (larger circles) ligand concentrations, according to embodiments of the present invention.
- FIG. 2B is three graphs of qualitative reverse transcriptase PCR (qRT-PCR) measurements of expression levels of three endogenous BMP-responsive genes (Id1, Smad6, and Klf10), as indicated, showing a correlation of mRNA expression of these endogenous BMP-responsive genes with H2B-Citrine reporter expression, according to embodiments of the present invention.
- qRT-PCR quantitative reverse transcriptase PCR
- FIG. 2C shows qRT-PCR correlation coefficients for each pair of target genes shown in FIG. 5B , according to embodiments of the present invention.
- FIG. 2D is a graph showing unimodal distributions of reporter H2B-Citrine expression levels at 24 hours after stimulation of NMuMG BMP reporter cells across the indicated range of BMP4 concentrations represented by distinctly colored lines as indicated, according to embodiments of the present invention.
- FIG. 2E is a graph measuring the normalized amount of phosphorylated SMAD1/5/8 in NMuMG BMP reporter cells when measured using immunoblotting at time-points up to 48 hours (2880 minutes) after BMP addition where after a short transient of a few hours, phosphorylated SMAD1/5/8 levels remained constant, with the plot showing mean and standard deviation (error bars) of 3 independent repeats, according to embodiments of the present invention.
- FIG. 2F is two graphs each measuring fluorescence over time in NMuMG BMP reporter cells that were exposed to different concentrations of BMP4 (top graph) (from 0 ng/ml up to 1000 ng/ml represented by variously colored dots as indicated) or BMP10 (bottom graph) (from 0 ng/ml up to 3000 ng/ml represented by variously colored dots as indicated) for which fluorescence was monitored using time-lapse microscopy over more than 48 hours, increases in mean fluorescence per cell occurred in most conditions, and the vertical dashed line indicates the 24 hour time point, according to embodiments of the present invention.
- FIG. 2G is a schematic showing 4 modes of ligand integration, according to embodiments of the present invention, in which Type I is characterized by a strong response to mixed ligands (green), with weaker responses to the individual ligands (gray), Type II is characterized by a weak response to mixed ligands (red) in comparison to individual ligands, and where the mixed response is intermediate (dark blue), two additional integration modes can be realized: the type III integration mode is characterized by decreased activity in response to removal of one ligand (dark blue to light blue), and a type IV integration mode occurs when removal of one of the ligands causes an increase in the response (dark blue to purple).
- FIG. 2H is a ligand matrix using the low resolution ligand survey of FIG. 5A in which all pairs of ligands were classified across the 4 integration modes in FIG. 5G using the same representative colors, where for every pair, the likelihood of each mode was calculated as disclosed herein, and the corresponding square was colored by bands with widths proportional to the relative likelihood of each mode for which the appearance of multiple colors in the same square thus indicates uncertainty about the integration mode.
- FIG. 3A is a ligand matrix of a low resolution ligand survey of reporter H2B-Citrine expression in NMuMG BMP reporter cells exposed to 136 different combinatorial pairings of 15 homodimeric BMP ligands, as indicated, in which the color scale indicates mean fluorescence level at 24 hours, normalized by the uninduced population (‘relative activity’), with the relative activity of reporter H2B-Citrine expression shown in blue, green, orange, or yellow as indicated, according to embodiments of the present invention.
- FIG. 3B is a ligand matrix showing the relative activity of the individual response as measured by reporter H2B-Citrine expression in NMuMG BMP reporter cells to each ligand (top row) compared to the response to BMP4 (bottom row) and to mixtures of each ligand with BMP4 (middle row) showing that specific ligands combine with BMP4 in different ways, both synergistically and antagonistically, with the relative activity of reporter H2B-Citrine expression shown in blue, green, orange, or yellow as indicated, according to embodiments of the present invention.
- FIG. 3C is a ligand matrix of measurements of full input-output response profiles as measured by reporter H2B-Citrine expression in NMuMG BMP reporter cells for specific ligand pairs showing that BMP4 and BMP9 combine to increase pathway activity in an additive fashion, where the dashed outline in the matrix indicates a set of ligand concentrations varying from high concentration of one ligand (top left corner) to high concentration of the other ligand through intermediate states containing both ligands (e.g. top right), the bottom row and left column correspond to an absence of the indicated ligand with the relative activity of reporter H2B-Citrine expression shown in blue, green, orange, or yellow as indicated, according to embodiments of the present invention.
- FIG. 3D is a ligand matrix of measurements of full input-output response profiles as measured by reporter H2B-Citrine expression in NMuMG BMP reporter cells for specific ligand pairs showing that BMP4 and GDF5 combine in a ratiometric manner, where the dashed outline in the matrix indicates a set of ligand concentrations varying from high concentration of one ligand (top left corner) to high concentration of the other ligand through intermediate states containing both ligands (e.g. top right), the bottom row and left column correspond to an absence of the indicated ligand with the relative activity of reporter H2B-Citrine expression shown in blue, green, orange, or yellow as indicated, according to embodiments of the present invention.
- FIG. 3E is a ligand matrix of measurements of full input-output response profiles as measured by reporter H2B-Citrine expression in NMuMG BMP reporter cells for specific ligand pairs showing that the combination of BMP4 and BMP10 result in an ‘imbalance detection’ response, where the dashed outline in the matrix indicates a set of ligand concentrations varying from high concentration of one ligand (top left corner) to high concentration of the other ligand through intermediate states containing both ligands (e.g. top right), the bottom row and left column correspond to an absence of the indicated ligand with the relative activity of reporter H2B-Citrine expression shown in blue, green, orange, or yellow as indicated, according to embodiments of the present invention.
- FIG. 3F is a graph of the relative activity responses as measured by reporter H2B-Citrine expression in NMuMG BMP reporter cells across a range of concentration ratios of BMP4 and BMP9 from 0:1 to 1:1 and 1:1 to 1:0 as indicated schematically on the x-axis with the logarithmic levels of each ligand across the range of ratios shown in green for BMP4 and blue for BMP9, and error bars indicate the standard deviation calculated from at least 3 experiments, according to embodiments of the present invention.
- FIG. 3G is a graph of the relative activity responses as measured by reporter H2B-Citrine expression in NMuMG BMP reporter cells across a range of concentration ratios of BMP4 and GDF5 from 0:1 to 1:1 and 1:1 to 1:0 as indicated schematically on the x-axis with the logarithmic levels of each ligand across the range of ratios shown in green for BMP4 and blue for GDF5, and error bars indicate the standard deviation calculated from at least 3 experiments, according to embodiments of the present invention.
- FIG. 3H is a graph of the relative activity responses and ligand ratio profile as measured by reporter H2B-Citrine expression in NMuMG BMP reporter cells across a range of concentration ratios of BMP4 and BMP10 from 0:1 to 1:1 and 1:1 to 1:0 as indicated schematically on the x-axis with the logarithmic levels of each ligand across the range of ratios shown in green for BMP4 and blue for BMP10, and error bars indicate the standard deviation calculated from at least 3 experiments, according to embodiments of the present invention.
- FIG. 4A shows the measured pathway activities of reporter H2B-Citrine expression in NMuMG BMP reporter cells plotted across all points in ligand matrices (with measured pathway relative activity shown in blue, green, orange, or yellow as indicated), adjusted ratio ligand concentration plots (upper plot), and summed ligand concentration plots (lower plot) for each indicated ligand pair (BMP4 and BMP9, BMP4 and GDF5, BMP4 and BMP10), where for most of the variation in activity in BMP4 and BMP9 can be explained by the sum of the two ligands, for BMP4 and GDF5 the data are better explained as a function of an adjusted ratio with the GDF5 concentration offset by a constant, representing the threshold above which the response becomes approximately ratiometric, and for BMP4 and BMP10, the response approximately follows a non-monotonic function of the ratio, according to embodiments of the present invention.
- FIG. 4B shows similar activity plots as in FIG. 7A for archetypes generated in the model representing each type of activity (Additive, Ratiometric, Imbalance, and Balance), according to embodiments of the present invention.
- FIG. 4C shows ligand matrices of measured pathway relative activity shown in blue, green, orange, or yellow as indicated in an independent BMP response element (BRE)-based sensor cell line (NMuMG D1 cell line) generated from NMuMG cells using a different integration technique (PiggyBAC method as disclosed herein), the results showing that exposure to the same BMP ligand pairs results in similar combined responses to the NMuMG reporter cells as shown in FIGS. 3C-3E , according to embodiments of the present invention.
- BRE BMP response element
- FIG. 4D shows ligand matrices of measured pathway activities using ligands (BMP4, BMP10, and GDF5 as indicated) acquired from a different source (PeproTech®) in which similar responses to those acquired from R&D Systems® in FIGS. 3D-3E , according to embodiments of the present invention.
- FIG. 4E shows an immunoblot and corresponding graph of the relative amounts of phosphorylated SMAD1/5/8 in cells exposed to a single ligand (BMP4 or BMP10), a ligand combination (BMP4 and BMP10), or no ligand (none), the results showing that BMP4 and BMP10 in combination exhibited imbalanced activity as indicated by the decrease in the amount of phosphorylated SMAD1/5/8, in which the results are normalized to the un-activated condition, and represent the mean and standard deviation of at least 3 independent repeats, according to embodiments of the present invention.
- BMP4 or BMP10 single ligand
- BMP4 and BMP10 a ligand combination
- no ligand no ligand
- FIG. 4F shows an immunoblot and corresponding graph of the relative amounts of phosphorylated SMAD1/5/8 in cells exposed to a single ligand (BMP4 or GDF5), a ligand combination (BMP4 and GDF5), or no ligand (none), the results showing that BMP4 and GDF5 in combination exhibited a ratiometric response as indicated by the amount of phosphorylated SMAD1/5/8, in which the results are normalized to the un-activated condition, and represent the mean and standard deviation of at least 3 independent repeats, according to embodiments of the present invention.
- BMP4 or GDF5 single ligand
- BMP4 and GDF5 a ligand combination
- no ligand no ligand
- FIG. 4G shows immunoblots and corresponding graphs of the relative amounts of ERK phosphorylation by measuring the relative amounts of phosphorylation of ERK1 and ERK2 in response to BMP ligands where both ERK1 and ERK2 respond dose-dependently to epidermal growth factor 1 (EGF1) as shown on the right, and ERK1 and ERK2 show no change in phosphorylation in the presence of BMP4, BMP10, or GDF5 alone or in the indicated combinations as shown in the immunoblots and graphs on the left and middle, in which the results are normalized to the un-activated condition and represent the mean and standard deviation of at least 3 independent repeats, according to embodiments of the present invention.
- EGF1 and ERK2 epidermal growth factor 1
- FIG. 5A shows ligand matrices representing the relative amount of phosphorylated SMAD (pSMAD) in response to the indicated ligand concentrations and combinations (left to right: BMP4 and BMP9, BMP4 and GDF5, and BMP4 and BMP10, as measured by phospho-SMAD immunostaining after 20 minutes after ligand addition, according to embodiments of the present invention.
- pSMAD phosphorylated SMAD
- FIG. 5B is a ligand matrix representing the normalized fluorescence of reporter H2B-Citrine expression in NMuMG BMP reporter cells in response to mixtures of BMP4 and BMP10 plotted over 70 hours after addition of the ligands in which data is normalized at each time point to the response of cells treated with BMP4 only, according to embodiments of the present invention.
- FIG. 5C is graph of the relative expression level of the indicated BMP modifier (Fst, RGMb, or Twsg1) in NMuMG cells in the presence Fst, RGMb, or Twsg1 siRNA, where the relative expression levels of Fst, RGMb and Twsg1 were measured using qPCR in cells transfected with the corresponding siRNA (blue) normalized to their levels in cells transfected with a random siRNA (grey), where error bars indicate standard deviation calculated from 3 independent experiments according to embodiments of the present invention.
- Fst, RGMb, or Twsg1 siRNA indicated BMP modifier
- FIG. 5D is a graph of the relative activity of reporter H2B-Citrine expression in NMuMG BMP reporter cells treated with varying levels of BMP4 and the indicated ligand: BMP9 (blue), GDF5 (purple), or BMP10 (red) after depletion by random siRNA establishing control expression profile, where error bars indicate standard deviation calculated from 3 independent experiments according to embodiments of the present invention.
- FIG. 5E is a graph of the relative activity of reporter H2B-Citrine expression in NMuMG BMP reporter cells treated with varying levels of BMP4 and the indicated ligand: BMP9 (blue), GDF5 (purple), or BMP10 (red) after depletion with Fst siRNA, where error bars indicate standard deviation calculated from 3 independent experiments according to embodiments of the present invention.
- FIG. 5F is a graph of the relative activity of reporter H2B-Citrine expression in NMuMG BMP reporter cells treated with varying levels of BMP4 and the indicated ligand: BMP9 (blue), GDF5 (purple), or BMP10 (red) after depletion with RGMb siRNA, where error bars indicate standard deviation calculated from 3 independent experiments according to embodiments of the present invention.
- FIG. 5G is a graph of the relative activity of reporter H2B-Citrine expression in NMuMG BMP reporter cells treated with varying levels of BMP4 and the indicated ligand: BMP9 (blue), GDF5 (purple), or BMP10 (red) after depletion with Twsg1 siRNA, according to embodiments of the present invention.
- FIG. 6A is a ligand matrix representing the normalized fluorescence of reporter H2B-Citrine expression in NMuMG BMP reporter cells in response to mixtures of BMP4 and BMP10 with pathway responses (reporter H2B-Citrine expression) analyzed at different time points after ligand addition, with the results showing that while absolute fluorescence levels increased over time, the imbalance response is visible at all time points, from 6 to 96 hours after ligand stimulations, according to embodiments of the present invention.
- FIG. 6B is graph showing fold imbalance of BMP4 and BMP10 combination quantified as the ratio of the least active individual ligand to activation by both ligands, in which the measured activities were shown to be stable over the duration of the experiment, where error bars indicate the standard deviation calculated from 3 independent experiments, according to embodiments of the present invention.
- FIG. 6C is a ligand matrix representing the relative activity measured as fluorescence of reporter H2B-Citrine expression in NMuMG BMP reporter cells in response to mixtures of BMP4 with BMP10, BMP9, or GDF5 as indicated and treatment with siRNA against SMAD6 (siSmad6) or with a random sequence (siRND), the results showing that SMAD6 knockdown does not disrupt ligand integration, according to embodiments of the present invention.
- FIG. 6D is a graph of Smad6 relative expression quantified by qPCR showing that siRNA treatment reduced Smad6 transcript by approximately 90% where the error bars indicate standard deviation calculated from 3 independent experiments, according to embodiments of the present invention.
- FIG. 6G is a ligand matrix representing the relative activity measured as fluorescence of reporter H2B-Citrine expression in NMuMG BMP reporter cells in response to mixtures of BMP4 with BMP10 or GDF5 as indicated in response to treatment with NaClO 3 to inhibit the biosynthesis of heparin sulfate proteoglycans (HSPGs), according to embodiments of the present invention.
- HSPGs heparin sulfate proteoglycans
- FIG. 6H is a ligand matrix representing the relative activity measured as fluorescence of reporter H2B-Citrine expression in NMuMG BMP reporter cells in response to mixtures of BMP4 with BMP10 or GDF5 as indicated in the presence or absence of heparinase to remove HSPG, according to embodiments of the present invention.
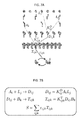
- FIG. 7A is schematic representation of ligands (top row, green), type A receptors (second row, red), type B receptors (third row, purple), intermediate complexes (fourth row), and signaling complexes (fifth row), in which only a subset of possible complexes is shown for simplicity, colored lines highlight interactions involved in the formation of a single signaling complex, with corresponding parameters indicated, according to embodiments of the present disclosure.
- FIG. 7B show reactions (left) and corresponding steady-state equations (right) for the model shown in FIG. 7A , according to embodiments of the present disclosure.
- FIG. 7C is graph using 2 ligands and 2 variants of each receptor type, plotting the relative ligand strength versus the ligand interference coefficient (the type and strength of interference between the 2 ligands with antagonism have negative values and synergy having positive values, the plot showing that the model produces a variety of different signal processing behaviors, where each point represents the behavior of one randomly chosen parameter set, and most parameter sets generate computations that fall within a triangular region, while some show more extreme phenotypes, according to embodiments of the present disclosure.
- FIG. 7D shows a representative ligand matrix characterizing ligand-dependent response with each of Ligand 1 and Ligand 2 alone and in combination as a result of pathway activity as a function of ligand ratio in which Ligand 1 and Ligand 2 show an Additive type response in combination, according to embodiments of the present disclosure.
- FIG. 7E shows a representative ligand matrix characterizing ligand-dependent response with each of Ligand 1 and Ligand 2 alone and in combination as a result of pathway activity as a function of ligand ratio in which Ligand 1 and Ligand 2 show a Ratiometric type response in combination, according to embodiments of the present disclosure.
- FIG. 7F shows a representative ligand matrix characterizing ligand-dependent response with each of Ligand 1 and Ligand 2 alone and in combination as a result of pathway activity as a function of ligand ratio in which Ligand 1 and Ligand 2 show an Imbalance type response in combination, according to embodiments of the present disclosure.
- FIG. 7G shows a representative ligand matrix characterizing ligand-dependent response with each of Ligand 1 and Ligand 2 alone and in combination as a result of pathway activity as a function of ligand ratio in which Ligand 1 and Ligand 2 show a Balance type response in combination, according to embodiments of the present disclosure.
- FIG. 8A shows a series of ligand matrices using the mathematical model where different biochemical parameter sets generate a range of 2-ligand integration functions in which the steady-state response for 50 randomly selected parameter sets (grid of heat maps) was plotted in which a broad range of behaviors and the general dependence on ratiometric features at high total ligand concentrations is noted and reflected by the diagonal contours, according to embodiments of the present disclosure.
- FIG. 8B shows analysis of 2 ligand response profiles parameterized by Relative Ligand Strength (RLS) and Ligand Interference Coefficient (LIC) in which these coefficients are determined by four activity levels that can be extracted from the high total ligand regime: the activity generated by the weaker (a) and stronger (b) ligands individually, as well as the maximal (c) and minimal (d) activity over the entire high ligand region, denoted by satmax and satmin, respectively, according to embodiments of the present disclosure.
- RLS Relative Ligand Strength
- LIC Ligand Interference Coefficient
- FIG. 8C shows determination of RLS and LIC for imbalance, according to embodiments of the present disclosure.
- FIG. 8D shows determination of RLS and LIC for balance, according to embodiments of the present disclosure.
- FIG. 8E graphically shows for each (LIC, RLS) coordinate pair the computed mean response functions for 5 biochemical parameter sets generating phenotypic parameters close to the indicated (LIC, RLS) point (location of heatmap) with inset zooms in one specific (RLS, LIC) point, according to embodiments of the present disclosure.
- FIG. 8F shows ligand matrices for a specific set of K ij , K ijk values as indicated, the level of each trimeric signaling complex, T ijk , is plotted as a function of the concentrations of two ligands, according to embodiments of the present disclosure.
- FIG. 8G shows ligand matrices for 4 specific sets of activities ( ⁇ ijk ), each of which generates a distinct response profile, despite using the same affinity parameters, showing that the total pathway response depends in general on the levels of all trimeric complexes, each multiplied by a corresponding activity parameter, according to embodiments of the present disclosure.
- FIG. 9A is dot plot of 100,000 simulations performed on randomly chosen parameter sets with (lower) and without (upper) allowing for consumption of ligands by cells, in which the calculated ligand interference coefficient (LIC) and relative ligand strength (RLS) show similar distributions and produce all computations in both cases, according to embodiments of the present disclosure.
- LIC ligand interference coefficient
- RLS relative ligand strength
- FIG. 9B shows full 2D input-output ligand matrices plotted for parameter sets corresponding to the 4 archetypes in which the models are with (center) and without (left) ligand consumption with the difference (right column) between the two models (constant ligand, left, vs. consumed ligand, middle) demonstrating that the effects of ligand consumption are most significant at intermediate ligand levels, giving rise to a sharper signal response, according to embodiments of the present disclosure.
- FIG. 9C is a dot plot graph using 100,000 parameter sets randomly selected either from the complete theoretically available parameter space, assuming a uniform distribution for the dimensional reduced parameters based on previously measured valued for BMP affinities, with specific regions in the neighborhood of each archetype boxed as indicated with the colored boxes, according to embodiments of the present disclosure.
- FIG. 9D is a dot plot graph using 100,000 parameter sets randomly selected either from the complete theoretically available parameter space, restricted to a biologically relevant range based on previously measured valued for BMP affinities, with specific regions in the neighborhood of each archetype boxed as indicated with the colored boxes, according to embodiments of the present disclosure.
- FIG. 9E is a graph showing the percent of parameter sets giving rise to each response type is shown for the unrestricted parameter selection (black) and for parameters restricted to the biologically relevant range (grey), in which the uncertainty was estimated by calculating a standard deviation between 10,000 bootstrapped samples of size 100,000, according to embodiments of the present disclosure.
- FIG. 10A shows a schematic representing an Additive computation in which the left-hand schematic represents a parameter regime sufficient for the computation corresponding to FIG. 11A , with arrow thicknesses represent the relative affinities or activities of indicated complexes, arrow color represents the identity of the ligand in a given complex, with the response profile across the ligand compositions is shown on the right, in which the behavior of the system is also indicated schematically above the plot for three ligand composition regimes: only one ligand present (left and right) or an equal mixture of ligands (center), with hollow ligands representing those not present in each case, where for each regime, some reactions don't occur (because a particular ligand is not present) or are disfavored (because of competition), and the total activity of the system in each of these three regimes is indicated by the number of copies of the phosphorylated second messenger, according to embodiments of the present disclosure.
- FIG. 10B shows a schematic representing a Ratiometric computation in which the left-hand schematic represents a parameter regime sufficient for the computation corresponding to FIG. 11A , with arrow thicknesses represent the relative affinities or activities of indicated complexes, arrow color represents the identity of the ligand in a given complex, with the response profile across the ligand compositions is shown on the right, in which the behavior of the system is also indicated schematically above the plot for three ligand composition regimes: only one ligand present (left and right) or an equal mixture of ligands (center), with hollow ligands representing those not present in each case, where for each regime, some reactions don't occur (because a particular ligand is not present) or are disfavored (because of competition), and the total activity of the system in each of these three regimes is indicated by the number of copies of the phosphorylated second messenger, according to embodiments of the present disclosure.
- FIG. 10C shows a schematic representing an Imbalance Detection computation in which the left-hand schematic represents a parameter regime sufficient for the computation corresponding to FIG. 11A , with arrow thicknesses represent the relative affinities or activities of indicated complexes, arrow color represents the identity of the ligand in a given complex, with the response profile across the ligand compositions is shown on the right, in which the behavior of the system is also indicated schematically above the plot for three ligand composition regimes: only one ligand present (left and right) or an equal mixture of ligands (center), with hollow ligands representing those not present in each case, where for each regime, some reactions don't occur (because a particular ligand is not present) or are disfavored (because of competition), and the total activity of the system in each of these three regimes is indicated by the number of copies of the phosphorylated second messenger, according to embodiments of the present disclosure.
- FIG. 10D shows a schematic representing a Balance Detection computation in which the left-hand schematic represents a parameter regime sufficient for the computation corresponding to FIG. 11A , with arrow thicknesses represent the relative affinities or activities of indicated complexes, arrow color represents the identity of the ligand in a given complex, with the response profile across the ligand compositions is shown on the right, in which the behavior of the system is also indicated schematically above the plot for three ligand composition regimes: only one ligand present (left and right) or an equal mixture of ligands (center), with hollow ligands representing those not present in each case, where for each regime, some reactions don't occur (because a particular ligand is not present) or are disfavored (because of competition), and the total activity of the system in each of these three regimes is indicated by the number of copies of the phosphorylated second messenger, according to embodiments of the present disclosure.
- FIG. 11A is a schematic of a representative interaction when two ligands are equivalent (similar arrow thicknesses), they combine additively, where upper and middle arrow thicknesses indicate the affinities K ij D and K ijk T , respectively, and lower arrow thicknesses indicate the phosphorylation rate of each signaling complex ⁇ ijk , according to embodiments of the present disclosure.
- FIG. 11B is a schematic of a representative interaction when different ligands generate different levels of activity in complex with the same receptors (thin vs. thick bottom arrows), the less active ligand (blue) competitively inhibits the more active ligand (green), leading to ratiometric behavior, where upper and middle arrow thicknesses indicate the affinities K ij D and K ijk T , respectively, and lower arrow thicknesses indicate the phosphorylation rate of each signaling complex ⁇ ijk , according to embodiments of the present disclosure.
- FIG. 11C is a schematic of a representative interaction when imbalance detection regimes occur when affinity and activity parameters enable ligands to preferentially form less active complexes, where upper and middle arrow thicknesses indicate the affinities K ij D and K ijk T , respectively, and lower arrow thicknesses indicate the phosphorylation rate of each signaling complex ⁇ ijk , according to embodiments of the present disclosure.
- FIG. 11D is a schematic of a representative interaction when balance detection regimes occur when affinity and activity parameters enable ligands to preferentially form more active complexes, where upper and middle arrow thicknesses indicate the affinities K ij D and K ijk T , respectively, and lower arrow thicknesses indicate the phosphorylation rate of each signaling complex ⁇ ijk , according to embodiments of the present disclosure.
- FIG. 11E is a schematic of the parameter regime corresponding to the imbalance detection, cells exposed only to a single ligand species (i.e. only blue or green ligands) produce a mixture of strong and weakly active complexes (left, right), but cells exposed to mixtures of the two ligands predominantly form weakly active complexes (middle), leading to the imbalance detection behavior, according to embodiments of the present disclosure.
- FIG. 12A is a graphical comparison of two simulated biochemical parameter sets, where for each set, multiple receptor expression profiles are plotted (individual dots), and dot color indicates the most similar archetype, for one parameter set (non-versatile, left), receptor expression only weakly affected computation, and for the other parameter set (versatile, right), variation in receptor expression generates the full range of possible computations, according to embodiments of the present disclosure.
- FIG. 12B is a graph showing BMP receptor expression profiles for three cell lines, as indicated where bars indicate expression levels of each receptor (FPKM), and error bars represent standard deviation of three independent biological replicates, according to embodiments of the present disclosure.
- FIG. 12C shows computation correlates with receptor expression pattern for ligand pairs (BMP4-BMP9) in NMuMG cells, NIH3T3 cells, and mouse embryonic stem cells (mESC), with a significant qualitative change in function between mESCs and the other cell lines, and line colors refer to closest archetype as in FIGS. 11A-11E , according to embodiments of the present disclosure.
- FIG. 12D shows computation correlates with receptor expression pattern for ligand pairs (BMP4-GDF5) in NMuMG cells, NIH3T3 cells, and mouse embryonic stem cells (mESC), with a significant qualitative change in function between mESCs and the other cell lines, and line colors refer to closest archetype as in FIGS. 11A-11E , according to embodiments of the present disclosure.
- BMP4-GDF5 receptor expression pattern for ligand pairs
- mESC mouse embryonic stem cells
- FIG. 12E shows computation correlates with receptor expression pattern for ligand pairs (BMP4-BMP10) in NMuMG cells, NIH3T3 cells, and mouse embryonic stem cells (mESC), where each column shows the response to the same pair of ligands for the indicated pair of ligands. Note the qualitative change in function between mESCs (bottom) and the other cell lines, and line colors refer to closest archetype as in FIG. 11C , according to embodiments of the present disclosure.
- FIG. 12F shows computation correlates of perturbing receptor expression level reprograms computations in NMuMG cells for ligand pairs BMP4-BMP9, according to embodiments of the present disclosure.
- FIG. 12G shows computation correlates of perturbing receptor expression level reprograms computations in NMuMG cells for ligand pairs BMP4-GDF5, according to embodiments of the present disclosure.
- FIG. 12H shows computation correlates of perturbing receptor expression level reprograms computations in NMuMG cells for ligand pairs BMP4-BMP10, according to embodiments of the present disclosure.
- FIG. 12I shows a ligand matrix for NMuMG, NMuMG with overexpressed BMPR1B, and NMuMG with overexpressed ALK1 cells exposed in the indicated concentrations to BMP4 and BMP9.
- FIG. 12J shows a ligand matrix for NMuMG, NMuMG with overexpressed BMPR1B, and NMuMG with overexpressed ALK1 cells exposed in the indicated concentrations to BMP4 and BMP10.
- FIG. 13A shows the relative ligand strength (RLS) and ligand interference coefficient (LIC) are plotted for each ligand pair (shape), for different cell lines (fill style).
- FIG. 13B shows RLS and LIC are plotted for each ligand pair (shape), for wild-type (filled), and each indicated receptor perturbation (hollow).
- FIG. 13C shows expression levels of all 7 BMP receptors in NMuMG cells were measured using RT-qPCR, for each receptor perturbation (indicated) to quantify the effect size and specificity of knockdown or overexpression where the values represent fold expression relative to Sdha expression, relative to control cells, either wildtype (for receptor overexpression) or a non-specific siRNA (for receptor knock down).
- FIGS. 13D, 13E, and 13F show effects of noise in receptor expression on ligand integration mode with the effects of noise analyzed on 5 specific parameter sets representing different response profiles (colors), and for each parameter set, we analyzed 25 randomly perturbed receptor expression profiles chosen from a gamma distribution with a coefficient of variation (CV) of 0.25, with each resulting interaction profile is plotted in the LIC-RLS phenotypic space.
- CV coefficient of variation
- FIG. 13G shows the cumulative distribution function of the standard deviations in the RLS
- FIG. 13H shows that the LIC is shown to indicate the distribution of sensitivities of ligand integration behavior to each category of noise.
- FIG. 14 is a schematic illustration of computational plasticity in the BMP signaling system where ligand combinations represent inputs to the pathway, which processes them through receptor-ligand interactions to control the expression level of downstream target genes.
- a given receptor configuration can perform different computations on different ligand combinations (e.g. additive and imbalance, top panel), whereas cells expressing different receptor profiles can perform distinct computations on the same combination of ligands (e.g. ratiometric and additive, lower panel).
- FIG. 15A is shows simulated responses to two ligands plotted in log-log space and the same pairwise relationship can be summarized by measuring only the rim defined by the purple arrow.
- FIG. 15B is a graph of ligand activation where red shows the response to Ligand 1 only, blue shows the response to the Ligand 2 only, and purple shows the response to the mixture of ligands, and each response was simulated at the same input concentrations indicated by the purple arrow in FIG. 15A .
- FIG. 16A is a graph showing the pathway response activity of a combination of two ligands.
- FIG. 16B shows the calculation of the RLS and LIC computations, according to embodiments of the present disclosure.
- FIG. 17 shows simulation data for the 4 types of ligand activation.
- FIG. 18A is graph plotting the RLS versus the LIC of two BMP pairs in NMuMG cells.
- FIG. 18B plots the activity of the two BMP pairs of FIG. 18A in two dimensional space, according to embodiments of the present disclosure.
- aspects of some embodiments of the present disclosure are based on the discovery of new methods to manipulate the behavior of signaling pathways through the use of the pathway's extracellular ligands and receptors.
- Signaling pathways are used to convert extracellular ligand concentrations into intracellular protein levels.
- Several of the intercellular signaling pathways have multiple ligand and receptor variants that interact promiscuously with one another to combinatorially generate a large set of distinct signaling complexes.
- the Bone Morphogenetic Protein (BMP) signaling pathway comprises multiple ligands and receptors that interact promiscuously with one another, and typically appear in combinations. As disclosed herein, and schematically shown in FIG.
- the BMP pathway processes multi-ligand inputs using a specific repertoire of computations, including additive, ratiometric sensing, balance detection and imbalance detection.
- These computations operate on the relative levels of different ligands, and may arise directly from competitive receptor-ligand interactions.
- different cell types are capable of selecting different computations to perform on the same ligand combination through expression of alternative sets of receptor variants.
- the BMP pathway is an example of a promiscuous receptor-ligand architecture as shown in FIG. 1A .
- the BMP pathway includes more than 20 distinct BMP ligands, 4 type I receptors (BMPR1A, BMPR1B, ACVR1, and ALK1) and 3 type II receptors (BMPR2, ACVR2A, and ACVR2B). These components could interact in combination to form hundreds of distinct receptor-ligand signaling complexes, each composed of 2 type I and 2 type II receptors binding a dimeric ligand.
- Active signaling complexes phosphorylate SMAD1, 5 and 8 (SMAD1/5/8), which, together with SMAD4, translocate to the nucleus to regulate target gene expression.
- a “ligand-dependent response” refers to a molecular action in a cell caused by a ligand binding to a receptor on the cell.
- a “BMP-dependent response” or a “BMP ligand-dependent response” may be used interchangeably to refer to a BMP protein binding to a BMP receptor.
- BMP receptor activation by BMP ligand binding results in the phosphorylation of SMAD1/5/8.
- the phosphorylation of SMAD1/5/8 may be measured directly or by a downstream event such as the expression of gene targeted by phosphorylated SMAD1/5/8.
- dynamic range As used herein, “dynamic range,” “range of dynamic concentrations,” and “dynamic concentration range,” each refer interchangeably to the range encompassing the minimal concentration of a ligand to induce a measurable ligand-dependent response to the minimal concentration of a ligand to induce a saturating ligand-dependent response.
- the methods and compositions as disclosed herein for inducing a BMP ligand-dependent response were elucidated utilizing a BMP ligand-dependent fluorescent reporter assay that expresses a fluorescent reporter protein upon BMP ligand-receptor binding.
- a BMP ligand-dependent fluorescent reporter assay that expresses a fluorescent reporter protein upon BMP ligand-receptor binding.
- methods and compositions are disclosed for inducing a bone morphogenetic protein (BMP)-dependent response in a cell.
- BMP bone morphogenetic protein
- the induction of the BMP-dependent response is selective for a specific cell type or specific cell subtype having a distinct set of BMP receptors.
- a specific cell type has the same BMP receptors
- a specific cell subtype has at least one of the same BMP receptors.
- a method of inducing a bone morphogenetic protein (BMP)-dependent response in a mouse mammary gland (NMuMG) BMP receptor cell or a NMuMG-like BMP receptor cell includes exposing the NMuMG-like BMP receptor cell to the single heterologous BMP ligands of BMP4, BMP9, or BMP10 or to a mixture of heterologous BMP4 and BMP9.
- a NMuMG-like BMP receptor cell expresses the same BMP receptor profile as the NMuMG cell.
- NIH3T3 cells express the same BMP receptors as NMuMG cells.
- the NMuMG BMP receptor cells and the NMuMG-like BMP receptor cells express the BMPR1A, BMPR2, and ACVR1 receptors.
- expression of a BMP receptor refers to a receptor expression of at least 5 fragments per kilo million (FPKM) as measured by RNA sequencing.
- the BMP4, BMP9, and BMP10 ligands are homodimers.
- the dynamic range for BMP4, BMP9, and BMP10 homodimer ligands for inducing a BMP-dependent response in NMuMG-like BMP receptor cells is from about 10 ng/ml to about 1,000 ng/ml.
- a suitable concentration range for BMP4, BMP9, and/or BMP10 homodimers in NMuMG-like BMP receptor cells is selected from about 15 ng/ml to about 1,000 ng/ml, about 30 ng/ml to about 1,000 ng/ml, about 50 ng/ml to about 1,000 ng/ml, about 100 ng/ml to about 1,000 ng/ml, about 200 ng/ml to about 1,000 ng/ml, about 300 ng/ml to about 1,000 ng/ml, about 400 ng/ml to about 1,000 ng/ml, about 500 ng/ml to about 1,000 ng/ml, about 600 ng/ml to about 1,000 ng/ml, about 700 ng/ml to about 1,000 ng/ml, about 800 ng/ml to about 1,000 ng/ml, or about 900 ng/ml to about 1,000 ng/ml.
- a method of inducing a bone morphogenetic protein (BMP)-dependent response in an embryonic stem cell (ESC) BMP receptor cell or an ESC-like BMP receptor cell includes exposing the ESC-like BMP receptor cell to a mixture of heterologous BMP4 and BMP9.
- a ESC-like BMP receptor cell expresses the same BMP receptor profile as the ESC cell.
- the ESC BMP receptor cells and the ESC-like BMP receptor cells express the BMPR1A and ACVR2B receptors.
- expression of a BMP receptor refers to a receptor expression of at least 5 fragments per kilo million (FPKM) as measured by RNA sequencing.
- the mixture of BMP4 and BMP9 ligands are homodimers.
- the mixture of BMP4 and BMP9 show a balanced interaction in which their cooperative (e.g., synergistic) induction of a BMP-dependent response in ESC-like BMP receptor cells.
- the synergy of BMP4 and BMP9 in ESC-like BMP receptor cells occurs when the ratio of BMP4 to BMP9 is within the range of about 1.0:0.4 to about 1.0:100.
- a mixture of BMP4 and BMP9 in a ratio outside of this range will not induce a BMP-dependent response in ESC-like BMP receptor cells, but will activate a BMP-dependent response in a NMuMG-like BMP receptor cells, the overexpressed BMPR1P NMuMG-like receptor cells, and the overexpressed ALK1 NMuMG-like receptor cells as disclosed herein.
- the dynamic range for BMP4 and BMP9 homodimer ligands for inducing a BMP-dependent response in ESC-like BMP receptor cells is from about 10 ng/ml to about 1,000 ng/ml.
- a suitable concentration range for BMP4 and BMP9 homodimers for inducing a BMP-dependent response in ESC-like BMP receptor cells is selected from about 15 ng/ml to about 1,000 ng/ml, about 30 ng/ml to about 1,000 ng/ml, about 50 ng/ml to about 1,000 ng/ml, about 100 ng/ml to about 1,000 ng/ml, about 200 ng/ml to about 1,000 ng/ml, about 300 ng/ml to about 1,000 ng/ml, about 400 ng/ml to about 1,000 ng/ml, about 500 ng/ml to about 1,000 ng/ml, about 600 ng/ml to about 1,000 ng/ml, about 700 ng/ml to about 1,000 ng/ml, about 800 ng/ml to about 1,000 ng/ml, or about 900 ng/ml to about 1,000 ng/ml.
- a method of inducing a bone morphogenetic protein (BMP)-dependent response in an overexpressed BMPR1B NMuMG BMP receptor cell or an overexpressed BMPR1B NMuMG-like BMP receptor cell includes exposing the overexpressed BMPR1B NMuMG-like BMP receptor cell to heterologous BMPs selected from BMP4, BMP9, BMP10, GDF5, a mixture of BMP4 and BMP9, or a mixture of BMP4 and GDF5.
- BMP bone morphogenetic protein
- the ALK1 NMuMG-like BMP cells may be in a population of different cell types, where inducing a BMP-dependent response in an overexpressed BMPR1B NMuMG-like BMP receptor cells includes exposing these cells to heterologous BMPs that do not induce a BMP-dependent response in another cell type in the population of different cell types, thereby selectively inducing the overexpressed BMPR1B NMuMG-like BMP receptor cells.
- a mixture of BMP4 and GDF5 does not induce NMuMG-like BMP receptor cells, ESC-like BMP receptor cells, or the overexpressed ALK1 NMuMG-like BMP receptor cells.
- overexpressed BMPR1B NMuMG-like BMP receptor cell expresses the same BMP receptor profile as an overexpressed BMPR1B NMuMG BMP receptor cell.
- the overexpressed BMPR1B NMuMG BMP receptor cells and the overexpressed BMPR1B NMuMG-like BMP receptor cells are genetically modified to express the BMPR1B receptors in a cell that does not express native BMPR1B.
- Overexpression of BMPR1B may include high levels of receptor expression, but overexpression also refers to engineered expression of a BMP receptor in a cell that does not otherwise express the BMP receptor. Accordingly, expression and overexpression of a BMP receptor refers to receptor expression of at least 5 fragments per kilo million (FPKM) as measured by RNA sequencing.
- FPKM fragments per kilo million
- the BMP4, BMP9, BMP10, and GDF5 ligands are homodimers.
- the dynamic range for BMP4, BMP9, BMP10, and GDF5 homodimer ligands for inducing a BMP-dependent response in overexpressed BMPR1B NMuMG-like BMP receptor cells is from about 10 ng/ml to about 1,000 ng/ml.
- a suitable concentration range for BMP4, BMP9, BMP10, and/or GDF5 homodimers in overexpressed BMPR1B NMuMG-like BMP receptor cells is selected from about 15 ng/ml to about 1,000 ng/ml, about 30 ng/ml to about 1,000 ng/ml, about 50 ng/ml to about 1,000 ng/ml, about 100 ng/ml to about 1,000 ng/ml, about 200 ng/ml to about 1,000 ng/ml, about 300 ng/ml to about 1,000 ng/ml, about 400 ng/ml to about 1,000 ng/ml, about 500 ng/ml to about 1,000 ng/ml, about 600 ng/ml to about 1,000 ng/ml, about 700 ng/ml to about 1,000 ng/ml, about 800 ng/ml to about 1,000 ng/ml, or about 900 ng/ml to about 1,000 ng/ml.
- a method of inducing a bone morphogenetic protein (BMP)-dependent response in an overexpressed ALK1 NMuMG BMP receptor cell or an overexpressed ALK1 NMuMG-like BMP receptor cell includes exposing the overexpressed ALK1 NMuMG-like BMP receptor to heterologous BMPs selected from BMP4, BMP9, and BMP10, a mixture of BMP4 and BMP9, or a mixture of BMP4 and BMP10.
- BMP bone morphogenetic protein
- the ALK1 NMuMG-like BMP cells may be in a population of different cell types, where inducing a BMP-dependent response in an overexpressed ALK1 NMuMG-like BMP receptor cells includes exposing these cells to heterologous BMPs that do not induce a BMP-dependent response in another cell type of the population of different cell types, thereby selectively inducing the overexpressed ALK1 NMuMG-like BMP cells.
- a mixture of BMP4 and BMP10 does not induce NMuMG-like BMP receptor cells, ESC-like BMP receptor cells, or the overexpressed BMPR1B NMuMG-like BMP receptor cells.
- overexpressed ALK1 NMuMG-like BMP receptor cell expresses the same BMP receptor profile as an overexpressed ALK1 NMuMG BMP receptor cell.
- the overexpressed BMPR1B ALK1 BMP receptor cell and the overexpressed ALK1 NMuMG-like BMP receptor cell are genetically modified to express the ALK1 receptors in a cell that does not express native ALK1.
- Overexpression of ALK1 may include high levels of receptor expression, but overexpression also refers to engineered expression of a BMP receptor in a cell that does not otherwise express the BMP receptor. Accordingly, expression and overexpression of a BMP receptor refers to receptor expression of at least 5 fragments per kilo million (FPKM) as measured by RNA sequencing.
- FPKM fragments per kilo million
- the BMP4, BMP9, and BMP10 ligands are homodimers.
- the dynamic range for BMP4, BMP9, and BMP10 homodimer ligands for inducing a BMP-dependent response in overexpressed ALK1 NMuMG-like BMP receptor cells is from about 10 ng/ml to about 1,000 ng/ml.
- a suitable concentration range for BMP4, BMP9, and/or BMP10 homodimers in overexpressed ALK1 NMuMG-like BMP receptor cells is selected from about 15 ng/ml to about 1,000 ng/ml, about 30 ng/ml to about 1,000 ng/ml, about 50 ng/ml to about 1,000 ng/ml, about 100 ng/ml to about 1,000 ng/ml, about 200 ng/ml to about 1,000 ng/ml, about 300 ng/ml to about 1,000 ng/ml, about 400 ng/ml to about 1,000 ng/ml, about 500 ng/ml to about 1,000 ng/ml, about 600 ng/ml to about 1,000 ng/ml, about 700 ng/ml to about 1,000 ng/ml, about 800 ng/ml to about 1,000 ng/ml, or about 900 ng/ml to about 1,000 ng/ml.
- combinations of BMPs activate distinct cell types more specifically than single BMPs.
- Single BMPs tend to nonspecifically activate all cells that express any of the many BMP receptors that can activate the pathway.
- a mixture of the single BMPs will not necessarily activate the pathway to the same extent in all cell types, particularly in cases where the BMPs effectively antagonize each other.
- to compose a combination of BMPs that selectively activate a tissue or cell type of interest one must know how that target cell type responds to single BMPs and to BMP combinations, and how that profile of responses is different from other cell types.
- a given cell type is exposed to many possible combinations of BMP ligand pairs to quantify and characterize a BMP-dependent cellular response for that cell type. Even without understanding the precise molecular details of how each BMP uniquely binds the available BMP receptors, one can observe subtle differences in the cellular response to BMP combinations.
- determining the combinations of BMPs that could selectively activate a given cell type requires a full map of responses to many different BMP combinations.
- exposing cells to a range of concentrations for a BMP ligand reveals the dynamic range of that ligand. This is the range defined by the minimal concentration to induce a measurable pathway response and the minimal concentration to induce a nearly saturating response, as defined more specifically below.
- R is the cellular response as a function of C, the concentration of BMP ligand.
- R 0 +B is the response as C ⁇ , or the response at saturating concentrations of ligand.
- K d is the effective affinity and the concentration at which the response is halfway between background and saturating levels (i.e. B+R 0 /2)
- n is the Hill coefficient.
- R 0 , K d , and n are all ligand-specific parameters.
- the dynamic range might be the concentrations that induce responses equal to B+0.05 R 0 and B+0.95 R 0 .
- a single ligand pair is characterized by measuring responses at every point on a grid of logarithmically spaced points in the domain of the dynamic ranges of the two ligands.
- each ligand pair combination is mixed in concentrations following a set of minimally informative measurements.
- BMP pairs that selectively activate the cell type being studied will not activate other cells exposed to the same BMP pair. Therefore, the pairwise profile generated in the study must be compared to responses to BMP pairs in cells that should not be activated.
- a threshold e.g. B+0.05R 0
- Our goal is to find a BMP input condition that activates the cell type of interest and does not activate (or minimally activates) other cell types.
- RLS Relative Ligand Strength
- LIC Ligand Interference Coefficient
- This plot can serve as an effective summary of how each BMP pair activates the cell type being studied.
- This “pairwise behavior” plot indicates, indirectly, how BMPs activate, or do not activate, this cell type. Comparing this pairwise behavior plot to a similar plot for a different cell type would reveal which BMP pairs are “specific” to each cell type. Responses to BMP pairs that are antagonistic in all other cell types (i.e. red or blue response types), but synergistic or additive in the cell type of interest (i.e. yellow or green response types) are good candidates for combinatorial specificity. This would be apparent as a yellow or green square, in the map for the target cell type, in the same location as blue or red squares in the maps for all other cell types that should not be activated.
- the BMP pathway perceives ligand combinations through a specific family of multi-dimensional response profiles. These profiles allow the pathway to perceive relative, in addition to absolute, levels of multiple ligands.
- Mathematical modeling further reveals that these response profiles can arise from an interplay between receptor-ligand binding affinities and the quantitative activity of each complex. The former determine what complexes are formed, while the latter determine how the activities of those complexes combine to establish overall pathway activity.
- the response profiles differ qualitatively and quantitatively depending on the expression levels of the different receptor variants. As a result, different cell types, with distinct receptor expression profiles, may respond to distinct features in the multidimensional space of ligand concentrations. Together, these results establish a general framework for analyzing the BMP signaling pathway and reveal a more general design principle for biological signaling systems containing promiscuous receptor-ligand interactions.
- BMP ligands exhibit combinatorial effects.
- the dependence of BMP pathway activity on individual ligands and ligand combinations was measured.
- Ligand monomers form covalent homodimers and heterodimers with distinct activities.
- a reporter cell line was constructed, by stably integrating a Histone 2B (H2B)-Citrine fluorescent reporter driven by a BMP response element (BRE) specific for SMAD1/5/8 into the NAMRU mouse mammary gland (NMuMG) epithelial cell line, in which the BMP pathway can be activated without inducing differentiation.
- Reporter expression correlated with phosphorylation of SMAD1/5/8 and with endogenous BMP target gene expression FIGS. 2A-2C and exhibited a unimodal distribution for each ligand concentration ( FIG. 2D ).
- pSMAD levels reached a steady state within 90 min ( FIG. 2E ).
- the steady-state behavior was also reflected in reporter fluorescence, which accumulated at an approximately constant rate over time for up to 48h ( FIG. 2F ). (Since the fluorescent protein is stable and the cell cycle is greater than 24h in these conditions, linear accumulation indicates a constant rate of reporter expression.) Based on these dynamics, a 24h post-induction was selected as a time-point for subsequent analysis.
- candidate ligand pairs were identified for subsequent higher resolution analysis.
- a coarse-grained survey was performed of 15 commercially available homodimeric ligands ( FIG. 3A ). Reporter expression was measured in response to each ligand individually, at a specific base concentration; each ligand at twice its base concentration (diagonal elements); and each pair of ligands at their base concentrations (other matrix elements).
- pathway activity each measurement by basal activity was normalized with no added ligand (bottom).
- FIG. 3B the diverse ways in which BMP4 (one of the best-studied BMP ligands) combines with other ligands was analyzed ( FIG. 3B ), particularly BMP9, GDF5, and BMP10 ( FIGS. 3C-3E ).
- BMP9, GDF5, and BMP10 FIGS. 3C-3E .
- FIGS. 3C-3E To quantitatively characterize these interactions in a manner independent of the choice of base concentrations, we analyzed a 2-dimensional matrix of logarithmically spaced ligand concentrations.
- the broad (3 orders of magnitude) concentration range covers the full input dynamic range for each ligand pair in the NMuMG cell line, and overlaps ligand concentrations in circulating blood, as well as those used to induce BMP dependent responses in vitro.
- BMP4 and BMP9 increased pathway activity both individually and in combination, exhibiting an additive response, with little dependence on ligand identity, as one would expect for ligands that function redundantly ( FIGS. 3C, 4A ).
- GDF5 reduced activation by BMP4 in a dose-dependent fashion, such that pathway output approximated the ratio of the concentrations of the two ligands ( FIGS. 3D, 4A ). Similar ratiometric responses have been observed in other systems.
- BMP4 and BMP10 were potent activators individually, but each became inhibitory in the presence of high concentrations of the other ligand, resulting in a weaker response when both ligands were present ( FIGS.
- the BMP pathway utilizes many secreted and surface-bound modulators to shape the spatial distribution of available ligands. To test whether these factors play a role in ligand integration, we first determined which ones were expressed in the NMuMG cell line. Individually depleting each of these factors using siRNAs ( FIG. 5C ) did not affect the type of response profile generated by BMP4 in combination with BMP9, BMP10, or GDF5 ( FIGS. 5D-5G ). In addition, BMPs could interact more generally with heparin sulfate proteoglycans (HSPGs).
- HSPGs heparin sulfate proteoglycans
- Each ligand can bind with affinity K ij D to an A-type receptor to form a dimeric complex D ij , which in turn can bind a B-type receptor with affinity K ijk T to form an active trimeric complex, T ijk .
- affinity parameters can differ for each ligand-receptor combination, this model allows both receptor preferences as well as promiscuous interactions.
- Each trimeric complex phosphorylates SMAD proteins at a distinct rate, or activity, denoted ⁇ ijk , to produce an overall output signal S at steady state.
- the model considers the experimental regime of large extracellular volume, but similar conclusions occur at finite volume.
- This simplified model omits several known features of the BMP pathway, such as variations in the sequence of binding reactions, the hexameric nature of actual signaling complexes, as well as the roles of other BMP regulatory factors. These features likely play important biological roles, e.g. in controlling the amplitude and spatio-temporal dynamics of signaling, that should be considered in models of specific biological processes. However, incorporation of these additional features in the model does not change the types of input-output computations examined here.
- LIC Ligand Interference Coefficient
- FIGS. 9A, 9B This analysis provides an intuitive way to understand the distribution of response profiles.
- FIGS. 10A-10D Complex response profiles emerge from the interplay of receptor-ligand affinities and activities. We next asked how the archetypal ligand integration modes arise within the model. To do so, we analyzed the corresponding parameter regimes in more detail ( FIGS. 10A-10D ). As expected, additive responses occur when the two ligands are approximately equivalent, forming signaling complexes with similar phosphorylation activities ( ⁇ i1k ⁇ i2k , FIGS. 10A, 11A ). By contrast, ratiometric behaviors occur when signaling complexes containing one ligand have higher activities than those containing the other ( ⁇ i1k ⁇ i2k ), such that a weaker ligand competitively inhibits activation by the other, stronger ligand ( FIGS.
- a critical feature of the model is that the overall activity of the pathway depends not only on how much of each ligand is complexed with receptors, but also on how that ligand is distributed across the range of distinct possible receptor complexes.
- simply changing the activities of the complexes can result in completely different response profiles ( FIGS. 8F, 8G ).
- addition of a second ligand can change not just the amount of the first ligand that is bound to receptors, but more importantly the distribution of that ligand across different potential signaling complexes with distinct activities. This could explain how two ligands can exhibit similar receptor preferences but still combine in qualitatively different ways with a third ligand.
- Receptor expression reprograms ligand response profiles.
- different cell types generally express receptors at different levels. Changes in receptor expression could in principle alter BMP responses in similar, or different, ways compared to changes in ligand concentrations.
- biochemical parameter values K ij D , K ijk T , ⁇ ijk ) fixed.
- K ij D , K ijk T , ⁇ ijk biochemical parameter values
- ectopically expressed BMPR1B which is known to mediate GDF5 signaling enabled GDF5 to activate, rather than inhibit, the pathway, and thereby reprogrammed the ratiometric BMP4-GDF5 interaction to an additive one ( FIGS. 12G, 13C ). Furthermore, combining ectopic BMPR1B to enable GDF5 signaling with depletion of BMPR2 to reduce BMP4-dependent signaling inverted the ratiometric response ( FIGS. 12G, 13C ).
- This system provides several key capabilities for cells: First, it is sensitive to both absolute concentrations of individual ligands and their relative concentrations. Encoding signals in relative ligand concentrations can increase robustness to variations in ligand accessibility, cell surface area, and other properties that affect all ligands in a correlated way. Second, computation is integrated with sensing. The system performs computations on ligand concentrations directly through competitive binding interactions, at steady state, without requiring regulatory cascades or transcriptional feedback loops. The observed computations arise because affinities among components need not correlate with the activities of the resulting signaling complexes. This allows ligands to compete for receptors to form a variety of distinct signaling complexes with distinct efficiencies. Third, and most interestingly, this system possesses computational plasticity.
- a cell By controlling the abundance of different receptor variants, a cell can control which computations it performs, and thus what features of the ligand environment it responds to. These capabilities could enable non-intuitive operative modes. For example, the use of ligand combinations may offer the ability to selectively activate a given cell type, since different cell types may respond to specific ligand combinations. Temporal changes in the concentration of a single ligand could elicit different, or opposite, changes in signal perception in distinct cell types.
- NMuMG (NAMRU Mouse Mammary Gland cells, female) and NIH3T3 (mouse fibroblast, male) cells were acquired from ATCC (CRL-1636 and CRL-1658, respectively).
- E14 cells mouse embryonic stem cells, E14Tg2a.4, male
- All cells were cultured in a humidity controlled chamber at 37° C. with 5% CO2.
- NMuMG cells were cultured in DMEM supplemented with 10% FBS (Clonetech #631367), 1 mM sodium pyruvate, 1 unit/ml penicillin, 1 ug/ml streptomycin, 2 mM L-glutamine and 1 ⁇ MEM non-essential amino acids.
- NIH-3T3 cells were cultured in DMEM supplemented with 10% CCS (Hyclone #SH30087), 1 mM sodium pyruvate, 1 unit/ml penicillin, 1 ug/ml streptomycin and 2 mM L-glutamine.
- ES cells were plated on tissue culture plates pre-coated with 0.1% gelatin and cultured in a standard pluripotency-maintaining conditions (Smith, 2001) using DMEM supplemented with 15% FBS (ES qualified, Gibco #16141), 1 mM sodium pyruvate, 1 unit/ml penicillin, 1 ug/ml streptomycin, 2 mM L-glutamine 1 ⁇ MEM non-essential amino acids 55 mM ⁇ -mercaptoethanol and 1000 Units/ml leukemia inhibitory factor (LIF).
- LIF leukemia inhibitory factor
- BRE BMP response element
- NMuMG and 3T3 cells were transfected using Lipofectamine LTX. After transfection, cells were selected with 100 ug/ml hygromycin. All experiments were performed with clonal populations, generated via colony picking (ES) or limiting dilutions (NMuMG, NIH3T3). To ensure results were not dependent on the specific reporter integration site, an independent BRE-reporter cell line was generated using Piggybac integration (SBI) (see FIG. 6A ).
- SBI Piggybac integration
- BMP response and flow cytometry were plated at 40% confluency in 96 well plates and cultured under standard conditions (above) for 12h. Media was then replaced and ligand(s) were added at specified concentrations. 24h after ligand addition cells were prepared for flow cytometry in the following way: Cells were washed with PBS and lifted from the plate using either 0.05 ml Accutase (ES cells) or trypsin (NMuMG and 3T3 cells) for 5 minutes at 37° C. Protease activity was quenched by re-suspending the cells in HBSS with 1.0% Bovine Serum Albumin (BSA).
- BSA Bovine Serum Albumin
- Ligand integration survey In order to identify non-additive ligand integration modes, cells were exposed to a matrix of ligands at predetermined concentrations. We selected concentrations that were sufficient to induce responses in cells already known to respond to those ligands, but not so high as to induce potential non-specific responses. For this reason, we based ligand concentrations on supplier data, and selected a concentration at the high end of the input dynamic range for a cell based system susceptible to each ligand). All BMP ligands used in the survey were acquired from R&D Systems
- Phoshpo-SMAD 1/5/8 For assessment of phoshpo-SMAD1/5/8 cells were plated at 40% confluency under standard conditions in 24 well plates. To reduce phospho-SMAD1/5/8 background activity, cells were transferred to reduced serum media containing 1.0% FBS for 12 hours. This media was then exchanged for DMEM and cells were incubated at 37° C. for another 6 hours. DMEM was then replaced and ligands were added in DMEM at the specified concentrations and incubated at 37° C. for 20 minutes.
- Cells were then treated with 50 ⁇ l lysis buffer (Cell Signaling 9803) with the following additions, 0.1M DTT, 50 mM NaF, 1 mM PMSF and additional protease inhibitors (Thermo 87785). Samples were immediately stored at ⁇ 80° C. until processed for SDS-PAGE. SDS-PAGE was conducted using NuPAGE Bis-Tris Mini Gels 4-12% (Thermo). Approximately 10-20 ⁇ g of total protein, denatured by heat, was loaded per well. Samples were run at 50 mA for approximately 60 minutes. Protein was transferred from gels to nitrocellulose using the iBlot apparatus and iBlot reagents (Thermo) and program 2 for 8 minutes.
- Membranes were trimmed and blocked with 5% milk in Tris buffered saline with 0.1% Tween 20 (TBST) for at least 60 minutes at room temperature. Blocking buffer was removed and membranes were briefly washed with TBST. Antibodies against phospho-SMAD 1/5/8 (13820 Cell Signaling), phospho-p44/42 MAPK (4370 Cell Signaling), SMAD1 (6944 Cell Signaling), GAPDH (2118 Cell Signaling) were than applied at a dilution of 1:1000, 1:2000 for GAPDH, in 1.0% BSA TBST and incubated at 4° C. for 12 to 16 hours.
- TBST Tris buffered saline with 0.1% Tween 20
- immunoblots were washed with TBST three times for 5 minutes at room temperature and a secondary antibody conjugated with horse radish peroxidase (7074 Cell Signaling) was applied to the blots at 1:1000 in 1.0% BSA TBST for 60 minutes at room temperature. After incubation with the secondary antibody, the immunoblots were washed with TBST three times for 5 minutes and developed using a luminol based substrate (7003 Cell Signaling). The immunoblots were imaged using a BioRad and exposure times that produced signal below saturation. Densitometry was performed using ImageJ (http://imagej.nih.gov).
- BMPR2 BMPR2.
- BMP9 400 ng/ml
- cells were then incubated at 37° C. for the specified times.
- Cells were then treated with 50 ⁇ l lysis buffer (see above). Samples were immediately stored at ⁇ 80° C. until processed for SDS-PAGE. After electrophoresis, gels were incubated with 20% Ethanol in TBS for 5 minutes. Transfer of protein to nitrocellulose was performed with the iBlot apparatus using program 3 for 8 minutes.
- Antibodies against BMPR2 (6979 Cell Signaling) and GAPDH (2118 Cell Signaling) were than applied at 1:1000 and 1:2000, respectively, in 1.0% BSA TBST and incubated at 4° C. for 12 to 16 hours. Immunoblots were processed, developed and analyzed as described above.
- BMP response with heparinase I/III Cells were plated at 40% confluency in 96 well plates and cultured under standard conditions for 12 hours. Media was exchanged with media containing 2 units of Heparinase I/III (H3917 SIGMA) and cells were incubated at 37° C. for 3 hours. Media was then replaced with media containing ligands at the specified concentrations. The cells were then incubated with ligands at 37° C. for 20 minutes. After incubation for 20 minutes the cells were processed for phoshpo-SMAD 1/5/8 staining and flow cytometry as described above.
- Overexpression plasmids were constructed for each of the BMP receptors (BMPR1A, BMPR1B, BMPR2, ACVR1, ACVR2A, ACVR2B and ALK1) using the Gibson cloning method.
- Bmpr1b and Alk1 cDNA was purchased from Dharmacon (MMM1013-202858407 and MMM1013-202763719). All other receptor cDNAs were generated by RT-PCR from total RNA extracted from NMuMG cells.
- the receptor cDNA was concatenated with mTurquoise with an intervening T2A cleavage site and was expressed under the control of a constitutive PGK promoter integrated in the Pb510b plasmid backbone to enable PiggyBac integration. Stable integrations were then generated using the PiggyBac method. Cells were co-transfected with these overexpression plasmids and PB200A to express transposase, and selected with Geneticin. Experiments were performed with polyclonal populations resulting from PiggyBac integrations.
- ES cells 0.05 ml Accutase
- NMuMG and 3T3 cells trypsin
- Protease activity was quenched by re-suspending the cells in 0.45 ml HBSS with 1.0% Bovine Serum Albumin (BSA).
- BSA Bovine Serum Albumin
- the cells were then pelleted, washed with 0.5 ml PBS and fixed by re-suspension in 0.5 ml of 4.0% formaldehyde for 5 minutes at room temperature.
- the cells were washed in 0.5 ml PBS and re-suspended in 0.5 ml PBS with 1.0% Triton X-100 for permeabilization. The cells were then washed with 0.5 ml PBS and re-suspended in blocking solution (PBS with 1.0% BSA and 0.1% Tween 20). Blocking was carried out for 30 minutes at room temperature. The cells were then pelleted and re-suspended in binding solution (PBS with 1.0% BSA) containing a 1:100 dilution of a primary antibody against the phosphorylated form of SMAD1/5/8 complex (Cell Signaling Technologies Cat#13820). The staining proceeded for 12-16 hours at 4° C. with constant rocking.
- Fluorescent reporter cells were first mixed with an excess of non-fluorescent parental cells at a 1:9 ratio to simplify image segmentation and data extraction. Cells were then plated at 1.6-104 cells/well in a 96 well plate equivalent roughly to 15-20% confluency. Cells were grown for 12 hours prior to ligand addition. Each position was imaged every hour starting from the addition of ligands until cells became confluent after about 60h. Images were then analyzed for the number of fluorescent cells and fluorescent signal level.
- model can be used equally well for mixtures of homodimers, heterodimers, or combinations thereof.
- model applies most directly to the BMP pathway, variants of it could also describe other systems that similarly form multi-part signaling complexes, including receptor aggregates, such as those listed above.
- n L ligands, L j each of which can bind to one of n A type A receptor sub-units, A i , to form n L ⁇ n A intermediate dimeric ligand-type A receptor complexes, D ij .
- These complexes can in turn bind to one of n B type B receptor sub-units, B k , to form n L ⁇ n A ⁇ n B different trimeric signaling complexes, T ijk .
- L j denotes the concentration of the ligand in a volume V
- a i , B k , D ij and T ijk are the absolute number of receptors and complexes on the cell surface.
- each complex T ijk induces phosphorylation of the intracellular signal, S, at some rate ⁇ ijk so that the rate of change of the total signal is given by
- D ij K ij D ⁇ A i ⁇ L j ( 18 )
- T ijk K ijk T ⁇ D ij ⁇ B k ( 19 )
- This equation is now in a form that can be solved numerically for any given set of parameters via standard optimization methods such as MATLAB's fmincon and lsqnonlin functions.
- N L 2 ligands
- N A 2 A-type receptors
- N B 2 B-type receptors
- random sets of parameters were chosen.
Abstract
Description
-
- and the LIC represented by Equation C
-
- where
- min is the minimum ligand-dependent response observed across the plurality of mixtures of the combination of ligands,
- max is the maximum ligand-dependent response observed across the plurality of mixtures of the combination of ligands,
- Lweak is the activation response of the more weakly interacting ligand, and
- Lstrong is the activation response of the more strongly interacting ligand,
- wherein the combination of ligands having an RLS value of about 1 or greater and an LIC value of about 0 or greater activate the first cell type by inducing an additive or synergistic ligand-dependent response.
L j =L j 0. (12)
D ij =K ij D A i L j (13)
T ijk =K ijk T D ij B k (14)
E(T ijk)=0.
S→α·S
εijk→α·εijk. (26)
A i →β·A i
BB k →β·B k
D ij →β·D ij
T ijk →β·T ijk
S→β·S
K ijk T→β−1 ·K ijk T ·D (28)
L j→γj ·L j
K ij D→γj −1 K ij D (30)
Claims (9)
Priority Applications (2)
| Application Number | Priority Date | Filing Date | Title |
|---|---|---|---|
| US15/847,909 US10527631B2 (en) | 2016-12-19 | 2017-12-19 | Compositions and methods for programmable sensing and control through combinatorial molecular interactions |
| US16/701,049 US11604198B2 (en) | 2016-12-19 | 2019-12-02 | Compositions and methods for programmable sensing and control through combinatorial molecular interactions |
Applications Claiming Priority (2)
| Application Number | Priority Date | Filing Date | Title |
|---|---|---|---|
| US201662436071P | 2016-12-19 | 2016-12-19 | |
| US15/847,909 US10527631B2 (en) | 2016-12-19 | 2017-12-19 | Compositions and methods for programmable sensing and control through combinatorial molecular interactions |
Related Child Applications (1)
| Application Number | Title | Priority Date | Filing Date |
|---|---|---|---|
| US16/701,049 Division US11604198B2 (en) | 2016-12-19 | 2019-12-02 | Compositions and methods for programmable sensing and control through combinatorial molecular interactions |
Publications (2)
| Publication Number | Publication Date |
|---|---|
| US20180172704A1 US20180172704A1 (en) | 2018-06-21 |
| US10527631B2 true US10527631B2 (en) | 2020-01-07 |
Family
ID=62561501
Family Applications (2)
| Application Number | Title | Priority Date | Filing Date |
|---|---|---|---|
| US15/847,909 Active US10527631B2 (en) | 2016-12-19 | 2017-12-19 | Compositions and methods for programmable sensing and control through combinatorial molecular interactions |
| US16/701,049 Active 2039-12-13 US11604198B2 (en) | 2016-12-19 | 2019-12-02 | Compositions and methods for programmable sensing and control through combinatorial molecular interactions |
Family Applications After (1)
| Application Number | Title | Priority Date | Filing Date |
|---|---|---|---|
| US16/701,049 Active 2039-12-13 US11604198B2 (en) | 2016-12-19 | 2019-12-02 | Compositions and methods for programmable sensing and control through combinatorial molecular interactions |
Country Status (2)
| Country | Link |
|---|---|
| US (2) | US10527631B2 (en) |
| WO (1) | WO2018119011A1 (en) |
Cited By (1)
| Publication number | Priority date | Publication date | Assignee | Title |
|---|---|---|---|---|
| US11604198B2 (en) | 2016-12-19 | 2023-03-14 | California Institute Of Technology | Compositions and methods for programmable sensing and control through combinatorial molecular interactions |
Citations (4)
| Publication number | Priority date | Publication date | Assignee | Title |
|---|---|---|---|---|
| US20110097799A1 (en) * | 2009-10-19 | 2011-04-28 | Casey Stankewicz | Cardiomyocyte production |
| US20110135710A1 (en) * | 2004-06-01 | 2011-06-09 | Pronai Therapeutics, Inc. | Methods and Compositions for the Inhibition of Gene Expression |
| US20140234964A1 (en) * | 2011-07-12 | 2014-08-21 | Michael West | Novel Methods and Formulations for Orthopedic Cell Therapy |
| US20180153940A1 (en) * | 2015-05-29 | 2018-06-07 | Katholieke Universiteit Leuven | Compositions for treatment of osteochondral disorders |
Family Cites Families (1)
| Publication number | Priority date | Publication date | Assignee | Title |
|---|---|---|---|---|
| WO2018119011A1 (en) | 2016-12-19 | 2018-06-28 | California Institute Of Technology | Compositions and methods for programmable sensing and control through combinatorial molecular interactions |
-
2017
- 2017-12-19 WO PCT/US2017/067446 patent/WO2018119011A1/en active Application Filing
- 2017-12-19 US US15/847,909 patent/US10527631B2/en active Active
-
2019
- 2019-12-02 US US16/701,049 patent/US11604198B2/en active Active
Patent Citations (4)
| Publication number | Priority date | Publication date | Assignee | Title |
|---|---|---|---|---|
| US20110135710A1 (en) * | 2004-06-01 | 2011-06-09 | Pronai Therapeutics, Inc. | Methods and Compositions for the Inhibition of Gene Expression |
| US20110097799A1 (en) * | 2009-10-19 | 2011-04-28 | Casey Stankewicz | Cardiomyocyte production |
| US20140234964A1 (en) * | 2011-07-12 | 2014-08-21 | Michael West | Novel Methods and Formulations for Orthopedic Cell Therapy |
| US20180153940A1 (en) * | 2015-05-29 | 2018-06-07 | Katholieke Universiteit Leuven | Compositions for treatment of osteochondral disorders |
Non-Patent Citations (6)
| Title |
|---|
| Daly, A.C. et al., Transforming Growth Factor Beta-Induced smad 1/5 Phosphorylation in Epithelial Cells in Medicated by Novel Receptor Comiexes and is Essential for Anchorage-Independent Growth, Molecular and Cellular Biology, Nov. 2008, vol. 28, No. 22, pp. 6889-6902. |
| Dyer, L.A. et al., The Role of BMPs in Endothelial Cell Function and Dysfunction, Trends Endocrinol Metab., Sep. 2014, vol. 25, No. 9, pp. 472-480. |
| Herrera et al., BMC Cell Biol. Mar. 19, 2009;10:20 (Year: 2009). * |
| International Search Report and Written Opinion issued in corresponding International Application No. PCT/US2017/067446, dated May 4, 2018, 14 pages. |
| Li, J., Bone Morphogenetic Proteins and Their Co-Receptor, Repulsive Guidance Molecules, Signaling Pathways in Human Cancers, Thesis submitted to Cardiff University for the degree of Doctor of Philosophy, Metastasis & Angiogenesis Research Group Cardiff University School of Medicine, Nov. 2010, 84 pages. |
| Thomson et al., Science. 1998;282:1145-1147 (Year: 1998). * |
Cited By (1)
| Publication number | Priority date | Publication date | Assignee | Title |
|---|---|---|---|---|
| US11604198B2 (en) | 2016-12-19 | 2023-03-14 | California Institute Of Technology | Compositions and methods for programmable sensing and control through combinatorial molecular interactions |
Also Published As
| Publication number | Publication date |
|---|---|
| US20200116717A1 (en) | 2020-04-16 |
| US11604198B2 (en) | 2023-03-14 |
| US20180172704A1 (en) | 2018-06-21 |
| WO2018119011A1 (en) | 2018-06-28 |
Similar Documents
| Publication | Publication Date | Title |
|---|---|---|
| Antebi et al. | Combinatorial signal perception in the BMP pathway | |
| Bandara et al. | Optimal experimental design for parameter estimation of a cell signaling model | |
| Chiou et al. | Principles that govern competition or co-existence in Rho-GTPase driven polarization | |
| Morris et al. | Training signaling pathway maps to biochemical data with constrained fuzzy logic: quantitative analysis of liver cell responses to inflammatory stimuli | |
| Granek et al. | Explicit equilibrium modeling of transcription-factor binding and gene regulation | |
| Miller et al. | ADAM-10 and-17 regulate endometriotic cell migration via concerted ligand and receptor shedding feedback on kinase signaling | |
| Buzdin et al. | Oncofinder, a new method for the analysis of intracellular signaling pathway activation using transcriptomic data | |
| Busch et al. | Gene network dynamics controlling keratinocyte migration | |
| Wei et al. | Transcript and protein expression decoupling reveals RNA binding proteins and miRNAs as potential modulators of human aging | |
| Zi et al. | Constraint-based modeling and kinetic analysis of the Smad dependent TGF-β signaling pathway | |
| Hughey et al. | Single-cell variation leads to population invariance in NF-κB signaling dynamics | |
| Mahdavi et al. | Sensitivity analysis of intracellular signaling pathway kinetics predicts targets for stem cell fate control | |
| Xia et al. | Cell-to-cell variability in cell death: can systems biology help us make sense of it all? | |
| Monast et al. | Computational analysis of the regulation of EGFR by protein tyrosine phosphatases | |
| Lee et al. | Mining the function of protein tyrosine phosphatases in health and disease | |
| Pargett et al. | Model-based analysis for qualitative data: an application in drosophila germline stem cell regulation | |
| Melke et al. | A rate equation approach to elucidate the kinetics and robustness of the TGF-β pathway | |
| Srinivasan et al. | A BMP-FGF morphogen toggle switch drives the ultrasensitive expression of multiple genes in the developing forebrain | |
| Tasaki et al. | Phosphoproteomics-based modeling defines the regulatory mechanism underlying aberrant EGFR signaling | |
| US11604198B2 (en) | Compositions and methods for programmable sensing and control through combinatorial molecular interactions | |
| Lazzara et al. | Quantitative modeling perspectives on the ErbB system of cell regulatory processes | |
| Rohrs et al. | Predictive model of lymphocyte-specific protein tyrosine kinase (LCK) autoregulation | |
| Luo et al. | Time series gene expression profiling and temporal regulatory pathway analysis of BMP6 induced osteoblast differentiation and mineralization | |
| Wittmann et al. | Spatial analysis of expression patterns predicts genetic interactions at the mid-hindbrain boundary | |
| Palani et al. | Positive receptor feedback during lineage commitment can generate ultrasensitivity to ligand and confer robustness to a bistable switch |
Legal Events
| Date | Code | Title | Description |
|---|---|---|---|
| FEPP | Fee payment procedure |
Free format text: ENTITY STATUS SET TO UNDISCOUNTED (ORIGINAL EVENT CODE: BIG.); ENTITY STATUS OF PATENT OWNER: SMALL ENTITY |
|
| FEPP | Fee payment procedure |
Free format text: ENTITY STATUS SET TO SMALL (ORIGINAL EVENT CODE: SMAL); ENTITY STATUS OF PATENT OWNER: SMALL ENTITY |
|
| STPP | Information on status: patent application and granting procedure in general |
Free format text: RESPONSE TO NON-FINAL OFFICE ACTION ENTERED AND FORWARDED TO EXAMINER |
|
| STPP | Information on status: patent application and granting procedure in general |
Free format text: NON FINAL ACTION MAILED |
|
| AS | Assignment |
Owner name: CALIFORNIA INSTITUTE OF TECHNOLOGY, CALIFORNIA Free format text: ASSIGNMENT OF ASSIGNORS INTEREST;ASSIGNORS:ANTEBI, YARON E.;LINTON, JAMES;KLUMPE, HEIDI;REEL/FRAME:048894/0909 Effective date: 20190408 |
|
| STPP | Information on status: patent application and granting procedure in general |
Free format text: RESPONSE TO NON-FINAL OFFICE ACTION ENTERED AND FORWARDED TO EXAMINER |
|
| STPP | Information on status: patent application and granting procedure in general |
Free format text: NOTICE OF ALLOWANCE MAILED -- APPLICATION RECEIVED IN OFFICE OF PUBLICATIONS |
|
| STPP | Information on status: patent application and granting procedure in general |
Free format text: PUBLICATIONS -- ISSUE FEE PAYMENT VERIFIED |
|
| STCF | Information on status: patent grant |
Free format text: PATENTED CASE |
|
| AS | Assignment |
Owner name: CALIFORNIA INSTITUTE OF TECHNOLOGY, CALIFORNIA Free format text: ASSIGNMENT OF ASSIGNORS INTEREST;ASSIGNOR:HOWARD HUGHES MEDICAL INSTITUTE;REEL/FRAME:053649/0628 Effective date: 20200830 Owner name: HOWARD HUGHES MEDICAL INSTITUTE, MARYLAND Free format text: ASSIGNMENT OF ASSIGNORS INTEREST;ASSIGNOR:ELOWITZ, MICHAEL;REEL/FRAME:053649/0610 Effective date: 20160111 |
|
| FEPP | Fee payment procedure |
Free format text: MAINTENANCE FEE REMINDER MAILED (ORIGINAL EVENT CODE: REM.); ENTITY STATUS OF PATENT OWNER: SMALL ENTITY |
|
| FEPP | Fee payment procedure |
Free format text: SURCHARGE FOR LATE PAYMENT, SMALL ENTITY (ORIGINAL EVENT CODE: M2554); ENTITY STATUS OF PATENT OWNER: SMALL ENTITY |
|
| MAFP | Maintenance fee payment |
Free format text: PAYMENT OF MAINTENANCE FEE, 4TH YR, SMALL ENTITY (ORIGINAL EVENT CODE: M2551); ENTITY STATUS OF PATENT OWNER: SMALL ENTITY Year of fee payment: 4 |