STATEMENT REGARDING SEQUENCE LISTING
The sequence listing associated with this application is provided in text format in lieu of a paper copy and is hereby incorporated by reference into the specification. The name of the text file containing the sequence listing is 57068_Seq_Revised Final_2019-10-23.txt. The text file is 27 KB; was created on Oct. 23, 2019; and is being submitted via DFS-Web with the filing of the specification.
BACKGROUND
The present invention relates to the field of green microalgae and their use in biotechnology. More particularly, the present invention describes the use of Chlamydomonas lacking a functional DYRKP-1 protein, for producing large amounts of neutral lipids (triacylglycerides: TAGs, or oils) and/or large amounts of starch, under stress conditions.
Because of their high biomass productivity and their ability to accumulate high intracellular amounts of starch (convertible into bioethanol), or oil (convertible into biodiesel), microalgae represent a promising feedstock for the production of next-generation biofuels (Hu et al., 2008; Wijffels and Barbosa, 2010). However, their productivity needs to be increased in order to reach sustainable biofuel production (Delrue et al., 2013).
Microalgae and, more generally, photosynthetic organisms have developed sophisticated strategies to optimize growth and survival under constantly fluctuating conditions of light, temperature and nutrient availability. In microalgae, deprivation of essential macronutrients strongly affects growth and induces drastic changes in the cellular metabolism. A general response to nitrogen or sulfur deprivation consists in a decrease in protein synthesis, an arrest in cell division, a massive accumulation of energy-rich storage compounds such as starch and triacylglycerols (Ball et al., 1990; Merchant et al., 2012), and a down-regulation of photosynthesis (Grossman, 2000; Peltier and Schmidt, 1991). This requirement of nutrient deprivation to trigger accumulation of reserve compounds is one of the major biological limitations of microalgae for biotechnology purposes because it impairs biomass productivity (Hu et al., 2008). Despite considerable interest for microalgae as a new feedstock (Larkum et al., 2012), little is known about signaling and regulatory genes and pathways controlling processes of photosynthetic energy conversion and storage in relation to nutrient and energy status.
Deciphering regulatory mechanisms controlling growth, photosynthesis and reserve accumulation in response to the nutrient and energy status is hence a key issue towards optimizing microalgal productivity for biotechnological applications.
With the aim to unravel regulatory mechanisms involved in the dynamics of reserve in response to nutrient availability, the inventors have now characterized one mutant of Chlamydomonas reinhardtii, screened on a defect in starch degradation and called std1 (for starch degradation). The std1 mutant harbors an insertion in a gene of the DYRK family, initially annotated as DYRK2 (Chlamydomonas genome version 4.0), and renamed here DYRKP-1. The Chlamydomonas std1 mutant, the first dyrk mutant of the green lineage reported so far, accumulates much more starch and oil than its wild-type progenitor in response to nutrient deprivation in photoautotrophic conditions, and more oil than its wild-type progenitor in response to nutrient deprivation also in mixotrophic conditions. The present invention hence provides methods to cultivate microalgae cells so as to optimize their growth for optimum production of starch and/or lipids from the microalgae. The methods of the present invention induce and enhance accumulation of starch and/or oil, depending on the culture conditions, within the microalgae cells. The methods disclosed are suitable for large-scale production of starch- and/or oil-rich microalgae.
A first aspect of the present invention is hence a method for producing biomass feedstock, comprising the steps of:
(i) cultivating green microalgae cells in which the expression and/or the activity of the DYRKP-1 protein is altered; and
(ii) inducing reserve accumulation and/or increase in biomass production by said microalgae.
As defined herein, the “DYRKP-1 protein” is a DYRK protein expressed by microalgae, which possesses a DH-box having the following sequence: H(R/K)TGFEEXK(D/E/N)(F/L) (SEQ ID No: 3). The amino acid sequence and coding sequence (cDNA sequence including the 5′- and 3′-UTRs) of the DYRKP-1 protein of Chlamydomonas reinhardtii are disclosed herein (SEQ ID NO: 1 and 2, respectively). From these sequences, the skilled artisan can perfectly identify the sequence of DYRKP-1 in any green microalga different from Chlamydomonas reinhardtii, by identifying in said microalga the protein homologous to that of SEQ ID NO: 1. In the present text, a protein is considered as being an homolog of DYRKP-1 from Chlamydomonas reinhardtii if both proteins share a common ancestor, as shown by very similar primary sequences (at least 50, 60, 70, 75, 80, 85, 90, 95 or 99% identity, as measured by BLAST) and secondary and tertiary structures.
In the present text, “altered” or “impaired” means that the expression and/or the activity of the DYRKP-1 protein is changed, so that the activity of the protein is decreased. For example, the DYRKP-1 gene can be silenced, knocked down, mutated and/or interrupted, so that the microalgae lack a functional DYRKP-1 protein. Activity of the DYRK-P protein could also be inhibited by chemical compounds acting as specific inhibitors.
As disclosed in the experimental part below, the method according to the invention can be performed with Chlamydomonas, especially with Chlamydomonas reinhardtii.
In step (i), the cells are cultured according to any usual protocol known by the skilled artisan. For example, they can be grown photoautotrophically in a MOPS-buffered minimal medium (MM) supplied with 2% CO2 to a density of 2-5×10⁶ cells/nil.
In a particular embodiment of this aspect, said inducing reserve accumulation comprises incubating the microalgae cells in a deficient medium, i.e., a medium which does not comprise, in sufficient quantities, all the nutrients required for optimal growth of green microalgae. Examples of such a deficient medium include a medium deficient in at least one element selected from the group consisting of nitrogen, sulfur and phosphorus, in a form which can be metabolized by the microalgae. Of course, the phrase “deficient in” is not to be read in an absolute sense (i.e., with a concentration equal to zero), but means that the concentration of said nutrient in the medium is far below (at least 10-fold below) the concentration of said nutrient in a classical medium used for microalgae culture.
Between step (i) and step (ii), the cells can be harvested and transferred into the deficient medium. Alternatively, typically in a continuous culture device, the deficit in the medium is created by the cell's metabolism, in absence of exogenous addition of at least one nutrient. For example, as illustrated in the experimental part and in FIG. 9A, addition of minimal N-free medium in a photobioreactor operated as a turbidostat (to maintain the cellular biomass at a constant level) resulted in a decrease in the ammonia content of the culture medium, which was fully exhausted in less than 2 days.
In a particular embodiment, the step of inducing reserve accumulation comprises illuminating the microalgae cells with a light enabling photosynthesis to occur.
For example, this illumination can be performed at an intensity of at least 25 μmol photons m−2 s−1, or at least 100 μmol photons m−2 s−1, for example comprised between 25 and 2000 μmol photons m−2 s−1, during 8 to 24 hours per day. The skilled artisan perfectly knows that the effects of the light intensity depend in fact on the intensity which is really received by the microalgae, and hence depend on several parameters such as cell density and the shape of the photobioreactor, etc., and is able to adapt the illumination intensity to the specific encountered conditions.
Remarkably, the inventors have shown that nutrient deprivation does not lead to a rapid stop of photosynthesis by microalgae lacking DYRKP-1 activity, as is usually the case for wild-type microalgae. This is particularly advantageous, since the cells can not only be oil- and/or starch-enriched, but in addition, the global biomass increases during several days of deficient conditions, leading to remarkable overall increased lipid and starch productivity.
Hence, in an advantageous embodiment of the present invention, the step of incubating the microalgae cells in a deficient medium lasts at least 24 hours, for example from 2 to 8 days, preferably from 3 to 6 days. Of course, the cell growth in a deficient medium strongly depends on experimental conditions, particularly of the cell density, and hence the skilled artisan will adapt the duration of the incubation with a deficient medium so that, under the specific conditions used, the reserve accumulation and/or biomass increase is optimal.
According to a particular embodiment of the invention, step (ii) comprises incubating the microalgae cells in a medium comprising organic carbon such as, for example, acetate. According to a non-limitative example of such mixotrophic conditions, illustrated in the examples below, the cells are incubated in step (ii) during 2 to 6 days in a nitrogen-deficient medium comprising acetate, under constant illumination of at least 50 μmol photons m−2 s−1. The inventors have shown that in mixotrophic conditions, microalgae lacking DYRKP-1 activity respond to nutrient depletion by increased lipid accumulation compared to wild-type cells. Hence, this particular embodiment of the method is advantageously used for producing oil, for example for biodiesel production.
According to another embodiment, the inducing step (ii) comprises incubating the microalgae cells in a deficient medium as defined previously and in photoautotrophic conditions, i.e., in conditions such that they convert radiant energy into biologically useful energy and synthesize metabolic compounds using only carbon dioxide, bicarbonate or carbonates as source of carbon. Typically, the microalgae cells are incubated under illumination in a medium essentially devoid of organic carbon which they can metabolize. In what precedes, “essentially devoid of organic carbon” means that no organic carbon which can be metabolized by the microalgae has been added into the medium. According to a preferred version of this embodiment, the cells are incubated in step (ii) during at least 15 hours, preferably at least 1, 2 or 3 days, and up to 6 or more days in a nutrient-deficient medium, for example in a nitrogen-deficient medium essentially devoid of organic carbon which can be metabolized by the microalgae. The inventors have shown that in photoautotrophic conditions, microalgae lacking DYRKP-1 activity accumulate much more starch and oil than their wild-type progenitor in response to nutrient deprivation. Hence, this particular embodiment of the method is advantageously used for producing starch, for example for bioethanol production, as well as for producing oil, for example for biodiesel production. This embodiment is particularly interesting, because in photoautotrophic conditions, cells can supply their need for carbon completely through photosynthesis, which is a major advantage compared to cells requiring an additionally supplied carbon source for growth (such as yeast or E coli).
It is to be noted that microalgae naturally produce polyunsaturated fats (omega-3 and omega-6), as well as complex molecules such as carotenoids, and that these high-value products can also be produced according to the methods described herein. The invention hence also relates to methods for producing fatty acids, polyunsaturated fats, carotenoids and other compounds for cosmetic and/or pharmaceutical industries, as well as food supplements, comprising a step of starch and/or triacylglycerols accumulation in microalgae by performing a method as described above
The methods of the invention may comprise one or more extraction steps after the triggering of starch and/or triacylglycerols accumulation step in microalgae. The extraction step may be implemented using solvents or another extraction method well known form the skilled artisan.
The present invention will be understood more clearly from the further description which follows, which refers to examples illustrating the response of microalgae lacking DYRKP-1 activity to nutrient deprivation, as well as to the appended figures.
FIGURE LEGENDS
FIGS. 1A through 1E describe the isolation and molecular characterization of the Chlamydomonas std1 mutant affected in the DYRKP-1 gene.
FIG. 1A depicts starch degradation phenotype of the std1 mutant. Algal colonies were spotted on paper filters onto N or S depleted TAP-agar for 5 days, leading to starch accumulation, and then placed in the dark on minimal medium (MM) for two days to induce starch breakdown. Starch accumulation was visualized by exposure to iodine vapor.
FIG. 1B depicts the Chlamydomonas DYRKP-1 gene model is composed of 14 exons (black boxes) and 13 introns (black lines). Sequence information about the exon-intron borders and the 5′ start was obtained from three overlapping RT-PCRs. Insertion of the paromomycin resistance cassette (AphVIII gene, white box) in the third DYRKP-1 exon was determined by genome walking PCR.
FIG. 1C depicts DYRKP-1 gene expression analyzed by RT-PCR in wild-type, std1 and two complemented strains (std1::STD1 1 and 2) grown in TAP. Actin was used as a control gene.
FIG. 1D depicts DYRKP-1 protein expression analyzed by immuno-detection in soluble protein lysates from photoautotrophically grown cells separated on an 8% SDS-polyacrylamide gel.
FIG. 1E depicts DYRKP-1 transcript accumulation in response to N deprivation. Wild-type, std1 mutant and complemented strains std1:: STD1 1 and 2 were starved for nitrogen for three days in photoautotrophic conditions. RNA was hybridized with probes coding for a DYRKP-1 fragment; the CBLP2 gene that served as a loading control.
FIGS. 2A through 2C depict Southern blot analysis and mutant complementation.
FIG. 2A depicts Southern blot analysis of wild-type strain 137AH and std1 mutant strain. NotI-, XmaI- or StuI/SacI-restricted genomic DNA was loaded on an agarose gel, Southern blotted and hybridized with a probe against the AphVIII gene (paromomycin resistance cassette). Loaded amount of DNA per lane is indicated in μg.
FIG. 2B depicts construction of the plasmid for std1 complementation with hygromycin resistance marker. Genomic wild-type DNA coding for STD1 was amplified by PCR and cloned into pSL-Hyg vector that emerged from pSL18.
FIG. 2C depicts starch levels of wild-type strain (137AH, in black), std1 mutant strain (white) and two complemented strains (std1:: STD1 1 and 2, in grey) in different deprivation conditions. Cultures were grown in TAP medium (Con.=Control), subjected for two days to nitrogen (TAP-N) or sulfur (TAP-S) starvation, which induced starch accumulation (Acc.). Subsequently, the starved cultures were centrifuged, resuspended in minimal medium (MM) and kept for 8 or 24 h hours in the dark. In MM (comprising N but no C) in the dark starch will be catabolized (Degr.). Starch values are the means of at least 3 biological replicates ±SD.
FIGS. 3A through 3B depict a phylogenetic tree of the DYRK protein family including the green lineage.
FIG. 3A depicts a phylogenetic tree of the DYRK protein family. Homologous amino acids sequences from algae, fungi and plants retrieved from JGI, Phytozome or NCBI databases were compared by performing a phylogenetic analysis. Sequences were aligned with the MAFFT version 6 program. The tree was obtained with the Neighbor-Joining method. The following abbreviations were used: Asp: Aspergillus fumigatus, At: Arabidopsis thaliana, d: Drosophila melanogaster, Dd: Dictyostelium discoideum, ChlNC: Chlorella sp. NC64A, Cre: Chlamydomonas reinhardtii, Micpu: Micromonas pusilla (CCMP1545/sp. RCC299), Os: Oryza sativa, Ost: Ostreococcus (lucimarinus/tauri), Phypa: Physcomitrella patens, Vca: Volvox carteri, Viv: Vitis vinifera (Zea mays sequences were combined with rice homologs and Populus trichocarpa with wine). DYRK sequences accession numbers and multi-alignment used to build the phylogenetic tree are shown in Table 1.
FIG. 3B depicts consensus sequence of the DYRK homology (DH)-box of six DYRK subgroups according to FIG. 3A; in the DYRKP subgroup three minor subgroups were distinguished giving the following seven classes: DYRK1 (7 sequences; SEQ ID NO:19), DYRK2 (22 sequences; SEQ ID NO:20), YAK1 (21 sequences; SEQ ID NO:21), DYRKP-A (12 higher plant sequences including moss; SEQ ID NO:22), DYRKP-B (11 higher plant sequences; SEQ ID NO:23), DYRKP-algae (7 sequences; SEQ ID NO:24), and the published DH consensus sequence from (Becker and Joost, 1999), in which nine sequences from different DYRK groups were compared (SEQ ID NO:18).
| TABLE 1 |
| |
| Accession numbers for the sequences used for the phylogenetic tree in FIG. 2. |
| |
| |
| |
|
|
Accession |
predicted |
| Name |
Group |
Species |
Number NCBI |
aa |
| |
| DYRK1A |
DYRK1 |
Homo sapiens
|
NP_001387; |
763 |
| |
|
|
GI:18765758 |
|
| DYRK1B |
DYRK1 |
Homo sapiens
|
NP_004705; |
629 |
| |
|
|
GI:4758222 |
|
| DYRK2 |
DYRK2 |
Homo sapiens
|
NP_006473; |
601 |
| |
|
|
GI:153281169 |
|
| DYRK3 |
DYRK2 |
Homo sapiens
|
NP_003573; |
588 |
| |
|
|
GI:51702240 |
|
| DYRK4 |
DYRK2 |
Homo sapiens
|
NP_003836; |
520 |
| |
|
|
GI:28827774 |
|
| DYRK1A |
DYRK1 |
Mus musculus
|
NP_031916; |
763 |
| |
|
|
GI:24418935 |
|
| DYRK1B |
DYRK1 |
Mus musculus
|
NP_001033046; |
629 |
| |
|
|
GI:83816922 |
|
| DYRK2 |
DYRK2 |
Mus musculus
|
NP_001014412; |
599 |
| |
|
|
GI:67846105 |
|
| DYRK3 |
DYRK2 |
Mus musculus
|
NP_663483; |
586 |
| |
|
|
GI:21704000 |
|
| DYRK4 |
DYRK2 |
Mus musculus
|
NP_001028487; |
616 |
| |
|
|
GI:161333817 |
|
| Minibrain (dDyrk1) |
DYRK1 |
Drosophila melanogaster
|
NP_728104; |
908 |
| |
|
|
GI:24642876 |
|
| dDyrk2 (Smi35A) |
DYRK2 |
Drosophila melanogaster
|
NP_523564; |
722 |
| |
|
|
GI:17737415 |
|
| dDyrk3 |
DYRK2 |
Drosophila melanogaster
|
NP_001033810; |
828 |
| |
|
|
GI:85724756 |
|
| DYRK1B (Dyrk1b) |
DYRK1 |
Danio rerio
|
NP_001161737; |
681 |
| |
|
|
GI:319996595 |
|
| DYRK2 |
DYRK2 |
Danio rerio
|
NP_001038298.1 |
587 |
| |
|
|
GI:113677529 |
|
| DYRK4 |
DYRK2 |
Danio rerio
|
XP_693389; |
634 |
| |
|
|
GI:189537435 |
|
| DYRK3 |
DYRK2 |
Xenopus laevis
|
NP_001088793; |
567 |
| |
|
|
GI:148224808 |
|
| YakA |
Yak |
Dictyostelium discoideum
|
XP_638920; |
1458 |
| |
|
|
GI:66810395 |
|
| DdDyrk1 |
DYRK1 |
Dictyostelium discoideum
|
XP_642598; |
836 |
| |
|
|
GI:66817490 |
|
| DdDyrk2 |
DYRK2 |
Dictyostelium discoideum
|
XP_628965; |
915 |
| |
|
|
GI:66800079 |
|
| Yak1p |
Yak |
Saccharomyces cerevisiae
|
NP_012394; |
807 |
| |
|
|
GI:6322320 |
|
| Pom1 |
Pom/DYRK2 |
Neurospora crassa
|
XP_960871; |
1300 |
| |
|
|
GI:85099941 |
|
| Pom1 |
Pom/DYRK2 |
Pyrenophora tritici-repentis |
XP_001940188; |
545 |
| |
|
|
GI:189207709 |
|
| Ppk15p |
Yak |
Schizosaccharomyces pombe
|
NP_593830; |
534 |
| |
|
|
GI:19114742 |
|
| Pom1 (Pom1p) |
Pom/DYRK2 |
Schizosaccharomyces pombe
|
NP_592974; |
1087 |
| |
|
|
GI:19113886 |
|
| Ppk5p |
Pom/DYRK2 |
Schizosaccharomyces pombe
|
NP_593081; |
836 |
| |
|
|
GI:63054495 |
|
| AspYak1 |
Yak |
Aspergillus fumigatus
|
XP_746572; |
894 |
| |
|
|
GI:70982087 |
| |
| |
|
|
|
Accession |
predicted |
genome |
| Name |
Groupe |
Species |
Gene Model |
Number NCBI |
aa |
website |
| |
| AtYak1 |
Yak |
Arabidopsis thaliana
|
AT5G35980 |
NP_198447; |
956 |
The |
| |
|
|
|
GI:42568145 |
|
Arabidopsis |
| |
|
|
|
|
|
Information |
| |
|
|
|
|
|
Resource |
| AtDYRKP-1 |
DYRKP |
Arabidopsis thaliana
|
AT1G73450 |
NP_177487; |
1152 |
|
| |
|
|
|
GI:42563202 |
|
|
| AtDYRKP-2 |
DYRKP |
Arabidopsis thaliana
|
AT1G73460 |
NP_177488; |
1169 |
|
| |
|
|
|
GI:42563204 |
|
|
| AtDYRKP-3 |
DYRKP |
Arabidopsis thaliana
|
AT2G40120 |
NP_181541; |
570 |
|
| |
|
|
|
GI:15225633 |
|
|
| AtDYRKP-4 |
DYRKP |
Arabidopsis thaliana
|
AT3G17750 |
NP_188402; |
1138 |
|
| |
|
|
|
GI:15229515 |
|
|
| OsYak1 |
Yak |
Oryza sativa ssp |
Os02g0702500 |
NP_001047851; |
813 |
Michigan State |
| |
|
japonica
|
|
GI:115448143 |
|
University - |
| |
|
|
|
|
|
Rice Genome |
| |
|
|
|
|
|
Annotation |
| |
|
|
|
|
|
Project |
| OsYak2 |
Yak |
Oryza sativa ssp |
Os04g0602800 |
NP_001053776; |
924 |
Joint Genome |
| |
|
japonica
|
|
GI:115460352 |
|
Institute - Plant |
| |
|
|
|
|
|
Comparative |
| |
|
|
|
|
|
Genomics |
| |
|
|
|
|
|
Portal |
| OsDYRKP-1 |
DYRKP |
Oryza sativa ssp |
Os01g0832900 |
NP_001044708; |
729 |
(JGI) |
| |
|
japonica
|
|
GI:115440857 |
|
|
| OsDYRKP-2 |
DYRKP |
Oryza sativa ssp |
Os03g0719500 |
NP_001051095; |
1115 |
|
| |
|
japonica
|
|
GI:115454989 |
|
|
| OsDYRKP-3 |
DYRKP |
Oryza sativa ssp |
Os05g0466900 |
NP_001055789; |
708 |
|
| |
|
japonica
|
|
GI:297604629 |
|
|
| VivYak1 |
Yak |
Vitis vinifera
|
GSVIVG01024260001 |
XP_002267912.1; |
909 |
JGI |
| |
|
|
|
GI:225454595 |
|
|
| VivDYRKP-1 |
DYRKP |
Vitis vinifera
|
GSVIVG01012107001 |
XP_002276420.1; |
1855 |
|
| |
|
|
|
GI:225423662 |
|
|
| VivDYRKP-2 |
DYRKP |
Vitis vinifera
|
GSVIVG01032814001 |
XP_002272072.1; |
728 |
|
| |
|
|
|
GI:225448445 |
|
|
|
ZmYak1
|
Yak
|
Zea mays
|
GRMZM2G156638
|
NP_001159228.1; |
706 |
(incomplete)
|
| |
|
|
|
GI:259490627
|
|
|
|
ZmYak2
|
Yak
|
Zea mays
|
GRMZM2G311051
|
ACL53420.1;
|
556 |
(incomplete)
|
| |
|
|
|
GI:219886091
|
|
|
| ZmDYRKP-1 |
DYRKP |
Zea mays
|
GRMZM2G015073 |
Not found |
1103 |
Gramene |
| |
|
|
|
|
|
Database |
| ZmDYRKP-2 |
DYRKP |
Zea mays
|
GRMZM2G181002 |
Not found |
1098 |
JGI |
| ZmDYRKP-3 |
DYRKP |
Zea mays
|
GRMZM2G068192 |
NP_001145942.1; |
391 |
|
| |
|
|
|
GI:226530085 |
|
|
| ZmDYRKP-4 |
DYRKP |
Zea mays
|
GRMZM2G088409 |
NP_001182917.1; |
684 |
|
| |
|
|
|
GI:308081613 |
|
|
| ZmDYRKP-5 |
DYRKP |
Zea mays
|
GRMZM2G357873 |
NP_001130373.1; |
724 |
|
| |
|
|
|
GI:212275250 |
|
|
| ZmDYRKP-6 |
DYRKP |
Zea mays
|
GRMZM2G448633 |
NP_001148168.1; |
725 |
|
| |
|
|
|
GI:226506060 |
|
|
| PhypaYak1 |
Yak |
Physcomitrella patens
|
Pp1s3_592V6.1 |
No completed |
959 |
Plant Genome |
| |
|
|
|
gene models |
|
Database |
| PhypaYak2 |
Yak |
Physcomitrella patens
|
Pp1s16_333V6.1 |
at NCBI |
1064 |
JGI |
| PhypaYak3 |
Yak |
Physcomitrella patens
|
Pp1s132_192V6.1 |
|
1108 |
|
| PhypaYak4 |
Yak |
Physcomitrella patens
|
Pp1s192_46V6.1 |
|
1089 |
|
| PhypaYak5 |
Yak |
Physcomitrella patens
|
Pp1s401_7V6.1 |
|
1136 |
|
| PhypaDYRK2 |
DYRK2 |
Physcomitrella patens
|
Pp1s252_88V6.1 |
|
1129 |
|
| PhypaDYRKP-1 |
DYRKP |
Physcomitrella patens
|
Pp1s47_312V6.1 |
|
726 |
|
| PhypaDYRKP-2 |
DYRKP |
Physcomitrella patens
|
Pp1s312_23V6.1 |
|
525 |
|
| PhypaDYRKP-3 |
DYRKP |
Physcomitrella patens
|
Pp1s381_39V6.1 |
|
1446 |
|
| PoptrYak1 |
Yak |
Populus trichocarpa
|
POPTR_0013s07280 |
EEE95157.1; |
966 |
|
| |
|
|
|
GI:222857610 |
|
|
| PoptrYak2 |
Yak |
Populus trichocarpa
|
POPTR_0019s06030 |
EEF00267.1; |
893 |
|
| |
|
|
|
GI:222862760 |
|
|
| PoptrDYRKP-1 |
DYRKP |
Populus trichocarpa
|
POPTR_0008s06890 |
EEE89528.1; |
725 |
|
| |
|
|
|
GI:222851981 |
|
|
| PoptrDYRKP-2 |
DYRKP |
Populus trichocarpa
|
POPTR_0010s19570 |
EEF01327.1; |
591 |
|
| |
|
|
|
GI:222864196 |
|
|
| PoptrDYRKP-3 |
DYRKP |
Populus trichocarpa
|
POPTR_0012s03670 |
EEE96543.1; |
1158 |
|
| |
|
|
|
GI:222858996 |
|
|
| PoptrDYRKP-4 |
DYRKP |
Populus trichocarpa
|
POPTR_0015s05140 |
EEF07789.1; |
1151 |
|
| |
|
|
|
GI:222870658 |
|
|
| CreYak1 |
Yak |
Chlamydomonas
|
Cre08.g381950 |
XP_001694330; |
2202 |
JGI |
| |
|
reinhardtii
|
|
GI:159472382 |
|
|
| CreDYRK2 |
DYRK2 |
Chlamydomonas
|
Cre02.g146500 |
XP_001695011; |
1239 |
|
| |
|
reinhardtii
|
|
GI:159473779 |
|
|
| CreDYRKP-1 |
DYRKP |
Chlamydomonas
|
Cre07.g337300 |
XP_001700085; |
1278 |
|
| |
|
reinhardtii
|
|
GI:159484074 |
|
|
| VcaYak1 |
Yak |
Volvox carteri
|
Volca1|30949 |
XP_002953068; |
398 |
JGI |
| |
|
|
|
GI:302843051 |
(incom- |
|
| |
|
|
|
|
plete) |
|
| VcaDYRK2 |
DYRK2 |
Volvox carteri
|
Volca1|61790 |
XP_002951959; |
512 |
|
| |
|
|
|
GI:302840826 |
|
|
| VcaDYRKP-1 |
DYRKP |
Volvox carteri
|
Volca1|77582 |
XP_002957430; |
370 |
|
| |
|
|
|
GI:302851815 |
|
|
| OstluYak1 |
Yak |
Ostreococcus
|
Ost9901_3|37908 |
XP_001420045; |
425 |
JGI |
| |
|
lucimarinus CCE9901 |
|
GI:145351353 |
|
|
| OstluDYRKP-1 |
DYRKP |
Ostreococcus
|
Ost9901_3|36819 |
XP_001417467; |
395 |
|
| |
|
lucimarinus CCE9901 |
|
GI:145345962 |
|
|
|
Ostlu38674
|
DYRK2?
|
Ostreococcus
|
Ost9901_3|38674 |
XP_001418004; |
397 |
|
| |
|
lucimarinus
CCE9901
|
|
GI:145347077
|
(incom-
|
|
| |
|
|
|
|
plete)
|
|
|
Ostlu42173
|
DYRK1?
|
Ostreococcus
|
Ost9901_3|42173 |
XP_001422264; |
154 |
|
| |
|
lucimarinus
CCE9901
|
|
GI: 145356070
|
(incom-
|
|
| |
|
|
|
|
plete)
|
|
| OsttaYak1 |
Yak |
Ostreococcus tauri
|
Ostta4|19878 |
XP_003081795; |
772 |
JGI |
| |
|
|
|
GI:308808970 |
|
|
| OsttaDYRKP-1 |
DYRKP |
Ostreococcus tauri
|
Ostta4|16877 |
XP_003078697; |
652 |
|
| |
|
|
|
GI:308802768 |
|
|
|
Ostta17596
|
DYRK2?
|
Ostreococcus tauri
|
Ostta4|17596
|
XP_003079347; |
837 |
|
| |
|
|
|
GI:308804069
|
(incom-
|
|
| |
|
|
|
|
plete)
|
|
|
Ostta22490
|
DYRK1?
|
Ostreococcus tauri
|
Ostta4|22490
|
XP_003084217; |
472 |
|
| |
|
|
|
GI:308813822
|
(incom-
|
|
| |
|
|
|
|
plete)
|
|
| ChINC-DYRK2 |
DYRK2 |
Chlorella sp. NC64A |
ChINC64A_1|16563 |
EFN52309; |
364 |
JGI |
| |
|
|
|
GI:307104053 |
(incom- |
|
| |
|
|
|
|
plete) |
|
| ChINC-DYRKP-1 |
DYRKP |
Chlorella sp. NC64A |
ChINC64A_1|36965 |
EFN52148; |
285 |
|
| |
|
|
|
GI:307103891 |
(incom- |
|
| |
|
|
|
|
plete) |
|
| MicpuC-Yak1 |
Yak |
Micromonas pusilla
|
MicpuC3|39551 |
XP_003057930; |
605 |
JGI |
| |
|
CCMP1545 |
|
GI:303277273 |
|
|
| MicpuC-DYRK2 |
DYRK2 |
Micromonas pusilla
|
MicpuC3|152430 |
XP_003057384; |
513 |
|
| |
|
CCMP1545 |
|
GI:303276180 |
|
|
| MicpuC-DYRKP-1 |
DYRKP |
Micromonas pusilla
|
MicpuC3|16074 |
XP_003058010; |
341 |
|
| |
|
CCMP1545 |
|
GI:303277433 |
|
|
|
MicpuC8718
|
DYRK1?
|
Micromonas pusilla
|
MicpuC3|8718
|
XP_003057290; |
143 |
|
| |
|
CCMP1545
|
|
GI:303275992
|
(incom-
|
|
| |
|
|
|
|
plete)
|
|
| MicpuN-Yak1 |
Yak |
Micromonas sp. |
MicpuN3|83368 |
XP_002503782; |
421 |
JGI |
| |
|
RCC299 |
|
GI:255080404 |
|
|
| MicpuN-DYRK2 |
DYRK2 |
Micromonas sp. |
MicpuN3|58615 |
XP_002502528; |
642 |
|
| |
|
RCC299 |
|
GI:255077896 |
|
|
| MicpuN-DYRKP-1 |
DYRKP |
Micromonas sp. |
MicpuN3|58100 |
XP_002501491; |
1019 |
|
| |
|
RCC299 |
|
GI:25507563 |
|
|
|
MicpuN85819
|
DYRK1?
|
Micromonas
sp.
|
MicpuN3|85819
|
XP_002508509; |
238 |
|
| |
|
RCC299
|
|
GI:255083869
|
(incom-
|
|
| |
|
|
|
|
plete)
|
| |
Sequences in bold were not utilized for the alignment. Definitively incomplete gene models are indicated. When predicted number of amino acids differed at two compared genome databases, usually the longer version was chosen. Some genes have different splice variants, e.g. “ZmDYRKP3” that harbours three transcripts at this locus. In case of Danio rerio and Xenopus laevis, not all existing DYRK genes were provided for the alignment.
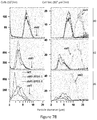
FIGS. 4A through 4D depict carbon storage and photosynthetic activity in the std1 mutant in response to nitrogen deprivation. Cells were grown in TAP or minimal medium with 2% CO2 in air under a constant illumination of 100 μmol photons m−2 s−1. At day 0, cells were centrifuged, washed and resuspended in TAP-N (left panels; FIGS. 4A-4C) or MM-N (right panels; FIGS. 4A-4C). Measurements were performed in wild-type (WT), std1 mutant and in two complemented strains std1::STD1 1 and std1::STD1 2 (FIGS. 4A-4C).
FIG. 4A depicts intracellular starch accumulation. Shown are means of 4 experiments (3 for day 6)±SD for TAP-N and means of 6 experiments (3 for day 10)±SD for MM-N.
FIG. 4B depicts intracellular accumulation of neutral lipids (TAGs). Upon extraction of total cellular lipids, TAGs were separated by thin layer chromatography and quantified. One representative experiment out of three biological replicates is shown for each condition (TAP-N or MM-N). TAG values are mean of three technical replicates ±SD.
FIG. 4C depicts photosynthetic electron transport rate (ETR) as determined from chlorophyll fluorescence measurements during the first three days of N deprivation. Plotted values are the means of 4 (TAP-N) or 6 (MM-N) measurements ±SD under actinic illumination of ˜100 μmol photons m2 s−1.
FIG. 4D depicts immunodetection of proteins of interest. Whole cell protein extracts were analyzed by immuno-detection after 1, 2 or 6 days of nitrogen starvation in photoautotrophic conditions (MM-N). Proteins were separated on a 10% SDS-polyacrylamide gel and stained by Coomassie blue for loading control (FIG. 7C) or immunoblotted to detect the indicated proteins.
FIGS. 5A through 5D depict intracellular starch accumulation and photosynthetic activity in photoautotropically grown cultures submitted to N-deprivation or S-deprivation.
At day 0, phototoautropically grown cultures (MM, 2% CO2 in air) of wild-type (WT), mutant (std1) and two complemented (std1::STD1 1 and 2) strains were centrifuged, washed and resuspended in MM-N or MM-S in the presence of 2% CO2 in air. At different time points, cell pellets, total cellular volume and dry weight biomass were analyzed.
FIG. 5A depicts starch dynamics in autotrophic N deprivation and FIG. 5B depicts autotrophic S deprivation at low light intensities of 30-40 μmol photons m−2 s−1. Starch values are the means of 5 biological replicates ±SD and means of 3 experiments for the std1 progeny strains 1A and 2A resulting from a backcross of std1 (mt−nit1 nit2) with the wild-type CC125 (mt+nit1 nit2), both are of the type “137c” strain. Four experiments were performed in MM-N/CO2 at low light intensities of 30-40 μmol photons m−2 s−1.
FIG. 5C depicts photosynthetic efficiencies of wild-type, std1 mutant and complemented cells during three days of N deprivation at ˜35 μE m−2 s−1 in autotrophic conditions or FIG. 5D depicts S deprivation at 100 μE m−2 s−1. Plotted values are the means of 5 measurements ±SD at an illumination of ˜100 μE m−2 s−1.
FIGS. 6A through 6C depict biomass productivity of the std1 mutant during N deprivation in photo-autotrophic conditions. Experimental setup was the same as in FIG. 5 but using only a MM-N medium.
In FIG. 6A cells were harvested from 1 mL culture, centrifuged and pellets pictured.
In FIG. 6B total cellular volume was determined per mL. Shown are means±SD (n=7).
In FIG. 6C was determined as dry weight from five 5 mL cultures harvested by filtration, rinsed, and dried overnight. Analysis of intracellular starch allowed determination of the starch fraction of total biomass (hatched area). Shown are means±SD (n=3).
FIGS. 7A through 7C show that std1 mutant cells form aggregates (palmelloids) enclosed by the mother cell wall.
FIG. 7A depicts bright field and differential interference contrast images of wild-type, std1 mutant and complemented (std1::STD1 1 and 2) strains grown in minimal medium and 2% CO2 and then subjected to N deprivation for 0, 2 or 6 days. Arrows indicate mother cell walls. Scale bars=10 μm.
FIG. 7B shows the distribution of cell or aggregate diameter, respectively, and comparison of the cell volume per ml of WT, std1 mutant and rescued strains std1:: STD1 1 and 2 in 0, 2 or 6 days MM-N/CO2 condition. Same representative experiment as in FIG. 7A.
FIG. 7C depicts the Commassie blue loading control of the immuno-detection experiment shown on FIG. 4D.
FIGS. 8A through 8C depict the evolution of chlorophyll contents, total cellular volume, and cell number during nitrogen deprivation. Cells were grown in TAP or minimal medium with 2% CO2 in air under a constant illumination of 100 μmol photons m−2 s−1. At day 0, cells were centrifuged, washed and resuspended in TAP-N (left panels) or MM-N (right panels). Measurements were performed in wild-type (WT), std1 mutant and in two complemented strains std1::STD1 1 and std1::STD1 2.
FIG. 8A depicts the chlorophyll concentration. Shown are means±SD of 5 experiments for TAP-N and 7 experiments for MM-N (3 for 10 d).
FIG. 8B depicts the total cellular volume in μm3 mL−1, and FIG. 8C depicts the cell or particle concentration per mL which were recorded by Multisizer™ 3 Coulter Counter® (Beckman). Shown are means±SD (n=6 for TAP-N experiments and n=7 for MM-N experiments).
FIGS. 9A and 9B depict the growth performances of std1 and wild-type Chlamydomonas cells cultivated photo-autotrophically in 1 L photobioreactors operated as turbidostats during transition from exponential growth to N-deprivation conditions. Cell density was measured using an absorption probe and maintained at a constant level by injection of fresh medium. Due to the aggregation phenotype of std1, OD880 nm was regulated at different values for WT (OD880 nm=0.4) and std1 (OD880 nm=0.3) to reach similar biomass concentrations (0.15 g dry weight L−1) in both cultures. After 48 h of stabilization in the presence of MM under constant illumination (500 μmol photons m−2 s−1) in the presence of 2% CO2 enriched air, the dilution medium was replaced by MM-N (t0). Measurements of ammonium concentration in the culture medium showed complete exhaustion after 45 h.
FIG. 9A shows the cumulated amounts of fresh medium added to maintain the culture at a constant biomass concentration. Shown are data from three biological replicates for WT and std1 cultures;
FIG. 9B depicts productivity measurements (g dry weight. d−1. L−1) were determined from at t0, t48 and t72 from dilation rates and biomass measurements. Shown are means±SD (n=3).
FIGS. 10A and 10B show the formation of oxidized MGDG in the mutant std1.
FIG. 10A shows the over-accumulation of oxidized MGDG species in the std1 mutant detected on the TLC plate.
FIG. 10B shows the structural elucidation of one oxidized MGDG 34 (16:2 O2; 18:1) species accumulating in std1.
Note: C2 and C7 represent two independent complemented lines of the std1 mutant.
FIG. 11 depicts complete analyses of lipidome in WT, std1 mutant and the two complemented lines in response to nitrogen starvation.
FIGS. 12A and 12B show the over-accumulation of oxidized MGDG in the mutant and its species distribution.
FIG. 12A depicts the total accumulation of oxidized MGDG in response to days of nitrogen starvation in WT, std1 mutant, and two complemented lines.
FIG. 12B shows the molecular species distribution of oxidized MGDG.
FIG. 13 shows the over-accumulation of a putative lipoxygenase 1 (CreLOX1) in the Chlamydomonas mutant std1. An image of SDS-PAGE gel stained by Coomassie blue demonstrating the appearance of a stronger band with a mass of ˜110 kDa. Wild-type, the std1 mutant and two independent complemented lines (C2, C7) were grown to exponential phase at standard autotrophic conditions in minimum medium supplied with 2% CO2 at 100 μmol photons m−2 s−1. After cell lysis, soluble and insoluble proteins were fractionated by ultracentrifugation with a sucrose cushion. Proteins from the pellet fraction containing membranes were resolubilized by addition of Triton X-100, ultracentrifuged and separated on a 10% NuPAGE® Bis-Tris gel. After being stained with Coomassie Brilliant Blue, a strong band was detected in the std1 mutant at ˜110 kDa and the corresponding gel regions of all samples were excised and subjected to mass spectrometric analysis.
FIGS. 14A and 14B depict the inhibition of TAG and starch accumulation in the mutant by LOX inhibitors.
FIG. 14A depicts starch accumulation.
FIG. 14B depicts TAG accumulation.
EXAMPLES
Example 1: Dual Specificity Tyrosine-Phosphorylation-Regulated Kinase DYRKP-1 Negatively Controls Starch and Oil Accumulation During Nutrient Deprivation in Chlamydomonas reinhardtii
Methods
Strains and Cultivation Conditions
As described in (Chochois et al., 2010), the strain CC125 (mt−nit1 nit2) was chosen as genetic background for mutant generation and used as wild-type strain in this study. The mutant strain std1 was generated by transformation with KpnI-linearized plasmid pSL-X harboring the paromomycin resistance cassette AphVIII. In the case of std1, only a ˜1900 bp-fragment of the ˜4800 bp-pSL-X was inserted into the genome. Cells were grown mixotrophically in Tris-acetate-phosphate (TAP) medium (Harris, 2009) in an incubator shaker at 25° C., under continuous light at ˜100 μE m−2 sec−1. For deprivation experiments, precultures were grown mixotrophically in TAP medium or photoautotrophically in a MOPS-buffered minimal medium (Harris, 2009) and 2% CO2 in the air to a density of 2-5×10⁶ cells mL−1. After taking samples at t=0, the culture was centrifuged at 25° C. and 1789 g for 4 min, the cell pellet was washed once and resuspended in N- or S-deprived medium. It should be noted that an ideally identical initial cell density of the cultures is critical to get comparable data for all studied strains. Because of palmelloid formation of std1 total cellular volume per mL or chlorophyll content was compared to adjust the cultures before starvation.
Genetic Characterization and Complementation of the Mutant Strain Std1
To check the integration frequency of the inserted DNA, Southern blot analysis was performed with wild-type and std1 mutant cells. Genomic DNA was prepared as described previously (Tolleter et al., 2011), and 4, 6 or 8 μg genomic DNA restricted with NotI were separated in an 0.8% agarose gel, blotted on a nylon membrane and hybridized with a digoxygenin-labelled probe complementary to part of the AphVIII gene of the inserted resistance cassette. A PCR DIG Probe Synthesis Kit (Roche) was utilized for probe labelling using primers 5′-CGAAGCATGGACGATGCGTT-3′ (SEQ ID NO: 4) and 5′-CGAGACTGCGATCGAACGGACA-3′ (SEQ ID NO: 5). The hybridization with the resulting 400 bp-PCR fragment was performed overnight at 50° C. using DIG Easy Hyb™ buffer (Roche). Anti-Digoxigenin-AP and CSPD as substrate (Roche) were applied to detect signals using G:BOXChemin XL (Syngene). In order to determine the site of integration of the paromomycin resistance cassette, genome walking was performed according to the GenomeWalker Kit from Clontech. Genomic DNA of the strain std1 was digested with FspI and processed appropriately according to the manufacturer's instruction. The sequences 5′-CTGGTGCTGCGCGAGCTGGCCCACGAGGAG-3′ (SEQ ID NO: 6) (GPS1) and 5′-TGGTTCGGGCCGGAGTGTTCCGCGGCGTT-3′ (SEQ ID NO: 7) (GPS2) served as gene-specific primers allowing the determination of the genomic sequence downstream of the inserted Aph VIII cassette. The Advantage GC genomic LA polymerase (Clontech) was used for amplification reactions. For complementation of the strain std1, a PCR reaction was carried out on genomic wild-type DNA using primers 5′-GTCTAGAATGTCGCTCCGCCTGAACCGATG-3′ (SEQ ID NO: 8) (XbaG4forHyg) and 5′-GTCTAGACTACATGCTGTCGAGCGAGG-3′ (SEQ ID NO: 9) (XbaG4RevHyg) and the DyNAzyme™ EXT DNA Polymerase (FinnzymesOy). The amplified 6913 bp coding for the DYRKP-1 gene were restricted by XbaI and cloned into XbaI-digested vector pSL-Hyg, originating from pSL18, (Dauvillee et al., 2003) under control of the PSAD promoter and carrying a resistance cassette for hygromycin (Berthold et al., 2002). std1 cells were transformed with KpnI-linearized pSL-Hyg-STD1 by agitation with glass beads (Kindle, 1990), selected on 20 mM hygromycin and then screened applying the same protocol as for isolating the mutant strain (Chochois et al., 2010). Transformants were exposed for several days to S or N deprivation, transferred to minimal medium and subjected to darkness followed by iodine staining to test for remaining starch levels.
Phylogenetic Analysis
Amino acid sequences were aligned using MAFFT version 6 software (Katoh et al., 2002). Next, the resulting alignment was manually refined using SeaView version 4 (Gouy et al., 2010) and regions where homology was doubtful were removed from further analysis. A total of 313 amino acid positions were kept for the phylogenetic analysis of DYRK proteins. Phylogentic analyses were conducted using Neighbour-Joining (NJ), Maximum Likelihood (ML) and Parsimony (Pars) approaches in the Phylogenetic Inference Package Phylip version 3.69 (Folenstein et al., 2005). The PROTML program was used for ML analysis and the sequence input order was randomized (20 jumbles). The SEQBOOT and CONSENSE programs were used for bootstrap value calculations on 100 replications and consensus tree reconstructions, respectively. To examine the confidence of nodes, NJ and Pars analysis were done using NEIGHBOR and PROTPARS programs. Distance matrices used for the NJ analysis were created with the PROTDIST program. The phylogenetic trees were drawn with MEGA5 (Tamura et al., 2011).
RNA Analyses and RT-PCR
Total RNA was isolated as described in (Liu et al., 2005). For RT-PCR reactions 1 μg of DNaseI-treated total RNA was employed for application of the OneStep RT-PCR Kit (Qiagen). To obtain sequence information of the complete transcribed DYRKP-1/STD1 gene, three overlapping RT-PCRs were performed using primer pairs 5′-CATAGTGCTCAGCAGGGGACAAGGC-3′ (SEQ ID NO: 10) (Std1UTR1) and 5′-AGCGTGCCAGAGGTTTCGCCGTC-3′ (SEQ ID NO: 11) (Std1P3rev), 5′-CCGCGGACGGCGAAACCTCTGGCAC-3′ (SEQ ID NO: 12) (Std1FW2) and 5′-GATCTCGTCCAGCGACTGGTCAAAGTAG-3′ (SEQ ID NO: 13) (G4rev14), and 5′-GCGGATCCGACGAGCAGGGCAACGTGCTG-3′ (SEQ ID NO: 14) (ACG4_FW3) and 5′-CGGCAAGCTTCTACATGCTGTCGAGCGAGG-3′ (SEQ ID NO: 15) (ACG4_Rev1), the latter primer pair was initially created to express the corresponding region as antigen. For comparison of transcript levels in wild-type, mutant and complemented strains, the primer pairs Std1FW2 and G4rev14 were used to amplify part of the DYRKP-1 transcript. Specific primers were designed for an actin (Locus name Cre13. g603700, Protein ID 515031), serving as constitutively expressed control gene (5′-AATCGTGCGCGACATCAAGGAGAA-3′ (SEQ ID NO: 16) and 5′-TTGGCGATCCACATTTGCTGGAAGGT-3′ (SEQ ID NO:17)).
Northern Blot Analyses
For RNA extraction, 15 mL of cell cultures at relative time points were collected on ice, centrifuged for 1 min at 1789 g and the 500 μL-cell suspension was transferred to 1.5 mL-tube on ice and mixed with 500 μL of RNA lysis buffer. RNA extraction, separation on formaldehyde agarose gels and Northern blot were performed as described in (Liu et al., 2005). Membranes were hybridized with DNA probes containing a fragment of the STD1 gene or CBLP2 gene as a loading control. A 1. pAC-STD1 plasmid was obtained by a ligation of the BamHI-HindIII-restricted vector pQE-30 (Qiagen) and a BamHI-HindII-restricted RT-PCR product coding for the 3′-part of DYRKP-1. RT-PCR was carried out using the primers 5′-GCGGATCCGACGAGCAGGGCAACGTGCTG-3′ (SEQ ID NO: 14) (ACG4_FW3) and 5′-CGGCAAGCTTCTACATGCTGTCGAGCGAGG-3′ (SEQ ID NO: 15) (ACG4_Rev1), giving rise to a 1116 pb product. 1-kb BamHI-HindIII fragment from this pAC-STD1 plasmid, and the 1-kb cDNA of CBLP2, were used for hybridization. Radioactive signals were detected using BAS-IP MS2040 phosphorimager plates (Raytest), scanned with a Molecular Imager FX phosphorimager (Bio-Rad), and imaged using the Quantity One-4.5.1 program (Bio-Rad).
Genomic DNA Analysis
To determine genomic DNA concentration during nitrogen deprivation time course experiments, cells equivalent to 1.2 mm3 total cellular volume on average were harvested by centrifugation and stored at −80° C. Genomic DNA of two replicate samples for each time point was prepared by phenol-chloroform extraction as described previously (Tolleter et al., 2011). DNA concentrations were measured using a NanoDrop™ 2000 Spectrophotometer (Thermo Scientific).
Protein Preparation, Quantification and Immunoblot Analysis
For the detection of DYRKP-1, soluble cell lysates were prepared as follows: 100 mL of C. reinhardtii cell cultures in the exponential phase (eq. to 5×10⁶ cells/mL or 0.8 mm3/mL) were harvested by centrifugation for 2 min at 1789 g and resuspended in 1 mL lysis buffer (20 mM HEPES-KOH pH 7.2, 10 mM KCl, 1 mM MgCl2, 154 mM NaCl, 0.1× protease inhibitor cocktail; Sigma P9599). Cells were sonicated on ice for 90 sec with a setting of 1 sec pulse/1 sec pause. Lysates were loaded onto a sucrose cushion (20 mM HEPES-KOH pH 7.2, 0.6 M sucrose) and centrifuged in a MLA-55 rotor (Beckman Coulter) for 30 min at 151 300 g and 4° C. Soluble proteins were mixed with one volume of 2× sample buffer (Schulz-Raffelt et al., 2007) or 2×LDS sample buffer (Invitrogen) and heated for 5 min at 95° C. or 10 min at 70° C. prior to loading on an 8% SDS-polyacrylamide gel. Western blotting was carried out for 1:45 h to detect the expression of DYRKP-1 by ECL (SuperSignal West Pico Chemiluminescent Substrate, Thermo Scientific), using a purified peptide antibody (Proteogenix). Protein samples taken during nitrogen starvation kinetics were treated as follows: cell pellets equivalent to 1.2 mm3 total cellular volume on average were stored at −80° C. until use. Total proteins of two replicate samples at each time point were extracted in 70 μL buffer containing 50 mM Tris pH 8, 10 mM EDTA and 2% SDS for 30 min at RT, followed by a 2-min cold centrifugation. To quantify protein concentrations, 2 μL of protein extracts were analyzed by colorimetric measurements with bicinchonic acid (Pierce BCA Protein Assay kit, Thermo Scientific). For immunoblot analysis, 10-12 μg of total protein extracts were separated on 10% SDS-polyacrylamide gels, transferred to BioTrace™ NT nitrocellulose membrane (Pall Life Sciences) and analyzed by immunodecoration with antibodies against AtpB, RbcL, CytF, PsbD (D2) (Agrisera) and HSP70B (Schroda et al., 1999). The DYRKP antibody was obtained by immunization of two rabbits with two synthesized peptides (DGMDDPGYSRKEVPNP-cys (SEQ ID NO:25) and PAVNHEDVELFRN-cys (SEQ ID NO:26)) conjugated to KLH (keyhole limpet hemocyanin) as carrier protein (Proteogenix).
Starch and Chlorophyll Measurements
The starch and chlorophyll contents were measured according to (Chochois et al., 2010). One mL of culture was harvested, centrifuged at ˜20,000 g for 10 min, resuspended in 1 mL of methyl alcohol for chlorophyll extraction and stored at −80° C. The pellets were dried, and 400 μL of water were added. To solubilize starch, the samples were autoclaved setting “dry cycle”. Subsequently, starch was degraded to glucose by adding 200 μL amyloglucosidase solution (1 U/mL, Roche) and incubation at 55° C. for 1-2 h. Using an automated sugar analyzer (Ysi model 2700 select, Yellow Springs, Ohio, USA), glucose concentration were determined. Chlorophyll was extracted by methanol, and chlorophyll a and b were determined by measuring the absorbance at 653, 666 and 750 nm using UV-VIS spectrophotometer (SAFAS UVmc2 with the software SP2000).
Oil Content Quantification
C. reinhardtii cells (eq. to 2 mm3 total cellular volume) were harvested by centrifuge at 1000 g for 2 min (at 4° C.). The cells were either frozen right away under −80° C., or quenched in hot isopropanol for immediate lipid extractions. Total cellular lipids were extracted using a mixture of hexane and isopropanol (Li-Beisson et al., 2010). Organic solvent phase containing total cellular lipids were collected and dried under a stream of nitrogen gas, then resuspended into 200 μL chloroform:methanol (2:1, v/v). Triacylglycerols (TAG) were first separated from other lipid classes on thin layer chromatograph, charred with 2% CuSO4 dissolved in 8% H3PO4 in water, then TAG content was calculated based on a densitometry method after being compared to a standard curve generated with a C17:0 TAG standard (Siaut et al., 2011).
Chlorophyll Fluorescence
Chlorophyll fluorescence was measured using a Dual Pam-100 (Heinz Walz). Samples were placed into a cuvette under constant stirring at room temperature and dark-adapted for 5-10 min before measurement. Light Curves were recorded with ten illumination steps ranging from 15 to 715 μmol m−2 s−1 PAR, each light intensity was kept for 30 s following a saturating flash to measure Fm′. ETR was calculated as described previously (Rumeau et al., 2005).
Biomass Determination
To determine biomass accumulation of a culture, at each time point three 5 mL-samples were dropped on glass fiber filter on disposable aluminum dishes (VWR, Ref. 611-0739 and -0741) and dried overnight in an oven at 80° C. Three 10 mL-samples of the medium were treated equally. The paper filters were weighed before and after adding cells and the mean value for the medium was subtracted.
Microscopy
For light microscopy, a Leica DMRXA microscope was used (Leica Microsystems, Germany). Cells were fixed with 0.25% glutaraldehyde in the medium, if necessary. To compare cell concentrations easily, a Neubauer chamber was used. Images were captured with the Spot Insight 4 software (Diagnostic Instruments Inc., Sterling Heights, USA; the SpotImaging website).
Results
Identification and Genetic Characterization of the Starch Degradation Mutant std1
From the screening of a DNA insertional library created by transformation of the C. reinhardtii wild-type strain CC125 with a paromomycin (AphVIII) resistance cassette, several mutants affected in starch degradation were previously isolated (Chochois et al., 2010). One of these mutants, called std1 for starch degradation 1, showed a slower rate of starch degradation in the dark compared to its wild-type progenitor (FIG. 1A). Southern blot analysis indicated a single integration of the paromomycin cassette into the mutant genome (FIG. 2A). Sequencing of DNA flanking regions showed insertion of the AphVIII cassette within the third exon of a gene, annotated as Dual-Specificity Tyrosine-Phosphorylated Protein Kinase DYRK2 (Chlamydomonas genome version 4.0), and renamed here DYRKP-1 (FIG. 1B). The Chlamydomonas DYRKP-1 gene model was confirmed by sequencing three overlapping cDNA fragments produced by RT-PCRs (FIG. 1B). The Chlamydomonas DYRKP-1 consists of 14 exons and 13 introns, the coding region containing 3834 nucleotides. With regard to the gene model Cre07. g337300 (Phytozomev 9.0), the start codon is located 51 nucleotides upstream. The std1 mutant was complemented using a construct holding the wild-type DYRKP-1 genomic sequence driven by the psaD promoter (FIG. 2B). Two independent complemented strains std1::STD1 1 and std1::STD1 2 were isolated, showing STD1 gene expression levels and Std1 protein amounts slightly lower to the wild-type progenitor (FIGS. 1C, 1D). Similar patterns of starch accumulation and degradation kinetics were observed in response to N or S deprivation in both complemented lines and in the wild-type progenitor (FIG. 2C). Northern blot analysis revealed that the DYRKP-1 transcript is strongly induced after 1 day of N depletion, the transcript levels remaining at a high level after 3-days of deprivation (FIG. 1E). Note that although DYRKP-1 gene expression was driven by the constitutive PSAD promoter in the complemented line, accumulation of the DYRKP-1 transcript increased in the same manner as in wild-type cells in response to N deprivation, suggesting that regulation of DYRKP-1 gene expression is regulated at a post-transcriptional level.
Chlamydomonas DYRKP-1/STD1 is a Member of a Novel Plant Specific Group of the DYRK Protein Family
A phylogenetic analysis of the DYRK gene family allowed to distinguish four distinct branches: the previously described DYRK1, DYRK2 and Yak sub-families, and a novel DYRK group, named here DYRKP (for Plant DYRK) that solely comprises members of the green lineage (plants, mosses and algae), including the Chlamydomonas DYRKP-1/STD1 (FIG. 3A). While algal genomes harbor only one member of the DYRKP group, mosses and higher plants hold two to six plant-like homologues. Interestingly, plant and algal genomes contain Yak homologues, but no DYRK1 homologue (Han et al., 2012), DYRK2 homologues being only identified in algae and mosses, but not in higher plants. DYRK kinases exhibit conserved sequence features, particularly the DYRK homology (DH)-box that precedes the conserved catalytic domain (FIG. 3B). The consensus sequence for DYRK1 and DYRK2 sub-groups is NxGYDD(D/E)(N/R)xDY, slightly different for the Yak group (FIG. 3B). The DH-box of the novel identified DYRKP group shows an altered motif: (N/H)(R/K)TGFEExK(D/E/N)(F/L).
Std1 Shows a Strong Increase in Reserve Accumulation and More Robust Photosynthetic Activity Under Nutrient Deprivation in Conditions of Photoautotrophy
The effect of nitrogen depletion was then studied in different growth conditions (mixotrophic vs. photoautotrophic) known to differentially affect the intracellular energy status and accumulation of reserve compounds such as starch (Ral et al., 2006) or TAGs (Goodson et al., 2011). In mixotrophic conditions (in the presence of both acetate and light), no difference in starch accumulation was observed between the WT and the std1 mutant in response to N deprivation (FIG. 4A), but an increase in the oil content was observed in the mutant after 1 to 3 days of starvation (FIG. 4B). In fully photoautotrophic conditions, a much higher and persistent starch accumulation was observed in std1 in comparison to the WT and to both complemented lines (FIG. 4B), the oil content increasing in the mutant after 3 days of starvation (FIG. 4B). When N deprivation was conducted in photoautotrophic conditions at a lower fluence rate (35 μmol photons m−2 s−1), WT and complemented mutant lines accumulated only low starch levels, whereas the std1 mutant accumulated high starch amounts (FIGS. 5A-D). Higher starch accumulation was also observed in std1 in response to sulfur deprivation (FIG. 5B). Photosynthetic electron transport rate (ETR), determined from chlorophyll fluorescence measurements, showed a parallel decline in std1 and control strains when N deprivation was realized in mixotrophic conditions (FIG. 4C, left panel). In contrast, when N deprivation was conducted under photoautotrophic conditions, the drop in ETR was less pronounced in std1 as compared to control strains (FIG. 4C, right panel). Taken together, these data show that, depending on the intracellular energy status, std1 accumulates more reserve compounds and maintains higher photosynthetic activity than control strains in response to nutrient deprivation. Immunodetection of major photosynthetic components showed a similar decrease of PSII, PSI, cytochrome b6f, ATPase, and Rubisco subunits in std1 compared to the wild-type progenitor (FIG. 4D). Interestingly, the mitochondrial alternative oxidase (AOX) was much more abundant in the mutant than in the WT (FIG. 4D), indicating a redox imbalance in the mutant.
Increased Biomass Production in Std1 Mutant During Autotrophic Nitrogen Deprivation
A strong increase in biomass production was observed in std1 from the size of cell pellets harvested after 3 and 10 days of culture in a N-deprived medium (FIG. 6A). Noticeably, while wild-type and complemented lines were counted as single cell particles of about 6-7 μm diameter, the std1 mutant consisted of aggregates of 2, 4 and 8 cells enclosed by the mother cell wall, and measured as particles of 10-20 μm diameter (FIG. 7). This phenotypical characteristic, previously described in several C. reinhardtii mutants, is called palmelloids (Harris, 2009). Despite cell aggregation, the total cellular volume was similar in wild-type and mutant cultures under N-replete conditions (FIG. 6B). In response to nitrogen deprivation, the total cellular volume showed only slight variations in wild-type and complemented cultures, but strongly increased in std1 (FIG. 6B). When nitrogen deprivation was conducted in mixotrophic condition (TAP-N), the std1 mutant showed a similar behavior as wild-type cells (FIG. 8). Biomass, measured as dry weight, showed a 1.7-fold increase in wild-type and complemented strains after 6 days of N depletion, and a more than 3-fold increase in std1 (FIG. 6C). In order to confirm the spectacular increase in biomass and starch production observed in std1, additional experiments were carried out in more controlled conditions using 1 L photobioreactors operated as turbidostats (FIG. 9). In these experiments, the cellular biomass was maintained at a constant level (monitored by OD880 nm) by addition of fresh culture medium, thus allowing dilution rate and biomass productivity measurements. At t0, dilution by minimal N-replete medium was replaced by minimal N-free medium, resulting in a decrease in the ammonia content of the culture medium, which was fully exhausted after 45 h (FIG. 9A). At that time, the biomass productivity of the WT started to gradually decrease and completely stopped after 72 h. In sharp contrast, biomass productivity of std1 increased (from 45 h to 65 h) and then started to gradually decrease, the biomass productivity at 72 h being still higher than the initial productivity of the WT. These experiments demonstrate that std1 produces more starch and biomass than the control strain when submitted to N-deprivation under photoautotrophic conditions.
Discussion
We report here on the characterization of the std1 mutant affected in a DYRK kinase homologue belonging to a novel subgroup (called DYRKP), specific to the green lineage. The std1 mutant, the first DYRK mutant of the green lineage reported so far, accumulates high intracellular starch and oil amounts and shows a persistent photosynthetic activity in response to nutrient starvation.
Control of Biomass and Reserve Accumulation by DYRK Kinases
As shown in the experiments performed in different trophic conditions (mixotrophic vs. photoautotrophic), the cellular energy status, in addition to the nutrient status, plays a central role in the control of starch and oil accumulation in the mutant. In mixotrophic conditions (illuminated cells growing in an acetate-containing medium), conditions in which the energy status is high, high starch levels accumulate in the WT in response to N-deprivation, but no starch increase is observed in std1. Note that in these conditions an increase in the oil content was observed in the mutant. In photoautrophic conditions however, starch accumulation in the WT depends on the intensity of illumination (low at low light intensity and higher at higher light). Strikingly, the dependence of starch accumulation upon the energy status is lost in std1, mutant cells accumulating similar starch amounts, while at different rates, in the different trophic conditions (FIG. 4A and FIG. 5A). In yeast, the DYRK homologue Yak1 has been reported to control glycogen storage, deletion of the YAK1 gene inducing an increase in the intracellular glycogen content (Wilson et al., 2010). Yak1 would control the arrest of the cell cycle in response to glucose deprivation by phosphorylating_the transcription factors Msn2 and Hsf1 (Moriya et al., 2001). More recently, Yak1 was proposed to lie at the centre of a regulatory cascade controlling growth and stress response by targeting different transcription factors (Malcher et al., 2011). As for the yeast Yak1 mutant, the increased reserve and biomass production of std1 in response to nutrient deprivation indicates that a signal required to stop growth and reserve accumulation is not correctly perceived or transferred. In yeast, Yak1 is among others transcription factors such as Sfp1 and Msn2/4, at the intersection between PKA and TOR pathways (Rohde et al., 2008). To which extent Chlamydomonas and higher plants DYRKP are involved in TOR and cAMP-PKA signalling cascades will need further investigation to be elucidated.
Loss of Feedback Regulation of Photosynthesis in Std1
In microalgae, the decline in photosynthetic activity is part of the general cellular response to nutrient deprivation which helps to maintain a balance between the generation of reducing power by photosynthesis and the ability to use it for metabolic purposes (Grossman, 2000). The sac1 mutant (defect in Sacclimation response) was reported to die upon two days of S deprivation in the light due to an inability to down-regulate photosynthesis, resulting in an over-production of reactive oxygen species (ROS) damaging PSII centers (Davies et al., 1996; Wykoff et al., 1998). In contrast, the std1 mutant shows a decrease in_photosynthetic complexes similar to that observed in control strains (FIG. 4D), but its photosynthetic activity, while decreasing, remains higher than in the control strain in photoautotropic conditions (FIG. 4C and FIG. 5B). In parallel, the std1 mutant accumulates more reserve compounds than control strains. The inventors therefore propose that the pronounced starch accumulation occurring in std1 functions as a sink for reducing power generated by photosynthesis, therefore decreasing the feedback inhibition of photosynthesis. Metabolite profiling studies have shown the existence in higher plants of a negative correlation between starch biomass production (Sulpice et al., 2009). Such a negative correlation is abolished in the std1 mutant in conditions of nutrient limitation where parallel starch and biomass productions are observed, at least in conditions of nutrient shortage.
Biotechnological Implications
The discovery of a negative regulator controlling growth and reserve accumulation in conditions of nutrient deprivation has important biotechnological implications for microalgae. Indeed, these unicellular microorganisms are increasingly considered as a promising biomass feedstock for the production of next generation biofuels. One of the major advantages of microalgae, when compared to higher plants, is their ability to accumulate high starch or lipid amounts, these compounds being convertible into bioethanol or biodiesel, respectively. However, techno-economic analyses have shown that productivity of reserve compounds need to be increased in order to reach economic feasibility.
Example 2: Additional Information on Characterization of the Std1 Mutant
Example 1 describes a massive accumulation of oil and starch after prolonged nitrogen starvation in the mutant std1. To dissect the molecular mechanism(s) between the mutated gene DYRK and the observed phenotype in carbon reserve formation, comparative transcriptomic, quantitative proteomic as well as lipidomic analyses of the mutant std1 were carried out and compared to its wild-type background strain 137AH.
Results
The Mutant Std1 Over-Accumulated Oxidized MGDG
In example 1, the inventors observed the over-accumulation of triacylglycerols (TAGs, oils) in the mutant std1 after prolonged nitrogen starvation (FIG. 4B). To gain a full picture of overall lipidomic changes in the mutant, they quantified lipid classes based on thin layer chromatograph (TLC), and compared changes in lipid molecular species using the state-of-the-art LC-MS/MS. First, each lipid class was quantified based on TLC. As shown in FIG. 10A, besides the classical polar lipids (i.e., MGDG, DGDG, DGTS, PG, PE) present in all strains, a new band was detected just below the MGDG only in the mutant std1 on the TLC plate (pointed by an arrow). The lipids present in the band were recovered via eluting with a mixture of chloroform and methanol (2:1) and subjected to identification by LC-MS/MS. Mass spectrometry analyses revealed the presence of a mixture of oxidized MGDG 34 with a combination of C16 and C18 fatty acids with different level of unsaturations. The mass spectrometry identification for one of the molecular species oxidized MGDG34:x is shown in FIG. 10B.
The relative quantity of these oxidized MGDG in the mutant cells was then further examined as compared to WT, also in a time dependent manner in response to nitrogen starvation. Mid-log phase grown cells were harvested once a day for 5 days, and total cellular lipids were extracted by the method of hexane and hot isopropanol. The total lipid extract was then subjected to lipidomic analyses by the state-of-the-art qTOF UPLC-MS/MS. Samples were subjected to both positive and negative analyses, for polar membrane lipid and for neutral lipid detection, respectively. As shown in FIG. 11, except DGTS, no significant differences were observed for all other cellular lipids between WT, the mutant std1 and two complemented strains (named here C2, and C7 respectively). Significant TAG accumulation after prolonged nitrogen starvation was observed, which confirms the previous TLC based analyses. For yet non-understood reasons, DGTS level remains constant in the mutant std1, yet increased dramatically in the WT in response to nitrogen starvation.
A basal level of oxidized MGDGs is present in cells of Chlamydonomas reinhardtii, which remained unaltered in response to nitrogen starvation in WT (FIG. 12A). Under nutrient sufficient conditions, the std1 mutant already accumulated over twice more oxidized MGDG than the wild-type cells, which significantly increased even further (up to 18 fold higher) in a time dependent manner in response to nitrogen starvation. The major oxidized MGDG species include the C16 and C18 species and the detailed structure for these oxylins are under investigation in the laboratory at the moment (FIG. 12B).
Collectively, the higher accumulation/synthesis of hydroperoxide MGDG points to potential dys-regulation of the gene(s) encoding proteins catalyzing or regulating lipid oxidation reactions. Lipid oxidation is a common metabolic reaction in all biological systems. This reaction is mainly catalyzed by proteins called lipoxygenases (LOX: EC:1.13.11.12). Lipoxygenases are a family of non-heme iron containing dioxygenases. LOXs catalyze the insertion of molecular oxygen into stereospecific position of a polyunsaturated fatty acid chain. LOXs are ubiquitously found in plants, mammals, coral, moss, fungi and also a number of bacteria and microalgae.
CreLOX1 is Upregulated at Both Transcriptomic as Well as at the Proteomic Level in the Std1 Mutant
To gain better understanding of the potential regulatory networks involving STD1 protein, a comparative transcriptomic study based on the Illumina RNA-seq sequencing technology (Genoscope) was performed. Preliminary analyses of the transcriptomic dataset revealed an over 6 log fold (Log FC) increase of the CreLOX1 transcript as compared to WT cells under photoautotrophic conditions (Table 2). Quantitative proteomic analyses based on 15N/14N labelling showed striking increase in the CreLOX1 protein (up_to 30 log FC) in the mutant than in the WT (Table 2). This large increase in CreLOX1 protein amount in the mutant cells is further supported by the observation of an increased signal (˜110 kDa) on the SDS-PAGE. This band was recovered and identified as indeed containing mainly the CreLOX1 protein (FIG. 13 and Table 3).
Products derived from these fatty acid oxidation reactions are collectively called oxylipins, which are lipophilic signaling molecules in many biological processes. Based on protein homology searches with the known Arabidopsis lipoxygenases as baits, only one putative homolog (CreLOX1) is encoded in the genome of Chlamydomonas reinhardtii (version 5). The locus encoding the putative CreLOX1 is Cre12.g512300 (phytozome version 5). The CreLOX1 protein has a theoretical molecular weight of 118 kDa, and contains two lipoxygenase domains similar to all its higher plant homologs. CreLOX1 is predicted to harbor a 65 amino acid long chloroplast transit peptide (cTP) at its N-terminus using the online ChloroP software. This is in agreement with the notion that the closet Arabidopsis homolog is the plastid localized AtLOX5.
| TABLE 2 |
| |
| CreLOX1 is unregulated in the Chlamydomonas mutant std1 at both transcript and protein level. |
| System biology | | growth | | | | | adj. |
| approach | method | condition | Comparison | gene id | Annotation | LogFC | p-value |
| |
| Transcriptomics | RNA-Seq | MM | std1 vs. | Cre12.g512300.t1.1 | lipoxygenase 1 | 6.7 | 0.000 |
| | sequencing | 2% CO2 | WT | Cre07.g337300.t1.2 | DYRKP-1 | −1.93 | 0.000 |
| | platform | | | | | | |
| | Illumina | | | | | | |
| Quantitative | (14)N/(15)N- | 24 h | std1 vs. | Cre12.g512300.t1.1 | lipoxygenase 1 | 29.6 | 0.063 |
| proteomics | labeling Mass | MM-N | WT | Cre07.g337300.t1.2 | DYRKP-1 | n.d. | |
| | spectrormetry | 2% CO2 |
| |
Two large-scale studies were performed, a transcriptomic and a proteomic approach, that reveal an upregulation of
lipoxygenase 1 in std1 mutant cells. The transcriptome dataset was obtained by RNA Sequencing using Illumina technology (Genoscope). Wild-type and std1 mutant cells were grown at standard autotrophic condition in minimum medium and 2% CO
2 in the air at 100 μE m
−2 s
−1 in triplicate precultures that were combined before harvesting. For quantitative proteomic analysis wild-type and mutant cells were grown at autotrophic conditions in 4 replicates for each strain, 2 replicates in minimum medium containing
14N and 2 replicates containing
15N ammonium salts leading to an overall metabolic labeling. Cells were centrifuged, washed, resuspended in MM-N medium and harvested after 24 h of nitrogen deprivation. Before protein extraction, cells from
14N-labeled wild-type were combined with cells from
15N-labeled std1 and vice versa giving 4 biological replicates.
Log 2 fold change (log FC) for protein results is the mean of 4 replicates and given relative to wild-type. “Adj. p-value” is the p-value adjusted for Multiple Comparisons.
| TABLE 3 |
| |
| Identification of proteins in the highlighted band in FIG. 13A by mass spectrometry. |
| |
| |
| | | | WT | | | | | |
| accession | Annotation | mass (kDa) | rk | score | coverage | #peptides | emPAI | spectral counts |
| |
| Cre06.g269050.t1.1 | NmrA-like family, | 91.26 | 1 | 4671.86 | 67.26 | 54 | 15.31 | 95 |
| | Predicted dehydrogenase | | | | | | | |
| Cre12.g512300.t1.1 | LIPOXYGENASE | 117.92 | 2 | 4172.78 | 62.19 | 53 | 8.18 | 123 |
| Cre11.g477950.t1.2 | unknown function | 94.80 | 3 | 4440.31 | 77.86 | 39 | 6.21 | 66 |
| Cre06.g288700.t1.1 | Glycolate dehydrogenase | 120.45 | 4 | 3137.98 | 50.18 | 41 | 3.87 | 64 |
| Cre01.g054500.t1.1 | NADP TRANSHYDROGENASE | 112.85 | 5 | 2873.82 | 41.22 | 37 | 4.27 | 64 |
| |
| | | | std1 | | | | | |
| accession | Define (aug10.2; 169) | mass (kDa) | rk | score | coverage | #peptides | emPAI | spectral counts |
| |
| Cre12.g512300.t1.1 | LIPOXYGENASE | 117.92 | 1 | 3659.18 | 49.04 | 48 | 7.72 | 248 |
| Cre06.g269050.t1.1 | NmrA-like family, | 91.26 | 2 | 3740.72 | 56.12 | 43 | 7.61 | 67 |
| | Predicted dehydrogenase | | | | | | | |
| Cre11.g477950.t1.2 | unknown function | 94.80 | 3 | 3733.94 | 62.53 | 34 | 3.44 | 50 |
| Cre01.g054500.t1.1 | NADP TRANSHYDROGENASE | 112.85 | 4 | 2429.72 | 43.65 | 31 | 2.13 | 37 |
| Cre06.g288700.t1.1 | Glycolate dehydrogenase | 120.45 | 5 | 2112.46 | 34.45 | 25 | 1.55 | 37 |
| |
| | | | C2 | | | | | |
| accession | Define (aug10.2; 169) | mass (kDa) | rk | score | coverage | #peptides | emPAI | spectral counts |
| |
| Cre06.g269050.t1.1 | NmrA-like family, | 91.26 | 1 | 4919.95 | 64.92 | 56 | 17.04 | 108 |
| | Predicted dehydrogenase | | | | | | | |
| Cre11.g477950.t1.2 | unknown function | 94.80 | 2 | 4349.85 | 72.75 | 38 | 7.76 | 77 |
| Cre01.g054500.t1.1 | NADP TRANSHYDROGENASE | 112.85 | 3 | 2898.18 | 42.87 | 36 | 4.88 | 86 |
| Cre06.g288700.t1.1 | Glycolate dehydrogenase | 120.45 | 4 | 2823.34 | 45.52 | 38 | 2.59 | 50 |
| Cre12.g512300.t1.1 | LIPOXYGENASE | 117.92 | 5 | 2743.81 | 47.76 | 38 | 3.31 | 57 |
| |
| | | | C7 | | | | | |
| accession | Define (aug10.2; 169) | mass (kDa) | rk | score | coverage | #peptides | emPAI | spectral counts |
| |
| Cre06.g269050.t1.1 | NmrA-like family, | 91.26 | 1 | 4052.68 | 59.24 | 46 | 9.18 | 73 |
| | Predicted dehydrogenase | | | | | | | |
| Cre11.g477950.t1.2 | unknown function | 94.80 | 2 | 3862.11 | 69.64 | 36 | 4.39 | 58 |
| Cre01.g005050.t1.1 | SELECTIN LIGAND RELATED, | 99.56 | 3 | 3007.98 | 45.86 | 43 | 3.98 | 53 |
| | golgi apparatus protein 1 | | | | | | | |
| Cre12.g512300.t1.1 | LIPOXYGENASE | 117.92 | 4 | 2399.25 | 40.09 | 33 | 2.07 | 44 |
| Cre12.g517900.t1.1 | Chloroplast-associated | 114.00 | 5 | 2029.16 | 32.72 | 29 | 1.25 | 30 |
| | SecA protein |
| |
The first 5 identified proteins are listed according to their rank (rk) for each strain. The score and coverage of the proteins and the number of identified peptides, which also correspond to specific peptides, are displayed. The values “emPAI” indicating the “exponentially modified Protein Abundance Index” and the number of total (specific) spectra observed (“spectral counts”; relevant and duplicated) may serve to give an estimation of the relative abundance of a protein in one sample.
LOX Inhibitors Prohibited Carbon Reserve (Lipid and Starch) Formation
Based on current results, the inventors hypothesized that the kinase STD1 act as a negative regulator of LOX1 protein. Indeed, products of lipoxygenase, oxylipins, are precursors to a large array of signaling molecules playing roles in many developmental as well as stress response signaling networks. To test this hypothesis, catechol (Sigma Cat#452637) was used. Catechol is a known lipoxygenase inhibitors, which inhibits the activity of lipoxygenase by quenching the cellular reactive oxygen species. Two different catechol concentrations (5 mM and 10 mM) were initially tested. With the presence of 5 mM catechol, both TAG and starch accumulation were inhibited in the std1 mutant after 6-day under nitrogen starvation (FIG. 14). Catechol also inhibited TAG accumulation in response to nitrogen starvation in WT strains, however no effect on starch accumulation was observed. Other conditions are tested.
From the above, it appears that inactivation of STD1 in std1 mutant provokes a LOX1 up-regulation, thus leading to the formation of a family of oxylipins that are involved in starch and TAG accumulations, inhibition of LOX activity by catechol preventing starch and TAG accumulation.
REFERENCES
- Ball, S. G., Dirick, L., Decq, A., Martiat, J. C., Matagne, R. F., 1990. Physiology of starch storage in the monocellular alga Chlamydomonas reinhardtii. Plant Sci. 66, 1-9.
- Becker, W., Joost, H. G., 1999. Structural and functional characteristics of Dyrk, a novel subfamily of protein kinases with dual specificity. Prog. Nucl. Acid. Res. Mol. Biol. 62, 1-17.
- Berthold, P., Schmitt, R., Mages, W., 2002. An engineered Streptomyces hygroscopicus aph 7″ gene mediates dominant resistance against hygromycin B in Chlamydomonas reinhardtii. Protist. 153, 401-412.
- Chochois, V., Constans, L., Dauvillée, D., Beyly, A., Solivérès, M., Ball, S., Peltier, G., Cournac, L., 2010. Relationships between PSII-independent hydrogen bioproduction and starch metabolism as evidenced from isolation of starch catabolism mutants in the green alga Chlamydomonas reinhardtii. Int. J. Hydrogen Energ. 35, 10731-10740.
- Dauvillee, D., Stampacchia, O., Girard-Bascou, J., Rochaix, J. D., 2003. Tab2 is a novel conserved RNA binding protein required for translation of the chloroplast psaB mRNA. EMBO J. 22, 6378-6388.
- Davies, J. P., Yildiz, F. H., Grossman, A., 1996. Sac1, a putative regulator that is critical for survival of Chlamydomonas reinhardtii during sulfur deprivation. EMBO J. 15, 2150-2159.
- Delrue, F., Li-Beisson, Y., Setier, P. A., Sahut, C., Roubaud, A., Froment, A. K., Peltier, G., 2013. Comparison of various microalgae liquid biofuel production pathways based on energetic, economic and environmental criteria. Bioresource Technol. 136, 205-212.
- Goodson, C., Roth, R., Wang, Z. T., Goodenough, U., 2011. Structural correlates of cytoplasmic and chloroplast lipid body synthesis in Chlamydomonas reinhardtii and stimulation of lipid body production with acetate boost. Eukaryot. Cell. 10, 1592-1606.
- Gouy, M., Guindon, S., Gascuel, O., 2010. SeaView version 4: A multiplatform graphical user interface for sequence alignment and phylogenetic tree building. Mol. Biol. Evol. 27, 221-224.
- Grossman, A., 2000. Acclimation of Chlamydomonas reinhardtii to its nutrient environment. Protist. 151, 201-224.
- Han, J. F., Miranda-Saavedra, D., Luebbering, N., Singh, A., Sibbet, G., Ferguson, M. A. J., Cleghon, V., 2012. Deep evolutionary conservation of an intramolecular protein kinase activation mechanism. Plos One. 7.
- Harris, E. H., 2009. The Chlamydomonas sourcebook. Second edition. Academic Press.
- Hu, Q., Sommerfeld, M., Jarvis, E., Ghirardi, M., Posewitz, M., Seibert, M., Darzins, A., 2008. Microalgal triacylglycerols as feedstocks for biofuel production: perspectives and advances. Plant J. 54, 621-639.
- Katoh, K., Misawa, K., Kuma, K., Miyata, T., 2002. MAFFT: a novel method for rapid multiple sequence alignment based on fast Fourier transform. Nucleic Acids Res. 30, 3059-3066.
- Kindle, K. L., 1990. High-frequency nuclear transformation of Chlamydomonas reinhardtii. Proc. Natl. Acad. Sci. USA. 87, 1228-1232.
- Larkum, A. W. D., Ross, I. L., Kruse, O., Hankamer, B., 2012. Selection, breeding and engineering of microalgae for bioenergy and biofuel production. TiBiotech. 30, 198-205.
- Li-Beisson, Y., Shorrosh, B., Beisson, F., Andersson, M. X., Arondel, V., Bates, P. D., Baud, S., Bird, D., Debono, A., Durrett, T. P., Franke, R. B., Graham, I. A., Katayama, K., Kelly, A. A., Larson, T., Markham, J. E., Miguel, M., Molina, I., Nishida, I., Rowland, O., Samuels, L., Schmid, K. M., Wada, H., Welti, R., Xu, C., Zallot, R., Ohlrogge, J., 2010. Acyl-lipid metabolism. Arabidopsis Book. 8:e0133. doi: 10.1199/tab.0133. Epub 2010 Jun. 11.
- Liu, C. M., Willmund, F., Whitelegge, J. P., Hawat, S., Knapp, B., Lodha, M., Schroda, M., 2005. J-domain protein CDJ2 and HSP70B are a plastidic chaperone pair that interacts with vesicle-inducing protein in plastids 1. Mol. Biol. Cell. 16, 1165-1177.
- Matcher, M., Schladebeck, S., Mosch, H. U., 2011. The Yak1 protein kinase lies at the center of a regulatory cascade affecting adhesive growth and stress resistance in Saccharomyces cerevisiae. Genetics. 187, 717-730.
- Merchant, S. S., Kropat, J., Liu, B. S., Shaw, J., Warakanont, J., 2012. TAG, You're it! Chlamydomonas as a reference organism for understanding algal triacylglycerol accumulation. Curr. Op. Biotechnol. 23, 352-363.
- Moriya, H., Shimizu-Yoshida, Y., Omori, A., Iwashita, S., Katoh, M., Sakai, A., 2001. Yak1p, a DYRK family kinase, translocates to the nucleus and phosphorylates yeast Pop2p in response to a glucose signal. Genes & Dev. 15, 1217-1228.
- Peltier, G., Schmidt, G. W., 1991. Chlororespiration—an adaptation to nitrogen deficiency in Chlamydomonas reinhardtii. Proc. Natl. Acad. Sci. USA. 88, 4791-4795.
- Ral, J. P., Colleoni, C., Wattebled, F., Dauvillee, D., Nempont, C., Deschamps, P., Li, Z. Y., Morell, M. K., Chibbar, R., Purton, S., d'Hulst, C., Ball, S. G., 2006. Circadian clock regulation of starch metabolism establishes GBSSI as a major contributor to amylopectin synthesis in Chlamydomonas reinhardtii. Plant Physiol. 142, 305-317.
- Rohde, J. R., Bastidas, R., Puria, R., Cardenas, M. E., 2008. Nutritional control via Tor signaling in Saccharomyces cerevisiae. Curr. Opin. Microbiol. 11, 153-160.
- Rumeau, D., Becuwe-Linka, N., Beyly, A., Louwagie, M., Garin, J., Peltier, G., 2005. New subunits NDH-M, -N, and -O, encoded by nuclear genes, are essential for plastid Ndh complex functioning in higher plants. Plant Cell. 17, 219-232.
- Schroda, M., Vallon, O., Wollman, F. A., Beck, C. F., 1999. A chloroplast-targeted heat shock protein 70 (HSP70) contributes to the photoprotection and repair of photosystem II during and after photoinhibition. Plant Cell. 11, 1165-1178.
- Schulz-Raffelt, M., Lodha, M., Schroda, M., 2007. Heat shock factor 1 is a key regulator of the stress response in Chlamydomonas. Plant J. 52, 286-295.
- Siaut, M., Cuine, S., Cagnon, C., Fessler, B., Nguyen, M., Carrier, P., Beyly, A., Beisson, F., Triantaphylides, C., Li-Beisson, Y. H., Peltier, G., 2011. Oil accumulation in the model green alga Chlamydomonas reinhardtii: characterization, variability between common laboratory strains and relationship with starch reserves. BMC Biotechnol. 11.
- Sulpice, R., Pyl, E. T., Ishihara, H., Trenkamp, S., Steinfath, M., Witucka-Wall, H., Gibon, Y., Usadel, B., Poree, F., Piques, M. C., Von Korff, M., Steinhauser, M. C., Keurentjes, J. J. B., Guenther, M., Hoehne, M., Selbig, J., Fernie, A. R., Altmann, T., Stitt, M., 2009. Starch as a major integrator in the regulation of plant growth. Proc. Natl. Acad. Sci. USA. 106, 10348-10353.
- Tamura, K., Peterson, D., Peterson, N., Stecher, G., Nei, M., Kumar, S., 2011. MEGA5: Molecular evolutionary genetics analysis using maximum likelihood, evolutionary distance, and maximum parsimony methods. Mol. Biol. Evol. 28, 2731-2739.
- Tolleter, D., Ghysels, B., Alric, J., Petroutsos, D., Tolstygina, I., Krawietz, D., Happe, T., Auroy, P., Adriano, J. M., Beyly, A., Cuine, S., Plet, J., Reiter, I. M., Genty, B., Cournac, L., Hippler, M., Peltier, G., 2011. Control of hydrogen photoproduction by the proton gradient generated by cyclic electron flow in Chlamydomonas reinhardtii. Plant Cell. 23, 2619-2630.
- Wijffels, R. H., Barbosa, M. J., 2010. An outlook on microalgal biofuels. Science. 329, 796-799.
- Wilson, W. A., Roach, P. J., Montero, M., Baroja-Fernandez, E., Munoz, F. J., Eydallin, G., Viale, A. M., Pozueta-Romero, J., 2010. Regulation of glycogen metabolism in yeast and bacteria. FEMS Microbiol. Rev. 34, 952-985.
- Wykoff, D. D., Davies, J. P., Melis, A., Grossman, A. R., 1998. The regulation of photosynthetic electron transport during nutrient deprivation in Chlamydomonas reinhardtii. Plant Physiol. 117, 129-139.