US10436895B2 - Phase confocal method for near-field microwave imaging - Google Patents
Phase confocal method for near-field microwave imaging Download PDFInfo
- Publication number
- US10436895B2 US10436895B2 US15/342,368 US201615342368A US10436895B2 US 10436895 B2 US10436895 B2 US 10436895B2 US 201615342368 A US201615342368 A US 201615342368A US 10436895 B2 US10436895 B2 US 10436895B2
- Authority
- US
- United States
- Prior art keywords
- phase
- transmitter
- receiver
- image
- signals
- Prior art date
- Legal status (The legal status is an assumption and is not a legal conclusion. Google has not performed a legal analysis and makes no representation as to the accuracy of the status listed.)
- Active, expires
Links
Images


Classifications
-
- G—PHYSICS
- G01—MEASURING; TESTING
- G01S—RADIO DIRECTION-FINDING; RADIO NAVIGATION; DETERMINING DISTANCE OR VELOCITY BY USE OF RADIO WAVES; LOCATING OR PRESENCE-DETECTING BY USE OF THE REFLECTION OR RERADIATION OF RADIO WAVES; ANALOGOUS ARRANGEMENTS USING OTHER WAVES
- G01S13/00—Systems using the reflection or reradiation of radio waves, e.g. radar systems; Analogous systems using reflection or reradiation of waves whose nature or wavelength is irrelevant or unspecified
- G01S13/88—Radar or analogous systems specially adapted for specific applications
- G01S13/89—Radar or analogous systems specially adapted for specific applications for mapping or imaging
-
- G—PHYSICS
- G01—MEASURING; TESTING
- G01N—INVESTIGATING OR ANALYSING MATERIALS BY DETERMINING THEIR CHEMICAL OR PHYSICAL PROPERTIES
- G01N22/00—Investigating or analysing materials by the use of microwaves or radio waves, i.e. electromagnetic waves with a wavelength of one millimetre or more
-
- G—PHYSICS
- G01—MEASURING; TESTING
- G01S—RADIO DIRECTION-FINDING; RADIO NAVIGATION; DETERMINING DISTANCE OR VELOCITY BY USE OF RADIO WAVES; LOCATING OR PRESENCE-DETECTING BY USE OF THE REFLECTION OR RERADIATION OF RADIO WAVES; ANALOGOUS ARRANGEMENTS USING OTHER WAVES
- G01S13/00—Systems using the reflection or reradiation of radio waves, e.g. radar systems; Analogous systems using reflection or reradiation of waves whose nature or wavelength is irrelevant or unspecified
- G01S13/88—Radar or analogous systems specially adapted for specific applications
- G01S13/887—Radar or analogous systems specially adapted for specific applications for detection of concealed objects, e.g. contraband or weapons
-
- G—PHYSICS
- G01—MEASURING; TESTING
- G01S—RADIO DIRECTION-FINDING; RADIO NAVIGATION; DETERMINING DISTANCE OR VELOCITY BY USE OF RADIO WAVES; LOCATING OR PRESENCE-DETECTING BY USE OF THE REFLECTION OR RERADIATION OF RADIO WAVES; ANALOGOUS ARRANGEMENTS USING OTHER WAVES
- G01S17/00—Systems using the reflection or reradiation of electromagnetic waves other than radio waves, e.g. lidar systems
- G01S17/88—Lidar systems specially adapted for specific applications
- G01S17/89—Lidar systems specially adapted for specific applications for mapping or imaging
-
- A—HUMAN NECESSITIES
- A61—MEDICAL OR VETERINARY SCIENCE; HYGIENE
- A61B—DIAGNOSIS; SURGERY; IDENTIFICATION
- A61B2562/00—Details of sensors; Constructional details of sensor housings or probes; Accessories for sensors
- A61B2562/02—Details of sensors specially adapted for in-vivo measurements
- A61B2562/0228—Microwave sensors
-
- A—HUMAN NECESSITIES
- A61—MEDICAL OR VETERINARY SCIENCE; HYGIENE
- A61B—DIAGNOSIS; SURGERY; IDENTIFICATION
- A61B5/00—Measuring for diagnostic purposes; Identification of persons
- A61B5/05—Detecting, measuring or recording for diagnosis by means of electric currents or magnetic fields; Measuring using microwaves or radio waves
- A61B5/0507—Detecting, measuring or recording for diagnosis by means of electric currents or magnetic fields; Measuring using microwaves or radio waves using microwaves or terahertz waves
-
- G—PHYSICS
- G01—MEASURING; TESTING
- G01S—RADIO DIRECTION-FINDING; RADIO NAVIGATION; DETERMINING DISTANCE OR VELOCITY BY USE OF RADIO WAVES; LOCATING OR PRESENCE-DETECTING BY USE OF THE REFLECTION OR RERADIATION OF RADIO WAVES; ANALOGOUS ARRANGEMENTS USING OTHER WAVES
- G01S15/00—Systems using the reflection or reradiation of acoustic waves, e.g. sonar systems
- G01S15/88—Sonar systems specially adapted for specific applications
- G01S15/89—Sonar systems specially adapted for specific applications for mapping or imaging
Definitions
- the present disclosure pertains generally to near-field microwave imaging.
- near-field microwave imaging attempts to detect the profile of an object less than one wavelength to several wavelengths away from the antennas by measuring an electromagnetic scattered field.
- many antennas are placed near the object and antennas take turns transmitting a waveform that illuminates the object, while the other antennas serve as receivers.
- the detection can use a small number of movable antennas to observe the object in multiple locations.
- an algorithm is applied to process the collected data to form an image displaying the object's profile.
- Typical applications are buried-object detection, nondestructive surveys, and biomedical examinations.
- Microwave tomography involves reconstructing an image in terms of a quantitative description of any objects present such as a dielectric constant or conductivity, impedance, or local velocity. This approach usually is ill posed and is performed by iteratively comparing measurement data with numerical simulation data, which can be a slow and time consuming process.
- RADAR-based imaging methods reconstruct an image in terms of a qualitative description of any objects present and instead aim to find the profile of an object. More specifically, the purpose of a RADAR-based method is to distinguish the object's size, shape, and location instead of showing a distribution of a physical parameter in the entire area.
- FIG. 3A , FIG. 3B , and FIG. 6 can help describe how a conventional RADAR based method works, in which the time arrival information and amplitude of scattered signals are utilized to identify the presence and location of a significant scatter.
- the conventional algorithm involves calculating the flight time of the signal travelling in space or a medium then back-propagating the signal to the transmitters' position with corresponding time-delay compensation.
- a time domain UWB (ultra-wide band) signal is often used to illuminate an object and the scattered signal is measured from numerous places (in this case from three different places).
- the Euclidean distance from each receiver to the source through a focal point is estimated and each signal is compensated for its time delay or shift.
- a flight time from positions in the interested area to antennas (or probes in simulation) is individually calculated.
- the shifted signals are less correlated and will result in less amplitude when they are summed, as shown in FIG. 3A .
- the shifted signals are highly correlated in time and result in greater amplitude when summed, as shown in FIG. 3B .
- a qualitative image of the object under investigation is obtained. This kind of approach is expected to achieve a high-resolution imaging effect since it uses a UWB signal containing many frequency components.
- the present inventive concepts titled phase confocal method (PCM), belong to a RADAR-based imaging approach. Unlike previous RADAR-based approaches which operate in the time domain, the present method processes signals in the frequency domain. While the conventional RADAR-based approaches calculate the time delay of a signal in the time-space domain, the present inventive concepts calculate a phase delay (or a phase shift) in the frequency-space domain.
- a dispersive medium in which the wave propagation speed varies with frequency. For example, in biomedical microwave detection, human-body tissue is dispersive at microwave frequencies and in ground-penetration detection, soil is a dispersive medium.
- phase delay instead of time delay is calculated and utilized to shift the phase of the acquired signal at each frequency. By treating each frequency individually an accurate delay (or shift) is found and utilized. Therefore, the present method is able to fully take advantage of the UWB spectrum.
- the present inventive concepts allow using the phase information alone, or alternatively a combination with amplitude information to reconstruct an image.
- all the phase signals are assumed as unit vectors whose magnitude is unity.
- the phase delay of all signals are correctly compensated (shifted), in the locations an object is present, the shifted phase signals will have a very small difference. In those positions where no object is present, there will be large differences between these shifted phase signals.
- two methods are proposed to calculate the pixel values to form an image. In the first, when both phase information and amplitude information are used, the phase-shifted signals are summed following the principle of vector addition. In the second method, the 2-D distance from the unit vectors to their average value is implemented to compute the pixel value of an image.
- the data processing is in the frequency domain and the signals are treated as complex numbers, which is different from a conventional algorithm that processes real numbered data in the time domain.
- PCM can reconstruct an image using a single frequency signal and also multiple frequency signals.
- PCM also has the advantage of being able to accurately estimate the contribution of multiple frequency components.
- the present method processes data in the frequency domain, experiments can be performed in the time domain and converted to the frequency domain by a Fourier transform.
- FIG. 1 shows the time-domain embodiment of the microwave near-field imaging system
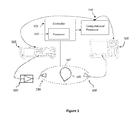
- FIG. 2 shows the frequency-domain embodiment of the microwave near-field imaging system
- FIG. 3A shows signals less correlated in time result in a lower amplitude when they are summed
- FIG. 3B shows signals highly correlated in time reinforce each other when they are summed
- FIG. 4 is a flow chart showing exemplary steps for the present imaging method.
- FIG. 5 shows a 2-port network to simplify a transmission-reception system.
- FIG. 6 shows the interested area to be imaged which is composed of many focal points.
- FIG. 7 shows the phase shift of the signal as it propagates for some particular distances in different channels from the same start position.
- FIG. 7A shows a phase compensation step where the wave back-propagated from the reception end to the transmission end through an object's location such that after compensation phases are coherent.
- FIG. 7B shows a phase compensation step where the wave back-propagated from the reception end to the transmission end through a focal point where no object is present such that after compensation phases are incoherent.
- FIG. 8A shows the sum of two vectors having a big phase difference results in a small magnitude vector.
- FIG. 8B shows the sum of two vectors having a small phase difference results in a big magnitude vector.
- FIG. 9 shows the distances from two vectors to their mean position.
- FIG. 10 shows a signal with different frequencies travels with different speeds in a dispersive medium, and will take different paths as the different frequencies propagate from the sensor to the object.
- FIG. 11 shows a reconstructed image using lab measured data with the present microwave imaging method.
- the measurement process can be carried out either in the time domain or in the frequency domain.
- a system as illustrated in FIG. 1 is typically used for electromagnetic signal collection.
- the transmitter 104 and the receiver 105 are usually UWB antennas which can individually move along a rail system 107 to send/receive a signal in many positions.
- a time-domain signal that has a wide-band characteristic is produced by a waveform generator 101 .
- the electromagnetic energy radiated by the transmitter antenna 104 is large enough for detection.
- the scattered signal of the object 106 is received by at least one receiver antenna 105 and then recorded on an oscilloscope 102 .
- the object 106 may be in air, in a coupling medium, or within another object. By moving the transmitter 104 and the receiver 105 on the rail system 107 , the object 106 is fully observed.
- a controller 108 is configured to move and rotate the transmitter 104 and the receiver 105 on the rail system 107 .
- the controller 108 contains a processor 109 programmed with computer software to allow it to perform its control functions.
- An image showing the location and profile of object 106 can be achieved by processing the received data by means of a computational processor 110 .
- the computational processor 110 has one or more processors and a memory programmed with computer software that performs the functions described herein. Alternatively, hardware may be used instead of or in addition to software.
- the computational processor 110 can further communicate with the waveform generator 101 and oscilloscope 102 .
- a system as illustrated in FIG. 2 is typically used for electromagnetic signal collection.
- a vector network analyzer (VNA) 201 is typically implemented to send and receive signals. By clarifying the start frequency, end frequency, and a number of frequencies, the VNA uses a “frequency sweeping” mode to continually send out time domain sinusoid waves at assigned discrete frequencies in turn until waves at all frequencies are received.
- a controller 108 is configured to move and rotate the transmitter 104 and the receiver 105 on the rail system 107 .
- the transmitter antenna 104 and receiver antenna 105 can be narrow band antennas for a single frequency or a narrow band survey or wide band antennas to catch discrete frequencies over a wide band.
- the controller 108 contains a processor 109 to allow it to perform its control functions.
- An image showing the location and profile of object 106 can be achieved by processing the received data by means of a computational processor 110 .
- the computational processor 110 can further communicate with the vector network analyzer 201 .
- the antenna arrangement in FIG. 1 and FIG. 2 is able to achieve the same goal as using many antennas in fixed positions but has the advantage that moving the antennas allows for more possible positions to be covered.
- An advantage of using a single transmitter and receiver is that unwanted couplings between antennas when antennas are close can be prevented.
- An advantage of a time domain measurement over a frequency domain measurement is that a reconstruction algorithm based on time domain data employs the scattered field of the object over an entire wideband rather than a few selected discrete frequencies. As such, high resolution is better able to be achieved in the reconstructions.
- a downside of a time domain measurement over a frequency domain measurement is that time domain signals are often distorted in shape as they propagate in a dispersive and/or lossy medium. This may degrade the image quality in the reconstruction.
- An advantage of a frequency domain measurement is that the signal-to-noise ratio is usually better than that in the time domain.
- the present inventive concepts can use data recorded from a VNA directly.
- the recorded signals on the VNA are usually in the form of S parameters (S 21 ).
- the present method is able to adopt the S 21 signal directly without a conversion to electrical-field data. In conventional microwave imaging techniques, this kind of conversion is usually challenging because it contains both simulation and experimental steps, and then new noise from this additional experiment will be brought into subsequent signal processing.
- the reason that the present method can use the phase of S 21 parameter is because it is equal to that of the electrical field. Meanwhile, the magnitude of S 21 can be directly substituted into the present method, without a need to know the ratio to the magnitude of electric field (in conventional imaging approaches the S parameters must be converted to electric field).
- the transmitted waves and received waves are converted to the frequency domain and a division calculation is carried out in the VNA to obtain the transmission coefficients (S 21 and S 12 ), which is often applied in the analysis of a two-port network.
- the transmission coefficient or S parameters can be viewed as the signal of a frequency domain response system and be used in the image reconstruction process.
- the S parameters are complex numbers and have magnitude and phase.
- the phase of S 21 represents the phase difference between the output signal and the input signal.
- S parameters are measured by a vector network analyzer their phase is shown from 0 to 360°. This does not mean the phase change in the system must be less than 360°. For example, if the distance a wave traveled from a transmitter to a receiver is 1.5 wavelengths the phase actually changes 1.5*2 ⁇ (540°) during the propagation. On the reception side, the phase of S 21 observed is 180°.
- FIG. 4 shows a flow chart of exemplary procedures for the present imaging method.
- the first step 401 is to perform any calibration necessary prior to data collection.
- the second step 402 is to collect the electromagnetic signal using the system of FIG. 1 or 2 .
- the first step is to measure the incident field, in which no object presents in the middle of the antenna ring 107 .
- the second step is to measure the total field—as the object presents in the middle area of the antenna ring 107 —with the same antenna arrangement.
- the transmitter stops at the same M locations.
- At each stop at least one receiver is utilized to collect signals at the same N locations.
- the time-domain data obtained from a time domain measurement can be converted to frequency-domain data by a Fourier transform. Regardless of whether the measurement is carried out in the time domain or frequency domain, the acquired incident field signal and total field signal contains the effect of antennas (time delay or phase delays when the signal goes through the antennas) which has to be calibrated out before data can be used for imaging.
- FIG. 5 shows a simplified two-port system 500 to represent a measurement system.
- RADAR based methods there is a need to obtain the time shifts or phase shifts (in present method) of the signal between the antenna ends 503 and 504 when the antennas are in any pre-selected places.
- the effects due to the cables connected to antennas are taken to already be calibrated out by a standard VNA calibration for a frequency-domain measurement or by a simple estimation of the time delay in the cable for a time-domain measurement.
- FIG. 5 herein focuses on the calibration of the antennas' effect only.
- the input of 500 is the signal delivered to the port of a transmitter antenna 104 and the output is the signal obtained at the port of the receiver antenna 105 .
- Two antennas are face-to-face placed for a known distance d.
- the wave flight time between two antennas is calculated as
- the time delay in one antenna (from the antenna's port 501 to the antenna's end 503 , or 504 to 502 ) can be calculated as
- T denotes the time shift between the measured output signal and input signal
- ⁇ denotes the phase difference between the output signal and input signal
- Step 403 involves obtaining scattered signals by a subtraction process.
- the path that a signal travels from one of the M locations to one of the N reception locations is called a channel.
- the scattered field of the object is obtained and saved in an M ⁇ N matrix, representing the measured results for corresponding transmission locations and reception locations.
- step 404 the electrical distances from receivers to focal points and then to transmitters is calculated.
- This distance can in some cases include the physical distance from receivers to focal points and then from the focal points to transmitters which can be calculated by using the Euclidean distance formula and knowing the Cartesian coordinates.
- the electrical distance calculation can be elaborated with the help of FIG. 6 .
- FIG. 6 the interested area to be imaged is meshed into many grids. Each grid is imagined as a focal point (each dot). For each focal point, it is imagined that the wave propagates from a transmitter 104 to the current focal point, and scatters at each position and then the scattered wave is acquired by a receiver 105 . To clarify, physical scanning of each different focal point is not performed.
- the algorithm described above is used to computationally focus on each position (focal point), using the signals from a single set of measurements. This process is regarded as a beamforming method. The distance the wave propagates in this path is computed. The distance calculation is repeated for all focal points in the entire area, including those the object 106 possesses or does not possess (this is actually unknown before an image is obtained). Note that when the object is enclosed in a medium other than air, refraction which occurs on the air-medium interface must be taken into account. Therefore, the traveled distance d is a combination of electrical distances in different media and has taken refractions into account.
- step 405 the phase change of the wave as it propagates is calculated by using the equation
- FIG. 7 , FIG. 7A , and FIG. 7B illustrates the detail of step 405 .
- FIG. 7 shows the phase of a wave shifts clockwise when the wave has a zero initial phase at a transmitter, which propagates in three different paths, by a different distance, and arrives at three different receivers. The magnitude attenuates with the distance it traveled. It is necessary to compensate the phase of the obtained signals at the receivers by
- ⁇ mn is the phase delay in air, that is, the phase delay to the focal point based on distance.
- step 406 a decision is made if there is single frequency or multiple frequency data that has been collected. If single frequency data is collected then the signals are synthesized in step 407 . If multiple frequency data is collected, then a check is made to determine if this is the last frequency applied in step 409 . The last frequency is the highest frequency present in a set of multiple frequencies. If the last frequency is not yet reached, then in step 410 the current data is saved and the next frequency is selected. Then step 404 is started with the next frequency. If the last frequency is applied, then the signals at all frequencies are synthesized in step 411 .
- a total of M ⁇ N signals (M ⁇ N complex numbers) will be synthesized to calculate the pixel value at each focal point, and an image showing the entire distribution can be produced.
- the compensated phase values LP′ are expected to be identical in all channels, if the same detection signal was used by the transmitters.
- two separate methods are developed to synthesize signals. In both methods, the complex-number signals are treated as vectors.
- the first method to synthesize signals is vector addition.
- FIG. 8A and FIG. 8B (which show two signals as a simplification), two vectors are shown in dashed line arrows as two obtained signals after the phase compensation step.
- FIG. 8A shows an occasion where two signals 802 and 803 have a large difference in phase after the phase compensation step. Their sum, shown in a solid line vector 801 having a short length, is of a small magnitude, which indicates the object is less likely residing in the current focal point.
- FIG. 8B illustrates an occasion where two signals 805 and 806 have a relatively small difference in phase, which results in a large magnitude in the summation vector 804 , indicating the object is more likely to be residing in the current focal point.
- Signals 805 and 806 are signals from different channels (different receivers) looking at the same focal point. The magnitude of the result will be converted linearly to a pixel value in the final image (Step 408 or 412 ). It is optional to compensate the magnitude of signals due to spread out and loss in the medium before the sum.
- the second method to synthesize the M ⁇ N signals is relatively complex, but is more likely to achieve a better performance.
- the magnitude of the complex-number signals is completely ignored such that all of the signals are thought of as unit vectors only.
- the average of the squared distance from all unit vectors to their mean position is computed.
- FIG. 9 shows a case where two signals 901 and 902 are involved in the calculation.
- a round dot 903 represents the mean position (or middle point) of the two signals.
- the average of the squared distance from the two unit vectors to their mean position is calculated as 1 ⁇ 2(d 1 2 +d 2 2 ), where d 1 and d 2 are the distances from the unit vector 901 and 902 to their mean position respectively.
- the equation used is
- d m,n is the average of the squared distance from all unit vectors to their mean position for each of the M ⁇ N signals.
- the PCM uses the phase of S (when measuring with a VNA) which actually represents the phase change from the port of transmitter 104 to the port of receiver 105 , if the VNA is calibrated correctly in advance. More specifically, the phase change consists of five parts: phase change in the connector on the transmitter end ( ⁇ TC ), phase change in the transmitter antenna ( ⁇ T ), phase change of propagation in space ( ⁇ space ), phase change in the receiver antenna ( ⁇ R ), and phase change in the connector on the receiver end ( ⁇ RC ).
- ⁇ TC , ⁇ T , ⁇ RC , ⁇ R are fixed in all channels, there is only a need to compensate the phase change in space, i.e., ⁇ space . There is no need to know the other four terms, nor are they used in the single-frequency PCM.
- phase delay for each frequency component will take turns being calculated and compensated.
- the phase delay in the connectors and antennas ⁇ TC + ⁇ T , ⁇ RC + ⁇ R ) varies with frequency, so these four terms have to be taken into account in the phase compensation when applying multiple-frequency PCM.
- ⁇ containing five parts will all be applied in the phase compensation step in multiple-frequency PCM instead of only using ⁇ space as in single-frequency PCM.
- the value of ⁇ TC + ⁇ T and ⁇ RC + ⁇ R can be found by a simple test on the VNA in advance of the data collection.
- FIG. 10 shows the propagation of three frequency components, where f 1 >f 2 >f 3 , from a source present in air or a light dense medium to an object present in a heavy dense medium. As the refraction points on the interface are different, the three frequency components must take different paths to arrive at the object.
- the quality of the image using conventional time-domain UWB imaging methods depends on the time delay of the UWB signal being correctly calculated.
- the UWB signal containing many frequency components is assumed to travel together taking one path and propagating at one speed.
- the conventional method neglects the speed difference and path difference so the time delay is not accurately calculated. Therefore, the ultra-wideband characteristic of the UWB signal is not fully utilized, which causes degradation in image quality.
- a UWB signal is applied in the conventional method to achieve high-resolution, but the manner in which the conventional method processes the UWB signal is more like processing a single-frequency signal.
- the present method works in the frequency domain. It analyzes the refraction and propagation path for each frequency component individually and uses the associated speed to compute the phase delay. Therefore, the phase delay under each frequency in the spectrum can be accurately computed.
- PCM takes full advantage of the ultra-wideband characteristic of the UWB signal.
- Step 411 The approach that synthesizes the signals from all channels and all frequencies (Step 411 ) is similar to the single frequency case. The only difference is that it will have L ⁇ M ⁇ N signals to process, where L is the number of frequencies applied.
- the measurement is made in the frequency domain, it is assumed all frequency components have the same initial phase.
- the phases from all channels and all frequencies are expected to be correlated after the phase compensation step when the focal point falls in the object's location.
- the initial phases of frequency components in a UWB signal are usually unequal.
- an additional step that subtracts the initial phases of the frequency components in the UWB signal from the compensated phases must be taken into account in the multiple-frequency method.
- an image is constructed using the synthesized data in steps 408 or 412 respectively.
- the vector addition method linearly converts the output to a pixel value to form an image.
- the image is constructed using the previously presented equation for P( ⁇ right arrow over (r) ⁇ ) in the variance method.
- FIG. 11 presents a reconstructed image in the horizontal plane by the invented method with a single frequency of 4 GHz.
- the targeted object was a long square lumber (wood) vertically placed in the middle area of the rail system 107 .
- the object is distinguished out from the background which is contained in a blue color and corresponds to a value of 0.
- FIG. 11 indicates that the present method successfully localizes the position of the object where it was placed in the experiment and shows its basic dimension in the horizontal cross plane.
- Microwave data required to reconstruct FIG. 11 were acquired from a fully automated microwave detection system that can be operated remotely. Such a system is described in, for example, U.S. application Ser. No. 15/094,368 entitled “Microwave Imaging Device,” filed Apr.
- the inventive algorithm does not require this kind of compensation.
- PCM Delay and Sum
- Another advantage of the present method is its efficiency.
- the total processing time, including phase estimation and compensation, multiple channels and multiple frequencies synthesis, and an image buildup only takes a couple of seconds on a regular personal computer. This efficiency is better than existing microwave imaging approaches. If speedup in data collection can be achieved (by means of appropriately increasing the number of antennas) and a super computer is available to run the invented method, a real-time microwave image is feasible.
Landscapes
- Engineering & Computer Science (AREA)
- Remote Sensing (AREA)
- Physics & Mathematics (AREA)
- Radar, Positioning & Navigation (AREA)
- General Physics & Mathematics (AREA)
- Electromagnetism (AREA)
- Computer Networks & Wireless Communication (AREA)
- Analytical Chemistry (AREA)
- Biochemistry (AREA)
- General Health & Medical Sciences (AREA)
- Chemical & Material Sciences (AREA)
- Immunology (AREA)
- Pathology (AREA)
- Life Sciences & Earth Sciences (AREA)
- Health & Medical Sciences (AREA)
- Radar Systems Or Details Thereof (AREA)
Abstract
Description
where ν is the wave speed travelling in air. The phase delay between two antennas is
where λ is the wavelength. Assuming the same antennas are utilized for 104 and 105, by a simple transmission-reception test, the time delay in one antenna (from the antenna's
where T denotes the time shift between the measured output signal and input signal, and
A similar method can be used to calculate the phase delays in the antenna which can be written as
where Φ denotes the phase difference between the output signal and input signal, and
With this approach accurate time shifts of waves propagating in a medium (from
at a particular frequency.
for each channel. The phase of the obtained signals will rotate back by
counterclockwise, as if all the signals back-propagate to their initial position. As a result, when the computation focuses on a focal point like 602 where the object is present and the wave really scattered at this focal point, the phase of all the signals will return to their common initial phase after phase compensation (the phases are coherent), as shown in
ψ′mn=ψmn+Δψmn
The variable dm,n is the average of the squared distance from all unit vectors to their mean position for each of the M×N signals. The mean position of M×N signals
in the Cartesian coordinates can be written in another form:
where ψm,n is the phase of the M×N signals. A simpler statistic form can be used to show what is calculated:
Q({right arrow over (r)})=σ2(Cos(ψ′m,n))+σ2(Sin(ψ′m,n))
where σ2 represents a variance computation. As a result, in locations where an object is present, a small variance value is present and can be converted to a large pixel value in the image by a reciprocal computation:
P({right arrow over (r)}) will be the pixel value of the image in the position {right arrow over (r)}.
ΔΦ=ΦTC+ΦT+Δψspace+ΦRC+ΦR
In single frequency detection, since ΦTC, ΦT, ΦRC, ΦR are fixed in all channels, there is only a need to compensate the phase change in space, i.e., Δψspace. There is no need to know the other four terms, nor are they used in the single-frequency PCM.
Q({right arrow over (r)})=σ2(Cos(ψ′mnl))+σ2(Sin(ψ′mnl))
When the measurement is made in the frequency domain, it is assumed all frequency components have the same initial phase. Thus, the phases from all channels and all frequencies are expected to be correlated after the phase compensation step when the focal point falls in the object's location. If the measurement is taken in the time domain, the initial phases of frequency components in a UWB signal are usually unequal. Thus, an additional step that subtracts the initial phases of the frequency components in the UWB signal from the compensated phases must be taken into account in the multiple-frequency method.
Claims (18)
Priority Applications (1)
| Application Number | Priority Date | Filing Date | Title |
|---|---|---|---|
| US15/342,368 US10436895B2 (en) | 2016-06-09 | 2016-11-03 | Phase confocal method for near-field microwave imaging |
Applications Claiming Priority (2)
| Application Number | Priority Date | Filing Date | Title |
|---|---|---|---|
| US201662347798P | 2016-06-09 | 2016-06-09 | |
| US15/342,368 US10436895B2 (en) | 2016-06-09 | 2016-11-03 | Phase confocal method for near-field microwave imaging |
Publications (2)
| Publication Number | Publication Date |
|---|---|
| US20170356995A1 US20170356995A1 (en) | 2017-12-14 |
| US10436895B2 true US10436895B2 (en) | 2019-10-08 |
Family
ID=60572574
Family Applications (1)
| Application Number | Title | Priority Date | Filing Date |
|---|---|---|---|
| US15/342,368 Active 2037-09-26 US10436895B2 (en) | 2016-06-09 | 2016-11-03 | Phase confocal method for near-field microwave imaging |
Country Status (1)
| Country | Link |
|---|---|
| US (1) | US10436895B2 (en) |
Families Citing this family (3)
| Publication number | Priority date | Publication date | Assignee | Title |
|---|---|---|---|---|
| US10983209B2 (en) | 2017-04-12 | 2021-04-20 | Ellumen, Inc. | Accurate signal compensations for UWB radar imaging in dispersive medium |
| CN109283530B (en) * | 2018-09-14 | 2020-08-14 | 浙江大学 | Method for improving microwave imaging linearity by utilizing compressed sensing |
| CN113238221B (en) * | 2021-05-11 | 2023-09-22 | 沈阳航空航天大学 | MIMO through-wall radar imaging method based on two-dimensional minimum phase coherence factor |
Citations (16)
| Publication number | Priority date | Publication date | Assignee | Title |
|---|---|---|---|---|
| US3806929A (en) * | 1971-06-24 | 1974-04-23 | Us Navy | Method for the detection of radar targets |
| US5233541A (en) * | 1990-08-10 | 1993-08-03 | Kaman Aerospace Corporation | Automatic target detection process |
| US6061589A (en) | 1994-07-01 | 2000-05-09 | Interstitial, Inc. | Microwave antenna for cancer detection system |
| US6389084B1 (en) * | 1998-08-07 | 2002-05-14 | Lucent Technologies Inc. | Apparatus and method for equalizing a signal independent of the impact of doppler frequency |
| US6972714B1 (en) * | 2004-06-08 | 2005-12-06 | Agilent Technologies, Inc. | Optically-augmented microwave imaging system and method |
| WO2006028397A1 (en) | 2004-09-10 | 2006-03-16 | Industrial Research Limited | Synthetic focusing method |
| US20060147090A1 (en) * | 2004-12-30 | 2006-07-06 | Seung-Joon Yang | Motion adaptive image processing apparatus and method thereof |
| US20060214836A1 (en) * | 2005-03-24 | 2006-09-28 | Izhak Baharav | System and method for pattern design in microwave programmable arrays |
| US20070257188A1 (en) * | 2003-09-13 | 2007-11-08 | Valtion Teknillinen Tutkimuskeskus | Radiometric Calibration |
| US20080079625A1 (en) * | 2006-10-03 | 2008-04-03 | William Weems | System and method for stereoscopic anomaly detection using microwave imaging |
| US20080100510A1 (en) * | 2006-10-27 | 2008-05-01 | Bonthron Andrew J | Method and apparatus for microwave and millimeter-wave imaging |
| US20120084036A1 (en) * | 2010-10-01 | 2012-04-05 | Tektronix, Inc. | Signal Acquisition Probe Storing Compressed or Compressed and Filtered Time Domain Impulse or Step Response Data for Use in a Signal Measurement System |
| US20130002488A1 (en) * | 2011-06-30 | 2013-01-03 | Sony Corporation | Wideband beam forming device; wideband beam steering device and corresponding methods |
| US20130106651A1 (en) * | 2011-10-30 | 2013-05-02 | Raytheon Company | Single-pass barankin estimation of scatterer height from sar data |
| US20160139259A1 (en) * | 2013-07-15 | 2016-05-19 | Northeastern University | Modular superheterodyne stepped frequency radar system for imaging |
| US20170131399A1 (en) * | 2015-11-10 | 2017-05-11 | Northrop Grumman Systems Corporation | Two-way coded aperture three-dimensional radar imaging |
-
2016
- 2016-11-03 US US15/342,368 patent/US10436895B2/en active Active
Patent Citations (16)
| Publication number | Priority date | Publication date | Assignee | Title |
|---|---|---|---|---|
| US3806929A (en) * | 1971-06-24 | 1974-04-23 | Us Navy | Method for the detection of radar targets |
| US5233541A (en) * | 1990-08-10 | 1993-08-03 | Kaman Aerospace Corporation | Automatic target detection process |
| US6061589A (en) | 1994-07-01 | 2000-05-09 | Interstitial, Inc. | Microwave antenna for cancer detection system |
| US6389084B1 (en) * | 1998-08-07 | 2002-05-14 | Lucent Technologies Inc. | Apparatus and method for equalizing a signal independent of the impact of doppler frequency |
| US20070257188A1 (en) * | 2003-09-13 | 2007-11-08 | Valtion Teknillinen Tutkimuskeskus | Radiometric Calibration |
| US6972714B1 (en) * | 2004-06-08 | 2005-12-06 | Agilent Technologies, Inc. | Optically-augmented microwave imaging system and method |
| WO2006028397A1 (en) | 2004-09-10 | 2006-03-16 | Industrial Research Limited | Synthetic focusing method |
| US20060147090A1 (en) * | 2004-12-30 | 2006-07-06 | Seung-Joon Yang | Motion adaptive image processing apparatus and method thereof |
| US20060214836A1 (en) * | 2005-03-24 | 2006-09-28 | Izhak Baharav | System and method for pattern design in microwave programmable arrays |
| US20080079625A1 (en) * | 2006-10-03 | 2008-04-03 | William Weems | System and method for stereoscopic anomaly detection using microwave imaging |
| US20080100510A1 (en) * | 2006-10-27 | 2008-05-01 | Bonthron Andrew J | Method and apparatus for microwave and millimeter-wave imaging |
| US20120084036A1 (en) * | 2010-10-01 | 2012-04-05 | Tektronix, Inc. | Signal Acquisition Probe Storing Compressed or Compressed and Filtered Time Domain Impulse or Step Response Data for Use in a Signal Measurement System |
| US20130002488A1 (en) * | 2011-06-30 | 2013-01-03 | Sony Corporation | Wideband beam forming device; wideband beam steering device and corresponding methods |
| US20130106651A1 (en) * | 2011-10-30 | 2013-05-02 | Raytheon Company | Single-pass barankin estimation of scatterer height from sar data |
| US20160139259A1 (en) * | 2013-07-15 | 2016-05-19 | Northeastern University | Modular superheterodyne stepped frequency radar system for imaging |
| US20170131399A1 (en) * | 2015-11-10 | 2017-05-11 | Northrop Grumman Systems Corporation | Two-way coded aperture three-dimensional radar imaging |
Non-Patent Citations (9)
| Title |
|---|
| Elise C. Fear et al., Enhancing Breast Tumor Detection with Near-Field Imaging, IEEE Microwave Magazine, Mar. 2002, pp. 48-56. |
| Elise Fear et al., Microwaves for Breast Cancer Detection?, IEEE Potentials, 2003, pp. 12-18. |
| Hooi Been Lim et al., Confocal Microwave Imaging for Breast Cancer Detection: Delay-Multiply- and Sum Image Reconstruction Algorithm, IEEE Transactions on Biomedical Engineering, vol. 55, No. 6, Jun. 2008, pp. 1697-1704. |
| Jason Langley et al., A Model-Based 3D Phase Unwrapping Algorithm Using Gegenbauer Polynomials, Physics in Medicine and Biology, 54, 2009, pp. 5237-5252, IOP Publishing. |
| Jason Langley et al., Unwrapping Magnetic Resonance Phase Maps With Chebyshev Polynomials, Magnetic Resonance Imaging, 27, 2009, pp. 1293-1301. |
| Lei Guo et al., Optimization-Based Confocal Microwave Imaging in Medical Applications, IEEE Transactions on Antennas and Propagation, vol. 63, No. 8, Aug. 2015, pp. 3531-3539. |
| U.S. Appl. No. 15/094,368, filed Apr. 8, 2016, Ellumen, Inc. |
| Xu Li et al., A Confocal Microwave Imaging Algorithm for Breast Cancer Detection, IEEE Microwave and Wireless Components Letters, vol. 11, No. 3, Mar. 2001, pp. 130-132. |
| Yao Xie et al., Multistatic Adaptive Microwave Imaging for Early Breast Cancer Detection, IEEE Transactions on Biomedical Engineering, Aug. 2006, pp. 1647-1657, vol. 53, No. 8. |
Also Published As
| Publication number | Publication date |
|---|---|
| US20170356995A1 (en) | 2017-12-14 |
Similar Documents
| Publication | Publication Date | Title |
|---|---|---|
| EP2893594B1 (en) | Wideband radar with heterogeneous antenna arrays | |
| US8330642B2 (en) | Imaging by time reversal beamforming | |
| EP2967477B1 (en) | Microwave imaging resilient to background and skin clutter | |
| US10983209B2 (en) | Accurate signal compensations for UWB radar imaging in dispersive medium | |
| US10436895B2 (en) | Phase confocal method for near-field microwave imaging | |
| Catapano et al. | A qualitative inverse scattering method for through-the-wall imaging | |
| Sadeghi et al. | A practical UWB microwave imaging system using time-domain DORT for tumor detection | |
| Moscato et al. | A mm‐wave 2D ultra‐wideband imaging radar for breast cancer detection | |
| Morrow et al. | Effective imaging of buried dielectric objects | |
| Oloumi | Ultra-wideband synthetic aperture radar imaging: Theory and applications | |
| Anwar et al. | Sidelobe suppression featuring the phase coherence factor in 3-D through-the-wall radar imaging | |
| Moallemi et al. | A new model for array spatial signature for two-layer imaging with applications to nondestructive testing using ultrasonic arrays | |
| Maisto et al. | Spatial sensor arrangement in Through-the Wall radar imaging: Numerical results | |
| Hantscher et al. | Comparison of UWB target identification algorithms for through-wall imaging applications | |
| Bektas et al. | An experimental investigation of FK migration and SAR algorithm using beam space MUSIC for UWB through-the-wall imaging | |
| Mu et al. | Through wall imaging based on the space-frequency time reversal | |
| Clavero et al. | Compact semi-circular mimo radar system for the fast detection of small particles approaching the rayleigh scattering region | |
| Sabzevari et al. | A Modified Kirchhoff Migration for Microwave Imaging in Superluminal Propagation Region | |
| Gennarelli et al. | The effect of array configuration in transmission-mode electromagnetic imaging | |
| Panda et al. | Time reversal imaging based subsurface velocity estimation | |
| RU2568430C1 (en) | Radar space sounding method | |
| RU2753829C1 (en) | Method for determining anechoic coefficient in radio frequency anechoic chamber and apparatus for implementation thereof | |
| Solberg et al. | Minimum variance signal selection for aorta radius estimation using radar | |
| Schatzberg et al. | Maximum likelihood estimation of target location in acoustic and electromagnetic imaging | |
| Abed et al. | Poles Isolation via ESPRIT for Ultra-Wide Band Breast Cancer Imaging |
Legal Events
| Date | Code | Title | Description |
|---|---|---|---|
| AS | Assignment |
Owner name: ELLUMEN, INC., VIRGINIA Free format text: ASSIGNMENT OF ASSIGNORS INTEREST;ASSIGNORS:SHAO, WENYI;MCCOLLOUGH, TODD R.;MCCOLLOUGH, WILLIAM J.;AND OTHERS;SIGNING DATES FROM 20161121 TO 20161130;REEL/FRAME:040949/0418 |
|
| STPP | Information on status: patent application and granting procedure in general |
Free format text: RESPONSE TO NON-FINAL OFFICE ACTION ENTERED AND FORWARDED TO EXAMINER |
|
| STPP | Information on status: patent application and granting procedure in general |
Free format text: FINAL REJECTION MAILED |
|
| STPP | Information on status: patent application and granting procedure in general |
Free format text: NOTICE OF ALLOWANCE MAILED -- APPLICATION RECEIVED IN OFFICE OF PUBLICATIONS |
|
| STPP | Information on status: patent application and granting procedure in general |
Free format text: PUBLICATIONS -- ISSUE FEE PAYMENT VERIFIED |
|
| STCF | Information on status: patent grant |
Free format text: PATENTED CASE |
|
| MAFP | Maintenance fee payment |
Free format text: PAYMENT OF MAINTENANCE FEE, 4TH YR, SMALL ENTITY (ORIGINAL EVENT CODE: M2551); ENTITY STATUS OF PATENT OWNER: SMALL ENTITY Year of fee payment: 4 |