US10197657B2 - Methods and systems for generating a conductivity map of an in vivo tissue - Google Patents
Methods and systems for generating a conductivity map of an in vivo tissue Download PDFInfo
- Publication number
- US10197657B2 US10197657B2 US15/233,448 US201615233448A US10197657B2 US 10197657 B2 US10197657 B2 US 10197657B2 US 201615233448 A US201615233448 A US 201615233448A US 10197657 B2 US10197657 B2 US 10197657B2
- Authority
- US
- United States
- Prior art keywords
- tissue
- mri
- conductivity
- concentration
- carrier ion
- Prior art date
- Legal status (The legal status is an assumption and is not a legal conclusion. Google has not performed a legal analysis and makes no representation as to the accuracy of the status listed.)
- Active, expires
Links
Images


Classifications
-
- G—PHYSICS
- G01—MEASURING; TESTING
- G01R—MEASURING ELECTRIC VARIABLES; MEASURING MAGNETIC VARIABLES
- G01R33/00—Arrangements or instruments for measuring magnetic variables
- G01R33/20—Arrangements or instruments for measuring magnetic variables involving magnetic resonance
- G01R33/44—Arrangements or instruments for measuring magnetic variables involving magnetic resonance using nuclear magnetic resonance [NMR]
- G01R33/48—NMR imaging systems
- G01R33/54—Signal processing systems, e.g. using pulse sequences ; Generation or control of pulse sequences; Operator console
- G01R33/56—Image enhancement or correction, e.g. subtraction or averaging techniques, e.g. improvement of signal-to-noise ratio and resolution
- G01R33/563—Image enhancement or correction, e.g. subtraction or averaging techniques, e.g. improvement of signal-to-noise ratio and resolution of moving material, e.g. flow contrast angiography
- G01R33/56341—Diffusion imaging
-
- A—HUMAN NECESSITIES
- A61—MEDICAL OR VETERINARY SCIENCE; HYGIENE
- A61B—DIAGNOSIS; SURGERY; IDENTIFICATION
- A61B5/00—Measuring for diagnostic purposes; Identification of persons
- A61B5/0033—Features or image-related aspects of imaging apparatus classified in A61B5/00, e.g. for MRI, optical tomography or impedance tomography apparatus; arrangements of imaging apparatus in a room
- A61B5/004—Features or image-related aspects of imaging apparatus classified in A61B5/00, e.g. for MRI, optical tomography or impedance tomography apparatus; arrangements of imaging apparatus in a room adapted for image acquisition of a particular organ or body part
- A61B5/0042—Features or image-related aspects of imaging apparatus classified in A61B5/00, e.g. for MRI, optical tomography or impedance tomography apparatus; arrangements of imaging apparatus in a room adapted for image acquisition of a particular organ or body part for the brain
-
- A—HUMAN NECESSITIES
- A61—MEDICAL OR VETERINARY SCIENCE; HYGIENE
- A61B—DIAGNOSIS; SURGERY; IDENTIFICATION
- A61B5/00—Measuring for diagnostic purposes; Identification of persons
- A61B5/0033—Features or image-related aspects of imaging apparatus classified in A61B5/00, e.g. for MRI, optical tomography or impedance tomography apparatus; arrangements of imaging apparatus in a room
- A61B5/004—Features or image-related aspects of imaging apparatus classified in A61B5/00, e.g. for MRI, optical tomography or impedance tomography apparatus; arrangements of imaging apparatus in a room adapted for image acquisition of a particular organ or body part
- A61B5/0044—Features or image-related aspects of imaging apparatus classified in A61B5/00, e.g. for MRI, optical tomography or impedance tomography apparatus; arrangements of imaging apparatus in a room adapted for image acquisition of a particular organ or body part for the heart
-
- A—HUMAN NECESSITIES
- A61—MEDICAL OR VETERINARY SCIENCE; HYGIENE
- A61B—DIAGNOSIS; SURGERY; IDENTIFICATION
- A61B5/00—Measuring for diagnostic purposes; Identification of persons
- A61B5/05—Detecting, measuring or recording for diagnosis by means of electric currents or magnetic fields; Measuring using microwaves or radio waves
- A61B5/053—Measuring electrical impedance or conductance of a portion of the body
- A61B5/0536—Impedance imaging, e.g. by tomography
-
- A—HUMAN NECESSITIES
- A61—MEDICAL OR VETERINARY SCIENCE; HYGIENE
- A61B—DIAGNOSIS; SURGERY; IDENTIFICATION
- A61B5/00—Measuring for diagnostic purposes; Identification of persons
- A61B5/05—Detecting, measuring or recording for diagnosis by means of electric currents or magnetic fields; Measuring using microwaves or radio waves
- A61B5/055—Detecting, measuring or recording for diagnosis by means of electric currents or magnetic fields; Measuring using microwaves or radio waves involving electronic [EMR] or nuclear [NMR] magnetic resonance, e.g. magnetic resonance imaging
-
- A—HUMAN NECESSITIES
- A61—MEDICAL OR VETERINARY SCIENCE; HYGIENE
- A61B—DIAGNOSIS; SURGERY; IDENTIFICATION
- A61B5/00—Measuring for diagnostic purposes; Identification of persons
- A61B5/72—Signal processing specially adapted for physiological signals or for diagnostic purposes
- A61B5/7271—Specific aspects of physiological measurement analysis
- A61B5/7278—Artificial waveform generation or derivation, e.g. synthesising signals from measured signals
Definitions
- Quantitative intracranial current source localization using mathematical models applied to magnetoencephalography (MEG), electroencephalography (EEG), and combined MEG-EEG data rely on assumptions regarding electrical conductivity through the skull and brain.
- quantitative estimates of electrical conductivities and tissue anisotropies are needed for accurate boundary element, finite element, single and multi-sphere models, and combination MEG/EEG models, as mis specification of these conductivity parameters and their anisotropies can affect the apparent magnitude (strength) of magnetic fields and electric surface potentials, leading to inappropriate localization.
- DT-MRI diffusion tensor magnetic resonance imaging
- ADC apparent diffusion coefficient
- the present disclosure provides methods of generating a conductivity map of an in vivo tissue.
- the present disclosure provides systems for generating a conductivity map of an in vivo tissue.
- aspects of the present disclosure include a non-invasive method of generating a conductivity map of an in vivo tissue.
- MRI magnetic resonance imaging
- D water proton diffusivity
- DT-MRI diffusion tensor MRI
- the tissue is brain tissue.
- the tissue is heart tissue.
- concentration of the carrier ion and the water proton diffusivity are measured using a single coil.
- the carrier ion is selected from sodium ion, chloride ion, potassium ion, and calcium ion.
- the DT-MRI is performed at 0.3 T.
- the DT-MRI is performed at 1.5 T.
- the DT-MRI is performed at 3 T.
- the DT-MRI is performed at 7 T.
- the DT-MRI is performed at 9 T.
- the DT-MRI is performed at 12 T.
- aspects of the present disclosure include a system for generating a conductivity map of an in vivo tissue.
- MRI magnetic resonance imaging
- D water proton diffusivity
- k is Boltzmann constant
- T temperature in degrees Kelvin.
- the system includes a data storage that is configured to store conductivity map data.
- the system includes a user interface and a data connector that transmits data between the processor and the user interface.
- the MRI device comprises a coil for measuring the concentration of the carrier ion in the tissue.
- the MRI device comprises electronic devices configured to generate frequencies, gradients and pulses for measuring the concentration of the carrier ion in the tissue.
- the MRI device comprises a coil for measuring the water proton diffusivity (D) in the tissue.
- the MRI device comprises a single coil for measuring the concentration of the carrier ion in the tissue and the water proton diffusivity (D) in the tissue.
- FIG. 1 depicts a schematic diagram of the conductivity measuring instrumentation.
- a function generator (FG) is used to modulate the current output of a stimulus isolator (SI) through the sample.
- SI stimulus isolator
- the potential drops and phase changes are measured through the lock-in amplifiers.
- the resistor R4 is used to monitor the current and the phase change due to instrumentation. All instrumentation is automated through Lab View software and controlled through a computer, which also records and analyzes all data.
- FIG. 2 depicts a table showing the DT-MRI field strength and acquisition parameters for the respective rows of data depicted in FIG. 5 .
- FIG. 3A - FIG. 3F depict various models and equations.
- FIG. 3A Diffusion tensor defining three principle diffusivities by their eigenvalues ( ⁇ 1 , ⁇ 2 , and ⁇ 3 ) and eigenvectors (v 1 , v 2 , and v 3 ) with respect to the global coordinate system.
- FIG. 3B The diffusion ellipsoid model with axes defined by the diffusion eigenvalues.
- FIG. 3C Intersection of the diffusion ellipsoid and plane parallel to the cortical surface.
- FIG. 3D Plane defining the cortical surface with normal vector, n, and parallel vector components, r and s.
- FIG. 3A Diffusion tensor defining three principle diffusivities by their eigenvalues ( ⁇ 1 , ⁇ 2 , and ⁇ 3 ) and eigenvectors (v 1 , v 2 , and v 3 ) with respect to the
- FIG. 3E Diffusivity perpendicular to the cortical surface, q, in relation to the diffusion ellipsoid and cortical surface.
- FIG. 3F Diffusivity measurements parallel to the cortical surface, a and b.
- FIG. 4 depicts a table that shows a comparison of clinical variables with electrical conductivity and MRI diffusion. Data presented as F-values/P-values (i.e., the corresponding 2 numbers at each entry) using ANOVA. Comparisons reached a prior statistical significance (P ⁇ 0.05) for age at surgery and age at seizure onset vs diffusivity parameters both in the parallel and perpendicular directions. Comparison of ratios of diffusivities in the parallel and perpendicular directions with the seizure free duration post-surgery also reached significance at p ⁇ 0.05 level. Significant values (P ⁇ 0.05) indicated in Bold.
- FIG. 5 depicts a table that shows values of electrical conductivities perpendicular, and parallel, ⁇ ⁇ , to pia, as well as the DT-MRI values along the corresponding directions.
- FIG. 6 depicts a table that shows the linear correlations comparing electrical conductivity ( ⁇ ) and DT-MRI (D) measurements. Data presented as R-values/P-values. Significant values (P ⁇ 0.05) indicated in Bold.
- FIG. 7A - FIG. 7H depict graphs demonstrating that positive and significant correlations exist between the ratios of electrical conductivities ( ⁇ ⁇ / ⁇ ) and DT-MRI values in the perpendicular ( FIG. 7A ), and parallel ( FIG. 7B ) directions to the pial surface. Positive and significant correlations also exist between the parallel and perpendicular values of electrical conductivities ( FIG. 7C ), and those of DT-MRI ( FIG. 7D ). The slope of best-fitting line in FIG. 3C is 1.38 ⁇ 0.082. No significant correlation is present between the ratios of the electrical conductivities and conductivity parallel to pia ( FIG. 7E ), the ratios of the DT-MRI values and MRI diffusivity parallel to pia ( FIG. 7F ), the ratios of the electrical conductivities and the ratios of the DT-MRI (major) ( FIG. 7G ), and the ratios of the DT-MRI (minor) ( FIG. 7H ).
- FIG. 8 depicts a schematic illustration of the circuit for measuring the dc conductivity of a sample between blocking electrodes separated by the distance L.
- FIG. 10 depicts a schematic illustration of the circuit for measuring the ac conductivity of a sample between blocking electrodes separated by the distance L.
- FIG. 11 depicts the ac conductivity, ⁇ ( ⁇ ) at applied frequency ⁇ , in units of the initial dc conductivity ⁇ dc plotted versus the square-root of win units of 2D/L 2 , where D and L respectively denote the charge-carriers' diffusion constant and the separation between blocking electrodes.
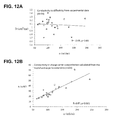
- FIG. 12A-12B are plots of electrical conductivity versus water proton diffusivity (D; in ⁇ m 2 /ms) ( FIG. 12A ), and ion concentration versus water proton diffusivity ( FIG. 12B ).
- the resulting tissue ion concentration n; in mM
- the predicted brain tissue ion concentration is consistent with the range and variation of tissue sodium concentration in normal and diseased brain tissues.
- FIG. 13A-13B are images of sodium MRI scans of brain tissue samples, according to embodiments of the present disclosure.
- the present disclosure provides methods of generating a conductivity map of an in vivo tissue.
- the present disclosure provides systems for generating a conductivity map of an in vivo tissue.
- the present disclosure provides methods of generating a conductivity map of an in vivo tissue in a subject.
- the method is a non-invasive method of generating a conductivity map of an in vivo tissue in a subject. Methods that do not involve the puncturing of the skin or an incision, or the introduction of foreign objects or materials into the body of the subject are known as non-invasive methods. For instance, a non-invasive method does not require a surgical procedure to be performed on the subject.
- Non-invasive methods may involve performing one or more non-invasive diagnostic procedures on the subject.
- non-invasive diagnostic procedures may include, but are not limited to, magnetic resonance imaging (MRI), computed tomography (CT), ultrasound, X-ray radiography, electroencephalography (EEG), magnetoencephalography (MEG), electrocardiography (ECG), and combinations thereof.
- the non-invasive methods disclosed herein include MRI.
- MRI magnetic resonance imaging
- CT computed tomography
- EEG electroencephalography
- MEG magnetoencephalography
- ECG electrocardiography
- the non-invasive methods disclosed herein include MRI.
- MRI Various types of MRI may be used, such as, but not limited to, diffusion MRI, diffusion tensor MRI (DT-MRI), functional MRI (fMRI), real-time MRI, and the like.
- DT-MRI is used in the presently disclosed methods.
- the methods are performed in vivo.
- Methods that are performed in vivo include methods in which an assay is performed on a biological entity that is a whole, living organism, such as an animal (e.g., a mammal; e.g., a non-human mammal (e.g., a non-human primate; a rodent (e.g., a rat; a mouse); a cat; a dog; a horse; etc.); a human), or a plant, as opposed to a part of an organism or a dead organism, or methods performed in vitro, i.e., in a laboratory environment using test tubes, petri dishes, etc.
- the method may be an in vitro method.
- the method includes measuring a detectable parameter of the tissue in the subject.
- the detectable parameter of the tissue includes a concentration of a carrier ion in the tissue.
- methods of the present disclosure include measuring a concentration of a carrier ion in a tissue of a subject.
- the concentration of the carrier ion is measured directly in the tissue of the subject.
- the concentration of the carrier ion is measured using a non-invasive diagnostic method, such as MRI.
- methods of the present disclosure include measuring the concentration of a carrier ion in a tissue using MRI.
- the carrier ion may be any carrier ion present in the tissue that is detectable using the presently disclosed methods.
- the carrier ion is sodium, chloride, potassium or calcium.
- the carrier ion may be sodium ion (Na + ).
- the carrier ion is chloride ion (Cl ⁇ ).
- the carrier ion is potassium ion (K + ).
- the carrier ion is calcium ion (Ca 2+ ).
- the concentration of the carrier ion is expressed in mM.
- the concentration of the carrier ion is expressed in m ⁇ 3 .
- the MRI can be performed at 0.3 Tesla (T), 1.5 T, 3 T, 7 T, 9 T, or 12 T. In some cases, the MRI is performed at 0.3 T.
- the MRI is performed at 1.5 T. In some cases, the MRI is performed at 3 T. In some cases, the MRI is performed at 7 T. In some cases, the MRI is performed at 9 T. In some cases, the MRI is performed at 12 T.
- the detectable parameter of the tissue is the water proton diffusivity (D) in the tissue.
- methods of the present disclosure include measuring the water proton diffusivity in a tissue of a subject. In some cases, the water proton diffusivity is measured using a non-invasive diagnostic method, such as MRI. In some cases, the water proton diffusivity is measured using a non-invasive diagnostic method, such as DT-MRI. Thus, methods of the present disclosure include measuring the concentration of a carrier ion in a tissue using MRI (e.g., using DT-MRI). In certain instances, the water proton diffusivity is expressed in cm 2 /s, such as ⁇ cm 2 /s.
- the DT-MRI can be performed at 0.3 T, 1.5 T, 3 T, 7 T, 9 T, or 12 T. In some cases, the DT-MRI is performed at 0.3 T. In some cases, the DT-MRI is performed at 1.5 T. In some cases, the DT-MRI is performed at 3 T. In some cases, the DT-MRI is performed at 7 T. In some cases, the DT-MRI is performed at 9 T. In some cases, the DT-MRI is performed at 12 T.
- the carrier ion concentration and the water proton diffusivity are measured using a single coil (e.g., radiofrequency receive coil) in the MRI or DT-MRI device. In other cases, the carrier ion concentration and the water proton diffusivity are measured using separate coils in the MRI or DT-MRI device.
- a single coil e.g., radiofrequency receive coil
- the carrier ion concentration and the water proton diffusivity are measured using separate coils in the MRI or DT-MRI device.
- the detectable parameter of the tissue may include the temperature of the tissue.
- methods of the present disclosure may include measuring the temperature of a tissue of a subject that is being analyzed.
- the temperature of the tissue may be substantially the same as the normal body temperature of the subject being analyzed.
- the temperature may be about 37° C. (310 K).
- the temperature of the tissue being analyzed may be substantially the same as the environment surrounding the tissue.
- the temperature of the tissue for an in vitro method may be room temperature, or about 25° C. (300 K).
- the method does not need to include a step of measuring the temperature of the tissue. Instead, the method may include inputting temperature data into the system, for example by using a user interface to input the temperature data. In certain cases, the temperature is expressed in degrees Kelvin (K).
- the detectable parameters of the tissue being analyzed can be measured in a single target area in the subject (e.g., a uniplex analysis of a target area).
- a uniplex analysis is meant that a single target area is analyzed using the methods and systems disclosed herein.
- Other embodiments include the multiplex analysis of two or more target areas (e.g., target tissues) in a subject.
- multiplex analysis is meant that two or more target areas of tissue in a subject may be analyzed using the methods and systems disclosed herein.
- the number of target areas for analysis using multiplex methods and systems as disclosed herein is 2 or more, such as 4 or more, 6 or more, 8 or more, 10 or more, etc., up to 20 or more, e.g., 50 or more, including 100 or more, or 500 or more distinct target areas.
- the methods and systems may be used for the multiplex analysis of 2 to 500 distinct target areas in the subject, such as 2 to 250 distinct target areas, including 2 to 100 distinct target areas, or 2 to 50 distinct target areas, or 2 to 25 distinct target areas, or 2 to 10 distinct target areas.
- 2 or more multiplex assays may be conducted in parallel substantially simultaneously.
- Measuring the concentration of the carrier ion in the tissue may generate concentration data.
- measuring the water proton diffusivity in the tissue may generate water proton diffusivity data.
- measuring the temperature of the tissue may generate temperature data.
- the method includes storing the data (e.g., the concentration data and/or the water proton diffusivity data and/or the temperature data) in a data storage of the system.
- the data storage includes a computer readable medium on which the data may be recorded such that the data are accessible and retrievable at a later date by a computer.
- methods of the present disclosure may include retrieving data from the data storage.
- the data (e.g., the concentration data and/or the water proton diffusivity data and/or the temperature data) may be obtained and then analyzed in real-time.
- real-time is meant that the acquired data are analyzed by the system (e.g., a processor) immediately after the measurement data are acquired.
- the method further includes analyzing the measured concentration of the carrier ion and analyzing the measured water proton diffusivity to determine a parameter associated with the analyzed tissue.
- the parameter to be determined is a conductivity associated with the analyzed tissue.
- methods of the present disclosure include determining the conductivity of a target tissue in a subject based on the concentration of the carrier ion and the water proton diffusivity of the target tissue. The conductivity may be determined at one or more target areas in the subject.
- the method includes determining an average conductivity for a target tissue area. By average is meant the arithmetic mean.
- the method includes determining a directional component of the conductivity.
- the method may include determining the conductivity in a certain direction with respect to a surface of the analyzed tissue. In some cases, the method includes determining the conductivity in a direction perpendicular to a surface of the analyzed tissue. In some cases, the method includes determining the conductivity in a direction parallel to a surface of the analyzed tissue.
- the method includes generating a conductivity map of the tissue.
- the conductivity map of the tissue may be a 2-dimensional or 3-dimensional representation of empirically determined conductivity values associated with the analyzed tissue.
- the conductivity map is constructed by determining the conductivity at a plurality of target areas in a tissue of the subject and combining the determined conductivity values into a conductivity map of the tissue.
- embodiments of the presently disclosed methods include using the measured carrier ion concentration and the measured water proton diffusivity to determine a conductivity value associated with a tissue and/or generate a conductivity map of the tissue.
- the method includes using an equation to determine the conductivity values, and thus generate the conductivity map of the tissue.
- ⁇ is conductivity, where the conductivity is expressed in siemens per meter (S/m), such as mS/m.
- D is the water proton diffusivity, where D is expressed in cm 2 /s, such as ⁇ cm 2 /s.
- n is the concentration of the carrier ion, where the concentration is expressed in m ⁇ 3 .
- q is the charge of the carrier ion.
- the q of the carrier ion may be calculated by multiplying the fundamental physical constant for elementary charge by the electrical charge of the carrier ion.
- the elementary charge physical constant is equal to 1.6 ⁇ 10 ⁇ 19 coulomb (C).
- the electrical charge of the carrier ion is an integer equal to the difference between the total number of protons and the total number of electrons in the carrier ion. For example, for a sodium carrier ion (Na + ), the electrical charge is 1.
- k is Boltzmann constant, which is equal to 1.381 ⁇ 10 ⁇ 23 J/K.
- T is temperature in degrees Kelvin (K), e.g., the temperature of the tissue being analyzed, such as, for example, the normal body temperature of the subject for in vivo assays or the temperature of the environment surrounding the tissue being analyzed for in vitro assays.
- K degrees Kelvin
- the method includes generating one or more frequencies, gradients and/or pulses for measuring the concentration of the carrier ion in the tissue.
- the frequencies, gradients and/or pulses may be generated by one or more electronic devices included in the MRI device.
- the electronic devices may include one or more magnets, such as electromagnets.
- the method of the present disclosure is performed once. In other cases, the method is performed two or more times. In some cases, the method is performed several times over a period of time, e.g., the method includes chronically determining the conductivity of the tissue.
- the method may be performed periodically over an extended period of time, such as 1 day or more, 2 days or more, 3 days or more, 4 days or more, 5 days or more, 6 days or more, 7 days or more, 8 days or more, 9 days or more, 10 days or more, such as, for example, 1 week or more, 2 weeks or more, 3 weeks or more, 1 month or more, 2 months or more, 3 months or more, 4 months or more, 5 months or more, 6 months or more, 7 months or more, 8 months or more, 9 months or more, 10 months or more, 11 months or more, 1 year or more, or ever longer periods of time.
- an extended period of time such as 1 day or more, 2 days or more, 3 days or more, 4 days or more, 5 days or more, 6 days or more, 7 days or more, 8 days or more, 9 days or more, 10 days or more, such as, for example, 1 week or more, 2 weeks or more, 3 weeks or more, 1 month or more, 2 months or more, 3 months or more, 4 months or more, 5
- the individual is a human. In some cases, the individual is a non-human primate. In some cases, the individual is a rodent (e.g., a rat, a mouse, etc.).
- the target tissue may be an in vivo neuronal tissue, a tissue slice preparation, a nerve fiber bundle, a neuromuscular junction, etc.
- the in vivo neuronal tissue may be neuronal tissue of an animal that is anesthetized or non-anesthetized, and is restrained or non-restrained.
- the target tissue of interest may include, but is not limited to, the neocortex, the hypothalamus, entorhinal and hippocampal formation cortex, mammillary bodies, septum, bed nucleus of stria terminalis, dorsal and ventral striatum, thalamus, amygdala, accumbens, brainstem, subcortical structures in general, muscle, spinal cord, cardiac (heart) tissue, etc.
- the tissue is brain tissue.
- the tissue is heart tissue.
- the present disclosure provides a non-invasive method of generating a conductivity map of the brain of a living individual.
- the method includes measuring the concentration of a carrier ion in a brain tissue of the individual using MRI and measuring the water proton diffusivity (D) in the brain tissue using DT-MRI.
- the method may also include generating a conductivity map of the brain tissue, using the measured carrier ion concentration and the measured water proton diffusivity.
- Methods of the present disclosure for generating a conductivity map of an in vivo tissue may include determining the conductivity of the target tissue.
- the target tissue includes normal tissue.
- the target tissue includes abnormal tissue.
- the methods of the present disclosure include determining the location of abnormal tissue (e.g., pathological tissue; diseased tissue) in a subject, where the abnormal tissue has a conductivity that differs from normal (non-diseased) tissue.
- abnormal tissue e.g., pathological tissue; diseased tissue
- a method of the present disclosure for generating a conductivity map of an in vivo tissue may include determining the location of epileptic lesions, a tumor, damaged tissue (e.g., damaged tissue resulting from ischemia caused by stroke or myocardial ischemia), abnormal tissue caused by Alzheimer's disease, and/or abnormal tissue caused by Parkinson's disease, and the like.
- damaged tissue e.g., damaged tissue resulting from ischemia caused by stroke or myocardial ischemia
- abnormal tissue caused by Alzheimer's disease e.g., Alzheimer's disease, and/or abnormal tissue caused by Parkinson's disease, and the like.
- the present disclosure provides a non-invasive method of localizing a diseased tissue in a living individual.
- the method involves generating a conductivity map of the target tissue in the living individual, as described above, and, based on the conductivity map, localizing an area of abnormal conductivity.
- the area of abnormal conductivity is an indication of abnormal (e.g., diseased) tissue.
- the diseased tissue is a tumor.
- the diseased tissue is ischemic tissue.
- the diseased tissue is an epileptic lesion.
- the diseased tissue comprises neurofibrillary tangles and/or amyloid plaques.
- methods of the present disclosure may include diagnosing an individual for a disease or condition based on the conductivity map. For instance, based on the generated conductivity map, methods of the present disclosure may include diagnosing the individual for epilepsy, a tumor, stroke, myocardial ischemia, Alzheimer's disease, or Parkinson's disease.
- localization of a diseased tissue is followed by treatment.
- the method may include treating the individual by resection of the diseased tissue.
- the method may include treating the individual by lesionectomy.
- treating the individual may include administering a therapeutically effective amount of a drug to treat the disease or condition.
- the diseased tissue is a tumor, an epileptic lesion, damaged tissue resulting from stroke or myocardial ischemia, Alzheimer's disease or Parkinson's disease
- the method may include administering a therapeutically effective amount of a drug to treat the disease or condition.
- “Pharmaceutically effective amount” and “therapeutically effective amount” refer to an amount of a compound sufficient to treat a specified disorder or disease or one or more of its symptoms and/or to prevent the occurrence of the disease or disorder.
- a pharmaceutically or therapeutically effective amount may include an amount sufficient to, among other things, cause the tumor to shrink or decrease the growth rate of the tumor.
- a method of the present disclosure for generating a conductivity map of an in vivo tissue includes providing guidance for placement of deep brain stimulation (DBS) electrodes.
- DBS deep brain stimulation
- a conductivity map, generated as disclosed herein, allows for more precise placement of DBS electrodes.
- DBS is used in the treatment of a variety of disorders, including, e.g., Parkinson's disease, Alzheimer's disease, depression, dystonia, chronic pain, and epilepsy.
- the present disclosure provides methods of treatment, comprising: a) generating a conductivity map of a brain of an individual, as described above; and b) placing DBS electrodes in the brain, using information from the conductivity map, to place the electrodes in or near a desired target brain area (e.g., a brain area exhibiting abnormal conductivity).
- a desired target brain area e.g., a brain area exhibiting abnormal conductivity
- methods of the present disclosure include methods for identifying a treatment, e.g., a therapeutic treatment, with a desired activity on a brain tissue (e.g., a group of neurons). If the desired outcome is known, then the method may include screening for treatments, including, but not limited to, pharmacological agents (drugs), nonchemical based therapeutic treatment, behavioral treatment, electrical, magnetic, or optical based neural-modulation treatment, etc., that will bring about the desired neuronal activity pattern.
- pharmacological agents drug
- nonchemical based therapeutic treatment e.g., behavioral treatment, electrical, magnetic, or optical based neural-modulation treatment, etc.
- the screening may be performed in any suitable animal model, either normal, or a model for a neurological disorder, such as, but not limited to, Alzheimer's disease, Parkinson's disease, mild cognitive impairment, other dementias, and Down's Syndrome, as well as schizophrenia, autism, mood disorders, affective disorders, anxiety, personality/developmental disorders, and the like.
- a neurological disorder such as, but not limited to, Alzheimer's disease, Parkinson's disease, mild cognitive impairment, other dementias, and Down's Syndrome, as well as schizophrenia, autism, mood disorders, affective disorders, anxiety, personality/developmental disorders, and the like.
- the method includes treating a condition or disorder, such as a neurological or psychiatric condition using deep brain stimulation (DBS) and/or optogenetic control.
- a condition or disorder such as a neurological or psychiatric condition using deep brain stimulation (DBS) and/or optogenetic control.
- DBS deep brain stimulation
- a controller or processor may be configured to modulate the activity of neurons based on the generated conductivity map in such a way as to treat or reduce symptoms of the condition or disorder, at the behavioral and/or physiological levels.
- the terms “treat,” “treatment,” “treating,” and the like refer to obtaining a desired pharmacologic and/or physiologic effect.
- the effect may be prophylactic in terms of completely or partially preventing a disease or symptom thereof and/or may be therapeutic in terms of a partial or complete cure for a disease and/or adverse effect attributable to the disease.
- Treatment covers any treatment of a disease in a mammal, e.g., in a human, and includes: (a) preventing the disease from occurring in a subject which may be predisposed to the disease but has not yet been diagnosed as having it; (b) inhibiting the disease, i.e., arresting its development; and (c) relieving the disease, e.g., causing regression of the disease, e.g., to completely or partially remove symptoms of the disease.
- Suitable animals include mammals, e.g., a non-human mammal (e.g., a non-human primate; a rodent (e.g., a rat; a mouse); a cat; a dog; a horse; etc.); a human; etc.
- a non-human mammal e.g., a non-human primate
- rodent e.g., a rat; a mouse
- cat e.g., a dog; a horse; etc.
- a human etc.
- the individual is a human.
- the individual is a non-human mammal.
- the individual is a non-human primate.
- the individual is a rodent (e.g., a mouse; a rat).
- the individual is a feline, e.g., a cat.
- the individual is a canine, e.g., a dog.
- the individual is an ungulate.
- the system is configured for generating a conductivity map of an in vivo tissue.
- the system may include a magnetic resonance imaging (MRI) device.
- the MRI device may be configured to measure a concentration of a carrier ion in the tissue.
- the MRI device is also configured to measure the water proton diffusivity (D) in the tissue.
- the MRI device may include a coil (e.g., a transceiver coil) for measuring the concentration of the carrier ion in the tissue.
- the MRI device includes a coil (e.g., a transceiver coil) for measuring the water proton diffusivity in the tissue.
- the coil for measuring the concentration of the carrier ion and the coil for measuring the water proton diffusivity are the same coil.
- the MRI device includes a single coil for measuring the concentration of the carrier ion and the water proton diffusivity in the tissue.
- the coil for measuring the concentration of the carrier ion and the coil for measuring the water proton diffusivity are different coils.
- the MRI device may include a first coil for measuring the concentration of the carrier ion and a second coil for measuring the water proton diffusivity.
- Embodiments of the system also include a processor.
- the processor may be configured to execute programming (i.e., instructions) stored in the system (e.g., stored in a non-transient memory of the system), where execution of the programming by the processor causes the processor to generate a conductivity map of the tissue based on measurements from the MRI device.
- the processor is configured to execute programming (i.e., instructions) that causes the processor to generate a conductivity map of the tissue based on the measured concentration of the carrier ion and the measured water proton diffusivity as described herein.
- programming i.e., instructions
- the system includes one or more electronic devices configured to generate one or more frequencies, gradients and/or pulses for measuring the concentration of the carrier ion in the tissue.
- the frequencies, gradients and/or pulses may be generated by one or more electronic devices included in the MRI device.
- the electronic devices may include one or more magnets, such as electromagnets.
- the system can further include a data storage that is configured to store data.
- the data storage may be operably connected to the MRI device and/or the processor.
- the data storage is configured to store data measured by the MRI device, such as carrier ion concentration data, water proton diffusivity data, temperature data, and the like.
- the data storage is configured to store data, such as conductivity map data that is generated by the processor.
- the system can further include a user interface and a data connector that transmits data from the processor to the user interface.
- the user interface may include any convenient user interface, such as, for example, a display, a touchscreen display, a keypad, a keyboard, a mouse, combinations thereof, and the like. In some instances, the user interface is configured to accept user inputs from a user of the system.
- the user interface may be configured to accept user inputs, such as, but not limited to, commands to begin or end an assay, commands to measure the concentration of a carrier ion in a particular target tissue area, commands to measure the water proton diffusivity in a particular target tissue area, commands to generate a conductivity map of the target tissue, user inputs for naming an assay and/or data file(s), etc.
- the user interface may be operably connected to the MRI device and/or the processor, such as through a data connector that transmits data between the processor and the user interface.
- the system can be used to non-invasively generate a conductivity map of an in vivo tissue. Based on the generated conductivity map, the system may be configured to identify abnormal tissue within a target tissue in a living individual, as described above. As such, the system may be configured for localization of an abnormal tissue in an individual, where the abnormal tissue has a conductivity that differs from normal (non-diseased) tissue.
- Methods and systems of the present disclosure for generating a conductivity map of an in vivo tissue are useful for determining the conductivity of the target tissue non-invasively.
- the target tissue includes normal tissue.
- the target tissue includes abnormal tissue.
- the methods of the present disclosure are useful for localization of abnormal tissue (e.g., pathological tissue; diseased tissue), where the abnormal tissue has a conductivity that differs from normal (non-diseased) tissue.
- the subject methods and systems are useful for localization of epileptic lesions, for localization of a tumor, for localization of damaged tissue (e.g., damaged tissue resulting from ischemia caused by stroke or myocardial ischemia), localization of abnormal tissue caused by Alzheimer's disease, and localization of abnormal tissue caused by Parkinson's disease.
- damaged tissue e.g., damaged tissue resulting from ischemia caused by stroke or myocardial ischemia
- Alzheimer's disease e.g., Alzheimer's disease
- Parkinson's disease e.g., Parkinson's disease.
- methods and systems of the present disclosure are useful for non-invasively localizing a diseased tissue in a living individual.
- the methods and systems are useful for generating a conductivity map of the target tissue in the living individual, as described above, and, based on the conductivity map, localizing an area of abnormal conductivity.
- the methods and systems are useful for identifying and localizing an area of abnormal conductivity, such as a tumor, ischemic tissue, epileptic lesions, neurofibrillary tangles and/or amyloid plaques.
- the subject methods and systems find use in screening in vitro and/or in vivo animal models of disease for tissues (e.g., brain tissue or neurons) that are diagnostic of or causative for neuropsychiatric disease.
- tissues e.g., brain tissue or neurons
- the present methods and systems find use in diagnosis of neuropsychiatric diseases of interest, which may include disorders of mood and affect, anxiety, psychosis, personality, etc.
- the animal model may be any suitable model, including, but not limited to, rodents, cats, dogs, monkeys, and non-human primates.
- Perturbations used to model a neuropsychiatric disease include genetic models of neurological or psychiatric disease, such as autism; chronically induced models as with kainate or pilocarpine-induced epilepsy or chronic stress-induced depression; and acutely induced models as with hallucinogens or psychotogenic agents such as ketamine or phencyclidine (PCP).
- Genetic models of neurological or psychiatric disease such as autism; chronically induced models as with kainate or pilocarpine-induced epilepsy or chronic stress-induced depression; and acutely induced models as with hallucinogens or psychotogenic agents such as ketamine or phencyclidine (PCP).
- PCP ketamine or phencyclidine
- the present methods and systems find use in diagnostic methods for neuropsychiatric diseases, e.g., where the diagnosis is carried out on a human or non-human mammalian subject.
- the present methods and systems find use in identifying a treatment, e.g., a therapeutic treatment, with a desired activity on a target tissue (e.g., a brain tissue, such as a group of neurons). If the desired outcome is known, then the present system and method may be used to screen for treatments, including, but not limited to, pharmacological agents, nonchemical based therapeutic treatment; behavioral treatment; electrical, magnetic, or optical based neural-modulation treatment; etc., that will bring about the desired neuronal activity pattern.
- the screening may be performed in any suitable animal model, either normal, or a model for a neurological disorder, such as Alzheimer's and Parkinson's disease, mild cognitive impairment, other dementias, and Down's Syndrome, as well as schizophrenia, autism, mood, affective, anxiety, and personality/developmental disorders, and the like.
- a neurological disorder such as Alzheimer's and Parkinson's disease, mild cognitive impairment, other dementias, and Down's Syndrome, as well as schizophrenia, autism, mood, affective, anxiety, and personality/developmental disorders, and the like.
- the present methods and systems find use in the treatment of a condition or disorder, such as a neurological or psychiatric condition.
- a controller or processor may be configured to provide a treatment that modulates the activity of neurons in response to the generated conductivity map in such a way as to treat or reduce symptoms of the condition or disorder, at the behavioral and/or physiological levels.
- methods and systems of the present disclosure are useful for providing guidance for placement of deep brain stimulation (DBS) electrodes.
- DBS deep brain stimulation
- a conductivity map, generated as disclosed herein, allows for more precise placement of DBS electrodes.
- DBS is used in the treatment of a variety of disorders, including, e.g., Parkinson's disease, Alzheimer's disease, depression, dystonia, chronic pain, and epilepsy.
- the present disclosure provides methods and systems useful for treatments involving DBS treatment.
- the methods and systems of the present disclosure are useful for generating a conductivity map of a brain of an individual, as described above, which guides the placement of DBS electrodes in the brain using information from the conductivity map to place the electrodes in or near a desired target brain area (e.g., a brain area exhibiting abnormal conductivity).
- a desired target brain area e.g., a brain area exhibiting abnormal conductivity
- a variety of computer-related embodiments are also provided. Specifically, the data analysis methods described herein may be performed using a computer, e.g., a processor. Accordingly, provided is a computer-based system for analyzing data produced using the above methods and systems in order to provide qualitative and/or quantitative analysis of a target area of interest in a subject.
- the methods are coded onto a computer-readable medium in the form of “programming” or “instructions”, where the term “computer-readable medium” as used herein refers to any storage or transmission medium that participates in providing instructions and/or data to a computer for execution and/or processing.
- Examples of storage media include CD-ROM, DVD-ROM, BD-ROM, a hard disk drive, a ROM or integrated circuit, a magneto-optical disk, a solid-state memory device, a computer readable flash memory, and the like, whether or not such devices are internal or external to the computer.
- a file containing information may be “stored” on computer readable medium, where “storing” means recording information such that it is accessible and retrievable at a later date by a computer or processor.
- Non-transitory media e.g., physical media in which the programming is associated with, such as recorded onto or stored by, a physical structure.
- Non-transitory media for storing computer programming does not include electronic signals in transit via a wireless protocol.
- computer programming may include instructions for directing a computer to perform one or more assay steps as disclosed herein.
- the computer programming may include instructions for directing a computer to detect and/or analyze signals acquired by the devices disclosed herein (e.g., MRI and/or DT-MRI devices).
- the computer programming includes instructions for directing a computer to analyze the acquired signals qualitatively and/or quantitatively.
- Qualitative determination includes determinations in which a simple yes/no result is provided to a user with respect to the presence or absence of a detectable signal.
- Quantitative determination includes both semi-quantitative determinations in which a rough scale result, e.g., low, medium, high, is provided to a user regarding the detectable signal and fine scale results in which an exact measurement of the detectable signal is provided to a user (e.g., a quantitative measurement of carrier ion concentration and/or water proton diffusivity in a target area of interest).
- a rough scale result e.g., low, medium, high
- “permanent memory” refers to memory that is permanent, i.e., non-volatile memory. Permanent memory is not erased by termination of the electrical supply to a computer or processor. Computer hard-drive, CD-ROM, DVD-ROM, BD-ROM, solid state memory, flash memory, and holographic memory are all examples of permanent memory. Random Access Memory (RAM) is an example of non-permanent memory. A file in permanent memory may be editable and re-writable. Similarly, a file in non-permanent memory may be editable and re-writable.
- RAM Random Access Memory
- Standard abbreviations may be used, e.g., bp, base pair(s); kb, kilobase(s); pl, picoliter(s); s or sec, second(s); min, minute(s); h or hr, hour(s); aa, amino acid(s); kb, kilobase(s); bp, base pair(s); nt, nucleotide(s); i.m., intramuscular(ly); i.p., intraperitoneal(ly); s.c., subcutaneous(ly); and the like.
- the electrical conductivities of the freshly excised brain tissues were obtained using the four-electrode method (Schwann, Ann N Y Acad Sci. 1968, 148(1):191-209) as described previously (Akhtari et al., Brain Topogr. 2006, 18(4):281-290; Akhtari et al., Brain Topogr. 2010, 23(3):292-300).
- freshly excised brain tissue samples approximately 1 cm 3 in volume, were inserted inside a plastic cylindrical holder.
- the tissue axis perpendicular to the pial surface was placed along the long axis of the holder.
- J E J is the current density (encompassing the entire sample in the prescribed direction), and E is the electric field (Akhtari et al., Brain Topogr. 2006, 18(4):281-290; Akhtari et al., Brain Topogr. 2010, 23(3):292-300; Okada et al., J Neurophysiol. 1994, 72(2):742-753; Nicholson and Freeman, J Neurophysiol. 1975, 38(2):356-368).
- the lower bound of uncertainty (e.g., due to instrumentation) in conductivity measurements was calculated using:
- DT-MRI data were collected on a Siemens 1.5T (Avanto or Sonata) or 3T MR system (Trio or Verio) using either 6 or 12 directions.
- the 3 ⁇ 3 diffusion tensor was calculated using FSL's FDT toolbox (FMRIB; Oxford, UK).
- FMRIB FSL's FDT toolbox
- the eigenvalues ( ⁇ 1 , ⁇ 2 , ⁇ 3 ), ranked by their relative magnitude where ⁇ 1 was the largest, and eigenvectors (v 1 , v 2 , v 3 ) corresponding to the orientation of these eigenvalues were estimated from the diffusion tensor ( FIG. 3A ).
- the conductivity parameters were measured in directions parallel and perpendicular to the cortical surface.
- the DTI parameters computed from pre-surgical DT-MR images and in the same tissues used for conductivity measurements, showed the principal directions of tissue water proton diffusion in these tissues. These diffusion directions were determined inherently by the tissues and were measured in local voxels whose coordinates were defined in the MRI coordinate system.
- diffusivity (D) within a voxel was represented by the surface of an oblate ellipsoid contained within the individual voxel. This ellipsoid was defined by the major and minor axes of diffusivity.
- a centered plane, parallel to the cortical surface for the intended region of interest (ROI) was defined within individual ellipsoids.
- the intercept of the ellipsoid and the normal to this plane defined the diffusivity in the direction normal to the cortical surface (D ⁇ ).
- the maximum and minimum intercept distances with the ellipsoid parallel to this plane defined the diffusivities parallel to the ROI cortical surface (D ⁇ major and D ⁇ minor ).
- the resected gyri ROI were manually delineated on pre-operative T2 weighted scans by the attending neuroradiologist.
- the direction that the gyms was aligned along its apex was visually determined in the MRI coordinate system and recorded.
- the diffusion eigenvalues and eigenvectors for every voxel in the ROI were exported and evaluated using MATLAB (Mathworks Inc, USA).
- the diffusion tensor for each image voxel can be described in terms of a “diffusion ellipsoid model” that describes the three axes of the ellipsoid in terms of the diffusion eigenvalues ( FIG. 3B ):
- x′, y′, and z′ are a new coordinate system aligned with the axes of the diffusion ellipsoid described by the direction of the eigenvectors, ⁇ right arrow over (v) ⁇ 1 , ⁇ right arrow over (v) ⁇ 2 and ⁇ right arrow over (v) ⁇ 3 .
- the diffusivity measured parallel and perpendicular to the cortical surface was then defined according to the intersection of this diffusion ellipsoid with the plane defining the cortical surface, localized to the center of the ellipsoid ( FIG. 3C ).
- Vectors ⁇ right arrow over (r) ⁇ and ⁇ right arrow over (s) ⁇ define a plane with normal vector ⁇ right arrow over (n) ⁇ parallel to the cortical surface, and then the intersection of the diffusion ellipsoid and this plane resulted in an ellipse with major and minor axes defined by ⁇ right arrow over (a) ⁇ and ⁇ right arrow over (b) ⁇ , which describe diffusivity parallel to the cortical surface (Klein, Applied Mathematics. 2012, 3:1634-1640).
- the diffusivity measured parallel to the cortical surface was estimated as the average of the diffusion measurements along vectors ⁇ right arrow over (r) ⁇ and ⁇ right arrow over (s) ⁇ ( FIG. 3F ).
- Surgery consisted of 14 (58%) cases of cerebral hemispherectomy, five (21%) multi-lobar resections, and five (21%) cases of lobar/focal resections.
- Pre-surgery 20 patients had more than a seizure per day, and the other four were having weekly seizures.
- Post-surgery seizure outcomes were available on 22 (92%) patients, and 19 (86%) were seizure free.
- the values of the electrical conductivity in directions perpendicular ( ⁇ ) and parallel ( ⁇ ⁇ ) to the cortical surface are shown in FIG. 5 .
- the values of proton diffusion in directions perpendicular (D ⁇ ) and parallel (D ⁇ ) to the cortical surface are shown in FIG. 5 .
- the values of proton diffusion in parallel and perpendicular directions did not show significant anisotropy ( ⁇ 2 test, p>0.05).
- FIG. 7A perpendicular
- FIG. 7B parallel
- FIG. 7D DT-MRI diffusion perpendicular to the pial surface positively correlated with MRI diffusion parallel to the pia
- FIG. 7E Brain electrical conductivities and ratios ( FIG. 7E ) and MRI diffusivity parallel to the pial surface did not show significant correlation. Brain electrical conductivity and MRI diffusivity perpendicular to the pial surface did not show correlations. The ratios of MRI diffusivities did not correlate significantly with MRI diffusivity in direction perpendicular to the pial surface ( FIG. 7F ). No correlation was observed between the ratios of electrical conductivities ( ⁇ ⁇ / ⁇ , i.e., measure of anisotropy in conductivity) and electrical conductivity parallel to the pial surface or the ratio of MRI diffusivities (D ⁇ /D ⁇ , i.e., measure of anisotropy in diffusivity) ( FIG. 7E , FIG. 7G and FIG. 7H ).
- Transient-dc and frequency-dependent electrical conductivities were analyzed between blocking electrodes. This analysis was extended to measurements of ions' transport in freshly excised bulk samples of human brain tissue whose complex cellular structure produces blockages. The associated ionic charge-carrier density and diffusivity were consistent with local values for sodium cations determined non-invasively in brain tissue by MRI (NMR) and diffusion-MRI (spin-echo NMR). The characteristic separation between blockages was estimated to be about 450 microns.
- Metallic electrodes generally functioned as extrinsic impenetrable barriers to ions' flow.
- intrinsic barriers resulted from structural features of an inhomogeneous material that preclude the passage of ions on the time scale of a transport measurement.
- q, n and D respectively represent the carrier's charge, density and diffusion constant and E indicates the strength of the applied electric field.
- n ⁇ ( x , ⁇ ) n 0 ⁇ ( qEL / kT ) exp ⁇ ( qEL / kT ) - 1 ⁇ exp ⁇ ( qEx / kT ) .
- an electronic charge carrier confined to an isolated pair of a semiconductor's dopants comprises a well-known polarization center (Pollak and Geballe, Phys. Rev. 1961, 122:1742).
- a constant electric field shifted centers' confined charges.
- the conductivity associated with this polarization decreased after the electric field is applied as exp( ⁇ t/ ⁇ ), where ⁇ denotes the center's characteristic relaxation time (Pollak and Geballe, Phys. Rev. 1961, 122:1742; Emin, Phys. Rev. B. 1992, 46:9419).
- This two-center relaxation time was calculated with the master equations in terms of the rates with which a carrier moves between sites.
- a macroscopic sample whose mobile ions are confined by their inability to penetrate electrical contacts constitutes a macroscopic polarization center.
- a sufficiently small carrier density carriers' mutual interactions can be ignored and the two-center polarization current to account for multiple ionic carriers with multiple polarization distances can be generalized.
- the macroscopic specimen's relaxation can be described with the classical diffusion equation in terms of carriers' diffusion constant (Reichl, A Modern Course in Statistical Mechanics, University of Texas Press ( Austin ). 1980, Chapter 6. D).
- the relaxation time for interfacial conductivity produced by impenetrable electrodes decreases as the inter-electrode separation L is decreased.
- Temporal decay of the ionic conductivities of samples of gelatin gels doped with NaCl was observed. Relaxation times (10 2 -10 3 sec) were found to fall as the sample length and the associated inter-electrode separation L is reduced.
- the metallic electrodes functioned as extrinsic impenetrable barriers that dominated the temporal decay of the conductivity.
- the real part of the frequency-dependent ac conductivity corresponding to this temporally decaying current was obtained from the Fourier transforms of the current density and the strength of the applied electric field, J(t) and E, respectively:
- FIG. 11 displays a plot of Re[ ⁇ ( ⁇ )] versus ( ⁇ L 2 /2D) 1/2 .
- Re[ ⁇ ( ⁇ )] vanished in the dc limit, ⁇ 0, since carriers cannot penetrate the electrodes.
- Re[ ⁇ ( ⁇ )] remained finite at finite applied frequencies.
- Re[ ⁇ ( ⁇ )] manifested its strongest frequency dependence when ⁇ ⁇ 2D/L 2 .
- ⁇ >>2D/L 2 the frequency dependence of the measured conductivity weakened.
- the measured conductivity asymptotically approached the material's intrinsic dc conductivity ⁇ dc :
- the average Na + concentration measured in human brain tissue is about 2.4 ⁇ 10 25 m ⁇ 3 (about 40 mM) (Madelin et al., Scientific Reports. 2014, 4:4763).
- a similar average Na+ concentration was found in the brain tissue of healthy rats.
- the extracellular and intracellular concentrations of sodium reported for healthy rat brain tissue were 140 mM and 10 mM, respectively, with the extracellular volume fraction being ⁇ 0.2 (Goodman et al., Magnetic Resonance in Medicine. 2005, 53:1040).
- ions diffusing through intercellular fluid must navigate through a dense distribution of cells with diameters up to 40 ⁇ m (Sekino et al., Bioelectromagnetics. 2009, 30:489; Holsheimer, Exp. Brain Res. 1987, 67:402). All told, sodium cations would appear to diffuse among many cells in the brain's complex inhomogeneous medium before being effectively blocked.
- Conductivities ( ⁇ ) of 4 brain samples were measured immediately after intracranial excision of the brain samples while maintaining a temperature of 20° C.
- the preoperative apparent diffusion coefficient (ADC) values of the excised tissues were measured on preoperative diffusion tensor imaging (DTI) scans of the same patients.
- the sodium concentration values of the excised tissues were measured using inductively coupled plasma mass spectrometry (ICP-MS) in all tissues and using sodium MRI scans in 2 brain samples according to embodiments of the present disclosure.
- the sodium MRI scans were acquired while 2 plastic tubes containing saline solutions of 0.9% and 1.8% concentrations were inserted in the brain tissue samples.
- FIGS. 13A-13B show the sodium concentration scans as visualized by MRI.
- FIG. 13A shows a sodium MRI of Sample 1. Brain tissue is indicated by the large outer white circle. The top inner white circle indicates the saline sample with a concentration of 0.9%, and the bottom inner white circle indicates the saline sample with a concentration of 1.8%.
- FIG. 13A shows a sodium MRI of Sample 2. Brain tissue is indicated by the large outer white circle. The top inner white circle indicates the saline sample with a concentration of 0.9%, and the bottom inner white circle indicates the saline sample with a concentration of 1.8%.
- the sodium concentration of the tissue samples was calculated by comparing the tissue signal intensity with that of the known sodium concentration of the saline tubes.
- Table 1 shows the sodium concentrations obtained from the MRI scans and those obtained from ICP-MS, as well as measured apparent diffusion coefficient (ADC) values in both saline samples from Sample 1 and Sample 2, and also the measured and calculated conductivity values.
Abstract
Description
σ=(D n q 2)/kT
where σ is conductivity, D is the water proton diffusivity, n is the concentration of the carrier ion, q is the charge of the carrier ion, k is Boltzmann constant, and T is temperature in degrees Kelvin.
σ=(D n q 2)/kT
where σ is conductivity, D is the water proton diffusivity, n is the concentration of the carrier ion, q is the charge of the carrier ion, k is Boltzmann constant, and T is temperature in degrees Kelvin (K).
σ=(D n q 2)/kT
where σ is conductivity, D is the water proton diffusivity, n is the concentration of the carrier ion, q is the charge of the carrier ion, k is Boltzmann constant, and T is temperature in degrees Kelvin, as described herein.
J is the current density (encompassing the entire sample in the prescribed direction), and E is the electric field (Akhtari et al., Brain Topogr. 2006, 18(4):281-290; Akhtari et al., Brain Topogr. 2010, 23(3):292-300; Okada et al., J Neurophysiol. 1994, 72(2):742-753; Nicholson and Freeman, J Neurophysiol. 1975, 38(2):356-368). The lower bound of uncertainty (e.g., due to instrumentation) in conductivity measurements was calculated using:
where l≡inter-electrode distance, A≡electrode area, δR≡uncertainty in potential measurement, and δS≡uncertainty in current measurements, with the latter two adjusted for conformity of units (Beers, Introduction to the theory of error. Second Edition, Addison-Wesley Publishing (London). 1953). It was noted that δl is systematic within the repeated measurements of one sample, while δA is systematic within all measurements in all samples. These uncertainties were used to determine if the electrical conductivities perpendicular and parallel to the pial surface were statistically different indicating isotropy or anisotropy, using the chi-squared test.
where D⊥=|{right arrow over (q)}| is the water diffusivity measured perpendicular to the cortical surface (
where the semi-axes are defined as:
n(x,∞)=n eexp(qEx/kT),
where E3/2(x) designates the established exponential integral defined in Eq. (5.1.4) of Abramowitz and Stegun (1964), Handbook of Mathematical Functions, National Bureau of Standards Applied Mathematics Series 55. As illustrated in
| TABLE 1 | ||||||
| Milli molar | mM | |||||
| (mM) [Na] | [Na] | ADC m2/s × | σmeasured | |||
| MRI | ICPMS | 10−9 | (S/m) | σmodel | ||
| Sample 1 | 65 | 67 | 0.36 | 0.103 | 0.094 |
| (0.9% saline) | (0.0063) | ||||
| |
90 | 90 | 0.36 | 0.119 | 0.126 |
| (1.8% saline) | (0.0063) | ||||
| |
— | 65 | 0.65 | 0.235 | 0.240 |
| (0.9% saline) | (0.007) | ||||
| |
— | 67 | 0.65 | 0.210 | 0.247 |
| (1.8% saline) | (0.0069) | ||||
Claims (18)
σ=(D n q 2)/kT
σ=(D n q 2)/kT
Priority Applications (1)
| Application Number | Priority Date | Filing Date | Title |
|---|---|---|---|
| US15/233,448 US10197657B2 (en) | 2015-08-12 | 2016-08-10 | Methods and systems for generating a conductivity map of an in vivo tissue |
Applications Claiming Priority (2)
| Application Number | Priority Date | Filing Date | Title |
|---|---|---|---|
| US201562204271P | 2015-08-12 | 2015-08-12 | |
| US15/233,448 US10197657B2 (en) | 2015-08-12 | 2016-08-10 | Methods and systems for generating a conductivity map of an in vivo tissue |
Publications (2)
| Publication Number | Publication Date |
|---|---|
| US20170045601A1 US20170045601A1 (en) | 2017-02-16 |
| US10197657B2 true US10197657B2 (en) | 2019-02-05 |
Family
ID=57995682
Family Applications (1)
| Application Number | Title | Priority Date | Filing Date |
|---|---|---|---|
| US15/233,448 Active 2037-08-16 US10197657B2 (en) | 2015-08-12 | 2016-08-10 | Methods and systems for generating a conductivity map of an in vivo tissue |
Country Status (1)
| Country | Link |
|---|---|
| US (1) | US10197657B2 (en) |
Families Citing this family (9)
| Publication number | Priority date | Publication date | Assignee | Title |
|---|---|---|---|---|
| WO2019060298A1 (en) | 2017-09-19 | 2019-03-28 | Neuroenhancement Lab, LLC | Method and apparatus for neuroenhancement |
| US11717686B2 (en) | 2017-12-04 | 2023-08-08 | Neuroenhancement Lab, LLC | Method and apparatus for neuroenhancement to facilitate learning and performance |
| US11478603B2 (en) | 2017-12-31 | 2022-10-25 | Neuroenhancement Lab, LLC | Method and apparatus for neuroenhancement to enhance emotional response |
| US11364361B2 (en) | 2018-04-20 | 2022-06-21 | Neuroenhancement Lab, LLC | System and method for inducing sleep by transplanting mental states |
| WO2020056418A1 (en) | 2018-09-14 | 2020-03-19 | Neuroenhancement Lab, LLC | System and method of improving sleep |
| EP3911219A2 (en) * | 2019-01-14 | 2021-11-24 | Koninklijke Philips N.V. | Compartment-specific down-scaling of high-frequency conductivity to low-frequency conductivity for eeg |
| US11786694B2 (en) | 2019-05-24 | 2023-10-17 | NeuroLight, Inc. | Device, method, and app for facilitating sleep |
| CN112704486B (en) * | 2021-01-14 | 2021-10-26 | 中国科学院自动化研究所 | TMS coil pose map generation method based on electromagnetic simulation calculation |
| CN112819948B (en) * | 2021-02-05 | 2022-08-26 | 四川大学 | Reconstruction method and device of myocardial cell thin layer arrangement structure, computer equipment and computer readable storage medium |
Citations (7)
| Publication number | Priority date | Publication date | Assignee | Title |
|---|---|---|---|---|
| US20140184219A1 (en) * | 2012-12-28 | 2014-07-03 | Industry-Academic Cooperation Foundation, Yonsei University | Apparatus and method for conductivity and susceptibility reconstruction |
| US20140300354A1 (en) * | 2013-04-04 | 2014-10-09 | Bin He | Systems and methods for spatial gradient-based electrical property properties tomography using magnetic resonance imaging |
| US20150051475A1 (en) * | 2012-02-06 | 2015-02-19 | Koninklijke Philips N.V. | Temperature determination using b1 field mapping |
| US20160055304A1 (en) * | 2005-06-16 | 2016-02-25 | Aaken Laboratories | Targeted electrical stimulation |
| US20160305910A1 (en) * | 2015-04-17 | 2016-10-20 | Elwha Llc | Methods and system for performing magnetic induction tomography |
| US20170303991A1 (en) * | 2014-08-28 | 2017-10-26 | The Regents Of The University Of California | Monitoring Electrolysis |
| US20180011158A1 (en) * | 2015-01-21 | 2018-01-11 | Koninklijke Philips N.V. | Mri method for calculating derived values from b0 and b1 maps |
-
2016
- 2016-08-10 US US15/233,448 patent/US10197657B2/en active Active
Patent Citations (7)
| Publication number | Priority date | Publication date | Assignee | Title |
|---|---|---|---|---|
| US20160055304A1 (en) * | 2005-06-16 | 2016-02-25 | Aaken Laboratories | Targeted electrical stimulation |
| US20150051475A1 (en) * | 2012-02-06 | 2015-02-19 | Koninklijke Philips N.V. | Temperature determination using b1 field mapping |
| US20140184219A1 (en) * | 2012-12-28 | 2014-07-03 | Industry-Academic Cooperation Foundation, Yonsei University | Apparatus and method for conductivity and susceptibility reconstruction |
| US20140300354A1 (en) * | 2013-04-04 | 2014-10-09 | Bin He | Systems and methods for spatial gradient-based electrical property properties tomography using magnetic resonance imaging |
| US20170303991A1 (en) * | 2014-08-28 | 2017-10-26 | The Regents Of The University Of California | Monitoring Electrolysis |
| US20180011158A1 (en) * | 2015-01-21 | 2018-01-11 | Koninklijke Philips N.V. | Mri method for calculating derived values from b0 and b1 maps |
| US20160305910A1 (en) * | 2015-04-17 | 2016-10-20 | Elwha Llc | Methods and system for performing magnetic induction tomography |
Non-Patent Citations (1)
| Title |
|---|
| Emin, et al., Ionic charge transport between blockages: Sodium cation conduction in freshly excised bulk brain tissue, AIP Advances 5, 087133 (2015), 7 pages. |
Also Published As
| Publication number | Publication date |
|---|---|
| US20170045601A1 (en) | 2017-02-16 |
Similar Documents
| Publication | Publication Date | Title |
|---|---|---|
| US10197657B2 (en) | Methods and systems for generating a conductivity map of an in vivo tissue | |
| Makris et al. | Variability and anatomical specificity of the orbitofrontothalamic fibers of passage in the ventral capsule/ventral striatum (VC/VS): precision care for patient-specific tractography-guided targeting of deep brain stimulation (DBS) in obsessive compulsive disorder (OCD) | |
| Krieg et al. | Utility of presurgical navigated transcranial magnetic brain stimulation for the resection of tumors in eloquent motor areas | |
| Koessler et al. | In‐vivo measurements of human brain tissue conductivity using focal electrical current injection through intracerebral multicontact electrodes | |
| Rosenow et al. | Presurgical evaluation of epilepsy | |
| Lascano et al. | Yield of MRI, high-density electric source imaging (HD-ESI), SPECT and PET in epilepsy surgery candidates | |
| Stufflebeam et al. | Localization of focal epileptic discharges using functional connectivity magnetic resonance imaging | |
| Bello et al. | Tailoring neurophysiological strategies with clinical context enhances resection and safety and expands indications in gliomas involving motor pathways | |
| Forster et al. | Navigated transcranial magnetic stimulation and functional magnetic resonance imaging: advanced adjuncts in preoperative planning for central region tumors | |
| Lee et al. | Regional electric field induced by electroconvulsive therapy in a realistic finite element head model: influence of white matter anisotropic conductivity | |
| Coenen et al. | Diffusion tensor imaging and neuromodulation: DTI as key technology for deep brain stimulation | |
| Kamada et al. | Functional monitoring for visual pathway using real-time visual evoked potentials and optic-radiation tractography | |
| Lai et al. | Functional MRI reveals frequency-dependent responses during deep brain stimulation at the subthalamic nucleus or internal globus pallidus | |
| Moayedi et al. | Connectivity-based parcellation of the human frontal polar cortex | |
| Elias et al. | Validation of connectivity-based thalamic segmentation with direct electrophysiologic recordings from human sensory thalamus | |
| Coburger et al. | Comparison of navigated transcranial magnetic stimulation and functional magnetic resonance imaging for preoperative mapping in rolandic tumor surgery | |
| Numssen et al. | Efficient high-resolution TMS mapping of the human motor cortex by nonlinear regression | |
| Lee et al. | Electric field model of transcranial electric stimulation in nonhuman primates: correspondence to individual motor threshold | |
| Mohseni et al. | MEG can map short and long-term changes in brain activity following deep brain stimulation for chronic pain | |
| US20040096395A1 (en) | Using magnetic resonance imaging to directly map neuronal activity | |
| Gomez-Tames et al. | Intraoperative direct subcortical stimulation: comparison of monopolar and bipolar stimulation | |
| Hefft et al. | Safety of hybrid electrodes for single-neuron recordings in humans | |
| Zhang et al. | The effectiveness of cortico-cortical evoked potential in detecting seizure onset zones | |
| JP7361732B2 (en) | System and method for estimating physical parameters of media | |
| Unnwongse et al. | Validating EEG source imaging using intracranial electrical stimulation |
Legal Events
| Date | Code | Title | Description |
|---|---|---|---|
| AS | Assignment |
Owner name: NATIONAL INSTITUTES OF HEALTH (NIH), U.S. DEPT. OF Free format text: CONFIRMATORY LICENSE;ASSIGNOR:UNIVERSITY OF CALIFORNIA LOS ANGELES;REEL/FRAME:041011/0610 Effective date: 20161213 |
|
| AS | Assignment |
Owner name: THE REGENTS OF THE UNIVERSITY OF CALIFORNIA, CALIF Free format text: ASSIGNMENT OF ASSIGNORS INTEREST;ASSIGNOR:AKHTARI, MASSOUD;REEL/FRAME:042692/0820 Effective date: 20170506 |
|
| STCF | Information on status: patent grant |
Free format text: PATENTED CASE |
|
| MAFP | Maintenance fee payment |
Free format text: PAYMENT OF MAINTENANCE FEE, 4TH YR, SMALL ENTITY (ORIGINAL EVENT CODE: M2551); ENTITY STATUS OF PATENT OWNER: SMALL ENTITY Year of fee payment: 4 |