US10169223B2 - Identifying commits associated with failed tests - Google Patents
Identifying commits associated with failed tests Download PDFInfo
- Publication number
- US10169223B2 US10169223B2 US15/491,542 US201715491542A US10169223B2 US 10169223 B2 US10169223 B2 US 10169223B2 US 201715491542 A US201715491542 A US 201715491542A US 10169223 B2 US10169223 B2 US 10169223B2
- Authority
- US
- United States
- Prior art keywords
- commit
- file
- commits
- failed test
- test
- Prior art date
- Legal status (The legal status is an assumption and is not a legal conclusion. Google has not performed a legal analysis and makes no representation as to the accuracy of the status listed.)
- Active
Links
Images


Classifications
-
- G—PHYSICS
- G06—COMPUTING; CALCULATING OR COUNTING
- G06F—ELECTRIC DIGITAL DATA PROCESSING
- G06F11/00—Error detection; Error correction; Monitoring
- G06F11/36—Preventing errors by testing or debugging software
- G06F11/3668—Software testing
- G06F11/3672—Test management
- G06F11/3692—Test management for test results analysis
-
- G—PHYSICS
- G06—COMPUTING; CALCULATING OR COUNTING
- G06F—ELECTRIC DIGITAL DATA PROCESSING
- G06F8/00—Arrangements for software engineering
- G06F8/70—Software maintenance or management
- G06F8/71—Version control; Configuration management
Definitions
- the codebase is the set of source code files from which the end product is created.
- the process of creating the end product which can also be referred to as building the end product or a build, may vary based on the type of codebase.
- the end product may be created by compiling and linking the source code files or by arranging and packaging the files into a package that is later executed by an interpreter. What should be understood is that the functionality of the end product is defined by the code base.
- FIG. 1 is an example of a system that may utilize the identifying commits associated with failed tests techniques described herein.
- FIG. 2 is an example of build related data that may be stored and utilized by the techniques described herein.
- FIG. 3 is an example of commit related data that may be stored and utilized by the techniques described herein.
- FIG. 4 is an example of the file usage data maintained by the training model utilizing the techniques described herein.
- FIG. 5 is an example of the pairwise file data maintained by the training model utilizing the techniques described herein.
- FIG. 6 is an example of the test associated data maintained by the training model utilizing the techniques described herein.
- FIG. 7 is an example of using the model training data from FIGS. 2-6 to identify commit associated with failed tests according to the techniques described herein.
- FIG. 8 is an example of a high level flow diagram for training a model according to the identifying commits associated with failed tests techniques described herein.
- FIG. 9 is another example of a high level flow diagram for training a model according to the identifying commits associated with failed tests techniques described herein.
- FIG. 10 is an example of a high level flow diagram of using a trained model to identify commits associated with failed tests based on the techniques described herein.
- the end product may be periodically built by including all of the commits submitted by developers working on the codebase.
- the created end product may initially go through some regression tests to ensure that the newly submitted commits did not introduce error, often referred to as bugs, to the code base.
- the regression tests may be fully automated and do not require the input of human testers. In other cases, the tests may be manual, or a combination of manual and automatic tests. Should one of the regression tests fail, that indicates that functionality that was previously working has been broken. Given the complexity of current software, there may be the possibility that something in a developer commit introduced the error.
- Each build may contain any number of commits. Each commit has the potentially for being the cause of the failed test(s). Determining the specific commit that caused a particular test to fail may be a very difficult task requiring large amounts of developer/tester time that may be better utilized on other tasks. Once the source of the error has been determined, an additional commit may be submitted to fix the error.
- the techniques described herein provide a mechanism to automate the process of determining which commit may have caused a test failure. As mentioned above, a pattern may exist where an error is introduced with one commit, and is later fixed in a second commit. The techniques described herein utilize this relationship to create a model and then use the model to determine commits that cause test failures.
- the techniques described herein generally have two phases.
- a model is created based on historical build data. This historical data is analyzed to identify pairs of commits that may be related as part of a test error/test fix pair.
- the pairs of commits are identified using heuristics that are described in further detail below.
- For each failed test the files included in the identified pair of commits are logged as associated with the failed test.
- a count of the number of times each file appears in any commit is maintained.
- a pairwise count of the number of times a file appears in a commit with all other files is maintained.
- the model that was created in the first phase is used to aid in the identification of commits that cause test failures.
- a score is calculated for each commit in a build that includes a test failure.
- the score for the commit is determined based on the model. A portion of the score is determined by how often failure of the particular test is associated with each file appearing in the commit. Another portion of the score is determined by how often each file in the commit appears with other files that are associated with failures of the test, even though the file itself is not associated with the failure of the test.
- the scores for each commit may be ordered. Commits with higher scores may be more likely to be the source of the failed test. Although this result is not guaranteed to be correct, it will at least allow developers to begin their search for a fix of the failed test with the commits that are most likely to have caused the failure.
- FIG. 1 is an example of a system that may utilize the identifying commits associated with failed tests techniques described herein.
- System 100 may include a processor 110 , a non-transitory processor readable medium 130 containing processor executable instructions thereon, and a data store 150 .
- the processor may be any type of device that is capable of executing instructions in order to implement the techniques described herein.
- the processor may be a central processing unit (CPU), a graphics processing unit (GPU), an application specific integrated circuit (ASIC) or any other device capable of executing instructions stored on a processor readable medium.
- CPU central processing unit
- GPU graphics processing unit
- ASIC application specific integrated circuit
- the non-transitory processor readable medium 130 may include a set of processor executable instructions thereon. These instructions may be executed by the processor to implement the techniques described herein.
- the medium may include model training phase instructions 132 to create a model from build data. The model may be used in later predictions of which commit caused a test to fail.
- the operation of model training phase instructions 132 are described below and in the flow diagrams and in the remaining figures.
- the model training phase flow diagrams depicted in FIGS. 8 and 9 may be an implementation of model training phase instructions.
- the non-transitory medium 130 may also include prediction phase instructions 134 .
- the operation of the prediction phase instructions are described below and in the flow diagram depicted in FIG. 10 .
- the system 100 may also include a data store 150 .
- the particular form of the data store is relatively unimportant.
- the data store may be a database.
- the data store may be a relational database, and object database, a key-value store, or any other mechanism for data storage.
- the data store may be a file based data store.
- the data store may be a block based data store. What should be understood is that any device capable of storing data is suitable for use with system 100 .
- the data store 150 may store the codebase of the software product that is utilizing the commit identification techniques described herein.
- the data store may store all of the source files of the software product.
- the data store may also store build data, which may include information about previous builds and the results of any regression testing performed on those builds.
- the data store may also include information related to the commits that were submitted by developers.
- the data store may also store data related to the files that were included in the commits as well as the relationships those files have with other files as well as with failed tests. Examples of the data are presented in the next figures to aid in description of the techniques described herein.
- system 100 as processor based is just an example.
- the techniques described herein are not limited to processor based systems that execute instructions.
- the techniques described herein are equally applicable to systems created using discrete logic and hard coded circuitry.
- the logic may be embodied in the form of an application specific integrated circuit (ASIC), as a field programmable gate array (FPGA), a programmable logic device (PLD), or any other form of logic circuitry.
- ASIC application specific integrated circuit
- FPGA field programmable gate array
- PLD programmable logic device
- FIG. 2 is an example of build related data that may be stored in data store 150 and utilized by the techniques described herein.
- Each build may include an identification of the commits that were included in the build.
- the build data may also include an indication of any regression tests that failed to execute properly for the build. As mentioned above, a failed test may indicate that something in a commit introduced an error into the codebase.
- build 1 includes 5 commits with identifiers 101 , 103 , 105 , 107 and 109 .
- the commit identifiers are merely examples to allow each particular commit, and the files and associated data for that commit to be identified.
- Build 2 includes 3 commits, with identifiers 111 , 112 , 113 .
- Build 3 may have 1 commit, identified as commit 120 .
- Build 3 may have no test failures. As such, it is likely that the codebase change made in commit 120 may have repaired the codebase change that caused the error in build 2 .
- the techniques described herein are not dependent on such an easy identification of a commit that fixes a failing test. The techniques described herein are statistical in nature and can be applied even in cases where it is not as easy to determine the relationship between a failed test and the commit that fixed the failure.
- Build 4 may have 2 commits, identified as 130 , 131 and no test failures.
- Build 5 may have 2 commits 150 , 151 , and no failures.
- Build 6 may have 3 commits, 170 , 171 , 172 and 2 failed tests.
- the failing test names may be “Test TTT” and “Test MMM.”
- FIG. 3 is an example of commit related data that may be stored and utilized by the techniques described herein. As described with respect to FIG. 2 each build may include certain commits. FIG. 3 depicts an example of some of the information that may be associated with commits. This commit data may be stored in data store 150 .
- the commit related data may include a commit identifier, which in this example is noted by the column “#” and is shown as a numeric value. However, it should be understood that this is merely for purpose of description. The techniques described herein are suitable for use with any type of identifier that can individually identify a commit.
- the commit related data may also include a committer name, as indicated by the “name” column.
- the committer name may be the name of the developer that is submitting the commit.
- the commit related data may include a committer team, as indicated by the “Team” column, which in this example lists Red, Blue, and Yellow teams.
- Software developers are often organized into teams to work on related features. Thus, it may be possible that persons working on the same feature are working on the same areas of functionality in the codebase.
- the commit related data may also include what may be referred to as a commit message, as designated by the “message” column.
- a commit message may be a line of descriptive text that is associated with the contents of the commit. For example, the commit message might recite a particular feature that is associated with a commit. The commit message may also indicate that a particular commit is associated with a bug fix for a feature. The techniques described herein are not limited to any particular content in a commit message.
- the commit related data may include the particular files that were part of the commit (i.e. the files modified by that particular commit) as denoted by the “Files” column.
- commit data need only include some way of identifying commits, an indication of which files are included in the commit, and data for relating the commits to each other via a heuristic of some type. Various types of heuristic will be described below.
- FIG. 4 is an example of the file usage data maintained by the training model utilizing the techniques described herein.
- the training model includes a table that keeps track of the number of times a file appears in any given commit. Because a file cannot appear in a single commit more than once, the numeric range for the number of appearances ranges from 0 (i.e. file is not included in any commit) to the total number of commits (i.e. file is included in every commit). Use of this data is described in further detail below. Although specific file names and counts are used, it should be understood that this is not intended to reflect actual data but is being used for purposes of explanation.
- FIG. 5 is an example of the pairwise file data maintained by the training model utilizing the techniques described herein.
- the training model includes a table that keeps track of the number of times each file appears with any other file in the same commit. For example, if the files a.java and b.java are included in the same commit (e.g. commit 111 shown in FIG. 3 ) then the count for the combination a.java and b.java will be incremented by 1. Use of this data is described in further detail below. Although specific file names and counts are used, it should be understood that this is not intended to reflect actual data but is being used for purposes of explanation.
- FIG. 6 is an example of the test associated data maintained by the training model utilizing the techniques described herein.
- the training model For each regression test that can be executed on the product, the training model maintains a table that include a count on the files that are associated with commits that may have caused the test to fail or may have provided a fix to the failing test.
- a build includes one commit, containing two files, a.java and b.java, that causes “Test TTT” to fail.
- the very next build may also include a single commit, which includes the file a.java, and includes no failed tests. Presumably these two commits are related, at minimum by virtue of the heuristic that they contain at least one file in common.
- the training model may identify the two commits as a pair, due to the heuristic that there is file commonality between the commits.
- all files that were included in either commit are associated with failing “Test TTT.”
- the entry associated with “Test TTT” would include an indication that file a.java and b.java were present, and their count would be 1 each.
- a first build may include a commit that included file a.java and caused “Test TTT” to fail.
- a second build may have included a commit containing files a.java and c.java, and did not cause a failure on “Test TTT.” Given the heuristic that file commonality is a mechanism for identifying pairs of commits, the counts of the record associated with “Test TTT” may be modified.
- the file a.java may have its count incremented, because this is the second time that the file a.java has appeared in a pair of commits that was associated with a failure of “Test TTT.”
- File c.java may then also be associated with the failing “Test TTT” and its count set to 1, because this is the first time it has appeared.
- File commonality has is one heuristic that may be used to identify pairs of commits that are associated with an introduction of an error in one commit and a correction of that error in a second commit.
- Other heuristics may be used as well.
- the committer name may be used to identify pairs of commits. For example, if a commit was submitted by committer “Bob” caused a “Test MMM” to fail in a given build and a later build also contained a commit by “Bob” that did not cause the same test failure, the two commits may be considered to be a pair. “Test MMM” may then be associated with all the files that are included in the two commits.
- Yet another heuristic that may be used is the committers team. Just as the above example of committer “Bob” causes identification of a pair of commits, a similar heuristic involving the committers team may also be used.
- Yet another heuristic that may be used could be the area of the product that the test covers. Assume that “Test TTT” covers some defined functionality, commits that include files associated with that functionality could be considered related. Another example of a heuristic that may be used is the area of the product that is related to the commit. Another example of heuristic that may be used are commonality of the commit message. Consider a commit message that says “Code submission for feature Alpha” and another commit that has a commit message that says “Bug Fix:Code submission for feature Alpha.” These two commits should likely be identified as a pair. Existing string commonality algorithms may be used to identify similarity in commit messages. Other examples of heuristics that may be used may include files extensions, file extensions of the test file, file extensions of the committed files, or any other mechanism that may be used to identify pairs of commits.
- heuristics for identifying two commits as belonging to a pair may include same committer name plus greater than 50% file commonality.
- Another example may be same committer team with 90% similarity in the commit message.
- the techniques described herein are not limited to any specific heuristic or combination of heuristics for identifying pairs of commits.
- the system 100 will periodically update the training model by examining the build data.
- the system will update the counts of files included in commits and the pairwise presence of files as described in FIGS. 4 and 5 . It should be understood that system 100 need not start from the beginning of the build sequences when updating file counts. Instead, the system can update the file counts by examining only the builds that have occurred since the last update of the training model.
- the system 100 can update the failing test data as shown in FIG. 6 .
- the system can identify sequences of builds that cause a test to fail and a subsequent build that causes the test to pass. Once these builds have been identified, pairs of commits can be identified by using the heuristics that are described above. Once those pairs of commits are identified, the files included in those commits can be associated with the failing test, with a count maintained for the number of pairs of commits that were associated with that file.
- FIGS. 2-6 are intended for purposes of description only.
- the actual numbers, file names, build data, and commit data are not intended to depict an actual implementation, but rather are for purposes of description.
- the preceding description described the model training phase of the techniques described herein.
- the model training phase occurs periodically.
- the model training phase can occur upon completion of every build, every defined number of builds, every hour, every day, every week, or any other period. What should be understood is that as additional build and failing test data is obtained, the model is updated to incorporate that new information.
- the model may be used in a prediction phase.
- a new build may compete, and that build may fail one or more regression tests.
- the build may include one or more commits. For each commit, a score may be calculated. The score may determine the likelihood that the specific commit was the source of the failed test. The score is based on the training model that was previously described.
- the score assigned to each commit is based on the files included in the commit.
- Each file in the commit that has been previously associated with the failing test is given a weighting factor. For example, assume a build is completed and test TTT failed. As shown in FIG. 6 , Test TTT has been previously associated with files a.java, b.java, and d.java.
- a weighting factor may be assigned to each commit that includes one of the files that has been previously associated with the failing test.
- the weighting factor may be based on a term frequency—inverse document frequency (TF-IDF) metric.
- TF-IDF term frequency—inverse document frequency
- the term frequency (TF) portion is calculated first.
- the IDF portion may then be calculated.
- the TF and IDF portions may then be multiplied to calculate the TF-IDF metric, which may then be used as the weighting factor.
- K is a constant that ranges from 0-1
- f is a count of the number of times the file has been previously associated with the failed test, as retrieved from the table similar to the one depicted in FIG. 6
- max file is a count of the file with highest number of previous associations with the failed test.
- K may be set to the value of 0.
- the TF value indicates how often the particular file is associated with the test failing in relation to the file that has been associated with the test failing the largest number of times.
- IDF log(TESTS/Tests file ) (eq. 2)
- TESTS is the total number of tests possible
- Tests file is the total number of tests that have been previously associated with this file. What should be clear is that as a file is associated with more and more tests, the IDF value is reduced (due to the log function) because the file becomes less valuable in predicting the commit that caused the test failure. At the limit, if a file is associated with every possible test, then the IDF value would be 0, as the file would provide no predictive value.
- the TF-IDF value is calculated for each file that was included in the commit. This covers the case where a test failure and a file have a direct relationship (e.g. something included in the file caused the test to fail).
- the file included on in the commit has an indirect relationship with failed test. For example, consider a case where the failed test is associated with file a.java only. Assume that the commit only contains file c.java. However, assume that based on the pairwise file data (e.g. the type of data maintained in FIG. 5 ) file a.java and c.java appear together very often in commits. Thus, even though the file a.java does not appear in the commit, the presence of the file c.java may indicate a relationship with the failed test.
- a dice metric may be used.
- freq(f 1 ,f 2 ) is the number of times the file in question appears with one of the files that has been previously associated with the failing test (i.e. the data maintained as shown in FIG. 5 )
- freq(f x ) is the number of times the file appears across all commits (i.e. the data maintained as shown in FIG. 4 ). It should be understood that for each file in a commit that has not been previously associated with a failed test, that there will be multiple dice metrics calculated, with one for each file that has been previously associated with the failed test. The maximum value of the calculated dice metrics may be associated with the file that appears in the commit but has not been previously associated with the failed test.
- the prediction phase may be better understood by way of example.
- the numerical values contained in tables 2-6 represent actual data from a model that has been previously trained. The example will be described below.
- FIG. 7 is an example of using the model training data from FIGS. 2-6 to identify commit associated with failed tests according to the techniques described herein.
- the new build includes 3 commits, commit 201 , 301 , and 401 .
- Commit 201 includes files a.java, b.java, and c.java
- commit 301 includes files c.java
- commit 401 includes file e.java, as shown in element 720 .
- Test TTT is associated with three files (counts of previous association with failed test TTT), a.java (5), b.java(3) and c.java(1). The process then proceeds to compute a metric for each of the commits that were included in build 7 .
- the first commit is commit 201 .
- file b.java has been associated with failing test TTT 3 times, and that the maximum number of times any file has been associated with failing test TTT is file a.java at 5 times.
- the TF function is 3/5.
- the table shown in FIG. 6 indicates that the file b.java is associated with 2 tests (Test TTT and Test MMM).
- the calculation shown for the IDF function is log (6/2).
- the resultant TF-IDF value is 0.286.
- File c.java is not associated with failing test TTT, and as such, there is no direct relationship. However, there may be an indirect relations as will be computed by the dice metric.
- the computation of the dice value for the files follows equation 3. As shown, file c.java is not associated with failing test. What is calculated is the dice value for the appearance of file c.java with each file that is associated with the failing test TTT. As shown, the dice value for (a.java, c.java), (b.java, c.java) and (d.java, c.java) will be calculated according to equation 3 and the data shown in FIGS. 4 and 5 . The maximum value of this calculation(0.909) is selected and this weighting factor is associated with file c.java. The weighting factors for all files in commit 201 are then added to arrive at a score of 1.973 that is then assigned to commit 201 .
- commit 301 A similar process happens for commit 301 .
- commit 301 only includes file c.java.
- file c.java is not associated with test TTT.
- the dice metric may be calculated.
- the dice metric calculation for file c.java in commit 301 is the same that of the dice metric computed for commit 201 (i.e. 0.909) and the description will not be repeated here. Because there are no other files associated with commit 301 , the score of 0.909 is assigned to commit 301 as shown in element 740 .
- Element 750 depicts the computation of the score for commit 401 .
- Commit 401 includes only file e.java. As shown in FIG. 6 , file e.java has not been previously associated with failing test TTT, and as such, no TF-IDF weighting can be computed. Likewise, based on the table shown in FIG. 5 , file e.java does not appear with any other file that has been previously associated with failing test TTT (e.g. file e.java never appears in any commit with any of files a.java, b.java, or d.java). As such, the dice computation for file e.java and test TTT is 0. The resulting score of commit 401 is thus 0.
- the scores assigned to each commit may then be ordered.
- commit 201 has the highest score and is thus ordered first.
- Commit 301 has the second highest score and may be ranked second.
- Commit 401 has the lowest score and may be ranked last. Because a higher score indicates a greater probability that a commit is associated with a test failure, a developer may wish to examine commit 201 as the source of the failure of test TTT first. If it turns out that commit 201 was not the cause of the test failure, the developer may move to the next lower ordered commit.
- the techniques described herein are not guaranteed to always identify the commit that caused a particular test to fail, they do at least point the developer to the most likely culprit, thus relieving the developer of the need to randomly guess which commit caused the test to fail.
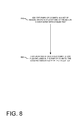
- FIG. 8 is an example of a high level flow diagram for training a model according to the identifying commits associated with failed tests techniques described herein.
- pairs of commits in a set of builds may be identified. At least one of the builds may be associated with a failed test.
- build data is examined to build a model. That model may be used later in a prediction process that may be used to help identify commits that caused a test to fail.
- the files included in the pair of commits may be logged.
- the logging may be associated with the failed test.
- a list of files that may be associated with the test is maintained.
- the files may be identified by the files that are included in commits that were determined to be related and also related to the failed test.
- FIG. 9 is another example of a high level flow diagram for training a model according to the identifying commits associated with failed tests techniques described herein.
- pairs of commits may be identified.
- the files included in the pairs of commits and associated with a failing test may be logged.
- Identifying pairs of commits may further comprise determining commits that are related using a heuristic.
- a heuristic any number of heuristics may be used.
- commonality of committer file commonality between commits, commonality of the commit message, or any number of other heuristics, such as those mentioned above.
- the heuristic may be a combination of heuristics.
- a combined heuristic may be commits form the same committer that have at least 50% file commonality.
- the techniques described herein are not limited to any particular type or combination of heuristics.
- the files contained in the pair of commits may be logged.
- the log may be associated with the failed test.
- a count of the number of times a file appears in any commit in the set of builds may be maintained.
- the total number of times a file is included in any build may be used as part of the dice algorithm that may be used to weight files that are not directly associated with the failed test.
- a pairwise count of the number of time each file appears with any other file in the same commit in the set of builds may be maintained.
- a file may have an indirect relationship with a failed test. Thus, even though the file may itself not directly appear in a commit, it may often appear with other files which themselves may be associated with failed tests.
- FIG. 10 is an example of a high level flow diagram of using a trained model to identify commits associated with failed tests based on the techniques described herein.
- a build which includes a failed test may be identified. For example, this could be a build that may contain numerous commits. One of those commits may have been the one that caused a test to fail.
- the techniques described herein aid in identifying the commit that caused the test to fail.
- block 1020 it may be determined if all commits have been assigned a score. As described above, a score is computed for the files included in each commit. This score may be used to identify the commit that cause the test to fail. If there are no more commits to assign a score, the process moves to block 1060 . If there are still commits that have not been assigned a score, the process moves to block 1030 .
- a weighting factor may be calculated.
- the weighting factor may be based on the number of times the file has been associated with the failed test and a total number of tests.
- the weighting factor may be based on a TF-IDF metric.
- the TF part of the metric may be based on a double normalization K scheme.
- the IDF part of the metric may be based on a log based inverse document frequency scheme.
- a weighting factor may be calculated for each file in the commit that has not been previously associated with the failed test.
- the weighting factor may be based on the number of times the file appears with other files that are associated with the failing test. As mentioned above, there can be an indirect relationship with a test failure and a file such that even though a particular file may not be directly associated with a failed test, it may be associated with another file that is associated with the failed test. Depending on how strong the correlation is, the file may still be implicated in causing the test to fail.
- the waiting factors computed for in block 1030 and 1040 may be added.
- the result of the computation may be assigned to the commit as a score for the commit.
- the process then returns to block 1020 to determine if there are more commits to process.
- the process moves to block 1060 .
- the scores for the commits are ordered. The higher the score of the commit, the more likely the commit was the cause of the failed test.
Abstract
Description
TF=K+(1−K)f/maxfile (eq. 1)
IDF=log(TESTS/Testsfile) (eq. 2)
dice(f 1 ,f 2)=(2*freq(f 1 ,f 2))/(freq(f 1)+freq(f2)) (eq. 2)
Claims (20)
Priority Applications (1)
| Application Number | Priority Date | Filing Date | Title |
|---|---|---|---|
| US15/491,542 US10169223B2 (en) | 2017-04-19 | 2017-04-19 | Identifying commits associated with failed tests |
Applications Claiming Priority (1)
| Application Number | Priority Date | Filing Date | Title |
|---|---|---|---|
| US15/491,542 US10169223B2 (en) | 2017-04-19 | 2017-04-19 | Identifying commits associated with failed tests |
Publications (2)
| Publication Number | Publication Date |
|---|---|
| US20180307593A1 US20180307593A1 (en) | 2018-10-25 |
| US10169223B2 true US10169223B2 (en) | 2019-01-01 |
Family
ID=63854500
Family Applications (1)
| Application Number | Title | Priority Date | Filing Date |
|---|---|---|---|
| US15/491,542 Active US10169223B2 (en) | 2017-04-19 | 2017-04-19 | Identifying commits associated with failed tests |
Country Status (1)
| Country | Link |
|---|---|
| US (1) | US10169223B2 (en) |
Families Citing this family (2)
| Publication number | Priority date | Publication date | Assignee | Title |
|---|---|---|---|---|
| US11347629B2 (en) * | 2018-10-31 | 2022-05-31 | Dell Products L.P. | Forecasting a quality of a software release using machine learning |
| US11809859B2 (en) * | 2021-03-25 | 2023-11-07 | Kyndryl, Inc. | Coordinated source code commits utilizing risk and error tolerance |
Citations (4)
| Publication number | Priority date | Publication date | Assignee | Title |
|---|---|---|---|---|
| US20130152047A1 (en) | 2011-11-22 | 2013-06-13 | Solano Labs, Inc | System for distributed software quality improvement |
| US20160034270A1 (en) * | 2014-08-01 | 2016-02-04 | Microsoft Corporation | Estimating likelihood of code changes introducing defects |
| US9292688B2 (en) | 2012-09-26 | 2016-03-22 | Northrop Grumman Systems Corporation | System and method for automated machine-learning, zero-day malware detection |
| US20180067740A1 (en) * | 2016-01-07 | 2018-03-08 | International Business Machines Corporation | Efficient detection of architecture related bugs during the porting process |
-
2017
- 2017-04-19 US US15/491,542 patent/US10169223B2/en active Active
Patent Citations (4)
| Publication number | Priority date | Publication date | Assignee | Title |
|---|---|---|---|---|
| US20130152047A1 (en) | 2011-11-22 | 2013-06-13 | Solano Labs, Inc | System for distributed software quality improvement |
| US9292688B2 (en) | 2012-09-26 | 2016-03-22 | Northrop Grumman Systems Corporation | System and method for automated machine-learning, zero-day malware detection |
| US20160034270A1 (en) * | 2014-08-01 | 2016-02-04 | Microsoft Corporation | Estimating likelihood of code changes introducing defects |
| US20180067740A1 (en) * | 2016-01-07 | 2018-03-08 | International Business Machines Corporation | Efficient detection of architecture related bugs during the porting process |
Non-Patent Citations (2)
| Title |
|---|
| Brun, Y. et al.; Finding Latent Code Errors via Machine Learning Over Program Executions; https://homes.cs.washington.edu/˜mernst/pubs/machlearn-errors-icse2004.pdf; May 23-28, 2004; 11 pages. |
| Mathur, R. et al; Adaptive Automation: Leveraging Machine Learning to Support Uninterrupted Automated Testing of Software Applications; https://arxiv.org/pdf/1508.00671.pdf ; Aug. 4, 2015; 6 pages. |
Also Published As
| Publication number | Publication date |
|---|---|
| US20180307593A1 (en) | 2018-10-25 |
Similar Documents
| Publication | Publication Date | Title |
|---|---|---|
| US9552274B2 (en) | Enhancements to logging of a computer program | |
| Lachmann et al. | System-level test case prioritization using machine learning | |
| US9471470B2 (en) | Automatically recommending test suite from historical data based on randomized evolutionary techniques | |
| US9052980B2 (en) | Exception based quality assessment | |
| US9529700B2 (en) | Method of optimizing execution of test cases and a system thereof | |
| Servant et al. | WhoseFault: automatic developer-to-fault assignment through fault localization | |
| EP3816806B1 (en) | Utilizing neural network and artificial intelligence models to select and execute test cases in a software development platform | |
| US8856725B1 (en) | Automated source code and development personnel reputation system | |
| Heckman et al. | A model building process for identifying actionable static analysis alerts | |
| US8719789B2 (en) | Measuring coupling between coverage tasks and use thereof | |
| US20210286708A1 (en) | Method and electronic device for recommending crowdsourced tester and crowdsourced testing | |
| CN110515826B (en) | Software defect positioning method based on frequency spectrum and neural network algorithm | |
| US11494288B2 (en) | Test relevancy prediction for code changes | |
| US20150378869A1 (en) | Measuring the logging quality of a computer program | |
| US10866804B2 (en) | Recommendations based on the impact of code changes | |
| Tian et al. | Test data generation for path coverage of message-passing parallel programs based on co-evolutionary genetic algorithms | |
| Mondal et al. | Does cloned code increase maintenance effort? | |
| US20230086361A1 (en) | Automatic performance evaluation in continuous integration and continuous delivery pipeline | |
| US10169223B2 (en) | Identifying commits associated with failed tests | |
| US20230161687A1 (en) | System and method for test selection according to test impact analytics | |
| US20100131497A1 (en) | Method for determining which of a number of test cases should be run during testing | |
| Plöesch et al. | On the validity of the it-cisq quality model for automatic measurement of maintainability | |
| Mondal et al. | Fleccs: A technique for suggesting fragment-level similar co-change candidates | |
| Aktaş et al. | A learning-based bug predicition method for object-oriented systems | |
| Bonisoli et al. | Effective plan retrieval in case-based planning for metric-temporal problems |
Legal Events
| Date | Code | Title | Description |
|---|---|---|---|
| AS | Assignment |
Owner name: ENTIT SOFTWARE LLC, CALIFORNIA Free format text: ASSIGNMENT OF ASSIGNORS INTEREST;ASSIGNORS:BENEDICT, ELAD;STRACHAN, SHAUL;REGEV, RAZ;AND OTHERS;SIGNING DATES FROM 20170418 TO 20170425;REEL/FRAME:042907/0147 |
|
| STCF | Information on status: patent grant |
Free format text: PATENTED CASE |
|
| AS | Assignment |
Owner name: MICRO FOCUS LLC, CALIFORNIA Free format text: CHANGE OF NAME;ASSIGNOR:ENTIT SOFTWARE LLC;REEL/FRAME:050004/0001 Effective date: 20190523 |
|
| AS | Assignment |
Owner name: JPMORGAN CHASE BANK, N.A., NEW YORK Free format text: SECURITY AGREEMENT;ASSIGNORS:MICRO FOCUS LLC;BORLAND SOFTWARE CORPORATION;MICRO FOCUS SOFTWARE INC.;AND OTHERS;REEL/FRAME:052294/0522 Effective date: 20200401 Owner name: JPMORGAN CHASE BANK, N.A., NEW YORK Free format text: SECURITY AGREEMENT;ASSIGNORS:MICRO FOCUS LLC;BORLAND SOFTWARE CORPORATION;MICRO FOCUS SOFTWARE INC.;AND OTHERS;REEL/FRAME:052295/0041 Effective date: 20200401 |
|
| MAFP | Maintenance fee payment |
Free format text: PAYMENT OF MAINTENANCE FEE, 4TH YEAR, LARGE ENTITY (ORIGINAL EVENT CODE: M1551); ENTITY STATUS OF PATENT OWNER: LARGE ENTITY Year of fee payment: 4 |
|
| AS | Assignment |
Owner name: NETIQ CORPORATION, WASHINGTON Free format text: RELEASE OF SECURITY INTEREST REEL/FRAME 052295/0041;ASSIGNOR:JPMORGAN CHASE BANK, N.A.;REEL/FRAME:062625/0754 Effective date: 20230131 Owner name: MICRO FOCUS SOFTWARE INC. (F/K/A NOVELL, INC.), MARYLAND Free format text: RELEASE OF SECURITY INTEREST REEL/FRAME 052295/0041;ASSIGNOR:JPMORGAN CHASE BANK, N.A.;REEL/FRAME:062625/0754 Effective date: 20230131 Owner name: MICRO FOCUS LLC, CALIFORNIA Free format text: RELEASE OF SECURITY INTEREST REEL/FRAME 052295/0041;ASSIGNOR:JPMORGAN CHASE BANK, N.A.;REEL/FRAME:062625/0754 Effective date: 20230131 Owner name: NETIQ CORPORATION, WASHINGTON Free format text: RELEASE OF SECURITY INTEREST REEL/FRAME 052294/0522;ASSIGNOR:JPMORGAN CHASE BANK, N.A.;REEL/FRAME:062624/0449 Effective date: 20230131 Owner name: MICRO FOCUS SOFTWARE INC. (F/K/A NOVELL, INC.), WASHINGTON Free format text: RELEASE OF SECURITY INTEREST REEL/FRAME 052294/0522;ASSIGNOR:JPMORGAN CHASE BANK, N.A.;REEL/FRAME:062624/0449 Effective date: 20230131 Owner name: MICRO FOCUS LLC, CALIFORNIA Free format text: RELEASE OF SECURITY INTEREST REEL/FRAME 052294/0522;ASSIGNOR:JPMORGAN CHASE BANK, N.A.;REEL/FRAME:062624/0449 Effective date: 20230131 |