US10067850B2 - Load test charts with standard deviation and percentile statistics - Google Patents
Load test charts with standard deviation and percentile statistics Download PDFInfo
- Publication number
- US10067850B2 US10067850B2 US15/012,839 US201615012839A US10067850B2 US 10067850 B2 US10067850 B2 US 10067850B2 US 201615012839 A US201615012839 A US 201615012839A US 10067850 B2 US10067850 B2 US 10067850B2
- Authority
- US
- United States
- Prior art keywords
- load
- test
- computer
- servers
- results
- Prior art date
- Legal status (The legal status is an assumption and is not a legal conclusion. Google has not performed a legal analysis and makes no representation as to the accuracy of the status listed.)
- Active, expires
Links
Images


Classifications
-
- G—PHYSICS
- G06—COMPUTING; CALCULATING OR COUNTING
- G06F—ELECTRIC DIGITAL DATA PROCESSING
- G06F11/00—Error detection; Error correction; Monitoring
- G06F11/30—Monitoring
- G06F11/34—Recording or statistical evaluation of computer activity, e.g. of down time, of input/output operation ; Recording or statistical evaluation of user activity, e.g. usability assessment
- G06F11/3466—Performance evaluation by tracing or monitoring
- G06F11/3495—Performance evaluation by tracing or monitoring for systems
-
- G—PHYSICS
- G06—COMPUTING; CALCULATING OR COUNTING
- G06F—ELECTRIC DIGITAL DATA PROCESSING
- G06F11/00—Error detection; Error correction; Monitoring
- G06F11/30—Monitoring
- G06F11/34—Recording or statistical evaluation of computer activity, e.g. of down time, of input/output operation ; Recording or statistical evaluation of user activity, e.g. usability assessment
- G06F11/3409—Recording or statistical evaluation of computer activity, e.g. of down time, of input/output operation ; Recording or statistical evaluation of user activity, e.g. usability assessment for performance assessment
- G06F11/3414—Workload generation, e.g. scripts, playback
-
- G—PHYSICS
- G06—COMPUTING; CALCULATING OR COUNTING
- G06F—ELECTRIC DIGITAL DATA PROCESSING
- G06F11/00—Error detection; Error correction; Monitoring
- G06F11/30—Monitoring
- G06F11/34—Recording or statistical evaluation of computer activity, e.g. of down time, of input/output operation ; Recording or statistical evaluation of user activity, e.g. usability assessment
- G06F11/3409—Recording or statistical evaluation of computer activity, e.g. of down time, of input/output operation ; Recording or statistical evaluation of user activity, e.g. usability assessment for performance assessment
- G06F11/3419—Recording or statistical evaluation of computer activity, e.g. of down time, of input/output operation ; Recording or statistical evaluation of user activity, e.g. usability assessment for performance assessment by assessing time
-
- G—PHYSICS
- G06—COMPUTING; CALCULATING OR COUNTING
- G06F—ELECTRIC DIGITAL DATA PROCESSING
- G06F11/00—Error detection; Error correction; Monitoring
- G06F11/30—Monitoring
- G06F11/34—Recording or statistical evaluation of computer activity, e.g. of down time, of input/output operation ; Recording or statistical evaluation of user activity, e.g. usability assessment
- G06F11/3466—Performance evaluation by tracing or monitoring
-
- G—PHYSICS
- G06—COMPUTING; CALCULATING OR COUNTING
- G06F—ELECTRIC DIGITAL DATA PROCESSING
- G06F17/00—Digital computing or data processing equipment or methods, specially adapted for specific functions
- G06F17/10—Complex mathematical operations
- G06F17/18—Complex mathematical operations for evaluating statistical data, e.g. average values, frequency distributions, probability functions, regression analysis
-
- H—ELECTRICITY
- H04—ELECTRIC COMMUNICATION TECHNIQUE
- H04L—TRANSMISSION OF DIGITAL INFORMATION, e.g. TELEGRAPHIC COMMUNICATION
- H04L67/00—Network arrangements or protocols for supporting network services or applications
- H04L67/01—Protocols
- H04L67/02—Protocols based on web technology, e.g. hypertext transfer protocol [HTTP]
-
- G—PHYSICS
- G06—COMPUTING; CALCULATING OR COUNTING
- G06F—ELECTRIC DIGITAL DATA PROCESSING
- G06F2201/00—Indexing scheme relating to error detection, to error correction, and to monitoring
- G06F2201/805—Real-time
-
- G—PHYSICS
- G06—COMPUTING; CALCULATING OR COUNTING
- G06F—ELECTRIC DIGITAL DATA PROCESSING
- G06F2201/00—Indexing scheme relating to error detection, to error correction, and to monitoring
- G06F2201/875—Monitoring of systems including the internet
Definitions
- the present disclosure relates generally to cloud computing; more particularly, to automated systems and methods for functional and/or load testing of websites or features of message-based, intranet, Internet, or browser-based applications.
- Information technology is now routinely used by many enterprises to receive, process, and provide information via widely accessible electronic communications networks, such as the Internet Yet most information technology systems will begin to deny service, or fail to process message traffic efficiently, when communications traffic exceeds a processing capacity of the system. Such failures in communication can significantly impair the operations of an enterprise in many ways. Slower website performance is also known to cause users/visitors to leave the website sooner. Another consequence of poor performance is that the website may be downgraded in search engine results rankings.
- Cloud computing gets its name from the fact that the machine, storage, and application resources exist on a “cloud” of servers.
- cloud computing shared resources software and information are provided on-demand, like a public utility, via the Internet.
- Cloud computing is closely related to grid computing, which refers to the concept of interconnecting networked computers such that processing power, memory and data storage are all community resources that authorized users can utilize for specific tasks.
- Load testing a web-based application or website can involve simulating a very large number (e.g., up to or beyond 1,000,000) of virtual website users via Hypertext Transfer Protocol (HTTP) or HTTP Secure (HTTPS) message intercommunications with the target website.
- HTTP Hypertext Transfer Protocol
- HTTPS HTTP Secure
- sending and aggregating the test results data generated from all of the load servers to a database available to a dashboard in real-time has been problematic.
- the huge overhead of receiving and processing a very large number of HTTP messages containing all of the requests and responses sent from each of the many load servers to the analytic servers responsible for analyzing the test results data can easily overwhelm the resources of the server.
- communications bottlenecks can occur wherein messages get queued, such that the test results are no longer sent to the database in real-time, and therefore are not available in the dashboards in real-time.
- the load test servers can also back up, causing them to not generate the appropriate load on the customers' websites or web applications. Adding to the problem is the fact that some calculations, such as standard deviation, cannot easily be calculated at each server and then added up or totaled with the same calculations performed on other servers to form a unified result for the entire set of servers generating the load test.
- FIG. 1 illustrates an example high level architectural diagram of one stage of a CloudTest® provisioning process.
- FIG. 2 illustrates an example high level architectural diagram of another stage of a CloudTest® provisioning process after the cross-cloud grid has been fully allocated and checked.
- FIG. 3 is an example block high level architectural diagram that illustrates how, in real-time, load test results are aggregated at multiple different tiers or levels.
- FIG. 4 illustrates an example graphical user interface window that shows real-time results of a test composition running on an example grid.
- FIG. 5 is an example flow diagram of an automated sequence of steps for aggregating load test results at multiple different tiers or levels.
- FIG. 6 is a set of mathematical expressions useful for determining standard deviation and confidence interval for a given dataset.
- FIG. 7 is an example flow diagram of an automated sequence of steps for aggregating load test results at multiple different tiers or levels to calculate standard deviation and confidence interval.
- FIG. 8 is an example graphical user interface window that allows a user to select a certain percentile chart.
- FIG. 9 is an example graphical user interface window that shows a collection completion time percentile chart.
- FIG. 10 is an example graphical user interface window that shows a collection completion time standard deviation chart.
- FIG. 11 is an example graphical user interface window that shows top N collections by duration percentile.
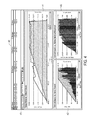
- FIGS. 12A & 12B are two parts of an example graphical user interface window that shows a collection analysis table with standard deviation and 90 th percentile calculations for a set of different components.
- references throughout this description to “one embodiment”, “an embodiment”, “one example” or “an example” means that a particular feature, structure or characteristic described in connection with the embodiment or example is included in at least one embodiment.
- the phrases “in one embodiment”, “in an embodiment”, “one example” or “an example” in various places throughout this description are not necessarily all referring to the same embodiment or example.
- the particular features, structures or characteristics may be combined in any suitable combinations and/or sub-combinations in one or more embodiments or examples.
- cloud broadly refers to a collection of machine instances, storage and/or network devices that work together in concert.
- a “public cloud” refers to a cloud that is publically available, i.e., provided by a cloud provider that a user may access via the Internet in order to allocate cloud resources for the purpose of utilizing or deploying software programs, and also for running or executing those programs thereon.
- Some public clouds deliver cloud infrastructure services or Infrastructure as a Service (IaaS).
- IaaS Infrastructure as a Service
- Amazon Elastic Compute Cloud (also known as “EC2TM”) is a web service that allows users to rent computers on which to run their own computer applications, thereby allowing scalable deployment of applications through which a user can create a virtual machine (commonly known as an “instance”) containing any software desired.
- the term “elastic” refers to the fact that user can create, launch, and terminate server instances as needed, paying by the hour for active servers.
- PaaS Cloud platform services or “Platform as a Service” deliver a computing platform and/or solution stack as a service.
- An example PaaS cloud provider is the Google App Engine, which lets anyone build applications on Google's scalable infrastructure.
- Google App Engine Another leading software platform in the cloud provider is Microsoft AzureTM, an application platform in the cloud that allows applications to be hosted and run at Microsoft datacenters.
- a “private cloud” is a cloud that is not generally available to the public, and which is typically located behind a firewall of a business. Thus, a private cloud is only available as a platform for users of that business who are behind the firewall.
- server broadly refers to any combination of hardware or software embodied in a computer (i.e., a machine “instance”) designed to provide services to client devices or processes.
- a server therefore can refer to a computer that runs a server operating system from computer-executable code stored in a memory, and which is provided to the user as virtualized or non-virtualized server; it can also refer to any software or dedicated hardware capable of providing computing services.
- a “message” generally refers to a unit of data that can be sent via an electronics communications network, e.g., the Internet, to another computational or communications system or device, e.g., to a server.
- a message could represent a communication sent to a queuing system, a REST call, or a HTTP request.
- a message could also be instantiated entirely or partially as a single operation, such as a web service call in any one of a variety of forms, e.g., XML, JMS, HTML, JSON, etc.
- a “message clip” (or “clip” for short) comprises a set of one or more messages that includes a specification of the timing and/or dependencies within that set of messages.
- a clip typically comprises a plurality (e.g., hundreds of thousands) of sequenced messages that form part of a larger load test composition.
- load servers also referred to as “Maestro” or “test” servers
- load servers play the test composition, generating a load on a target (customer) website and web applications.
- Load servers also function to report back results of the load test and statistics in real-time.
- Analytic or “result” servers are deployed and utilized primarily to collect the real-time test results from the load servers, aggregate those results, stream the results to real-time dashboards, and store them in a database.
- real-time refers to a level of computer responsiveness that a user senses as sufficiently immediate or that enables the computer to keep up with some external process (for example, to present visualizations of load test results as it constantly changes).
- real-time is a mode of computer operation in which the computer collects data, analyzes or computes with the data, reports (e.g., visually displays) and/or stores the results nearly instantaneously, i.e., within seconds or milliseconds.
- Run-time refers to the time during which a program is executing, or, in the case of a load test composition, when the composition is being played. In other words, when a user starts a program that runs on a processor-based system or computer, it is run-time for that program.
- a “grid” or “test grid” refers to a collection of interconnected load servers and result servers that may be used to run a load test on a target website or web applications.
- a computer program or grid wizard may be utilized to automatically determine the global, cross-cloud, resources needed to execute a test by examining the test plan or script (also referred to as a test composition).
- the computer program can automatically allocate those server resources required for the test across multiple different cloud providers; verifies that the allocated servers are operational; and that the allocated servers are running proprietary load testing software or computer program product correctly.
- the computer program or product also monitors the allocated servers, replacing non-operational servers (when allocated, and during execution of the test) and displays results from multiple globally distributed clouds in a real-time streaming dashboard which requires no user initiated refresh.
- a method and system for calculating load test aggregated test results at three architectural levels: first, at the load server level; second, at the analytics server level; and lastly at the system-wide data-store level.
- detailed level “raw” data (the content of a request sent to a website e.g., to access a homepage) is not sent from any of the load servers to any analytic server.
- system resources on the load server side are not wasted for the continual sending of raw data.
- system resources on the analytics server side are conserved since the need to receive and process raw data sent from the load servers is obviated.
- each load server includes an embedded component or client (referred to as a Results Service Client) that performs analytics server functions at the load server level.
- This Results Service Client aggregates test result data and generates various results statistics or metrics, e.g., average response time, average response size, etc., from the raw data that the load server received from the target website or application.
- results statistics or metrics e.g., average response time, average response size, etc.
- the Results Service Client of each load server generates aggregates that include the sum of data elements obtained during a load test, the sum of squares of the data elements, a count of the number of data elements, and an average of the data elements. These aggregates are calculated at each of the load servers in real-time, and then passed down the Result Server hierarchy in a communicative manner.
- a specialized mathematical formula or algorithm is utilized by an automated computer program to calculate standard deviation for the load test results across a massively distributed dataset in real-time.
- a graphical user interface of an analytical dashboard allows a user to generate a graphical display (in the form of a widget or chart) of a selected percentile confidence interval using the standard deviation.
- FIG. 1 illustrates an example high level architectural diagram of one stage of a CloudTest® provisioning process, which is the name given to the application program or grid wizard program described herein.
- a target website 12 includes a plurality of web servers 17 coupled to Internet cloud 15 through a load balancer 18 and a firewall 19 .
- Web servers 17 are interconnected with a plurality of application servers 16 and a plurality of database servers 14 .
- Target website 12 is shown connected to a public cloud 11 via Internet cloud 15 a .
- Public cloud 11 includes a main instance 23 coupled to a database 24 .
- Database 24 may be used to store test results, store metadata indicative of the test definition, and to store monitoring data (e.g., CPU metrics) generated during the load test.
- Main instance 23 is also shown coupled to a pair of analytic servers 22 and a pair of load servers 21 within cloud 11 , consistent with a snapshot view of the start of a process of deploying a test grid. It is appreciated that cloud 11 may comprise multiple clouds associated with multiple different cloud providers.
- main instance 23 is a virtual machine deployed on a server provided in cloud 11 that communicates with a browser application.
- main instance 23 may include a results service (designated as a “reader” results service, as opposed to all of the other remote, “writer” results services) which reads data from database 24 and serves it to a web application, which in turn formats the data and serves it to an analytic dashboard in the browser.
- main instance 23 executes the coded sequence of computer executed steps (e.g., from code stored in a memory) that allocates the server resources required for the test across one or multiple different cloud providers.
- the same application that allocates/verifies server resources may also verify that the allocated servers are operational to conduct the website load test.
- the main instance may also execute code that implements the multi-tiered load test results aggregation steps disclosed herein.
- a laptop computer 20 Connected to the front-end of cloud 11 through Internet cloud 15 is a laptop computer 20 associated with a user who may orchestrate deployment of the test of target website 12 .
- computer 20 may comprise a desktop computer, workstation, or other computing device that provides a user interface that allows a user to create and execute the test composition, define the parameters of the grid, initiate the load test, as well as analyze/review results of the test in real-time.
- the user interface may be web-based so it can be accessed from any computer having web-browser capabilities from any location in the world, without installation of specialized software.
- main instance 23 may also be downloaded to the user's laptop computer 20 or implemented on a separate hardware appliance unit located either at the user's premises (e.g., behind the firewall) or anywhere in clouds 15 or 11 .
- laptop 20 is representative of a wide variety of computer devices, such as workstations, personal computers, distributed computer systems, etc., that may be utilized by the user to launch the method for provisioning/running the cross-CloudTest grid, analyzing streaming real-time results, as well as monitoring the performance of the actual load test.
- main instance 23 operates to create a graphical user interface (GUI) that allows a user of laptop 20 to remotely interact with the application, view/monitor the test results in real-time, and modify parameters/test conditions dynamically during the actual test.
- GUI graphical user interface
- main instance 23 may include an embedded load server for running a relatively small load test that does not require the deployment of other load servers, and an embedded results (i.e., analytic) server for collecting/aggregating the real-time test results.
- the main instance and the database provide a basic CloudTest environment that can be used to launch/establish one or more grids, with more or more cloud providers being utilized to provision each grid.
- the overall testing process begins with the user creating a sophisticated test plan or composition via a GUI of either the same application program running on main instance 23 or a GUI associated with another web browser application.
- the GUI may be utilized that generate complex parallel message streams for website testing.
- the test plan may be created in the form of a visual message composition (analogous to a music composition) for testing and demonstrating web services, such as that described in U.S. patent application Ser. No. 11/503,580, filed Aug. 14, 2006, which application is herein incorporated by reference.
- the process of deploying the test grid for a large-scale test may start with the user of laptop 20 indicating to main instance 23 the number of virtual users wanted on each track of the test composition.
- the user of the system may wish test the target website with a load equal to 1000 users on each track of a test composition.
- the user may indicate the number of virtual users through an input entered on a browser page of the GUI (as described below), or, alternatively, invoke a grid wizard that automatically makes an intelligent allocation of the proper amount of resources needed to conduct the test, based on examining the composition that this grid will be running.
- the system may determine that a single load server should be allocated to accommodate every 1000 virtual users.
- the system may determine a proper allocation of result servers needed to accommodate the number of load servers specified.
- users can specify how many load servers and how many result servers they want in each cloud and region.
- users may employ the grid wizard to specify all parameters. That is, users can simply specify a defined test composition, and the grid wizard automatically analyzes the composition and determines how many servers they need in each cloud and region. It is appreciated that the determination of the number of load servers and result servers is typically made based on considerations that ensure each virtual user has a satisfactory amount of bandwidth, CPU & memory resources, etc., such that it correctly simulates or behaves as a real-world browser.
- the user main instance 23 starts the process of actually deploying and allocating the specified resources by interacting with an application programming interface (API) of one or more cloud providers.
- API application programming interface
- a user may click on a “Deploy Instances” button provided in a page of the CloudTest program GUI; in response, the system software contacts all of the different cloud APIs it needs and starts to allocate the required servers.
- FIG. 1 show the beginning of this process, wherein a first pair of load servers 21 and analytic servers 22 (also referred to as result servers or results services) have already been allocated and deployed on the grid.
- a first pair of load servers 21 and analytic servers 22 also referred to as result servers or results services
- FIG. 2 illustrates an example high level architectural diagram of a later stage of a CloudTest test grid provisioning process, which may be after the cross-cloud grid has been fully allocated and checked.
- an array of just fifty-four interconnected load servers 21 are shown allocated per each result server 22 in the example of FIG. 2 .
- a typical ratio of analytic (result) servers to load (maestro) servers is 1:50.
- FIG. 3 is an example block high level architectural diagram that illustrates how, in real-time, load test results are aggregated at multiple different tiers or levels.
- block 27 represents a browser that provides real-time test analytics to a user (e.g., via laptop 20 shown in FIG. 1 , or other computer device).
- Browser 27 is shown connected with main instance 23 , which, in turn, is coupled with database 24 .
- Database 24 provides system-level storage for aggregated test result data received from the Results Service servers 22 .
- Database 24 receives aggregated test result data via a direct connection to each of the plurality of result servers 22 .
- Each of result servers 22 is connected to a plurality of associated load (Maestro) servers 21 .
- Each load server 21 is shown having an embedded component or Result Service client 25 , which computes metrics or statistics from the raw data (e.g., web pages) received from the target website or application.
- the function of each load server 21 is to provide a load to the target website by creating one or more virtual users that access information on the target website.
- Result Service client 25 which functions to compute statistics such as average response time, average response size, and the like.
- Result Service client 25 instead of sending all of the raw data received from the target website, Result Service client 25 computes relevant statistics and discards the data. Then, once an interval (e.g., every five seconds) the statistics computed by client 25 are sent to the associated result server 22 .
- Each of the result servers takes all of the statistics received from all of its associated load servers 21 and further aggregates those statistics.
- each result server 22 aggregates the aggregated results received from all of the load servers 21 that it is connected to.
- the resulting aggregated data is then further aggregated in database 24 .
- statistics such as average response time across all of load servers 21 for the load test is stored in database 24 and available on a real-time basis to browser 27 , via database queries performed by the main instance 23 , which can perform further aggregation, grouping, filtering, etc.
- each load server 21 includes an accumulator that stores the statistically aggregated data (e.g., average response time) computed on a second-by-second basis. Periodically (e.g., every 5 seconds), each load server 21 sends an appropriate number of messages (e.g., 5 messages, one for each second) to its associated result server 22 . That is, one batched message is sent every 5 seconds—the batched message including data about all of the previous 5 seconds. Each message contains the data metrics computed every one second interval. These fine granularity metrics are then further aggregated in database 24 . It is appreciated that by computing statistics/metrics on a second-by-second basis, the analytic dashboard running on browser 27 can analyze the results on various levels of granularity.
- the analytic dashboard running on browser 27 can analyze the results on various levels of granularity.
- the user may want to view statistical results of the load test on a minute-by-minute basis, or all the way down to a second-by-second basis.
- the architecture described herein allows a user to view real-time streaming results in an analytic dashboard of various performance metrics on a second-by-second basis, even when there are millions of virtual users on thousands of load servers.
- FIG. 4 illustrates an example graphical user interface window (also referred to as “widget”) 40 that shows real-time results of a test composition running on an example grid.
- the analytic dashboard shown as widget 40 provides the user with visibility into the load that the test is creating on the grid server instances.
- a widget refers to a super class of charts—anything that a user might want to display graphically on a user interface.
- a widget can be a cross-set of results data, a set of charts, a list of data, or any combination/correlation of data displayed on the analytic dashboard.
- field 41 illustrates the number of virtual users (shaded area) and the send rate (heavy line) as a function of test time.
- Field 42 illustrates error count (vertical dark lines) and the number of virtual users (shaded area) versus test time.
- Field 43 shows the number of bytes sent and received (vertical dark lines) and the number of virtual users (shaded area) as a function of test time. It is appreciated that the user may select/view a wide variety of charts (combined, correlated, etc.) using tabs 45 .
- the charts provided in window 40 allow a user to view, analyze, and monitor test results and information in real-time so as to help identify root causes of performance problems their website or web application may be experiencing.
- FIG. 4 shows how the entire test grid (comprising a huge number of interconnected load and result servers) works in concert to send load, receive responses, aggregate and analyze those responses into a real-time streaming graphical result displayed to the user. All this is accomplished regardless of how many server instances and different cloud providers are utilized to run the load test.
- the various result charts may be viewed in one or many real-time streaming analytic dashboards.
- the user may change the time format or legend of the horizontal axis for reporting the testing analytics in real-time on a varying time (e.g., hour-by-hour, minute-by-minute, or second-by-second) basis.
- the user may pause or stop the test. Stopping the test closes the result and unloads the running test composition from all of the load servers. On the other hand, pausing or temporarily halting the test stops the load from all of the load servers, but keeps the test composition loaded and ready to resume playing into the same result. For instance, the user may pause the test after identifying a problem that requires adjustment of the load balancer on the target website.
- the grid remains fully provisioned and running.
- the composition and running of the load test is independent from the provisioning and running of the grid.
- the user may continue with the execution or playback of the test composition, either beginning at the place where it was halted, or re-starting the test from the beginning.
- the ability to start/re-start the test without affecting the state of the grid, in conjunction with the ability to view test results metrics in real-time provides a powerful advantage over prior art methods for testing a customer website, especially if the website is the production website.
- Owners of the website often want to know how the load applied from the load servers is affecting the experience of real users on the site, and appreciate the ability to stop the load test, pause the load test, or pause the ramp-up process (wherein more virtual users are added during the test) to make sure that real user behavior is not adversely affected by the load test.
- FIG. 5 is an example flow diagram of an automated sequence of steps for aggregating load test results at multiple different tiers or levels.
- the example method begins at a point where the load test grid is up and running, and the test composition is being executed on the target website.
- a component or client periodically calculates or computes aggregated test results from the raw load test data generated from the target website (block 51 ).
- the raw data may comprise HTTP, Simple Object Access Protocol (SOAP) or other protocols messages' responses received from the target website, whereas the aggregated test results may comprise any statistic or metric of interest.
- SOAP Simple Object Access Protocol
- the periodic interval that the aggregated test results are computed for may vary, but in a specific embodiment, results are computed every second.
- the aggregated test results computed by the client running on each load server are periodically sent to their associated analytic server (block 52 ).
- the period at which the aggregated results are sent to the analytic servers may be equal to or greater than the period at which the aggregated test results are computed within each load server.
- aggregated test result data is computed by each load server every second, with the results of those computations being sent to the analytic servers from each of the load servers every five seconds.
- each analytic server produces aggregated test result data across all of its associated load servers. For example, if each analytic server is associated (i.e., connected) with 50 load servers, each analytic server aggregates statistics/metrics across the aggregated test result data received from each of the 50 load servers.
- the aggregated statistical data produced by each analytic server is further aggregated at the system-wide data store in real-time.
- SQL Structured Query Language
- queries to the database can perform statistical functions (e.g., AVG, SUM, etc.) against tables' rows which have been inserted from the individual analytics servers, thereby producing further (third-level) aggregated results.
- statistical functions e.g., AVG, SUM, etc.
- results of this final level of aggregation is available in real-time to a browser executing an analytic dashboard that provides a graphical display of the results in various charts.
- a metric of particular interest may be a one-tailed distribution that tosses out 5-10% of the highest outliers (worst performance). Such a calculation is referred to as a percentile calculation or confidence interval, which requires the standard deviation for the dataset.
- a method, apparatus and computer program product is provided to calculate standard deviation formula in real-time for a massively distributed dataset produced during a load test.
- the standard deviation calculation is made possible through the calculation of a number of aggregates or metrics in the load servers.
- the disclosed subject matter makes it possible to aggregate across all of the servers and calculate standard deviation across a massively distributed dataset in real time. Once that is done it is also possible to calculate any confidence interval percentiles based on the calculated standard deviation for the entire dataset.
- the problem of calculating standard deviation and confidence interval percentiles that typically require aggregations across a massively distributed dataset in real-time is solved by aggregating data test results at each load server for all of the virtual users that it hosts; then at the analytic servers for all of the load servers each supports, and finally in the system wide data store for all of the results or analytic servers.
- an automated software tool provides a graphical user interface that allows a user to automatically calculate metrics such as percentile and standard deviation in real-time from aggregated load test results.
- a user may calculate a one-tailed confidence interval, meaning that the outliers are removed to obtain the 90 th (or 95 th , or 98 th , etc.) percentile for average response time of a website.
- FIG. 6 illustrates a general equation 61 for calculating standard deviation, where standard deviation (STDEV) is equal to the square root of the sum of the squares of the geometric distance of the individual data points from the mean divided by the sample size or count.
- STDEV standard deviation
- the average (AVERAGE) is represented as “a”
- the count (COUNT), or number of test result data points is shown as “n”
- each of the data points is not something that is easily calculated in real-time for massively distributed dataset.
- X i the individual data points
- an embedded component or client i.e., a Results Service Client performs analytics server functions at the load server level.
- the Results Service Client aggregates test result data and generates various results statistics or metrics, e.g., average response time, average response size, etc., from the raw data that the load server received from the target website or application.
- results statistics or metrics e.g., average response time, average response size, etc.
- the Results Service Client runs inside each load server to calculate the metric AVERAGE, which is then passed down the result server hierarchy (see FIG. 3 ) to obtain a cumulative average (i.e., an average of all averages) across the entire dataset.
- Formula 62 includes a sum of the squares of the test result data points (SUM_OF_SQUARES) term 63 and a simple sum of the data points (SUM) term 64 , as well as AVERAGE and COUNT aggregates.
- the Results Service Client in each load server calculates the SUM, SUM_OF_SQUARES, COUNT and AVERAGE aggregates in real-time. These first-level aggregated test results are then aggregated down the Results Server hierarchy in the same manner as described in connection with FIG. 3 .
- STDEV can be calculated from the entire dataset when first launching an analytic dashboard that provides a graphical display of the results in various charts, as well as after load testing has been completed. That is, as a load test composition is running, the load servers collect test result data points received from the website or web application. The Results Service Client running in each load server calculates the above first-level aggregated test results in real-time, with the calculations being sent to the associated Result Servers. The Results Servers then aggregate the aggregates received from the load servers and forward the results down to the main instance and database.
- formula 62 also works for calculating STDEV based on incremental or delta changes when the load test is running live, in real-time.
- the delta SUM_OF_SQUARES aggregate is added to the SUM_OF_SQUARES, and the delta SUM is added to the SUM.
- the new COUNT and new cumulative AVERAGE metrics are also calculated at each of the load servers and passed down their associated Result Servers.
- To produce the final result of the total aggregated standard deviation all of the aggregated terms or results that were calculated from all of the results servers are added up as shown in the nominator of formula 62 .
- the number of observations or count is the denominator. A square root of this fraction is the standard deviation result across the entire dataset.
- a confidence interval, “X”, may be determined, as shown by the set of equivalent equations 65 shown in FIG. 6 .
- the confidence interval X may be calculated to determine what will be the average response time of 90%, 95%, or 98% of the users of a particular website or web application.
- the confidence interval X is calculated as the AVERAGE+(Z*STDEV), where Z is a value obtained from a known statistics table used for calculating a certain percentile (e.g., 90%, 95%, or 98%).
- the Z value is well-known in statistics as the result of a translation from a normally-distributed variable.
- the Z value is thus a constant that may determined from a look-up to a standard statistical table such as that provided at ⁇ http://www.statsoft.com/textbook/distribution-tables/#z>.
- table can be used to calculate percentiles, i.e., using a so-called “Z-table”. For instance, the respective Z values for two-tailed confidence intervals for 90 th , 95 th and 98 th percentiles are 1.65, 1.96, and 2.33.
- the SUM, SUM_OF_SQUARES, COUNT and AVERAGE aggregates are calculated at each of the load servers in real-time, which aggregates are passed down the Result Server hierarchy to be further aggregated for the entire dataset produced during the load test in a communicative manner.
- the CloudTest application software program uses these aggregates and formulas 62 and 65 to generate a graphical display (in the form of a widget or chart) of the selected percentile confidence interval.
- the application program is configured to generate a graphical user interface that allows a user to select a certain percentile (e.g., 90% of average response time) of the load test results in real-time.
- the user interface allows the user to change or modify the percentile (e.g., change from a one-tailed to a two-tailed distribution, or from 90% to 95%), with the new results being produced on an analytic dashboard or chart in real-time.
- FIG. 7 is an example flow diagram of an automated sequence of steps for aggregating load test results at multiple different tiers or levels to calculate standard deviation and confidence interval.
- the process begins in block 71 with the calculation of the SUM, SUM_OF_SQUARES, COUNT and AVERAGE aggregates at each of the load servers.
- each of these aggregates are further aggregated at each of the Result Servers associated with their respective load servers. That is, the aggregates collected at the Load Servers are aggregated down the Result Server hierarchy (block 72 ). Standard deviation may then be calculated from the aggregates in the manner described above.
- Standard deviation may be calculated from formula 62 at any given time during or after the load test (block 73 ), or live, in real-time based on delta changes in the aggregates (block 74 ).
- a confidence interval X may be calculated, i.e., using AVERAGE, Z value, and STDEV (block 75 ).
- FIG. 8 is an example window 80 of the CloudTest application program GUI according to one embodiment that allows a user to select a certain percentile chart from among a set of default percentile values (e.g., 90%, 95%, or 98%). That is, the CloudTest application program GUI provides collection charts for standard deviation and 90%, 95%, and 98% percentiles. The charts assume a normal distribution in calculations. Additionally, the application program calculates a one-tailed confidence interval, meaning that the outliers removed to obtain the 90th percentile are the slow response times but not the really fast ones. The GUI also provides the user with the option of calculating a two-tailed confidence interval.
- a set of default percentile values e.g. 90%, 95%, or 98%. That is, the CloudTest application program GUI provides collection charts for standard deviation and 90%, 95%, and 98% percentiles. The charts assume a normal distribution in calculations. Additionally, the application program calculates a one-tailed confidence interval, meaning that the outliers removed to obtain the 90th percent
- the user can select from among the default percentile values (e.g. 90%, 95%, or 98%) using up/down selection arrows 81 .
- the corresponding Z-Value is shown in field 82 .
- a new Z-value can be entered manually in field 82 for any of the drop-down percentile values.
- Selection of a new percentile results in a reset, wherein the default z-values for each of the percentiles appear in field 82 .
- the user may select between the bottom or top N collections by duration percentile.
- standard deviation charges may include similar chart settings as described in connection with the collection-based chart of FIG. 8 , with the option to include Stopped Collections or Failed Collections, which are not included by default.
- FIG. 9 illustrates an example graphical user interface window 90 that shows a collection completion time percentile chart.
- the y-axis represents collection duration for a 90 th percentile confidence interval, whereas the x-axis represents time.
- the chart shown in FIG. 9 plots the standard deviation of collection completion time for each load test time period, with a separate series being shown for each collection.
- FIG. 10 is an example graphical user interface window 100 that shows a collection completion time standard deviation chart in which the standard deviation of collection completion is plotted against test time.
- FIG. 11 is an example graphical user interface window 110 that shows top N collections by duration percentile. In this example, five is the default number shown for N.
- FIGS. 12A & 12B are the left-hand side and right-hand side, respectively, of an example graphical user interface window 120 that shows a collection analysis table with standard deviation and 90 th percentile calculations for a set of different components.
- the collection analysis widget includes columns 121 and 122 , respectively showing standard deviation and 90th percentile confidence interval for the components listed in each row.
- elements of the disclosed subject matter may also be provided as a computer program product which may include a machine-readable medium having stored thereon instructions which may be used to program a computer (e.g., a processor or other electronic device) to perform a sequence of operations. Alternatively, the operations may be performed by a combination of hardware and software.
- the machine-readable medium may include, but is not limited to, floppy diskettes, optical disks, CD-ROMs, and magneto-optical disks, ROMs, RAMs, EPROMs, EEPROMs, magnet or optical cards, or other type of machine-readable medium suitable for storing electronic instructions.
Abstract
Description
Claims (7)
STDEV=SQRT[{(X 1 2 +X 2 2 + . . . +X N 2)+NA 2−2A(X 1 +X 2 + . . . +X N)}/N];
X={(A+(Z*STDEV)};
Priority Applications (1)
| Application Number | Priority Date | Filing Date | Title |
|---|---|---|---|
| US15/012,839 US10067850B2 (en) | 2010-07-19 | 2016-02-01 | Load test charts with standard deviation and percentile statistics |
Applications Claiming Priority (3)
| Application Number | Priority Date | Filing Date | Title |
|---|---|---|---|
| US12/804,338 US9436579B2 (en) | 2010-07-19 | 2010-07-19 | Real-time, multi-tier load test results aggregation |
| US13/369,899 US9251035B1 (en) | 2010-07-19 | 2012-02-09 | Load test charts with standard deviation and percentile statistics |
| US15/012,839 US10067850B2 (en) | 2010-07-19 | 2016-02-01 | Load test charts with standard deviation and percentile statistics |
Related Parent Applications (1)
| Application Number | Title | Priority Date | Filing Date |
|---|---|---|---|
| US13/369,899 Continuation US9251035B1 (en) | 2010-07-19 | 2012-02-09 | Load test charts with standard deviation and percentile statistics |
Publications (2)
| Publication Number | Publication Date |
|---|---|
| US20160147632A1 US20160147632A1 (en) | 2016-05-26 |
| US10067850B2 true US10067850B2 (en) | 2018-09-04 |
Family
ID=55174946
Family Applications (2)
| Application Number | Title | Priority Date | Filing Date |
|---|---|---|---|
| US13/369,899 Expired - Fee Related US9251035B1 (en) | 2010-07-19 | 2012-02-09 | Load test charts with standard deviation and percentile statistics |
| US15/012,839 Active 2031-07-09 US10067850B2 (en) | 2010-07-19 | 2016-02-01 | Load test charts with standard deviation and percentile statistics |
Family Applications Before (1)
| Application Number | Title | Priority Date | Filing Date |
|---|---|---|---|
| US13/369,899 Expired - Fee Related US9251035B1 (en) | 2010-07-19 | 2012-02-09 | Load test charts with standard deviation and percentile statistics |
Country Status (1)
| Country | Link |
|---|---|
| US (2) | US9251035B1 (en) |
Cited By (5)
| Publication number | Priority date | Publication date | Assignee | Title |
|---|---|---|---|---|
| US10579507B1 (en) | 2006-08-14 | 2020-03-03 | Akamai Technologies, Inc. | Device cloud provisioning for functional testing of mobile applications |
| US10586358B1 (en) | 2017-05-10 | 2020-03-10 | Akamai Technologies, Inc. | System and method for visualization of beacon clusters on the web |
| US10601674B2 (en) | 2014-02-04 | 2020-03-24 | Akamai Technologies, Inc. | Virtual user ramp controller for load test analytic dashboard |
| US10606736B1 (en) | 2017-03-03 | 2020-03-31 | Akamai Technologies Inc. | System and method for automated creation of a load test plan |
| CN112468558A (en) * | 2020-11-16 | 2021-03-09 | 中科三清科技有限公司 | Request forwarding method, device, terminal and storage medium based on hybrid cloud |
Families Citing this family (20)
| Publication number | Priority date | Publication date | Assignee | Title |
|---|---|---|---|---|
| US9720569B2 (en) | 2006-08-14 | 2017-08-01 | Soasta, Inc. | Cloud-based custom metric/timer definitions and real-time analytics of mobile applications |
| US9990110B1 (en) | 2006-08-14 | 2018-06-05 | Akamai Technologies, Inc. | Private device cloud for global testing of mobile applications |
| US9450834B2 (en) | 2010-07-19 | 2016-09-20 | Soasta, Inc. | Animated globe showing real-time web user performance measurements |
| US9251035B1 (en) | 2010-07-19 | 2016-02-02 | Soasta, Inc. | Load test charts with standard deviation and percentile statistics |
| US9495473B2 (en) | 2010-07-19 | 2016-11-15 | Soasta, Inc. | Analytic dashboard with user interface for producing a single chart statistical correlation from source and target charts during a load test |
| US9021362B2 (en) | 2010-07-19 | 2015-04-28 | Soasta, Inc. | Real-time analytics of web performance using actual user measurements |
| US9785533B2 (en) | 2011-10-18 | 2017-10-10 | Soasta, Inc. | Session template packages for automated load testing |
| US9742858B2 (en) | 2011-12-23 | 2017-08-22 | Akamai Technologies Inc. | Assessment of content delivery services using performance measurements from within an end user client application |
| US9652355B2 (en) * | 2012-09-25 | 2017-05-16 | Nec Corporation | Bottleneck detection device, method and recording medium storing program |
| US9772923B2 (en) | 2013-03-14 | 2017-09-26 | Soasta, Inc. | Fast OLAP for real user measurement of website performance |
| US9477648B1 (en) * | 2014-02-28 | 2016-10-25 | Intuit Inc. | Optimized web application user experience |
| US10318615B1 (en) * | 2014-06-18 | 2019-06-11 | Amazon Technologies, Inc. | Modeling and measuring browser performance using reference pages |
| US9608880B1 (en) * | 2015-02-19 | 2017-03-28 | Dell Products L.P. | Systems and methods for real-time performance monitoring |
| US10346431B1 (en) | 2015-04-16 | 2019-07-09 | Akamai Technologies, Inc. | System and method for automated run-tme scaling of cloud-based data store |
| US20170097742A1 (en) * | 2015-10-01 | 2017-04-06 | Salesforce.Com, Inc. | Generating dashboards using a mobile computing device |
| US10037393B1 (en) | 2016-05-03 | 2018-07-31 | Akamai Technologies, Inc. | Consumer performance index scoring for websites and web-based applications |
| US10635502B2 (en) * | 2017-09-21 | 2020-04-28 | Sap Se | Scalable, multi-tenant machine learning architecture for cloud deployment |
| US10761959B2 (en) | 2017-09-22 | 2020-09-01 | Microsoft Technology Licensing, Llc | Synchronized temporal and frequency-based visualizations of operational data |
| CN108509309B (en) * | 2018-02-13 | 2021-09-28 | 南京途牛科技有限公司 | System and method for performing performance monitoring based on access log |
| US11372871B1 (en) * | 2020-02-21 | 2022-06-28 | Rapid7, Inc. | Programmable framework for distributed computation of statistical functions over time-based data |
Citations (49)
| Publication number | Priority date | Publication date | Assignee | Title |
|---|---|---|---|---|
| US5017778A (en) * | 1989-09-06 | 1991-05-21 | Schlumberger Technology Corporation | Methods and apparatus for evaluating formation characteristics while drilling a borehole through earth formations |
| US5615347A (en) | 1995-05-05 | 1997-03-25 | Apple Computer, Inc. | Method and apparatus for linking images of sliders on a computer display |
| US6134582A (en) | 1998-05-26 | 2000-10-17 | Microsoft Corporation | System and method for managing electronic mail messages using a client-based database |
| US20020107826A1 (en) | 2000-12-22 | 2002-08-08 | Surya Ramachandran | Multi-agent collaborative architecture for problem solving and tutoring |
| US20020147937A1 (en) | 2001-01-16 | 2002-10-10 | Wolf Gregory H. | Method and apparatus for computer network analysis |
| US6477483B1 (en) | 2000-01-17 | 2002-11-05 | Mercury Interactive Corporation | Service for load testing a transactional server over the internet |
| US20030130982A1 (en) | 2002-01-09 | 2003-07-10 | Stephane Kasriel | Web-site analysis system |
| US20040123320A1 (en) | 2002-12-23 | 2004-06-24 | Mike Daily | Method and system for providing an interactive guide for multimedia selection |
| US6775644B2 (en) | 2000-05-03 | 2004-08-10 | Eureka Software Solutions, Inc. | System load testing coordination over a network |
| US20050027858A1 (en) | 2003-07-16 | 2005-02-03 | Premitech A/S | System and method for measuring and monitoring performance in a computer network |
| US6898556B2 (en) | 2001-08-06 | 2005-05-24 | Mercury Interactive Corporation | Software system and methods for analyzing the performance of a server |
| US7133805B1 (en) | 2004-07-07 | 2006-11-07 | Sprint Communications Company L.P. | Load test monitoring system |
| US20070282567A1 (en) | 2006-05-31 | 2007-12-06 | Dawson Christopher J | Systems and Methods for Predicting Load Test Resource Requirements |
| US20070288205A1 (en) | 2006-05-31 | 2007-12-13 | Sun Microsystems, Inc. | Dynamic data stream histograms for no loss of information |
| US20080049641A1 (en) | 2006-08-22 | 2008-02-28 | Edwards Stephen K | System and method for displaying a graph representative of network performance over a time period |
| US20080140347A1 (en) | 2006-12-12 | 2008-06-12 | International Business Machines Corporation | Real time analytics using hybrid histograms |
| US20080189408A1 (en) | 2002-10-09 | 2008-08-07 | David Cancel | Presenting web site analytics |
| US20080235075A1 (en) | 2007-03-23 | 2008-09-25 | Fmr Corp. | Enterprise application performance monitors |
| US20090210890A1 (en) | 2008-02-15 | 2009-08-20 | Yahoo! Inc. | Real-time data collection via hierarchical web page parsing |
| US7607169B1 (en) | 2002-12-02 | 2009-10-20 | Arcsight, Inc. | User interface for network security console |
| US7617201B1 (en) | 2001-06-20 | 2009-11-10 | Microstrategy, Incorporated | System and method for analyzing statistics in a reporting system |
| US20100332401A1 (en) | 2009-06-30 | 2010-12-30 | Anand Prahlad | Performing data storage operations with a cloud storage environment, including automatically selecting among multiple cloud storage sites |
| US20110066591A1 (en) | 2009-04-16 | 2011-03-17 | Tibco Software Inc. | Policy-based storage structure distribution |
| US20110078102A1 (en) * | 2008-03-27 | 2011-03-31 | Cirba Inc. | System and method for detecting system relationships by correlating system workload activity levels |
| US20110096108A1 (en) | 2001-05-09 | 2011-04-28 | Candice Hellen Brown Elliott | Conversion of a sub-pixel format data to another sub-pixel data format |
| US7965643B1 (en) | 2008-07-10 | 2011-06-21 | At&T Intellectual Property Ii, L.P. | Method and apparatus for using histograms to produce data summaries |
| US20110191465A1 (en) | 2010-02-01 | 2011-08-04 | Netmotion Wireless, Inc. | Public wireless network performance management system with mobile device data collection agents |
| US20120017165A1 (en) | 2010-07-19 | 2012-01-19 | Soasta, Inc. | Apparatus and method for combining / correlating data sets |
| US20120166634A1 (en) | 2008-09-29 | 2012-06-28 | Amazon Technologies, Inc. | Monitoring performance and operation of data exchanges |
| US20120246310A1 (en) | 2010-07-19 | 2012-09-27 | Soasta, Inc. | Active Waterfall Charts |
| US8291079B1 (en) | 2008-06-04 | 2012-10-16 | Appcelerator, Inc. | System and method for developing, deploying, managing and monitoring a web application in a single environment |
| US8306195B2 (en) | 2006-08-14 | 2012-11-06 | Soasta, Inc. | Visual test automation tool for message-based applications, web applications and SOA systems |
| US20120324101A1 (en) | 2011-05-25 | 2012-12-20 | Comscore, Inc. | Combining measurements based on beacon data |
| US8341462B2 (en) | 2010-07-19 | 2012-12-25 | Soasta, Inc. | System and method for provisioning and running a cross-cloud test grid |
| US20130097307A1 (en) | 2011-10-18 | 2013-04-18 | Soasta, Inc. | Session template packages for automated load testing |
| US20130116976A1 (en) | 2011-11-03 | 2013-05-09 | The Georgia Tech Research Corporation | Method, computer program, and information processing apparatus for analyzing performance of computer system |
| US8464224B2 (en) | 2009-06-30 | 2013-06-11 | Sap Ag | Integrated performance and load testing tool for application servers |
| US20130166634A1 (en) | 2011-12-23 | 2013-06-27 | Akamai Technologies Inc. | Assessment of content delivery services using performance measurements from within an end user client application |
| US8479122B2 (en) | 2004-07-30 | 2013-07-02 | Apple Inc. | Gestures for touch sensitive input devices |
| US20140033055A1 (en) | 2010-07-19 | 2014-01-30 | Soasta, Inc. | Animated Globe Showing Real-Time Web User Performance Measurements |
| US20140189320A1 (en) | 2012-12-28 | 2014-07-03 | Shih Shigjong KUO | Instruction for Determining Histograms |
| US20140280880A1 (en) | 2013-03-14 | 2014-09-18 | Soasta, Inc | Fast OLAP for Real User Measurement of Website Performance |
| US20150067527A1 (en) | 2006-08-14 | 2015-03-05 | Soasta, Inc. | Cloud-Based Custom Metric/Timer Definitions and Real-Time Analytics of Mobile Applications |
| US20150095471A1 (en) | 2013-10-01 | 2015-04-02 | Adobe Systems Incorporated | Method and apparatus for enabling dynamic analytics configuration on a mobile device |
| US9015654B2 (en) | 2012-08-13 | 2015-04-21 | Bitbar Technologies Oy | System for providing test environments for executing and analysing test routines |
| US9021362B2 (en) | 2010-07-19 | 2015-04-28 | Soasta, Inc. | Real-time analytics of web performance using actual user measurements |
| US9251035B1 (en) | 2010-07-19 | 2016-02-02 | Soasta, Inc. | Load test charts with standard deviation and percentile statistics |
| US9384121B2 (en) | 2006-08-14 | 2016-07-05 | Soasta, Inc. | Functional test automation for gesture-based mobile applications |
| US9436579B2 (en) | 2010-07-19 | 2016-09-06 | Soasta, Inc. | Real-time, multi-tier load test results aggregation |
Family Cites Families (69)
| Publication number | Priority date | Publication date | Assignee | Title |
|---|---|---|---|---|
| US6092043A (en) | 1992-11-13 | 2000-07-18 | Dragon Systems, Inc. | Apparatuses and method for training and operating speech recognition systems |
| JPH08509849A (en) | 1993-02-16 | 1996-10-15 | サイエンティフィック−アトランタ・インコーポレーテッド | System and method for remote selection of subscribers and control of messages to subscribers in a cable television system |
| US5414809A (en) | 1993-04-30 | 1995-05-09 | Texas Instruments Incorporated | Graphical display of data |
| US6025853A (en) | 1995-03-24 | 2000-02-15 | 3Dlabs Inc. Ltd. | Integrated graphics subsystem with message-passing architecture |
| US5945986A (en) | 1997-05-19 | 1999-08-31 | University Of Illinois At Urbana-Champaign | Silent application state driven sound authoring system and method |
| US6711649B1 (en) * | 1997-10-06 | 2004-03-23 | Emc Corporation | Load balancing on disk array storage device |
| US6317786B1 (en) | 1998-05-29 | 2001-11-13 | Webspective Software, Inc. | Web service |
| GB2342018B (en) | 1998-09-24 | 2003-11-05 | Nokia Mobile Phones Ltd | Communication network |
| US6434513B1 (en) | 1998-11-25 | 2002-08-13 | Radview Software, Ltd. | Method of load testing web applications based on performance goal |
| US6542163B2 (en) | 1999-05-05 | 2003-04-01 | Microsoft Corporation | Method and system for providing relevant tips to a user of an application program |
| US6587878B1 (en) | 1999-05-12 | 2003-07-01 | International Business Machines Corporation | System, method, and program for measuring performance in a network system |
| US6563523B1 (en) | 1999-10-28 | 2003-05-13 | Midway Amusement Games Llc | Graphical control of a time-based set-up feature for a video game |
| WO2001033431A1 (en) | 1999-11-02 | 2001-05-10 | E-Clarity, Inc. | Verbal classification system for the efficient sending and receiving of information |
| US6865509B1 (en) | 2000-03-10 | 2005-03-08 | Smiths Detection - Pasadena, Inc. | System for providing control to an industrial process using one or more multidimensional variables |
| US7725812B1 (en) | 2000-03-31 | 2010-05-25 | Avid Technology, Inc. | Authoring system for combining temporal and nontemporal digital media |
| US6898564B1 (en) | 2000-05-23 | 2005-05-24 | Microsoft Corporation | Load simulation tool for server resource capacity planning |
| US7231606B2 (en) | 2000-10-31 | 2007-06-12 | Software Research, Inc. | Method and system for testing websites |
| US6817010B2 (en) | 2000-12-27 | 2004-11-09 | International Business Machines Corporation | Monitoring messages during execution of a message flow |
| WO2002080587A1 (en) | 2001-03-19 | 2002-10-10 | Empirix Inc. | Software test message streams |
| US20020138226A1 (en) * | 2001-03-26 | 2002-09-26 | Donald Doane | Software load tester |
| US6738933B2 (en) | 2001-05-09 | 2004-05-18 | Mercury Interactive Corporation | Root cause analysis of server system performance degradations |
| EP2432190A3 (en) | 2001-06-27 | 2014-02-19 | SKKY Incorporated | Improved media delivery platform |
| US20030074606A1 (en) * | 2001-09-10 | 2003-04-17 | Udi Boker | Network-based control center for conducting performance tests of server systems |
| US6792393B1 (en) | 2001-12-03 | 2004-09-14 | At&T Corp. | System and method for diagnosing computer system operational behavior |
| US7693947B2 (en) | 2002-03-08 | 2010-04-06 | Mcafee, Inc. | Systems and methods for graphically displaying messaging traffic |
| US6691155B2 (en) | 2002-06-20 | 2004-02-10 | Linda Gottfried | Multimedia system for sharing brand information keeps history of modifications of production information by consumers to allow recreating multimedia interface in its previous formats |
| US7346891B2 (en) | 2002-07-05 | 2008-03-18 | Eka Systems Inc. | System and method for automating generation of an automated sensor network |
| US20040010584A1 (en) | 2002-07-15 | 2004-01-15 | Peterson Alec H. | System and method for monitoring state information in a network |
| US6975963B2 (en) | 2002-09-30 | 2005-12-13 | Mcdata Corporation | Method and system for storing and reporting network performance metrics using histograms |
| US7376902B2 (en) | 2002-10-25 | 2008-05-20 | Sap Ag | User interface for alerts |
| US7050056B2 (en) | 2002-12-20 | 2006-05-23 | Sap Aktiengesellschaft | Interactive and web-based Gantt Chart |
| US7334162B1 (en) | 2003-01-29 | 2008-02-19 | Sun Microsystems, Inc. | Dynamic distribution of test execution |
| US7853508B2 (en) | 2003-05-19 | 2010-12-14 | Serena Software, Inc. | Method and system for object-oriented management of multi-dimensional data |
| US7689628B2 (en) * | 2005-05-19 | 2010-03-30 | Atul Garg | Monitoring several distributed resource elements as a resource pool |
| US7630862B2 (en) | 2004-03-26 | 2009-12-08 | Microsoft Corporation | Load test simulator |
| US20050278458A1 (en) | 2004-06-09 | 2005-12-15 | Microsoft Corporation | Analysis services database synchronization |
| US8296654B2 (en) | 2004-07-01 | 2012-10-23 | Spotfire Ab | Automatic guide for data analysis |
| JP2006040222A (en) | 2004-07-30 | 2006-02-09 | Fujitsu Ltd | Message display method and message display system |
| US8745198B2 (en) | 2004-09-10 | 2014-06-03 | Riverbad Technology, Inc. | Method for discovery and troubleshooting of network application usage and performance issues |
| US7231210B1 (en) | 2004-12-29 | 2007-06-12 | At&T Corp. | Method and apparatus for automatically generating call flow test scripts |
| US7587638B2 (en) * | 2005-02-25 | 2009-09-08 | Microsoft Corporation | Method and system for generating and monitoring variable load on an application under test |
| US7689455B2 (en) | 2005-04-07 | 2010-03-30 | Olista Ltd. | Analyzing and detecting anomalies in data records using artificial intelligence |
| US7743128B2 (en) | 2005-04-20 | 2010-06-22 | Netqos, Inc. | Method and system for visualizing network performance characteristics |
| JP4101251B2 (en) | 2005-05-24 | 2008-06-18 | 富士通株式会社 | Load distribution program, load distribution method, and load distribution apparatus |
| US7933900B2 (en) | 2005-10-23 | 2011-04-26 | Google Inc. | Search over structured data |
| US8166458B2 (en) | 2005-11-07 | 2012-04-24 | Red Hat, Inc. | Method and system for automated distributed software testing |
| KR100764690B1 (en) | 2005-12-15 | 2007-10-08 | 주식회사 아이온커뮤니케이션즈 | Integrated management system of web site and the method thereof |
| US7464121B2 (en) | 2006-01-06 | 2008-12-09 | International Business Machines Corporation | Apparatus for sending a sequence of asynchronous messages to the same member of a clustered consumer |
| CA2646303A1 (en) | 2006-04-18 | 2007-11-01 | Collabnet, Inc. | Systems and methods for on- demand deployment of software build and test environments |
| US20080147462A1 (en) | 2006-12-14 | 2008-06-19 | Deborah Muller | Method of managing human resource cases |
| US7840523B2 (en) * | 2007-03-09 | 2010-11-23 | Yahoo! Inc. | Method and system for time-sliced aggregation of data that monitors user interactions with a web page |
| US8015327B1 (en) | 2007-09-17 | 2011-09-06 | Emc Corporation | Techniques for monitoring and managing wait queues |
| US9294296B2 (en) | 2007-10-31 | 2016-03-22 | Hewlett Packard Enterprise Development Lp | Automated test execution in a shared virtualized resource pool |
| US20100023867A1 (en) | 2008-01-29 | 2010-01-28 | Virtual Instruments Corporation | Systems and methods for filtering network diagnostic statistics |
| US20090271152A1 (en) | 2008-04-28 | 2009-10-29 | Alcatel | Load testing mechanism for server-based applications |
| US20090300423A1 (en) | 2008-05-28 | 2009-12-03 | James Michael Ferris | Systems and methods for software test management in cloud-based network |
| US9465718B2 (en) | 2008-10-30 | 2016-10-11 | Hewlett Packard Enterprise Development Lp | Filter generation for load testing managed environments |
| US8930818B2 (en) * | 2009-03-31 | 2015-01-06 | International Business Machines Corporation | Visualization of website analytics |
| US8301761B2 (en) | 2009-03-31 | 2012-10-30 | International Business Machines Corporation | Determining server load capacity with virtual users |
| US20110119370A1 (en) | 2009-11-17 | 2011-05-19 | Microsoft Corporation | Measuring network performance for cloud services |
| KR101269671B1 (en) | 2009-12-01 | 2013-05-30 | 한국전자통신연구원 | Game grammar based packet capture analyzing apparatus for game testing and its method |
| WO2011072134A2 (en) | 2009-12-09 | 2011-06-16 | Velocent Systems Incorporated | Method and apparatus pertaining to data-session peak-throughput measurements |
| WO2011085335A2 (en) | 2010-01-08 | 2011-07-14 | Sauce Labs, Inc. | Real time verification of web applications |
| US8448148B1 (en) | 2010-04-09 | 2013-05-21 | Parasoft Corporation | Detection of deadlocks or race conditions in physical systems using load testing |
| US20110282642A1 (en) * | 2010-05-15 | 2011-11-17 | Microsoft Corporation | Network emulation in manual and automated testing tools |
| US9208050B2 (en) | 2010-07-21 | 2015-12-08 | Hewlett-Packard Development Company, L.P. | Methods and apparatus to manage system performance information |
| US9268673B2 (en) | 2010-10-20 | 2016-02-23 | Sony Computer Entertainment America Inc. | Load testing online game server environment using web-based interface |
| US20130031455A1 (en) | 2011-07-28 | 2013-01-31 | Peter Griffiths | System for Linking to Documents with Associated Annotations |
| US8583777B1 (en) | 2013-08-13 | 2013-11-12 | Joingo, Llc | Method and system for providing real-time end-user WiFi quality data |
-
2012
- 2012-02-09 US US13/369,899 patent/US9251035B1/en not_active Expired - Fee Related
-
2016
- 2016-02-01 US US15/012,839 patent/US10067850B2/en active Active
Patent Citations (56)
| Publication number | Priority date | Publication date | Assignee | Title |
|---|---|---|---|---|
| US5017778A (en) * | 1989-09-06 | 1991-05-21 | Schlumberger Technology Corporation | Methods and apparatus for evaluating formation characteristics while drilling a borehole through earth formations |
| US5615347A (en) | 1995-05-05 | 1997-03-25 | Apple Computer, Inc. | Method and apparatus for linking images of sliders on a computer display |
| US6134582A (en) | 1998-05-26 | 2000-10-17 | Microsoft Corporation | System and method for managing electronic mail messages using a client-based database |
| US6477483B1 (en) | 2000-01-17 | 2002-11-05 | Mercury Interactive Corporation | Service for load testing a transactional server over the internet |
| US6775644B2 (en) | 2000-05-03 | 2004-08-10 | Eureka Software Solutions, Inc. | System load testing coordination over a network |
| US20020107826A1 (en) | 2000-12-22 | 2002-08-08 | Surya Ramachandran | Multi-agent collaborative architecture for problem solving and tutoring |
| US20020147937A1 (en) | 2001-01-16 | 2002-10-10 | Wolf Gregory H. | Method and apparatus for computer network analysis |
| US20110096108A1 (en) | 2001-05-09 | 2011-04-28 | Candice Hellen Brown Elliott | Conversion of a sub-pixel format data to another sub-pixel data format |
| US7617201B1 (en) | 2001-06-20 | 2009-11-10 | Microstrategy, Incorporated | System and method for analyzing statistics in a reporting system |
| US6898556B2 (en) | 2001-08-06 | 2005-05-24 | Mercury Interactive Corporation | Software system and methods for analyzing the performance of a server |
| US20030130982A1 (en) | 2002-01-09 | 2003-07-10 | Stephane Kasriel | Web-site analysis system |
| US20080189408A1 (en) | 2002-10-09 | 2008-08-07 | David Cancel | Presenting web site analytics |
| US7607169B1 (en) | 2002-12-02 | 2009-10-20 | Arcsight, Inc. | User interface for network security console |
| US20040123320A1 (en) | 2002-12-23 | 2004-06-24 | Mike Daily | Method and system for providing an interactive guide for multimedia selection |
| US20050027858A1 (en) | 2003-07-16 | 2005-02-03 | Premitech A/S | System and method for measuring and monitoring performance in a computer network |
| US7133805B1 (en) | 2004-07-07 | 2006-11-07 | Sprint Communications Company L.P. | Load test monitoring system |
| US8479122B2 (en) | 2004-07-30 | 2013-07-02 | Apple Inc. | Gestures for touch sensitive input devices |
| US20070288205A1 (en) | 2006-05-31 | 2007-12-13 | Sun Microsystems, Inc. | Dynamic data stream histograms for no loss of information |
| US20070282567A1 (en) | 2006-05-31 | 2007-12-06 | Dawson Christopher J | Systems and Methods for Predicting Load Test Resource Requirements |
| US20150067527A1 (en) | 2006-08-14 | 2015-03-05 | Soasta, Inc. | Cloud-Based Custom Metric/Timer Definitions and Real-Time Analytics of Mobile Applications |
| US9384121B2 (en) | 2006-08-14 | 2016-07-05 | Soasta, Inc. | Functional test automation for gesture-based mobile applications |
| US8306195B2 (en) | 2006-08-14 | 2012-11-06 | Soasta, Inc. | Visual test automation tool for message-based applications, web applications and SOA systems |
| US9720569B2 (en) | 2006-08-14 | 2017-08-01 | Soasta, Inc. | Cloud-based custom metric/timer definitions and real-time analytics of mobile applications |
| US20080049641A1 (en) | 2006-08-22 | 2008-02-28 | Edwards Stephen K | System and method for displaying a graph representative of network performance over a time period |
| US20080140347A1 (en) | 2006-12-12 | 2008-06-12 | International Business Machines Corporation | Real time analytics using hybrid histograms |
| US20080235075A1 (en) | 2007-03-23 | 2008-09-25 | Fmr Corp. | Enterprise application performance monitors |
| US20090210890A1 (en) | 2008-02-15 | 2009-08-20 | Yahoo! Inc. | Real-time data collection via hierarchical web page parsing |
| US20110078102A1 (en) * | 2008-03-27 | 2011-03-31 | Cirba Inc. | System and method for detecting system relationships by correlating system workload activity levels |
| US8291079B1 (en) | 2008-06-04 | 2012-10-16 | Appcelerator, Inc. | System and method for developing, deploying, managing and monitoring a web application in a single environment |
| US7965643B1 (en) | 2008-07-10 | 2011-06-21 | At&T Intellectual Property Ii, L.P. | Method and apparatus for using histograms to produce data summaries |
| US20120166634A1 (en) | 2008-09-29 | 2012-06-28 | Amazon Technologies, Inc. | Monitoring performance and operation of data exchanges |
| US20110066591A1 (en) | 2009-04-16 | 2011-03-17 | Tibco Software Inc. | Policy-based storage structure distribution |
| US8464224B2 (en) | 2009-06-30 | 2013-06-11 | Sap Ag | Integrated performance and load testing tool for application servers |
| US20100332401A1 (en) | 2009-06-30 | 2010-12-30 | Anand Prahlad | Performing data storage operations with a cloud storage environment, including automatically selecting among multiple cloud storage sites |
| US20110191465A1 (en) | 2010-02-01 | 2011-08-04 | Netmotion Wireless, Inc. | Public wireless network performance management system with mobile device data collection agents |
| US20120017165A1 (en) | 2010-07-19 | 2012-01-19 | Soasta, Inc. | Apparatus and method for combining / correlating data sets |
| US9436579B2 (en) | 2010-07-19 | 2016-09-06 | Soasta, Inc. | Real-time, multi-tier load test results aggregation |
| US20120246310A1 (en) | 2010-07-19 | 2012-09-27 | Soasta, Inc. | Active Waterfall Charts |
| US9495473B2 (en) | 2010-07-19 | 2016-11-15 | Soasta, Inc. | Analytic dashboard with user interface for producing a single chart statistical correlation from source and target charts during a load test |
| US8510600B2 (en) | 2010-07-19 | 2013-08-13 | Soasta, Inc. | System and method for provisioning and running a cross-cloud test grid |
| US20140033055A1 (en) | 2010-07-19 | 2014-01-30 | Soasta, Inc. | Animated Globe Showing Real-Time Web User Performance Measurements |
| US9491248B2 (en) | 2010-07-19 | 2016-11-08 | Soasta, Inc. | Real-time analytics of web performance using actual user measurements |
| US9450834B2 (en) | 2010-07-19 | 2016-09-20 | Soasta, Inc. | Animated globe showing real-time web user performance measurements |
| US8341462B2 (en) | 2010-07-19 | 2012-12-25 | Soasta, Inc. | System and method for provisioning and running a cross-cloud test grid |
| US9251035B1 (en) | 2010-07-19 | 2016-02-02 | Soasta, Inc. | Load test charts with standard deviation and percentile statistics |
| US9229842B2 (en) | 2010-07-19 | 2016-01-05 | Soasta, Inc. | Active waterfall charts for continuous, real-time visualization of website performance data |
| US9021362B2 (en) | 2010-07-19 | 2015-04-28 | Soasta, Inc. | Real-time analytics of web performance using actual user measurements |
| US20120324101A1 (en) | 2011-05-25 | 2012-12-20 | Comscore, Inc. | Combining measurements based on beacon data |
| US20130097307A1 (en) | 2011-10-18 | 2013-04-18 | Soasta, Inc. | Session template packages for automated load testing |
| US20130116976A1 (en) | 2011-11-03 | 2013-05-09 | The Georgia Tech Research Corporation | Method, computer program, and information processing apparatus for analyzing performance of computer system |
| US20130166634A1 (en) | 2011-12-23 | 2013-06-27 | Akamai Technologies Inc. | Assessment of content delivery services using performance measurements from within an end user client application |
| US20150319071A1 (en) | 2012-08-13 | 2015-11-05 | Bitbar Technologies Oy | System for providing test environments for executing and analysing test routines |
| US9015654B2 (en) | 2012-08-13 | 2015-04-21 | Bitbar Technologies Oy | System for providing test environments for executing and analysing test routines |
| US20140189320A1 (en) | 2012-12-28 | 2014-07-03 | Shih Shigjong KUO | Instruction for Determining Histograms |
| US20140280880A1 (en) | 2013-03-14 | 2014-09-18 | Soasta, Inc | Fast OLAP for Real User Measurement of Website Performance |
| US20150095471A1 (en) | 2013-10-01 | 2015-04-02 | Adobe Systems Incorporated | Method and apparatus for enabling dynamic analytics configuration on a mobile device |
Non-Patent Citations (2)
| Title |
|---|
| Dillenseger, Bruno. "Clif, a framework based on fractal for flexible, distributed load testing." annals of telecommunications-annales des télécommunications 64.1-2 (2009): 101-120. * |
| France Telecom SA. "CLIFv2 user maual". May 17, 2010. Web. <http://web.archive.org/web/20100716200625/http://clif.ow2.org/doc/user_manual/manual/UserManual.pdf>. * |
Cited By (6)
| Publication number | Priority date | Publication date | Assignee | Title |
|---|---|---|---|---|
| US10579507B1 (en) | 2006-08-14 | 2020-03-03 | Akamai Technologies, Inc. | Device cloud provisioning for functional testing of mobile applications |
| US10601674B2 (en) | 2014-02-04 | 2020-03-24 | Akamai Technologies, Inc. | Virtual user ramp controller for load test analytic dashboard |
| US10606736B1 (en) | 2017-03-03 | 2020-03-31 | Akamai Technologies Inc. | System and method for automated creation of a load test plan |
| US10586358B1 (en) | 2017-05-10 | 2020-03-10 | Akamai Technologies, Inc. | System and method for visualization of beacon clusters on the web |
| CN112468558A (en) * | 2020-11-16 | 2021-03-09 | 中科三清科技有限公司 | Request forwarding method, device, terminal and storage medium based on hybrid cloud |
| CN112468558B (en) * | 2020-11-16 | 2021-08-20 | 中科三清科技有限公司 | Request forwarding method, device, terminal and storage medium based on hybrid cloud |
Also Published As
| Publication number | Publication date |
|---|---|
| US9251035B1 (en) | 2016-02-02 |
| US20160147632A1 (en) | 2016-05-26 |
Similar Documents
| Publication | Publication Date | Title |
|---|---|---|
| US10067850B2 (en) | Load test charts with standard deviation and percentile statistics | |
| US9436579B2 (en) | Real-time, multi-tier load test results aggregation | |
| US10177999B2 (en) | System and method for real-time visualization of website performance data | |
| US9491248B2 (en) | Real-time analytics of web performance using actual user measurements | |
| US9942105B2 (en) | Animated globe showing real-time web user performance measurements | |
| US9495473B2 (en) | Analytic dashboard with user interface for producing a single chart statistical correlation from source and target charts during a load test | |
| US8341462B2 (en) | System and method for provisioning and running a cross-cloud test grid | |
| US10817803B2 (en) | Data driven methods and systems for what if analysis | |
| AU2013202560B2 (en) | Method and system for evaluating the resiliency of a distributed computing service by inducing latency | |
| EP3449205A1 (en) | Predictive rollup and caching for application performance data | |
| US20180123922A1 (en) | Correlating performance outliers and network performance impacting event metric | |
| EP3449437A1 (en) | Dynamic streaming of query responses | |
| US11265231B2 (en) | Real-time ranking of monitored entities | |
| US10536505B2 (en) | Intelligent data transmission by network device agent | |
| CN110546615B (en) | Super dynamic JAVA management extension | |
| US20140096125A1 (en) | Systems and methods for installing, managing, and provisioning applications | |
| US20180219752A1 (en) | Graph search in structured query language style query | |
| US20180121329A1 (en) | Uninstrumented code discovery | |
| US20190079851A1 (en) | Mid-method instrumentation | |
| AU2015271911B9 (en) | Method and system for evaluating the resiliency of a distributed computing service by inducing latency | |
| Kuhn et al. | Chapter 8: Analyzing Server Performance |
Legal Events
| Date | Code | Title | Description |
|---|---|---|---|
| AS | Assignment |
Owner name: AKAMAI TECHNOLOGIES, INC., MASSACHUSETTS Free format text: MERGER;ASSIGNOR:SOASTA, INC.;REEL/FRAME:044798/0558 Effective date: 20171228 |
|
| AS | Assignment |
Owner name: AKAMAI TECHNOLOGIES, INC., MASSACHUSETTS Free format text: MERGER;ASSIGNOR:SOASTA, INC.;REEL/FRAME:045351/0887 Effective date: 20171228 |
|
| AS | Assignment |
Owner name: AKAMAI TECHNOLOGIES, INC., MASSACHUSETTS Free format text: CORRECTIVE ASSIGNMENT TO CORRECT THE 15338002 RECORDED ON PREVIOUSLY RECORDED ON REEL 044798 FRAME 0558. ASSIGNOR(S) HEREBY CONFIRMS THE ASSIGNOR (S) HEREBY CONFIRMS THE MERGER;ASSIGNOR:SOASTA INC.;REEL/FRAME:046110/0306 Effective date: 20171228 |
|
| AS | Assignment |
Owner name: AKAMAI TECHNOLOGIES, INC., MASSACHUSETTS Free format text: MERGER;ASSIGNOR:SOASTA, INC.;REEL/FRAME:045613/0362 Effective date: 20171228 |
|
| STCF | Information on status: patent grant |
Free format text: PATENTED CASE |
|
| AS | Assignment |
Owner name: SOASTA, INC., CALIFORNIA Free format text: ASSIGNMENT OF ASSIGNORS INTEREST;ASSIGNORS:VAZAC, CHARLES A.;BRODA, TAL;HEMMERT, MICHAEL;AND OTHERS;REEL/FRAME:048107/0803 Effective date: 20120208 |
|
| FEPP | Fee payment procedure |
Free format text: ENTITY STATUS SET TO UNDISCOUNTED (ORIGINAL EVENT CODE: BIG.); ENTITY STATUS OF PATENT OWNER: LARGE ENTITY |
|
| MAFP | Maintenance fee payment |
Free format text: PAYMENT OF MAINTENANCE FEE, 4TH YEAR, LARGE ENTITY (ORIGINAL EVENT CODE: M1551); ENTITY STATUS OF PATENT OWNER: LARGE ENTITY Year of fee payment: 4 |