RU2822373C1 - Method of forest pathological diagnostics - Google Patents
Method of forest pathological diagnostics Download PDFInfo
- Publication number
- RU2822373C1 RU2822373C1 RU2023119845A RU2023119845A RU2822373C1 RU 2822373 C1 RU2822373 C1 RU 2822373C1 RU 2023119845 A RU2023119845 A RU 2023119845A RU 2023119845 A RU2023119845 A RU 2023119845A RU 2822373 C1 RU2822373 C1 RU 2822373C1
- Authority
- RU
- Russia
- Prior art keywords
- samples
- signals
- forest
- clamping device
- cross
- Prior art date
Links
- 230000001575 pathological effect Effects 0.000 title claims abstract description 11
- 238000000034 method Methods 0.000 title claims description 23
- 238000005314 correlation function Methods 0.000 claims abstract description 13
- 230000004907 flux Effects 0.000 claims abstract description 7
- 230000003595 spectral effect Effects 0.000 claims abstract description 7
- 230000008807 pathological lesion Effects 0.000 claims description 2
- 230000007170 pathology Effects 0.000 abstract description 8
- 239000000126 substance Substances 0.000 abstract description 3
- 230000000694 effects Effects 0.000 abstract description 2
- 238000011156 evaluation Methods 0.000 abstract 1
- 239000000523 sample Substances 0.000 description 8
- 238000001228 spectrum Methods 0.000 description 8
- 238000004364 calculation method Methods 0.000 description 6
- 230000006378 damage Effects 0.000 description 4
- 238000005259 measurement Methods 0.000 description 4
- 230000008569 process Effects 0.000 description 4
- 238000010521 absorption reaction Methods 0.000 description 3
- 230000003993 interaction Effects 0.000 description 3
- 239000011159 matrix material Substances 0.000 description 3
- 230000000007 visual effect Effects 0.000 description 3
- 238000001069 Raman spectroscopy Methods 0.000 description 2
- 229930002875 chlorophyll Natural products 0.000 description 2
- 235000019804 chlorophyll Nutrition 0.000 description 2
- ATNHDLDRLWWWCB-AENOIHSZSA-M chlorophyll a Chemical compound C1([C@@H](C(=O)OC)C(=O)C2=C3C)=C2N2C3=CC(C(CC)=C3C)=[N+]4C3=CC3=C(C=C)C(C)=C5N3[Mg-2]42[N+]2=C1[C@@H](CCC(=O)OC\C=C(/C)CCC[C@H](C)CCC[C@H](C)CCCC(C)C)[C@H](C)C2=C5 ATNHDLDRLWWWCB-AENOIHSZSA-M 0.000 description 2
- 238000004891 communication Methods 0.000 description 2
- 238000010586 diagram Methods 0.000 description 2
- 238000005516 engineering process Methods 0.000 description 2
- 239000003344 environmental pollutant Substances 0.000 description 2
- 229910052500 inorganic mineral Inorganic materials 0.000 description 2
- 239000011707 mineral Substances 0.000 description 2
- 239000000203 mixture Substances 0.000 description 2
- 230000001338 necrotic effect Effects 0.000 description 2
- 230000035764 nutrition Effects 0.000 description 2
- 235000016709 nutrition Nutrition 0.000 description 2
- 210000000056 organ Anatomy 0.000 description 2
- 230000029553 photosynthesis Effects 0.000 description 2
- 238000010672 photosynthesis Methods 0.000 description 2
- 230000000243 photosynthetic effect Effects 0.000 description 2
- 231100000719 pollutant Toxicity 0.000 description 2
- 238000012545 processing Methods 0.000 description 2
- 230000005855 radiation Effects 0.000 description 2
- 230000003068 static effect Effects 0.000 description 2
- 239000002028 Biomass Substances 0.000 description 1
- 102000010410 Nogo Proteins Human genes 0.000 description 1
- 108010077641 Nogo Proteins Proteins 0.000 description 1
- 206010040007 Sense of oppression Diseases 0.000 description 1
- 238000009825 accumulation Methods 0.000 description 1
- 238000003491 array Methods 0.000 description 1
- 238000009614 chemical analysis method Methods 0.000 description 1
- 238000006243 chemical reaction Methods 0.000 description 1
- 239000003153 chemical reaction reagent Substances 0.000 description 1
- 238000010219 correlation analysis Methods 0.000 description 1
- 238000001514 detection method Methods 0.000 description 1
- 238000011161 development Methods 0.000 description 1
- 238000002405 diagnostic procedure Methods 0.000 description 1
- MXCPYJZDGPQDRA-UHFFFAOYSA-N dialuminum;2-acetyloxybenzoic acid;oxygen(2-) Chemical class [O-2].[O-2].[O-2].[Al+3].[Al+3].CC(=O)OC1=CC=CC=C1C(O)=O MXCPYJZDGPQDRA-UHFFFAOYSA-N 0.000 description 1
- 230000004069 differentiation Effects 0.000 description 1
- 201000010099 disease Diseases 0.000 description 1
- 208000037265 diseases, disorders, signs and symptoms Diseases 0.000 description 1
- 239000006185 dispersion Substances 0.000 description 1
- 238000006073 displacement reaction Methods 0.000 description 1
- 238000001035 drying Methods 0.000 description 1
- 230000005281 excited state Effects 0.000 description 1
- 239000000284 extract Substances 0.000 description 1
- 239000000835 fiber Substances 0.000 description 1
- 238000005286 illumination Methods 0.000 description 1
- 239000012535 impurity Substances 0.000 description 1
- 230000005764 inhibitory process Effects 0.000 description 1
- 238000009434 installation Methods 0.000 description 1
- 230000001678 irradiating effect Effects 0.000 description 1
- 230000002427 irreversible effect Effects 0.000 description 1
- 239000004973 liquid crystal related substance Substances 0.000 description 1
- 238000012544 monitoring process Methods 0.000 description 1
- 230000017074 necrotic cell death Effects 0.000 description 1
- 230000003287 optical effect Effects 0.000 description 1
- 238000010827 pathological analysis Methods 0.000 description 1
- 231100000915 pathological change Toxicity 0.000 description 1
- 230000036285 pathological change Effects 0.000 description 1
- 230000009467 reduction Effects 0.000 description 1
- 239000013074 reference sample Substances 0.000 description 1
- 238000005070 sampling Methods 0.000 description 1
- 230000035945 sensitivity Effects 0.000 description 1
- 239000002689 soil Substances 0.000 description 1
- 238000012360 testing method Methods 0.000 description 1
- 230000007704 transition Effects 0.000 description 1
- 238000013519 translation Methods 0.000 description 1
Images
Abstract
Description
Изобретение относится к лесному хозяйству, в частности к оперативному выявлению зон техногенного угнетения лесов, накапливания в фотосинтезирующих органах вредных поллютантов, разрушения фитопластов, уменьшения хлорофилла.The invention relates to forestry, in particular to the rapid identification of zones of technogenic oppression of forests, accumulation of harmful pollutants in photosynthetic organs, destruction of phytoplasts, and reduction of chlorophyll.
В отдельные годы, по данным лесопатологического надзора, общая площадь повреждения лесов может достигать млн га. Визуальными признаками лесопатологии являются некроз хвои, листьев, изменение окраски, уменьшение их линейных размеров, ажурность крон, усыхание ветвей, уменьшение степени охвоенности побегов, уменьшение общего объема фитомассы. Во всех случаях лесопатологического мониторинга, желательно обнаруживать лесопатоло-гические изменения на ранней стадии, чтобы своевременно проводить лесозащитные мероприятия, пока процессы не приняли необратимый характер.In some years, according to forest pathological surveillance, the total area of forest damage can reach millions of hectares. Visual signs of forest pathology are necrosis of needles and leaves, changes in color, a decrease in their linear dimensions, openwork of crowns, drying out of branches, a decrease in the degree of leaf cover of shoots, and a decrease in the total volume of phytomass. In all cases of forest pathological monitoring, it is desirable to detect forest pathological changes at an early stage in order to promptly carry out forest protection measures before the processes become irreversible.
Известен способ оценки состояния лесов по проценту потери хвои, ее некротического повреждения. [см., например, Шкала оценки категорий состояния насаждений, Справочник, Общесоюзные нормативы для таксации лесов, Изд. «Колос», М, 1992 г, стр. 182-185, табл. 60-62] - аналог. В известном способе выделяют пять категорий состояния 0 - (0-10)%, I - (10-25)%, II - (25-60)%, III-более 60 %, IV - отмирающие. Сильное варьирование охвоенности кроны деревьев, даже в пределах одной категории состояния, а также, невозможность точного учета некротического состояния с поверхности земли, делают данный диагностический способ недостаточно точным. Недостатками аналога, также, является:There is a known method for assessing the condition of forests by the percentage of needle loss and necrotic damage. [see, for example, Scale for assessing categories of planting condition, Directory, All-Union standards for forest taxation, Ed. "Spike", M, 1992, pp. 182-185, table. 60-62] - analog. In the known method, five categories of condition are distinguished: 0 - (0-10)%, I - (10-25)%, II - (25-60)%, III - more than 60%, IV - dying. The strong variation in the cover of tree crowns, even within one category of condition, as well as the impossibility of accurately recording the necrotic condition from the surface of the ground, makes this diagnostic method insufficiently accurate. The disadvantages of the analogue are also:
- субъективность визуальных наблюдений;- subjectivity of visual observations;
- не выявляются скрытые, ранние, признаки патологии.- latent, early signs of pathology are not detected.
Известен «Способ ранней лесопатологической диагностики» Патент Ru № 2189732, 2002 г. - ближайший аналог. В способе ближайшего аналога, получают цифровые изображения функции яркости I(x, y) в виде матриц дискретных отсчетов (mxn)элементов в зонах R и G, вычисляют попиксельные отношения матриц R и G; составляют результирующую матрицу из этих отношений, выделяют, методами пространственного дифференцирования, контуры на результирующем изображении, рассчитывают функции фрактальной размерности изображений внутри контуров и, по численному значению фрактальной размерности, положению контуров и их площади, судят о причинах, координатах и размерах выявленной патологии.Known “Method for early forest pathological diagnosis” Patent Ru No. 2189732, 2002 - the closest analogue. In the method of the closest analogue, digital images of the brightness function I(x, y) are obtained in the form of matrices of discrete samples of (mxn) elements in the zones R and G, and the pixel-by-pixel ratios of the matrices R and G are calculated; they compose the resulting matrix from these relationships, select, using the methods of spatial differentiation, the contours in the resulting image, calculate the functions of the fractal dimension of the images within the contours and, based on the numerical value of the fractal dimension, the position of the contours and their area, judge the causes, coordinates and dimensions of the identified pathology.
Недостатками аналога следует считать:The disadvantages of the analogue should be considered:
- неадекватность алгоритма формирования и обработки результирующей матрицы измеряемому физическому процессу;- inadequacy of the algorithm for generating and processing the resulting matrix to the measured physical process;
- не все существенные признаки лесопатологии измеряются и используются, что снижает достоверность конечных результатов оценки;- not all essential signs of forest pathology are measured and used, which reduces the reliability of the final assessment results;
- невысокая чувствительность способа, поскольку интервал изменения фрактальной размерности составляет 0,1…0,3- low sensitivity of the method, since the range of changes in the fractal dimension is 0.1…0.3
Задача, решаемая заявленным способом, состоит в оперативной идентификации вида патологии путем вычисления функции взаимной корреляции текущего, отраженного от образца сигнала, с эталонным.The problem solved by the claimed method is to quickly identify the type of pathology by calculating the cross-correlation function of the current signal reflected from the sample with the reference one.
Поставленная задача решается тем, что способ лесопатологической диагностики включает подготовку образцов в виде побегов крон деревьев в вегетационный период, размещение их в светонепроницаемом зажимном устройстве, облучение образцов через окно в зажимном устройстве спектральным потоком в полосе 400…600 нм в импульсном режиме с регулируемой интенсивностью, прием отраженных от образцов сигналов спектрометром высокого разрешения, преобразование измеренных сигналов в цифровую форму с регулируемой дискретностью отчетов, запись сигналов в буферное запоминающее устройство, расчет функций взаимной корреляции текущего сигнала с эталонными сигналами лесопатологических образцов из базы данных, идентификацию вида лесопатологического поражения по ширине функции взаимной корреляции на уровне 0,1 от максимального значения.The problem is solved by the fact that the method of forest pathological diagnostics includes preparing samples in the form of shoots of tree crowns during the growing season, placing them in a lightproof clamping device, irradiating the samples through a window in the clamping device with a spectral flux in the 400...600 nm band in a pulsed mode with adjustable intensity, reception of signals reflected from samples by a high-resolution spectrometer, conversion of measured signals into digital form with adjustable discreteness of reports, recording of signals in a buffer memory device, calculation of cross-correlation functions of the current signal with reference signals of forest pathological samples from the database, identification of the type of forest pathological lesion by the width of the cross function correlation at the level of 0.1 from the maximum value.
Изобретение поясняется чертежами, где:The invention is illustrated by drawings, where:
- фиг. 1 - полосы переизлучения солнечного спектра при квантовом взаимодействии с молекулами вещества;- fig. 1 - re-emission bands of the solar spectrum during quantum interaction with molecules of matter;
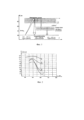
- фиг. 2 - спектр облучения образцов (а) и спектры отражения от них (б, в, г);- fig. 2 - irradiation spectrum of samples (a) and reflection spectra from them (b, c, d);
- фиг. 3 - функции взаимной корреляции текущего сигнала и сигналов эталонных образцов;- fig. 3 - functions of cross-correlation of the current signal and signals of reference samples;
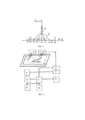
- фиг. 4 - функциональная схема установки, реализующей способ.- fig. 4 - functional diagram of the installation that implements the method.
Техническая сущность способа состоит в следующем. В процессе фотосинтеза, до 90% энергии солнечного потока превращается в биомассу. Взаимодействие солнечного света с клетчаткой происходит на молекулярном уровне. При поглощении энергии кванта молекулой, последняя переходит в возбужденное состояние с переходом на разрешенный виртуальный уровень. При всех видах возможного взаимодействия, как то поглощение, рассеяние, переизлучение, интегральный эффект состоит в смещении спектра падающего потока в его длинноволновую часть. На рисунке, фиг. 1, иллюстрируются полосы смещенного переизлучения: серия Лаймана (100…300 нм), серия Бальмера (400…650 нм), серия Пашена (610…1200 нм) [см., например, Р. Межерис, Лазерное дистанционное зондирование, перевод с англ., Мир, М, 1987 г., стр. 124, табл. 3.4, «Волновые числа комбинационного сдвига на длине волны 337,1 нм. Ниже представлены извлечения и данной таблицы:The technical essence of the method is as follows. During the process of photosynthesis, up to 90% of the solar energy is converted into biomass. The interaction of sunlight with fiber occurs at the molecular level. When quantum energy is absorbed by a molecule, the latter goes into an excited state with a transition to an allowed virtual level. For all types of possible interaction, such as absorption, scattering, re-emission, the integral effect consists of a shift in the spectrum of the incident flux to its long-wavelength part. In the figure, fig. 1, the bands of shifted re-emission are illustrated: Lyman series (100...300 nm), Balmer series (400...650 nm), Paschen series (610...1200 nm) [see, for example, R. Mezheris, Laser remote sensing, translation from English ., Mir, M, 1987, p. 124, table. 3.4, “Wave numbers of the Raman shift at a wavelength of 337.1 nm. Below are extracts from this table:
ного излученияScattered wavelength
nogo radiation
смещения Δλ, нмAbsolute value
displacement Δλ, nm
В результате комбинационного рассеяния, происходит перераспределение энергии между спектральными составляющими отраженного потока. На рисунке фиг. 2 иллюстрируются спектры падающего (облучаемого) Iλ[пад]и отраженные от образцов Iλ[отр] смещенные спектры. В отраженном спектре содержится вся информация о состоянии исследуемых образцов: эффективность поглощения лучистой энергии, состояние фотосинтезирующих органов, химический состав примесей, минеральный состав питания и увлажненность почв. Подобная информация не может быть получена при визуальных наблюдениях или дистанционном зондировании.As a result of Raman scattering, energy is redistributed between the spectral components of the reflected flux. In the figure fig. Figure 2 illustrates the spectra of the incident (irradiated) I λ[inc] and the shifted spectra I λ[neg] reflected from the samples. The reflected spectrum contains all the information about the state of the samples under study: the efficiency of absorption of radiant energy, the state of photosynthetic organs, the chemical composition of impurities, the mineral composition of nutrition and soil moisture. Such information cannot be obtained from visual observations or remote sensing.
В технике, основным методом идентификации объектов является метод сравнения. Математической процедурой сравнения служит вычисление функции взаимной корреляции В(λ1, λ2)текущего сигнала и сигнала от эталонного образца. По определению [см., например, А.М. Заездный, «Основы расчетов по статической радиотехнике», Связь издат, М, 1969 г., стр. 92-96]. In technology, the main method of identifying objects is the comparison method. The mathematical comparison procedure is the calculation of the cross-correlation function B(λ 1 , λ 2 ) of the current signal and the signal from the reference sample. By definition [see, for example, A.M. Zaezdny, “Fundamentals of calculations in static radio engineering”, Communications Publishing House, M, 1969, pp. 92-96].
При современном развитии вычислительной техники, методы корреляционного анализа (вычисление интеграла) легко реализуются специальной математической программой на ПЭВМ. Предварительно осуществляют преобразование аналоговых сигналов в цифровые посредством аналогово-цифрового преобразователя. With the modern development of computer technology, methods of correlation analysis (calculation of the integral) are easily implemented by a special mathematical program on a PC. The analog signals are first converted into digital signals using an analog-to-digital converter.
Программа расчета функции взаимной корреляции текущего измерения с эталонным сигналом:Program for calculating the cross-correlation function of the current measurement with the reference signal:
program correlator;program correlate;
uses crt;uses crt;
constconst
nnI=500;nnI=500;
nnR=2*nnI;nnR=2*nnI;
T_=1.0;T_=1.0;
TypeType
Imass=array[-nnR..nnR] of real;Imass=array[-nnR..nnR] of real;
Rmass=array[-nnR..nnR] of real;Rmass=array[-nnR..nnR] of real;
VarVar
IE, IH:Imass;IE, IH:Imass;
REN:Rmass;REN:Rmass;
fi, fr, text;fi, fr, text;
dt:real;dt:real;
nI, nR, i:integer;nI, nR, i:integer;
procedure Int (var IE, IH:Imass; var REN:Rmass; T_, dt:real);procedure Int (var IE, IH:Imass; var REN:Rmass; T_, dt:real);
var I, integer;var I, integer;
beginbegin
for i:=-nI to nI dofor i:=-nI to nI do
beginbegin
REN[i]:=0;REN[i]:=0;
for j:=-nI to nI dofor j:=-nI to nI do
beginbegin
REN[i]:=REN[i]+1.0/(2*T_)*IE[j]*IH[j+i]*dtREN[i]:=REN[i]+1.0/(2*T_)*IE[j]*IH[j+i]*dt
end;end;
end;end;
end;end;
beginbegin
cirscr;cirscr;
assign (fi, ‘data.pas’);assign(fi, 'data.pas');
reset (fi);reset(fi);
readln (fi, nI); nR:=2*nI;readln(fi, nI); nR:=2*nI;
dt:=T_/nI;dt:=T_/nI;
for i:=-nR to nR do readln (fi, IE[i], IH[i]);for i:=-nR to nR do readln (fi, IE[i], IH[i]);
close (fi);close(fi);
for i:=-nR to nR do writeln (IE[i]:10:5, IH[i]:10-5);for i:=-nR to nR do writeln (IE[i]:10:5, IH[i]:10-5);
Int (IE, IH, REN, T_, dt);Int(IE, IH, REN, T_, dt);
assign (fr, ‘rez.pas’);assign(fr, 'rez.pas');
rewrite (fr);rewrite(fr);
for i:= -nI to nI do writeln (fr, REN[i]:10:5);for i:= -nI to nI do writeln (fr, REN[i]:10:5);
close (fr);close(fr);
end.end.
По измерениям образцов с известной патологией (полученных, например, методами химического анализа) создают базу эталонных сигналов, используемую при оперативной лесопатологической диагностике. Функции взаимной корреляции сигнала текущего измерения с эталонными образцами иллюстрируются графиками фиг. 3 По определению [см., например, А.М. Заездный, «Основы расчетов по статической радиотехнике», Связь издат, М, 1969 г.] значение корреляционной функции В(λ1, λ2) в нуле, есть дисперсия (мощность) процесса. Селектируемым параметром функции взаимной корреляции служит интервал корреляции (ширинаBased on measurements of samples with known pathology (obtained, for example, by chemical analysis methods), a database of reference signals is created that is used in operational forest pathological diagnostics. The cross-correlation functions of the current measurement signal with the reference samples are illustrated by the graphs of Fig. 3 By definition [see, for example, A.M. Zaezdny, “Fundamentals of calculations in static radio engineering,” Communications Publishing House, M, 1969] the value of the correlation function B(λ 1 , λ 2 ) at zero is the dispersion (power) of the process. The selected parameter of the cross-correlation function is the correlation interval (width
Δλ) на уровне 0,1 от максимума. Поэтому графики фиг. 3 могут быть идентифицированы как:Δλ) at the level of 0.1 from the maximum. Therefore, the graphs of Fig. 3 can be identified as:
а) - здоровый образец (ширина Δλ=10 нм), категория состояния 0…I;a) - healthy sample (width Δλ=10 nm),
б) - образец техногенного угнетения фотосинтеза промышленными поллютантами, недостаток минерального питания (ширина Δλ=25 нм), категория состояния II…III;b) - a sample of technogenic inhibition of photosynthesis by industrial pollutants, lack of mineral nutrition (width Δλ=25 nm), condition category II...III;
в) - образец на стадии отмирания (ширина Δλ=50 нм), полное разрушение фитопластов, категория IV…V.c) - sample at the dying stage (width Δλ=50 nm), complete destruction of phytoplasts, category IV...V.
Пример реализации способа.An example of the method implementation.
Заявленный способ может быть реализован по схеме фиг. 4. Функциональная схема содержит зажимную светоизолирующую клипсу (1) внутрь которой помещают испытываемый образец побега (2), размещенную на поверхности рабочего стола (3). Облучение образца осуществляют через окно в клипсе (1) диаметром 4 мм импульсным световым потоком с регулируемой интенсивностью посредством генератора оптического излучения (4), собранного на светодиодах (светодиодная матрица) обеспечивающих равномерность освещения поверхности образца посредством рассеивающих линз. Сдвинутый (по длине волны) сигнал флуоресценции (из-за поглощения падающего потока хлорофиллом образца) воспринимается спектрометром (5). Сигнал флуоресценции квантуется аналогово-цифровым преобразователем (6) с изменяемой дискретизацией отсчетов (в интервале от единиц ms до единиц сек) и накапливается в буферном запоминающем устройстве (7).The claimed method can be implemented according to the scheme of Fig. 4. The functional diagram contains a light-insulating clip (1) inside which the test sample of the shoot (2) is placed, placed on the surface of the work table (3). The sample is irradiated through a window in a clip (1) with a diameter of 4 mm with a pulsed light flux with adjustable intensity using an optical radiation generator (4) assembled on LEDs (LED matrix) that ensure uniform illumination of the sample surface through diffusing lenses. The shifted (wavelength) fluorescence signal (due to absorption of the incident flux by the chlorophyll of the sample) is perceived by the spectrometer (5). The fluorescence signal is quantized by an analog-to-digital converter (6) with variable sampling (in the range from units of ms to units of sec) and accumulated in a buffer memory device (7).
Обработку массивов измерений осуществляют посредством микропроцессора (8) на основе программ, записанных на жестком диске (9). Предварительно создают базу эталонных спектров сигналов (10) от образцов с известными лесопатологическими заболеваниями. Вычисление функций взаимной корреляции осуществляют посредством коррелятора (11). Управление микропроцессором (8) осуществляют посредством буквенно-цифровой клавиатуры (12) с отображением результата обработки сигналов на жидкокристаллическом дисплее (13).The measurement arrays are processed by a microprocessor (8) based on programs recorded on the hard disk (9). A database of reference spectra of signals (10) from samples with known forest pathological diseases is first created. The calculation of cross-correlation functions is carried out using a correlator (11). The microprocessor (8) is controlled via an alphanumeric keyboard (12) with the result of signal processing displayed on a liquid crystal display (13).
Расчетные функции взаимной корреляции иллюстрируются графиками фиг. 3. Как следует из графиков, интервал корреляции Δλ текущего сигнала с эталонным составляет от 5 нм до 25 нм. Следовательно, спектральное разрешение спектрометра (5) должно составлять единицы нм. Чем выше спектральное разрешение, тем точнее результат и выше вероятность раннего обнаружения лесопатологии. На настоящий момент, существуют спектрометры высокого разрешения [см., например, «Технические предложения по ОКР «Вулкан-Астрогон», НТЦ Реагент, г.Москва, 2001 г, стр. 10-16]. Гиперспектрометр высокого разрешения Астрогон-1, спектральное разрешение 1,7 нм. Перечисленный функционал средств (1, 4, 5, 6, 7, 8, 9, 12, 13) также реализован на существующей технической базе в виде флуориметра (fluorimeter «Handy FEA» (фирма Hansatech Instruments).The calculated cross-correlation functions are illustrated in the graphs of Figs. 3. As follows from the graphs, the correlation interval Δλ of the current signal with the reference signal is from 5 nm to 25 nm. Therefore, the spectral resolution of the spectrometer (5) should be units of nm. The higher the spectral resolution, the more accurate the result and the higher the likelihood of early detection of forest pathology. At the moment, there are high-resolution spectrometers [see, for example, “Technical proposals for R&D “Vulcan-Astrogon”, Scientific and Technical Center Reagent, Moscow, 2001, pp. 10-16]. High-resolution hyperspectrometer Astrogon-1, spectral resolution 1.7 nm. The listed functionality of the tools (1, 4, 5, 6, 7, 8, 9, 12, 13) is also implemented on the existing technical base in the form of a fluorimeter (fluorimeter “Handy FEA” (Hansatech Instruments).
Claims (1)
Publications (1)
| Publication Number | Publication Date |
|---|---|
| RU2822373C1 true RU2822373C1 (en) | 2024-07-04 |
Family
ID=
Citations (5)
| Publication number | Priority date | Publication date | Assignee | Title |
|---|---|---|---|---|
| RU2189732C2 (en) * | 2000-12-14 | 2002-09-27 | Московский государственный университет леса | Method for early forest pathology diagnosis |
| RU2416192C2 (en) * | 2009-04-27 | 2011-04-20 | Государственное учреждение "Научный центр проблем аэрокосмического мониторинга" - ЦПАМ "АЭРОКОСМОС" | Method to identify ecological condition of forests |
| RU2436291C1 (en) * | 2010-04-23 | 2011-12-20 | Государственное образовательное учреждение высшего профессионального образования "Московский Государственный Университет Леса" (ГОУ ВПО "МГУЛ") | Method of early forest pathology diagnostics |
| RU2588179C1 (en) * | 2015-01-29 | 2016-06-27 | Федеральное государственное бюджетное научное учреждение "Научно-исследовательский институт аэрокосмического мониторинга "АЭРОКОСМОС" (НИИ "АЭРОКОСМОС") | Method for determining above-soil cover digression in arctic zone |
| CN110114800A (en) * | 2016-12-29 | 2019-08-09 | 亚拉国际有限公司 | For determining the handheld device and method of vegetative state |
Patent Citations (5)
| Publication number | Priority date | Publication date | Assignee | Title |
|---|---|---|---|---|
| RU2189732C2 (en) * | 2000-12-14 | 2002-09-27 | Московский государственный университет леса | Method for early forest pathology diagnosis |
| RU2416192C2 (en) * | 2009-04-27 | 2011-04-20 | Государственное учреждение "Научный центр проблем аэрокосмического мониторинга" - ЦПАМ "АЭРОКОСМОС" | Method to identify ecological condition of forests |
| RU2436291C1 (en) * | 2010-04-23 | 2011-12-20 | Государственное образовательное учреждение высшего профессионального образования "Московский Государственный Университет Леса" (ГОУ ВПО "МГУЛ") | Method of early forest pathology diagnostics |
| RU2588179C1 (en) * | 2015-01-29 | 2016-06-27 | Федеральное государственное бюджетное научное учреждение "Научно-исследовательский институт аэрокосмического мониторинга "АЭРОКОСМОС" (НИИ "АЭРОКОСМОС") | Method for determining above-soil cover digression in arctic zone |
| CN110114800A (en) * | 2016-12-29 | 2019-08-09 | 亚拉国际有限公司 | For determining the handheld device and method of vegetative state |
Similar Documents
| Publication | Publication Date | Title |
|---|---|---|
| Berry | 3.10 solar induced chlorophyll fluorescence: Origins, relation to photosynthesis and retrieval | |
| Jia et al. | Estimation of leaf nitrogen content and photosynthetic nitrogen use efficiency in wheat using sun-induced chlorophyll fluorescence at the leaf and canopy scales | |
| Bergsträsser et al. | HyperART: non-invasive quantification of leaf traits using hyperspectral absorption-reflectance-transmittance imaging | |
| Köhler et al. | Assessing the potential of sun-induced fluorescence and the canopy scattering coefficient to track large-scale vegetation dynamics in Amazon forests | |
| US7112806B2 (en) | Bio-imaging and information system for scanning, detecting, diagnosing and optimizing plant health | |
| Romero et al. | Modeling re-absorption of fluorescence from the leaf to the canopy level | |
| Ryu et al. | Testing the performance of a novel spectral reflectance sensor, built with light emitting diodes (LEDs), to monitor ecosystem metabolism, structure and function | |
| CN109187417B (en) | Unmanned aerial vehicle-mounted terahertz wave and hyperspectral remote sensing crop monitoring system | |
| Oumar et al. | Predicting Thaumastocoris peregrinus damage using narrow band normalized indices and hyperspectral indices using field spectra resampled to the Hyperion sensor | |
| CA3132824A1 (en) | Remote sensing of plant photosynthetic capacity | |
| Du et al. | Application of spectral indices and reflectance spectrum on leaf nitrogen content analysis derived from hyperspectral LiDAR data | |
| Peng et al. | Using remotely sensed spectral reflectance to indicate leaf photosynthetic efficiency derived from active fluorescence measurements | |
| Yang et al. | Accurate identification of nitrogen fertilizer application of paddy rice using laser-induced fluorescence combined with support vector machine. | |
| RU2822373C1 (en) | Method of forest pathological diagnostics | |
| Johansson et al. | Remote fluorescence measurements of vegetation spectrally resolved and by multi-colour fluorescence imaging | |
| Julitta | Optical proximal sensing for vegetation monitoring | |
| Upadhyay et al. | Revisit and optimisation of spectral data collection techniques from vegetation using handheld non-imaging spectroscopic sensor for minimising errors | |
| Stamford et al. | Spectral reflectance measurements | |
| Yasir et al. | Spectral index for estimating leaf water content across diverse plant species using multiple viewing angles | |
| RU2824521C1 (en) | Method for determining the state of a tree stand by crown shoots | |
| SCHMUCK | Applications of in vivo chlorophyll fluorescence in forest decline research | |
| SAITO et al. | Remote sensing of plant fluorescence spectrum and lifetime by laser-induced fluorescence lidars | |
| Berry et al. | Collaborative research on ecophysiological controls on Amazonian precipitation seasonality and variability | |
| Ren et al. | Inversion of plant functional traits from hyperspectral imagery enhances the distinction of wheat stripe rust severity | |
| Sui et al. | Plant health sensing system for in situ determination of cotton nitrogen status |