RU2719574C1 - Method of increasing signal-to-noise ratio when analyzing aqueous solutions using raman spectroscopy - Google Patents
Method of increasing signal-to-noise ratio when analyzing aqueous solutions using raman spectroscopy Download PDFInfo
- Publication number
- RU2719574C1 RU2719574C1 RU2019117131A RU2019117131A RU2719574C1 RU 2719574 C1 RU2719574 C1 RU 2719574C1 RU 2019117131 A RU2019117131 A RU 2019117131A RU 2019117131 A RU2019117131 A RU 2019117131A RU 2719574 C1 RU2719574 C1 RU 2719574C1
- Authority
- RU
- Russia
- Prior art keywords
- raman spectroscopy
- analysis
- salts
- tablet
- aqueous solutions
- Prior art date
Links
Images


Classifications
-
- G—PHYSICS
- G01—MEASURING; TESTING
- G01N—INVESTIGATING OR ANALYSING MATERIALS BY DETERMINING THEIR CHEMICAL OR PHYSICAL PROPERTIES
- G01N21/00—Investigating or analysing materials by the use of optical means, i.e. using sub-millimetre waves, infrared, visible or ultraviolet light
- G01N21/62—Systems in which the material investigated is excited whereby it emits light or causes a change in wavelength of the incident light
- G01N21/63—Systems in which the material investigated is excited whereby it emits light or causes a change in wavelength of the incident light optically excited
- G01N21/65—Raman scattering
Abstract
Description
Изобретение относится к области аналитической химии и спектроскопии комбинационного рассеяния света, в частности к анализу качества лекарственных препаратов методом КР-спектроскопии.The invention relates to the field of analytical chemistry and Raman spectroscopy, in particular to the analysis of the quality of drugs by Raman spectroscopy.
Предложенный способ может использоваться для качественного и количественного анализа водных растворов органических веществ, например, для контроля качества лекарственных средств в испытательных лабораториях и на производстве, а также в любых других областях где используется метод КР-спектроскопии.The proposed method can be used for qualitative and quantitative analysis of aqueous solutions of organic substances, for example, to control the quality of drugs in testing laboratories and in production, as well as in any other areas where Raman spectroscopy is used.
Заявленный способ основывается на эффекте поглощения воды при образовании кристаллогидратов солей, что приводит к увеличению локальной концентрации растворенного вещества. Анализируемый раствор предлагается наносить на таблетку из спрессованных безводных или высушенных солей определенного состава (например, сульфата натрия, сульфата лития и хлорида кальция) и по истечению времени поглощения воды (не менее 5 минут), за счет образования кристаллогидратов, проводят регистрацию спектрограмм по стандартной методике, например, калибровка с использованием методов на основе закона Бера, CLS, SMLR, PCR или PLS, без дополнительных изменений.The claimed method is based on the effect of water absorption during the formation of crystalline hydrates of salts, which leads to an increase in the local concentration of the dissolved substance. The analyzed solution is proposed to be applied to a tablet from compressed anhydrous or dried salts of a certain composition (for example, sodium sulfate, lithium sulfate and calcium chloride), and after water absorption time (at least 5 minutes), due to the formation of crystalline hydrates, spectrograms are recorded according to the standard method for example, calibration using methods based on Beer's law, CLS, SMLR, PCR or PLS, without further changes.
Показано, что соли, не образующие кристаллогидратов, не вызывают эффекта усиления сигнала комбинационного рассеяния света. При использовании предложенного способа для анализа лекарственных препаратов наблюдалось 16-кратное увеличение соотношения сигнал/шум по сравнению с анализом по стандартной методике, что эквивалентно сокращению времени анализа и количеству зарегистрированных спектров в 256 раз. Проведено исследование концентрационной зависимости отклика аналитического сигнала и показана линейность калибровочного кривой для 10 - кратной разницы в концентрации аналита. Вычисление метрологических параметров методики доказывает применимость предложенного способа для количественного анализа.It is shown that salts that do not form crystalline hydrates do not cause the effect of amplification of the Raman signal. When using the proposed method for the analysis of drugs, a 16-fold increase in the signal-to-noise ratio was observed compared to the analysis according to the standard method, which is equivalent to a 256-fold reduction in the analysis time and the number of recorded spectra. A study was made of the concentration dependence of the response of the analytical signal and the linearity of the calibration curve for a 10-fold difference in the analyte concentration was shown. The calculation of the metrological parameters of the method proves the applicability of the proposed method for quantitative analysis.
Из уровня техники известен патент US 16072393, дата приоритета 21.06.2016, «Analysis method and analysis device» Предложенный способ отличается от указанного аналога тем, что в данном патенте используется метод прямого определения концентрации методом КР-спектроскопии на основе полученной калибровочной модели, описывающей зависимость интенсивности аналитического сигнала от концентрации аналита, без использования каких-либо методов усиления сигнала. Этот подход имеет ограничение по нижнему приделу определяемых концентраций вследствие низкого соотношения сигнал/шум в диапазоне концентраций ниже 1-5%, что является источником высоких погрешностей измерений, для снижений которых может потребоваться использование спектрометров комбинационного рассеяния более высокого класса точности, либо значительное увеличение времени анализа. Предлагаемый нами способ позволяет без изменения параметров анализа существенно повысить соотношение сигнал/шум и как следствие уменьшить предел количественного определения веществ в водных растворах как минимум до 0,25%.The prior art patent US 16072393, priority date 06/21/2016, "Analysis method and analysis device" is known. The proposed method differs from the specified analogue in that this patent uses the direct concentration determination method by Raman spectroscopy based on the obtained calibration model describing the dependence the intensity of the analytical signal from the analyte concentration, without using any signal amplification methods. This approach has a limitation on the lower limit of the determined concentrations due to the low signal to noise ratio in the concentration range below 1-5%, which is a source of high measurement errors, for the reduction of which may require the use of Raman spectrometers of a higher accuracy class, or a significant increase in the analysis time . Our proposed method allows, without changing the analysis parameters, to significantly increase the signal-to-noise ratio and, as a result, reduce the limit of quantitative determination of substances in aqueous solutions to at least 0.25%.
Известно изобретение US 16022121, дата приоритета 28.06.2018 «Reaction control in acetic acid processes», где описана методика определения компонентов реакционной смеси, находящихся в высокой концентрации 65,3%-70,5% при этом содержание воды находится на уровне 2-14%, что снижает ее влияние на результат анализа. Предлагаемый нами способ позволят анализировать более сложные смеси на основе водных растворов с пределом обнаружения действующего вещества как минимум до 0,07%, при этом вода, как растворитель, может занимать основную часть анализируемого раствора (соответственно до 99,93%).The invention is known US 16022121, priority date 06/28/2018 "Reaction control in acetic acid processes", which describes the method for determining the components of the reaction mixture in a high concentration of 65.3% -70.5% with a water content of 2-14 %, which reduces its effect on the analysis result. Our proposed method will allow us to analyze more complex mixtures based on aqueous solutions with an active substance detection limit of at least 0.07%, while water, as a solvent, can occupy the bulk of the analyzed solution (up to 99.93%, respectively).
Ближайшим аналогом заявленного изобретения является заявка CN 102353665 (А), дата приоритета 15.02.2012 «Surface enhanced raman spectroscopy detection method for sulfanilamide medicines». Заявленный способ отличается от указанного аналога рядом важных технологических деталей. В предложенном нами способе отсутствует необходимость в длительно и многостадийном синтезе наночастиц драгоценных металлов (например, серебра, золота, платины и др.), поскольку эффект усиления сигнала достигается не за счет плазмонного резонанса наночастицы с молекулой аналита, а в следствие поглощения воды за счет образования кристаллогидратов солей в результате чего происходит повышение локальной концентрации аналита на поверхности солевой таблетки. Это существенно снижает стоимость анализа, а также отсутствует необходимость в предварительном изготовлении наночастиц и систем на их основе срок хранения которых ограничен.The closest analogue of the claimed invention is the application CN 102353665 (A), priority date 02.15.2012 "Surface enhanced raman spectroscopy detection method for sulfanilamide medicines". The claimed method differs from the specified analogue by a number of important technological details. In our proposed method, there is no need for a long and multi-stage synthesis of precious metal nanoparticles (for example, silver, gold, platinum, etc.), since the signal amplification effect is achieved not due to plasmon resonance of the nanoparticle with the analyte molecule, but as a result of water absorption due to the formation of crystalline hydrates of salts, resulting in an increase in the local concentration of analyte on the surface of the salt tablets. This significantly reduces the cost of analysis, and there is no need for the preliminary manufacture of nanoparticles and systems based on them whose shelf life is limited.
Техническим результатом заявленного изобретения является повышение чувствительности анализа водных растворов веществ, за счет повышения соотношения сигнал/шум; снижение предела количественного определения и предела обнаружения веществ, находящихся в водном растворе с использованием спектроскопии комбинационного рассеяния света.The technical result of the claimed invention is to increase the sensitivity of the analysis of aqueous solutions of substances, by increasing the signal-to-noise ratio; reducing the limit of quantification and the detection limit of substances in aqueous solution using Raman spectroscopy.
Предложенный способ позволяет сократить время на проведение анализа за счет снижения числа сканирований для получения приемлемого соотношения сигнал/шум, а также позволяет проводить анализ водных растворов нестабильных веществ, которые склонны к разрушению, химической модификации либо любому иному виду изменения физико-химических и/или химических свойств под действием лазерного излучения в условиях анализа.The proposed method allows to reduce the time for analysis by reducing the number of scans to obtain an acceptable signal to noise ratio, and also allows the analysis of aqueous solutions of unstable substances that are prone to destruction, chemical modification or any other type of change in physicochemical and / or chemical properties under the influence of laser radiation in the conditions of analysis.
Технический результат достигается за счет выполнения следующих этапов пробоподготовки:The technical result is achieved by performing the following stages of sample preparation:
1. Получение тонкого порошка безводных (или высушенных) солей состава МхАу,1. Obtaining a fine powder of anhydrous (or dried) salts of the composition MxAy,
где х и у=1-2;where x and y = 1-2;
М - катион щелочных или щелочноземельных металлов;M - cation of alkali or alkaline earth metals;
А - анион одно-, или двухосновных кислот;A is the anion of mono- or dibasic acids;
2. Изготовление таблетки из данных солей (одной соли или смеси солей указанного состава) путем прессования под давлением не менее 50 кг/см2;2. The manufacture of tablets from these salts (one salt or a mixture of salts of the specified composition) by pressing under a pressure of at least 50 kg / cm 2 ;
3. Нанесение аликвоты анализируемого водного раствора на полученную таблетку;3. Application of an aliquot of the analyzed aqueous solution to the resulting tablet;
4. Анализ поверхности таблетки методом спектроскопии комбинационного рассеяния света и обработка спектральных данных с помощью соответствующего программного обеспечения (например TQ Analist).4. Analysis of the tablet surface by Raman spectroscopy and processing of spectral data using appropriate software (for example, TQ Analist).
Для осуществления изобретения в качестве модельного препарата были использованы следующие препараты:For the implementation of the invention, the following preparations were used as a model preparation:
1. «Кетоджект» (организация-разработчик: ООО «АПИ-САН», г. Москва). Противовоспалительный, жаропонижающий и анальгезирующий лекарственный препарат для ветеринарного применения. В качестве действующего вещества содержит кетопрофен - 100 мг/мл и вспомогательные вещества: L-аргинин, бензиловый спирт, натрия гидроксид и воду для инъекций.1. “Ketoject” (organization-developer: LLC “API-SAN”, Moscow). Anti-inflammatory, antipyretic and analgesic drug for veterinary use. As an active ingredient it contains ketoprofen - 100 mg / ml and excipients: L-arginine, benzyl alcohol, sodium hydroxide and water for injection.
2. «Энрофлон» (организация-разработчик: группа компаний «ВИК»). Антибактериальный инъекционный препарат. Содержит в качестве действующего вещества энрофлоксацин в концентрации 10%, а также вспомогательные вещества: натрия гидроксид и воду для инъекций.2. Enroflon (development organization: VIK group of companies). Antibacterial injection drug. Contains 10% enrofloxacin as an active ingredient, as well as excipients: sodium hydroxide and water for injection.
Для работы использовали ИК-Фурье спектрометр с Фурье-Раман модулем Thermo Scientific Nicolet iS50, США (далее КР-спектрометр).For work, we used an IR-Fourier spectrometer with a Fourier-Raman module Thermo Scientific Nicolet iS50, USA (hereinafter KR spectrometer).
Анализ препаратов методом ВЭЖХ проводили на хроматографе Agilent 1260 Infinity с DAD- детектором 1260 ТТС, Германия.HPLC analysis of the preparations was carried out on an Agilent 1260 Infinity chromatograph with a 1260 TTC DAD detector, Germany.
Для проведения анализа готовили порошки безводных солей - хлорида кальция (Honeywell, США), сульфат лития (Acros, Бельгия) и сульфата натрия (Acros, Бельгия), путем их растирания в агатовой ступке. Затем из полученных порошков изготавливали таблетки диаметром 3 мм путем прессования 20-100 мг порошка с помощью ручного пресса (IS50 RMNZ pellet sample press, Thermo Scientific, США) с усилием не менее 50 кг/см2. На полученную таблетку сразу же наносили 0,5 мкл анализируемого раствора. После выдерживания в течение не менее 5 мин при комнатной температуре, для завершения процесса кристаллизации, таблетку помещали в КР-спектрометр и регистрировали спектры комбинационного рассеяния света при следующих настройках прибора: Разрешение 16 см-1, диапазон измерения 3500-700 см-1, детектор- InGaAs, светоделитель - СаF2, длина волны лазера λ=1064 нм, мощность лазера 0,50 Вт, число сканирований - 100, время анализа - 2 мин.For analysis, powders of anhydrous salts were prepared — calcium chloride (Honeywell, USA), lithium sulfate (Acros, Belgium) and sodium sulfate (Acros, Belgium), by grinding them in an agate mortar. Then, tablets with a diameter of 3 mm were made from the obtained powders by pressing 20-100 mg of the powder using a hand press (IS50 RMNZ pellet sample press, Thermo Scientific, USA) with a force of at least 50 kg / cm 2 . 0.5 μl of the analyzed solution was immediately applied to the resulting tablet. After keeping at least 5 min at room temperature, to complete the crystallization process, the tablet was placed in a Raman spectrometer and Raman spectra were recorded at the following instrument settings:
Пример №1. Для определения диапазона линейности отклика аналитического сигнала приготовили серию разведений препарата «Кетоджект» в воде до получения растворов с концентраций кетопрофена: 10, 7, 5, 3, 2, 1%. КР-спектры полученных растворов регистрировали в описанных условиях на таблетке из сульфата натрия. Для получения калибровочной кривой использовали зависимость высоты пика на частоте 1598 см-1 (соответствует С=С валентным колебаниям ароматического цикла) от концентрации кетопрофена в растворе. Была показана линейности отклика аналитического сигнала в диапазоне концентрации кетопрофена от 1 до 10%. Коэффициент корреляции (R) в этом диапазоне составил 0,9970, что соответствует хорошему уровню аппроксимации и доказывает применимость предлагаемой методики для количественного анализа в данном диапазоне концентраций. КР-спектры полученных растворов регистрировали в описанных условиях на таблетке из сульфата натрия. Калибровочная кривая кетопрофена концентрированного на таблетке из сульфата натрия приведена на рис. 1.Example No. 1. To determine the linearity range of the response of the analytical signal, we prepared a series of dilutions of the Ketoject preparation in water to obtain solutions with ketoprofen concentrations: 10, 7, 5, 3, 2, 1%. The Raman spectra of the resulting solutions were recorded under the described conditions on a tablet of sodium sulfate. To obtain the calibration curve, we used the dependence of the peak height at a frequency of 1598 cm -1 (corresponding to C = C stretching vibrations of the aromatic cycle) on the concentration of ketoprofen in solution. The linearity of the response of the analytical signal in the concentration range of ketoprofen from 1 to 10% was shown. The correlation coefficient (R) in this range was 0.9970, which corresponds to a good level of approximation and proves the applicability of the proposed method for quantitative analysis in this concentration range. The Raman spectra of the resulting solutions were recorded under the described conditions on a tablet of sodium sulfate. The calibration curve of ketoprofen concentrated on a tablet of sodium sulfate is shown in Fig. 1.
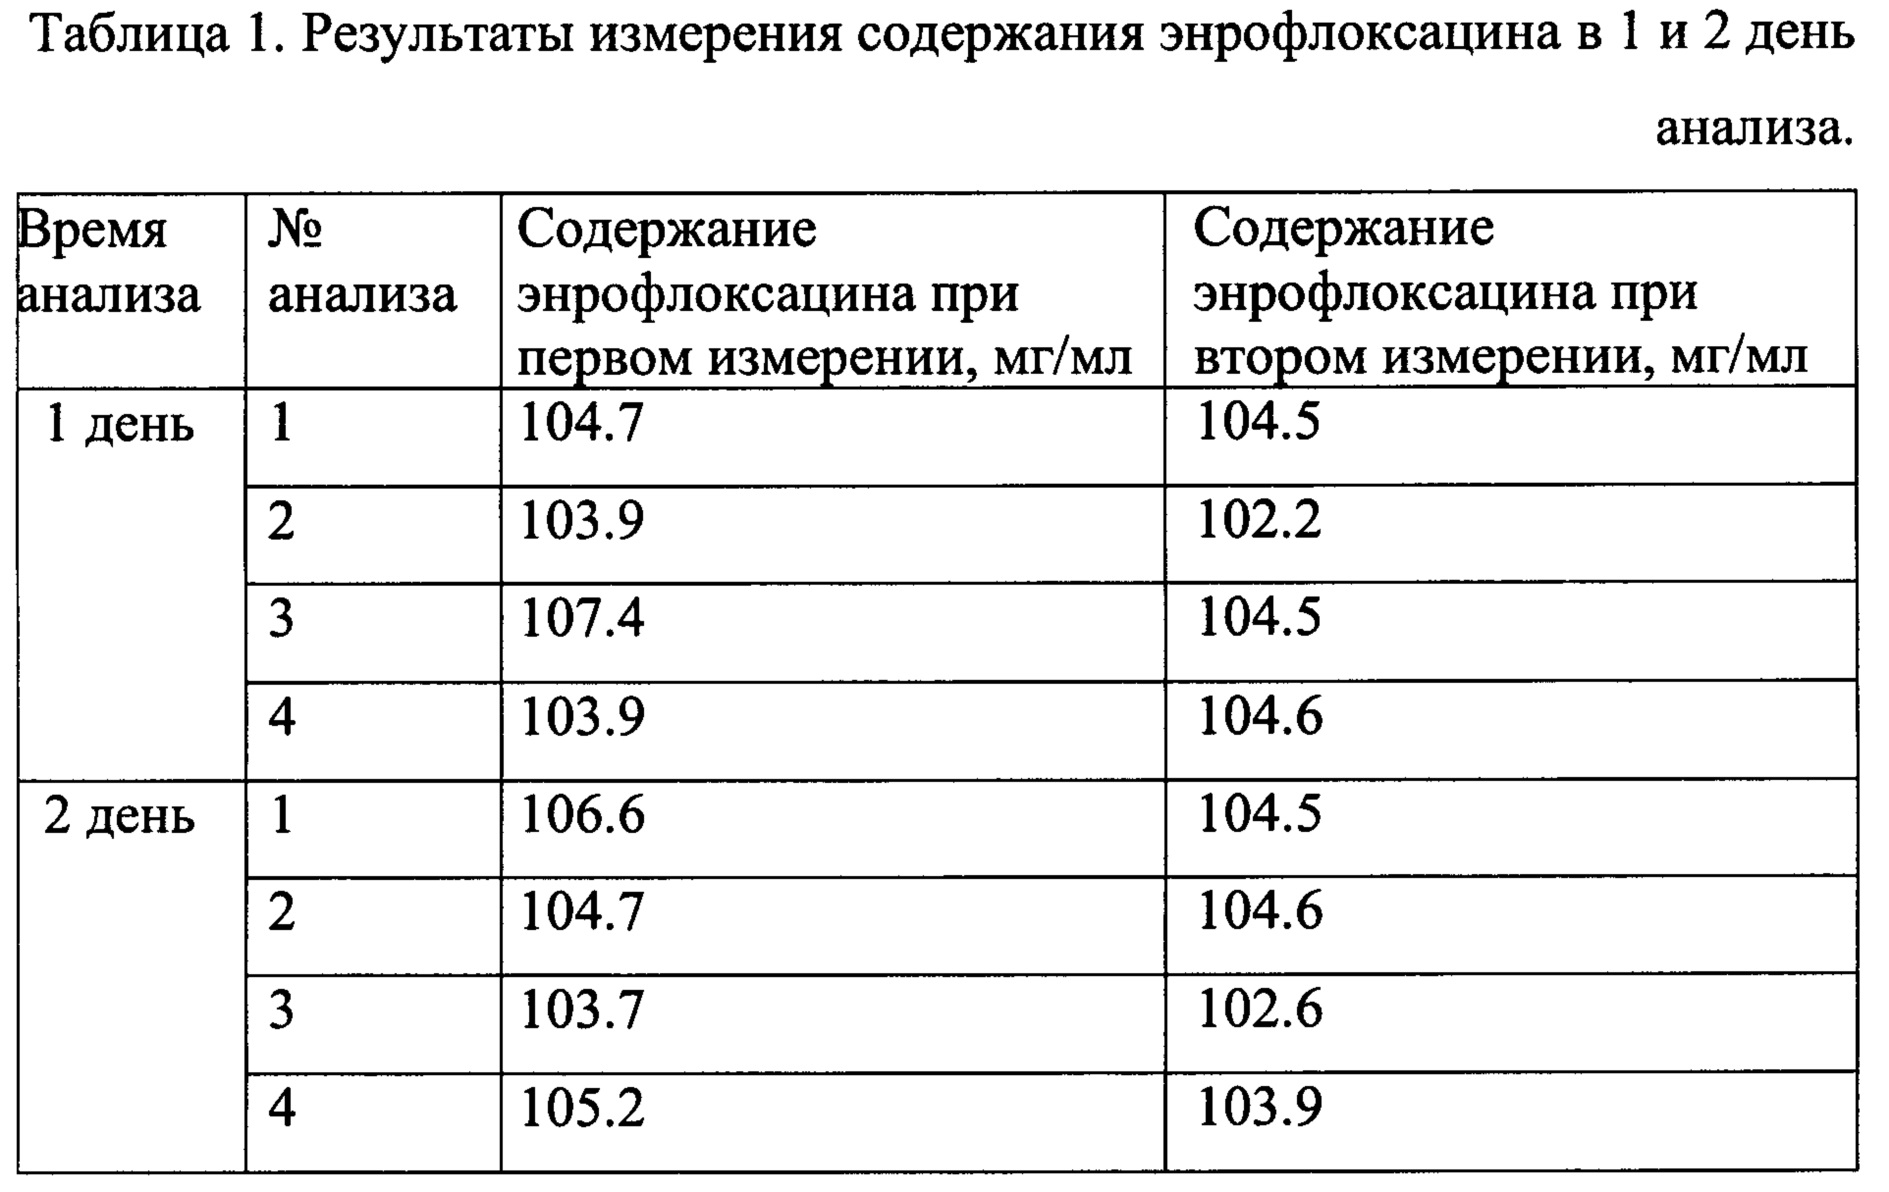
Пример №2. Было проведено количественное определение энрофлоксацина в препарате «Энрофлон» с использованием предлагаемого способа. В качестве поглотителя воды использовали сульфат натрия, запрессованный в таблетку по описанной методике. Значение концентрации энрофлоксацина в препарате определенное методом ВЭЖХ (согласно ТУ BY 811000025.029-2007, извещения об изменениях №1-5) составило 106,4 мг/мл с неопределенностью 4,4 мг/мл. Эта величина была принята в качестве аттестационного значения для определения валидационных параметров предложенной методики. Для калибровки приготовили раствор энрофлоксацина (Fluka) в воде с концентрацией 101,97 мг/мл, рН довели с помощью 1М NaOH до 10,0, что аналогично кислотности среды в анализируемом препарате. Результаты измерений, полученные методом КР-спектроскопии в 1 и 2 день анализа представлены в Таблице 1. Для расчета метрологических параметров анализ проводили с варьированием фактора «время анализа и оператор». В первый день оператор №1 сделал 4 пробоподготовки по указанному способу (в качестве соли-осушителя использовался сульфат натрия) и дважды провел измерение концентрации для каждой пробоподготовки. На 2 день оператор №2 провел те же этапы пробоподготовки и анализа. Данные представлены в табл. 1.Example No. 2. A quantitative determination of enrofloxacin in the preparation "Enroflon" was carried out using the proposed method. Sodium sulfate, pressed into a tablet according to the described procedure, was used as a water absorber. The concentration of enrofloxacin in the preparation determined by HPLC (according to TU BY 811000025.029-2007, notification of changes No. 1-5) was 106.4 mg / ml with an uncertainty of 4.4 mg / ml. This value was adopted as a certification value for determining the validation parameters of the proposed methodology. For calibration, a solution of enrofloxacin (Fluka) in water with a concentration of 101.97 mg / ml was prepared, the pH was adjusted with 1M NaOH to 10.0, which is similar to the acidity of the medium in the analyzed preparation. The measurement results obtained by Raman spectroscopy on
Для оценки методики на грубые ошибки (промахи) сомнительных значений выборки из случайной величины, имеющей нормальное распределение был применен критерий Граббса. При этом расчетное значение критерия Uрасч определяли по формулеTo evaluate the technique for gross errors (misses) of dubious values of a sample from a random variable with a normal distribution, the Grubbs criterion was applied. In this case, the calculated value of the criterion Ucalc was determined by the formula
![]()
![]()
Здесь хср - среднее значение выборки, хс - сомнительное значение (максимальное или минимальное в выборке), s - выборочное среднеквадратическое отклонение (СКО), определяемое по формулеHere, xsr is the average value of the sample, xs is the doubtful value (maximum or minimum in the sample), s is the sample standard deviation (SD), determined by the formula

где xi -элементы выборки, n - объем выборки.where xi are the sample elements, n is the sample size.
Поскольку Uрасч < Uтабл, полученные значения не содержат грубых ошибок и не одно из них не исключали из выборки. Расхождение между дисперсиями оценивали по критерию Кохрена. Данные представлены в таблице 2.Since Ucalc <Utable, the obtained values do not contain gross errors and not one of them was excluded from the sample. The discrepancy between the variances was evaluated by the Cochren criterion. The data are presented in table 2.

Стандартная неопределенность в условиях повторяемости и относительная стандартная неопределенность в условиях промежуточной прецизионности представлены в таблице 3.The standard uncertainty under repeatability conditions and the relative standard uncertainty under intermediate precision conditions are presented in Table 3.

Смещение представляет собой систематическую ошибку в противоположность случайной ошибке. Большее систематическое отклонение от истинного значения соответствует большему значению смещения. В таблице 4 представлены значения оцененного смещения результатов измерения концентрации по предложенной методике относительно арбитражного значения. Так значения относительной суммарной стандартной неопределенности и суммарной стандартной неопределенности находится на уровне 2,6-2,7%.The bias is a systematic error as opposed to a random error. A larger systematic deviation from the true value corresponds to a larger bias value. Table 4 presents the values of the estimated bias of the concentration measurement results by the proposed methodology with respect to the arbitration value. So the values of the relative total standard uncertainty and total standard uncertainty are at the level of 2.6-2.7%.

Предел повторяемости - значение, которое с доверительной вероятностью 95% не превышает абсолютной величиной разность между результатами двух измерений (или испытаний), получены в условиях повторяемости (сходимости). Прецизионностью является мера схожести независимых результатов измерений, полученных методом КР-спектроскопии. Предел промежуточной прецизионности предложенной методики менее 3%. Данные представлены в таблице 5.Repeatability limit - a value that with a confidence level of 95% does not exceed the absolute value of the difference between the results of two measurements (or tests), obtained under conditions of repeatability (convergence). Precision is a measure of the similarity of the independent measurement results obtained by Raman spectroscopy. The limit of intermediate precision of the proposed methodology is less than 3%. The data are presented in table 5.

Результаты представленной метрологической оценки способа определения количественного содержания кетопрофена в лекарственном препарате методом КР-спектроскопии доказывают применимость данного способа согласно нормам изложенным в ГОСТ 8.563-2009, ГОСТ Р 5725-2002.The results of the presented metrological evaluation of the method for determining the quantitative content of ketoprofen in a drug by Raman spectroscopy prove the applicability of this method according to the standards set forth in GOST 8.563-2009, GOST R 5725-2002.
Пример №3. Для доказательства эффективности предложенного способа для усиления сигнала по сравнению со стандартной процедурой анализа проведено измерение соотношения сигнал/шум, предела количественного определения и предела обнаружения путем проведения анализа препаратов «Энрофлон» и «Кетоджект» согласно предложенному способу с использованием сульфата натрия, сульфата лития, хлорида кальция и бромида калия. Для этого растворы препаратов наносили на таблетки из порошков данных солей и регистрировали КР-спектры в описанных условиях. В случае препарата «Кетоджект» была зарегистрированы высота пика на 1598 см-1 (соответствует С=С валентным колебаниям ароматического цикла), для препарата Энрофлон регистрировали высоту пика на 1388 см-1 (соответствует деформационным колебаниям СН3-группы).Example No. 3. To prove the effectiveness of the proposed method for signal amplification compared with the standard analysis procedure, the signal-to-noise ratio, the quantification limit and the detection limit were measured by analyzing Enroflon and Ketoject preparations according to the proposed method using sodium sulfate, lithium sulfate, and chloride calcium and potassium bromide. For this, drug solutions were applied to tablets from powders of these salts and Raman spectra were recorded under the described conditions. In the case of the Ketoject preparation, a peak height of 1598 cm -1 was recorded (corresponds to C = C stretching vibrations of the aromatic cycle); for Enroflon, a peak height of 1388 cm -1 was recorded (corresponds to deformation vibrations of the CH 3 group).
Для сравнения были зарегистрированы спектрограммы препаратов без нанесения на таблетки из соли - каждый препарат в количестве 500 мкл был помещен в лунку планшета и проведено измерение спектрограммы в тех же условиях, что и в случае анализа на поверхности таблетки из солей. Данные представлены в таблице 6. Спектры препаратов, нанесенных на соответствующие соли представлены на рисунках 2-8 (Кетоджект / кальция хлорид - рисунок 2, Кетоджект / натрия сульфат - рисунок 3, Энрофлон / натрия сульфат - рисунок 4, Энрофлон / кальция хлорид - рисунок 5, Энрофлон / сульфат лития - рисунок 6, Энрофлон / бромид калия - рисунок 7, Кетоджект / бромид калия- рисунок 8).For comparison, spectrograms of the preparations were recorded without applying salt tablets to each tablet - each drug in an amount of 500 μl was placed in the well of the tablet and the spectrogram was measured under the same conditions as in the case of analysis on the surface of a salt tablet. The data are presented in Table 6. The spectra of preparations applied to the corresponding salts are presented in Figures 2-8 (Ketoject / calcium chloride - Figure 2, Ketoject / sodium sulfate - Figure 3, Enroflon / sodium sulfate - Figure 4, Enroflon / calcium chloride - Figure 5, Enroflon / lithium sulfate - Figure 6, Enroflon / potassium bromide - Figure 7, Ketoject / potassium bromide - Figure 8).


Из приведенных данных видно, при использовании предложенного способа наблюдалось увеличение соотношения сигнал/шум по сравнению со стандартной процедурой анализа. Хлорид кальция показал набольший эффект усиления сигнала (в 16,09 раз) по сравнению с сульфатами лития (в 2,35 раза) и натрия (в 1,72 раз), что имеет корреляцию с разницей в растворимости данных солей в воде (19,2 г/100 мл - сульфат натрия, 34,3 г/100 мл -сульфат лития и 74,5 г/100 мл - хлорид кальция) и как следствие в способности поглощать воду с образованием кристаллогидратов. Максимальное усиление соотношения сигнал/шум (в 16,09 раз) наблюдалось в случае анализа препарата «Энрофлон» на таблетке из хлорида кальция. При этом для препарата «Кетоджект» анализ в этих же условиях показал увеличение сигнала только в 3,13 раза. В качестве возможной причины этого экспериментального факта может быть присутствие в данном препарате бензилового спирта, который может препятствовать полному поглощению воды за счет образования гидрофобного слоя на поверхности хлорида кальция.From the above data it is seen that when using the proposed method, an increase in the signal-to-noise ratio was observed compared to the standard analysis procedure. Calcium chloride showed the greatest signal amplification effect (16.09 times) compared with lithium sulfates (2.35 times) and sodium (1.72 times), which has a correlation with the difference in the solubility of these salts in water (19, 2 g / 100 ml — sodium sulfate, 34.3 g / 100 ml — lithium sulfate and 74.5 g / 100 ml — calcium chloride) and, as a result, the ability to absorb water with the formation of crystalline hydrates. The maximum gain in the signal-to-noise ratio (16.09 times) was observed in the case of the analysis of the Enroflon preparation on a tablet of calcium chloride. Moreover, for the preparation “Ketoject”, analysis under the same conditions showed an increase in signal by only 3.13 times. A possible reason for this experimental fact may be the presence of benzyl alcohol in this preparation, which can impede the complete absorption of water due to the formation of a hydrophobic layer on the surface of calcium chloride.
Расчеты показывают, что повышение соотношения сигнал/шум в 16 раз эквивалентно увеличению числа сканирований и времени на проведение анализа в 256 раз, что в указанных условиях соответствует регистрации около 25600 спектров (примерно 8.5 часов непрерывной работы КР-спектрометра) по стандартной методике, в то время как при использовании предложенного способа требуется регистрация только 100 спектров и при этом весь анализ занимает 2 минуты. Кроме этого, при длительном времени анализа образец неминуемо будет претерпевать физико-химические и химические изменения, вследствие разогрева под действием лазерного излучения, что приведет к получению некорректных результатов. Таким образом предложенный способ позволяет исследовать водные растворы веществ методом КР-спектроскопии в области низких концентраций которые недоступны для стандартной процедуры анализа.Calculations show that an increase in the signal-to-noise ratio by 16 times is equivalent to an increase in the number of scans and analysis time by 256 times, which under these conditions corresponds to recording about 25600 spectra (approximately 8.5 hours of continuous operation of the Raman spectrometer) according to the standard method, whereas while using the proposed method requires registration of only 100 spectra and the entire analysis takes 2 minutes. In addition, with a long analysis time, the sample will inevitably undergo physico-chemical and chemical changes due to heating under the influence of laser radiation, which will lead to incorrect results. Thus, the proposed method allows you to study aqueous solutions of substances by Raman spectroscopy in the low concentration region that are not available for the standard analysis procedure.
Было показано, что только соли способные к образованию кристаллических кристаллогидратов (например, хлорид кальция, сульфаты лития и натрия) приводят к усилению сигнала комбинационного рассеяния света в описанных условиях анализа. Так, например, при изготовлении спрессованной таблетки из бромида калия и нанесении на нее препаратов «Энрофлон» и «Кетоджект» не наблюдалось усиления сигнала, более того было зарегистрировано снижение интенсивности характеристических линий в 7 и 6 раз соответственно по сравнению анализом растворов этих препаратов (см. табл. 6). Поскольку известно, что бромид калия не образует кристаллогидратов, полученные данные свидетельствуют в пользу того, что для усиления сигнала решающее значение имеет не степень растворимости солей в воде, а способность к образованию кристаллогидратов, при этом использование солей не имеющих данного свойства приводит к уменьшению локальной концентрации растворенного вещества на поверхности таблетки и как следствие снижение интенсивности сигнала.It was shown that only salts capable of forming crystalline crystalline hydrates (for example, calcium chloride, lithium sulfates and sodium) lead to amplification of the Raman signal under the described analysis conditions. So, for example, in the manufacture of a compressed tablet from potassium bromide and application of Enroflon and Ketoject preparations, no signal amplification was observed, moreover, a decrease in the intensity of characteristic lines was recorded by 7 and 6 times, respectively, compared to the analysis of solutions of these drugs (see Table 6). Since potassium bromide is not known to form crystalline hydrates, the obtained data indicate that, to enhance the signal, it is not the degree of solubility of salts in water that is decisive, but the ability to form crystalline hydrates, while the use of salts without this property leads to a decrease in local concentration dissolved substance on the surface of the tablet and, as a consequence, a decrease in signal intensity.
Заявленный способ позволяет повысить чувствительность качественного анализа, а также предела количественного определения и предела обнаружения веществ, находящихся в водном растворе с использованием спектроскопии комбинационного рассеяния света. Использование заявленного способа позволяет сократить время анализа, а также предоставляет возможность исследовать растворы веществ нестабильных в условиях длительного воздействия лазерного излучения.The claimed method allows to increase the sensitivity of the qualitative analysis, as well as the limit of quantification and detection limit of substances in aqueous solution using Raman spectroscopy. Using the claimed method allows to reduce the analysis time, and also provides the opportunity to study solutions of unstable substances under conditions of prolonged exposure to laser radiation.
Claims (5)
Priority Applications (1)
| Application Number | Priority Date | Filing Date | Title |
|---|---|---|---|
| RU2019117131A RU2719574C1 (en) | 2019-06-03 | 2019-06-03 | Method of increasing signal-to-noise ratio when analyzing aqueous solutions using raman spectroscopy |
Applications Claiming Priority (1)
| Application Number | Priority Date | Filing Date | Title |
|---|---|---|---|
| RU2019117131A RU2719574C1 (en) | 2019-06-03 | 2019-06-03 | Method of increasing signal-to-noise ratio when analyzing aqueous solutions using raman spectroscopy |
Publications (1)
| Publication Number | Publication Date |
|---|---|
| RU2719574C1 true RU2719574C1 (en) | 2020-04-21 |
Family
ID=70415546
Family Applications (1)
| Application Number | Title | Priority Date | Filing Date |
|---|---|---|---|
| RU2019117131A RU2719574C1 (en) | 2019-06-03 | 2019-06-03 | Method of increasing signal-to-noise ratio when analyzing aqueous solutions using raman spectroscopy |
Country Status (1)
| Country | Link |
|---|---|
| RU (1) | RU2719574C1 (en) |
Citations (3)
| Publication number | Priority date | Publication date | Assignee | Title |
|---|---|---|---|---|
| US6992759B2 (en) * | 2002-10-21 | 2006-01-31 | Nippon Shokubai Co., Ltd. | Sample holder for spectrum measurement and spectrophotometer |
| CN102353665A (en) * | 2011-07-06 | 2012-02-15 | 上海海洋大学 | Surface enhanced raman spectroscopy detection method for sulfanilamide medicines |
| RU2675407C1 (en) * | 2015-05-04 | 2018-12-19 | Тсинхуа Юниверсити | Method on basis of raman spectroscopy for control of western drugs added to health food products |
-
2019
- 2019-06-03 RU RU2019117131A patent/RU2719574C1/en active
Patent Citations (3)
| Publication number | Priority date | Publication date | Assignee | Title |
|---|---|---|---|---|
| US6992759B2 (en) * | 2002-10-21 | 2006-01-31 | Nippon Shokubai Co., Ltd. | Sample holder for spectrum measurement and spectrophotometer |
| CN102353665A (en) * | 2011-07-06 | 2012-02-15 | 上海海洋大学 | Surface enhanced raman spectroscopy detection method for sulfanilamide medicines |
| RU2675407C1 (en) * | 2015-05-04 | 2018-12-19 | Тсинхуа Юниверсити | Method on basis of raman spectroscopy for control of western drugs added to health food products |
Similar Documents
| Publication | Publication Date | Title |
|---|---|---|
| Kim et al. | New reliable Raman collection system using the wide area illumination (WAI) scheme combined with the synchronous intensity correction standard for the analysis of pharmaceutical tablets | |
| Patel et al. | Multivariate approaches for simultaneous determination of avanafil and dapoxetine by UV chemometrics and HPLC-QbD in binary mixtures and pharmaceutical product | |
| Madrakian et al. | Simultaneous spectrofluorimetric determination of levodopa and propranolol in urine using feed-forward neural networks assisted by principal component analysis | |
| Vishnikin et al. | Highly sensitive sequential injection determination of p-aminophenol in paracetamol formulations with 18-molybdodiphosphate heteropoly anion based on elimination of Schlieren effect | |
| Dinç et al. | Comparative study of the continuous wavelet transform, derivative and partial least squares methods applied to the overlapping spectra for the simultaneous quantitative resolution of ascorbic acid and acetylsalicylic acid in effervescent tablets | |
| Soto et al. | Simultaneous determination of albendazole and praziquantel by second derivative spectrophotometry and multivariated calibration methods in veterinary pharmaceutical formulation | |
| Kelani et al. | FTIR combined with chemometric tools (fingerprinting spectroscopy) in comparison to HPLC: which strategy offers more opportunities as a green analytical chemistry technique for pharmaceutical analysis | |
| Haque et al. | Drug development and analysis review | |
| RU2719574C1 (en) | Method of increasing signal-to-noise ratio when analyzing aqueous solutions using raman spectroscopy | |
| Baokar et al. | Validation of simple and rapid UV-spectrophotometric method with stress degradation study for sildenafil citrate | |
| Moustafa et al. | Evaluating the efficiency of spectral resolution of univariate methods manipulating ratio spectra and comparing to multivariate methods: An application to ternary mixture in common cold preparation | |
| Narayan et al. | Simultaneous analysis of paracetamol and tramadol–Analytical method development and validation | |
| Kumar et al. | Development and validation of UV-spectroscopy based stability indicating method for the determination of fluoxetine hydrochloride | |
| Selvakumar et al. | Development and Validation of analytical method for Simultaneous estimation of Ornidazole and Cefixime trihydrate tablet dosage forms by UV spectroscopy | |
| Toral et al. | Simultaneous determination of piperacillin and tazobactam in the pharmaceutical formulation Tazonam® by derivative spectrophotometry | |
| GA et al. | VALIDATED RP-HPLC AND UV-SPECTROSCOPY METHODS FOR THE ESTIMATION OF DAPAGLIFLOZIN IN BULK AND IN TABLETS. | |
| Abd El-Rahman et al. | Three different spectrophotometric methods exploiting ratio spectra for the selective determination of iohexol in the presence of its acidic degradate | |
| Gherman et al. | Spectrophotometric determination of enalapril using tropeolin 00 | |
| RU2668526C1 (en) | Method of identification and following quantitative determination of main components in injecting medicines | |
| Markopoulou et al. | Quantitative nondestructive methods for the determination of ticlopidine in tablets using reflectance near-infrared and Fourier transform Raman spectroscopy | |
| Kumar et al. | Analytical method development and validation for the estimation of miconazole nitrate in bulk and marketed topical formulation | |
| Von Ahn et al. | Study of the forced degradation of isoconazole nitrate in bulk drug and cream formulations | |
| Kushwaha et al. | METHOD DEVELOPMENT AND VALIDATION OF AN ACTIVE METABOLITE OF PYRAZINAMIDE USING ULTRA VIOLET SPECTROPHOTOMETRY | |
| Hegazy et al. | Evaluation of the efficiency of continuous wavelet transform as processing and preprocessing algorithm for resolution of overlapped signals in univariate and multivariate regression analyses; an application to ternary and quaternary mixtures | |
| Rath et al. | Development and validation of new analytical method for the estimation of atorvastatin calcium hydrate residue by using UV spectrophotometer |