RU2184373C1 - Noninvasive method for controlling products - Google Patents
Noninvasive method for controlling products Download PDFInfo
- Publication number
- RU2184373C1 RU2184373C1 RU2001113676A RU2001113676A RU2184373C1 RU 2184373 C1 RU2184373 C1 RU 2184373C1 RU 2001113676 A RU2001113676 A RU 2001113676A RU 2001113676 A RU2001113676 A RU 2001113676A RU 2184373 C1 RU2184373 C1 RU 2184373C1
- Authority
- RU
- Russia
- Prior art keywords
- signals
- control
- threshold level
- product
- defect
- Prior art date
Links
- 238000000034 method Methods 0.000 title claims abstract description 43
- 230000007547 defect Effects 0.000 claims abstract description 67
- 238000004458 analytical method Methods 0.000 claims abstract description 28
- 238000011161 development Methods 0.000 claims abstract description 20
- 238000009659 non-destructive testing Methods 0.000 claims description 16
- 230000000694 effects Effects 0.000 abstract description 2
- 238000005516 engineering process Methods 0.000 abstract description 2
- 238000005259 measurement Methods 0.000 abstract 1
- 238000003908 quality control method Methods 0.000 abstract 1
- 239000000126 substance Substances 0.000 abstract 1
- 238000012544 monitoring process Methods 0.000 description 26
- 238000001514 detection method Methods 0.000 description 18
- 230000002950 deficient Effects 0.000 description 13
- 239000000523 sample Substances 0.000 description 13
- 230000035945 sensitivity Effects 0.000 description 11
- 238000007689 inspection Methods 0.000 description 8
- 230000007423 decrease Effects 0.000 description 7
- 239000012634 fragment Substances 0.000 description 7
- 230000000737 periodic effect Effects 0.000 description 7
- 230000008569 process Effects 0.000 description 7
- 230000005855 radiation Effects 0.000 description 7
- 238000002592 echocardiography Methods 0.000 description 6
- 230000008439 repair process Effects 0.000 description 6
- 238000010835 comparative analysis Methods 0.000 description 5
- 238000012545 processing Methods 0.000 description 5
- 230000003449 preventive effect Effects 0.000 description 3
- 238000002310 reflectometry Methods 0.000 description 3
- 230000015572 biosynthetic process Effects 0.000 description 2
- 230000000739 chaotic effect Effects 0.000 description 2
- 238000010586 diagram Methods 0.000 description 2
- 238000012423 maintenance Methods 0.000 description 2
- 238000004519 manufacturing process Methods 0.000 description 2
- 230000010355 oscillation Effects 0.000 description 2
- 230000009467 reduction Effects 0.000 description 2
- 230000001105 regulatory effect Effects 0.000 description 2
- 229910000831 Steel Inorganic materials 0.000 description 1
- 230000005534 acoustic noise Effects 0.000 description 1
- 230000008901 benefit Effects 0.000 description 1
- 230000005540 biological transmission Effects 0.000 description 1
- 230000008859 change Effects 0.000 description 1
- 230000007797 corrosion Effects 0.000 description 1
- 238000005260 corrosion Methods 0.000 description 1
- 230000001934 delay Effects 0.000 description 1
- 238000013461 design Methods 0.000 description 1
- 230000001066 destructive effect Effects 0.000 description 1
- 238000003745 diagnosis Methods 0.000 description 1
- 238000006073 displacement reaction Methods 0.000 description 1
- 238000005553 drilling Methods 0.000 description 1
- 238000013213 extrapolation Methods 0.000 description 1
- 230000003137 locomotive effect Effects 0.000 description 1
- 230000007774 longterm Effects 0.000 description 1
- 238000011089 mechanical engineering Methods 0.000 description 1
- 239000004576 sand Substances 0.000 description 1
- 239000010959 steel Substances 0.000 description 1
- 238000012360 testing method Methods 0.000 description 1
- 230000000007 visual effect Effects 0.000 description 1
- 238000011179 visual inspection Methods 0.000 description 1
Images
Landscapes
- Investigating Or Analyzing Materials By The Use Of Ultrasonic Waves (AREA)
Abstract
Description
Предлагаемый способ относится к неразрушающему контролю (дефектоскопии) изделий ультразвуковыми, электромагнитными, вихретоковыми и другими методами и может быть использован для обнаружения дефектов в различных изделиях машиностроения, транспорта и других отраслях промышленности. The proposed method relates to non-destructive testing (flaw detection) of products by ultrasonic, electromagnetic, eddy current and other methods and can be used to detect defects in various products of mechanical engineering, transport and other industries.
С целью обеспечения безопасной эксплуатации многие изделия и конструкции ответственного назначения в соответствии с действующими нормативно-техническими документами (НТД) подвергают периодическому неразрушающему контролю. К таким объектам относятся сварные соединения, трубопроводы и отдельные узлы атомных электростанций, нефте- и газотрубопроводы, подъемно-транспортное оборудование, элементы бурильных установок, железнодорожные рельсы и другие изделия ответственного назначения. Причем в зависимости от интенсивности эксплуатации объекта и степени его ответственности временной интервал (период) между очередными операциями по дефектоскопии изделия может составлять от нескольких дней до нескольких лет. В процессе каждого неразрушающего контроля производят регистрацию сигналов контроля и координат участков изделия, на которых приняты сигналы. In order to ensure safe operation, many products and structures of critical designation are subjected to periodic non-destructive testing in accordance with the current regulatory and technical documents (NTD). Such objects include welded joints, pipelines and individual nodes of nuclear power plants, oil and gas pipelines, hoisting and conveying equipment, elements of drilling rigs, railway rails and other critical products. Moreover, depending on the intensity of operation of the object and the degree of its responsibility, the time interval (period) between the next operations for inspection of the product can be from several days to several years. In the process of each non-destructive testing, the control signals and the coordinates of the product sections on which the signals are received are recorded.
В последнее время в связи с активным развитием цифровой техники и приборостроения стало возможным обеспечивать регистрацию всех сигналов контроля совместно с данными о координатах полученных сигналов на долговременный носитель (магнитные носители, винчестер компьютера и т.п.). Recently, in connection with the active development of digital technology and instrumentation, it has become possible to register all control signals together with data on the coordinates of the received signals on a long-term medium (magnetic media, computer hard drive, etc.).
Возможность сравнения сигналов, полученных в ходе текущего контроля с результатами, полученными в процессе предыдущего контроля, открывает новые возможности по идентификации сигналов от дефекта, мониторингу развития дефектов и существенно повышает достоверность неразрушающего контроля. The ability to compare signals received during the current control with the results obtained during the previous control, opens up new possibilities for identifying signals from a defect, monitoring the development of defects and significantly increases the reliability of non-destructive testing.
В предлагаемой заявке рассмотрена возможность дальнейшего повышения достоверности неразрушающего контроля при многократной дефектоскопии ответственных объектов. In the proposed application, the possibility of further improving the reliability of non-destructive testing with multiple defectoscopy of critical facilities is considered.
Предлагаемый способ контроля рассматривается на примере ультразвуковой дефектоскопии железнодорожных рельсов, уложенных в путь, как наиболее представительного класса ответственных объектов, подвергающихся интенсивной эксплуатации. Естественно способ может быть применен и при контроле других объектов, подвергающихся периодическому контролю различными методами дефектоскопии с регистрацией сигналов контроля. The proposed control method is considered by the example of ultrasonic flaw detection of railway rails laid in the path, as the most representative class of critical objects subjected to intensive operation. Naturally, the method can be applied to the control of other objects subjected to periodic inspection by various flaw detection methods with the registration of control signals.
С целью обеспечения безопасности движения поездов на отечественных железных дорогах рельсы, уложенные в пути 1- и 2-го класса, в зависимости от интенсивности движения поездов, пропущенного тоннажа и других факторов в соответствии с Приказом МПС РФ 2-113 от 25 с февраля 1997 г. должны подвергаться дефектоскопированию ультразвуковыми съемными дефектоскопами, магнитными и ультразвуковыми вагонами-дефектоскопами до 84 раз в год (см. табл. 2.1 [1] ), т.е. чаще, чем один раз в каждую неделю. In order to ensure the safety of train traffic on domestic railways, the rails laid in the 1st and 2nd class tracks, depending on the train traffic, missed tonnage and other factors in accordance with the Order of the Ministry of Railways of the Russian Federation 2-113 dated February 25, 1997 . must be flawed by removable ultrasonic flaw detectors, magnetic and ultrasonic flaw detectors up to 84 times a year (see table 2.1 [1]), i.e. more often than once every week.
В основном на большинстве зарубежных железных дорог дефектоскопирование рельсов осуществляют 1-2 раза в год. Даже на самых интенсивно эксплуатируемых участках пути железных дорог Северной Америки рельсы контролируют не чаще, чем 16 раз в году (через каждые 45 дней) [2], т.е. реже, чем на Российских железных дорогах, в пять раз. Basically, on most foreign railways, flaw detection of rails is carried out 1-2 times a year. Even on the most intensively exploited sections of the railways of North America, the rails are monitored no more than 16 times a year (every 45 days) [2], i.e. five times less than on the Russian railways.
При ультразвуковом контроле рельсов как на зарубежных, так и на отечественных железных дорогах, вагоны-дефектоскопы осуществляют сплошную (непрерывную) регистрацию сигналов контроля на всей протяженности контролируемого пути с одновременной регистрацией координат сигналов, позволяющих осуществить привязку обнаруженных дефектов к пути. Дефектоскопные тележки старой конструкции (типа ПОИСК), эксплуатируемые на отечественных железных дорогах, в основном не имеют сплошной регистрации сигналов. Однако дефектоскопы нового поколения типа АВИ-КОН-01, РДМ-2 и АСД-02 [3], являясь цифровыми приборами, предусматривают наличие регистратора (встроенного или в виде отдельной приставки) для непрерывной регистрации сигналов контроля на всем пути сканирования. During ultrasonic monitoring of rails on both foreign and domestic railways, flaw detectors carry out continuous (continuous) registration of control signals along the entire length of the track being monitored, while simultaneously registering the coordinates of the signals that allow the detection of defects to be linked to the track. Flaw detection carts of an old design (type SEARCH), operated on domestic railways, generally do not have a continuous registration of signals. However, new generation flaw detectors such as AVI-KON-01, RDM-2 and ASD-02 [3], being digital devices, provide for a recorder (built-in or in the form of a separate set-top box) for continuous recording of control signals along the entire scanning path.
Таким образом, появляется возможность выполнения сравнительного анализа сигналов контроля, полученных в ходе многократной дефектоскопии конкретных участков рельсового пути. Thus, it becomes possible to perform a comparative analysis of control signals obtained during repeated flaw detection of specific sections of the rail track.
Вагоны-дефектоскопы позволяют осуществлять сплошную регистрацию сигналов контроля и отображать сигналы в процессе проезда на дисплеях дефектоскопического комплекса. При обнаружении в процессе анализа отображаемых сигналов контроля выделяют группы сигналов, удовлетворяющих определенным (заданным в НТД) критериям и осуществляют распечатку на принтере фрагмента дефектограммы ("стоп кадр") с координатами пути, на котором обнаружены эти сигналы. В последующем фрагменте дефектограммы передаются для вторичного осмотра данного участка рельсового пути, уточнения дефектного места с помощью переносного ультразвукового дефектоскопа с пьезопреобразователем (ПЭП), позволяющим осуществлять сканирование (перемещение) по поверхности рельса (если необходимо, по всему периметру) вручную. По результатам визуального осмотра, ручного контроля дефектного сечения рельса принимается окончательное решение о степени дефектности данного участка рельса и в зависимости от потенциальной опасности дефекта принимаются соответствующие меры (ремонт, замена рельса, оставление рельса в пути до следующего контроля). Flaw detectors allow continuous registration of control signals and display signals during travel on the displays of the flaw detector complex. When detecting the displayed control signals is detected during the analysis, groups of signals are selected that satisfy certain (specified in the technical documentation) criteria and a defectogram fragment ("freeze frame") is printed on the printer with the coordinates of the path on which these signals are detected. In the following fragment, the defectograms are transmitted for a second inspection of this section of the rail track, to clarify the defective place using a portable ultrasonic flaw detector with a piezoelectric transducer (PEP), which allows you to scan (move) along the rail surface (if necessary, around the entire perimeter) manually. Based on the results of visual inspection, manual control of the defective section of the rail, a final decision is made on the degree of defectiveness of the given section of the rail and appropriate measures are taken (repair, replacement of the rail, leaving the rail in transit until the next inspection), depending on the potential danger of the defect.
При контроле рельсов электромагнитным (магнитодинамическим) способом в качестве критерия сигнала от дефекта является превышение амплитуды выше заданного порога (уровня) [4], а при ультразвуковом контроле - прием пачки эхо-сигналов с содержанием в пачке импульсов больше определенного (заданного НТД) количества. Причем во всех отечественных и зарубежных ультразвуковых вагонах-дефектоскопах и дефектоскопных автомотрисах регистрацию эхо-сигналов осуществляют на развертке типа В (см. патент РФ 2149393 [5]), при котором любой эхо-сигнал, превышающий заданный амплитудный порог, регистрируется в координатах "время распространения ультразвуковых колебаний tузк в контролируемом изделии - время движения tдв преобразователя вдоль изделия" в виде яркостной отметки (точки) [6].When monitoring the rails in an electromagnetic (magnetodynamic) way, the amplitude signal exceeds the specified threshold (level) [4] as a criterion for a signal from a defect, and in ultrasonic testing, receiving a packet of echo signals containing more than a certain (specified NTD) quantity in a packet of pulses. Moreover, in all domestic and foreign ultrasonic flaw detectors and flaw detectors, echo signals are recorded on a Type B scan (see RF patent 2149393 [5]), in which any echo signal exceeding a given amplitude threshold is recorded in coordinates "time the propagation of ultrasonic vibrations t narrow in the product being monitored is the travel time t dv of the transducer along the product "in the form of a brightness mark (point) [6].
От дефектов и конструктивных отражателей (болтовые отверстия, торцы рельса и т.п.) обычно принимается упорядоченная группа (пачка) эхо-сигналов, отображающихся на развертке типа В в виде горизонтальных (для прямых ПЭП) или наклонных (для наклонных ПЭП) линий, состоящих из отдельных точек (эхо-сигналов) [6]. От всевозможных помех (структурные отражения, попадание песка и грязи под преобразователи, электрические и акустические шумы и т.п.) - в виде отдельных точек и хаотических групп эхо-сигналов. Иногда группы сигналов от помех весьма похожи группам (пачкам) сигналов от дефектов, что значительно затрудняет процесс расшифровки дефектограмм, обуславливает необходимость вторичной проверки участка с подозрением на дефект с помощью переносного дефектоскопа и снижает достоверность контроля. Кроме того, резко снижается и производительность контроля с помощью дефектоскопической подвижной единицы (вагона-дефектоскопа или дефектоскопией автомотрисы). Так как вторичный контроль дефектных участков рельсов с помощью переносных дефектоскопов, как правило, выполняют работники подвижной единицы, как наиболее квалифицированные и умеющие "читать" выдаваемые вагоном-дефектоскопом фрагменты дефектограмм. В результате значительное время тратится на вторичный контроль подозрительных участков, и месячная производительность контроля рельсов ультразвуковыми вагонами-дефектоскопами не превышает 1500-2000 км (несмотря на то, что при скорости контроля 50-60 км/ч вагон может проверять до 250 км пути в смену, т.е. не менее 5000 км в месяц). From defects and structural reflectors (bolt holes, rail ends, etc.), an ordered group (pack) of echo signals is usually displayed on a scan of type B in the form of horizontal (for direct probes) or inclined (for inclined probes) lines, consisting of individual points (echo signals) [6]. From all kinds of interference (structural reflections, hit of sand and dirt under the transducers, electrical and acoustic noise, etc.) - in the form of individual points and chaotic groups of echo signals. Sometimes groups of signals from interference are very similar to groups (packs) of signals from defects, which greatly complicates the process of decoding defectograms, necessitates a secondary check of the area with suspected defects using a portable flaw detector and reduces the reliability of the control. In addition, the control performance with the help of a flaw detection unit (flaw car or flaw detector) is sharply reduced. Since the secondary control of defective sections of rails with the help of portable flaw detectors, as a rule, is carried out by employees of a mobile unit, as the most qualified and able to "read" fragments of defectograms issued by the flaw detector car. As a result, considerable time is spent on secondary control of suspicious areas, and the monthly productivity of rail monitoring by ultrasonic flaw detectors does not exceed 1500-2000 km (despite the fact that at a speed of control of 50-60 km / h, the car can check up to 250 km of track per shift , i.e. at least 5000 km per month).
Для повышения производительности и достоверности контроля рельсов с помощью подвижных средств дефектоскопии на железных дорогах Австралии и Америки применяют усовершенствованную методику (способ) контроля. Например, способ и устройство дефектоскопии рельсов по патенту США 5970438 от 19.10.99 [7] заключается в том, что контроль рельсов производят первой подвижной единицей, результаты контроля отображаются на цифровом и аналоговом дисплеях, производят анализ сигналов по определенным критериям, по результатам анализа принимают решение о возможном дефекте, запоминают в виде моментального снимка (стоп-кадр) сигналы контроля, соответствующие дефектному участку, передают данный "стоп кадр" второй подвижной единице, следующей за первой единицей по этой же рельсовой колее, производят вторичный анализ принятых сигналов и при необходимости принимают решение о контроле данного дефектного участка рельса с помощью ручного дефектоскопа, производят вторичный контроль участка с помощью (переносного) ручного дефектоскопа. Результаты контроля передают на первую подвижную единицу для последующей корректировки критериев браковки, а по результатам ручного контроля принимают необходимые меры по ремонту участка рельса или его замене на бездефектный рельс. Причем первичный анализ сигналов контроля на борту первой подвижной единицы производят в полуавтоматическом режиме, в частности, используя известные технические решения, предложенные в патентах США 5574224 [8] и 5777891 [9]. To increase the productivity and reliability of rail monitoring using mobile flaw detection tools on the railways of Australia and America, an improved control technique (method) is used. For example, the method and device for rail flaw detection according to US Pat. No. 5,970,438 of 10/19/99 [7] consists in the fact that the rails are inspected by the first moving unit, the inspection results are displayed on digital and analog displays, the signals are analyzed according to certain criteria, and the analysis results are accepted the decision about a possible defect, the control signals corresponding to the defective section are stored in the form of a snapshot (freeze frame), transmit this “freeze frame” to the second mobile unit following the first unit for this rail track, produce secondary analysis of the received signals and if necessary, make a decision on the control of the defective portion with a hand rail flaw produce secondary control portion via (portable) manual flaw. The control results are transferred to the first mobile unit for subsequent adjustment of the rejection criteria, and according to the results of manual control, the necessary measures are taken to repair the rail section or replace it with a defect-free rail. Moreover, the primary analysis of control signals on board the first mobile unit is performed in a semi-automatic mode, in particular, using well-known technical solutions proposed in US patents 5574224 [8] and 5777891 [9].
Последовательный контроль одного и того же участка изделия (рельса) с помощью двух подвижных единиц, следующих друг за другом, существенно повышает производительность и эффективность контроля. На вторую подвижную единицу (автомотрису дефектоскопную) по радиоканалу передается полная информация о сигналах контроля дефектного участка. Вторичным анализом этих сигналов и контролем с помощью переносного дефектоскопа занимается специально обученный экипаж второй подвижной единицы. При этом экипаж первой подвижной единицы (вагона-дефектоскопа) без остановок продолжает непрерывный контроль рельсов и не теряет время на вторичный контроль. В то же время экипажу первой подвижной единицы всегда известны результаты вторичного осмотра дефектного участка, что позволяет внести необходимые коррективы в критерии дифференциации сигналов на сигналы от дефектов и помехи с учетом особенностей контролируемого участка рельсового пути (тип рельса, износ, коррозия и т.п.). Кроме того, окончательный результат о выполненном контроле может быть получен буквально через несколько минут (от 10 до 30-40 мин) после обнаружения сигналов от дефекта первой подвижной единицей, а не через несколько часов или суток, как при контроле только одним вагоном-дефектоскопом. Sequential control of the same section of the product (rail) with the help of two moving units, following each other, significantly increases the productivity and effectiveness of the control. To the second mobile unit (defectoscopic car track), complete information on the control signals of the defective section is transmitted over the radio channel. A secondary trained crew of the second mobile unit is engaged in the secondary analysis of these signals and control using a portable flaw detector. At the same time, the crew of the first mobile unit (flaw detector car) without stops continues continuous monitoring of the rails and does not lose time on the secondary control. At the same time, the crew of the first mobile unit is always aware of the results of the secondary inspection of the defective section, which allows you to make the necessary adjustments to the criteria for differentiating signals from signals from defects and interference, taking into account the features of the controlled section of the rail track (rail type, wear, corrosion, etc. ) In addition, the final result of the control performed can be obtained literally in a few minutes (from 10 to 30-40 minutes) after the detection of signals from the defect by the first mobile unit, and not after a few hours or days, as when monitoring with only one flaw detector car.
Определенными недостатками способа (аналога заявляемого технического решения) является то, что известный способ не позволяет сократить количество вторичных осмотров пути по показаниям первого вагона-дефектоскопа, не позволяет обнаружить дефекты до достижении ими критических размеров и требует увеличения первичных капитальных вложений на покупку, эксплуатацию и обслуживание не одного, а двух подвижных единиц. Таким образом аналог заявляемого способа обладает низкой чувствительностью и производительностью контроля и требует значительных затрат на контроль (т.е. не экономичен). Certain disadvantages of the method (analogue of the claimed technical solution) is that the known method does not allow to reduce the number of secondary inspections of the track according to the testimony of the first flaw detector car, does not allow to detect defects before they reach critical sizes and requires an increase in the initial capital investment for the purchase, operation and maintenance not one, but two moving units. Thus, the analogue of the proposed method has low sensitivity and control performance and requires significant control costs (i.e., it is not economical).
Наиболее близким к данному изобретению и принятым за прототип является способ неразрушающего контроля изделий, в частности железнодорожных рельсов, предложенный израильскими специалистами G. Krug, V. Orjelik, R. Aharoni и опубликованный в трудах XV Всемирной конференции по неразрушающему контролю (г. Рим, 15-21 октября 2000 г.) [10], заключающийся в том, что осуществляют многократный (два или более раз) контроль изделия с определенным интервалом времени между проверками, сканируя изделие при идентичных условиях, регистрируют все сигналы контроля, превышающие установленный (браковочный) порог регистрации и координаты изделия, соответствующие этим сигналам; отображают и анализируют зарегистрированные сигналы, по явным признакам принимают решение о дефектности конкретных участков изделия немедленно, а по признакам докритических дефектов анализируются сигналы, полученные при предыдущих контролях (сканированиях), выделяют различия сигналов между обнаруженными при двух или более сканированиях, по результатам анализа осуществляют мониторинг процесса развития дефекта и принимают решение о дефектности обнаруженного участка изделия. Closest to this invention and adopted as a prototype is a method of non-destructive testing of products, in particular railway rails, proposed by Israeli experts G. Krug, V. Orjelik, R. Aharoni and published in the proceedings of the XV World Conference on Non-destructive Testing (Rome, 15 -21 October 2000) [10], which consists in the fact that they carry out multiple (two or more times) inspection of the product with a certain time interval between checks, scanning the product under identical conditions, record all control signals exceeding e set (rejection) registration threshold and product coordinates corresponding to these signals; display and analyze the recorded signals, for obvious signs make a decision about the defectiveness of specific areas of the product immediately, and for signs of subcritical defects, analyze the signals obtained from previous controls (scans), highlight the differences between the signals detected during two or more scans, and monitor the results of the analysis the process of development of the defect and decide on the defectiveness of the detected area of the product.
Безусловным достоинством способа, принятого за прототип, является введение сравнительного анализа сигналов, полученных при многократном (двух или более) контроле изделия, что позволяет по анализу последовательно зарегистрированных сигналов осуществлять мониторинг (наблюдение, анализ) развития дефекта. При интенсивном развитии дефекта создается возможность обнаружения его до того, как он достигнет критических размеров, и принять своевременные предупредительные меры по устранению его в плановом порядке без аварийной остановки производственного цикла (например, без остановки движения поездов по контролируемым рельсам). Одновременно сравнительный анализ сигналов, полученных при многократном (двух или более) контроле позволяет отделять "паразитные" сигналы (шумы, помехи) от действительных отражений в изделии, т.к. шумы, являясь случайным процессом, как правило, не повторяются при двух или более сканированиях в одном и том же месте изделия. The undoubted advantage of the method adopted for the prototype is the introduction of a comparative analysis of the signals received during multiple (two or more) product monitoring, which allows the analysis of sequentially recorded signals to monitor (observe, analyze) the development of the defect. With the intensive development of a defect, it becomes possible to detect it before it reaches critical dimensions and take timely preventive measures to eliminate it as planned without an emergency stop of the production cycle (for example, without stopping the movement of trains on controlled rails). At the same time, a comparative analysis of the signals received during multiple (two or more) control allows one to separate “spurious” signals (noise, noise) from the actual reflections in the product, because noise, being a random process, as a rule, is not repeated with two or more scans in the same place of the product.
При этом существенно снижается вероятность ложной тревоги. Сравнение результатов двух (и более) контрольных сканирований облегчает идентификацию сигналов от дефектов, даже если они не достигли критических размеров. Как следует из результатов внедрения способа, принятого за прототип, на израильских железных дорогах двухэтапная методика анализа сигналов позволила повысить вероятность обнаружения дефектов с критическими размерами до 100%, а с докритическими размерами с 50 до 90% [10]. In this case, the probability of false alarm is significantly reduced. Comparison of the results of two (or more) control scans facilitates the identification of signals from defects, even if they have not reached critical sizes. As follows from the results of introducing the method adopted as a prototype, a two-stage signal analysis technique on Israeli railways increased the probability of detecting defects with critical sizes up to 100%, and with subcritical sizes from 50 to 90% [10].
Недостатком способа, принятого за прототип, является то, что регистрация сигналов при контроле проводится при одном, установленном амплитудном пороге, что не позволяет выполнить полноценный мониторинг развития дефекта за короткий временной интервал и обуславливает необходимость проведения многократных (более двух раз) проездов (сканирования) по одному и тому же участку рельсового пути Последнее снижает чувствительность и достоверность контроля и повышает эксплуатационные затраты на содержании рельсового пути и выполнение неразрушающего контроля. The disadvantage of the method adopted for the prototype is that the registration of signals during control is carried out at one set amplitude threshold, which does not allow for full monitoring of the development of the defect in a short time interval and necessitates the conduct of multiple (more than two times) drives (scans) along one and the same section of the rail track, the latter reduces the sensitivity and reliability of the control and increases operating costs for the maintenance of the rail track and the implementation of non-destructive present control.
Технической задачей, решаемой заявляемым изобретением, является повышение чувствительности и достоверности неразрушающего контроля изделий при одновременном снижении затрат на проведение контроля и как следствие на эксплуатацию изделия. The technical problem solved by the claimed invention is to increase the sensitivity and reliability of non-destructive testing of products while reducing the cost of control and, consequently, the operation of the product.
Поставленная задача достигается тем, что осуществляют многократный контроль изделия, сканируя изделие при идентичных условиях с определенными временными интервалами между сканированиями, регистрируют сигналы контроля на браковочном пороговом уровне, дополнительно при сканированиях сигналы регистрируют на дополнительных пороговых уровнях, находящихся ниже браковочного порогового уровня, при обнаружении сигналов, превышающих браковочный уровень, принимают во внимание и сигналы, полученные па данном участке контролируемого изделия при текущем и предыдущем сканированиях на пороговых уровнях ниже браковочного уровня, и по результатам анализа принимают решение о степени опасности обнаруженного дефекта, причем количество k уровней регистрации, находящихся ниже браковочного порогового уровня, составляет, но меньшей мере, один или более уровней (k≥l). The task is achieved by the fact that they carry out multiple product control by scanning the product under identical conditions with certain time intervals between scans, control signals are recorded at the rejection threshold level, additionally, during scans, signals are recorded at additional threshold levels below the rejection threshold level, when signals are detected exceeding the rejection level, take into account the signals received on this section of the controlled product in the current and previous scans at threshold levels below the rejection level, and according to the results of the analysis, a decision is made about the degree of danger of the detected defect, and the number k of registration levels below the rejection threshold is at least one or more levels (k≥l )
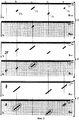
На фиг. 1 представлена схема регистрации сигналов на браковочном и двух (k= 2) дополнительных пороговых уровнях при однократном сканировании изделия на развертках типа А и типа В. На фиг.2 - три пары дефектограмм (типа В), полученные при сканировании контролируемого изделия с определенной (месячной) периодичностью на браковочном и одном дополнительном пороговом уровнях, на фиг. 3 графики, демонстрирующие возможности аналитического прогнозирования ожидаемых значений числа импульсов от одного из потенциальных дефектов в контролируемом изделии благодаря регистрации сигналов контроля одновременно на двух пороговых уровнях: на браковочном и дополнительном. In FIG. Figure 1 shows the signal registration scheme at the rejection and two (k = 2) additional threshold levels during a single scan of the product on type A and type B sweeps. Figure 2 shows three pairs of defectograms (type B) obtained by scanning a controlled product with a specific ( monthly) frequency at the rejection and one additional threshold level, in FIG. 3 graphs demonstrating the possibilities of analytical forecasting of the expected values of the number of pulses from one of the potential defects in the controlled product due to the registration of control signals at two threshold levels simultaneously: at the reject and additional levels.
Позиции на фиг.1, 2 и 3 обозначают: контролируемое изделие 1; преобразователь (электроакустический преобразователь) 2, поверхность сканирования 3 изделия 1; диаграмму направленности 4 преобразователя 2 с углом ввода α ультразвуковых колебаний в изделие 1 и с углом раскрытия 2φp диаграммы направленности, отражатели 5, 6 и 7 разных размеров в изделии 1; развертка 8 типа А, отображающая амплитуды эхо-сигналов от отражателей в изделии 1 в координатах "амплитуда U эхо-сигиалов - время tp распространения у.з. колебаний в изделии" (на фиг.1 развертка типа А повернута на 90o относительно положения, традиционно представляемого на экранах типовых ультразвуковых дефектоскопов); развертка 9 типа В, отображающая эхо-сигналы от отражателей 5, 6 и 7 в изделии 1 в координатах "время tp распространения ультразвуковых колебаний в изделии - время tдв движения преобразователя 2 по поверхности сканирования 3 изделия 1". На развертке типа А зондирующий импульс 10 и эхо-сигналы 11 отображаются в виде импульсов, а на развертке типа В эти же сигналы отображаются в виде точек (яркостных отметок), которые в процессе перемещения преобразователя 2, сливаясь, образуют линию зондирующих импульсов 12 и наклонные линии пачек эхо-сигналов 13 с нижним индексом n, соответствующим номеру отражателей 5, 6 и 7 (135, 136 и 137).Positions in figures 1, 2 and 3 denote: controlled
Получаемые в процессе сканирования преобразователя 2 по изделию 1 амплитудные огибающие эхо-сигналов от отражателей 5, 6 и 7 на развертке типа А обозначены как U(t)5, U(t)6 и U(t)7, а временные огибающие (пачки) эхо-сигналов от данных отражателей на развертке типа В - как 135, 136, и 137 соответственно, где нижний индекс в обозначении пачек эхо-сигиалов указывает на номер отражателя, от которого получены пачки эхо-сигналов.The amplitude envelopes of the echo signals received from the
Для демонстрации особенностей формирования пачек эхо-сигналов на развертке типа В при разных пороговых уровнях регистрации на фиг.1 приведены три пары разверток типа А и типа В (B1, В2 и B3), соответствующие браковочному (UБР) и двум (k=2) дополнительным UП1 и UП2 пороговым уровням. Дефектограмма B1 соответствует случаю регистрации сигналов на развертке типа В при пороговом уровне UП1, дефектограмма В2 - при пороговом уровне UП2 и В3 - при браковочном пороге UБР. Видно, что чем больше амплитудный порог регистрации, тем короче пачка эхо-сигналов на развертке типа В (например, можно сравнить пачки эхо-сигналов 135 на дефектограммах B1, В2 и В3 на фиг.1, полученные при соответствующих уровнях UП1, UП2 и UБР).To demonstrate the features of the formation of packs of echo signals on a scan of type B at different threshold levels of registration, Fig. 1 shows three pairs of scan of type A and type B (B 1 , B 2 and B 3 ) corresponding to reject (U BR ) and two ( k = 2) additional U П1 and U П2 threshold levels. Defectogram B 1 corresponds to the case of recording signals on scan type B under the threshold level U P1, defectogram B 2 - at a threshold level of S2 U and V 3 - if the acceptance threshold U BR. It can be seen that the higher the amplitude threshold of registration, the shorter the packet of echoes on a scan of type B (for example, you can compare the packets of echo signals 13 5 on the defectograms B 1 , B 2 and B 3 in figure 1, obtained at the corresponding levels U P1 , U P2 and U BR ).
Развертка типа А для всех случаев остается идентичной (меняется только амплитудный уровень порога регистрации UП1, UП2 и UБР) и на фиг.1 получена путем смещения первоначальной развертки (8 типа А вниз по плоскости фиг.1.The Type A scan for all cases remains identical (only the amplitude level of the registration threshold U P1 , U P2 and U BR changes) and in Fig. 1 it was obtained by shifting the initial scan (type 8 A down the plane of Fig. 1.
Нa фиг.2 представлены три пары дефектограмм (типа А и В), полученные на одном и том же протяженном участке контролируемого изделия 1 при сканировании (контроле) его с определенным временным интервалом (например, с периодичностью месяц в октябре (Ок), в ноябре (Н) и в декабре (Д)). При каждом сканировании регистрация сигналов на развертке типа В производилась в отличие от показанного на фиг.1 примера только на двух амплитудных пороговых уровнях: на дополнительном пороговом уровне UП1, находящемся ниже браковочного порога, и на браковочном (UБР) пороговом уровне (соответственно дефектограммы B1 и В2). Причем второй амплитудный порог UБР является основным (браковочным), на котором проводят первичный анализ сигналов контроля (на фиг.2 все дефектограммы, полученные при пороговом уровне UБР, выделены серым фоном).Figure 2 presents three pairs of defectograms (types A and B) obtained on the same extended section of the monitored
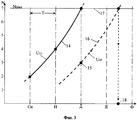
На фиг.3 в координатах текущее время (эксплуатации изделия) - количество эхо-сигналов (импульсов), принятых от дефекта, в виде графика 14 показан рост числа импульсов от конкретного отражателя (дефекта) при регистрации сигналов в процессе многократного контроля на дополнительном пороговом уровне, находящемся ниже порогового уровня. Количество импульсов, принятых от дефекта и зарегистрированных на браковочном пороговом уровне при одном из сканирований (в декабре -Д), на графике отображено в виде точки 15. Через эту точку параллельно линии 14 проведена пунктирная линия 15, отображающая предполагаемую тенденцию роста эхо-импульсов от дефекта, превышающих браковочный пороговый уровень с течением времени. Точка пересечения кривой 16 с горизонтальной линией 17, отображающей браковочный порог количества эхо-импульсов от искомого дефекта, позволяет получить на временной оси точку 18 времени достижения размера дефекта критической величины. Figure 3 in the coordinates of the current time (product operation) is the number of echo signals (pulses) received from the defect, in the form of
Способ неразрушающего контроля изделий реализуется следующим образом. The method of non-destructive testing of products is implemented as follows.
На контролируемое изделие 1 устанавливают электроакустический преобразователь 2 и перемещают его с постоянной скоростью V по поверхности 3 изделия 1. Ультразвуковые колебания, излучаемые преобразователем 2 в виде зондирующих импульсов 10, вводятся в контролируемое изделие под определенным углом α в пределах диаграммы направленности 4. При наличии в контролируемом изделии 1 отражателей (дефектов 5, 6 и 7) ультразвуковые колебания отражаются от дефектов и последовательно принимаются преобразователем 2 в виде эхо-импульсов 11, которые могут отображаться на дисплее (экране электронно-лучевой трубки) дефектоскопа в виде развертки типа А в координатах амплитуда U эхо-сигналов - время tр, распространения ультразвуковых колебании в изделии.An electro-
По мере перемещения преобразователя 2 по поверхности сканирования 3 на развертке типа А формируются амплитудные огибающие эхо-сигналов, обусловленные последовательным озвучиванием отражателя под разными углами в пределах диаграммы направленности 4 преобразователя 2. При этом в начальный момент времени, например при озвучивании отражателя 5, плоскость отражателя озвучивается под углом α+φp (крайним на фиг.1 - верхним лучом диаграммы) и эхо-сигнал на развертке типа А появляется на определенном расстоянии от зондирующего импульса. По мере движения преобразователя расстояние между отражателем и датчиком сокращается и отражатель 5 начинает озвучиваться осью диаграммы направленности и, наконец, другим краем диаграммы направленности (под углом α-φp). При этом временное положение эхо-сигнала на развертке типа А плавно изменяется и соответственно уменьшается временной интервал между зондирующим импульсом 10 и эхо-сигналом 11. Меняется и амплитуда эхо-сигнала от минимального при озвучивании отражателя краем диаграммы направленности до максимума при озвучивании отражателя осью диаграммы и снова до минимума при озвучивании другим краем диаграммы.As the
В результате на развертке типа А формируется амплитудная огибающая эхо-сигнала U(t). На фиг. 1 показано формирование амплитудных огибающих U(t)5, U(t)6, и U(1)7 от отражателей 5, 6 и 7 соответственно. В связи с тем, что отражающие свойства и глубина залегания указанных отражателей различны, то и амплитудные огибающие имеют разные параметры (максимальную амплитуду и условную высоту) [11] и разную удаленность эхо-сигналов от зондирующего импульса. Причем расстояние (временной интервал t) от линии зондирующих импульсов 12 до центра наклонной линии, отображающей пачку эхо-сигналов 13 от конкретного отражателя, зависит от глубины h залегания выявляемого отражателя и соответственно тем больше, чем глубже залегает отражатель:
t = 2h/c•cosα, (1)
где с - скорость распространения ультразвуковых колебаний в контролируемом изделии (при наклонном вводе у.з. колебаний скорость поперечной волны в стали равна 3260 м/с).As a result, the amplitude envelope of the echo signal U (t) is formed on a type A scan. In FIG. 1 shows the formation of the amplitude envelopes U (t) 5 , U (t) 6 , and U (1) 7 from
t = 2h / c • cosα, (1)
where c is the velocity of propagation of ultrasonic vibrations in the controlled product (with inclined input of ultrasonic vibrations, the shear wave velocity in steel is 3260 m / s).
В зависимости от амплитудного порога регистрации развертка типа В для каждого порога (на фиг.1: UП1, UП2 и UБР) имеет разный вид. Так, например, при низком амплитудном пороге (UП1) эхо-сигналы от всех трех отражателей превышают порог регистрации и на развертке В1 формируются три наклонные линии, центры которых по оси tдв соответствуют моменту озвучивания преобразователем 2 осью диаграммы направленности 4 соответствующих отражателей 5, 6 и 7, а по временной оси tp - временным положениям максимумов эхо-сигналов от данных отражателей (см. фиг.1). При высоком пороге (UБР) только огибающая U(t)5 превышает порог регистрации и соответственно на развертке типа В (дефектограмма В3) наблюдается только одна наклонная линия, отображающая эхо сигналы 135 от отражателя 5.Depending on the amplitude threshold of registration, the type B sweep for each threshold (in Fig. 1: U П1 , U П2 and U БР ) has a different look. For example, at low amplitude threshold (U S1) of the echo signals from all three reflectors exceed the detection threshold and the reamer In one form three diagonal lines, whose axes centers t dd match
При этом количество эхо-сигналов, отображаемых на развертке типа В в виде точек, на дефектограмме В3, меньше, чем на дефектограмме B1. Как известно (см. стр. 93 [1] ), количество N эхо-сигналов (импульсов), принимаемых от каждого отражателя, определяется величиной условного размера отражателя ΔL по длине (по пути сканирования) изделия, скоростью V перемещения преобразователя 2 и частотой посылок зондирующих импульсов F:
![]()
Так как при изменении порога регистрации соответственно изменяется и величина условного размера ΔL, также отсчитываемая на соответствующем уровне, то в соответствии с (2) уменьшается и количество фиксируемых импульсов. Например, дефектоскопная тележка, двигающаяся со скоростью V=1 м/с, при частоте посылок зондирующих импульсов F=1000 Гц от дефекта с условной протяженностью ΔL 10 мм в соответствии с (2) примет пачку эхо-сигналов, состоящую из 10 импульсов (N=10). При повышении амплитудного порога регистрации условный размер ΔL уменьшается и количество сигналов, формирующих пачку эхо-импульсов, также уменьшается (N <10), что наглядно демонстрируется на фиг.1.In this case, the number of echo signals displayed on the scan type B in the form of dots on the defectogram B 3 is less than on the defectogram B 1 . As is known (see page 93 [1]), the number N of echo signals (pulses) received from each reflector is determined by the conditional size of the reflector ΔL along the length (along the scanning path) of the product, the speed V of the
![]()
Since when the registration threshold changes, the value of the conditional size ΔL, also counted at the corresponding level, changes accordingly, in accordance with (2) the number of fixed pulses decreases. For example, a flaw trolley moving at a speed of V = 1 m / s, with a probe pulse frequency of F = 1000 Hz from a defect with a conditional length ΔL of 10 mm, in accordance with (2) will receive an echo packet consisting of 10 pulses (N = 10). With an increase in the amplitude threshold of detection, the conventional size ΔL decreases and the number of signals forming a packet of echo pulses also decreases (N <10), which is clearly shown in Fig. 1.
В соответствии с действующими НТД, при контроле изделий эхо-методом и наклонном вводе ультразвуковых колебаний существуют следующие критерии отнесения группы эхо-сигналов к сигналам от дефектов:
-амплитуды эхо-сигналов должны превышать браковочный порог (Uд ≥ UБР);
- количество импульсов (эхо-сигналов) в пачке должно быть больше заданного (N ≥ Nбрак);
- по мере перемещения преобразователя по поверхности изделия сигналы в пачке должны иметь временное смещение относительно зондирующего импульса, что на развертке типа В отображается в виде точек, лежащих на одной наклонной линии (см. фиг.1 и 2).In accordance with the current scientific and technical standards, when monitoring products with an echo method and inclined input of ultrasonic vibrations, the following criteria exist for assigning a group of echo signals to signals from defects:
- the amplitudes of the echo signals must exceed the rejection threshold (U d ≥ U BR );
- the number of pulses (echo signals) in the packet must be greater than the specified one (N ≥ N rejects );
- as the transducer moves along the surface of the product, the signals in the packet must have a temporary displacement relative to the probe pulse, which is displayed on a scan of type B in the form of points lying on one oblique line (see figures 1 and 2).
Для рассматриваемого примера при регистрации сигналов на браковочном пороговом уровне (UБР) примем критерий браковки по числу N импульсов в пачке эхо-сигналов: Nбрак ≥ 7. На фиг.2 фрагменты дефектограмм, соответствующие конкретным сечениям А, В, С, D и Е контролируемого изделия 1 (па фиг.не показаны), обозначены соответствующими строчными буквами а, b, с, d и е, а сигналы, отнесенные по результатам анализа к дефектным, выделены овальной линией.For a considered example of registration rejection signal to the threshold level (U BR) accept the rejection criterion on the number of N pulses in a burst of echoes: N marriage ≥ 7. Figure 2 defectogram fragments corresponding to specific sections A, B, C, D and E of the controlled product 1 (not shown in FIG.), Are indicated by the corresponding lowercase letters a, b, c, d and e, and the signals classified as defective according to the results of the analysis are indicated by an oval line.
При первом сканировании (на паре дефектограмм группы Ок) поиск дефектов производится только на дефектограмме, полученной при браковочном амплитудном пороге. Сигналы, превышающие данный порог регистрации, наблюдаются только на участке дефектограммы, соответствующей сечению С контролируемого изделия 1 (на фиг. 2 вспомогательная линия с). Так как в рассматриваемой пачке содержится всего 3 импульса (три точки), то участок изделия, соответствующий фрагменту дефектограммы "с", не относится к дефектным. At the first scan (on a pair of OK group defectograms), defects are searched only on the defectogram obtained at the rejection amplitude threshold. Signals that exceed this detection threshold are observed only in the portion of the defectogram corresponding to section C of the monitored product 1 (in Fig. 2, auxiliary line c). Since the packet in question contains only 3 pulses (three points), the part of the product corresponding to the fragment of the defectogram “c” is not defective.
При последующем сканировании (дефектограммы группы Н (ноябрь месяц), при первичном анализе на браковочном пороговом уровне (на дефектограмме В2Н) наблюдаются три пачки сигналов: на фрагментах дефектограмм, соответствующих вспомогательным линиям a, b и с. Все они содержат меньшее количество импульсов (точек на фиг.2), чем Nбрак. Анализ сигналов, полученных от данных сечений контролируемого изделия 1 при предыдущем сканировании (дефектограммы В1Ок и В2Ок), показывает, что:
- в сечении А изделия 1 (на вспомогательной линии а дефектограмм) сигналов при предыдущем сканировании (в октябре месяце) не было;
- в сечении В (на линии b) пачка из трех импульсов наблюдалась только на первом пороговом уровне (UП1),
- в сечении С (на линии с) сигналы наблюдаются как в предыдущем, так и в текущем проездах при обоих уровнях (UП1 и UБР). Причем на первом уровне (UП1) количество импульсов по сравнению с предыдущим сканированием изменилось с 4 до 7 импульсов, на втором с 3 до 6 импульсов. Это свидетельствует о наличии в сечении С контролируемого изделия 1 развивающегося дефекта. Не дожидаясь времени, когда параметры пачки сигналов превысят браковочный порог (Nбрак≥ 7), может быть принято решение об упреждающем ремонте или принятии иных предупредительных мер относительно данного участка изделия.During the subsequent scanning (defectograms of group H (November month), during the initial analysis at the rejection threshold level (on defectogram В 2Н ), three packets of signals are observed: on fragments of defectograms corresponding to auxiliary lines a, b and C. All of them contain fewer pulses ( dots in Fig. 2), than N marriage . Analysis of the signals received from the given sections of the controlled
- in section A of article 1 (on the auxiliary line a of defectograms) there were no signals during the previous scan (in the month of October);
- in section B (on line b) a packet of three pulses was observed only at the first threshold level (U P1 ),
- in section C (on line c), signals are observed both in the previous and current passages at both levels (U П1 and U БР ). Moreover, at the first level (U P1 ) the number of pulses compared with the previous scan changed from 4 to 7 pulses, at the second from 3 to 6 pulses. This indicates the presence in section C of the controlled
Таким образом, по анализу результатов контроля, полученных в процессе двух сканирований изделия 1 с месячным интервалом между сканированиями (на фиг. 2 дефектограммы групп Ок и Н) выделен (на фиг.2 овальной линией) один дефектный участок, соответствующий на дефектограмме В2Н условной линии с. Причем благодаря сравнительному анализу сигналов контроля, полученных с заданным интервалом, удается распознать сигнал от дефекта в сечении С изделия до достижения им критического размера.Thus, according to the analysis of the control results obtained during two scans of the
При первичном анализе сигналов после третьего сканирования (дефектограммы группы Д (декабрь) па браковочном пороговом уровне UБР (дефектограмма В2Д) наблюдаются четыре пачки эхо-сигналов на фрагментах, соответствующих сечениям А, В, D и Е изделия 1:
- в сечении А (линия а) можно предположить, что пачка сигналов относится к помехам, т.к. эхо-сигналы размещены хаотично, это предположение подтверждается и анализом результатов предыдущего сканирования (дефектограммы группы Н), где в этом же сечении наблюдаются группы эхо-сигналов, не имеющих определенной временной ориентации. Такие хаотичные импульсы обычно наблюдаются при кратковременных механических ударах преобразователя 2 о неровности поверхности сканирования 3. Кроме того, для данной группы не наблюдается тенденция нарастания количества импульсов за время, равное периоду контроля (один месяц);
- пачку сигналов в сечении В (на линии b) однозначно можно отнести к сигналам от дефекта, т.к. количество импульсов в пачке N=8 превышает принятый браковочный порог (Nбрак= 7 импульсов). Этот вывод подтверждается и анализом сигналов, полученных в данном сечении при предыдущих сканированиях (дефектограммы групп Ок и Н). Наблюдается тенденция нарастания сигналов в пачке от 3 до 9 при наблюдении на первом пороговом уровне (UП1) за два месяца. На фиг.2 данная пачка сигналов (на линии b) выделена как сигнал от развивающегося дефекта и обведена овальной линией;
- количество импульсов на условной линии d дефектограммы В2Д не превышает браковочный порог (N=6 <Nбрак). Однако анализ сигналов, полученных при сканировании изделия 1 в октябре и ноябре месяце, показывает тенденцию нарастания числа импульсов в пачке (при анализе на пороговых уровнях UП1). На дефектограммах В1Ок, В1Н и В1Д эхо-сигналы, получаемые от сечения D изделия 1, нарастают от 3 до 8 импульсов. Это позволят судить об увеличении отражающей способности внутренней несплошности в сечении D контролируемого изделия и отнести рассматриваемые сигналы на дефектограмме В2Д к сигналам от развивающегося дефекта для принятия предупредительных мер или ремонта дефектного участка;
- наглядно показывающим эффективность регистрации сигналов на двух пороговых уровнях (UП1 и UБР) является группа сигналов, наблюдаемых на вспомогательной линии e на дефектограммах В1Ок, В1Н и В1Д. Несмотря на то, что на браковочной дефектограмме В2Д пачка сигналов в данном сечении имеет всего три импульса (существенно меньше браковочного порога Nбрак = 7), последующий анализ результатов контроля данного сечения при предыдущих сканированиях позволяет наблюдать тенденцию нарастания отражающей способности дефекта (количество эхо-сигналов от него на дополнительном пороговом уровне UП1 за два месяца возросло с 2 импульсов до 7). Это позволяет относительно предполагаемого дефекта в сечении Е изделия принять упреждающие меры по ремонту и как следствие снизить незапланированные расходы на ликвидацию неожиданно возникающего дефекта в изделии 1.In the primary analysis, after the third scanning signals (defectogram group D (December) na rejection threshold level U BR (defectogram In 2D) are seen four packs echoes on the fragments corresponding to the sections A, B, D and E of the product 1:
- in section A (line a), it can be assumed that the signal packet refers to interference, because echoes are placed randomly, this assumption is confirmed by an analysis of the results of the previous scan (defectograms of group H), where groups of echoes that do not have a specific time orientation are observed in the same section. Such chaotic pulses are usually observed during short-term mechanical impacts of the
- a packet of signals in section B (on line b) can be unambiguously attributed to signals from a defect, because the number of pulses in a packet N = 8 exceeds the accepted rejection threshold (N reject = 7 pulses). This conclusion is also confirmed by the analysis of the signals obtained in this section during previous scans (defectograms of the groups OK and H). There is a tendency for signals to increase in the pack from 3 to 9 when observed at the first threshold level (U P1 ) for two months. In Fig.2, this packet of signals (on line b) is highlighted as a signal from a developing defect and is surrounded by an oval line;
- the number of pulses on line d conditional defectogram In 2D the rejection does not exceed the threshold (N = 6 <N marriage). However, the analysis of the signals obtained by scanning the
- clearly showing the efficiency of signal registration at two threshold levels (U P1 and U BR ) is a group of signals observed on the auxiliary line e on the defectograms V 1OK , V 1N and V 1D . Despite the fact that in the 2D defectogram, the signal packet in this section has only three pulses (significantly less than the rejection threshold N defective = 7), the subsequent analysis of the results of the control of this section in previous scans allows us to observe a tendency for the reflectance of the defect to increase (the number of echo signals from it at an additional threshold level U П1 for two months increased from 2 pulses to 7). This allows you to take proactive repair measures regarding the alleged defect in section E of the product and, as a result, reduce unplanned expenses for eliminating an unexpectedly occurring defect in the
Можно показать, что по диагностируемым параметрам (по количеству эхо-сигналов) можно осуществлять аналитическое прогнозирование состояния контролируемого изделия, включающее, как известно, две последовательные операции [12]:
- операцию интерполяции по обработке известных данных, при которой определяют закономерность изменения процесса (тенденцию развития дефекта в контролируемом изделии);
- операцию экстраполяции по определению будущих изменений состояний контролируемого объекта (прогнозирования по уже известной тенденции развития дефекта).It can be shown that by the diagnosed parameters (by the number of echo signals), it is possible to carry out analytical forecasting of the state of the controlled product, including, as you know, two sequential operations [12]:
- an interpolation operation for processing known data, in which the regularity of the process change is determined (the tendency for a defect to develop in a controlled product);
- extrapolation operation to determine future changes in the state of the controlled object (forecasting according to the already known tendency of the defect development).
На фиг.3 эти операции показаны на примере прогнозирования развития дефекта в сечении E контролируемого изделия 1 по данным дефектограмм, приведенным на фиг.2. По горизонтальной оси отложено текущее время с разделениями на периоды Т контроля (помесячно: октябрь - Ок, ноябрь - Н, декабрь - Д, январь - Я, февраль Ф и т.д.). По вертикальной оси - количество импульсов в пачке эхо-сигналов, полученных от дефекта при периодическом (через месяц) сканировании (контроле). В соответствии с фиг.2, в сечении Е контролируемого изделия (на вспомогательной линии "e" дефектограмм) в октябре при регистрации сигналов на дополнительном пороговом уровне (UП1) приняты 2, в ноябре - 4 и в декабре - 7 эхо-сигналов (импульсов, или точек на фиг.2). Полученные точки позволяют построить на фиг.3 кривую 14, показывающую тенденцию развития (роста импульсов) искомого дефекта. В то же время на браковочном уровне (UБР) в данном сечении эхо сигналы зафиксированы только при последнем сканировании (в декабре месяце) в виде трех импульсов и естественно по одной точке 15 на фиг.3 невозможно оценить характер и закономерность развития процесса в будущем.In Fig. 3, these operations are shown as an example of predicting the development of a defect in section E of the controlled
Предположив, что тенденция развития сигналов, регистрируемых на браковочном пороге, идентична характеру нарастания числа импульсов при регистрации их на дополнительном пороговом уровне, можно построить кривую 16, проходящую через точку 15 параллельно кривой 14. Точка пересечения кривой 16 с горизонтальной линией Nбрак 17 позволяет определить на временной оси точку 18, показывающую время, при которой количество импульсов, равное или больше браковочного Nбрак, будет зарегистрировано при проведении очередного сканирования (на фиг.3 в начале февраля месяца). Таким образом, можно прогнозировать развитие дефекта в сечении Е контролируемого изделия до критического размера. Естественно данный дефект в рассматриваемом сечении можно удалять до достижения им критического размера в плановом порядке, что требует меньших затрат и может быть проведено без ущерба производственному процессу.Assuming that the development trend of the signals recorded at the rejection threshold is identical to the nature of the increase in the number of pulses when they are recorded at an additional threshold level, we can construct
Таким образом, фиг.2 и 3 иллюстрируют, что введение регистрации сигналов на нескольких (в рассматриваемом примере - двух) амплитудных уровнях действительно позволяет более достоверно распознавать сигналы от потенциально опасных дефектов (сигналы d и е) на более ранней стадии их развития, не выполняя дополнительное сканирование (контроль). Это в свою очередь позволяет принять соответствующие меры по их ремонту (или замене на бездефектный рельс) в плановом порядке без аварийной остановки движения поездов. Thus, FIGS. 2 and 3 illustrate that the introduction of registration of signals at several (in this example, two) amplitude levels does allow more reliable recognition of signals from potentially dangerous defects (signals d and e) at an earlier stage of their development, without performing additional scanning (control). This, in turn, allows you to take appropriate measures to repair them (or replace them with a defect-free rail) in a planned manner without emergency stopping the movement of trains.
Необходимо отметить, что дефекты в сечениях D и Е не могли быть распознаны при использовании способа, принятого за прототип, так как при анализе сигналов только на одном браковочном уровне эхо-сигналы в данных сечениях при предыдущих сканированиях (в октябре и в декабре месяце) отсутствуют. Только дополнительная регистрация сигналов на амплитудном уровне ниже браковочного (UП1) и последующий их анализ, предусмотренные заявляемым способом, позволяют заметить и проследить тенденцию увеличения отражающей способности (количества эхо-сигналов) дефектов в этих сечениях и принять своевременное решение по недопущению аварийной ситуации.It should be noted that defects in sections D and E could not be recognized using the method adopted for the prototype, since when analyzing signals at only one rejection level, echo signals in these sections during previous scans (in October and December) were absent . Only additional registration of signals at an amplitude level below the rejection level (U P1 ) and their subsequent analysis, provided by the claimed method, allow us to notice and trace the tendency to increase the reflectivity (number of echo signals) of defects in these sections and make a timely decision to prevent an emergency.
Естественно и при первичном просмотре (анализе) можно было бы анализировать их на первом, более низком амплитудном пороговом уровне. Однако, как показывает практика и видно из фиг.2 (см. дефектограммы В1Ок, В1Н и В1Д), при этом оператору пришлось бы достаточно часто отвлекаться на незначительные отражения и помехи. В результате оператор окажется перегруженным второстепенной информацией, что приведет к его быстрому утомлению и как следствие к снижению достоверности контроля. При автоматической обработке это также потребует многократного увеличения мощности вычислительных средств и времени обработки из-за существенно увеличивающегося потока входных сигналов.Naturally, during the initial viewing (analysis), it would be possible to analyze them at the first, lower amplitude threshold level. However, as practice shows and can be seen from figure 2 (see the defectograms В 1Ок , В 1Н and В 1Д ), the operator would often have to be distracted by minor reflections and interference. As a result, the operator will be overloaded with secondary information, which will lead to rapid fatigue and, as a result, to a decrease in the reliability of control. In automatic processing, this will also require a multiple increase in computing power and processing time due to a significantly increased input signal stream.
Величину браковочного порогового уровня выбирают, исходя из требований, действующих в отрасли НТД. Например, при контроле железнодорожных рельсов условная чувствительность контроля в соответствии с ГОСТ 18576-85 должна быть равной 16 дБ (устанавливается на стандартном образце СО-3Р относительно эхо-сигнала от цилиндрического отражателя диаметром 6 мм, залегающего на глубине 44 мм). При этом дополнительный пороговый уровень на практике устанавливается на 3-6 дБ ниже, чем браковочный пороговый уровень, что соответствует контролю при повышенной чувствительности, превышающей чувствительность основного контроля почти до двух раз. При необходимости может быть установлен и следующий дополнительный пороговый уровень еще на 3-6 дБ ниже. В общем случае величины приращений чувствительностей контроля (отличий UБР от UП1, UП2.. . .) при введении дополнительных пороговых уровней выбирают, исходя из состояния контролируемого изделия (наличие структурных отражений, микронеровностей на поверхностях и т.п.) и экспериментальных данных.The value of the rejection threshold level is selected based on the requirements in force in the industry of technical documents. For example, when monitoring railroad tracks, the conditional sensitivity of control in accordance with GOST 18576-85 should be equal to 16 dB (set on a standard sample СО-3Р relative to the echo signal from a cylindrical reflector with a diameter of 6 mm, lying at a depth of 44 mm). In this case, the additional threshold level in practice is set 3-6 dB lower than the rejection threshold level, which corresponds to the control with increased sensitivity exceeding the sensitivity of the main control by almost two times. If necessary, the next additional threshold level can be set 3-6 dB lower. In the general case, the increments in the control sensitivities (differences between U BR and U P1 , U P2.... ) When additional threshold levels are introduced, are selected based on the state of the controlled product (presence of structural reflections, micro-irregularities on surfaces, etc.) and experimental data.
Введение анализа сигналов контроля на более низких амплитудных уровнях, чем браковочный амплитудный порог, равносильно проведению дополнительных сканирований (контроля) при более высокой чувствительности контроля, позволяющих получить эхо-сигналы от потенциальных дефектов до достижения ими критических размеров. The introduction of analysis of control signals at lower amplitude levels than the rejection amplitude threshold is equivalent to conducting additional scans (control) with a higher sensitivity of control, which allows receiving echo signals from potential defects until they reach critical sizes.
Безусловно, внедрение предлагаемого способа требует выполнения периодического контроля изделий при соблюдении ряда условий:
- контроль должен производиться при идентичных условиях (по мощности излучаемых колебаний, чувствительности, временной селекции, углу ввода упругих колебаний и т.п.),
- одновременно с регистрацией сигналов контроля должна быть обеспечена фиксация координат местоположения преобразователя 2 в моменты записи информации, обеспечивающая впоследствии точную синхронизацию сигналов контроля, полученных при разных сканированиях изделия, и при необходимости точное определение местоположения выявленного дефекта.Of course, the implementation of the proposed method requires periodic monitoring of products subject to a number of conditions:
- control should be carried out under identical conditions (by the power of the emitted oscillations, sensitivity, time selection, angle of entry of elastic oscillations, etc.),
- simultaneously with the registration of the control signals, the location coordinates of the
Выполнение указанных условий не требует особых затруднений и выполняется обычно при любом автоматизированном контроле, в частности, и при реализации способа, принятого за прототип. Например, при контроле рельсов с помощью ультразвуковых вагонов-дефектоскопов контроль должен производиться в соответствии с действующими в МПС РФ нормативными документами. При этом параметры контроля в процессе проведения периодического контроля должны оставаться неизменными, а координаты по длине рельсов фиксируются на всей протяженности контролируемого пути с точностью до 1 мм. The fulfillment of these conditions does not require special difficulties and is usually performed with any automated control, in particular, and when implementing the method adopted as a prototype. For example, when monitoring rails with the help of ultrasonic flaw detectors, control should be carried out in accordance with regulatory documents in force in the Ministry of Railways of the Russian Federation. In this case, the control parameters during the periodic monitoring should remain unchanged, and the coordinates along the length of the rails are fixed over the entire length of the controlled path with an accuracy of 1 mm.
Выбор количества дополнительных уровней регистрации осуществляется исходя из компромиссных условий:
- с одной стороны, чем более детально зафиксированы сигналы в зоне вероятного дефекта, т. е. чем больше дополнительных уровней регистрации, тем более достоверно можно просмотреть предысторию развития дефекта, увидеть тенденцию его развития и более точно прогнозировать момент превышения им критического размера;
- с другой стороны, чем больше дополнительных уровней регистрации сигнала, тем больший поток информации требуется регистрировать, запоминать и хранить для последующего анализа.The choice of the number of additional registration levels is based on compromise conditions:
- on the one hand, the more detailed the signals are recorded in the zone of a probable defect, i.e., the more additional levels of registration, the more reliably you can view the history of the development of the defect, see the trend of its development and more accurately predict the moment it exceeds the critical size;
- on the other hand, the more additional levels of signal registration, the greater the flow of information you need to register, remember and store for subsequent analysis.
Поэтому в реальных условиях ограничиваются только одним дополнительным уровнем регистрации. При контроле наиболее ответственных изделий (например, при контроле рельсов на высокоскоростном участке "Санкт-Петербург - Москва", где последствия задержки движения, вызванные аварийной ситуацией, весьма серьезны), можно идти на дополнительное усложнение аппаратуры и процедуры расшифровки для регистрации сигналов на нескольких дополнительных уровнях, находящихся ниже браковочного амплитудного порога. Therefore, in real conditions, they are limited to only one additional level of registration. When monitoring the most critical products (for example, when monitoring rails at the high-speed section St. Petersburg - Moscow, where the consequences of traffic delays caused by an emergency are very serious), you can go further to complicate the equipment and the decryption procedure to register signals for several additional levels below the rejection amplitude threshold.
Очевидно, что предлагаемый способ неразрушающего контроля изделий может быть реализован как при визуальной ("ручной") расшифровке сигналов, так и при автоматизированной обработке (расшифровке) с помощью процессорных систем. Важно лишь в алгоритмы обработки заложить основные операции способа:
- осуществлять многократное (двух и более) сканирование (контроль) изделия при идентичных условиях с определенными временными интервалами между сканированиями;
- регистрировать сигналы контроля при каждом сканировании на двух (браковочном и дополнительном) или более пороговых уровнях;
- осуществлять анализ сигналов контроля, полученных в процессе текущего сканирования на браковочном пороговом уровне;
- при обнаружении сигналов на браковочном пороговом уровне выполнить сравнительный анализ сигналов, полученных в данном сечении контролируемого изделия при текущем и предыдущих сканированиях, на всех пороговых уровнях регистрации;
- по результатам анализа определить тенденцию поведения обнаруженного в изделии отражателя (дефекта) и при нарастании размеров (отражающей способности) дефекта за межпериодный интервал контроля оценивают степень развития (опасности) дефекта;
- по результатам оценки сформировать управляющий сигнал (принять решение) по реализации упреждающих мер по ремонту или замене дефектного участка изделия.It is obvious that the proposed method of non-destructive testing of products can be implemented both in visual ("manual") decryption of signals and in automated processing (decryption) using processor systems. It is important only to lay down the basic operations of the method in the processing algorithms:
- to carry out multiple (two or more) scans (control) of the product under identical conditions with certain time intervals between scans;
- register control signals at each scan at two (reject and additional) or more threshold levels;
- to analyze the control signals received during the current scan at the rejection threshold level;
- upon detection of signals at the rejection threshold level, perform a comparative analysis of the signals received in this section of the controlled product during the current and previous scans at all threshold registration levels;
- according to the results of the analysis, determine the tendency of the behavior of the reflector (defect) found in the product, and with the increase in the size (reflectivity) of the defect during the inter-period control interval, the degree of development (danger) of the defect is estimated;
- according to the results of the assessment, generate a control signal (make a decision) on the implementation of proactive measures to repair or replace a defective part of the product.
Заявляемое техническое решение реализовано в работах, выполняемых ОАО "Радноавионика" по заказу МПС России по теме "Комплекс средств для неразрушающего контроля рельсов и других конструкций железнодорожного транспорта" (договор 959/94), в частности в регистраторе РИ-01 для ультразвукового дефектоскопа АВИКОН-01 и в дефектоскопическом комплексе АВИКОН-03 совмещенного (на базе ультразвуковых и магнитных методов контроля) вагона-дефектоскопа. В регистраторе РП-01, кроме записи сигналов контроля на браковочном пороговом уровне, производится фиксация сигналов на дополнительном пороговом уровне, находящемся на 6 дБ ниже браковочного. Программа отображения результатов контроля позволяет просматривать сигналы на ПЭВМ на браковочном и дополнительном уровнях последовательно. Как показывают результаты опытной эксплуатации регистратора на С.-Петербург-Балтийской дистанции пути (ПЧ-11) Октябрьской железной дороги, введение регистрации и анализа сигналов на дополнительном пороговом уровне при периодическом контроле участков рельсового пути позволяет существенно повысить реальную чувствительность и достоверность контроля, обнаруживать развивающиеся дефекты на ранней стадии, до достижения ими критических размеров. Причем указанные эффекты достигаются без изменения периодичности контроля, без дополнительных затрат на контроль рельсового пути. Напротив, увеличение достоверности контроля создает предпосылки к уменьшению частоты контроля и соответственно к дополнительному снижению расходов на содержание пути без снижения безопасности движения поездов. The claimed technical solution is implemented in the works carried out by OJSC "Radnoavionika" at the request of the Ministry of Railways of Russia on the subject "Complex of means for non-destructive testing of rails and other structures of railway transport" (contract 959/94), in particular in the recorder RI-01 for an ultrasonic flaw detector AVIKON- 01 and in the flaw detector complex AVIKON-03 of a combined (based on ultrasonic and magnetic control methods) flaw detector car. In the RP-01 registrar, in addition to recording control signals at the rejection threshold level, signals are recorded at an additional threshold level, which is 6 dB lower than the rejection level. The program for displaying control results allows you to view signals on a PC at the rejection and additional levels sequentially. According to the results of the trial operation of the recorder at the St. Petersburg-Baltic track distance (PCh-11) of the Oktyabrskaya Railway, the introduction of registration and analysis of signals at an additional threshold level during periodic monitoring of rail track sections can significantly increase the real sensitivity and reliability of monitoring, detect developing defects at an early stage, until they reach critical sizes. Moreover, these effects are achieved without changing the frequency of control, without additional costs for the control of the rail track. On the contrary, an increase in the reliability of control creates the prerequisites for a decrease in the frequency of control and, accordingly, an additional reduction in the cost of maintaining the track without compromising the safety of train traffic.
В приведенном описании в качестве примера реализации способа рассмотрен неразрушающий контроль железнодорожных рельсов, уложенных в путь, ультразвуковыми методами. Очевидно, способ может быть применен и при периодическом контроле ответственных изделий машиностроения, транспорта и других отраслей промышленности электромагнитными, вихретоковыми и другими методами. Например, при контроле железнодорожных рельсов с помощью магнитного вагона-дефектоскопа (магнитодинамический метод неразрушающего контроля), где критерием отнесения сигналов контроля к сигналам от дефектов в изделии является превышение амплитуды выше заданного порога, также с успехом может быть применен предлагаемый способ контроля. In the above description, as an example of the implementation of the method, non-destructive testing of railway rails laid in the path by ultrasonic methods is considered. Obviously, the method can be applied to periodic monitoring of critical engineering products, transport and other industries using electromagnetic, eddy current and other methods. For example, when monitoring railroad tracks using a magnetic flaw detector car (magnetodynamic method of non-destructive testing), where the criterion for assigning control signals to signals from defects in a product is the excess of the amplitude above a predetermined threshold, the proposed control method can also be successfully applied.
Таким образом, техническая задача, поставленная при разработке способа неразрушающего контроля изделий, полностью решена. Введение регистрации сигналов на нескольких (двух и более) пороговых уровнях ниже браковочного порога и соответствующий анализ сигналов, полученных в процессе периодического контроля, действительно повышает чувствительность и достоверность контроля изделий за счет появляющейся возможности обнаружения дефектов на более ранней стадии их развития. Одновременное снижение расходов на эксплуатацию изделия и затрат на неразрушающий контроль обеспечивается как за счет своевременного выявления опасных дефектов в изделии до достижения ими критических размеров и принятия упреждающих мер по их ликвидации в плановом порядке, так и за счет оптимизации периодичности контроля изделия и уменьшения затрат на контроль при сохранении необходимого уровня безопасности эксплуатации изделия. Thus, the technical problem posed in the development of a method of non-destructive testing of products is completely solved. The introduction of registration of signals at several (two or more) threshold levels below the rejection threshold and the corresponding analysis of signals received during the periodical monitoring really increase the sensitivity and reliability of product monitoring due to the emerging possibility of detecting defects at an earlier stage of their development. The simultaneous reduction of the operating costs of the product and the costs of non-destructive testing is ensured both by timely detection of dangerous defects in the product before they reach critical sizes and by taking proactive measures to eliminate them in a planned manner, and by optimizing the frequency of control of the product and reducing control costs while maintaining the necessary level of product safety.
Источники информации
1. Приказ МПС РФ 2-Ц3 от 25 февраля 1997 г. О совершенствовании системы контроля состояния рельсов средствами дефектоскопии. - на 28 стр.Sources of information
1. Order of the Ministry of Railways of the Russian Federation 2-C3 of February 25, 1997. On improving the system for monitoring the condition of rails by means of flaw detection. - on page 28
2. Башкатова Л. В., Гурвич А.К., Лохач А.В., Марков А.А. Компьютеризированные средства неразрушающего контроля и диагностики железнодорожного пути. Санкт-Петербург, Радиоавионика, 1997, 118 стр. (см. с. 45-70). 2. Bashkatova L.V., Gurvich A.K., Lokhach A.V., Markov A.A. Computerized means of non-destructive testing and diagnostics of the railway track. St. Petersburg, Radioavionics, 1997, 118 pp. (See p. 45-70).
3. Бабиков Д., Грибов В., Кириллов А. и др. Автоматизированная дефектоскопия рельсов. - Современные технология и автоматизация. 1, 2000 г., с. 54-57. 3. Babikov D., Gribov V., Kirillov A. et al. Automated rail inspection. - Modern technology and automation. 1, 2000, p. 54-57.
4. Гурвич А.К., Довнар Б.П. и др. Неразрушающий контроль рельсов при их эксплуатации и ремонте. М.: Транспорт, 1983 г. 4. Gurvich A.K., Dovnar B.P. Non-destructive testing of rails during their operation and repair. M .: Transport, 1983
5. Патент РФ 2149393 от 19.05.99, G 01 N 29/04, Арутюнян Ю.К., Бабичев В.А, и др. Способ ультразвукового котроля цилиндрических изделий. Опубл в БИ 14, 20.05.2000. 5. RF patent 2149393 from 05.19.99, G 01 N 29/04, Harutyunyan Y.K., Babichev V.A., et al. Method for ultrasonic inspection of cylindrical products. Published in BI 14.05.05.2000.
6. Марков А. А. Альтернативное представление дефектоскопической информации в переносных ультразвуковых дефектоскопах. - В мире неразрушающего контроля. 1, 2000 г., с.42-44. 6. Markov A. A. Alternative representation of defectoscopic information in portable ultrasonic flaw detectors. - In the world of non-destructive testing. 1, 2000, p. 42-44.
7. Патент США 5970438 от 19 октября 1999, G 01 М 19/00, G 01 N 29/04. R. Clark, J. Boyle, S. Morgan, A. Veitch. Способ и устройство дефектоскопии рельсов. 7. US patent 5970438 of October 19, 1999, G 01 M 19/00, G 01 N 29/04. R. Clark, J. Boyle, S. Morgan, A. Veitch. Method and device for flaw detection of rails.
8. Патент США 5574224 от 12 ноября 1996, G 01 N 29/04. J.-P. Jaeggi. Способ и устройство для непрерывного контроля рельсов на железнодорожных линиях посредством акустики ультразвуковых частот. 8. US Patent 5574224 of November 12, 1996, G 01 N 29/04. J.-P. Jaeggi. Method and device for continuous monitoring of rails on railway lines by means of acoustics of ultrasonic frequencies.
9. Патент США 5777891 от 7 июля 1998, G 01 N 29/04. D. Pagano, В. Масkay, J. Norris. Способ ультразвуковой дефектоскопии в реальном масштабе времени. 9. US patent 5777891 from July 7, 1998, G 01 N 29/04. D. Pagano, B. Maskay, J. Norris. Real-time ultrasonic flaw detection method.
10. G. Krug, V. Orjelik, R. Aharoni. Comparative Data Analysis for Optimal High-Speed Railways Testing. Сравнительный анализ данных для оптимальной проверки железнодорожных рельсов с высокой скоростью. - Тезисы XV Всемирной конференции по неразрушающему контролю. - г. Рим, Италия, 15-21 октября 2000 г. (копия доклада и перевод прилагаются). 10. G. Krug, V. Orjelik, R. Aharoni. Comparative Data Analysis for Optimal High-Speed Railways Testing. Comparative data analysis for optimal inspection of railway rails at high speed. - Abstracts of the XV World Conference on Non-Destructive Testing. - Rome, Italy, October 15-21, 2000 (a copy of the report and translation are attached).
11. Марков А.А., Шпагин Д.А. Ультразвуковая дефектоскопия рельсов. Санкт-Петербург, Образование-Культура, 1999, 236 с. (см. стр. 39-49). 11. Markov A.A., Shpagin D.A. Ultrasonic flaw detection of rails. St. Petersburg, Education-Culture, 1999, 236 p. (see pages 39-49).
12. В. И. Бервинов. Техническое диагностирование локомотивов. - М.: УМК МПС России, 1999. - 190 с. 12. V. I. Bervinov. Technical diagnosis of locomotives. - M .: UMK MPS of Russia, 1999 .-- 190 p.
Claims (1)
Priority Applications (1)
| Application Number | Priority Date | Filing Date | Title |
|---|---|---|---|
| RU2001113676A RU2184373C1 (en) | 2001-05-15 | 2001-05-15 | Noninvasive method for controlling products |
Applications Claiming Priority (1)
| Application Number | Priority Date | Filing Date | Title |
|---|---|---|---|
| RU2001113676A RU2184373C1 (en) | 2001-05-15 | 2001-05-15 | Noninvasive method for controlling products |
Publications (1)
| Publication Number | Publication Date |
|---|---|
| RU2184373C1 true RU2184373C1 (en) | 2002-06-27 |
Family
ID=20249812
Family Applications (1)
| Application Number | Title | Priority Date | Filing Date |
|---|---|---|---|
| RU2001113676A RU2184373C1 (en) | 2001-05-15 | 2001-05-15 | Noninvasive method for controlling products |
Country Status (1)
| Country | Link |
|---|---|
| RU (1) | RU2184373C1 (en) |
Cited By (12)
| Publication number | Priority date | Publication date | Assignee | Title |
|---|---|---|---|---|
| RU2254562C2 (en) * | 2003-04-08 | 2005-06-20 | Закрытое акционерное общество "Координационный центр по надежности, безопасности и ресурсу оборудования и трубопроводам атомных электростанций" (КЦНБРАС) | Method of determining presence of initial and residual defects |
| RU2265833C2 (en) * | 2003-07-31 | 2005-12-10 | ООО "Компания Нординкрафт" | Method of ultrasonic defectoscopy of sheet and bar |
| RU2286558C1 (en) * | 2005-06-20 | 2006-10-27 | Общество С Ограниченной Ответственностью "Газпромэнергодиагностика" | Method for predicting emergency technical state of pipeline |
| RU2296986C2 (en) * | 2004-11-11 | 2007-04-10 | Закрытое акционерное общество "Координационный центр по надежности, безопасности и ресурсу оборудования и трубопроводам атомных электростанций" (КЦНБРАС) | Method for achieving desired quality degree, reliability and safety of article taking into account quality control procedure (variants) |
| RU2339031C1 (en) * | 2007-04-11 | 2008-11-20 | Российская Федерация, от имени которой выступает Государственный заказчик - Федеральное агентство по атомной энергии | Method of two-channel ultrasonic control of welded connections with technological poor penetration of joint parts |
| RU2385456C2 (en) * | 2005-04-18 | 2010-03-27 | Юропиан Аэронотик Дефенс Энд Спейс Компани Эадс Франс | Method and device for monitoring state of aeroplane structure |
| RU2443991C1 (en) * | 2010-07-07 | 2012-02-27 | Сергей Михайлович Мужичек | Method of controlling aircraft structure state and device to this end |
| RU2547153C1 (en) * | 2013-11-29 | 2015-04-10 | Акционерное общество "Всероссийский научно-исследовательский институт по эксплуатации атомных электростанций" (АО ВНИИАЭС) | Method to improve accuracy of eddy current non-destructive testing |
| RU2586090C1 (en) * | 2015-05-20 | 2016-06-10 | Открытое акционерное общество "Радиоавионика" | Method for magnetic inspection of weld joints of rails |
| RU2608853C2 (en) * | 2012-04-02 | 2017-01-25 | Зе Боинг Компани | Method and system for detecting disturbances in articles by back scattered x-rays |
| RU2748869C1 (en) * | 2020-09-07 | 2021-06-01 | Открытое акционерное общество "Радиоавионика" | Method for assessing orientation of defects in long-length products based on results of non-destructive control |
| RU2788953C1 (en) * | 2019-06-05 | 2023-01-26 | Хюфшмиед Зерспанунгссистем Гмбх | Method and system for inspecting workpieces |
Citations (6)
| Publication number | Priority date | Publication date | Assignee | Title |
|---|---|---|---|---|
| GB1040242A (en) * | 1963-01-02 | 1966-08-24 | Stewart And Lloyds Ltd | Improvements relating to ultrasonic testing of articles |
| GB1234233A (en) * | 1968-02-02 | 1971-06-03 | ||
| US3683680A (en) * | 1970-02-03 | 1972-08-15 | British Railways Board | Ultrasonic flaw detection apparatus |
| FR2234561A1 (en) * | 1973-06-19 | 1975-01-17 | British Steel Corp | |
| US5574224A (en) * | 1992-12-23 | 1996-11-12 | Speno International S.A. | Process and device for the continuous nondestructive control of rails on a railway line by ultrasonics |
| US5970438A (en) * | 1998-04-07 | 1999-10-19 | Sperry Rail Service | Method and apparatus for testing rails for structural defects |
-
2001
- 2001-05-15 RU RU2001113676A patent/RU2184373C1/en active
Patent Citations (6)
| Publication number | Priority date | Publication date | Assignee | Title |
|---|---|---|---|---|
| GB1040242A (en) * | 1963-01-02 | 1966-08-24 | Stewart And Lloyds Ltd | Improvements relating to ultrasonic testing of articles |
| GB1234233A (en) * | 1968-02-02 | 1971-06-03 | ||
| US3683680A (en) * | 1970-02-03 | 1972-08-15 | British Railways Board | Ultrasonic flaw detection apparatus |
| FR2234561A1 (en) * | 1973-06-19 | 1975-01-17 | British Steel Corp | |
| US5574224A (en) * | 1992-12-23 | 1996-11-12 | Speno International S.A. | Process and device for the continuous nondestructive control of rails on a railway line by ultrasonics |
| US5970438A (en) * | 1998-04-07 | 1999-10-19 | Sperry Rail Service | Method and apparatus for testing rails for structural defects |
Non-Patent Citations (1)
| Title |
|---|
| G.KRUG, V.ORJELIK, R.AHARONI. Comparative Data Analysis for Optimal High-Speed Railways Testing. Сравнительный анализ данных для оптимальной проверки железнодорожных рельсов с высокой скоростью. Тезисы XV Всемирной конференции по неразрушающему контролю. Рим, Италия, 15-21 октября 2000 г. * |
Cited By (12)
| Publication number | Priority date | Publication date | Assignee | Title |
|---|---|---|---|---|
| RU2254562C2 (en) * | 2003-04-08 | 2005-06-20 | Закрытое акционерное общество "Координационный центр по надежности, безопасности и ресурсу оборудования и трубопроводам атомных электростанций" (КЦНБРАС) | Method of determining presence of initial and residual defects |
| RU2265833C2 (en) * | 2003-07-31 | 2005-12-10 | ООО "Компания Нординкрафт" | Method of ultrasonic defectoscopy of sheet and bar |
| RU2296986C2 (en) * | 2004-11-11 | 2007-04-10 | Закрытое акционерное общество "Координационный центр по надежности, безопасности и ресурсу оборудования и трубопроводам атомных электростанций" (КЦНБРАС) | Method for achieving desired quality degree, reliability and safety of article taking into account quality control procedure (variants) |
| RU2385456C2 (en) * | 2005-04-18 | 2010-03-27 | Юропиан Аэронотик Дефенс Энд Спейс Компани Эадс Франс | Method and device for monitoring state of aeroplane structure |
| RU2286558C1 (en) * | 2005-06-20 | 2006-10-27 | Общество С Ограниченной Ответственностью "Газпромэнергодиагностика" | Method for predicting emergency technical state of pipeline |
| RU2339031C1 (en) * | 2007-04-11 | 2008-11-20 | Российская Федерация, от имени которой выступает Государственный заказчик - Федеральное агентство по атомной энергии | Method of two-channel ultrasonic control of welded connections with technological poor penetration of joint parts |
| RU2443991C1 (en) * | 2010-07-07 | 2012-02-27 | Сергей Михайлович Мужичек | Method of controlling aircraft structure state and device to this end |
| RU2608853C2 (en) * | 2012-04-02 | 2017-01-25 | Зе Боинг Компани | Method and system for detecting disturbances in articles by back scattered x-rays |
| RU2547153C1 (en) * | 2013-11-29 | 2015-04-10 | Акционерное общество "Всероссийский научно-исследовательский институт по эксплуатации атомных электростанций" (АО ВНИИАЭС) | Method to improve accuracy of eddy current non-destructive testing |
| RU2586090C1 (en) * | 2015-05-20 | 2016-06-10 | Открытое акционерное общество "Радиоавионика" | Method for magnetic inspection of weld joints of rails |
| RU2788953C1 (en) * | 2019-06-05 | 2023-01-26 | Хюфшмиед Зерспанунгссистем Гмбх | Method and system for inspecting workpieces |
| RU2748869C1 (en) * | 2020-09-07 | 2021-06-01 | Открытое акционерное общество "Радиоавионика" | Method for assessing orientation of defects in long-length products based on results of non-destructive control |
Similar Documents
| Publication | Publication Date | Title |
|---|---|---|
| KR101476749B1 (en) | Non-destructive testing, in particular for pipes during manufacture or in the finished state | |
| EP0106580B1 (en) | Acoustic detection of defects in structures | |
| RU2184373C1 (en) | Noninvasive method for controlling products | |
| Kaphle | Analysis of acoustic emission data for accurate damage assessment for structural health monitoring applications | |
| RU2742599C1 (en) | Method for comprehensive diagnostics of welded seams of butless rails and device for its implementation | |
| US7555954B2 (en) | In-track wheel inspection system | |
| Topp et al. | Application of the ACFM inspection method to rail and rail vehicles | |
| AU2005325873B2 (en) | Method and device for determining defects on a component of a turbine | |
| RU2184374C1 (en) | Ultrasonic method for controlling rail head | |
| RU2184960C1 (en) | Process of ultrasonic inspection of rail head | |
| Appiani et al. | A feasibility study on in-service non-destructive inspection of railway rails by an ultrasonic technique based on travelling electromagnetic acoustic transducers: A. Appiani, M. Carboni | |
| US10845343B2 (en) | Process for finding potential defect indications in real time while ultrasonically scanning a weld | |
| RU2480741C1 (en) | Method of nondestructive check of units in railway car trolleys and device for its realisation | |
| KR100195436B1 (en) | Micro-Flaw Detection Method of Thread Using Ultrasound Rayleigh Wave | |
| RU2149393C1 (en) | Process of ultrasonic test of cylindrical articles | |
| Kaščak et al. | Utilization of the Ultrasonic Diagnostic Method in Rail Status on a Defined Railway Section. | |
| RU2052808C1 (en) | Ultrasonic method for detection of cracks in article hole walls | |
| RU2652511C1 (en) | Method of micro cracks on the rail head rolling surface ultrasonic detection | |
| RU2662464C1 (en) | Method for ultrasonic inspection | |
| RU2834598C1 (en) | Rail ultrasonic inspection method | |
| RU2748869C1 (en) | Method for assessing orientation of defects in long-length products based on results of non-destructive control | |
| RU2764571C1 (en) | Ultrasonic method for detecting and evaluating rail welded joints in high-speed inspection | |
| Riahi et al. | Substitution of the time-of-flight diffraction technique for nondestructive testing of welds and thick layers of steel: A comparative investigation | |
| RU2753810C1 (en) | Method for evaluating the performance of flaw detection equipment during high-speed inspection of rails | |
| RU2783753C1 (en) | Ultrasonic method for detecting defects in the rail head |