KR20230073210A - Vibration Analysis System, and Vibration Analysis Method - Google Patents
Vibration Analysis System, and Vibration Analysis Method Download PDFInfo
- Publication number
- KR20230073210A KR20230073210A KR1020237010195A KR20237010195A KR20230073210A KR 20230073210 A KR20230073210 A KR 20230073210A KR 1020237010195 A KR1020237010195 A KR 1020237010195A KR 20237010195 A KR20237010195 A KR 20237010195A KR 20230073210 A KR20230073210 A KR 20230073210A
- Authority
- KR
- South Korea
- Prior art keywords
- mahalanobis distance
- signal
- calculated
- unit
- vibration
- Prior art date
Links
- 238000004458 analytical method Methods 0.000 title claims abstract description 82
- 230000005484 gravity Effects 0.000 claims abstract description 45
- 238000004364 calculation method Methods 0.000 claims abstract description 24
- 230000002159 abnormal effect Effects 0.000 claims abstract description 21
- 230000005856 abnormality Effects 0.000 claims description 73
- 238000000034 method Methods 0.000 description 51
- 230000008569 process Effects 0.000 description 30
- 238000010586 diagram Methods 0.000 description 18
- 238000012423 maintenance Methods 0.000 description 12
- 238000004891 communication Methods 0.000 description 10
- 230000006870 function Effects 0.000 description 9
- 238000012545 processing Methods 0.000 description 9
- 238000002360 preparation method Methods 0.000 description 4
- 101150040337 H2BC1 gene Proteins 0.000 description 2
- 230000001133 acceleration Effects 0.000 description 2
- 230000005540 biological transmission Effects 0.000 description 2
- 230000008859 change Effects 0.000 description 2
- 238000001514 detection method Methods 0.000 description 2
- 238000005401 electroluminescence Methods 0.000 description 2
- 238000005259 measurement Methods 0.000 description 2
- 238000000611 regression analysis Methods 0.000 description 2
- 239000000284 extract Substances 0.000 description 1
- 238000000605 extraction Methods 0.000 description 1
- 238000007689 inspection Methods 0.000 description 1
- 239000004973 liquid crystal related substance Substances 0.000 description 1
- 239000000203 mixture Substances 0.000 description 1
- 238000012544 monitoring process Methods 0.000 description 1
- 230000008439 repair process Effects 0.000 description 1
- 238000005070 sampling Methods 0.000 description 1
- 238000001228 spectrum Methods 0.000 description 1
- 238000003860 storage Methods 0.000 description 1
Images


Classifications
-
- G—PHYSICS
- G01—MEASURING; TESTING
- G01H—MEASUREMENT OF MECHANICAL VIBRATIONS OR ULTRASONIC, SONIC OR INFRASONIC WAVES
- G01H1/00—Measuring characteristics of vibrations in solids by using direct conduction to the detector
- G01H1/12—Measuring characteristics of vibrations in solids by using direct conduction to the detector of longitudinal or not specified vibrations
- G01H1/14—Frequency
-
- F—MECHANICAL ENGINEERING; LIGHTING; HEATING; WEAPONS; BLASTING
- F04—POSITIVE - DISPLACEMENT MACHINES FOR LIQUIDS; PUMPS FOR LIQUIDS OR ELASTIC FLUIDS
- F04B—POSITIVE-DISPLACEMENT MACHINES FOR LIQUIDS; PUMPS
- F04B51/00—Testing machines, pumps, or pumping installations
-
- G—PHYSICS
- G01—MEASURING; TESTING
- G01H—MEASUREMENT OF MECHANICAL VIBRATIONS OR ULTRASONIC, SONIC OR INFRASONIC WAVES
- G01H17/00—Measuring mechanical vibrations or ultrasonic, sonic or infrasonic waves, not provided for in the preceding groups
-
- G—PHYSICS
- G01—MEASURING; TESTING
- G01M—TESTING STATIC OR DYNAMIC BALANCE OF MACHINES OR STRUCTURES; TESTING OF STRUCTURES OR APPARATUS, NOT OTHERWISE PROVIDED FOR
- G01M1/00—Testing static or dynamic balance of machines or structures
- G01M1/12—Static balancing; Determining position of centre of gravity
- G01M1/122—Determining position of centre of gravity
-
- G—PHYSICS
- G01—MEASURING; TESTING
- G01M—TESTING STATIC OR DYNAMIC BALANCE OF MACHINES OR STRUCTURES; TESTING OF STRUCTURES OR APPARATUS, NOT OTHERWISE PROVIDED FOR
- G01M7/00—Vibration-testing of structures; Shock-testing of structures
-
- G—PHYSICS
- G01—MEASURING; TESTING
- G01M—TESTING STATIC OR DYNAMIC BALANCE OF MACHINES OR STRUCTURES; TESTING OF STRUCTURES OR APPARATUS, NOT OTHERWISE PROVIDED FOR
- G01M7/00—Vibration-testing of structures; Shock-testing of structures
- G01M7/02—Vibration-testing by means of a shake table
- G01M7/025—Measuring arrangements
-
- G—PHYSICS
- G01—MEASURING; TESTING
- G01M—TESTING STATIC OR DYNAMIC BALANCE OF MACHINES OR STRUCTURES; TESTING OF STRUCTURES OR APPARATUS, NOT OTHERWISE PROVIDED FOR
- G01M99/00—Subject matter not provided for in other groups of this subclass
-
- G—PHYSICS
- G06—COMPUTING; CALCULATING OR COUNTING
- G06Q—INFORMATION AND COMMUNICATION TECHNOLOGY [ICT] SPECIALLY ADAPTED FOR ADMINISTRATIVE, COMMERCIAL, FINANCIAL, MANAGERIAL OR SUPERVISORY PURPOSES; SYSTEMS OR METHODS SPECIALLY ADAPTED FOR ADMINISTRATIVE, COMMERCIAL, FINANCIAL, MANAGERIAL OR SUPERVISORY PURPOSES, NOT OTHERWISE PROVIDED FOR
- G06Q50/00—Systems or methods specially adapted for specific business sectors, e.g. utilities or tourism
- G06Q50/10—Services
-
- G—PHYSICS
- G08—SIGNALLING
- G08B—SIGNALLING OR CALLING SYSTEMS; ORDER TELEGRAPHS; ALARM SYSTEMS
- G08B21/00—Alarms responsive to a single specified undesired or abnormal condition and not otherwise provided for
- G08B21/18—Status alarms
- G08B21/182—Level alarms, e.g. alarms responsive to variables exceeding a threshold
Abstract
진동 해석 시스템 (100) 은, 동작 중의 대상물에 장착된 센서에 의해 검출되는 진동 신호의 입력을 접수하는 신호 입력부 (202) 와, 대상물에 대응하는 진동 신호를 분석함으로써, 복수의 주파수 대역에 각각 대응하는 복수의 신호 강도를 산출하는 강도 산출부 (204) 와, 제 1 단위 공간에 대한, 복수의 신호 강도로 구성되는 제 1 신호 공간의 제 1 마할라노비스 거리를 산출하는 제 1 거리 산출부 (206) 와, 복수의 신호 강도의 무게 중심 위치를 나타내는 2 차원의 무게 중심 데이터를 산출하는 무게 중심 산출부 (208) 와, 제 2 단위 공간에 대한, 무게 중심 데이터로 구성되는 제 2 신호 공간의 제 2 마할라노비스 거리를 산출하는 제 2 거리 산출부 (210) 와, 제 1 마할라노비스 거리와 제 2 마할라노비스 거리에 기초하여, 대상물의 이상 발생 시기를 예측하는 이상 예측부 (212) 를 구비한다.The vibration analysis system 100 corresponds to a plurality of frequency bands by analyzing a signal input unit 202 that receives an input of a vibration signal detected by a sensor attached to an object during operation and a vibration signal corresponding to the object. a strength calculation unit 204 that calculates a plurality of signal strengths of a first unit space, and a first distance calculator that calculates a first Mahalanobis distance of a first signal space composed of a plurality of signal strengths with respect to a first unit space ( 206), a center of gravity calculation unit 208 that calculates two-dimensional center of gravity data representing the positions of the centers of gravity of a plurality of signal intensities, and a second signal space composed of the center of gravity data for a second unit space. A second distance calculation unit 210 that calculates a second Mahalanobis distance, and an anomaly prediction unit 212 that predicts an abnormal occurrence time of the object based on the first Mahalanobis distance and the second Mahalanobis distance to provide
Description
본 개시는, 진동 해석 시스템, 및 진동 해석 방법에 관한 것이다.The present disclosure relates to a vibration analysis system and a vibration analysis method.
종래, 기계의 이상을 검사하기 위한 수법으로서, 기기의 동작 중의 이상 진동에서 기인하는 신호를 검출함으로써, 그 기기의 이상의 유무를 판정하는 수법이 알려져 있다.BACKGROUND ART [0002] Conventionally, as a method for inspecting an abnormality in a machine, a method for determining the presence or absence of an abnormality in a machine by detecting a signal resulting from abnormal vibration during operation of the machine is known.
예를 들어, 일본 공개특허공보 2019-35585호 (특허문헌 1) 에서는, 데이터 간 거리에 기초한 이상인지의 여부의 정도를 나타내는 지표값을 산출하여 이상인지의 여부를 판정하는 소정의 근방법에 기초한 이상 판정 처리를, 기존의 분석 결과 데이터군을 대표하는 기존의 대표 데이터군에 대한, 새로운 분석 결과 데이터군의 각 데이터에 대해 적용한다.For example, in Japanese Unexamined Patent Publication No. 2019-35585 (Patent Document 1), an anomaly based on a predetermined proximity method for determining whether or not there is an anomaly by calculating an index value indicating the degree of anomaly based on a distance between data. Judgment processing is applied to each data of the new analysis result data group to the existing representative data group representing the existing analysis result data group.
특허문헌 1 에서는, 대상 기기의 상태 감시 결과인 다수의 데이터 중에서, 이상 검지에 사용하는 대표 데이터를 적절히 선택하는 것을 검토하고 있다. 그러나, 기기의 예지 보전 등을 위해 이상의 시기를 예측하는 구성에 대해서는 아무런 개시도 시사도 되어 있지 않다.In
본 개시의 어느 국면에 있어서의 목적은, 대상물의 진동 상태를 해석함으로써, 대상물의 이상 발생 시기를 예측하는 것이 가능한 진동 해석 시스템, 및 진동 해석 방법을 제공하는 것이다.An object of one aspect of the present disclosure is to provide a vibration analysis system and a vibration analysis method capable of predicting the occurrence timing of an abnormality of an object by analyzing the vibration state of the object.
어느 실시형태에 따른 진동 해석 시스템은, 동작 중의 대상물에 장착된 센서에 의해 검출되는 진동 신호의 입력을 접수하는 신호 입력부와, 대상물에 대응하는 진동 신호를 분석함으로써, 복수의 주파수 대역에 각각 대응하는 복수의 신호 강도를 산출하는 강도 산출부와, 미리 설정된 제 1 단위 공간에 대한, 복수의 신호 강도로 구성되는 제 1 신호 공간의 제 1 마할라노비스 거리를 산출하는 제 1 거리 산출부와, 강도 산출부에 의해 산출된 복수의 신호 강도의 무게 중심 위치를 나타내는 2 차원의 무게 중심 데이터를 산출하는 무게 중심 산출부와, 미리 설정된 제 2 단위 공간에 대한, 2 차원의 무게 중심 데이터로 구성되는 제 2 신호 공간의 제 2 마할라노비스 거리를 산출하는 제 2 거리 산출부와, 제 1 마할라노비스 거리와 제 2 마할라노비스 거리에 기초하여, 대상물에 이상이 발생하는 이상 발생 시기를 예측하는 이상 예측부를 구비한다.A vibration analysis system according to an embodiment includes a signal input unit that accepts an input of a vibration signal detected by a sensor mounted on an object during operation and analyzes a vibration signal corresponding to the object, thereby corresponding to a plurality of frequency bands, respectively. a strength calculator that calculates a plurality of signal strengths; a first distance calculator that calculates a first Mahalanobis distance of a first signal space composed of a plurality of signal strengths with respect to a preset first unit space; a center of gravity calculation unit that calculates two-dimensional center of gravity data representing positions of the centers of gravity of the plurality of signal intensities calculated by the calculation unit; A second distance calculating unit that calculates a second Mahalanobis distance in two-signal spaces, and an abnormality that predicts when an abnormality occurs in an object based on the first Mahalanobis distance and the second Mahalanobis distance. A prediction unit is provided.
바람직하게는, 제 1 단위 공간은, 정상시의 대상물에 대응하는 진동 신호를 분석함으로써 산출되는, 복수의 주파수 대역에 각각 대응하는 복수의 신호 강도로 구성된다. 제 2 단위 공간은, 제 1 단위 공간을 구성하는 당해 복수의 신호 강도의 무게 중심 위치를 나타내는 2 차원의 무게 중심 데이터로 구성된다.Preferably, the first unit space is composed of a plurality of signal strengths respectively corresponding to a plurality of frequency bands, which are calculated by analyzing a vibration signal corresponding to an object in normal conditions. The second unit space is composed of two-dimensional center of gravity data indicating the position of the center of gravity of the plurality of signal intensities constituting the first unit space.
바람직하게는, 제 1 임계값 이상의 제 1 마할라노비스 거리가 산출된 경우에 있어서의 이상 발생 시기는, 제 1 임계값 이상의 제 1 마할라노비스 거리가 산출되지 않은 경우에 있어서의 이상 발생 시기보다 가까운 장래인 것으로 예측된다.Preferably, the timing of occurrence of the anomaly when the first Mahalanobis distance equal to or greater than the first threshold value is calculated is greater than the timing of occurrence of the abnormality when the first Mahalanobis distance equal to or greater than the first threshold value is not calculated. predicted to be in the near future.
바람직하게는, 이상 예측부는, 제 1 임계값 이상의 제 1 마할라노비스 거리가 산출되고 나서 수일 경과 후에 대상물에 이상이 발생하는 것으로 예측한다.Preferably, the anomaly predicting unit predicts that anomaly will occur in the object several days after the first Mahalanobis distance equal to or greater than the first threshold is calculated.
바람직하게는, 제 1 임계값 이상의 제 1 마할라노비스 거리가 산출되고, 또한 제 2 임계값 이상의 제 2 마할라노비스 거리가 산출된 경우에 있어서의 이상 발생 시기는, 제 1 임계값 이상의 제 1 마할라노비스 거리가 산출되고, 또한 제 2 임계값 이상의 제 2 마할라노비스 거리가 산출되지 않은 경우에 있어서의 이상 발생 시기보다 가까운 장래인 것으로 예측된다.Preferably, when the first Mahalanobis distance equal to or greater than the first threshold value is calculated and the second Mahalanobis distance equal to or greater than the second threshold value is calculated, the timing of occurrence of the anomaly is a first value equal to or greater than the first threshold value. The Mahalanobis distance is calculated, and it is predicted to be in the near future than the abnormal occurrence time in the case where the second Mahalanobis distance equal to or greater than the second threshold is not calculated.
바람직하게는, 이상 예측부는, 제 2 임계값 이상의 제 2 마할라노비스 거리가 산출되고 나서 수시간 경과 후에 대상물에 이상이 발생하는 것으로 예측한다.Preferably, the anomaly predicting unit predicts that anomaly will occur in the object several hours after the second Mahalanobis distance equal to or greater than the second threshold is calculated.
바람직하게는, 제 1 임계값 이상의 제 1 마할라노비스 거리가 산출된 경우, 제 1 경고 정보를 출력하고, 제 2 임계값 이상의 제 2 마할라노비스 거리가 산출된 경우, 제 1 경고 정보보다 경고 레벨이 큰 제 2 경고 정보를 출력하는 출력 제어부를 추가로 구비한다.Preferably, when the first Mahalanobis distance equal to or greater than the first threshold value is calculated, first warning information is output, and when the second Mahalanobis distance equal to or greater than the second threshold value is calculated, the first warning information is warned. An output control unit for outputting second warning information having a high level is further provided.
바람직하게는, 출력 제어부는, 제 1 마할라노비스 거리의 시계열 데이터와, 제 2 마할라노비스 거리의 시계열 데이터를 디스플레이에 표시시킨다.Preferably, the output controller displays time-series data of the first Mahalanobis distance and time-series data of the second Mahalanobis distance on the display.
다른 실시형태에 따른 진동 해석 방법은, 동작 중의 대상물에 장착된 센서에 의해 검출되는 진동 신호의 입력을 접수하는 스텝과, 대상물에 대응하는 진동 신호를 분석함으로써, 복수의 주파수 대역에 각각 대응하는 복수의 신호 강도를 산출하는 스텝과, 미리 설정된 제 1 단위 공간에 대한, 복수의 신호 강도로 구성되는 제 1 신호 공간의 제 1 마할라노비스 거리를 산출하는 스텝과, 산출된 복수의 신호 강도의 무게 중심 위치를 나타내는 2 차원의 무게 중심 데이터를 산출하는 스텝과, 미리 설정된 제 2 단위 공간에 대한, 2 차원의 무게 중심 데이터로 구성되는 제 2 신호 공간의 제 2 마할라노비스 거리를 산출하는 스텝과, 제 1 마할라노비스 거리와 제 2 마할라노비스 거리에 기초하여, 대상물에 이상이 발생하는 이상 발생 시기를 예측하는 스텝을 포함한다.A vibration analysis method according to another embodiment includes a step of receiving an input of a vibration signal detected by a sensor mounted on an object during operation, and analyzing a vibration signal corresponding to the object, thereby comprising a plurality of frequencies respectively corresponding to a plurality of frequency bands. A step of calculating the signal intensity of , a step of calculating a first Mahalanobis distance of a first signal space composed of a plurality of signal intensities with respect to a preset first unit space, and a weight of the calculated plurality of signal intensities A step of calculating two-dimensional center of gravity data indicating a center position, and a step of calculating a second Mahalanobis distance of a second signal space composed of two-dimensional center of gravity data for a preset second unit space; , a step of predicting an anomaly occurrence time when an anomaly occurs in the object, based on the first Mahalanobis distance and the second Mahalanobis distance.
본 개시에 의하면, 대상물의 진동 상태를 해석함으로써, 대상물의 이상 발생 시기를 예측하는 것이 가능해진다.According to the present disclosure, by analyzing the vibration state of the object, it becomes possible to predict the occurrence timing of the abnormality of the object.
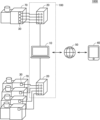
도 1 은, 시스템의 개요를 설명하기 위한 도면이다.
도 2 는, 진동 해석 시스템의 전체 구성의 일례를 나타내는 블록도이다.
도 3 은, 해석 장치의 하드웨어 구성의 일례를 나타내는 블록도이다.
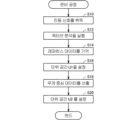
도 4 는, 준비 공정의 일례를 나타내는 플로 차트이다.
도 5 는, 각 주파수 대역의 신호 강도의 데이터 세트의 일례를 나타내는 도면이다.
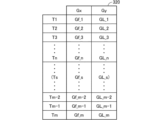
도 6 은, 무게 중심 위치의 데이터 세트의 일례를 나타내는 도면이다.
도 7 은, 해석 공정의 일례를 나타내는 플로 차트이다.
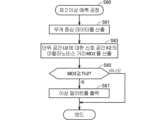
도 8 은, 제 1 이상 예측 공정의 일례를 나타내는 플로 차트이다.
도 9 는, 다차원 데이터에 기초한 마할라노비스 거리의 시계열 데이터를 나타내는 도면이다.
도 10 은, 제 2 이상 예측 공정의 일례를 나타내는 플로 차트이다.
도 11 은, 2 차원 데이터에 기초한 마할라노비스 거리의 시계열 데이터를 나타내는 도면이다.
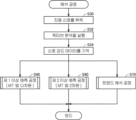
도 12 는, 트렌드 해석 공정의 일례를 나타내는 플로 차트이다.
도 13 은, 사용자 인터페이스 화면의 레이아웃예를 나타내는 도면이다.
도 14 는, 해석 장치의 기능 블록도이다.1 is a diagram for explaining the outline of the system.
2 is a block diagram showing an example of the overall configuration of a vibration analysis system.
3 is a block diagram showing an example of the hardware configuration of the analysis device.
4 is a flowchart showing an example of a preparatory step.
5 is a diagram showing an example of a data set of signal strength in each frequency band.
6 is a diagram showing an example of a data set of the center of gravity position.
7 is a flow chart showing an example of an analysis process.
8 is a flowchart showing an example of the first abnormality prediction process.
Fig. 9 is a diagram showing time-series data of the Mahalanobis distance based on multidimensional data.
10 is a flowchart showing an example of the second abnormality prediction process.
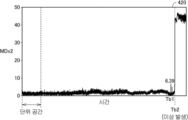
Fig. 11 is a diagram showing time-series data of the Mahalanobis distance based on two-dimensional data.
12 is a flowchart showing an example of a trend analysis process.
13 is a diagram showing an example of a layout of a user interface screen.
14 is a functional block diagram of an analysis device.
이하, 도면을 참조하면서, 본 발명의 실시형태에 대해 설명한다. 이하의 설명에서는, 동일한 부품에는 동일한 부호를 부여하고 있다. 그것들의 명칭 및 기능도 동일하다. 따라서, 그것들에 대한 상세한 설명은 반복하지 않는다.EMBODIMENT OF THE INVENTION Hereinafter, embodiment of this invention is described, referring drawings. In the following description, the same code|symbol is attached|subjected to the same component. Their names and functions are also the same. Accordingly, detailed descriptions thereof are not repeated.
<시스템 구성><System Configuration>
도 1 은, 시스템 (1000) 의 개요를 설명하기 위한 도면이다. 도 1 을 참조하면, 시스템 (1000) 은, 펌프 등의 보전 대상물 (이하, 간단히「대상물」이라고도 칭한다) 의 동작 중에 발생하는 진동의 신호를 해석함으로써, 대상물의 이상 발생을 예측하기 위한 시스템이다. 이하에서는, 대상물이 펌프인 것으로 하여 설명하지만, 이것에 한정되지 않고, 동작 중에 진동 (혹은 소리) 을 발생시키는 임의의 대상물에 대해 시스템 (1000) 을 적용할 수 있다. 예를 들어, 모터, 진동체로부터의 진동을 받아 진동하고 있는 부위 등의 이상 예측에도 시스템 (1000) 을 적용할 수 있다.FIG. 1 is a diagram for explaining the outline of a
시스템 (1000) 은, 진동 해석 시스템 (100) 과, 복수의 센서 (30) 와, 단말 장치 (40) 와, 네트워크 (50) 와, 복수의 펌프 (70) 를 포함한다. 진동 해석 시스템 (100) 은, 펌프 (70) 의 진동 해석을 실행한다. 진동 해석 시스템 (100) 은, 해석 장치 (10) 와, 센서 유닛 (20) 을 포함한다. 센서 유닛 (20) 은, 복수의 센서 (30) 와 전기적으로 접속되어 있다. 시스템 (1000) 에서는, 2 개의 센서 유닛 (20) 이 해석 장치 (10) 에 접속되어 있지만, 3 개 이상의 센서 유닛 (20), 또는 1 개의 센서 유닛 (20) 이 해석 장치 (10) 에 접속되는 구성이어도 된다. 각 센서 유닛 (20) 은, 1 개의 센서 (30) 와 전기적으로 접속되어 있어도 된다. 각 센서 유닛 (20) 은, 복수의 펌프 (70) 에 각각 장착된 복수의 센서 (30) 와 전기적으로 접속되어 있어도 된다.The
센서 (30) 는, 펌프 (70) 에 장착되어 있고, 펌프의 진동이나 소리에서 기인하여 검출되는 검출 신호 (진동 신호) 를 취득한다. 해석 장치 (10) 는, 센서 유닛 (20) 을 통하여 센서 (30) 로부터 입력된 진동 신호에 기초하여, 펌프 (70) 의 진동 해석을 실행한다. 해석 장치 (10) 는, 네트워크 (50) 를 통하여, 단말 장치 (40) 와 통신 가능하게 구성된다. 해석 장치 (10) 는, 진동 해석 결과 등을 단말 장치 (40) 에 송신한다.The
해석 장치 (10) 는, 전형적으로는, 범용적인 컴퓨터 아키텍처에 따른 구조를 갖고 있으며, 미리 인스톨된 프로그램을 프로세서가 실행함으로써, 후술하는 각종 처리를 실현한다. 해석 장치 (10) 는, 예를 들어, 랩탑 PC (Personal Computer) 이다. 단, 해석 장치 (10) 는, 이하에 설명하는 기능 및 처리를 실행 가능한 장치이면 되고, 다른 장치 (예를 들어, 데스크탑 PC, 태블릿 단말 장치) 여도 된다.The
네트워크 (50) 는, 인터넷 등의 각종 네트워크를 포함한다. 네트워크 (50) 는, 유선 통신 방식을 채용해도 되고, 무선 LAN (local area network) 등의 그 밖의 무선 통신 방식을 채용해도 된다.The
단말 장치 (40) 는, 예를 들어, 휴대 가능한 태블릿 단말 장치이다. 단, 단말 장치 (40) 는, 이것에 한정되지 않고, 스마트폰, 데스크탑 PC (Personal Computer) 등으로 실현되어도 된다. 또한, 본 실시형태에 따른 진동 해석 시스템 (100) 은, 해석 장치 (10) 와 센서 유닛 (20) 이 분리된 분리형의 장치로 구성되어 있지만, 해석 장치 (10) 및 센서 유닛 (20) 의 일체형의 장치로 구성되어 있어도 된다.The
도 2 는, 진동 해석 시스템 (100) 의 전체 구성의 일례를 나타내는 블록도이다. 도 2 를 참조하면, 진동 해석 시스템 (100) 은, 해석 장치 (10) 와, 센서 유닛 (20) 을 포함한다.2 is a block diagram showing an example of the overall configuration of the
센서 유닛 (20) 에 접속되는 센서 (30) 는, 진동이나 소리의 신호를 검출 가능한 센서이며, 예를 들어, 유기 압전 소자를 사용한 가속도 센서에 의해 구성된다. 또한, 센서 (30) 는, 진동이나 소리의 신호를 검출 가능한 센서이면 되며, 다른 방식 (예를 들어, 서보형) 의 가속도 센서로 구성되어 있어도 되고, 각종 다른 센서로 구성되어 있어도 된다.The
센서 (30) 에 의해 얻어지는 신호가 전하 신호인 경우, 차지 컨버터가, 센서 (30) 와 진동 해석 시스템 (100) 사이에 형성된다. 이 경우, 차지 컨버터는, 센서 (30) 로부터의 전하 신호를 전압 신호로 변환시켜, 진동 해석 시스템 (100) 에 출력한다. 또한, 센서 (30) 가 전하 신호를 전압 신호로 변환시키는 기능을 갖는 경우에는, 차지 컨버터는 불필요하다.When the signal obtained by the
센서 유닛 (20) 은, 센서 (30) (혹은, 차지 컨버터) 로부터 취득한 진동 신호를, 해석 장치 (10) 로 처리할 수 있는 신호로 변환시킨다. 구체적으로는, 센서 유닛 (20) 은, 필터 (21) 와, 증폭기 (22) 와, A/D 컨버터 (23) 를 포함한다.The
필터 (21) 는, 아날로그 필터이며, 센서 (30) 로부터 출력되는 진동 신호로부터 노이즈 성분을 제거한다. 필터 (21) 는, 로우 패스 필터, 하이 패스 필터 등에 의해 구성된다.The
증폭기 (22) 는, 필터 (21) 로부터 출력되는 아날로그 신호를 소정 배로 증폭시키고, 증폭된 신호를 A/D 컨버터 (23) 에 출력한다.The
A/D 컨버터 (23) 는, 소정의 샘플링 주파수에서, 증폭기 (22) 로부터 입력되는 신호를 아날로그 신호에서 디지탈 신호로 변환시킨다. A/D 컨버터 (23) 는, 디지탈 변환된 신호를 해석 장치 (10) 에 출력한다.The A/
도 3 은, 해석 장치 (10) 의 하드웨어 구성의 일례를 나타내는 블록도이다. 도 3 을 참조하면, 해석 장치 (10) 는, 프로세서 (101) 와, 메모리 (103) 와, 디스플레이 (105) 와, 입력 장치 (107) 와, 신호 입력 인터페이스 (I/F) (109) 와, 통신 인터페이스 (I/F) (111) 를 포함한다. 이들 각 부는, 서로 데이터 통신 가능하게 접속된다.3 is a block diagram showing an example of the hardware configuration of the
프로세서 (101) 는, 전형적으로는, CPU (Central Processing Unit), MPU (Multi Processing Unit) 등과 같은 연산 처리부이다. 프로세서 (101) 는, 메모리 (103) 에 기억된 프로그램을 판독 출력하여 실행함으로써, 해석 장치 (10) 의 각 부의 동작을 제어한다. 보다 상세하게는 프로세서 (101) 는, 당해 프로그램을 실행함으로써, 해석 장치 (10) 의 각 기능을 실현한다.The
메모리 (103) 는, RAM (Random Access Memory), ROM (Read-Only Memory), 플래시 메모리, 하드 디스크 등에 의해 실현된다. 메모리 (103) 는, 프로세서 (101) 에 의해 실행되는 프로그램 등을 기억한다.The
디스플레이 (105) 는, 예를 들어, 액정 디스플레이, 유기 EL (Electro Luminescence) 디스플레이 등이다. 디스플레이 (105) 는, 해석 장치 (10) 와 일체적으로 구성되어도 되고, 해석 장치 (10) 와는 별개로 구성되어도 된다.The
입력 장치 (107) 는, 해석 장치 (10) 에 대한 조작 입력을 접수한다. 입력 장치 (107) 는, 예를 들어, 키보드, 버튼, 마우스 등에 의해 실현된다. 또, 입력 장치 (107) 는, 터치 패널로서 실현되어 있어도 된다.The
신호 입력 인터페이스 (109) 는, 프로세서 (101) 와 센서 유닛 (20) 간의 데이터 전송을 중개한다. 신호 입력 인터페이스 (I/F) (109) 는, 센서 유닛 (20) 을 통하여, 센서 (30) 로부터의 진동 신호의 입력을 접수한다. 구체적으로는, 신호 입력 인터페이스 (109) 는, A/D 컨버터 (23) 로부터의 디지탈 신호의 입력을 접수한다.The
통신 인터페이스 (111) 는, 프로세서 (101) 와 단말 장치 (40) 등 간의 데이터 전송을 중개한다. 통신 방식으로는, 예를 들어, Bluetooth (등록 상표), 무선 LAN (Local Area Network) 등에 의한 무선 통신 방식이 사용된다. 또한, 통신 방식으로서, USB (Universal Serial Bus) 등의 유선 통신 방식을 사용해도 된다.The
<이상 예측 방식><Anomaly prediction method>
본 실시형태에 따른 이상 예측 방식의 개요에 대해 설명한다. 이상 예측 방식은, 레퍼런스 데이터를 준비하는 준비 공정과, 펌프 (70) 의 이상 상태를 해석하는 해석 공정을 포함한다.An outline of the abnormality prediction method according to the present embodiment will be described. The abnormality prediction method includes a preparation process for preparing reference data and an analysis process for analyzing the abnormal state of the
(준비 공정)(preparation process)
본 실시형태에 관련된 준비 공정에 있어서는, 예를 들어, 동작 개시 초기의 펌프 (70) 의 진동 상태가 계측된다. 동작 개시 초기의 펌프 (70) 는 신품의 상태인 점에서, 정상시의 펌프 (70) 의 진동 상태가 레퍼런스로서 계측된다. 단, 펌프 (70) 대신에, 펌프 (70) 와 동일 종류의 정상 상태의 펌프를 별도 준비하여, 당해 펌프의 진동 상태가 레퍼런스로서 계측되어도 된다.In the preparation process concerning this embodiment, the vibration state of the
도 4 는, 준비 공정의 일례를 나타내는 플로 차트이다. 전형적으로는, 이하의 각 스텝은, 해석 장치 (10) 의 프로세서 (101) 가 메모리 (103) 에 격납된 프로그램을 실행함으로써 실현된다.4 is a flowchart showing an example of a preparatory step. Typically, each of the following steps is realized when
도 4 를 참조하면, 프로세서 (101) 는, 센서 유닛 (20) 을 통하여, 센서 (30) 로부터 출력되는 진동 신호를 취득한다 (스텝 S10). 구체적으로는, 프로세서 (101) 는, 센서 (30) 로부터 정상시의 펌프 (70) 에 대응하는 진동 신호 (펌프 (70) 의 진동 상태를 나타내는 진동 신호) 를 취득한다.Referring to FIG. 4 , the
프로세서 (101) 는, 소정 시간 (예를 들어, 수십 ∼ 수백m초) 축적된 진동 신호를, 옥타브 분석한다 (스텝 S12). 본 실시형태에서는, 1/3 옥타브 분석이 이용된다. 그 때문에, 각 진동 신호는, 1/3 밴드 패스 필터에 의해, 예를 들어 0.4 Hz 에서 20 kHz 까지의 48 밴드로 분리되고, 밴드 (즉, 주파수 대역) 마다 신호 강도 (진동 강도) 가 평균화된다. 이하의 설명에서는, 주파수 대역에 있어서 평균화된 신호 강도를, 간단히「주파수 대역의 신호 강도」라고도 칭한다.The
프로세서 (101) 는, 각 주파수 대역에 대해, 정상시의 펌프 (70) 에 대응하는 당해 주파수 대역의 신호 강도를 레퍼런스 데이터 R 로서 메모리 (103) 에 기억한다 (스텝 S14).
도 5 는, 각 주파수 대역의 신호 강도의 데이터 세트의 일례를 나타내는 도면이다. 도 5 를 참조하면, 데이터 세트 (310) 는, 각 시간 T1 ∼ Tm (단, m 은 자연수) 에 대해, 각 주파수 대역 f1 ∼ fn (단, n 은 자연수, n < m) 의 신호 강도 L 을 포함한다. 각 진동 신호가 48 밴드로 분리되는 경우, n = 48 이다. 예를 들어, 데이터 세트 (310) 는, 시간 T1 에 있어서는, 각 주파수 대역 f1 ∼ fn 의 신호 강도 L1_1 ∼ L1_n 을 포함하고, 시간 Tm 에 있어서는, 각 주파수 대역 f1 ∼ fn 의 신호 강도 Lm_1 ∼ Lm_n 을 포함한다. 레퍼런스 데이터 R 은, 예를 들어, 각 시간 T1 ∼ Tn 의 각 주파수 대역 f1 ∼ fn 의 신호 강도 L 을 포함한다. 이 경우, 시간 T1 ∼ Tn 의 기간이 동작 개시 초기 기간에 대응한다.5 is a diagram showing an example of a data set of signal strength in each frequency band. Referring to FIG. 5, a
다시 도 4 를 참조하면, 프로세서 (101) 는, 레퍼런스 데이터 R 을 사용하여 마할라노비스·타구치법 (MT 법) 에 있어서의 단위 공간 U1 을 설정한다 (스텝 S16). 구체적으로는, 프로세서 (101) 는, 각 시간 T1 ∼ Tn 에 있어서의 각 주파수 대역 f1 ∼ fn 의 신호 강도 L 의 데이터를, 단위 공간 U1 로서 설정한다. 단위 공간 U1 은, 후술하는 제 1 이상 예측 공정에 있어서 사용된다.Referring again to Fig. 4,
프로세서 (101) 는, 각 주파수 대역의 신호 강도의 무게 중심 위치를 나타내는 2 차원의 무게 중심 데이터를 산출한다 (스텝 S18). 구체적으로는, 프로세서 (101) 는, 데이터 세트 (310) 로부터 도 6 에 나타내는 데이터 세트를 생성한다.
도 6 은, 무게 중심 위치의 데이터 세트의 일례를 나타내는 도면이다. 도 6 을 참조하면, 데이터 세트 (320) 는, 시간 T1 ∼ Tm 에 대해, 주파수 대역의 무게 중심 위치 Gx 와, 신호 강도의 무게 중심 위치 Gy 를 포함한다. 각 시간 T1 ∼ Tm 에 대해, 2 차원의 무게 중심 데이터 (무게 중심 위치 Gx, Gy) 가 생성된다. 무게 중심 위치 Gx 는 이하의 식 (1) 로 나타내고, 무게 중심 위치 Gy 는 이하의 식 (2) 로 나타낸다.6 is a diagram showing an example of a data set of the center of gravity position. Referring to FIG. 6 , a


fi 는 i 번째의 주파수 대역을 나타내고, Li 는 i 번째의 주파수 대역의 신호 강도를 나타내고, S 는 전체 주파수 대역의 신호 강도의 총합을 나타내고 있다. 상기 (1) 및 (2) 에 의해, n 차원 (다차원) 의 데이터 (각 주파수 대역 f1 ∼ fn 의 신호 강도 L) 로 구성되는 데이터 세트 (310) 로부터, 2 차원의 데이터 (무게 중심 위치 Gx, Gy) 로 구성되는 데이터 세트 (320) 가 생성된다. 데이터 세트 (320) 에서는, 예를 들어, 시간 T1 의 무게 중심 위치 Gx, Gy 를 각각 무게 중심 위치 Gf_1, GL_1 로 나타내고, 시간 Tm 의 무게 중심 위치 Gx, Gy 를 각각 무게 중심 위치 Gf_m, GL_m 으로 나타낸다.f i represents the i-th frequency band, L i represents the signal strength of the ith frequency band, and S represents the total signal strength of all frequency bands. From the
다시 도 4 를 참조하면, 프로세서 (101) 는, 동작 개시 초기 기간 (예를 들어, 시간 T1 ∼ Tn) 에 있어서의 무게 중심 데이터를 사용하여, MT 법에 있어서의 단위 공간 U2 를 설정한다 (스텝 S20). 구체적으로는, 프로세서 (101) 는, 각 시간 T1 ∼ Tn 의 2 차원의 무게 중심 데이터 (무게 중심 위치 Gx, Gy) 를, 단위 공간 U2 로서 설정한다. 단위 공간 U2 는, 후술하는 제 2 이상 예측 공정에 있어서 사용된다.Referring back to Fig. 4, the
(해석 공정)(analysis process)
해석 공정은, 펌프 (70) 의 진동 상태의 이상 발생 시기를 예측하는 제 1 및 제 2 이상 예측 공정과, 펌프 (70) 의 진동 상태의 향후의 경향을 해석하는 트렌드 해석 공정을 포함한다.The analysis process includes first and second abnormality prediction processes for predicting an abnormal occurrence time of the vibration state of the
도 7 은, 해석 공정의 일례를 나타내는 플로 차트이다. 도 7 을 참조하면, 프로세서 (101) 는, 센서 유닛 (20) 을 통하여, 센서 (30) 로부터 출력되는 진동 신호를 취득한다 (스텝 S30). 구체적으로는, 프로세서 (101) 는, 통상 기간 (예를 들어, 동작 개시 초기 기간 종료 후의 기간) 중의 펌프 (70) 에 대응하는 진동 신호를 센서 (30) 로부터 취득한다.7 is a flow chart showing an example of an analysis process. Referring to FIG. 7 , the
프로세서 (101) 는, 소정 시간 축적된 진동 신호를, 옥타브 분석한다 (스텝 S32). 프로세서 (101) 는, 각 주파수 대역에 대해, 펌프 (70) 에 대응하는 당해 주파수 대역의 신호 강도를 메모리 (103) 에 기억한다 (스텝 S34). 구체적으로는, 어느 시간 Ts 에서의 펌프 (70) 에 있어서의 각 주파수 대역의 신호 강도가, 데이터 세트 (310) 의 형식으로 기억된다. 여기서, 시간 Ts 에서의 펌프 (70) 에 있어서의 주파수 대역 f1 ∼ fn 의 일련의 신호 강도 Ls_1 ∼ Ls_n 을, 신호 강도 데이터 Ps 라고도 칭한다. 또한, 시간 T1 ∼ Tn 의 기간이 동작 개시 초기 기간에 대응하기 때문에, 통상 기간은 시간 Tn + 1 ∼ 시간 Tm 의 기간에 대응한다. 그 때문에, 시간 Ts 는, 시간 Tn + 1 ∼ 시간 Tm 중 어느 때이다.
프로세서 (101) 는, 신호 강도 데이터 Ps 와 레퍼런스 공정에서 얻어진 데이터를 사용하여, 제 1 이상 예측 공정 (스텝 S40), 제 2 이상 예측 공정 (스텝 S60) 및 트렌드 해석 공정 (스텝 S70) 을 실행한다. 이들 각 공정은, 병행하여 실행되어도 되고, 순차적으로 실행되어도 된다.
[제 1 이상 예측 공정][First Abnormal Prediction Process]
도 8 은, 제 1 이상 예측 공정의 일례를 나타내는 플로 차트이다. 제 1 이상 예측 공정에서는, 다차원 데이터로 구성되는 데이터 세트 (310) 가 사용된다. 도 8 을 참조하면, 프로세서 (101) 는, 도 4 의 스텝 S16 에서 설정한 단위 공간 U1 에 대한, 복수의 신호 강도로 구성되는 신호 공간 X1s 의 마할라노비스 거리 MD1 (이하, 간단히「거리 MD1」이라고도 칭한다) 을 산출한다 (스텝 S41). 신호 공간 X1s 는, 시간 Ts 에서의 복수의 신호 강도 Ls_1 ∼ Ls_n (즉, 신호 강도 데이터 Ps) 으로 구성된다.8 is a flowchart showing an example of the first abnormality prediction process. In the first anomaly prediction process, a
프로세서 (101) 는, 거리 MD1 이 임계값 Th1 (예를 들어, 5) 이상인지의 여부를 판단한다 (스텝 S43). 거리 MD1 이 임계값 Th1 미만인 경우 (스텝 S43 에 있어서 아니오), 프로세서 (101) 는 제 1 이상 예측 공정을 종료한다. 거리 MD1 이 임계값 Th1 이상인 경우 (스텝 S43 에 있어서 예), 프로세서 (101) 는, 가까운 장래에 펌프 (70) 에 이상이 발생하는 것으로 예측하여, 이상 얼러트를 출력하고 (스텝 S45), 제 1 이상 예측 공정을 종료한다. 전형적으로는, 이상 얼러트는, 디스플레이 (105) 에 표시된다. 또한, 이상 얼러트는, 스피커를 통하여 음성 출력되는 구성이어도 된다.
여기서, 도 9 를 참조하면서, 프로세서 (101) 가 상기와 같이 예측하는 이유에 대해 설명한다. 도 9 는, 다차원 데이터에 기초한 마할라노비스 거리의 시계열 데이터를 나타내는 도면이다. 그래프 410 은, 펌프 (70) 와 동일 종류의 참조 펌프에 있어서의 마할라노비스 거리 MDx1 의 시계열 데이터를 나타내고 있다. 그 때문에, 그래프 410 의 마할라노비스 거리 MDx1 은, 펌프 (70) 에 있어서의 마할라노비스 거리 MD1 과 동일한 경향을 나타낸다고 할 수 있다.Here, referring to Fig. 9, the reason why the
그래프 410 에 의하면, 단위 공간에 대한 신호 공간의 마할라노비스 거리 MDx1 은, 시간 Ta1 일 때에 처음으로 임계값 Th1 (= 5) 을 초과하고 있다. 그 후, 시간 Ta2, Ta3, Ta4 에 있어서, 마할라노비스 거리 MDx1 은 임계값 Th1 을 초과하고, 최종적으로는 시간 Ta5 에 있어서 참조 펌프에 이상이 발생하고 있다. 시간 Ta1 에서 시간 Ta5 까지의 기간은 4.5 일이고, 시간 Ta2 에서 시간 Ta5 까지의 기간은 3 일이고, 시간 Ta3 에서 시간 Ta5 까지의 기간은 1.5 일이고, 시간 Ta4 에서 시간 Ta5 까지의 기간은 8.5 시간이었다. 이 점에서, 마할라노비스 거리 MDx1 이 임계값 Th1 을 처음으로 초과하고 나서 수일 후에 이상이 발생하고 있는 것이 이해된다.According to the
따라서, 임계값 Th1 이상의 마할라노비스 거리 MD1 이 산출된 경우에는, 프로세서 (101) 는, 가까운 장래에 펌프 (70) 에 이상이 발생하는 것으로 예측한다. 특히, 프로세서 (101) 는, 임계값 Th1 이상의 마할라노비스 거리 MD1 이 처음으로 산출되었을 때로부터 수일 후에 펌프 (70) 에 이상이 발생하는 것으로 예측해도 된다. 이 경우, 프로세서 (101) 는, 수일 후에 펌프 (70) 에 이상이 발생할 가능성이 있는 것을 통지하는, 비교적 경고 레벨이 높은 이상 얼러트를 출력해도 된다.Accordingly, when the Mahalanobis distance MD1 equal to or greater than the threshold value Th1 is calculated,
[제 2 이상 예측 공정][Second Abnormal Prediction Process]
도 10 은, 제 2 이상 예측 공정의 일례를 나타내는 플로 차트이다. 도 10 을 참조하면, 프로세서 (101) 는, 각 주파수 대역의 신호 강도의 무게 중심 위치를 나타내는 2 차원의 무게 중심 데이터를 산출한다 (스텝 S61). 구체적으로는, 프로세서 (101) 는, 스텝 S32 에서 산출된 신호 강도 데이터 Ps 로부터 식 (1) 및 (2) 를 사용하여 2 차원의 무게 중심 데이터 (즉, 무게 중심 위치 Gx, Gy) 를 산출한다.10 is a flowchart showing an example of the second abnormality prediction process. Referring to Fig. 10,
프로세서 (101) 는, 도 4 의 스텝 S20 에서 설정된 단위 공간 U2 에 대한, 2 차원의 무게 중심 데이터로 구성되는 신호 공간 X2s 의 마할라노비스 거리 MD2 (이하, 간단히「거리 MD2」라고도 칭한다) 를 산출한다 (스텝 S63). 신호 공간 X2 는, 시간 Ts 에서의 무게 중심 위치 Gx, Gy (즉, Gf_s, GL_s) 로 구성된다.
프로세서 (101) 는, 거리 MD2 가 임계값 Th2 (예를 들어, 5) 이상인지의 여부를 판단한다 (스텝 S65). 거리 MD2 가 임계값 Th2 미만인 경우 (스텝 S63 에 있어서 아니오), 프로세서 (101) 는 제 2 이상 예측 공정을 종료한다. 거리 MD2 가 임계값 Th2 이상인 경우 (스텝 S63 에 있어서 예), 프로세서 (101) 는, 매우 가까운 장래에 펌프 (70) 에 이상이 발생하는 것으로 예측하여, 이상 얼러트를 출력하고 (스텝 S65), 제 2 이상 예측 공정을 종료한다.
여기서, 도 11 을 참조하면서, 프로세서 (101) 가 상기와 같이 예측하는 이유에 대해 설명한다. 도 11 은, 2 차원 데이터에 기초한 마할라노비스 거리의 시계열 데이터를 나타내는 도면이다. 그래프 420 은, 펌프 (70) 와 동일 종류의 참조 펌프에 있어서의 마할라노비스 거리 MDx2 의 시계열 데이터를 나타내고 있다. 그 때문에, 그래프 420 의 마할라노비스 거리 MDx2 는, 펌프 (70) 에 있어서의 마할라노비스 거리 MD2 와 동일한 경향을 나타낸다고 할 수 있다.Here, referring to Fig. 11, the reason why the
그래프 420 에 의하면, 마할라노비스 거리 MDx2 는, 시간 Tb1 일 때에 처음으로 임계값 Th2 (= 5) 를 초과하고 있다. 그 후, 시간 Tb2 에 있어서 참조 펌프에 이상이 발생하고 있다. 시간 Tb1 에서 시간 Tb2 까지의 기간은 5.5 시간이었다. 이 점에서, 마할라노비스 거리 MD 가 임계값 Th2 를 최초로 초과하고 나서 수시간 후에 이상이 발생하고 있다고 할 수 있다.According to the
따라서, 임계값 Th2 이상의 마할라노비스 거리 MD2 가 산출된 경우에는, 프로세서 (101) 는, 매우 가까운 장래에 펌프 (70) 에 이상이 발생하는 것으로 예측한다. 특히, 프로세서 (101) 는, 임계값 Th2 이상의 마할라노비스 거리 MD2 가 처음으로 산출되었을 때로부터 수시간 후에 펌프 (70) 에 이상이 발생하는 것으로 예측해도 된다. 이 경우, 프로세서 (101) 는, 수시간 후에 이상이 발생할 가능성이 있는 것을 통지하는, 경고 레벨이 높은 이상 얼러트를 출력해도 된다.Accordingly, when the Mahalanobis distance MD2 equal to or greater than the threshold value Th2 is calculated,
[트렌드 해석 공정][Trend analysis process]
도 12 는, 트렌드 해석 공정의 일례를 나타내는 플로 차트이다. 도 12 를 참조하면, 프로세서 (101) 는, 신호 강도 데이터 Ps 로부터, 레퍼런스 데이터 R 의 대표 데이터를 감산한 차분 H 를 산출한다 (스텝 S71).12 is a flowchart showing an example of a trend analysis process. Referring to Fig. 12,
레퍼런스 데이터 R 은, 각 시간 T1 ∼ Tn 의 각 주파수 대역 f1 ∼ fn 의 신호 강도 L 을 포함하는 데이터군으로 구성된다. 예를 들어, 프로세서 (101) 는, 이 데이터군 중, 어느 시간 Tn 의 각 주파수 대역 f1 ∼ fn 의 신호 강도 Ln_1 ∼ Ln_n 을 대표 데이터로서 추출한다. 그리고, 프로세서 (101) 는, 신호 강도 데이터 Ps 로부터 대표 데이터를 감산한 차분 H 를 산출한다. 이로써, 각 주파수 대역의 차분 H 가 산출된다.The reference data R is composed of data groups containing signal strengths L of each frequency band f1 to fn in each time period T1 to Tn. For example,
또한, 대표 데이터는, 시간 T1 ∼ Tn 의 각 주파수 대역 f1 ∼ fn 의 신호 강도 L 의 평균값으로 구성되어 있어도 된다. 이 경우, 예를 들어, 대표 데이터에 포함되는 주파수 대역 f1 의 신호 강도 L1 은, 신호 강도 L1_1 ∼ Ln_1 의 평균값으로 구성되고, 대표 데이터에 포함되는 주파수 대역 fn 의 신호 강도 Ln 은, 신호 강도 L1_n ∼ Ln_n 의 평균값으로 구성된다.In addition, the representative data may be constituted by an average value of signal strengths L in each frequency band f1 to fn during times T1 to Tn. In this case, for example, the signal strength L1 of the frequency band f1 included in the representative data is composed of the average value of the signal strengths L1_1 to Ln_1, and the signal strength Ln of the frequency band fn included in the representative data is the signal strength L1_n to Ln_1. It consists of the average value of Ln_n.
계속해서, 프로세서 (101) 는, 주파수 대역마다 차분 H 와 복수의 기준값 Z1, Z2, Z3 을 비교함으로써, 각 주파수 대역에 있어서의 펌프 (70) 의 진동 상태의 이상 레벨을 판정한다 (스텝 S73). 예를 들어, 차분 H 가 0 이상 또한 기준값 Z1 (예를 들어, 3 dB) 미만인 경우에는, 이상 레벨은「0」이고, 진동 상태는「정상」이 된다. 차분 H 가 기준값 Z1 이상 또한 기준값 Z2 (예를 들어, 6 dB) 미만인 경우에는, 이상 레벨은「1」이고, 펌프 (70) 의 상태 확인이 추장된다. 차분 H 가 기준값 Z2 이상 또한 기준값 Z3 (예를 들어, 10 dB) 미만인 경우에는, 이상 레벨은「2」이고, 펌프 (70) 의 메인터넌스가 추장된다. 차분 H 가 기준값 Z3 이상인 경우에는, 이상 레벨은「3」이고, 펌프 (70) 의 교환 등이 필요한 위험한 상태이다.Subsequently,
프로세서 (101) 는, 펌프 (70) 에 있어서의 진동 상태의 이상 레벨의 판정 결과에 기초하여, 이상 얼러트를 출력한다 (스텝 S75). 구체적으로는, 프로세서 (101) 는, 이상 레벨이「3」인 경우 (즉, H ≥ Z3 의 경우) 에는, 경고 레벨이 높은 이상 얼러트 (예를 들어,「위험」) 를 출력하고, 이상 레벨이「2」인 경우 (즉, Z2 ≤ H < Z3 의 경우) 에는, 경고 레벨이 비교적 높은 이상 얼러트 (예를 들어,「메인터넌스 추장」) 를 출력하고, 이상 레벨이「1」인 경우 (즉, Z1 ≤ H < Z2 의 경우) 에는, 경고 레벨이 낮은 이상 얼러트 (예를 들어,「주의」) 를 출력한다. 또한, 프로세서 (101) 는, 이상 레벨이「0」인 경우 (즉, H < Z1 의 경우) 에는, 펌프 (70) 의 진동 상태가「정상」인 것을 출력해도 된다. 계속해서, 프로세서 (101) 는, 이상 레벨의 판정 결과를 기억한다 (스텝 S77).
프로세서 (101) 는, 각 주파수 대역에 있어서의 펌프 (70) 의 진동 상태 중, 기준 시점 (예를 들어, 현시점) 에 있어서 이상 레벨이 높은 상위 소정수 (예를 들어, 5 개) 의 진동 상태를 특정하고, 당해 특정된 진동 상태에 대응하는 주파수 대역을 추출한다 (스텝 S79). 기준 시점은, 사용자에 의해 임의로 선택 가능하게 구성된다.The
프로세서 (101) 는, 추출된 주파수 대역 (이하,「추출 주파수 대역」이라고도 칭한다) 의 진동 상태에 대해, 트렌드 예측 처리를 실행한다 (스텝 S81). 구체적으로는, 프로세서 (101) 는, 추출 주파수 대역에 있어서의 기존 (과거) 의 차분 H 의 시계열 데이터에 기초하여, 미래의 차분 H 의 경향을 예측한다. 예를 들어, 프로세서 (101) 는, 기준 시점보다 과거의 차분 H 의 시계열 데이터를 근사 곡선 (예를 들어, 선형 근사, 지수 근사 등) 에 의해 근사하여, 기준 시점보다 미래의 차분 H 를 예측한다. 또, 프로세서 (101) 는, 과거의 차분 H 의 시계열 데이터를 회귀 분석함으로써 회귀 직선을 취득하고, 당해 회귀 직선의 기울기 및 절편에 기초하여 미래의 차분 H 를 예측해도 된다.
프로세서 (101) 는, 트렌드 예측 처리의 결과를 트렌드 그래프로서 디스플레이 (105) 에 표시한다 (스텝 S83). 프로세서 (101) 는, 트렌드 그래프에 관한 데이터를 메모리 (103) 에 기억하고 (스텝 S85), 트렌드 해석 공정을 종료한다. 예를 들어, 프로세서 (101) 는, 추출 주파수 대역, 트렌드 그래프 등의 각종 데이터를 메모리 (103) 에 기억한다.
<화면예><Screen example>
도 13 은, 사용자 인터페이스 화면 (500) 의 레이아웃예를 나타내는 도면이다. 단, 사용자 인터페이스 화면 (500) 은, 후술하는 기능을 실현할 수 있는 레이아웃이면 되며, 도 13 이외의 레이아웃이어도 된다.13 is a diagram showing an example layout of the
도 13 을 참조하면, 사용자 인터페이스 화면 (500) 은, 표시 영역 502 ∼ 512 와, 계측 조건 및 설정값의 표시 영역 514 와, 각종 버튼 516 과, 표시 영역 520 ∼ 540 과, 그래프 550 ∼ 570 을 포함한다.Referring to FIG. 13 , a
표시 영역 502 에는, 센서 유닛 (20) 의 식별 번호 (유닛 번호), 센서 (30) 의 식별 번호 (센서 번호), 계측 대상명 (예를 들어, 펌프) 등이 표시된다. 표시 영역 504 에는, 다차원 데이터를 사용한 MT 법에 의해 산출된 거리 MD1 에 기초한 스테이터스가 표시된다. 이 스테이터스는, 산출된 거리 MD1 의 값에 따라 변화한다. 예를 들어, 임계값 Th1 (예를 들어, 5) 이상의 거리 MD1 이 산출되고 있는 경우에는 스테이터스「위험」이 표시되고, 임계값 Th1 미만 또한 임계값 Th1a (예를 들어, 4) 이상의 거리 MD1 이 산출되고 있는 경우에는 스테이터스「메인터넌스 추장」이 표시되고, 임계값 Th1a 미만 또한 임계값 Th1b (예를 들어, 3) 이상의 거리 MD1 이 산출되고 있는 경우에는 스테이터스「주의」가 표시되고, 임계값 Th1b 미만의 거리 MD1 이 산출되고 있는 경우에는 스테이터스「정상」이 표시된다. 이와 같이, 거리 MD1 이 클수록 스테이터스의 경고 레벨은 높아진다.In the
표시 영역 506 에는, 2 차원 데이터를 사용한 MT 법에 의해 산출된 거리 MD2 에 기초한 스테이터스가 표시된다. 이 스테이터스는, 거리 MD2 의 값에 따라 변화한다. 예를 들어, 임계값 Th2 (예를 들어, 5) 이상의 거리 MD2 가 산출되고 있는 경우에는 스테이터스「위험」이 표시되고, 임계값 Th2 미만 또한 임계값 Th2a (예를 들어, 4) 이상의 거리 MD2 가 산출되고 있는 경우에는 스테이터스「메인터넌스 추장」이 표시되고, 임계값 Th2a 미만 또한 임계값 Th2b (예를 들어, 3) 이상의 거리 MD2 가 산출되고 있는 경우에는 스테이터스「주의」가 표시되고, 임계값 Th2b 미만의 거리 MD2 가 산출되고 있는 경우에는 스테이터스「정상」이 표시된다. 이와 같이, 거리 MD2 가 클수록 스테이터스의 경고 레벨은 높아진다.In the
표시 영역 508 에는, 트렌드 해석에 기초한 스테이터스가 표시된다. 이 스테이터스는, 기준 시점에 있어서의 차분 H 에 따라 변화한다. 예를 들어, 기준 시점의 차분 H 가 기준값 Z3 (예를 들어, 10 dB) 이상인 경우에는 스테이터스「위험」이 표시되고, 차분 H 가 기준값 Z3 미만 또한 기준값 Z2 (예를 들어, 6 dB) 이상인 경우에는 스테이터스「메인터넌스 추장」이 표시되고, 차분 H 가 기준값 Z2 미만 또한 기준값 Z1 (예를 들어, 3 dB) 이상인 경우에는 스테이터스「주의」가 표시되고, 차분 H 가 기준값 Z1 미만인 경우에는 스테이터스「정상」이 표시된다. 이와 같이, 차분 H 가 클수록 스테이터스의 경고 레벨은 높아진다.In the display area 508, the status based on the trend analysis is displayed. This status changes according to the difference H at the reference point in time. For example, if the difference H at the reference point is greater than or equal to the reference value Z3 (eg 10 dB), the status "Danger" is displayed, and if the difference H is less than the reference value Z3 or greater than or equal to the reference value Z2 (eg 6 dB). , the status "Maintenance recommended" is displayed, and when the difference H is less than the reference value Z2 and greater than or equal to the reference value Z1 (eg 3 dB), the status "Caution" is displayed, and if the difference H is less than the reference value Z1, the status "Normal" is displayed. In this way, the larger the difference H is, the higher the status warning level is.
표시 영역 520 에는, 센서 (30) 에 의해 검출된 시계열의 센서 데이터 (로데이터 (raw data)) 가 나타난다. 표시 영역 530 에는, 시계열의 센서 데이터를 FFT (fast Fourier transform) 해석한 해석 결과 (주파수 스펙트럼) 가 표시된다. 표시 영역 540 에는, 시계열의 센서 데이터를 1/3 옥타브 분석함으로써 얻어지는 신호 강도 데이터가 막대 그래프로 표시된다.In the
그래프 550 은, 거리 MD1 의 시계열 데이터를 나타내고 있다. 그래프 560 은, 거리 MD2 의 시계열 데이터를 나타내고 있다. 그래프 570 은, 도 12 의 스텝 S83 의 처리에 의해 얻어지는 트렌드 그래프이다.
상기 서술한 바와 같이, 임계값 Th1 이상의 거리 MD1 이 최초로 산출되었을 때로부터 수일 후에 펌프 (70) 에 이상이 발생하는 것으로 예측되고, 임계값 Th2 이상의 거리 MD2 가 최초로 산출되었을 때로부터 수시간 후에 펌프 (70) 에 이상이 발생하는 것으로 예측된다. 그 때문에, 사용자는, 그래프 550 및 560 을 확인함으로써, 펌프 (70) 의 이상의 발생 시기를 추측할 수 있다.As described above, it is predicted that an abnormality in the
예를 들어, 사용자는, 그래프 550 에 있어서 임계값 Th1 이상의 거리 MD1 이 확인된 경우, 상태 변화를 확인하면서 보전의 준비를 진행시켜 두고, 그래프 560 에 있어서 임계값 Th2 이상의 거리 MD2 가 확인된 경우, 곧바로 보전에 착수할 수 있다. 이로써, 펌프 (70) 의 점검, 메인터넌스, 수리 등의 기기 보전의 시기를 양호한 정밀도로 예측할 수 있기 때문에, 기기 보전을 계획적으로 실시할 수 있다.For example, when a distance MD1 equal to or greater than the threshold value Th1 is confirmed in the
<기능 구성><Function configuration>
도 14 는, 해석 장치 (10) 의 기능 블록도이다. 도 14 를 참조하면, 해석 장치 (10) 는, 주된 기능 구성으로서, 신호 입력부 (202) 와, 강도 산출부 (204) 와, 제 1 거리 산출부 (206) 와, 무게 중심 산출부 (208) 와, 제 2 거리 산출부 (210) 와, 이상 예측부 (212) 와, 트렌드 해석부 (214) 와, 출력 제어부 (216) 를 포함한다. 이들 각 기능은, 예를 들어, 해석 장치 (10) 의 프로세서 (101) 가 메모리 (103) 에 격납된 프로그램을 실행함으로써 실현된다. 또한, 이들 기능의 일부 또는 전부는 하드웨어로 실현되도록 구성되어 있어도 된다.14 is a functional block diagram of the
신호 입력부 (202) 는, 동작 중의 펌프 (70) 에 장착된 센서 (30) 에 의해 검출되는 진동 신호의 입력을 접수한다. 구체적으로는, 신호 입력부 (202) 는, 센서 유닛 (20) 을 통하여, 센서 (30) 에 의해 검출된 진동 신호 (디지탈 신호) 를 수신한다.The
강도 산출부 (204) 는, 신호 입력부 (202) 에 의해 접수된 진동 신호를 분석함으로써, 복수의 주파수 대역에 각각 대응하는 복수의 신호 강도를 산출한다. 구체적으로는, 강도 산출부 (204) 는, 펌프 (70) 에 대응하는 진동 신호를 옥타브 분석 (예를 들어, 1/3 옥타브 분석) 함으로써, 각 주파수 대역의 신호 강도 (예를 들어, 각 주파수 대역 f1 ∼ fm 의 신호 강도 L) 를 산출한다. 또한, 강도 산출부 (204) 는, 고속 푸리에 변환 (FFT : Fast Fourier Transform) 에 의해, 각 주파수 대역의 신호 강도를 산출하는 구성이어도 된다.The
제 1 거리 산출부 (206) 는, MT 법을 사용하여, 미리 설정된 단위 공간 (예를 들어, 단위 공간 U1) 에 대한, 복수의 신호 강도로 구성되는 신호 공간 (예를 들어, 신호 공간 X1) 의 마할라노비스 거리 (예를 들어, 거리 MD1) 를 산출한다. 전형적으로는, 단위 공간 U1 은, 정상시의 펌프 (70) 에 대응하는 진동 신호를 분석함으로써 산출되는, 복수의 주파수 대역 f1 ∼ fn 에 각각 대응하는 복수의 신호 강도 L 로 구성된다. 정상시의 펌프 (70) 에 대응하는 진동 신호는, 예를 들어, 각 시간 T1 ∼ Tn (즉, 동작 개시 초기 기간) 에 있어서의 펌프 (70) 의 진동 상태를 나타내는 진동 신호여도 되고, 펌프 (70) 와 동일 종류의 정상 상태의 펌프의 진동 상태를 나타내는 진동 신호여도 된다. 각 시간 (예를 들어, 시간 Tn + 1 ∼ Tm) 에 대한 거리 MD1 이 산출됨으로써, 거리 MD1 의 시계열 데이터가 생성된다.The first
무게 중심 산출부 (208) 는, 강도 산출부 (204) 에 의해 산출된 복수의 신호 강도의 무게 중심 위치를 나타내는 2 차원의 무게 중심 데이터 (예를 들어, 무게 중심 위치 Gx, Gy) 를 산출한다.The center of
제 2 거리 산출부 (210) 는, MT 법을 사용하여, 미리 설정된 단위 공간 (예를 들어, 단위 공간 U2) 에 대한, 2 차원의 무게 중심 데이터로 구성되는 신호 공간 (예를 들어, 신호 공간 X2) 의 마할라노비스 거리 (예를 들어, 거리 MD2) 를 산출한다. 전형적으로는, 단위 공간 U2 는, 단위 공간 U1 을 구성하는 복수의 신호 강도 L 의 무게 중심 위치를 나타내는 2 차원의 무게 중심 데이터로 구성된다. 각 시간 (예를 들어, 시간 Tn + 1 ∼ Tm) 에 대한 거리 MD2 가 산출됨으로써, 거리 MD2 의 시계열 데이터가 생성된다.The second
이상 예측부 (212) 는, 거리 MD1 과 거리 MD2 에 기초하여, 펌프 (70) 에 이상이 발생하는 이상 발생 시기를 예측한다. 어느 국면에서는, 임계값 Th1 이상의 거리 MD1 이 산출된 경우에 있어서의 이상 발생 시기는, 임계값 Th1 이상의 거리 MD1 이 산출되지 않은 경우에 있어서의 이상 발생 시기보다 가까운 장래인 것으로 예측된다. 구체적으로는, 이상 예측부 (212) 는, 임계값 Th1 이상의 거리 MD1 이 산출되고 나서 수일 경과 후에 펌프 (70) 에 이상이 발생하는 것으로 예측한다. 또한, 이상 예측부 (212) 는, 현시점에 있어서 임계값 Th1 이상의 거리 MD1 이 산출되지 않은 경우에는, 현시점으로부터 수일 이내에 펌프 (70) 에 이상이 발생할 가능성은 낮은 것으로 예측해도 된다.The
다른 국면에서는, 임계값 Th1 이상의 거리 MD1 이 산출되고, 또한 임계값 Th2 이상의 거리 MD2 가 산출된 경우에 있어서의 이상 발생 시기는, 임계값 Th1 이상의 거리 MD1 이 산출되고, 또한 임계값 Th2 이상의 거리 MD2 가 산출되지 않은 경우에 있어서의 이상 발생 시기보다 가까운 장래인 것으로 예측된다. 구체적으로는, 이상 예측부 (212) 는, 임계값 Th2 이상의 거리 MD2 가 산출되고 나서 수시간 경과 후에 펌프 (70) 에 이상이 발생하는 것으로 예측한다. 또한, 현시점에 있어서 임계값 Th1 이상의 거리 MD1 이 산출되고 있지만, 임계값 Th2 이상의 거리 MD2 가 산출되지 않은 경우에는, 이상 예측부 (212) 는, 현시점으로부터 수시간 이내에 펌프 (70) 에 이상이 발생할 가능성은 낮은 것으로 예측해도 된다.In another phase, when the distance MD1 equal to or greater than the threshold value Th1 is calculated, and the distance MD2 equal to or greater than the threshold value Th2 is calculated, the abnormality occurrence time is calculated, and the distance MD2 equal to or greater than the threshold value Th2 is calculated It is predicted to be in the near future than the time of occurrence of the anomaly in the case where is not calculated. Specifically, the
트렌드 해석부 (214) 는, 복수의 주파수 대역의 각각에 대해, 펌프 (70) 에 대응하는 당해 주파수 대역의 신호 강도와, 참조 펌프에 대응하는 당해 주파수 대역의 신호 강도의 차분 H 를 산출한다. 트렌드 해석부 (214) 는, 펌프 (70) 에 대응하는 각 주파수 대역의 신호 강도와 소정의 기준값에 기초하여, 각 주파수 대역에 있어서의 펌프 (70) 의 진동 상태의 이상 레벨을 판정한다. 구체적으로는, 트렌드 해석부 (214) 는, 복수의 주파수 대역의 각각에 대해, 당해 주파수 대역에 있어서의 차분 H 와 복수의 기준값 Z1 ∼ Z3 을 비교함으로써, 당해 주파수 대역에 있어서의 펌프 (70) 의 진동 상태의 이상 레벨을 판정한다.For each of a plurality of frequency bands, the
또, 트렌드 해석부 (214) 는, 각 주파수 대역에 있어서의 펌프 (70) 의 진동 상태 중에서, 이상 레벨이 높은 쪽에서부터 상위 소정수 (예를 들어, 5 개) 의 진동 상태를 특정하고, 당해 특정된 진동 상태에 대응하는 주파수 대역을 추출한다. 트렌드 해석부 (214) 는, 메모리 (103) 에 기억된 각 주파수 대역의 차분 H 의 시계열 데이터에 기초하여, 각 주파수 대역의 미래의 차분 H 를 예측한다. 구체적으로는, 트렌드 해석부 (214) 는, 기준 시점보다 과거의 차분 H 의 시계열 데이터를 회귀 분석함으로써 미래의 차분 H 를 예측한다. 혹은, 트렌드 해석부 (214) 는, 과거의 차분 H 의 시계열 데이터를 근사 곡선에 의해 근사함으로써 미래의 차분 H 를 예측한다.In addition, the
출력 제어부 (216) 는, 이상 예측부 (212) 의 예측 결과 등의 각종 정보를 출력한다. 어느 국면에서는, 출력 제어부 (216) 는, 임계값 Th1 이상의 거리 MD1 이 산출된 경우, 제 1 경고 정보 (예를 들어, 가까운 장래에 있어서의 펌프 (70) 의 이상 발생을 경고하는 정보) 를 출력하고, 임계값 Th2 이상의 거리 MD2 가 산출된 경우, 제 1 경고 정보보다 경고 레벨이 큰 (사용자에 대하여 경계를 강하게 촉구하는) 제 2 경고 정보 (예를 들어, 매우 가까운 장래에 있어서의 펌프 (70) 의 이상 발생을 경고하는 정보) 를 출력한다.The
예를 들어, 제 1 경고 정보가, 중간 정도의 긴급도를 나타내는 경고 레벨인 경우, 제 2 경고 정보는, 높은 정도의 긴급도를 나타내는 경고 레벨이다. 즉, 제 2 경고 정보는, 제 1 경고 정보보다 긴급도가 높은 정보가 된다. 이 경우, 출력 제어부 (216) 는, 제 1 경고 정보의 표시 양태보다 제 2 경고 정보의 표시 양태를 강조하여 (즉, 제 1 경고 정보보다 제 2 경고 정보의 쪽이 눈에 띄도록) 디스플레이 (105) 에 표시해도 된다.For example, when the first warning information is a warning level indicating a medium degree of urgency, the second warning information is a warning level indicating a high degree of urgency. That is, the second warning information becomes information with a higher degree of urgency than the first warning information. In this case, the
다른 국면에서는, 출력 제어부 (216) 는, 사용자 인터페이스 화면 (500) 에 나타내는 각종 정보를 디스플레이 (105) 에 표시시킨다. 구체적으로는, 출력 제어부 (216) 는, 거리 MD1 의 시계열 데이터 (예를 들어, 도 13 중의 그래프 550) 와, 거리 MD2 의 시계열 데이터 (예를 들어, 도 13 중의 그래프 560) 를 디스플레이 (105) 에 표시시킨다. 또 다른 국면에서는, 출력 제어부 (216) 는, 예측된 각 주파수 대역의 미래의 차분 H (예를 들어, 그래프 570 에 나타내는 트렌드 그래프) 를 디스플레이 (105) 에 표시시킨다. 또, 출력 제어부 (216) 는, 트렌드 해석부 (214) 에 의해 판정된 이상 레벨의 판정 결과에 기초한 이상 얼러트를 출력 (예를 들어, 디스플레이 (105) 에 표시) 한다.In another aspect, the
<이점><Advantages>
본 실시형태에 의하면, MT 법에 의한 거리 MD1 및 거리 MD2 를 확인함으로써, 펌프 (70) 의 이상 발생 시기가 가까운 장래 (예를 들어, 수일 후) 인지, 매우 가까운 장래인지 (예를 들어, 수시간 후) 를 예측할 수 있다. 또한, 트렌드 그래프에 의한 경향도 함께 참조함으로써 다양한 각도에서 펌프 (70) 의 이상을 사전에 예측할 수 있다. 그 때문에, 기기 보전을 계획적으로 실시할 수 있다.According to the present embodiment, by checking the distance MD1 and the distance MD2 according to the MT method, it is determined whether the
<그 밖의 실시형태><Other embodiments>
(1) 상기 서술한 실시형태에서는, 해석 장치 (10) 는, 임계값 Th1 이상이 되는 마할라노비스 거리 MD1 이 처음으로 산출되고 나서 수일 후에 이상 발생하는 것으로 예측하는 구성에 대해 설명하였다. 이것에 관하여, 도 9 에 나타내는 바와 같이, 시간 Ta 일 때에 처음으로 임계값 Th1 이상이 되고 나서, 시간 Ta2, Ta3, Ta4 에 있어서, 마할라노비스 거리 MDx1 은 임계값 Th1 이상이 되고, 시간 Ta5 에 있어서 참조 펌프에 이상이 발생하고 있다. 그 때문에, 마할라노비스 거리 MDx1 이 임계값 Th1 이상이 되는 횟수가 많아질수록, 이상 발생 시기가 근접해 있다고 할 수 있다. 그 때문에, 해석 장치 (10) (이상 예측부 (212)) 는, 임계값 Th1 이상이 되는 거리 MD1 이 산출되는 횟수가 많을수록, 보다 가까운 장래에 펌프 (70) 의 이상이 발생하는 것으로 예측해도 된다.(1) In the above-described embodiment, the
(2) 상기 서술한 실시형태에 있어서, 컴퓨터를 기능시켜, 상기 서술한 플로 차트에서 설명한 바와 같은 제어를 실행시키는 프로그램을 제공할 수도 있다. 이와 같은 프로그램은, 컴퓨터에 부속되는 플렉시블 디스크, CD-ROM (Compact Disk Read Only Memory), 2 차 기억 장치, 주기억 장치 및 메모리 카드 등의 일시적이 아닌 컴퓨터 판독 가능한 기록 매체에서 기록시켜, 프로그램 제품으로서 제공할 수도 있다. 혹은, 컴퓨터에 내장하는 하드 디스크 등의 기록 매체에서 기록시켜, 프로그램을 제공할 수도 있다. 또, 네트워크를 통한 다운로드에 의해, 프로그램을 제공할 수도 있다.(2) In the above-mentioned embodiment, it is also possible to provide a program that makes the computer function and executes the control as described in the above-mentioned flow chart. Such a program is recorded on a non-temporary computer readable recording medium such as a flexible disk attached to a computer, a compact disk read only memory (CD-ROM), a secondary storage device, a main memory device, and a memory card, and is used as a program product. may also provide. Alternatively, the program may be provided by recording it in a recording medium such as a hard disk built into a computer. Also, programs can be provided by downloading through a network.
프로그램은, 컴퓨터의 오퍼레이팅 시스템 (OS) 의 일부로서 제공되는 프로그램 모듈 중, 필요한 모듈을 소정의 배열로 소정의 타이밍에서 호출하여 처리를 실행시키는 것이어도 된다. 그 경우, 프로그램 자체에는 상기 모듈이 포함되지 않고 OS 와 협동하여 처리가 실행된다. 이와 같은 모듈을 포함하지 않는 프로그램도, 본 실시형태에 관련된 프로그램에 포함될 수 있다. 또, 본 실시형태에 관련된 프로그램은 다른 프로그램의 일부에 편입되어 제공되는 것이어도 된다. 그 경우에도, 프로그램 자체에는 상기 다른 프로그램에 포함되는 모듈이 포함되지 않고, 다른 프로그램과 협동하여 처리가 실행된다. 이와 같은 다른 프로그램에 편입된 프로그램도, 본 실시형태에 관련된 프로그램에 포함될 수 있다.The program may execute processing by calling necessary modules in a predetermined arrangement at a predetermined timing among program modules provided as part of an operating system (OS) of a computer. In that case, the above module is not included in the program itself, and processing is executed in cooperation with the OS. A program that does not include such a module can also be included in the program related to the present embodiment. Also, the program related to the present embodiment may be incorporated and provided as part of another program. Even in that case, the program itself does not contain modules included in the other programs, and processing is executed in cooperation with the other programs. Programs incorporated in other programs like this can also be included in the programs related to the present embodiment.
(3) 상기 서술한 실시형태로서 예시한 구성은, 본 발명의 구성의 일례이며, 다른 공지된 기술과 조합하는 것도 가능하고, 본 발명의 요지를 일탈하지 않는 범위에서, 일부를 생략하는 등, 변경하여 구성하는 것도 가능하다. 또, 상기 서술한 실시형태에 있어서, 그 밖의 실시형태에서 설명한 처리나 구성을 적절히 채용하여 실시하는 경우여도 된다.(3) The configuration exemplified as the embodiment described above is an example of the configuration of the present invention, and it is also possible to combine it with other known techniques, and a part is omitted without departing from the gist of the present invention. It is also possible to change the configuration. Moreover, in the embodiment described above, it may be a case where the processing and configuration described in the other embodiments are appropriately employed and implemented.
이번에 개시된 실시형태는 모든 점에서 예시로서 제한적인 것은 아닌 것으로 생각되어야 한다. 본 발명의 범위는, 상기한 설명이 아니라, 청구의 범위에 의해 나타내며, 청구의 범위와 균등한 의미 및 범위 내에서의 모든 변경이 포함되는 것이 의도된다.Embodiment disclosed this time should be considered as an illustration and not restrictive at all points. The scope of the present invention is shown by the claims rather than the description above, and it is intended that all changes within the scope and meaning equivalent to the scope of the claims are included.
10 : 해석 장치
20 : 센서 유닛
21 : 필터
22 : 증폭기
23 : 컨버터
30 : 센서
40 : 단말 장치
50 : 네트워크
70 : 펌프
100 : 진동 해석 시스템
101 : 프로세서
103 : 메모리
105 : 디스플레이
107 : 입력 장치
109 : 신호 입력 인터페이스
111 : 통신 인터페이스
202 : 신호 입력부
204 : 강도 산출부
206 : 제 1 거리 산출부
208 : 무게 중심 산출부
210 : 제 2 거리 산출부
212 : 이상 예측부
214 : 트렌드 해석부
216 : 출력 제어부
310, 320 : 데이터 세트
500 : 사용자 인터페이스 화면
1000 : 시스템10: analysis device
20: sensor unit
21: filter
22: Amplifier
23 : Converter
30: sensor
40: terminal device
50: network
70: pump
100: vibration analysis system
101: processor
103: memory
105: display
107: input device
109: signal input interface
111: communication interface
202: signal input unit
204: strength calculation unit
206: first distance calculator
208: center of gravity calculation unit
210: second distance calculator
212: anomaly prediction unit
214: trend analysis unit
216: output control
310, 320: data set
500: user interface screen
1000: system
Claims (9)
상기 대상물에 대응하는 진동 신호를 분석함으로써, 복수의 주파수 대역에 각각 대응하는 복수의 신호 강도를 산출하는 강도 산출부와,
미리 설정된 제 1 단위 공간에 대한, 상기 복수의 신호 강도로 구성되는 제 1 신호 공간의 제 1 마할라노비스 거리를 산출하는 제 1 거리 산출부와,
상기 강도 산출부에 의해 산출된 상기 복수의 신호 강도의 무게 중심 위치를 나타내는 2 차원의 무게 중심 데이터를 산출하는 무게 중심 산출부와,
미리 설정된 제 2 단위 공간에 대한, 상기 2 차원의 무게 중심 데이터로 구성되는 제 2 신호 공간의 제 2 마할라노비스 거리를 산출하는 제 2 거리 산출부와,
상기 제 1 마할라노비스 거리와 상기 제 2 마할라노비스 거리에 기초하여, 상기 대상물에 이상이 발생하는 이상 발생 시기를 예측하는 이상 예측부를 구비하는, 진동 해석 시스템.a signal input unit for accepting an input of a vibration signal detected by a sensor attached to an object during operation;
an intensity calculator configured to calculate a plurality of signal intensities respectively corresponding to a plurality of frequency bands by analyzing a vibration signal corresponding to the object;
a first distance calculation unit for calculating a first Mahalanobis distance of a first signal space composed of the plurality of signal intensities with respect to a preset first unit space;
a center of gravity calculation unit that calculates two-dimensional center of gravity data representing positions of centers of gravity of the plurality of signal intensities calculated by the intensity calculation unit;
a second distance calculation unit for calculating a second Mahalanobis distance of a second signal space composed of the two-dimensional center of gravity data for a preset second unit space;
A vibration analysis system comprising: an anomaly prediction unit that predicts an anomaly occurrence time when an anomaly occurs in the object based on the first Mahalanobis distance and the second Mahalanobis distance.
상기 제 1 단위 공간은, 정상시의 상기 대상물에 대응하는 진동 신호를 분석함으로써 산출되는, 상기 복수의 주파수 대역에 각각 대응하는 복수의 신호 강도로 구성되고,
상기 제 2 단위 공간은, 상기 제 1 단위 공간을 구성하는 당해 복수의 신호 강도의 무게 중심 위치를 나타내는 2 차원의 무게 중심 데이터로 구성되는, 진동 해석 시스템.According to claim 1,
The first unit space is composed of a plurality of signal intensities respectively corresponding to the plurality of frequency bands, which are calculated by analyzing a vibration signal corresponding to the object at normal times,
The second unit space is composed of two-dimensional center of gravity data indicating the position of the center of gravity of the plurality of signal intensities constituting the first unit space, the vibration analysis system.
제 1 임계값 이상의 상기 제 1 마할라노비스 거리가 산출된 경우에 있어서의 상기 이상 발생 시기는, 상기 제 1 임계값 이상의 상기 제 1 마할라노비스 거리가 산출되지 않은 경우에 있어서의 상기 이상 발생 시기보다 가까운 장래인 것으로 예측되는, 진동 해석 시스템.According to claim 1 or 2,
The anomaly occurrence time when the first Mahalanobis distance equal to or greater than the first threshold value is calculated is the abnormality occurrence time when the first Mahalanobis distance equal to or greater than the first threshold value is not calculated. A vibration analysis system that is predicted to be in the near future.
상기 이상 예측부는, 상기 제 1 임계값 이상의 상기 제 1 마할라노비스 거리가 산출되고 나서 수일 경과 후에 상기 대상물에 이상이 발생하는 것으로 예측하는, 진동 해석 시스템.According to claim 3,
The vibration analysis system according to claim 1 , wherein the abnormality predicting unit predicts that an abnormality will occur in the target object several days after the first Mahalanobis distance equal to or greater than the first threshold value is calculated.
상기 제 1 임계값 이상의 상기 제 1 마할라노비스 거리가 산출되고, 또한 제 2 임계값 이상의 상기 제 2 마할라노비스 거리가 산출된 경우에 있어서의 상기 이상 발생 시기는, 상기 제 1 임계값 이상의 상기 제 1 마할라노비스 거리가 산출되고, 또한 상기 제 2 임계값 이상의 상기 제 2 마할라노비스 거리가 산출되지 않은 경우에 있어서의 상기 이상 발생 시기보다 가까운 장래인 것으로 예측되는, 진동 해석 시스템.According to claim 3 or 4,
When the first Mahalanobis distance equal to or greater than the first threshold value is calculated and the second Mahalanobis distance equal to or greater than the second threshold value is calculated, the anomaly occurrence timing is determined by the first Mahalanobis distance equal to or greater than the first threshold value. A vibration analysis system that is predicted to be in the near future than the occurrence time of the abnormality in the case where the first Mahalanobis distance is calculated and the second Mahalanobis distance equal to or greater than the second threshold is not calculated.
상기 이상 예측부는, 상기 제 2 임계값 이상의 상기 제 2 마할라노비스 거리가 산출되고 나서 수시간 경과 후에 상기 대상물에 이상이 발생하는 것으로 예측하는, 진동 해석 시스템.According to claim 5,
The vibration analysis system according to claim 1 , wherein the abnormality predicting unit predicts that an abnormality will occur in the target object several hours after the second Mahalanobis distance equal to or greater than the second threshold value is calculated.
상기 제 1 임계값 이상의 상기 제 1 마할라노비스 거리가 산출된 경우, 제 1 경고 정보를 출력하고, 상기 제 2 임계값 이상의 상기 제 2 마할라노비스 거리가 산출된 경우, 상기 제 1 경고 정보보다 경고 레벨이 큰 제 2 경고 정보를 출력하는 출력 제어부를 추가로 구비하는, 진동 해석 시스템.According to claim 5 or 6,
When the first Mahalanobis distance equal to or greater than the first threshold value is calculated, first warning information is output, and when the second Mahalanobis distance equal to or greater than the second threshold value is calculated, the first warning information A vibration analysis system, further comprising an output control unit that outputs second warning information having a large warning level.
상기 출력 제어부는, 상기 제 1 마할라노비스 거리의 시계열 데이터와, 상기 제 2 마할라노비스 거리의 시계열 데이터를 디스플레이에 표시시키는, 진동 해석 시스템.According to claim 7,
The vibration analysis system, wherein the output controller displays time-series data of the first Mahalanobis distance and time-series data of the second Mahalanobis distance on a display.
상기 대상물에 대응하는 진동 신호를 분석함으로써, 복수의 주파수 대역에 각각 대응하는 복수의 신호 강도를 산출하는 스텝과,
미리 설정된 제 1 단위 공간에 대한, 상기 복수의 신호 강도로 구성되는 제 1 신호 공간의 제 1 마할라노비스 거리를 산출하는 스텝과,
산출된 상기 복수의 신호 강도의 무게 중심 위치를 나타내는 2 차원의 무게 중심 데이터를 산출하는 스텝과,
미리 설정된 제 2 단위 공간에 대한, 상기 2 차원의 무게 중심 데이터로 구성되는 제 2 신호 공간의 제 2 마할라노비스 거리를 산출하는 스텝과,
상기 제 1 마할라노비스 거리와 상기 제 2 마할라노비스 거리에 기초하여, 상기 대상물에 이상이 발생하는 이상 발생 시기를 예측하는 스텝을 포함하는, 진동 해석 방법.A step of receiving an input of a vibration signal detected by a sensor attached to an object during operation;
calculating a plurality of signal intensities respectively corresponding to a plurality of frequency bands by analyzing vibration signals corresponding to the object;
Calculating a first Mahalanobis distance of a first signal space composed of the plurality of signal intensities with respect to a preset first unit space;
Calculating two-dimensional center of gravity data representing the positions of the centers of gravity of the plurality of calculated signal intensities;
Calculating a second Mahalanobis distance of a second signal space composed of the two-dimensional center of gravity data for a preset second unit space;
and predicting an abnormal occurrence time when an abnormality occurs in the object based on the first Mahalanobis distance and the second Mahalanobis distance.
Applications Claiming Priority (3)
| Application Number | Priority Date | Filing Date | Title |
|---|---|---|---|
| JPJP-P-2020-160910 | 2020-09-25 | ||
| JP2020160910 | 2020-09-25 | ||
| PCT/JP2021/033498 WO2022065103A1 (en) | 2020-09-25 | 2021-09-13 | Vibration analysis system and vibration analysis method |
Publications (1)
| Publication Number | Publication Date |
|---|---|
| KR20230073210A true KR20230073210A (en) | 2023-05-25 |
Family
ID=80845354
Family Applications (1)
| Application Number | Title | Priority Date | Filing Date |
|---|---|---|---|
| KR1020237010195A KR20230073210A (en) | 2020-09-25 | 2021-09-13 | Vibration Analysis System, and Vibration Analysis Method |
Country Status (6)
| Country | Link |
|---|---|
| US (1) | US20230332979A1 (en) |
| JP (1) | JPWO2022065103A1 (en) |
| KR (1) | KR20230073210A (en) |
| CN (1) | CN116209883A (en) |
| TW (1) | TW202219470A (en) |
| WO (1) | WO2022065103A1 (en) |
Citations (1)
| Publication number | Priority date | Publication date | Assignee | Title |
|---|---|---|---|---|
| JP2019035585A (en) | 2017-08-10 | 2019-03-07 | 公益財団法人鉄道総合技術研究所 | Representative data selection device, device diagnostic device, program and representative data selection method |
Family Cites Families (6)
| Publication number | Priority date | Publication date | Assignee | Title |
|---|---|---|---|---|
| JP3692106B2 (en) * | 2002-09-27 | 2005-09-07 | 株式会社東芝 | Manufacturing apparatus and life prediction method of rotating machine |
| JP4396286B2 (en) * | 2004-01-21 | 2010-01-13 | 三菱電機株式会社 | Device diagnostic device and device monitoring system |
| CN105300692B (en) * | 2015-08-07 | 2017-09-05 | 浙江工业大学 | A kind of bearing failure diagnosis and Forecasting Methodology based on expanded Kalman filtration algorithm |
| JP2017142153A (en) * | 2016-02-10 | 2017-08-17 | セイコーエプソン株式会社 | Life prediction method, life prediction device, and life prediction system |
| JP2020134479A (en) * | 2019-02-26 | 2020-08-31 | 日本電産株式会社 | Abnormality detection method and abnormality detection device |
| JP7306967B2 (en) * | 2019-11-06 | 2023-07-11 | 株式会社日本製鋼所 | Anomaly detection device, anomaly detection method and computer program |
-
2021
- 2021-09-13 WO PCT/JP2021/033498 patent/WO2022065103A1/en active Application Filing
- 2021-09-13 KR KR1020237010195A patent/KR20230073210A/en unknown
- 2021-09-13 US US18/026,210 patent/US20230332979A1/en active Pending
- 2021-09-13 CN CN202180065165.5A patent/CN116209883A/en active Pending
- 2021-09-13 JP JP2022551891A patent/JPWO2022065103A1/ja active Pending
- 2021-09-24 TW TW110135478A patent/TW202219470A/en unknown
Patent Citations (1)
| Publication number | Priority date | Publication date | Assignee | Title |
|---|---|---|---|---|
| JP2019035585A (en) | 2017-08-10 | 2019-03-07 | 公益財団法人鉄道総合技術研究所 | Representative data selection device, device diagnostic device, program and representative data selection method |
Also Published As
| Publication number | Publication date |
|---|---|
| WO2022065103A1 (en) | 2022-03-31 |
| US20230332979A1 (en) | 2023-10-19 |
| CN116209883A (en) | 2023-06-02 |
| TW202219470A (en) | 2022-05-16 |
| JPWO2022065103A1 (en) | 2022-03-31 |
Similar Documents
| Publication | Publication Date | Title |
|---|---|---|
| US10228994B2 (en) | Information processing system, information processing method, and program | |
| US10504036B2 (en) | Optimizing performance of event detection by sensor data analytics | |
| EP3392727A1 (en) | Control device, monitoring system, control program, and recording medium | |
| US20180314238A1 (en) | Data processing apparatus, data processing system, data processing method, and program | |
| KR20130065621A (en) | Abnormality detection apparatus for periodic driving system, processing apparatus including periodic driving system, abnormality detection method for periodic driving system, and computer program | |
| US10359401B2 (en) | Malfunction diagnosing apparatus, malfunction diagnosing method, and recording medium | |
| EP2135144B1 (en) | Machine condition monitoring using pattern rules | |
| EP3910437B1 (en) | Monitoring apparatus, monitoring method, and computer-readable medium | |
| EP3674827B1 (en) | Monitoring target selecting device, monitoring target selecting method and program | |
| US20040193387A1 (en) | Signal recorder with status recognizing function | |
| US8416086B2 (en) | Methods for improved forewarning of condition changes in monitoring physical processes | |
| US20220187140A1 (en) | Abnormal temperature detection device, abnormal temperature detection method, and non-transitory computer readable storage medium | |
| KR20230073210A (en) | Vibration Analysis System, and Vibration Analysis Method | |
| JP6887374B2 (en) | Vibration analysis system and vibration analysis method | |
| CN116421178A (en) | Auxiliary monitoring method, device, terminal equipment and readable storage medium | |
| JP5751606B2 (en) | Abnormality diagnosis system for machinery | |
| US10866163B2 (en) | Anomaly monitoring device and method for producing anomaly signs according to combinations of sensors based on relationship of sensor fluctuations | |
| US11762360B2 (en) | Sensor device, data acquisition method, and current monitoring system | |
| JP2016031568A (en) | Abnormality diagnosis apparatus, abnormality diagnosis method, and abnormality diagnosis program | |
| EP3076169A1 (en) | Analysis device, analysis method, and analysis program | |
| KR102345646B1 (en) | A wearable device and a method for processing acceleration data | |
| JP2010279644A (en) | State determining device, state determining method, and program | |
| CN115898633A (en) | Method and system for identifying abnormal explosion pressure of cylinder | |
| WO2020059012A1 (en) | Abnormality detection device, abnormality detection system, and program | |
| JP2024031072A (en) | Monitoring device, monitoring method, and monitoring program |