KR20200040469A - Method, system and computer program for detecting error of facilities in building - Google Patents
Method, system and computer program for detecting error of facilities in building Download PDFInfo
- Publication number
- KR20200040469A KR20200040469A KR1020180120425A KR20180120425A KR20200040469A KR 20200040469 A KR20200040469 A KR 20200040469A KR 1020180120425 A KR1020180120425 A KR 1020180120425A KR 20180120425 A KR20180120425 A KR 20180120425A KR 20200040469 A KR20200040469 A KR 20200040469A
- Authority
- KR
- South Korea
- Prior art keywords
- abnormality
- anomaly detection
- score
- detection model
- autoencoder
- Prior art date
Links
Images


Classifications
-
- G—PHYSICS
- G06—COMPUTING; CALCULATING OR COUNTING
- G06N—COMPUTING ARRANGEMENTS BASED ON SPECIFIC COMPUTATIONAL MODELS
- G06N20/00—Machine learning
-
- G—PHYSICS
- G06—COMPUTING; CALCULATING OR COUNTING
- G06Q—INFORMATION AND COMMUNICATION TECHNOLOGY [ICT] SPECIALLY ADAPTED FOR ADMINISTRATIVE, COMMERCIAL, FINANCIAL, MANAGERIAL OR SUPERVISORY PURPOSES; SYSTEMS OR METHODS SPECIALLY ADAPTED FOR ADMINISTRATIVE, COMMERCIAL, FINANCIAL, MANAGERIAL OR SUPERVISORY PURPOSES, NOT OTHERWISE PROVIDED FOR
- G06Q50/00—Systems or methods specially adapted for specific business sectors, e.g. utilities or tourism
- G06Q50/10—Services
Abstract
Description
본 발명은 건물 내 설비의 이상을 탐지하는 방법, 시스템 및 컴퓨터 프로그램에 관한 것이다. The present invention relates to a method, system and computer program for detecting an abnormality in facilities in a building.
건물 에너지 관리 시스템(BEMS, Building Energy Management System)이란 IT 기술을 활용하여 건물 내의 전기, 공조, 방범, 방재와 같은 여러 설비를 관리하는 시스템을 말한다. 건물 에너지 관리 시스템은 빌딩 내 에너지 관리 설비와 관련된 다양한 정보를 실시간으로 수집 및 분석하여 에너지 사용량, 설비 운전 현황, 실내환경 및 탄소배출량 등을 관리하여 에너지 사용 효율을 개선시킬 수 있다. Building Energy Management System (BEMS) refers to a system that manages various facilities such as electricity, air conditioning, crime prevention, and disaster prevention in a building using IT technology. The building energy management system can improve energy use efficiency by collecting and analyzing various information related to energy management facilities in a building in real time to manage energy usage, facility operation status, indoor environment, and carbon emissions.
이러한 건물 에너지 관리 시스템과 관련하여, 선행기술인 한국등록특허 제 10-1170743호는 건물 에너지 관리 시스템을 통한 냉동기 최적 운전 시스템 및 방법을 개시하고 있다. In connection with such a building energy management system, Korean Patent Registration No. 10-1170743, which is a prior art, discloses an optimal operating system and method of a refrigerator through a building energy management system.
종래의 건물 에너지 관리 시스템은 건물 내 설비에서 고장이 발생된 경우, 머신러닝을 이용한 데이터 분석을 통해 설비에서 발생된 고장을 탐지할 수 있었다. 이때, 고장 탐지의 정확도를 높이기 위해서는 정상 데이터뿐만 아니라 고장 데이터도 함께 학습될 필요가 있으나, 실제 운용 환경에서는 고장 데이터를 수집하기 어렵다는 단점을 가지고 있다. In the conventional building energy management system, when a failure occurs in a facility in a building, a failure occurring in the facility can be detected through data analysis using machine learning. At this time, in order to increase the accuracy of the failure detection, it is necessary to learn not only normal data but also failure data, but it has a disadvantage in that it is difficult to collect failure data in an actual operating environment.
또한, 종래의 머신러닝이 건물의 특징까지 학습하지 못하므로, 건물, 설비에 따라 각각의 모델을 별도로 생성해야 하는 번거로움이 존재했다. In addition, since the conventional machine learning does not even learn the features of a building, there is a hassle of creating each model separately according to a building and facilities.
오토인코더(Autoencoder) 기반 이상 탐지 모델을 이용하여 고장 데이터 없이도 건물 내 설비에서 발생된 오류 및 오작동을 검출할 수 있도록 하는 건물 내 설비의 이상을 탐지하는 방법, 시스템 및 컴퓨터 프로그램을 제공하고자 한다. We intend to provide a method, system, and computer program for detecting abnormalities in facilities in buildings that enable errors and malfunctions in facilities in buildings to be detected without failure data using an autoencoder-based anomaly detection model.
오토인코더 기반 이상 탐지 모델을 이용함으로써, 이상이 발견된 설비의 위치와 원인을 찾을 수 있도록 하는 건물 내 설비의 이상을 탐지하는 방법, 시스템 및 컴퓨터 프로그램을 제공하고자 한다. By using an auto-encoder-based anomaly detection model, it is intended to provide a method, system, and computer program for detecting anomalies in facilities in a building that can find the location and cause of the anomalies.
종래의 기계 학습 기반의 임계값을 이용한 모델은 각 건물, 시스템마다 임계값을 설정해야 하며, 각 건물 및 설비별로 특성이 달라 임계값의 설정에 어려움이 따랐으나, 건물과 설비 내의 변수들 간의 상호 작용을 스스로 학습하도록 하여 건물의 특성이 자동으로 반영된 개별적인 모델을 생성하는 건물 내 설비의 이상을 탐지하는 방법, 시스템 및 컴퓨터 프로그램을 제공하고자 한다.In a model using a threshold value based on machine learning, thresholds must be set for each building and system, and it is difficult to set thresholds due to different characteristics for each building and facility. It is intended to provide a method, system, and computer program to detect anomalies in facilities in a building that self-learn the action to create individual models that automatically reflect the building's characteristics.
다만, 본 실시예가 이루고자 하는 기술적 과제는 상기된 바와 같은 기술적 과제들로 한정되지 않으며, 또 다른 기술적 과제들이 존재할 수 있다. However, the technical problems to be achieved by the present embodiment are not limited to the technical problems as described above, and other technical problems may exist.
상술한 기술적 과제를 달성하기 위한 수단으로서, 본 발명의 일 실시예는, 오토인코더(Autoencoder) 기반 이상 탐지 모델을 생성하는 단계, 상기 건물 내의 설비에 관한 복수의 학습용 데이터를 수집하는 단계, 상기 복수의 학습용 데이터에 기초하여 상기 오토인코더 기반 이상 탐지 모델을 학습하는 단계, 상기 건물 내의 설비에 관한 복수의 실시간 데이터를 수집하는 단계 및 상기 복수의 실시간 데이터를 상기 오토인코더 기반 이상 탐지 모델의 입력 변수로 입력하여 이상 점수(Anomaly score)를 도출하고, 상기 이상 점수에 기초하여 상기 설비의 이상 여부를 탐지하는 단계를 포함하는 이상 탐지 방법을 제공할 수 있다. As a means for achieving the above technical problem, an embodiment of the present invention, generating an autoencoder (Autoencoder) -based anomaly detection model, collecting a plurality of learning data for the equipment in the building, the plurality Learning the auto-encoder-based anomaly detection model based on the learning data of, collecting a plurality of real-time data about the facilities in the building, and using the plurality of real-time data as input variables of the auto-encoder-based anomaly detection model. An abnormality detection method may be provided, including inputting to derive an anomaly score and detecting whether the facility is abnormal based on the abnormality score.
본 발명의 다른 실시예는, 상기 건물 내의 설비에 관한 복수의 학습용 데이터를 수집하는 데이터 수집부, 오토인코더(Autoencoder) 기반 이상 탐지 모델을 생성하고, 상기 복수의 학습용 데이터에 기초하여 상기 오토인코더 기반 이상 탐지 모델을 학습하는 모델 학습부 및 복수의 실시간 데이터를 상기 오토인코더 기반 이상 탐지 모델의 입력 변수로 입력하여 이상 점수(Anomaly score)를 도출하고, 상기 이상 점수에 기초하여 상기 설비의 이상 여부를 탐지하는 이상 탐지부를 포함하는 이상 탐지 시스템을 제공할 수 있다. According to another embodiment of the present invention, a data collection unit that collects a plurality of learning data related to facilities in the building, an autoencoder-based anomaly detection model is generated, and the autoencoder based on the plurality of learning data The model learning unit learning the anomaly detection model and a plurality of real-time data are input as input variables of the autoencoder-based anomaly detection model to derive an anomaly score and determine whether the facility is abnormal based on the anomaly score. An abnormality detection system including an abnormality detection unit to detect may be provided.
본 발명의 또 다른 실시예는, 컴퓨터 프로그램은 컴퓨팅 장치에 의해 실행될 경우, 오토인코더(Autoencoder) 기반 이상 탐지 모델을 생성하고, 상기 건물 내의 설비에 관한 복수의 학습용 데이터를 수집하고, 상기 복수의 학습용 데이터에 기초하여 상기 오토인코더 기반 이상 탐지 모델을 학습하고, 상기 건물 내의 설비에 관한 복수의 실시간 데이터를 수집하고, 상기 복수의 실시간 데이터를 상기 오토인코더 기반 이상 탐지 모델의 입력 변수로 입력하여 이상 점수(Anomaly score)를 도출하고, 상기 이상 점수에 기초하여 상기 설비의 이상 여부를 탐지하도록 하는 명령어들의 시퀀스를 포함하는 매체에 저장된 컴퓨터 프로그램을 제공할 수 있다. In another embodiment of the present invention, when a computer program is executed by a computing device, an autoencoder-based anomaly detection model is generated, a plurality of learning data related to facilities in the building are collected, and the plurality of learning programs are used. Based on the data, the auto-encoder-based anomaly detection model is trained, a plurality of real-time data on facilities in the building are collected, and the plurality of real-time data are input as input variables of the auto-encoder-based anomaly detection model to score abnormalities It is possible to provide a computer program stored in a medium including a sequence of instructions for deriving an anomaly score and detecting whether the facility is abnormal based on the abnormal score.
상술한 과제 해결 수단은 단지 예시적인 것으로서, 본 발명을 제한하려는 의도로 해석되지 않아야 한다. 상술한 예시적인 실시예 외에도, 도면 및 발명의 상세한 설명에 기재된 추가적인 실시예가 존재할 수 있다.The above-described problem solving means are merely exemplary and should not be construed as limiting the present invention. In addition to the exemplary embodiments described above, there may be additional embodiments described in the drawings and detailed description of the invention.
전술한 본 발명의 과제 해결 수단 중 어느 하나에 의하면, 오토인코더(Autoencoder) 기반 이상 탐지 모델을 이용하여 고장 데이터 없이도 건물 내 설비에서 발생된 오류 및 오작동을 검출할 수 있도록 하는 건물 내 설비의 이상을 탐지하는 방법, 시스템 및 컴퓨터 프로그램을 제공할 수 있다. According to any one of the above-described problem solving means of the present invention, by using an autoencoder (Autoencoder) -based anomaly detection model, it is possible to detect an error in the facility in the building to detect errors and malfunctions in the facility in the building without failure data. It can provide methods, systems and computer programs to detect.
오토인코더 기반 이상 탐지 모델을 이용함으로써, 이상이 발견된 설비의 위치와 원인을 찾을 수 있도록 하는 건물 내 설비의 이상을 탐지하는 방법, 시스템 및 컴퓨터 프로그램을 제공할 수 있다. By using an auto-encoder-based anomaly detection model, it is possible to provide a method, system, and computer program for detecting anomalies in facilities in a building that can find the location and cause of the anomalies.
종래의 기계 학습 기반의 임계값을 이용한 모델은 각 건물, 시스템마다 임계값을 설정해야 하며, 각 건물 및 설비별로 특성이 달라 임계값의 설정에 어려움이 따랐으나, 건물과 설비 내의 변수들 간의 상호 작용을 스스로 학습하도록 하여 건물의 특성이 자동으로 반영된 개별적인 모델을 생성하는 건물 내 설비의 이상을 탐지하는 방법, 시스템 및 컴퓨터 프로그램을 제공할 수 있다.In a model using a threshold value based on machine learning, thresholds must be set for each building and system, and it is difficult to set thresholds due to different characteristics for each building and facility. It is possible to provide a method, a system, and a computer program for detecting an abnormality in a facility in a building that allows students to self-learn the action to generate an individual model in which the property of the building is automatically reflected.
도 1은 본 발명의 일 실시예에 따른 이상 탐지 시스템의 구성도이다.
도 2a 및 도 2b는 종래의 기계 학습 기반의 이상 탐지 모델과 본 발명의 일 실시예에 따른 오토인코더 기반의 이상 탐지 모델을 비교한 예시적인 도면이다.
도 3a 내지 도 3j는 본 발명의 일 실시예에 따른 단일 덕트의 공조 설비에서 이상을 탐지하는 과정을 설명하기 위한 예시적인 도면이다.
도 4a 내지 도 4n는 본 발명의 일 실시예에 따른 냉동기 냉수 순환 루프에서 이상을 탐지하는 과정을 설명하기 위한 예시적인 도면이다.
도 5는 본 발명의 일 실시예에 따른 이상 탐지 시스템에서 건물 내 설비의 이상을 탐지하는 방법의 순서도이다. 1 is a block diagram of an abnormality detection system according to an embodiment of the present invention.
2A and 2B are exemplary diagrams comparing a conventional machine learning-based anomaly detection model and an autoencoder-based anomaly detection model according to an embodiment of the present invention.
3A to 3J are exemplary views illustrating a process of detecting an abnormality in an air conditioning facility of a single duct according to an embodiment of the present invention.
4A to 4N are exemplary views illustrating a process of detecting an abnormality in a cold water circulation loop of a refrigerator according to an embodiment of the present invention.
5 is a flowchart of a method of detecting an abnormality in a facility in a building in the abnormality detection system according to an embodiment of the present invention.
아래에서는 첨부한 도면을 참조하여 본 발명이 속하는 기술 분야에서 통상의 지식을 가진 자가 용이하게 실시할 수 있도록 본 발명의 실시예를 상세히 설명한다. 그러나 본 발명은 여러 가지 상이한 형태로 구현될 수 있으며 여기에서 설명하는 실시예에 한정되지 않는다. 그리고 도면에서 본 발명을 명확하게 설명하기 위해서 설명과 관계없는 부분은 생략하였으며, 명세서 전체를 통하여 유사한 부분에 대해서는 유사한 도면 부호를 붙였다. Hereinafter, embodiments of the present invention will be described in detail with reference to the accompanying drawings so that those skilled in the art to which the present invention pertains can easily practice. However, the present invention can be implemented in many different forms and is not limited to the embodiments described herein. In addition, in order to clearly describe the present invention in the drawings, parts irrelevant to the description are omitted, and like reference numerals are assigned to similar parts throughout the specification.
명세서 전체에서, 어떤 부분이 다른 부분과 "연결"되어 있다고 할 때, 이는 "직접적으로 연결"되어 있는 경우뿐 아니라, 그 중간에 다른 소자를 사이에 두고 "전기적으로 연결"되어 있는 경우도 포함한다. 또한 어떤 부분이 어떤 구성요소를 "포함"한다고 할 때, 이는 특별히 반대되는 기재가 없는 한 다른 구성요소를 제외하는 것이 아니라 다른 구성요소를 더 포함할 수 있는 것을 의미하며, 하나 또는 그 이상의 다른 특징이나 숫자, 단계, 동작, 구성요소, 부분품 또는 이들을 조합한 것들의 존재 또는 부가 가능성을 미리 배제하지 않는 것으로 이해되어야 한다. Throughout the specification, when a part is "connected" to another part, this includes not only "directly connected" but also "electrically connected" with another element in between. . Also, when a part is said to “include” a certain component, it means that the component may further include other components, not to exclude other components, unless otherwise stated. However, it should be understood that the existence or addition possibilities of numbers, steps, actions, components, parts or combinations thereof are not excluded in advance.
본 명세서에 있어서 '부(部)'란, 하드웨어에 의해 실현되는 유닛(unit), 소프트웨어에 의해 실현되는 유닛, 양방을 이용하여 실현되는 유닛을 포함한다. 또한, 1 개의 유닛이 2 개 이상의 하드웨어를 이용하여 실현되어도 되고, 2 개 이상의 유닛이 1 개의 하드웨어에 의해 실현되어도 된다.In the present specification, the term “unit” includes a unit realized by hardware, a unit realized by software, and a unit realized by using both. Further, one unit may be realized by using two or more hardware, and two or more units may be realized by one hardware.
본 명세서에 있어서 단말 또는 디바이스가 수행하는 것으로 기술된 동작이나 기능 중 일부는 해당 단말 또는 디바이스와 연결된 서버에서 대신 수행될 수도 있다. 이와 마찬가지로, 서버가 수행하는 것으로 기술된 동작이나 기능 중 일부도 해당 서버와 연결된 단말 또는 디바이스에서 수행될 수도 있다.Some of the operations or functions described in this specification as being performed by a terminal or device may be performed instead on a server connected to the corresponding terminal or device. Similarly, some of the operations or functions described as being performed by the server may be performed in a terminal or device connected to the corresponding server.
이하 첨부된 도면을 참고하여 본 발명의 일 실시예를 상세히 설명하기로 한다. Hereinafter, an embodiment of the present invention will be described in detail with reference to the accompanying drawings.
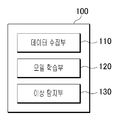
도 1은 본 발명의 일 실시예에 따른 이상 탐지 시스템의 구성도이다. 도 1을 참조하면, 데이터 수집부(110), 모델 학습부(120) 및 이상 탐지부(130)를 포함할 수 있다. 1 is a block diagram of an abnormality detection system according to an embodiment of the present invention. Referring to FIG. 1, a
데이터 수집부(110)는 건물 내의 설비에 관한 복수의 학습용 데이터를 수집할 수 있다. 예를 들어, 공조 설비의 경우, 데이터 수집부(110)는 실외온도, 실외상대습도, 냉수출구온도, 냉수출구유량, 냉수입구온도, 냉수입구온도-냉수출구온도, 리턴팬 토출구 온도, 리터팬 토출구 유량, 공급팬 토출구 온도, 공급팬 토출구 유량, 외기 댐퍼 토출구 온도 및 외기 댐퍼 토출구 유량 등의 학습용 데이터를 수집할 수 있다. 다른 예를 들어, 냉동기 순환 설비의 경우, 데이터 수집부(110)는 가스에너지, 냉수입구온도, 냉수출구온도, 냉수입구온도-출구온도 및 냉수유량 등의 학습용 데이터를 수집할 수 있다. The
모델 학습부(120)는 오토인코더(Autoencoder) 기반 이상 탐지 모델을 생성하고, 복수의 학습용 데이터에 기초하여 오토인코더 기반 이상 탐지 모델을 학습할 수 있다. 여기서, 오토인코더 기반 이상 탐지 모델은 입력 변수의 개수와 출력 변수의 개수가 동일한 것으로, 오토인코더 기반 이상 탐지 모델은 활성화 함수로서 쌍곡탄젠트(tanh) 함수, 시그모이드(sigmoid) 함수, ReLU(Rectified Linear Unit) 함수, Leaky ReLU 함수 중 어느 하나가 이용될 수 있다. 오토인코더 기반 이상 탐지 모델에 관해서는 도 2a 및 도 2b를 통해 상세히 설명하도록 한다. The
도 2a 및 도 2b는 본 발명의 일 실시예에 따른 일반적인 기계 학습 기반의 이상 탐지 모델과 오토인코더 기반의 이상 탐지 모델을 비교한 예시적인 도면이다. 2A and 2B are exemplary diagrams comparing a general machine learning-based anomaly detection model and an autoencoder-based anomaly detection model according to an embodiment of the present invention.
도 2a는 종래의 기계 학습 기반의 이상 탐지 모델을 도시한 도면이다. 도 2a를 참조하면, 종래의 기계 학습(비지도학습(unsupervised)) 기반의 이상 탐지 모델은 다양한 입력 변수(x, 200)가 입력(210)되면, 출력(220)을 통해 하나의 결과값 'y'(230)이 예측되도록 구성된다. 2A is a diagram illustrating a conventional machine learning-based anomaly detection model. Referring to FIG. 2A, in the conventional machine learning (unsupervised) based anomaly detection model, when various input variables (x, 200) are
종래의 기계 학습 기반의 이상 탐지 모델은 실제값과 예측값과의 차이를 계산하고, 차이가 임계값 이상인 경우 고장(오류)이 발생한 것으로 판단한다. 그러나 종래의 기계 학습 기반의 이상 탐지 모델은 임계값의 설정이 주관적이며, 임계값에 따라 고장인지 아닌지의 결과가 달라질 수 있다.The conventional machine learning-based anomaly detection model calculates a difference between an actual value and a predicted value, and determines that a failure (error) occurs when the difference is greater than or equal to a threshold value. However, in the conventional machine learning-based anomaly detection model, the setting of the threshold is subjective, and the result of whether or not it is a failure may vary according to the threshold.
또한, 출력(220)을 통해 하나의 결과값만이 도출되므로, 설비에서 고장이 발생된 경우, 어느 부분에서 이상이 발생한 것인지를 파악하기 어렵다는 단점이 있다. In addition, since only one result value is derived through the
도 2b는 본 발명의 일 실시예에 따른 오토인코더 기반의 이상 탐지 모델을 도시한 예시적인 도면이다. 2B is an exemplary diagram illustrating an autoencoder based anomaly detection model according to an embodiment of the present invention.
도 2b를 참조하면, 다양한 입력 변수(x, 240)가 입력(250)되면 인코더(260)를 통해 입력 데이터에 대한 특징(265)이 추출된다.Referring to FIG. 2B, when various input variables (x, 240) are
그리고, 디코더(270)를 통해 인코더(260)에 의해 추출된 특징(265)을 기준으로 뉴럿넷이 역으로 붙여진 원본 데이터를 생성하여 출력(280)을 통해 입력 변수(240)와 동일한 출력 변수(290)가 도출되도록 구성된다. Then, based on the
이러한, 오토인코더 기반의 이상 탐지 모델은 비지도 학습(unsupervised) 모델로 특징(265)을 기준으로 입력 변수(240)가 인코더(260)를 통해 특징(265)을 추출하는 과정과 특징(265)으로부터 디코더(270)를 통해 출력 변수(290)로 도출되는 과정이 데칼코마니되는 형상과 같이 구성된다. The auto-encoder-based anomaly detection model is an unsupervised model, and the process and feature 265 in which the
여기서, 입력 데이터는 0 또는 1의 입력 변수로 변환된다. 오토인코더 기반 이상 탐지 모델은 학습용 데이터의 80%가 이상 탐지 모델을 생성하는데 이용되고, 학습용 데이터의 20%가 이상 탐지 모델을 검증하는데 이용될 수 있다.Here, the input data is converted to an input variable of 0 or 1. The autoencoder-based anomaly detection model may be used for 80% of training data to generate anomaly detection models, and 20% of training data to be used to verify anomaly detection models.
오토인코더 기반의 이상 탐지 모델은 입력 변수(240)와 출력 변수(290)가 같은 모델로, 변수들 간의 상호 작용을 고려하여 자기 자신을 복구하는 모델이다. 오토인코더 기반의 이상 탐지 모델은 자기 자신을 복구함으로써, 각 변수의 이상 여부를 바로 판단하여 건물 내 설비의 고장 원인을 판단할 수 있다는 장점을 갖는다. The auto-encoder-based anomaly detection model is a model in which the
또한, 종래의 기계 학습 기반의 이상 탐지 모델과 같이 임계값 비교가 아닌 이상 점수를 계산하여 고장 확률을 계산하므로, 임계값에 민감하지 않는다는 장점을 갖는다. 또한, 변수들 간에 상호 작용을 스스로 학습하므로, 건물의 특성을 자동으로 반영할 수 있다는 장점을 갖는다. In addition, like the conventional machine learning-based anomaly detection model, the failure probability is calculated by calculating the abnormality score rather than the threshold value comparison, and thus it is not sensitive to the threshold value. In addition, since the interaction between variables is self-learning, it has the advantage of automatically reflecting the properties of a building.
이러한 오토인코더 기반의 이상 탐지 모델은 고장 데이터를 필요로 하지 않으며, 고장 데이터의 수집 여부와 상관 없이 이상 탐지 모델을 생성할 수 있다. 예를 들어, 오토인코더 기반의 이상 탐지 모델은 정상 데이터로 학습된 모델이므로, 비정상 데이터가 입력된 경우, 오토인코더 기반의 이상 탐지 모델은 자기 자신을 잘 복구할 수 없게 되어 고장의 원인을 판단할 수 있게 된다. 또한, 오토인코더 기반의 이상 탐지 모델은 고차원 데이터에서도 작동되어 센서 값이 많은 건물 데이터에 이용되기 적합한 모델이다. Such an autoencoder-based anomaly detection model does not require failure data, and can generate an anomaly detection model regardless of whether or not failure data is collected. For example, the auto-encoder-based anomaly detection model is a model trained with normal data. Therefore, when abnormal data is input, the auto-encoder-based anomaly detection model cannot recover itself well and determines the cause of the failure. It becomes possible. In addition, the auto-encoder-based anomaly detection model is also a model suitable for use in building data with high sensor values because it operates on high-dimensional data.
다시 도 1로 돌아와서, 모델 학습부(120)는 각 입력 변수와 이에 대응하는 출력 변수가 동일하도록 학습할 수 있다. Returning to FIG. 1 again, the
이상 탐지부(130)는 복수의 실시간 데이터를 오토인코더 기반 이상 탐지 모델의 입력 변수로 입력하여 이상 점수(Anomaly score)를 도출하고, 이상 점수에 기초하여 설비의 이상 여부를 탐지할 수 있다. 여기서, 복수의 실시간 데이터는 정상 데이터만을 포함할 수 있다. The

수학식 1을 참조하면, 이상 탐지부(130)는 각 입력 변수와 이에 대응하는 출력 변수의 차이에 기초하여 이상 점수를 도출할 수 있다. 이 때, 이상 점수는 각 입력 변수와 이에 대응하는 출력 변수의 RMS(Root Mean Square)값에 기초하여 도출된 것일 수 있다. Referring to
이상 탐지부(130)는 이상 점수의 추이를 모니터링하고, 이상 점수의 추이의 변화에 기초하여 설비의 이상 여부를 탐지할 수 있다. 예를 들어, 이상 탐지부(130)는 이상 점수의 시계열도를 기반으로 정상성 여부를 판단하고, 이상 점수의 추이 변화에 기초하여 이상 점수가 갑자기 증가한 경우, 설비에 이상이 탐지된 것으로 판단할 수 있다. 여기서, 이상 점수는 고장이 발생될 확률을 의미하므로, 이상 점수의 추이의 변화를 통해 고장이 발생된 확률(누적 확률 포함)을 파악할 수 있게 된다. The
또한, 이상 탐지부(130)는 이상 점수를 누적확률값으로 변환하여 누적 확률값이 계속 증가하는 경우, 건물 내 설비에 이상이 탐지된 것으로 판단할 수 있다. In addition, the
이러한 이상 탐지 시스템(100)은 건물 내 설비의 이상을 탐지하는 명령어들의 시퀀스를 포함하는 매체에 저장된 컴퓨터 프로그램에 의해 실행될 수 있다. 컴퓨터 프로그램은 컴퓨팅 장치에 의해 실행될 경우, 오토인코더(Autoencoder) 기반 이상 탐지 모델을 생성하고, 건물 내의 설비에 관한 복수의 학습용 데이터를 수집하고, 복수의 학습용 데이터에 기초하여 오토인코더 기반 이상 탐지 모델을 학습하고, 건물 내의 설비에 관한 복수의 실시간 데이터를 수집하고, 복수의 실시간 데이터를 오토인코더 기반 이상 탐지 모델의 입력 변수로 입력하여 이상 점수(Anomaly score)를 도출하고, 이상 점수에 기초하여 설비의 이상 여부를 탐지하도록 하는 명령어들의 시퀀스를 포함할 수 있다. The
도 3a 내지 도 3j는 본 발명의 일 실시예에 따른 단일 덕트의 공조 설비에서 이상을 탐지하는 과정을 설명하기 위한 예시적인 도면이다. 3A to 3J are exemplary views illustrating a process of detecting an abnormality in an air conditioning facility of a single duct according to an embodiment of the present invention.
도 3a는 본 발명의 일 실시예에 따른 단일 덕트의 공조 설비로부터 수집되는 학습용 데이터를 도시한 예시적인 도면이다. 도 3a를 참조하면, 이상 탐지 시스템(100)은 단일 덕트의 공조 설비에 설치된 복수의 센서로부터 10분 간격으로 실외온도(301), 실외상대습도(302), 냉수출구온도(303), 냉수출구유량(304), 냉수입구온도(305), 냉수입구온도-냉수출구온도(306), 리턴팬 토출구 온도(307), 리턴팬 토출구 유량(308), 공급팬 토출구 온도(309), 공급팬 토출구 유량(310), 외기 댐퍼 토출구 온도(311), 외기 댐퍼 토출구 유량(312) 등의 학습용 데이터를 수집할 수 있다. 3A is an exemplary diagram illustrating learning data collected from an air conditioning facility of a single duct according to an embodiment of the present invention. Referring to Figure 3a, the
도 3b는 본 발명의 일 실시예에 따른 학습 데이터에 기초하여 오토인코더 기반 이상 탐지 모델을 학습하는 과정을 설명하기 위한 예시적인 도면이다. 3B is an exemplary diagram for explaining a process of learning an autoencoder based anomaly detection model based on learning data according to an embodiment of the present invention.
도 3b를 참조하면, 이상 탐지 시스템(100)은 오토인코더 기반 이상 탐지 모델을 생성하여 학습용 데이터(347)를 오토인코더 기반 이상 탐지 모델에 입력 변수(340)로 입력(341)하고, 인코더(342)를 통해 특징(343)을 추출하고, 추출된 특징을 기준으로 디코더(344)를 통해 인코더(342)에 의해 추출된 특징(343)을 기준으로 뉴럿넷이 역으로 붙여진 원본 데이터를 생성하여 출력(345)을 통해 입력 변수(340)와 동일한 출력 변수(346)가 도출되도록 학습시킬 수 있다. Referring to FIG. 3B, the
도 3c 및 도 3d는 본 발명의 일 실시예에 따른 오토인코더 기반 이상 탐지 모델에 대한 적합성을 검증하는 과정을 설명하기 위한 예시적인 도면이다. 3C and 3D are exemplary diagrams for explaining a process of verifying suitability for an autoencoder based anomaly detection model according to an embodiment of the present invention.
도 3c를 참조하면, 이상 탐지 시스템(100)은 오토인코더 기반의 이상 탐지 모델을 통해 학습된 학습용 데이터에 기초하여 예측값과 실측값이 일치하는지를 확인하여 오토인코더 기반의 이상 탐지 모델에 대한 적합도를 검증할 수 있다. 여기서, x축은 실측값이고, y축은 예측값일 수 있다. Referring to FIG. 3C, the
도 3d를 참조하면, 이상 탐지 시스템(100)은 예측값과 실측값의 차이(잔차)가 평균이 '0'인 정규 분포인지를 확인하여 오토인코더 기반의 이상 탐지 모델에 대한 적합도를 검증할 수 있다. Referring to FIG. 3D, the
도 3e 및 도 3f는 본 발명의 일 실시예에 따른 학습용 데이터를 기준으로 실시간 데이터를 검증하는 과정을 설명하기 위한 예시적인 도면이다. 도 3e 및 도 3f를 참조하면, 도 3e의 실시간 데이터가 도 3f의 학습용 데이터와 달리 실측값과 예측값에 대한 차이가 큰 것을 알 수 있다. 여기서, 실측값과 예측값의 차이가 큰 부분은 비정상 구간일 확률이 높다. 3E and 3F are exemplary diagrams for explaining a process of verifying real-time data based on learning data according to an embodiment of the present invention. Referring to FIGS. 3E and 3F, it can be seen that the real-time data of FIG. 3E has a large difference between the measured value and the predicted value, unlike the learning data of FIG. 3F. Here, a portion having a large difference between the measured value and the predicted value is likely to be an abnormal section.
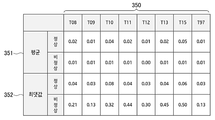
도 3g는 본 발명의 일 실시예에 따른 이상 점수를 도시한 예시적인 도면이다. 도 3g를 참조하면, 실시간 데이터(350)에 대한 이상 점수는 정상 및 비정상에 대한 평균값(351) 및 정상 및 비정상에 대한 최댓값(352)을 포함할 수 있다. 여기서, 이상 점수는 건물 내 설비에서 이상이 탐지되거나, 고장이 발생될 확률일 수 있으며, 이상 점수의 최댓값(352)이 정상값과 비정상값 간에 차이가 존재하는 것을 알 수 있다. 3G is an exemplary diagram illustrating an abnormal score according to an embodiment of the present invention. Referring to FIG. 3G, an abnormal score for the real-
도 3h는 본 발명의 일 실시예에 따른 이상 점수 그래프를 도시한 예시적인 도면이다. 도 3h를 참조하면, 실시간 데이터에 대한 이상 점수의 추이를 모니터링하여 그래프로 표시하고, 그래프를 통해 설비의 이상 여부를 탐지할 수 있다. 예를 들어, 그래프에서 이상 점수가 '0.1 이상'인 부분에 대해 주황색 점선으로 표시된 것을 확인할 수 있다. 이를 통해, 설비의 이상이 탐지된 시점 또는 고장이 발생된 시점과 고장이 발생된 위치를 파악할 수 있게 된다. 3H is an exemplary diagram illustrating an abnormal score graph according to an embodiment of the present invention. Referring to FIG. 3H, it is possible to monitor a trend of an abnormal score for real-time data and display it in a graph, and detect whether the facility is abnormal through the graph. For example, in the graph, it can be seen that the portion with an abnormal score of '0.1 or higher' is indicated by an orange dotted line. Through this, it is possible to grasp when the abnormality of the equipment is detected or when a failure occurs and where the failure occurs.
도 3i는 본 발명의 종래의 기계 학습 기반의 이상 탐지 모델과 일 실시예에 따른 오토인코더 기반 이상 탐지 모델을 이용한 경우의 설비의 이상 여부를 탐지하는 과정을 비교하기 위한 예시적인 도면이다. FIG. 3I is an exemplary diagram for comparing a process of detecting an abnormality in equipment when using the conventional machine learning-based anomaly detection model of the present invention and an autoencoder-based anomaly detection model according to an embodiment.
도 3i를 참조하면, 종래의 기계 학습 기반의 이상 탐지 모델의 임계값을 통해 설비의 이상 여부가 탐지된 부분은 별 모양으로 표시되고, 오토인코더 기반 이상 탐지 모델에서 설비의 이상 여부가 탐지된 부분은 주황색 선으로 표시될 수 있다. Referring to FIG. 3i, a part in which an abnormality of a facility is detected through a threshold value of a conventional machine learning-based anomaly detection model is displayed as a star, and an abnormality in a facility is detected in an autoencoder-based anomaly detection model. Can be marked with an orange line.
리턴팬 토출구 유량(308)의 그래프 중 특정 지점(360)에 대해 종래의 기계 학습 기반의 이상 탐지 모델 및 오토인코더 기반 이상 탐지 모델 모두 특정 지점(360)을 비정상이라고 판단할 수 있다. With respect to a
공급팬 토출구 온도(309)의 그래프 중 특정 지점(361)에 대해 종래의 기계 학습 기반의 이상 탐지 모델은 임계값을 비정상으로 판단하나, 오토인코더 기반 이상 탐지 모델은 해당 지점을 정상으로 판단할 수 있다. For a
외기 댐퍼 토출구 유량(312)의 그래프 중 특정 지점(362)에 대해 종래의 기계 학습 기반의 이상 탐지 모델은 임계값을 정상으로 판단하나, 오토인코더 기반 이상 탐지 모델은 해당 지점을 비정상으로 판단할 수 있다. For a
도 3j는 본 발명의 일 실시예에 따른 데이터의 시계열도의 패턴을 통해 건물 내 설비의 이상을 탐지하는 과정을 설명하기 위한 예시적인 도면이다. 도 3j를 참조하면, 냉수출구유량(304), 냉수입구온도(305), 냉수입구온도-냉수출구온도(306), 리턴팬 토출구 온도(307), 리턴팬 토출구 유량(308), 공급팬 토출구 온도(309), 공급팬 토출구 유량(310) 데이터의 시계열도를 확인하면, 거의 균일한 패턴을 나타내고 있는 것을 알 수 있다. 3J is an exemplary diagram for explaining a process of detecting an abnormality in a facility in a building through a pattern of a time series diagram of data according to an embodiment of the present invention. Referring to Figure 3j, cold water
그러나 외기 댐퍼 토출구 유량(312) 데이터의 시계열도의 경우, 패턴의 크기가 갑자기 줄어드는 구간(370)이 발생된 것을 알 수 있다. 이를 통해, 이상 탐지 시스템(100)은 외기 댐퍼 토출구 유량(312)과 관련된 설비에서 이상이 발생된 것을 파악할 수 있다. However, in the case of a time series diagram of the external damper discharge
도 4a 내지 도 4n은 본 발명의 일 실시예에 따른 냉동기 냉수 순환 루프에서 이상을 탐지하는 과정을 설명하기 위한 예시적인 도면이다. 4A to 4N are exemplary views illustrating a process of detecting an abnormality in a cold water circulation loop of a refrigerator according to an embodiment of the present invention.
도 4a는 본 발명의 일 실시예에 따른 냉동기 냉수 순환 루프에서 수집되는 데이터를 도시한 예시적인 도면이다. 도 4a를 참조하면, 이상 탐지 시스템(100)은 냉동기에 설치된 복수의 센서로부터 10분 간격으로 냉동기1(400), 냉동기2(401), 냉동기3(402) 각각에 대해 가스에너지(410), 냉수입구온도(411), 냉수출구온도(412) 및 냉수유량(413)의 데이터를 수집하고, 외기온도(403) 데이터를 수집할 수 있다. 4A is an exemplary diagram illustrating data collected in a cold water circulation loop of a refrigerator according to an embodiment of the present invention. Referring to Figure 4a, the
도 4b는 본 발명의 일 실시예에 따른 오토인코더 기반 이상 탐지 모델을 생성하는 과정을 설명하기 위한 예시적인 도면이다. 도 4b를 참조하면, 이상 탐지 시스템(100)은 오토인코더 기반 이상 탐지 모델을 생성하여 학습용 데이터(437)를 입력 변수(430)로 입력(431)하고, 인코더(432)를 통해 특징(433)을 추출하고, 추출된 특징(433)을 기준으로 디코더(434)를 통해 인코더(432)에 의해 추출된 특징(433)을 기준으로 뉴럿넷이 역으로 붙여진 원본 데이터를 생성하여 출력(435)을 통해 입력 변수(430)와 동일한 출력 변수(436)가 도출되도록 학습시킬 수 있다. 4B is an exemplary diagram for explaining a process of generating an autoencoder based anomaly detection model according to an embodiment of the present invention. Referring to FIG. 4B, the
도 4c 및 도 4d는 본 발명의 일 실시에에 따른 오토인코더 기반 이상 탐지 모델에 대한 적합성을 검증하는 과정을 설명하기 위한 예시적인 도면이다. 4C and 4D are exemplary diagrams for explaining a process of verifying suitability for an autoencoder based anomaly detection model according to an embodiment of the present invention.
도 4c를 참조하면, 이상 탐지 시스템(100)은 오토인코더 기반 이상 탐지 모델을 통해 학습된 학습용 데이터에 기초하여 예측값과 실측값이 일치하는지를 확인하여 오토인코더 기반 이상 탐지 모델에 대한 적합도를 검증할 수 있다. 여기서, x축은 실측값이고, y축은 예측값일 수 있다.Referring to FIG. 4C, the
도 4d를 참조하면, 이상 탐지 시스템(100)은 예측값과 실측값의 차이(잔차)가 평균이 '0'인 정규 분포인지를 확인하여 오토인코더 기반의 이상 탐지 모델에 대한 적합도를 검증할 수 있다.Referring to FIG. 4D, the
도 4e 및 도 4f는 본 발명의 일 실시예에 따른 학습용 데이터를 기준으로 실시간 데이터를 검증하는 과정을 설명하기 위한 예시적인 도면이다. 도 4e 및 도 4f를 참조하면, 도 4e의 실시간 데이터가 도 4f의 학습용 데이터와 달리 실측값과 예측값에 대한 차이가 큰 것을 알 수 있다. 여기서, 실측값과 예측값의 차이가 큰 부분은 비정상 구간일 확률이 높다.4E and 4F are exemplary diagrams for explaining a process of verifying real-time data based on learning data according to an embodiment of the present invention. Referring to FIGS. 4E and 4F, it can be seen that the real-time data of FIG. 4E has a large difference between the measured value and the predicted value, unlike the learning data of FIG. 4F. Here, a portion having a large difference between the measured value and the predicted value is likely to be an abnormal section.
도 4g는 본 발명의 일 실시예에 따른 이상 점수를 도시한 예시적인 도면이다. 도 4g를 참조하면, 실시간 데이터(440)에 대한 이상 점수는 정상 및 비정상에 대한 평균값(441) 및 정상 및 비정상에 대한 최댓값(442)을 포함할 수 있다. 여기서, 이상 점수는 건물 내 설비에서 이상이 탐지되거나, 고장이 발생될 확률일 수 있으며, 이상 점수의 최댓값이 정상값과 비정상값 간에 차이가 존재하는 것을 알 수 있다.4G is an exemplary diagram illustrating an abnormal score according to an embodiment of the present invention. Referring to FIG. 4G, the abnormal score for the real-
도 4h는 본 발명의 일 실시예에 따른 이상 점수 그래프를 도시한 예시적인 도면이다. 예를 들어, 이상 탐지 시스템(100)은 냉동기 1(400), 냉동기 2(401), 냉동기 3(402)의 각 실시간 데이터에 대한 이상 점수의 추이를 모니터링하여 그래프로 표시하고, 그래프를 통해 설비의 이상 여부를 탐지할 수 있다. 이상 탐지 시스템(100)은 이상 점수 그래프를 통해 고장 시점과 고장 위치를 파악할 수 있다. 4H is an exemplary diagram illustrating an abnormal score graph according to an embodiment of the present invention. For example, the
도 4i 및 도 4j는 본 발명의 일 실시예에 따른 냉동기 1(400)의 이상 점수 그래프 및 데이터의 시계열도의 패턴을 통해 설비의 이상 여부를 탐지하는 과정을 설명하기 위한 예시적인 도면이다. 4I and 4J are exemplary diagrams for explaining a process of detecting an abnormality of equipment through a pattern of an abnormality score graph of the
도 4i를 참조하면, 냉동기 1(400)의 이상 점수 그래프를 통해 냉수입구온도, 냉수출구온도, 냉수입구온도-출구온도, 냉수유량의 그래프에서 이상 점수가 '0.1 이상'(450)인 부분에 대해 주황색 점선으로 표시된 것을 확인할 수 있다. 이를 통해, 설비의 이상이 탐지된 시점 또는 고장이 발생된 시점과 고장이 발생된 위치도 파악할 수 있게 된다.Referring to FIG. 4i, in the graph of the cold water inlet temperature, the cold water outlet temperature, the cold water inlet temperature-outlet temperature, and the cold water flow rate through the abnormal score graph of the refrigerator 1 (400), the abnormal score is '0.1 or more' (450). You can see that it is marked with an orange dotted line. Through this, it is possible to grasp when the abnormality of the equipment is detected or when a failure occurs and where the failure occurs.
도 4j를 참조하면, 냉동기 1(400)의 데이터의 시계열도의 패턴을 통해 정상 데이터 및 비정상 데이터 간에 차이(451)가 존재하는 것을 확인할 수 있다. Referring to FIG. 4J, it can be confirmed that a
도 4k 및 도 4l은 본 발명의 일 실시예에 따른 냉동기 2(401)의 이상 점수 그래프 및 데이터의 시계열도의 패턴을 통해 설비의 이상 여부를 탐지하는 과정을 설명하기 위한 예시적인 도면이다. 4K and 4L are exemplary diagrams for explaining a process of detecting an abnormality of equipment through a pattern of an abnormality score graph of the
도 4k를 참조하면, 냉동기 2(401)의 이상 점수 그래프를 통해 냉수입구온도, 냉수출구온도, 냉수입구온도-출구온도, 냉수유량의 그래프에서 이상 점수가 '0.1 이상'(460)인 부분에 대해 주황색 점선으로 표시된 것을 확인할 수 있다. 이를 통해, 설비의 이상이 탐지된 시점 또는 고장이 발생된 시점과 고장이 발생된 위치도 파악할 수 있게 된다.Referring to FIG. 4K, in the graphs of the cold water inlet temperature, the cold water outlet temperature, the cold water inlet temperature-outlet temperature, and the cold water flow rate through the abnormal score graph of the refrigerator 2 (401), the abnormal score is '0.1 or more' (460). You can see that it is marked with an orange dotted line. Through this, it is possible to grasp when the abnormality of the equipment is detected or when a failure occurs and where the failure occurs.
도 4l을 참조하면, 냉동기 2(401)의 데이터의 시계열도의 패턴을 통해 정상 데이터 및 비정상 데이터 간에 차이(461)가 존재하는 것을 확인할 수 있다. Referring to FIG. 4L, it can be confirmed that a
도 4m 및 도 4n은 본 발명의 일 실시예에 따른 냉동기 3(402)의 이상 점수 그래프 및 데이터의 시계열도의 패턴을 통해 설비의 이상 여부를 탐지하는 과정을 설명하기 위한 예시적인 도면이다. 4M and 4N are exemplary diagrams for explaining a process of detecting whether a facility is abnormal through a pattern of an abnormal score graph of the
도 4m을 참조하면, 냉동기 3(402)의 이상 점수 그래프를 통해 냉수입구온도, 냉수출구온도, 냉수입구온도-출구온도, 냉수유량의 그래프에서 이상 점수가 '0.1 이상'(470)인 부분에 대해 주황색 점선으로 표시된 것을 확인할 수 있다. 이를 통해, 설비의 이상이 탐지된 시점 또는 고장이 발생된 시점과 고장이 발생된 위치도 파악할 수 있게 된다.Referring to FIG. 4M, in the graph of the abnormality score of the refrigerator 3 (402), in the graph of the cold water inlet temperature, the cold water outlet temperature, the cold water inlet temperature-outlet temperature, and the cold water flow rate, the abnormality score is '0.1 or more' (470). You can see that it is marked with an orange dotted line. Through this, it is possible to grasp when the abnormality of the equipment is detected or when a failure occurs and where the failure occurs.
도 4n을 참조하면, 냉동기 3(402)의 데이터의 시계열도의 패턴을 통해 정상 데이터 및 비정상 데이터 간에 차이(471)가 존재하는 것을 확인할 수 있다. Referring to FIG. 4N, it can be seen that a
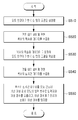
도 5는 본 발명의 일 실시예에 따른 이상 탐지 시스템에서 건물 내 설비의 이상을 탐지하는 방법의 순서도이다. 도 5에 도시된 이상 탐지 시스템(100)에서 건물 내 설비의 이상을 탐지하는 방법은 도 1 내지 도 4n에 도시된 실시예에 의해 시계열적으로 처리되는 단계들을 포함한다. 따라서, 이하 생략된 내용이라고 하더라도 도 1 내지 도 4n에 도시된 실시예에 따른 이상 탐지 시스템(100)에서 건물 내 설비의 이상을 탐지하는 방법에도 적용된다. 5 is a flowchart of a method of detecting an abnormality in a facility in a building in the abnormality detection system according to an embodiment of the present invention. The method of detecting an abnormality of a facility in a building in the
단계 S510에서 이상 탐지 시스템(100)은 오토인코더(Autoencoder) 기반 이상 탐지 모델을 생성할 수 있다. 오토인코더 기반 이상 탐지 모델은 입력 변수의 개수와 출력 변수의 개수가 동일한 것일 수 있으며, 활성화 함수로서 쌍곡탄젠트(tanh) 함수, 시그모이드(sigmoid) 함수, ReLU(Rectified Linear Unit) 함수, Leaky ReLU 함수 중 어느 하나를 이용할 수 있다. In step S510, the
단계 S520에서 이상 탐지 시스템(100)은 건물 내의 설비에 관한 복수의 학습용 데이터를 수집할 수 있다. In step S520, the
단계 S530에서 이상 탐지 시스템(100)은 복수의 학습용 데이터에 기초하여 오토인코더 기반 이상 탐지 모델을 학습할 수 있다. In step S530, the
단계 S540에서 이상 탐지 시스템(100)은 건물 내의 설비에 관한 복수의 실시간 데이터를 수집할 수 있다. 여기서, 복수의 실시간 데이터는 정상 데이터만을 포함하는 것일 수 있다. In step S540, the
단계 S550에서 이상 탐지 시스템(100)은 복수의 실시간 데이터를 오토인코더 기반 이상 탐지 모델의 입력 변수로 입력하여 이상 점수(Anomaly score)를 도출하고, 이상 점수에 기초하여 설비의 이상 여부를 탐지할 수 있다. 여기서, 이상 점수는 각 입력 변수와 이에 대응하는 출력 변수의 RMS(Root Mean Square)값에 기초하여 도출된 것일 수 있다. In step S550, the
도 5에서는 도시되지 않았으나, 이상 탐지 시스템(100)은 오토인코더 기반 이상 탐지 모델을 학습하는 단계에서, 각 입력 변수와 이에 대응하는 출력 변수가 동일하도록 학습하는 단계를 포함할 수 있다. Although not illustrated in FIG. 5, the
도 5에서는 도시되지 않았으나, 이상 탐지 시스템(100)은 이상 점수에 기초하여 설비의 이상 여부를 탐지하는 단계에서, 각 입력 변수와 이에 대응하는 출력 변수의 차이에 기초하여 상기 이상 점수를 도출하는 단계를 포함할 수 있다. Although not shown in FIG. 5, the
도 5에서는 도시되지 않았으나, 이상 탐지 시스템(100)은 이상 점수에 기초하여 설비의 이상 여부를 탐지하는 단계에서, 이상 점수의 추이를 모니터링하고, 이상 점수의 추이의 변화에 기초하여 설비의 이상 여부를 탐지하는 단계를 포함할 수 있다. 여기서, 이상 점수는 고장이 발생될 확률을 의미하므로, 이상 점수의 추이의 변화를 통해 고장이 발생된 확률(누적 확률 포함)을 파악할 수 있게 된다.Although not shown in FIG. 5, the
도 1 내지 도 5를 통해 설명된 이상 탐지 시스템에서 건물 내 설비의 이상을 탐지하는 방법은 컴퓨터에 의해 실행되는 매체에 저장된 컴퓨터 프로그램 또는 컴퓨터에 의해 실행 가능한 명령어를 포함하는 기록 매체의 형태로도 구현될 수 있다. 또한, 도 1 내지 도 5를 통해 설명된 이상 탐지 시스템에서 건물 내 설비의 이상을 탐지하는 방법은 컴퓨터에 의해 실행되는 매체에 저장된 컴퓨터 프로그램의 형태로도 구현될 수 있다. The method of detecting an abnormality of a facility in a building in the anomaly detection system described with reference to FIGS. 1 to 5 is also implemented in the form of a recording medium including a computer program or computer executable instructions stored in a medium executed by a computer Can be. In addition, the method of detecting an abnormality in a facility in a building in the abnormality detection system described with reference to FIGS. 1 to 5 may be implemented in the form of a computer program stored in a medium executed by a computer.
컴퓨터 판독 가능 매체는 컴퓨터에 의해 액세스될 수 있는 임의의 가용 매체일 수 있고, 휘발성 및 비휘발성 매체, 분리형 및 비분리형 매체를 모두 포함한다. 또한, 컴퓨터 판독가능 매체는 컴퓨터 저장 매체를 포함할 수 있다. 컴퓨터 저장 매체는 컴퓨터 판독가능 명령어, 데이터 구조, 프로그램 모듈 또는 기타 데이터와 같은 정보의 저장을 위한 임의의 방법 또는 기술로 구현된 휘발성 및 비휘발성, 분리형 및 비분리형 매체를 모두 포함한다. Computer readable media can be any available media that can be accessed by a computer and includes both volatile and nonvolatile media, removable and non-removable media. In addition, computer readable media may include computer storage media. Computer storage media includes both volatile and nonvolatile, removable and non-removable media implemented in any method or technology for storage of information such as computer readable instructions, data structures, program modules or other data.
전술한 본 발명의 설명은 예시를 위한 것이며, 본 발명이 속하는 기술분야의 통상의 지식을 가진 자는 본 발명의 기술적 사상이나 필수적인 특징을 변경하지 않고서 다른 구체적인 형태로 쉽게 변형이 가능하다는 것을 이해할 수 있을 것이다. 그러므로 이상에서 기술한 실시예들은 모든 면에서 예시적인 것이며 한정적이 아닌 것으로 이해해야만 한다. 예를 들어, 단일형으로 설명되어 있는 각 구성 요소는 분산되어 실시될 수도 있으며, 마찬가지로 분산된 것으로 설명되어 있는 구성 요소들도 결합된 형태로 실시될 수 있다. The above description of the present invention is for illustration only, and a person having ordinary knowledge in the technical field to which the present invention pertains can understand that it can be easily modified into other specific forms without changing the technical spirit or essential features of the present invention. will be. Therefore, it should be understood that the embodiments described above are illustrative in all respects and not restrictive. For example, each component described as a single type may be implemented in a distributed manner, and similarly, components described as distributed may be implemented in a combined form.
본 발명의 범위는 상기 상세한 설명보다는 후술하는 특허청구범위에 의하여 나타내어지며, 특허청구범위의 의미 및 범위 그리고 그 균등 개념으로부터 도출되는 모든 변경 또는 변형된 형태가 본 발명의 범위에 포함되는 것으로 해석되어야 한다.The scope of the present invention is indicated by the following claims rather than the above detailed description, and it should be interpreted that all changes or modified forms derived from the meaning and scope of the claims and equivalent concepts thereof are included in the scope of the present invention. do.
100: 이상 탐지 시스템
110: 데이터 수집부
120: 모델 학습부
130: 이상 탐지부100: anomaly detection system
110: data collection unit
120: model learning department
130: anomaly detection unit
Claims (17)
오토인코더(Autoencoder) 기반 이상 탐지 모델을 생성하는 단계;
상기 건물 내의 설비에 관한 복수의 학습용 데이터를 수집하는 단계;
상기 복수의 학습용 데이터에 기초하여 상기 오토인코더 기반 이상 탐지 모델을 학습하는 단계;
상기 건물 내의 설비에 관한 복수의 실시간 데이터를 수집하는 단계; 및
상기 복수의 실시간 데이터를 상기 오토인코더 기반 이상 탐지 모델의 입력 변수로 입력하여 이상 점수(Anomaly score)를 도출하고, 상기 이상 점수에 기초하여 상기 설비의 이상 여부를 탐지하는 단계
를 포함하는 것인, 이상 탐지 방법.
In the method of detecting anomalies of equipment in a building,
Generating an autoencoder based anomaly detection model;
Collecting a plurality of learning data about the facilities in the building;
Learning the autoencoder based anomaly detection model based on the plurality of learning data;
Collecting a plurality of real-time data about the facilities in the building; And
Deriving anomaly scores by inputting the plurality of real-time data as input variables of the autoencoder-based anomaly detection model, and detecting whether the equipment is abnormal based on the anomaly scores
An abnormality detection method comprising a.
상기 오토인코더 기반 이상 탐지 모델은 상기 입력 변수의 개수와 출력 변수의 개수가 동일한 것인, 이상 탐지 방법.
According to claim 1,
The auto-encoder-based anomaly detection model, the number of input variables and the number of output variables is the same, the anomaly detection method.
상기 오토인코더 기반 이상 탐지 모델은 활성화 함수로서 쌍곡탄젠트(tanh) 함수, 시그모이드(sigmoid) 함수, ReLU(Rectified Linear Unit) 함수, Leaky ReLU 함수 중 어느 하나를 이용하는 것인, 이상 탐지 방법.
According to claim 2,
The autoencoder-based anomaly detection model uses an hyperbolic tangent function, a sigmoid function, a rectified linear unit (ReLU) function, or a Leaky ReLU function as an activation function.
상기 오토인코더 기반 이상 탐지 모델을 학습하는 단계는
각 입력 변수와 이에 대응하는 출력 변수가 동일하도록 학습하는 단계
를 포함하는 것인, 이상 탐지 방법.
According to claim 1,
The step of learning the autoencoder based anomaly detection model is
Learning that each input variable and the corresponding output variable are the same
An abnormality detection method comprising a.
상기 복수의 실시간 데이터는 정상 데이터만을 포함하는 것인, 이상 탐지 방법.
According to claim 1,
The plurality of real-time data, the abnormality detection method that includes only normal data.
상기 이상 점수는 각 입력 변수와 이에 대응하는 출력 변수의 RMS(Root Mean Square)값에 기초하여 도출된 것인, 이상 탐지 방법.
According to claim 1,
The abnormality score is derived based on a value of each input variable and an output variable corresponding to the RMS (Root Mean Square).
상기 이상 점수에 기초하여 상기 설비의 이상 여부를 탐지하는 단계는
각 입력 변수와 이에 대응하는 출력 변수의 차이에 기초하여 상기 이상 점수를 도출하는 단계
를 포함하는 것인, 이상 탐지 방법.
According to claim 1,
The step of detecting whether the facility is abnormal based on the abnormality score is
Deriving the abnormal score based on the difference between each input variable and the corresponding output variable
An abnormality detection method comprising a.
상기 이상 점수에 기초하여 상기 설비의 이상 여부를 탐지하는 단계는
상기 이상 점수의 추이를 모니터링하고, 상기 이상 점수의 추이의 변화에 기초하여 상기 설비의 이상 여부를 탐지하는 단계
를 포함하는 것인, 이상 탐지 방법.
The method of claim 7,
The step of detecting whether the facility is abnormal based on the abnormality score is
Monitoring the trend of the abnormal score, and detecting whether the facility is abnormal based on a change in the trend of the abnormal score
An abnormality detection method comprising a.
상기 건물 내의 설비에 관한 복수의 학습용 데이터를 수집하는 데이터 수집부;
오토인코더(Autoencoder) 기반 이상 탐지 모델을 생성하고, 상기 복수의 학습용 데이터에 기초하여 상기 오토인코더 기반 이상 탐지 모델을 학습하는 모델 학습부; 및
복수의 실시간 데이터를 상기 오토인코더 기반 이상 탐지 모델의 입력 변수로 입력하여 이상 점수(Anomaly score)를 도출하고, 상기 이상 점수에 기초하여 상기 설비의 이상 여부를 탐지하는 이상 탐지부
를 포함하는 것인, 이상 탐지 시스템.
In the abnormality detection system for detecting an abnormality of the equipment in the building,
A data collection unit for collecting a plurality of learning data about the facilities in the building;
A model learning unit for generating an autoencoder based anomaly detection model and learning the autoencoder based anomaly detection model based on the plurality of training data; And
An abnormality detection unit that inputs a plurality of real-time data as input variables of the autoencoder-based anomaly detection model to derive an anomaly score, and detects an abnormality of the facility based on the abnormality score
An abnormality detection system that includes.
상기 오토인코더 기반 이상 탐지 모델은 상기 입력 변수의 개수와 출력 변수의 개수가 동일한 것인, 이상 탐지 시스템.
The method of claim 9,
The auto-encoder-based anomaly detection model, the number of input variables and the number of output variables is the same, the abnormality detection system.
상기 오토인코더 기반 이상 탐지 모델은 활성화 함수로서 쌍곡탄젠트(tanh) 함수, 시그모이드(sigmoid) 함수, ReLU(Rectified Linear Unit) 함수, Leaky ReLU 함수 중 어느 하나를 이용하는 것인, 이상 탐지 시스템.
The method of claim 10,
The autoencoder-based anomaly detection model is an anomaly detection system using any one of a hyperbolic tangent function, a sigmoid function, a rectified linear unit (ReLU) function, and a Leaky ReLU function as an activation function.
상기 모델 학습부는 각 입력 변수와 이에 대응하는 출력 변수가 동일하도록 학습하는 것인, 이상 탐지 시스템.
The method of claim 9,
The model learning unit is to learn that each input variable and the corresponding output variable are the same, an abnormality detection system.
상기 복수의 실시간 데이터는 정상 데이터만을 포함하는 것인, 이상 탐지 시스템.
The method of claim 9,
The plurality of real-time data is only an abnormality detection system that includes only normal data.
상기 이상 점수는 각 입력 변수와 이에 대응하는 출력 변수의 RMS(Root Mean Square)값에 기초하여 도출된 것인, 이상 탐지 시스템.
The method of claim 9,
The abnormality score is derived based on the RMS (Root Mean Square) value of each input variable and the corresponding output variable, an abnormality detection system.
상기 이상 탐지부는 각 입력 변수와 이에 대응하는 출력 변수의 차이에 기초하여 상기 이상 점수를 도출하는 것인, 이상 탐지 시스템.
The method of claim 9,
The abnormality detection unit derives the abnormality score based on a difference between each input variable and an output variable corresponding to the abnormality detection system.
상기 이상 탐지부는 상기 이상 점수의 추이를 모니터링하고, 상기 이상 점수의 추이의 변화에 기초하여 상기 설비의 이상 여부를 탐지하는 것인, 이상 탐지 시스템.
The method of claim 15,
The anomaly detection unit monitors the anomaly score trend, and detects an abnormality of the facility based on a change in the anomaly score trend.
상기 컴퓨터 프로그램은 컴퓨팅 장치에 의해 실행될 경우,
오토인코더(Autoencoder) 기반 이상 탐지 모델을 생성하고,
상기 건물 내의 설비에 관한 복수의 학습용 데이터를 수집하고,
상기 복수의 학습용 데이터에 기초하여 상기 오토인코더 기반 이상 탐지 모델을 학습하고,
상기 건물 내의 설비에 관한 복수의 실시간 데이터를 수집하고,
상기 복수의 실시간 데이터를 상기 오토인코더 기반 이상 탐지 모델의 입력 변수로 입력하여 이상 점수(Anomaly score)를 도출하고, 상기 이상 점수에 기초하여 상기 설비의 이상 여부를 탐지하도록 하는 명령어들의 시퀀스를 포함하는, 매체에 저장된 컴퓨터 프로그램.A computer program stored in a computer readable medium comprising a sequence of instructions for detecting an abnormality in a facility in a building, comprising:
When the computer program is executed by a computing device,
Create an autoencoder-based anomaly detection model,
Collecting a plurality of learning data about the facilities in the building,
Learning the auto-encoder-based anomaly detection model based on the plurality of learning data,
Collecting a plurality of real-time data about the facilities in the building,
And inputting the plurality of real-time data as an input variable of the auto-encoder-based anomaly detection model to derive an anomaly score, and a sequence of instructions to detect whether the facility is abnormal based on the anomaly score. , Computer programs stored on media.
Priority Applications (1)
| Application Number | Priority Date | Filing Date | Title |
|---|---|---|---|
| KR1020180120425A KR102285987B1 (en) | 2018-10-10 | 2018-10-10 | Method, system and computer program for detecting error of facilities in building |
Applications Claiming Priority (1)
| Application Number | Priority Date | Filing Date | Title |
|---|---|---|---|
| KR1020180120425A KR102285987B1 (en) | 2018-10-10 | 2018-10-10 | Method, system and computer program for detecting error of facilities in building |
Publications (2)
| Publication Number | Publication Date |
|---|---|
| KR20200040469A true KR20200040469A (en) | 2020-04-20 |
| KR102285987B1 KR102285987B1 (en) | 2021-08-04 |
Family
ID=70467373
Family Applications (1)
| Application Number | Title | Priority Date | Filing Date |
|---|---|---|---|
| KR1020180120425A KR102285987B1 (en) | 2018-10-10 | 2018-10-10 | Method, system and computer program for detecting error of facilities in building |
Country Status (1)
| Country | Link |
|---|---|
| KR (1) | KR102285987B1 (en) |
Cited By (7)
| Publication number | Priority date | Publication date | Assignee | Title |
|---|---|---|---|---|
| CN112488238A (en) * | 2020-12-14 | 2021-03-12 | 桂林电子科技大学 | Hybrid anomaly detection method based on countermeasure self-encoder |
| KR20220013811A (en) * | 2020-07-27 | 2022-02-04 | 가톨릭대학교 산학협력단 | Method and devices for detecting anomaly in a time series using rnn |
| KR20220090616A (en) | 2020-12-22 | 2022-06-30 | 숙명여자대학교산학협력단 | System for detecting abnormal sequence and method thereof |
| KR20220148411A (en) * | 2021-04-29 | 2022-11-07 | 한전케이디엔주식회사 | AMI failure management system and method |
| KR20230018228A (en) * | 2021-07-29 | 2023-02-07 | (주)커넥탈리스트 | System and method for detecting anormaly for renewable energy management system |
| KR20230067423A (en) * | 2021-11-09 | 2023-05-16 | 주식회사 스피랩 | METHOD FOR ABNORMALITY DETECTION OF IIoT FACILITY BASED ON DEEP LEARNING |
| WO2023090844A1 (en) * | 2021-11-17 | 2023-05-25 | 다임리서치 주식회사 | Method, apparatus, and system for detecting anomaly in logistics robot |
Citations (4)
| Publication number | Priority date | Publication date | Assignee | Title |
|---|---|---|---|---|
| KR101563511B1 (en) * | 2015-07-10 | 2015-10-27 | (주)유엠로직스 | Security incident anomalous event detection system and method using trend analytic technique of a support vector based on time series |
| JP2016085704A (en) * | 2014-10-29 | 2016-05-19 | 株式会社リコー | Information processing system, information processing device, information processing method, and program |
| JP2018049355A (en) * | 2016-09-20 | 2018-03-29 | 株式会社東芝 | Abnormality detector, learning device, abnormality detection method learning method, abnormality detection program and learning program |
| JP2018147172A (en) * | 2017-03-03 | 2018-09-20 | 日本電信電話株式会社 | Abnormality detection device, abnormality detection method and program |
-
2018
- 2018-10-10 KR KR1020180120425A patent/KR102285987B1/en active IP Right Grant
Patent Citations (4)
| Publication number | Priority date | Publication date | Assignee | Title |
|---|---|---|---|---|
| JP2016085704A (en) * | 2014-10-29 | 2016-05-19 | 株式会社リコー | Information processing system, information processing device, information processing method, and program |
| KR101563511B1 (en) * | 2015-07-10 | 2015-10-27 | (주)유엠로직스 | Security incident anomalous event detection system and method using trend analytic technique of a support vector based on time series |
| JP2018049355A (en) * | 2016-09-20 | 2018-03-29 | 株式会社東芝 | Abnormality detector, learning device, abnormality detection method learning method, abnormality detection program and learning program |
| JP2018147172A (en) * | 2017-03-03 | 2018-09-20 | 日本電信電話株式会社 | Abnormality detection device, abnormality detection method and program |
Cited By (7)
| Publication number | Priority date | Publication date | Assignee | Title |
|---|---|---|---|---|
| KR20220013811A (en) * | 2020-07-27 | 2022-02-04 | 가톨릭대학교 산학협력단 | Method and devices for detecting anomaly in a time series using rnn |
| CN112488238A (en) * | 2020-12-14 | 2021-03-12 | 桂林电子科技大学 | Hybrid anomaly detection method based on countermeasure self-encoder |
| KR20220090616A (en) | 2020-12-22 | 2022-06-30 | 숙명여자대학교산학협력단 | System for detecting abnormal sequence and method thereof |
| KR20220148411A (en) * | 2021-04-29 | 2022-11-07 | 한전케이디엔주식회사 | AMI failure management system and method |
| KR20230018228A (en) * | 2021-07-29 | 2023-02-07 | (주)커넥탈리스트 | System and method for detecting anormaly for renewable energy management system |
| KR20230067423A (en) * | 2021-11-09 | 2023-05-16 | 주식회사 스피랩 | METHOD FOR ABNORMALITY DETECTION OF IIoT FACILITY BASED ON DEEP LEARNING |
| WO2023090844A1 (en) * | 2021-11-17 | 2023-05-25 | 다임리서치 주식회사 | Method, apparatus, and system for detecting anomaly in logistics robot |
Also Published As
| Publication number | Publication date |
|---|---|
| KR102285987B1 (en) | 2021-08-04 |
Similar Documents
| Publication | Publication Date | Title |
|---|---|---|
| KR102285987B1 (en) | Method, system and computer program for detecting error of facilities in building | |
| O’Neill et al. | Model-based real-time whole building energy performance monitoring and diagnostics | |
| Li et al. | A data-driven strategy for detection and diagnosis of building chiller faults using linear discriminant analysis | |
| Rogers et al. | A review of fault detection and diagnosis methods for residential air conditioning systems | |
| Du et al. | Fault detection and diagnosis for buildings and HVAC systems using combined neural networks and subtractive clustering analysis | |
| Wang et al. | An online fault diagnosis tool of VAV terminals for building management and control systems | |
| Wang et al. | A robust fault detection and diagnosis strategy for multiple faults of VAV air handling units | |
| US9690265B2 (en) | Mobile device with automatic acquisition and analysis of building automation system | |
| US10331510B2 (en) | Simulation based fault diagnosis using extended heat flow models | |
| O’Neill et al. | Real time model-based energy diagnostics in buildings | |
| US10047757B2 (en) | Predicting a surge event in a compressor of a turbomachine | |
| Deshmukh et al. | Case study results: Fault detection in air-handling units in buildings | |
| Du et al. | A robot fault diagnostic tool for flow rate sensors in air dampers and VAV terminals | |
| Zhao et al. | A proactive fault detection and diagnosis method for variable-air-volume terminals in building air conditioning systems | |
| US20200351171A1 (en) | Machine-learning based optimization of data centers using supplemental indicators | |
| Alexandersen et al. | A stair-step probabilistic approach for automatic anomaly detection in building ventilation system operation | |
| Albayati et al. | Semi-supervised machine learning for fault detection and diagnosis of a rooftop unit | |
| Luo et al. | Novel pattern recognition-enhanced sensor fault detection and diagnosis for chiller plant | |
| Han et al. | Fault detection and diagnosis of HVAC systems | |
| JP2005301582A (en) | Process management device | |
| JP2021089116A (en) | Information processing device, information processing method, program and generation method for learned model | |
| Najafi et al. | A statistical pattern analysis framework for rooftop unit diagnostics | |
| Barwig et al. | The national building controls information program | |
| Ghimire et al. | Fault diagnosis and augmented reality-based troubleshooting of HVAC systems | |
| JP2004234302A (en) | Process management device |
Legal Events
| Date | Code | Title | Description |
|---|---|---|---|
| A201 | Request for examination | ||
| E902 | Notification of reason for refusal | ||
| AMND | Amendment | ||
| E601 | Decision to refuse application | ||
| X091 | Application refused [patent] | ||
| AMND | Amendment | ||
| X701 | Decision to grant (after re-examination) | ||
| GRNT | Written decision to grant |