KR20140031201A - System for detection of non-uniformities in web-based materials - Google Patents
System for detection of non-uniformities in web-based materials Download PDFInfo
- Publication number
- KR20140031201A KR20140031201A KR1020137024934A KR20137024934A KR20140031201A KR 20140031201 A KR20140031201 A KR 20140031201A KR 1020137024934 A KR1020137024934 A KR 1020137024934A KR 20137024934 A KR20137024934 A KR 20137024934A KR 20140031201 A KR20140031201 A KR 20140031201A
- Authority
- KR
- South Korea
- Prior art keywords
- image
- features
- training
- inspection system
- images
- Prior art date
Links
Images


Classifications
-
- G—PHYSICS
- G06—COMPUTING; CALCULATING OR COUNTING
- G06T—IMAGE DATA PROCESSING OR GENERATION, IN GENERAL
- G06T7/00—Image analysis
- G06T7/0002—Inspection of images, e.g. flaw detection
- G06T7/0004—Industrial image inspection
-
- B—PERFORMING OPERATIONS; TRANSPORTING
- B65—CONVEYING; PACKING; STORING; HANDLING THIN OR FILAMENTARY MATERIAL
- B65H—HANDLING THIN OR FILAMENTARY MATERIAL, e.g. SHEETS, WEBS, CABLES
- B65H43/00—Use of control, checking, or safety devices, e.g. automatic devices comprising an element for sensing a variable
-
- G—PHYSICS
- G06—COMPUTING; CALCULATING OR COUNTING
- G06F—ELECTRIC DIGITAL DATA PROCESSING
- G06F18/00—Pattern recognition
- G06F18/20—Analysing
- G06F18/23—Clustering techniques
-
- G—PHYSICS
- G06—COMPUTING; CALCULATING OR COUNTING
- G06F—ELECTRIC DIGITAL DATA PROCESSING
- G06F18/00—Pattern recognition
- G06F18/40—Software arrangements specially adapted for pattern recognition, e.g. user interfaces or toolboxes therefor
-
- G—PHYSICS
- G06—COMPUTING; CALCULATING OR COUNTING
- G06Q—INFORMATION AND COMMUNICATION TECHNOLOGY [ICT] SPECIALLY ADAPTED FOR ADMINISTRATIVE, COMMERCIAL, FINANCIAL, MANAGERIAL OR SUPERVISORY PURPOSES; SYSTEMS OR METHODS SPECIALLY ADAPTED FOR ADMINISTRATIVE, COMMERCIAL, FINANCIAL, MANAGERIAL OR SUPERVISORY PURPOSES, NOT OTHERWISE PROVIDED FOR
- G06Q10/00—Administration; Management
- G06Q10/06—Resources, workflows, human or project management; Enterprise or organisation planning; Enterprise or organisation modelling
-
- G—PHYSICS
- G06—COMPUTING; CALCULATING OR COUNTING
- G06V—IMAGE OR VIDEO RECOGNITION OR UNDERSTANDING
- G06V10/00—Arrangements for image or video recognition or understanding
- G06V10/70—Arrangements for image or video recognition or understanding using pattern recognition or machine learning
- G06V10/762—Arrangements for image or video recognition or understanding using pattern recognition or machine learning using clustering, e.g. of similar faces in social networks
-
- G—PHYSICS
- G06—COMPUTING; CALCULATING OR COUNTING
- G06V—IMAGE OR VIDEO RECOGNITION OR UNDERSTANDING
- G06V10/00—Arrangements for image or video recognition or understanding
- G06V10/94—Hardware or software architectures specially adapted for image or video understanding
- G06V10/945—User interactive design; Environments; Toolboxes
-
- G—PHYSICS
- G01—MEASURING; TESTING
- G01N—INVESTIGATING OR ANALYSING MATERIALS BY DETERMINING THEIR CHEMICAL OR PHYSICAL PROPERTIES
- G01N21/00—Investigating or analysing materials by the use of optical means, i.e. using sub-millimetre waves, infrared, visible or ultraviolet light
- G01N21/84—Systems specially adapted for particular applications
- G01N21/88—Investigating the presence of flaws or contamination
- G01N21/89—Investigating the presence of flaws or contamination in moving material, e.g. running paper or textiles
-
- G—PHYSICS
- G06—COMPUTING; CALCULATING OR COUNTING
- G06T—IMAGE DATA PROCESSING OR GENERATION, IN GENERAL
- G06T2207/00—Indexing scheme for image analysis or image enhancement
- G06T2207/20—Special algorithmic details
- G06T2207/20081—Training; Learning
-
- G—PHYSICS
- G06—COMPUTING; CALCULATING OR COUNTING
- G06T—IMAGE DATA PROCESSING OR GENERATION, IN GENERAL
- G06T2207/00—Indexing scheme for image analysis or image enhancement
- G06T2207/30—Subject of image; Context of image processing
- G06T2207/30108—Industrial image inspection
- G06T2207/30124—Fabrics; Textile; Paper
-
- G—PHYSICS
- G06—COMPUTING; CALCULATING OR COUNTING
- G06V—IMAGE OR VIDEO RECOGNITION OR UNDERSTANDING
- G06V2201/00—Indexing scheme relating to image or video recognition or understanding
- G06V2201/06—Recognition of objects for industrial automation
Landscapes
- Engineering & Computer Science (AREA)
- Theoretical Computer Science (AREA)
- Physics & Mathematics (AREA)
- General Physics & Mathematics (AREA)
- Computer Vision & Pattern Recognition (AREA)
- Data Mining & Analysis (AREA)
- Business, Economics & Management (AREA)
- Artificial Intelligence (AREA)
- Evolutionary Computation (AREA)
- Quality & Reliability (AREA)
- Human Resources & Organizations (AREA)
- Strategic Management (AREA)
- Entrepreneurship & Innovation (AREA)
- Economics (AREA)
- Multimedia (AREA)
- Life Sciences & Earth Sciences (AREA)
- Software Systems (AREA)
- General Health & Medical Sciences (AREA)
- Health & Medical Sciences (AREA)
- Bioinformatics & Cheminformatics (AREA)
- Bioinformatics & Computational Biology (AREA)
- Evolutionary Biology (AREA)
- General Engineering & Computer Science (AREA)
- Game Theory and Decision Science (AREA)
- General Business, Economics & Management (AREA)
- Tourism & Hospitality (AREA)
- Operations Research (AREA)
- Marketing (AREA)
- Educational Administration (AREA)
- Development Economics (AREA)
- Medical Informatics (AREA)
- Computing Systems (AREA)
- Databases & Information Systems (AREA)
- Pathology (AREA)
- Human Computer Interaction (AREA)
- Chemical & Material Sciences (AREA)
- Textile Engineering (AREA)
- Immunology (AREA)
- Biochemistry (AREA)
- Analytical Chemistry (AREA)
Abstract
불균일성 패턴들의 존재를 검출하고, 각각의 유형의 불균일성 패턴의 심각도를 지시하는 출력을 제공하기 위한 시스템이 기술된다. 시스템은 주어진 제품의 샘플들을 나타내는 다량의 트레이닝 이미지들에게 전문 등급(즉, 라벨)들을 효율적이고 일관성 있게 할당함에 있어서 사용자를 지원하는 전산화 등급화 도구를 포함한다. 게다가, 등급화 소프트웨어는, 전산화 검사 시스템이 제조된 웨브 재료에서 불균일성 패턴들의 존재를 실시간으로 검출하게 하고, 각각의 패턴의 심각도 수준을 나타내는 출력을 연속적인 척도로 제공하게 하는 모델을 개발한다. 시스템은 또한 검사 시스템의 처리량을 현저히 증가시키는 알고리즘 및 하드웨어 접근법들을 포함한다.A system for detecting the presence of non-uniform patterns and providing an output indicative of the severity of each type of non-uniformity pattern is described. The system includes a computerized grading tool that assists the user in efficiently and consistently assigning professional grades (ie, labels) to large amounts of training images representing samples of a given product. In addition, the grading software develops a model that allows the computerized inspection system to detect in real time the presence of non-uniform patterns in the manufactured web material and provide a continuous measure of output indicative of the severity level of each pattern. The system also includes algorithmic and hardware approaches that significantly increase the throughput of the inspection system.
Description
관련 출원에 대한 상호 참조Cross-reference to related application
본 출원은 2011년 2월 24일자로 출원된 미국 가특허 출원 제61/446,404호의 이익을 주장하며, 이 출원의 개시 내용은 전체적으로 본 명세서에 참고로 포함된다.This application claims the benefit of US Provisional Patent Application 61 / 446,404, filed February 24, 2011, the disclosure of which is incorporated herein by reference in its entirety.
본 발명은 이동하는 웨브(web)의 검사를 위한 전산화 시스템과 같은 자동화 검사 시스템에 관한 것이다.
The present invention relates to automated inspection systems, such as computerized systems for the inspection of moving webs.
이동하는 웨브 재료의 분석을 위한 전산화 검사 시스템은 현대의 제조 작업에 중요한 것으로 판명되었다. 제조 라인의 목적은 완벽하게 균일하고 가변성이 배제된 재료를 제조하는 것이다. 그러나, 웨브-기반의 재료를 제조할 때 불균일성은 통상적인 문제점이다. 이는 많은 공정 변수 또는 제형화 오차에 의해 유발될 수 있다. 결과적으로, 광학적 검사 센서(예를 들어, 카메라)에 의해 포착된 디지털 이미지를 기반으로 제조된 제품의 품질을 자동으로 분류할 수 있는 이미지화-기반 검사 시스템을 활용하는 것이 점점 보편화되고 있다. 일부 검사 시스템은 흔히 "분류기"라고 지칭되는 알고리즘을 적용하며, 이는 각각의 포착된 디지털 이미지(즉, "샘플")에 등급의 할당을 시도하여, 가장 단순한 경우에 샘플 또는 그의 일부가 합격인지 불합격인지를 지시한다.Computerized inspection systems for the analysis of moving web materials have proven to be important for modern manufacturing operations. The purpose of the production line is to produce materials that are perfectly uniform and exclude variability. However, nonuniformity is a common problem when producing web-based materials. This can be caused by many process variables or formulation errors. As a result, it is becoming increasingly common to utilize imaging-based inspection systems that can automatically classify the quality of products manufactured based on digital images captured by optical inspection sensors (eg cameras). Some inspection systems apply an algorithm, commonly referred to as a "classifier," which attempts to assign a rating to each captured digital image (i.e., "sample"), failing in the simplest case whether the sample or part thereof is a pass. Instructs recognition.
이들 검사 시스템은 흔히, 각각의 결함이 제조된 재료의 단일 영역에 국한된 "점" 결함의 식별을 시도한다. 그러나, "불균일성" 결함 또는 "패턴"으로 지칭되는 다른 유형의 결함이 존재할 수 있으며, 여기에서는 웨브 재료가 넓은 영역에 걸쳐 불균일한 가변성을 나타낸다. 이러한 불균일성의 예는 얼룩(mottle), 채터(chatter), 밴딩(banding), 및 줄무늬(streak)를 포함한다. 이들과 같은 불균일성-유형의 결함은 정의상 분포되며 비-국한적이다. 결과적으로, 이러한 결함은 국한된 점 결함에 비해 전산화 검사 시스템이 검출하고 정량화하기가 더 어려울 수 있다.These inspection systems often attempt to identify "point" defects where each defect is localized to a single area of material from which it is made. However, there may be other types of defects, referred to as "non-uniformity" defects or "patterns," where the web material exhibits non-uniform variability over a wide area. Examples of such nonuniformities include mottles, chatters, bandings, and streaks. Non-uniformity-type defects such as these are by definition distributed and non-local. As a result, such defects may be more difficult for a computerized inspection system to detect and quantify than localized point defects.
제조된 재료에서 불균일성 결함의 검출을 시도하는 경우, 검사 시스템은 전형적으로 샘플 이미지를 수집 및 처리하여 특정 불균일성을 지시하는 특징부를 추출한다. 이들 특징부를 기반으로, 검사 시스템은 하나 이상의 분류기를 적용하여 불균일성의 심각도의 평가를 생성시킨다. 특징부 추출은 계산 집약적일 수 있으며, 검사 공정의 제한 인자일 수 있다. 예를 들어, 이 단계에서는, 필터링, 형태학적, 시간적, 스펙트럼, 또는 통계적 처리를 포함할 수 있는 루틴(routine)을 통해, 수백만 화소를 포함하는 고해상도 이미지를 아마도 50개 이하의 대표적 수(또는 특징부)로 감소시킨다. 이어서, 얻어진 수는 기본 제품(underlying product)의 품질을 평가하기 위한 기반을 형성한다. 수백만개의 화소값을 수십개의 정보성 수로 축약하기 위해 필요한 시간의 양은 상당할 수 있으므로, 이와 같이, 현대 컴퓨터 상에서도 빠른 제조 속도에 대해 실시간으로 수행될 수 없다. 하나의 가능성은 더 고품질인 더 고가의 컴퓨터를 구입하는 것일 수 있으나, 이 해결책은 검사 시스템의 비용을 엄청나게 고가로 만들고 데이터 분배 및 결과 종합의 부가적 시행 문제점을 일으킬 수 있다.
When attempting to detect non-uniform defects in the manufactured material, inspection systems typically collect and process sample images to extract features that indicate specific non-uniformities. Based on these features, the inspection system applies one or more classifiers to generate an assessment of the severity of the nonuniformity. Feature extraction can be computationally intensive and can be a limiting factor in the inspection process. For example, at this stage, a routine may include filtering, morphological, temporal, spectral, or statistical processing, possibly representing 50 or less representative numbers (or features) of high resolution images containing millions of pixels. Decrease). The numbers obtained then form the basis for evaluating the quality of the underlying product. As such, the amount of time needed to abbreviate millions of pixel values to dozens of informative numbers can be significant and thus cannot be performed in real time for fast manufacturing speeds even on modern computers. One possibility could be to purchase a higher quality, more expensive computer, but this solution would make the cost of the inspection system incredibly expensive and cause additional implementation problems of data distribution and result synthesis.
일반적으로, 본 개시 내용은 제조된 재료에서 불균일성들을 다루는 전체 전산화 시스템을 기술한다. 예를 들어, 시스템은 주어진 제품의 샘플을 대표하는 다량의 디지털 이미지들에 전문 등급(즉, 라벨)을 효율적이고 일관성 있게 할당함에 있어서 사용자를 지원할 수 있는 전산화 등급화 도구를 포함한다. 게다가, 등급화 소프트웨어는, 전산화 검사 시스템이 제조된 웨브 재료에서 불균일성 결함들의 존재를 실시간으로 검출하게 하고, 각각의 결함의 심각도 수준을 나타내는 출력을 연속적인 척도로 제공하게 하는 모델을 개발할 수 있다. 즉, 전산화 검사 시스템은, 불균일성 결함들, 즉 패턴들의 존재를 검출하기 위해 그리고 각각의 결함의 심각도를 나타내는 출력을 제공하기 위해 실시간으로 적용될 트레이닝 데이터로서 전문 등급들을 이용한다. 본 기술은 불균일성 심각도의 연속 차트화를 제공하는 실시간 출력을 제공할 수 있다. 다시 말하면, "합격" 또는 "불합격", 또는 "1", "3", 또는 "5"와 같은 이산 등급 라벨로 제한되는 것이 아니라, 전산화 검사 시스템은 더욱 연속적인 샘플의 순위를 제공할 수 있다. 게다가, 웨브-제조 재료 내의 특정 패턴을 검출 및 분류하도록 설계된 검사 시스템의 처리량을 증가시키는 기술이 기술된다. 대부분 균일할 것으로 예상되는 주어진 분량의 재료를 검사하기 위해 필요한 평균 시간량을 현저하게 감소시키기 위한 알고리즘 및 하드웨어 접근방법이 기술된다. 본 명세서에 기술된 알고리즘 기술은, 기초 특징부 세트로 시작하여 단지 부가적 특징부 계산을 필요에 따라 트리거링함으로써 어느 이미지 특징부를 계산할 것인지의 동적(즉, 온라인) 결정을 포함한다. 몇몇 실시예에서, 많은 이미지 처리 루틴들에 대해 최적화될 수 있는 그래픽 처리 유닛(graphics processing unit, GPU)들에서 계산이 수행된다. 따라서, 본 기술은 상당한 생산성 이득을 유발할 수 있다.In general, the present disclosure describes an entire computerized system that addresses nonuniformities in the material produced. For example, the system includes a computerized grading tool that can assist the user in efficiently and consistently assigning a professional grade (ie, label) to large quantities of digital images representing a sample of a given product. In addition, the grading software can develop a model that allows the computerized inspection system to detect in real time the presence of non-uniform defects in the manufactured web material and provide a continuous measure of output indicative of the severity level of each defect. That is, the computerized inspection system uses professional grades as training data to be applied in real time to detect the presence of non-uniform defects, ie patterns, and to provide an output indicative of the severity of each defect. The technique can provide real-time output that provides continuous charting of non-uniformity severity. In other words, without being limited to discrete grade labels such as "pass" or "fail", or "1", "3", or "5", the computerized test system can provide a more continuous ranking of samples. . In addition, techniques for increasing the throughput of inspection systems designed to detect and classify specific patterns in web-fabric materials are described. Algorithms and hardware approaches are described to significantly reduce the average amount of time needed to inspect a given amount of material that is most likely to be uniform. The algorithmic techniques described herein include dynamic (ie, online) determination of which image features to compute by starting with a set of basic features and only triggering additional feature calculations as needed. In some embodiments, the calculations are performed in graphics processing units (GPUs) that can be optimized for many image processing routines. Thus, the present technology can result in significant productivity gains.
일 실시예에서, 복수의 트레이닝 이미지들의 각각에 불균일 결함에 대한 이산 등급 라벨을 자동으로 할당하고, 트레이닝 샘플들에게 할당된 등급 라벨들을 기반으로 분류 모델을 계산하는 등급화 소프트웨어를 컴퓨터 상에서 실행하는 단계를 포함한다. 등급화 소프트웨어는 트레이닝 이미지들의 서브세트(subset)만에 대한 입력을 사용자로부터 수신하고, 입력을 기반으로 모든 나머지 트레이닝 이미지들에 대한 등급 라벨들을 계산한다. 방법은 전산화 검사 시스템 내에 통합된 파이프라인형(pipelined) 그래픽 처리 유닛(GPU)의 하드웨어 구성요소들을 사용하여, 제조된 웨브 재료로부터 포착된 샘플 이미지를 실시간으로 처리하여 이미지로부터 제1 복수의 특징부들을 병렬로 추출하는 단계; 및 분류 모델에 따라 제1 복수의 특징부들로부터 전산화 검사 시스템을 사용하여 웨브 재료의 샘플 이미지에 대한 불균일성 결함의 심각도 수준을 계산하는 단계를 추가로 포함한다.In one embodiment, the step of executing grading software on a computer that automatically assigns discrete grade labels for non-uniform defects to each of the plurality of training images and calculates a classification model based on the grade labels assigned to the training samples. It includes. The grading software receives an input from the user for only a subset of the training images and calculates rating labels for all remaining training images based on the input. The method utilizes hardware components of a pipelined graphics processing unit (GPU) integrated within a computerized inspection system to process in real time a sample image captured from the manufactured web material to obtain a first plurality of features from the image. Extracting them in parallel; And calculating the severity level of the non-uniformity defect for the sample image of the web material using a computerized inspection system from the first plurality of features in accordance with the classification model.
다른 실시예에서, 웨브 재료가 제조될 때 웨브 재료를 실시간으로 검사하여, 불균일성 결함의 심각도를 계산하기 위한 온라인 전산화 검사 시스템이 기술된다. 검사 시스템은 이미지로부터 어느 특징부를 추출할 것인지를 실시간으로 선택하기 위한 동적 트리거(dynamic trigger)들의 체인(chain)을 정의하는 의사 결정 모델을 저장하기 위한 메모리; 및 현재 제조되고 있는 제조된 웨브 재료로부터 포착된 샘플 이미지를 처리하여 제1 특징부 세트를 추출하는 소프트웨어를 실행하는 컴퓨터를 포함한다. 소프트웨어는 의사 결정 모델을 적용하여 샘플 이미지로부터 추출할 부가적 특징부 세트들의 선택을 동적으로 트리거링하며, 추출된 특징부들이 웨브 재료에 대한 불균일성 결함의 심각도 수준을 정의된 신뢰 수준 내에서 계산하기에 충분할 때까지 부가적인 특징부 세트들을 추출하도록 검사 시스템의 파이프라인형 그래픽 처리 유닛(GPU)의 하드웨어 구성요소들을 호출한다. 동적 트리거링 및 계산들은 신규 재료가 검사 시스템에 제공될 때 필요한 대로 반복된다.In another embodiment, an online computerized inspection system is described for inspecting a web material in real time as the web material is manufactured to calculate the severity of non-uniform defects. The inspection system includes a memory for storing a decision model that defines a chain of dynamic triggers for selecting in real time which features to extract from the image; And a computer that executes software to process the sample image captured from the manufactured web material currently being manufactured to extract the first set of features. The software applies a decision model to dynamically trigger the selection of additional feature sets to extract from the sample image, which allows the extracted features to calculate the severity level of non-uniformity defects for the web material within a defined confidence level. Call the hardware components of the pipelined graphics processing unit (GPU) of the inspection system to extract additional feature sets until sufficient. Dynamic triggering and calculations are repeated as needed when new material is provided to the inspection system.
다른 실시예에서, 웨브 재료를 실시간으로 검사하기 위한 온라인 전산화 검사 시스템이 기술된다. 검사 시스템은 다차원 특징부 공간 내의 복수의 지점들로서 트레이닝 이미지들의 연속 순위를 나타내는 모델을 저장하는 메모리를 포함하는데, 다차원 공간 내의 지점들의 각각은 트레이닝 이미지들 중 상이한 트레이닝 이미지에 대한 특징부 벡터에 대응한다. 검사 시스템은 검사 시스템의 파이프라인형 그래픽 처리 유닛(GPU)를 추가로 포함하며, 이 GPU는 GPU의 병렬 하드웨어 구성요소들을 사용하여 샘플 이미지로부터 복수의 특징부들을 병렬로 추출하도록, 제조된 웨브 재료로부터 포착된 샘플 이미지를 처리한다. 전산화 검사 시스템은 트레이닝 이미지들의 모델을 기반으로 웨브 재료의 샘플 이미지에 대한 추출된 특징부들로부터의 불균일 결함의 심각도 수준을 연속적인 척도로 계산한다.In another embodiment, an online computerized inspection system for inspecting web material in real time is described. The inspection system includes a memory for storing a model representing a continuous ranking of training images as a plurality of points in the multidimensional feature space, each of which correspond to a feature vector for a different training image of the training images. . The inspection system further includes a pipelined graphics processing unit (GPU) of the inspection system, which GPU is fabricated to extract in parallel a plurality of features from a sample image using parallel hardware components of the GPU. Process sample images captured from. The computerized inspection system calculates on a continuous scale the severity level of non-uniform defects from the extracted features on the sample image of the web material based on the model of the training images.
본 명세서에 기술된 기술은 웨브 상에 제조되는 임의의 재료를 포함하는 다수의 제품 라인에서 응용성 및 유용성을 갖는다. 본 기술은, 균일성이 중요한 광범위한 제품에 넓은 응용성을 갖는다. 몇가지 예는 광학 필름, 창문 필름, 및 연마재이다.The techniques described herein have applicability and utility in many product lines, including any materials made on webs. This technology has wide applicability to a wide range of products where uniformity is important. Some examples are optical films, window films, and abrasives.
본 발명의 하나 이상의 실시예들의 상세 사항이 첨부 도면 및 이하의 설명에 기술되어 있다. 본 발명의 다른 특징부, 목적 및 이점이 설명 및 도면, 그리고 특허청구범위로부터 명백하게 될 것이다.
The details of one or more embodiments of the invention are set forth in the accompanying drawings and the description below. Other features, objects, and advantages of the present invention will become apparent from the description and drawings, and from the claims.
도 1은 본 명세서에 기술된 기술이 적용될 수 있는, 예시적인 웨브 제조 및 전환 시스템을 도시하는 블록도.
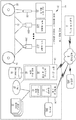
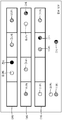
도 2는 예시적인 웨브 제조 공장에서의 검사 시스템의 예시적인 실시예를 도시하는 블록도.
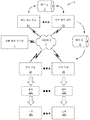
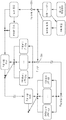
도 3은 본 명세서에 기술된 시스템의 예시적 작동을 도시하는 흐름도.
도 4는 소프트웨어 등급화 도구의 예시적 작동을 도시하는 흐름도.
도 5 내지 도 10은 등급화 도구에 의해 제공되는 사용자 인터페이스의 예시적 특징부를 도시하는 도면.
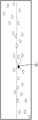
도 11은 "매니폴드"라고 지칭되는 연속 3차원(3D) 표면을 도시하며, 이를 참조하여 연속 순위 모델을 생성시키기 위해 트레이닝 소프트웨어에 의해 적용되는 알고리즘이 용이하게 이해되는 도면.
도 12는 트레이닝 소프트웨어가 트레이닝 이미지로부터 추출된 특징부 벡터를 처리하여 트레이닝 이미지의 연속 순위를 개발하고 연속 순위 모델을 생성시키는 예시적인 공정을 더욱 상세하게 나타내는 흐름도.
도 13은 차트화 모듈이 실시간으로 연속 순위 모델을 이용하여 불균일성 결함의 존재를 검출하고 각각의 결함에 대한 심각도 수준의 연속 차트화를 제공하는 예시적인 공정을 더욱 상세하게 나타내는 흐름도.
도 14는 2차원 특징부 공간 내에서 k-최근방 이웃을 찾는 논리적 표현을 제공하는 그래프.
도 15는 해싱 알고리즘(hashing algorithm)을 사용하여 k-최근방 이웃을 찾는 제2 기술을 도시하는 도면.
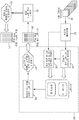
도 16은 특징부 추출 모듈이 연이어 더 큰 특징부 세트들로부터의 결과를 사용하여 부가적 특징부 계산을 트리거링함으로써 실시간으로 "최상의 특징부 세트"를 구축하는 동적 시스템 구성의 예를 나타내는 흐름도.
도 17은 ROC-공간 내의 3-단계 순서의 성능을 나타내는 도면.
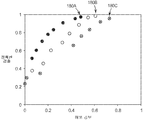
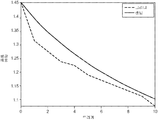
도 18 및 도 19는 시뮬레이션 연구를 기반으로 성능 결과를 나타내는 플롯(plot).
도 20은 특정 트리거링 전략이 더 낮은 비용을 산출한 샘플들의 (시험 전체에 걸친) 평균 분율을 나타내는 비교 플롯.1 is a block diagram illustrating an exemplary web fabrication and conversion system to which the techniques described herein may be applied.
2 is a block diagram illustrating an exemplary embodiment of an inspection system at an exemplary web manufacturing plant.
3 is a flow chart illustrating exemplary operation of a system described herein.
4 is a flow diagram illustrating exemplary operation of a software grading tool.
5-10 illustrate exemplary features of a user interface provided by a rating tool.
11 illustrates a continuous three dimensional (3D) surface, referred to as a “manifold,” in which the algorithm applied by the training software to generate a continuous ranking model is easily understood.
12 is a flow diagram illustrating in more detail an exemplary process by which training software processes feature vectors extracted from a training image to develop a continuous ranking of the training image and generate a continuous ranking model.
FIG. 13 is a flow diagram illustrating in more detail an exemplary process by which the charting module detects the presence of non-uniform defects using a continuous ranking model in real time and provides continuous charting of severity levels for each defect.
14 is a graph providing a logical representation of finding k-nearest neighbors within a two-dimensional feature space.
FIG. 15 illustrates a second technique for finding a k-nearest neighbor using a hashing algorithm.
FIG. 16 is a flow diagram illustrating an example of a dynamic system configuration in which the feature extraction module subsequently builds a “best feature set” in real time by triggering additional feature calculations using results from larger feature sets.
17 shows the performance of a three-step sequence in ROC-space.
18 and 19 are plots showing performance results based on simulation studies.
20 is a comparison plot showing the average fraction (over test) of samples for which a particular triggering strategy yielded lower costs.
도 1은, 본 명세서에 기술된 기술이 적용될 수 있는, 예시적 시스템(2)을 도시하는 블록도이다. 웨브 제조 공장(6A 내지 6N)(웨브 제조 공장(6))은 웨브 롤(7)의 형태로 웨브 재료를 제조 및 운송하는 제조 현장을 나타낸다. 웨브 제조 공장(6)은 지리적으로 분산되어 있을 수 있고, 각각의 웨브 제조 공장은 하나 이상의 제조 공정 라인을 포함할 수 있다. 일반적으로, 웨브 롤(7)은 제조 공장(6) 중 어느 하나에 의해 제조되고 부가적 처리를 위해 웨브 제조 공장 사이에 운송될 수 있다. 완성된 웨브 롤(10)은 제품(12A 내지 12N)(제품(12))으로의 전환을 위해 전환 현장(8A 내지 8N)(전환 현장(8))으로 운송된다. 도 1에 나타낸 바와 같이, 전환 제어 시스템(4), 웨브 제조 공장(6A 내지 6N)(웨브 제조 공장(6)), 및 전환 현장(8A 내지 8N)(전환 현장(8))은 웨브 재료의 제조 및 제품(12)으로의 전환에 관련된 정보(예를 들어, 결함 정보) 교환을 위하여 컴퓨터 네트워크(9)에 의해 상호연결된다.1 is a block diagram illustrating an
일반적으로, 웨브 롤(7, 10)은, 하나의 방향으로 고정된 치수를 갖고 직교하는 방향으로 미리설정된 또는 부정의 길이를 갖는 임의의 시트형 재료일 수 있는 제조된 웨브 재료를 포함할 수 있다. 웨브 재료의 예는 금속, 종이, 직물(woven), 부직물(non-woven), 유리, 중합체 필름, 연성 회로 또는 이들의 조합을 포함하지만, 이에 한정되는 것은 아니다. 금속은 강철 또는 알루미늄과 같은 재료를 포함할 수 있다. 직물은 일반적으로 다양한 천(fabric)을 포함한다. 부직물은 종이, 필터 매체, 또는 절연 재료와 같은 재료를 포함한다. 필름은 예를 들어 라미네이트 및 코팅된 필름을 비롯한 투명 및 불투명 중합체 필름을 포함한다.In general, the web rolls 7, 10 may comprise manufactured web materials, which may be any sheet-like material having a fixed dimension in one direction and a predetermined or negative length in the orthogonal direction. Examples of web materials include, but are not limited to, metals, paper, woven, non-woven, glass, polymer films, flexible circuits, or combinations thereof. The metal may comprise a material such as steel or aluminum. Fabrics generally include various fabrics. Nonwovens include materials such as paper, filter media, or insulating materials. Films include transparent and opaque polymer films, including, for example, laminates and coated films.
전환 현장(8)은 완성된 웨브 롤(10)을 웨브 제조 공장(6)으로부터 받아 고객(14A 내지 14N)(고객(14))에게 판매하기 위한 제품(12) 내로 혼입시키기 위하여 완성된 웨브 롤(10)을 개별 시트로 전환할 수 있다. 전환 시스템은 제품에 연계된 등급 수준과 같은 다양한 기준을 기반으로 주어진 완성된 웨브 롤(10)을 어느 제품(14)으로 전환시킬 것인지를 결정할 수 있다. 즉, 어느 시트가 어느 제품(12)에 혼입되어야 하는지의 선택 공정은 각각의 시트가 만족시키는 특정 등급 수준을 기반으로 할 수 있다. 본 명세서에 기술된 기술에 따르면, 전환 현장(8)은 완성된 웨브 롤(10)에서의 이상(anomaly), 즉 잠재적인 결함에 관한 데이터를 또한 수신할 수 있다. 궁극적으로, 전환 현장(8)은 완성된 웨브 롤(10)을 고객(14A 내지 14N)(고객(14))에 판매하기 위한 제품(12)에 포함될 수 있는 개별 시트들로 전환할 수 있다.The
제품(12)에 포함시킬 개별 시트로 개조할 준비가 된 완성된 웨브 롤(10)을 생산하기 위해, 미완성된 웨브 롤(7)은 하나의 웨브 제조 공장, 예를 들어, 웨브 제조 공장(6A) 내에서 또는 다수의 제조 공장 내에서 다수의 공정 라인의 처리를 거칠 필요가 있을 수 있다. 각각의 공정에 대해, 웨브 롤은 전형적으로 그로부터 웨브가 제조 공정으로 공급되도록 하는 소스 롤(source roll)로서 사용된다. 각각의 공정 후, 웨브는 전형적으로 웨브 롤(7)로 다시 수집되고, 상이한 제품 라인으로 이동되거나, 상이한 제조 공장으로 운송된 다음, 그곳에서 풀리고, 처리되며, 다시 롤로 수집된다. 이 공정은 궁극적으로 완성된 웨브 롤(10)이 제조될 때까지 반복된다. 많은 응용에 대해, 각각의 웨브 롤(7)을 위한 웨브 재료는 하나 이상의 웨브 제조 공장(6)의 하나 이상의 제조 라인에서 적용되는 다수의 코팅을 가질 수 있다. 코팅은 일반적으로 제1 제조 공정의 경우에는 베이스 웨브 재료의 노출된 표면에, 또는 후속 제조 공정의 경우에는 이전에 적용된 코팅의 노출된 표면에 적용된다. 코팅의 예는 접착제, 하드코트(hardcoat), 낮은 접착성의 배면 코팅, 금속화된 코팅, 중성 밀도 코팅, 전기 전도성 또는 비전도성 코팅, 또는 이들의 조합을 포함한다.In order to produce a
웨브 롤(7)들 중 주어진 것을 위한 각각의 제조 공정 동안에, 하나 이상의 검사 시스템이 웨브에 대한 이상 정보를 획득한다. 예를 들어, 도 2에 도시된 바와 같이, 제조 라인을 위한 검사 시스템은 웨브가 처리될 때, 예를 들어 하나 이상의 코팅이 웨브에 적용될 때, 연속적으로 이동하는 웨브에 아주 근접하게 위치되는 하나 이상의 이미지 획득 장치를 포함할 수 있다. 이미지 획득 장치는 디지털 이미지를 얻기 위해 연속적으로 이동하는 웨브의 순차적인 부분들을 스캔한다. 검사 시스템은 하나 이상의 알고리즘으로 이미지를 분석하여 웨브가 전환되는 궁극적 제품(12)에 따라 실제의 "결함"을 나타낼 수 있는 소위 "국소" 이상 정보를 생성시킨다. 검사 시스템은, 예를 들어, 각각의 결함이 단일 영역에 국한된 "점" 결함에 대한 이상 정보를 생성시킬 수 있다. 다른 예로서, 검사 시스템은 웨브 재료가 점 결함의 영역보다 넓은 영역에 걸쳐 불균일한 가변성을 나타내는 "불균일" 결함 또는 "불균일성"에 대한 이상 정보를 생성시킬 수 있다. 이러한 불균일성의 예는 얼룩, 채터, 밴딩, 및 줄무늬를 포함한다.During each manufacturing process for a given one of the web rolls 7, one or more inspection systems obtain abnormal information about the web. For example, as shown in FIG. 2, an inspection system for a manufacturing line may include one or more positioned close proximity to a continuously moving web when the web is processed, eg, when one or more coatings are applied to the web. It may include an image acquisition device. The image acquisition device scans the sequential portions of the web that move continuously to obtain a digital image. The inspection system analyzes the image with one or more algorithms to produce so-called "local" anomaly information that may represent actual "defects" depending on the
웨브 제조 공장(6) 내의 검사 시스템은, 웨브가 제조됨에 따라 실시간으로 불균일성 결함의 존재를 검출하고 각각의 결함의 심각도를 지시하는 출력을 제공하는 알고리즘을 적용할 수 있다. 예를 들어, 전산화 검사 시스템은 웨브 제조 공장(6) 내의 공정 기술자와 같은 사용자에게 불균일성의 존재 및 그들의 심각도에 관하여 실시간 피드백을 제공할 수 있으며, 이에 의해, 제조를 현저하게 지연시키거나 사용할 수 없는 재료를 다량으로 제조하지 않으면서 공정 조건을 조정하여 문제점을 해소함으로써, 발생하는 불균일성에 사용자가 신속하게 대응하는 것을 가능하게 한다. 불균일성에 대한 등급 라벨(예를 들어, "양호" 또는 "불량")을 궁극적으로 할당하거나 주어진 샘플의 불균일성 심각도의 측정값을, 0 내지 10의 척도의 1.63과 같이 연속적인 척도 또는 더욱 정확하게 샘플링된 척도로 생성시킴으로써, 전산화 검사 시스템들은 알고리즘을 적용하여 심각도 수준을 계산할 수 있다.The inspection system in the
이 공정 동안에, 검사 시스템은 본 명세서에 기술된 기술을 적용하여 어느 이미지 특징부를 계산할 것인지를 동적으로(즉, 웨브 재료의 제조 동안에 실시간으로) 결정할 수 있다. 일례에서, 검사 시스템들은, 시스템에 따라 그 내용이 변할 수 있는 베이스 특징부 세트를 추출함하고, 이어서 필요한 대로 부가적인 특징부(들)의 계산을 트리거링함으로써 시작된다. 각각의 획득된 샘플 이미지에 대하여, 본 기술은 연이어 더 큰 특징부 세트들로부터의 결과를 사용하여 필요한 대로 부가적 특징부 계산을 트리거링함으로써 실시간으로 "최상의 특징부 세트"를 구축한다. 각각의 검사 시스템은 적절한 베이스라인 특징부 세트로 시작하며, 이어서 베이스 특징부 세트의 값들에 기초하여, 어느 여분의 특징부들(존재한다면)을 계산할지를 결정한다. 유사하게, 이들 부가적인 특징부들은, 존재한다면, 어떠한 부가적인 특징부들이 필요한지를 결정하도록 분석될 수 있다. 특징부 추출 공정의 각각의 단계에서의 결정을 본 명세서에서는 잠재적 트리거 사건이라고 지칭한다. 일 실시예에서, 제어된 마르코프(Markov) 체인 모델 하에 예상되는 분류 정확도의 이득의 최적화와 관련하여, 검사 시스템은 각각의 잠재적 트리거 사건에서 부가적 특징부의 계산을 트리거링할 것인지를 결정한다.During this process, the inspection system can dynamically determine which image features to calculate by applying the techniques described herein (ie, in real time during the manufacture of the web material). In one example, inspection systems begin by extracting a set of base features whose content may vary depending on the system, and then triggering the calculation of additional feature (s) as needed. For each acquired sample image, the technique subsequently builds the “best feature set” in real time by triggering additional feature calculations as needed using the results from the larger feature sets. Each inspection system starts with an appropriate set of baseline features, and then, based on the values of the base feature set, determines which extra features (if any) to calculate. Similarly, these additional features, if present, can be analyzed to determine what additional features are needed. The determination at each step of the feature extraction process is referred to herein as a potential trigger event. In one embodiment, with respect to the optimization of the gain of classification accuracy expected under the controlled Markov chain model, the inspection system determines whether to trigger the calculation of additional features in each potential trigger event.
일부 실시예에서, 검사 시스템의 분석 컴퓨터는 트레이닝 데이터를 기반으로 개발된 연속 순위 모델의 적용에 의해 포착된 디지털 이미지를 처리한다. 트레이닝 데이터는 전형적으로, 오히려 "합격" 또는 "불합격" 혹은 "1", "3" 또는 "5"와 같은 조악한 이산 등급 라벨들을 흔히 채용하는 알고리즘들의 "트레이닝 단계" 동안에 처리되며, 연속 순위 모델이 트레이닝 데이터에 가장 잘 맞춤되도록 개발된다. 즉, 트레이닝 단계 및 연속 순위 모델의 개발 후에, 트레이닝 데이터에 연속 순위 모델을 적용하는 것은 정확성의 높은 확률을 동반하여 트레이닝 데이터에 라벨링할 것이다. 일단 트레이닝 데이터로부터 모델이 개발되었으면, 분석 컴퓨터들은 프로세싱의 "분류" 단계 동안 그 모델을 새롭게 제조된 제품으로부터 포착된 샘플들에 잠재적으로 실시간으로 적용하며, 이산 등급 라벨들로 제약되지 않는 불균일성 심각도의 연속 차트화를 제공한다. 전산화 검사 시스템들은 이에 의해 샘플들의 연속 순위를 제공할 수 있다. 예를 들어, 전산화 검사 시스템은 0 내지 10의 척도에서 1.63과 같은 연속적인 척도로 웨브 재료 내의 불균일성 결함들에 대한 심각도의 측정치들을 생성하는 알고리즘들을 적용할 수 있다.In some embodiments, the analysis computer of the inspection system processes digital images captured by the application of a continuous ranking model developed based on training data. Training data is typically processed during the "training phase" of algorithms that often employ "pass" or "fail" or coarse discrete grade labels such as "1", "3" or "5", and the continuous rank model is It is developed to best fit the training data. That is, after the training phase and development of the continuous ranking model, applying the continuous ranking model to the training data will label the training data with a high probability of accuracy. Once the model has been developed from the training data, the analysis computers potentially apply the model in real time to samples captured from the newly manufactured product during the "classification" phase of processing, and of non-uniformity severity not constrained by discrete grade labels. Provide continuous charting. Computerized test systems can thereby provide a continuous ranking of samples. For example, a computerized inspection system may apply algorithms that produce measurements of severity for non-uniformity defects in a web material on a continuous scale such as 1.63 on a scale of 0-10.
일부 실시예들에서, 주어진 제조된 웨브에 대한 디지털 이미지의 부가적 분석은 전환 제어 시스템(4)에 의해 오프라인으로 수행될 수 있다. 주어진 웨브에 대한 분류를 기반으로, 전환 제어 시스템(4)은 각각의 웨브 롤(10)에 대해 전환 플랜을 선택하고 생성시킬 수 있다. 소정의 불균일성이 하나의 제품, 예를 들어 제품(12A)에서는 결함을 유발할 수 있는 반면에, 그 이상이 상이한 제품, 예를 들어 제품(12B)에서는 결함을 유발하지 않을 수 있다는 점에서, 디지털 이미지의 분석 및 심각도 수준의 결정은 응용-특이적(application-specific)일 수 있다. 각각의 개조 계획은 궁극적으로 고객(14)에게 판매될 수 있는 제품(12)을 만들기 위해 대응하는 완성된 웨브 롤(10)을 처리하는 정의된 명령어를 나타낸다. 예를 들어, 웨브 롤(10)은 노트북 컴퓨터의 디스플레이에 적용하기 위한 최종 제품, 예를 들어 소정 크기의 시트(sheet)로 전환될 수 있다. 또 다른 예로서, 동일한 웨브 롤(10)이 대신에 휴대 전화의 디스플레이에 적용하기 위한 최종 제품으로 개조될 수 있다. 전환 제어 시스템(4)은, 이상에 적용될 수 있는 상이한 결함 검출 알고리즘들을 고려하여, 어느 제품이 웨브의 최대 이용도와 같은 소정의 파라미터들을 최상으로 달성하는지를 식별할 수 있다.In some embodiments, additional analysis of the digital image for a given manufactured web can be performed offline by the
도 2는 도 1의 예시적인 웨브 제조 공장(6A)에서 웨브 공정 라인(21)의 일부분 내에 위치하는 검사 시스템의 예시적인 실시예를 도시하는 블록도이다. 이 예시적인 실시예에서, 웨브(20)의 세그먼트가 2개의 지지 롤(22, 24)들 사이에 위치된다. 이미지 획득 장치(26A 내지 26N)(이미지 획득 장치(26))는 연속적으로 이동하는 웨브(20)에 아주 근접하여 위치하며, 연속적으로 이동하는 웨브(20)의 순차적인 부분을 스캔하여 이미지 데이터를 얻는다. 획득 컴퓨터(27)는 이미지 획득 장치(26)로부터 이미지 데이터를 수집하여 분석 컴퓨터(28)로 이미지 데이터를 전송한다.FIG. 2 is a block diagram illustrating an exemplary embodiment of an inspection system located within a portion of the
이미지 획득 장치(26)는, 이동하는 웨브(20)의 순차적인 부분을 판독할 수 있고 디지털 데이터 스트림의 형태로 출력을 제공할 수 있는 종래의 이미징 장치일 수 있다. 도 2에 도시된 바와 같이, 이미지화 장치(26)들은 디지털 데이터 스트림들을 직접 제공하는 카메라, 또는 부가적인 아날로그-디지털 컨버터를 구비한 아날로그 카메라들일 수 있다. 예를 들어 레이저 스캐너들과 같은 다른 센서들이 이미지화 획득 장치들로서 사용될 수 있다. 웨브의 순차적인 부분은 데이터가 연속하는 단일 라인에 의해 획득됨을 지시한다. 단일 라인은 단일 열의 센서 요소 또는 화소에 매핑되는 연속적으로 이동하는 웨브의 영역을 포함한다. 이미지를 획득하는 데 적합한 장치의 예는 달사(Dalsa)(캐나다 온타리오주 워털루 소재)의 피라냐(Piranha) 모델, 또는 아트멜(Atmel)(미국 캘리포니아주 새너제이 소재)의 모델 아비이바(Aviiva) SC2 CL과 같은 라인스캔 카메라를 포함한다. 추가의 예는 아날로그-디지털 컨버터와 함께 서피스 인스펙션 시스템즈 게엠베하(Surface Inspection Systems GmbH)(독일 뮌헨)로부터의 레이저 스캐너를 포함한다.Image acquisition device 26 may be a conventional imaging device capable of reading sequential portions of moving
이미지 데이터는 이미지의 입수를 지원하는 광학 조립체의 이용을 통해 임의로 획득될 수 있다. 이 조립체는 카메라의 부품일 수 있거나, 카메라와는 별개일 수 있다. 광학 조립체는 이미지화 공정 동안에 반사된 광, 투과된 광, 또는 반투과반사된(transflected) 광을 이용한다. 반사된 광은 예를 들어 표면 스크래치와 같은 웨브 표면 변형부에 의해 야기된 결함의 검출에 흔히 적합하다.Image data can be obtained arbitrarily through the use of an optical assembly that supports the acquisition of the image. This assembly may be part of the camera or may be separate from the camera. The optical assembly utilizes reflected light, transmitted light, or transflected light during the imaging process. Reflected light is often suitable for the detection of defects caused by web surface deformations such as, for example, surface scratches.
몇몇 실시예들에서, 기준 마크 제어기(fiducial mark controller)(30)는 웨브(20)로부터 롤 및 위치 정보를 수집하기 위해 기준 마크 판독기(fiducial mark reader)(29)를 제어한다. 예를 들어, 기준 마크 제어기(30)는 웨브(20)로부터 바코드 또는 다른 표지를 판독하기 위한 하나 이상의 사진-광학 센서(photo-optic sensor)를 포함할 수 있다. 게다가, 기준 마크 제어기(30)는 웨브(20) 및/또는 롤러(22, 24)에 관여된 하나 이상의 고정밀 인코더로부터 위치 신호를 수신할 수 있다. 이 위치 신호에 기초하여, 기준 마크 제어기(30)는 각각의 검출된 기준 마크에 대한 위치 정보를 결정한다. 기준 마크 제어기(30)는 롤 및 위치 정보를 검출된 이상과의 연계를 위해 분석 컴퓨터(28)에 전달한다.In some embodiments, a
분석 컴퓨터(28)는 획득 컴퓨터(27)로부터의 이미지 데이터의 스트림을 처리한다. 본 명세서에 기술된 기술에 따라, 특징부 추출 모듈(43)이 분석 컴퓨터(28) 상에서 실행되고, 웨브 재료(20)의 제조 동안에 실시간으로 어느 이미지 특징부를 이미지당 기준으로 계산할 것인지를 동적으로 결정한다. 즉, 제조 동안에 획득된 각각의 샘플 이미지에 대하여, 각각의 유형의 잠재적 불균일성에 대해 심각도 수준을 계산할 수 있을 때까지 특징부 추출 모듈(43)이 연이어 더 큰 특징부 세트들로부터의 결과를 사용하여 부가적 특징부 계산을 트리거링함으로써 실시간으로 "최상의 특징부 세트"를 구축한다. 예시적인 일 실시예에서, 전산화 불균일성 차트화 모듈(39)("차트화 모듈(39)")은 트레이닝 데이터(35)를 기반으로 개발된 연속 순위 모델(34)("모델(34)")을 이용하는 알고리즘을 적용함으로써 추출된 특징부를 처리하여 불균일성 결함의 존재를 검출하고 각각의 결함의 심각도 수준의 연속 차트화를 제공한다.
전형적으로 트레이닝 데이터(35)는 하나 이상의 전문가(38)에 의해 등급이 할당된 대표적 샘플 디지털 이미지들의 방대한 세트로 구성된다. 이전에 자동으로 순위화된 데이터 또한 트레이닝에 사용할 수 있다. 디지털 이미지는, 예를 들어, 웨브(20) 또는 웨브 공정 라인(21)에 의해 이전에 제조된 다른 웨브로부터 채취된 샘플을 나타낼 수 있다. 트레이닝 서버(36)는 전산화 전문 등급화 도구(37)("등급화 도구(37)")를 제공하는 소프트웨어의 실행을 위한 작동 환경을 제공하여, 샘플을 나타내는 다량의 디지털 이미지에 전문가(38)가 효율적이고 일관성 있게 등급(즉 라벨)을 할당하는 것을 지원할 수 있다.
일단 트레이닝 데이터(35)가 확립되었으면, 트레이닝 모듈(41)은 웨브 재료(20)에 대해 획득 컴퓨터(27)로부터 수신한 이미지 데이터의 실시간 분석을 위하여 트레이닝 데이터를 처리하여 차트화 모듈(39)에 의한 후속 용도로 연속 순위 모델(34)을 생성시킨다. 이러한 방식으로, 웨브 재료(20)의 구역의 새로운 이미지를 연속 순위 모델(34)에 따라 분류할 수 있다. 검출될 수 있는 예시적인 결함은 얼룩, 채터, 밴딩, 및 줄무늬와 같은 불균일성과 더불어, 반점(spot), 스크래치, 및 오일 드립(oil drip)을 포함하는 점 결함을 포함한다.Once
분석 컴퓨터(28)는, 웨브(20)에 대한 롤 식별 정보 및 가능하게는 각각의 이상에 대한 위치 정보를 포함하는, 웨브(20)에 대한 이상 정보를 데이터베이스(32) 내에 저장할 수 있다. 예를 들어, 분석 컴퓨터(28)는 기준 마크 제어기(30)에 의해 생성되는 위치 데이터를 이용하여 공정 라인의 좌표계 내에서 각각의 이상의 이미지 구역 또는 공간적 위치를 결정할 수 있다. 즉, 기준 마크 제어기(30)로부터의 위치 데이터를 기반으로, 분석 컴퓨터(28)는 현재의 공정 라인에 의해 사용되는 좌표계 내에서 각각의 이상에 대한 x, y, 및 가능하게는 z 위치 또는 범위를 결정한다. 예를 들어, x 치수가 웨브(20)를 가로지른 거리를 나타내고, y 치수가 웨브의 길이를 따른 거리를 나타내며, z 치수가 웨브에 이전에 적용된 코팅, 재료 또는 다른 층의 수에 기초할 수 있는 웨브의 높이를 나타내도록, 좌표계가 정의될 수 있다. 게다가, x,y,z 좌표계에 대한 원점은 공정 라인 내의 물리적 위치에 정의될 수 있고, 전형적으로 웨브(20)의 초기 공급 배치와 연관된다. 데이터베이스(32)는 데이터 저장 파일 또는 하나 이상의 데이터베이스 서버에서 실행되는 하나 이상의 데이터베이스 관리 시스템(DBMS)을 비롯한 다수의 상이한 형태들 중 임의의 형태로 구현될 수 있다. 데이터베이스 관리 시스템은 예를 들어 관계형(RDBMS), 계층형(HDBMS), 다차원(MDBMS), 객체 지향형(ODBMS 또는 OODBMS) 또는 객체 관계형(ORDBMS) 데이터베이스 관리 시스템일 수 있다. 일례로서, 데이터베이스(32)는 마이크로소프트 코포레이션(Microsoft Corporation)으로부터의 SQL 서버(SQL Server)™에 의해 제공된 관계형 데이터베이스로서 구현된다.The
일단 공정이 종료되었으면, 분석 컴퓨터(28)는 데이터베이스(32)에 수집된 데이터를 네트워크(9)를 통해 전환 제어 시스템(4)으로 전송할 수 있다. 예를 들어, 분석 컴퓨터(28)는 롤 정보와 더불어 이상 정보 및 각각의 이상에 대한 각각의 서브-이미지를 연속 순위 모델(34)에 따른 후속의 오프라인 상세 분석을 위해 전환 제어 시스템(4)에 전달할 수 있다. 예를 들어, 정보는 데이터베이스(32)와 개조 제어 시스템(4) 사이의 데이터베이스 동기화에 의해 전송될 수 있다. 몇몇 실시예들에서, 분석 컴퓨터(28)보다는, 개조 제어 시스템(4)이 제품(12)들 중의 각각의 이상이 결함을 야기할 수 있는 그 제품을 결정할 수 있다. 일단 완성된 웨브 롤(10)에 대한 데이터가 데이터베이스(32)에 수집되었으면, 데이터는 전환 현장(8)에 전달되고/되거나, 웨브 롤 상에, 제거가능하거나 세척가능한 마크로 웨브의 표면 상에 직접, 또는 웨브 상에 이상을 마킹하기 전에 또는 마킹하는 동안에 웨브에 적용될 수 있는 커버 시트 상에, 이상을 마킹하기 위해 사용될 수 있다.Once the process has been completed, the
분석 컴퓨터(28) 및 트레이닝 서버(36)의 구성요소는 적어도 부분적으로, 하나 이상의 하드웨어 마이크로프로세서, 디지털 신호 프로세서(digital signal processor, DSP), 응용 특이적 집적 회로(application specific integrated circuit, ASIC), 필드 프로그램 가능 게이트 어레이(field programmable gate array, FPGA), 또는 임의의 다른 균등한 집적 또는 개별 논리 회로와 더불어 이러한 구성요소의 임의의 조합을 포함하는, 분석 컴퓨터(28)의 하나 이상의 프로세서에 의해 실행되는 소프트웨어 명령어로서 구현될 수 있다. 소프트웨어 명령어는 랜덤 액세스 메모리(random access memory, RAM), 판독 전용 메모리(read only memory, ROM), 프로그램 가능 판독 전용 메모리(programmable read only memory, PROM), 소거 및 프로그램 가능 판독 전용 메모리(erasable programmable read only memory, EPROM), 전자적 소거 및 프로그램 가능 판독 전용 메모리(electronically erasable programmable read only memory, EEPROM), 플래시 메모리, 하드 디스크, CD-ROM, 플로피 디스크, 카세트, 자기 매체, 광학 매체, 또는 다른 컴퓨터-판독가능 저장 매체와 같은 비-일시적 컴퓨터 판독가능 매체 내에 저장될 수 있다. 예시를 목적으로 제조 공장(6A) 내에 위치하는 것으로 나타내지만, 분석 컴퓨터(28)는 트레이닝 서버(36)와 더불어 제조 공장의 외부, 예를 들어 중앙 위치 또는 전환 현장에 위치할 수 있다. 예를 들어, 분석 컴퓨터(28) 및 트레이닝 서버(36)는 전환 제어 시스템(4) 내에서 작동할 수 있다. 다른 예에서, 기술된 구성요소는 단일 계산 플랫폼 상에서 실행되며 동일한 소프트웨어 시스템 내에 집적될 수 있다.The components of the
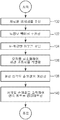
도 3은 도 2의 검사 시스템의 개요를 제공하는 순서도이다. 본 예에서, 공정은 하기의 2개의 일반적인 처리 단계를 포함한다: 트레이닝 단계(45) 및 온라인 추산 단계(47).3 is a flow chart providing an overview of the inspection system of FIG. In this example, the process includes two general processing steps:
초기에, 트레이닝 모듈(41)은, 심각도 순위가 아마도 조악하게 구분된 척도로 이미 알려진, 전형적으로는 이미지 세트 형태의 트레이닝 데이터(35)를 입력으로서 수신한다(50). 다음에, 트레이닝 서버(36) 상에서 실행되는 특징부 추출 소프트웨어 모듈은 이미지들의 각각을 처리하여 특징부들을 추출한다(52). 특징부 추출은 각각의 이미지에 내재적인 관련 정보의 간결한 수치적 표현으로서 각각의 이미지의 수치화된 디스크립터를 제공한다. 트레이닝 단계 동안에 오프라인에서 특징부 추출이 일어남에 따라, 특징부 추출 소프트웨어 모듈은 각각의 트레이닝 이미지에 대하여 완전한 세트의 특징부 추출 계산을 수행할 수 있다. 트레이닝 세트 내의 이미지들 사이의 관계에 대한 유용한 정보를 보존하면서, 동시에 정보성이 없는 이미지 특징을 제거하는 임의의 방식으로 특징부를 추출할 수 있다. 통상적인 특징부 추출 기술의 예는 필터의 세트로 이미지를 컨볼빙(convolving)하고 필터링된 이미지의 통계를 계산하는 단계, 또는 색 또는 강도 히스토그램을 기반으로 특징부를 추출하는 단계를 포함한다. 간혹 화소값을 특징부로서 사용할 수 있으나, 이 경우에는 전형적으로 전체 이미지가 저장되어야 하므로 디스크립터에 간결성이 없다. 일반적으로, 얻어진 특징부를 상응하는 이미지 내의 관련 정보의 간결한 표현으로서 처리한다.Initially,
본 명세서에 기술된 기술은 임의의 특정 특징부 추출 방법론을 동반하는 용도로 한정되지 않으며, 다른 유형의 특징부가 더욱 적절한 응용에 용이하게 적용될 수 있다. 일반적으로, 이미지로부터 추출된 특징부는, 그들이 특정 유형의 불균일성에 대해 이미지에 관한 식별 정보를 포함한다는 점에서 표현적이다. 그러므로, 일단 특징부가 추출되었으면, 각각의 이미지에 상응하는 특징부 벡터는 그 이미지에 포함된 대부분의 관련 정보를 나타낸다.The techniques described herein are not limited to use with any particular feature extraction methodology, and other types of features can be readily applied to more suitable applications. In general, features extracted from an image are expressive in that they include identifying information about the image for a particular type of heterogeneity. Therefore, once the features have been extracted, the feature vector corresponding to each image represents most of the relevant information contained in that image.
하나의 예시적인 특징부 추출 알고리즘은, 특히 그것이 텍스처와 관련될 경우, 이미지에 걸쳐 또는 이미지의 서브영역들에 대해서, 화소 특징부들의 작은 공분산 매트릭스(small covariance matrix)를 계산하는 것이다. 일단 이러한 작은 공분산 매트릭스(예를 들어, 5x5)가 추출되면, 이미지를 직접 취급하는 대신에 이들 매트릭스만을 기반으로 이미지들 사이의 쌍대(pair-wise) 비교를 효율적으로 실행할 수 있다. 예를 들어, 흑백 이미지는 I(x, y)와 같이 화소 좌표 x 및 y에 의해 지표화된 2차원 어레이로서 정의된다. 각각의 화소 위치(x, y)에서, 화소의 강도값 및 그 화소에서의 그들의 1차 및 2차 도함수를 기반으로 특징부 벡터를 추출한다:One example feature extraction algorithm is to calculate a small covariance matrix of pixel features, particularly when it is associated with a texture, over an image or for subregions of the image. Once this small covariance matrix (eg 5 × 5) is extracted, it is possible to efficiently perform pair-wise comparisons between images based only on these matrices instead of directly handling the images. For example, a monochrome image is defined as a two dimensional array indexed by pixel coordinates x and y, such as I (x, y). At each pixel position (x, y), extract the feature vector based on the intensity values of the pixels and their first and second derivatives in that pixel:
![]()
![]()
각각의 화소에서 단순히 강도값 사이의 전향차분 또는 중심차분을 계산함으로써 이미지 도함수(구배)를 근사화할 수 있다. 고차 도함수 또는 필터링된 이미지(들)로부터의 결과들을 포함하는 다른 특징부들이 또한 수학식 1의 벡터에 포함될 수 있다. 유사하게, 모든 도함수가 포함될 필요는 없으며, 예를 들어, 주어진 방향의 도함수가 특정 결함에 대한 정보를 제공하지 않는다면, 이는 수학식 1로부터 제거될 수 있다. 최종적으로, 전체 이미지에 걸쳐 이들 화소 특징부의 공분산 매트릭스를 계산한다:The image derivative (gradient) can be approximated by simply calculating the forward or center difference between the intensity values in each pixel. Other features, including results from higher order derivatives or filtered image (s), can also be included in the vector of equation (1). Similarly, not all derivatives need to be included, for example, if the derivative in a given direction does not provide information about a particular defect, it can be eliminated from equation (1). Finally, calculate the covariance matrix of these pixel features over the entire image:

여기서 N은 이미지 내의 화소의 수이고,Where N is the number of pixels in the image,

는 화소 특징부들의 평균이다. 후속의 처리 단계에서는, 이미지들 사이의 쌍대 거리를 계산하는 것이 유용할 수 있다. 이들 공분산 매트릭스 디스크립터의 경우, 쌍대 거리는 하기와 같이 계산된다:Is the average of the pixel features. In subsequent processing steps, it may be useful to calculate the dual distance between the images. For these covariance matrix descriptors, the dual distance is calculated as follows:

여기서 λi(CI1;CI2)는 2개 공분산 매트릭스의 i 번째 일반화된 고유값이다. 추가의 상세 사항은 문헌[O. Tuzel, F. Porikli, and P. Meer. "Region Covariance: A Fast Descriptor for Detection and Classification." Proceedings of the European Conference on Computer Vision, 2006]에서 확인할 수 있다.Where λ i (C I1 ; C I2 ) is the i th generalized eigenvalue of the two covariance matrices. Further details are given in O. Tuzel, F. Porikli, and P. Meer. "Region Covariance: A Fast Descriptor for Detection and Classification." Proceedings of the European Conference on Computer Vision, 2006].
트레이닝 이미지들의 각각에 대한 특징부들을 추출한 후, 전문가(38)들은 전산화 전문 등급화 도구(37)와 상호 작용하여 후술하는 방식으로 추출된 특징부 벡터들의 견지에서 디지털 이미지들의 각각에 이산 등급(53)들을 할당한다(55).After extracting the features for each of the training images, the experts 38 interact with the computerized professional grading tool 37 to produce
다음에, 트레이닝 모듈(41)은 추출된 특징부 벡터들 및 전문 등급(53)들을 처리하여, 트레이닝 이미지들의 연속 순위를 생성하고 그들의 불균일성들의 심각도를 기반으로 연속 순위 모델(34)을 생성한다(54). 초기에, 각각의 트레이닝 이미지에 관해 알려진 모든 것은, 대응하는 샘플이 특정 유형의 불균일성에 대해 "양호" 또는 "불량" 혹은 수준 "1", "3" 또는 "5"인지를 표기하는 전문 등급이다. 이들 전문 등급은 트레이닝 이미지들의 흔히 조악한 오더링(ordering)을 제공하는데, 즉 트레이닝 이미지들은 2개 또는 3개의 이산 카테고리들로 또는 전문가가 그러한 더 미세한 척도 정보를 제공할 수 있다면 그 이상의 카테고리들로 순위화될 수 있다. 트레이닝 모델(41)은 이 조악한 오더링을 입력으로서 사용하여, 특정 불균일성에 대한 연속적인 척도에 따라 트레이닝 이미지가 최상으로부터 최하까지 순위화되는 연속 순위를 학습한다. 양호한 순위는 가능한 한 전문 등급을 중시해야 하지만(예를 들어, "양호" 이미지를 할당하는 것은 "불량"으로 라벨링된 것들에 비해 심각도 순위를 낮춤), 일부 경우에는 트레이닝 모듈(41)이 이산 라벨들에 의해 제시되는 조악한 순위를 위반하는 것이 완전히 방지되지는 않는데, 이는 트레이닝 데이터의 수동 라벨링에서의 주관적인 사람 인지 특성 또는 심지어 명백한 실수로 인해 전문 등급에 오류가 존재한다는 것이 가능하고 사실상 통상적이기 때문이다.Next, the
온라인 추산 단계(47) 동안에, 차트화 모듈(39)은 학습된 연속 순위 모델(34)을 제조 라인에 실시간으로 적용한다. 생성되고 있는 웨브의 샘플 이미지가 포착됨에 따라(56), 특징부 추출 모듈(43)이 이미지로부터 특징부를 추출한다(58). 하기에 추가로 상세히 기술된 바와 같이, 특징부 추출 모듈(43)은 웨브 재료(20)의 제조 동안에 실시간으로 어느 이미지 특징부를 이미지당 기준으로 계산할 것인지를 동적으로 결정한다. 제조 동안에 획득된 각각의 샘플 이미지에 대하여, 특징부 추출 모듈(43)은 연이어 더 큰 특징부 세트들로부터의 결과들을 사용하여 부가적 특징부 계산들을 트리거링함으로써 "최상의 특징부 세트"를 실시간으로 구축한다. 특징부 추출 모듈(43)은 샘플 이미지로부터 어느 특징부들을 추출할 것인지를 실시간으로 선택하기 위한 동적 트리거들의 체인을 정의하는 의사 결정 모델(예를 들어, 마르코프 모델)을 저장할 수 있다. 추출된 특징부가 웨브 재료에 대한 불균일성 결함의 심각도 수준을 계산하기에 충분할 때까지 샘플 이미지로부터 추출할 부가적 특징부 세트의 선택을 반복하여 동적으로 트리거링하기 위하여 특징부 추출 모듈(43)은 모델을 적용한다(59, 60). 그러므로, 임의의 주어진 샘플 이미지에 대하여 추출된 특징부들의 수, 및 특징부가 추출되는 순서는, 특징부 추출 모듈(43)에 의해 실시간으로 동적으로 결정된다. "양호" 또는 "불량"과 같은 심각도 등급 라벨을 할당하거나, 1 내지 10의 척도의 "1.63"과 같은 심각도 값을 생성시킴으로써, 컴퓨터 검사 시스템이 심각도 수준을 계산할 수 있다. 이어서, 불균일성 결함에 대하여 계산된 심각도를 사용자에게 출력할 수 있다. 예를 들어, 일단 추출된 특징부가 연속 순위 모델(34)을 기반으로 심각도 등급이 할당되기에 충분하면, 심각도 등급을 사용자에게 출력할 수 있다.During the
본 명세서에서 설명되는 기술들은 전문 평가자들이 될 새로운 개인들을 트레이닝시키는 데 이용될 수 있다. 즉, 본 명세서에서 설명되는 기술들은, 가능하게는 특정 불균일성 결함들의 수 및 심각도를 증가시키거나 감소시키도록 조작자들에 의해 이루어지는 조절들에 응답하여, 특정 불균일성 결함들의 예들을 시각적으로 표현하는 데 사용될 수 있다. 이는 새로운 개인이 기존 전문가들과 동일한 방식으로 결함을 시각화하게 하고, 전문 등급화 시스템을 트레이닝시키는 데 사용되는 이미지들의 더 양호한 이해를 개발하게 한다. 예를 들어, 전산화 검사 시스템은 제조된 웨브 재료로부터 포착된 샘플 이미지를 실시간으로 처리하여 이미지로부터 제1 복수의 특징부들을 추출할 수 있다. 사용자를 위한 트레이닝 소프트웨어로서 구현된 등급화 도구(37)는, 분류 모델에 따라서 제1 복수의 특징부들로부터 전산화 검사 시스템으로 웨브 재료의 샘플 이미지에 대한 불균일성 결함의 심각도 수준을 계산할 수 있으며, 이어서 분류 모델로부터 계산된 심각도 수준 및 샘플 이미지 둘 모두를 트레이닝 정보로서 사용자에게 표시할 수 있다.The techniques described herein can be used to train new individuals to become professional evaluators. That is, the techniques described herein may be used to visually represent examples of specific non-uniformity defects, possibly in response to adjustments made by the operator to increase or decrease the number and severity of the specific non-uniformity defects. Can be. This allows new individuals to visualize defects in the same way as existing professionals and to develop a better understanding of the images used to train the professional grading system. For example, the computerized inspection system may process the sample image captured from the manufactured web material in real time to extract the first plurality of features from the image. The grading tool 37, implemented as training software for the user, can calculate the severity level of the non-uniformity defects for the sample image of the web material with the computerized inspection system from the first plurality of features according to the classification model, and then classify Both the severity level and the sample image calculated from the model can be displayed to the user as training information.
도 4는 이산 등급(53)들을 트레이닝 데이터(35)에 할당하는 데 있어서 전문가(38)들을 지원하는 등급화 도구(37)의 예시적인 동작(도 3의 단계 55)을 예시하는 흐름도이다. 초기에, 등급화 도구(37)는 전술된 바와 같은 특징부 추출 소프트웨어 모듈에 의해 추출된 특징부 벡터 세트 및 트레이닝 데이터(35)를 수신한다.4 is a flowchart illustrating an exemplary operation (step 55 of FIG. 3) of a grading tool 37 that assists professionals 38 in assigning
이때, 등급화 도구(37)는 클러스터링 단계(63)에 진입하며, 여기서 이미지들로부터 추출된 서술적 특징부들을 기반으로 이미지들이 클러스터링된다. 트레이닝 및 시험 분류 알고리즘에 사용되는 이미지 세트들이 흔히 대략 수만개의 이미지로 매우 방대한 것은 드문 일이 아니다. 대부분의 방대한 데이터세트는 현저한 중복을 포함하기 때문에 대표적 서브세트만 상세히 분석하면 되므로, 이렇게 많은 이미지를 상세하게 시각화하고 클러스터링하는 것은 전형적으로 짧은 기간에 실현가능하지 않으며 더욱이 불필요할 수 있다. 이러한 이유들로, 등급화 도구(37)는 대표적인 이미지 서브세트를 자동으로 선택하여 라벨링 공정(64)에서 전문가(38)를 보조한다. 전문가(38)가 활발히 데이터를 탐색하고 존재하는 결함의 유형을 식별하는 것을 지원하기 위하여, 등급화 도구(37)는 정상 수준의 불완전성을 가진 이미지의 예와 더불어 트레이닝 데이터(35) 내에 존재하는 결함의 상이한 유형의 극단적인 예를 포함하도록 서브세트를 자동으로 선택한다.The grading tool 37 then enters a
일례에서, 등급화 도구(37)는 상대적으로 극단적인 불완전성의 경우들을 구별하기 위해 화소 강도의 분산을 이용하며, 이는 웨브-기반의 제품의 이미지에서 불균일성(즉, 텍스처)을 특성화하기에 충분한 것으로 관찰되었다. 추가로, 화소 분산을 계산하는 단계는 상대적으로 계산상 저가이며, 이는 트레이닝 이미지의 매우 방대한 세트에 유리할 수 있다. 상기 개관된 공분산 매트릭스 디스크립터의 경우, 추가의 계산이 필요하지 않도록 화소 강도 분산이 매트릭스 CI의 좌상단 요소에 주어진다. 이러한 예에서, 서브 세트 선택의 제1 단계는 최고 분산을 가진 N1 이미지를 식별하는 것이다(64). 이들은 트레이닝 데이터(35) 내의 가장 결함이 있는 N1 이미지에 대략 상응한다. 서브세트가 전체로서의 세트를 대표하는 것 또한 중요하므로, 등급화 도구(37)는 또한 나머지 세트로부터 무작위로 N2 이미지를 선택한다. N1 + N2 이미지의 이러한 세트는 초기 서브세트 S0(도 3에서 "서브세트(0)"으로 표기함)을 포함한다. 크기 N1 및 N2는 사용자에 의해 선택된다.In one example, the grading tool 37 uses a variance of pixel intensity to distinguish between cases of relatively extreme imperfections, which is sufficient to characterize non-uniformity (ie, texture) in an image of a web-based product. Was observed. In addition, calculating pixel variance is relatively computationally inexpensive, which can be advantageous for a very large set of training images. In the case of the overview covariance matrix descriptor, the pixel intensity variance is given to the upper left element of the matrix C I so that no further calculation is required. In this example, the first step of subset selection is to identify 64 the N 1 image with the highest variance. These correspond roughly to the most defective N 1 images in
게다가, 등급화 도구(37)는 S0에 의해 잘 대표되지 않는 S0 에 이미 포함되지 않는 임의의 범위외 값(outlier)을 포함하도록 서브세트를 생성시킨다(65). S0 내에 있지 않은 각각의 나머지 이미지를 처리하여, 상기 거리 함수(수학식 4)를 사용하여 특징부 공간 내에서 그의 k 최근방 이웃(kNN)을 식별한다. 용어 "특징부 공간"은 수학식 1에 상기 정의된 특징부 벡터와 같은 특징부 벡터의 차원에 의해 정의되는 다차원 공간을 지칭한다. 그의 모든 kNN까지의 거리가 임계치 Td를 초과한다면, 이미지는 범위외 값으로 간주된다. 파라미터 k 및 Td는, 내정값을 사용할 수 있지만, 전문가(38)에 의해 구성될 수도 있다. 이는 전문가(38)가 상이한 값을 시도하여 결과를 관찰하는 것을 가능하게 한다. 예시적인 내정값은, 예를 들어, k = 5이고 Td = 1.0일 수 있다. 등급화 도구(37)는 이 방식으로 선택된 임의의 범위외 값을 사전에 선택된 N1 + N2 이미지에 첨가하여 완전한 서브세트 S1(도 1에서 "서브세트(1)"로 표기함)을 형성시킨다.Furthermore, the graded tool 37 are not well represented by S 0 S 0 Generate a
트레이닝 이미지의 대표적 서브세트 S1을 선택한 후에, 등급화 도구(37)는 클러스터링 알고리즘을 서브세트에 적용하여 서브세트 S1 내의 것들로부터 상대적으로 유사한 이미지의 작은 그룹을 형성시킨다(66). 등급화 도구(37)는 클러스터를 형성시켜 트레이닝 데이터세트의 더욱 직관적인 시각화를 제공하며 전문가(38)가 탐색하는 것을 더욱 용이하게 한다. 일례에서, 등급화 도구(37)는 상향 병합식 클러스터링 알고리즘(bottom-up agglomerative clustering algorithm)을 적용하여 그들의 공분산 매트릭스 디스크립터에 따라 서브세트 S1 내에 이미지 클러스터를 형성시킨다. 이 공정에서, 각각의 이미지는 초기에 별도의 클러스터로서 처리되며, 사전에 확립된 클러스터를 사용하여 연속되는 클러스터를 식별한다. 예를 들어, 수학식 4를 사용하여 계산한 이미지간 거리를 기반으로, 등급화 도구(37)는 병합식 계층형 연결 트리(agglomerative hierarchical linkage tree)를 형성시키며, 이는 트레이닝 데이터 사이의 계층형 상호관계를 압축한다. 전문가(38)에 의해 특정되는 바와 같이, 구성된 수의 클러스터 Nc를 생성시키기 위하여, 등급화 트리는 소정의 지점에서 공정을 종료한다(즉, 연결 트리를 마감함). 병합식 계층형 클러스터링에 대한 추가의 정보를 문헌[W.H.E. Day and H. Edelsbrunner, "Efficient Algorithms for Agglomerative Hierarchical Clustering Methods", Journal of Classification, vol. 1, no. 1, pp. 7-24, 1984]에서 볼 수 있다.After selecting a representative subset S 1 of training images, grading tool 37 applies a clustering algorithm to the subset to form a small group of relatively similar images from those in subset S 1 (66). The grading tool 37 forms a cluster to provide a more intuitive visualization of the training dataset and makes the expert 38 easier to navigate. In one example, the grading tool 37 applies a bottom-up agglomerative clustering algorithm to form image clusters in subset S 1 according to their covariance matrix descriptors. In this process, each image is initially processed as a separate cluster, using a previously established cluster to identify successive clusters. For example, based on the distance between images calculated using
다수의 클러스터(예를 들어, 일부 경우에 수백개)가 존재할 수 있으므로, 등급화 도구(37)는 또한, 가장 유사한 그룹이 서로 아주 근접하여 표시되도록 클러스터를 서로에 대해 오더링한다. 이는 제2 병합식 계층형 연결 트리를 형성하는 등급화 도구(37)에 의해 이루어지며, 이 경우에 클러스터 자체 사이의 상호관계를 압축한다. 따라서, 제2 트리의 최저 수준(단말 노드(leaf node))을 관찰함으로써 클러스터의 오더링을 얻을 수 있다. 제2 계층형 연결 트리를 형성시키기 위하여, 등급화 트리(37)는 이미지 클러스터를 쌍대 양식으로 분석하고 각각의 클러스터 쌍 사이의 쌍대 클러스터간 거리를 계산한다. 각각의 클러스터 사이의 클러스터간 거리를 사용하여 제2 연결 트리를 형성시킨다. 일례에서, 등급화 트리(37)는 2개 클러스터 내의 이미지들 사이의 개별적인 거리의 중앙값으로서 2개 클러스터 사이의 거리를 계산한다. 등급화 도구(37)는 제2 트리의 단말 노드의 배열을 이용하여 이미지 클러스터의 디스플레이를 제어함으로써, 공간적으로 서로 아주 근접한 가장 유사한 이미지 클러스터를 표시한다. 이는 전문가(38)가 트레이닝 테이터에 의해 대표되고 그 안에 존재하는 결함을 이해하는 것을 보조한다.Since there may be multiple clusters (eg, in some cases hundreds), the ranking tool 37 also orders the clusters against each other so that the most similar groups are displayed in close proximity to each other. This is done by a grading tool 37 which forms a second merged hierarchical connection tree, in which case it compresses the interrelationships between the clusters themselves. Thus, ordering of the cluster can be obtained by observing the lowest level (leaf node) of the second tree. In order to form a second hierarchical linking tree, the ranking tree 37 analyzes the image clusters in a twin form and calculates the inter-cluster distance between each cluster pair. The intercluster distance between each cluster is used to form a second connection tree. In one example, the ranking tree 37 calculates the distance between the two clusters as the median of the individual distances between the images in the two clusters. The grading tool 37 controls the display of the image cluster using the arrangement of terminal nodes in the second tree, thereby displaying the most similar image clusters that are in close proximity to each other spatially. This helps the expert 38 understand the defects represented by and present in the training data.
연결 트리들을 개발함으로써 트레이닝 이미지들을 클러스터링한 후에, 등급화 도구(37)는 사용자 인터페이스를 제공하며, 이에 의해 클러스터링이 시각적으로 불합격인 경우에 클러스터를 시각화하고 이미지를 재할당하는 기회가 전문가에게 주어진다(67). 이어서, 사용자는 각각의 이미지를 독립적으로 라벨링하는 것이 아니라 이미지의 각각의 클러스터에 전문 등급을 할당하며(68), 등급화 도구(37)는 이들 전문 등급을 추가의 사용자 상호작용이 필요 없이 이미지의 나머지 세트에 전파함으로써, 전체 데이터세트에 대한 전문 등급이 얻어진다(69). 즉, 등급화 도구(37)는 본 명세서에 기술된 알고리즘을 적용하여 트레이닝 이미지의 전체 데이터세트에 전문 등급을 자동으로 할당한다. 다시 말하면, 전문가(38)는 등급화 도구(37)에 의해 제공되는 사용자 인터페이스를 사용하여, 각각의 식별된 결함 클래스 내에서, 서브세트 S1 내의 이미지 클러스터의 전부(또는 일부)에 전문 등급만 할당하면 된다. 등급화 도구(37)는 서브세트 S1 내에 있지 않은 이미지를 포함하는, 라벨링되지 않은 나머지 이미지에 이들 전문 등급을 자동으로 전파한다.After clustering the training images by developing the connection trees, the grading tool 37 provides a user interface, thereby giving the expert the opportunity to visualize the cluster and reallocate the image if the clustering is visually rejected ( 67). The user then assigns a professional rating to each cluster of images rather than labeling each image independently (68), and the grading tool 37 assigns these professional ratings to the image without requiring additional user interaction. By propagating to the rest of the set, a full rating for the entire dataset is obtained (69). That is, the grading tool 37 applies the algorithm described herein to automatically assign a professional grade to the entire dataset of the training image. In other words, the expert 38 uses the user interface provided by the grading tool 37 to, within each identified defect class, only expert ratings on all (or some) of the image clusters in subset S 1 . You assign it. The grading tool 37 automatically propagates these full ratings to the remaining unlabeled images, including images that are not in subset S 1 .
라벨링되지 않은 각각의 이미지 Iu에 대하여, 이 이미지로부터 라벨링된 각각의 이미지 Il까지의(즉, 전문 등급이 할당된 서브세트 S1 내의 각각의 이미지까지의) 쌍대 거리를, 등급화 도구(37)가 거리 함수(수학식 4)를 사용하여 계산한다. 이어서, 하기 수학식에 따라 이들 거리를 쌍대 친화도로 전환한다:For each unlabeled image I u , the pairwise distance from this image to each labeled image I l (ie, to each image in subset S 1 to which the professional grade is assigned) is determined by the grading tool ( 37) is calculated using the distance function (Equation 4). The distances are then converted into dual affinity according to the following equation:

여기서 대역폭(bandwidth) 파라미터 σ는 거리 ![]()
![]()
![]()
![]()
분량 ![]()
![]()
![]()
![]()
최종적으로, 이 결함 클래스 내에서 전문 등급 e에 속하는 이미지 Iu의 확률은 하기와 같이 계산된다:Finally, the probability of the image I u belonging to the professional class e within this defect class is calculated as follows:
![]()
![]()
여기서 ![]()
![]()
![]()
![]()
![]()
![]()
도 4로 돌아가면, 이미지들의 각각의 클러스터에 전문가(38)가 전문 등급을 할당하고 나머지 이미지들에 라벨이 자동으로 전파된 후에, 등급화 도구(37)는 전문가가 트레이닝 데이터(35)를 탐색하게 하고 필요한 경우에 라벨 할당을 조정하게 하여(70) 궁극적으로 트레이닝 데이터(35)의 전체 세트에 대해 전문 등급들을 생성시키게 한다(71). 이러한 방식으로, 등급화 도구(37)는 자동 서브세트 선택 및 트레이닝 데이터(35) 내의 이미지의 더 방대한 세트에 대한 전문 등급의 후속 전파를 위한 기능을 제공한다. 결과적으로, 이미지가 현저한 중복을 포함하더라도 등급화 도구(37)는 전문가(38)가 방대한 데이터세트(예를 들어, 대략 수만개의 이미지)에 등급을 할당하고 용이하게 취급하는 것을 가능하게 할 수 있다.4, after the expert 38 assigns the expert grade to each cluster of images and the label is automatically propagated to the remaining images, the grading tool 37 retrieves the
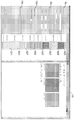
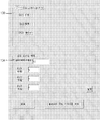
도 5는 등급화 도구(37)의 사용자 인터페이스에 의해 제공되는 예시적인 윈도우(80)의 도시이며, 이에 의해 전문가(38)는 파라미터를 구성하여 클러스터링 공정을 제어한다. 이러한 예에서, 윈도우(80)는 전문가(38)가 트레이닝 이미지의 디렉토리, 트레이닝 이미지의 체제, 결과 출력 및 등급화 도구가 이미지의 새로운 클러스터링을 수행해야 하는지 또는 판독이 이전의 클러스터링 공정으로부터의 결과를 입력하는 것인지를 지시하는 선택을 위한 디렉토리를 특정하는 입력 메커니즘을 포함한다.5 is an illustration of an
게다가, 전문가(38)는 클러스터링 공정을 제어하기 위한 소정의 파라미터를 특정할 수 있다. 특히, 윈도우(80)는 등급화 도구(37)가 그 안에 트레이닝 이미지를 체계화하고자 하는 클러스터들의 수를 특정하기 위한 입력 필드를 포함한다. 전술된 바와 같이, 등급화 도구(37)는 사용자에 의해 특정된 클러스터들의 원하는 수를 이용하여, 제1 연결 트리를 생성시킴에 있어서 특정된 클러스터들의 수를 충족하거나 초과하는 단말 노드들의 수를 갖도록 클러스터링 공정을 단축한다. 게다가, 전문가(38)는 트레이닝 데이터(35)가 방대한 데이터세트인지, 그리고 본 명세서에 기술된 바와 같이 등급화 도구(37)가 클러스터링을 위한 이미지의 대표적 서브세트를 자동으로 식별해야 하는지를 특정할 수 있다. 이 경우에, 전문가(38)는 또한 대표적 서브세트 S0의 크기, 즉, 포함할 최고 분산을 갖는 이미지들의 수 N1(도 5에서 150) 및 나머지 이미지로부터 무작위로 선택할 이미지들의 수 N2(도 5에서 50)를 제어하기 위한 파라미터를 특정할 수 있다. 이러한 N1 + N2 이미지의 세트는 초기 서브세트 S0을 포함한다. 게다가, 전문가(38)는 등급화 도구(37)가 대표적 세트 S1 내에 범위외 값을 포함할 것인지를 특정할 수 있으며, 그렇다면 각각의 이미지에 대한 특징부 공간 내에서 조사할 최근방 이웃들의 수 k(kNN)(도 5에서 5) 및 이미지를 범위외 값으로서 특성화하기 위한 임계치 Td(도 5에서 1.0)를 특정할 수 있다.In addition, the expert 38 may specify certain parameters for controlling the clustering process. In particular, the
도 6은 클러스터링 작동의 결과를 표시하기 위하여 등급화 도구(37)에 의해 제공되는 예시적인 클러스터 관찰 윈도우(90)의 도시이다. 보이는 바와 같이, 이미지 클러스터는 2개의 별도 패널(91A, 91B)들 내에 시각적으로 표시되며, 이를 통해 사용자는 내장된 하이퍼링크를 사용하여 클러스터를 검색하고 탐색할 수 있다. 좌측 패널(91A)은 각각의 클러스터(92A 내지 92N)로부터 단일 대표적(중심) 이미지를 표시함으로써 클러스터링 결과의 고수준 개요를 제공한다. 각각의 클러스터에 대하여, 패널(91A)은 대표적 이미지, 클러스터와 연계된 식별자, 및 괄호 안에 그 클러스터에 할당된 이미지들의 수를 표시한다. 예를 들어, 클러스터(92A)는 "10"의 식별자를 가지며 3개의 이미지들이 그 클러스터에 할당되었다. 등급화 도구(37)는 스크롤이 가능한 패널(91A) 내에 상기 제2 병합식 계층형 연결 트리에 따라 클러스터(94A 내지 94N)를 배열하여 유사한 이미지를 포함하는 클러스터가 패널 내에서 서로 아주 근접하여 위치되도록 한다. 다시 말하면, 등급화 도구(37)는 스크롤이 가능한 패널(91A) 내에 제2 병합식 계층형 연결 트리의 단말 노드에 따라 클러스터를 배열할 수 있다.6 is an illustration of an exemplary
더욱 상세하게 탐색하기 위하여, 전문가(38)는 이어서 임의의 클러스터(92)에 대한 대표적 이미지 또는 식별자를 선택(예를 들어, 클릭)하여 그 안에 포함된 이미지를 우측 패널(91B) 내에서 볼 수 있다. 도 6의 예에서, 전문가(38)는 검토를 위해 클러스터(92A)(즉, 식별자 "10"을 갖는 클러스터)를 선택하였다. 이러한 예에서, 패널(91B)은 클러스터에 할당되고 모두 서로 강력한 유사성을 지닌 3개의 이미지들을 나타내며, 이는 클러스터링 알고리즘이 그들을 적절하게 그룹화하였음을 나타낸다. 패널(91A)에 의해 제공되는 바와 같이 서브세트 S1 내의 이미지들의 그룹화 및 오더링으로 인하여, 전문가(28)는 클러스터링된 트레이닝 데이터(35)를 매우 직관적인 방식으로 탐색할 수 있다. 이는 수동 검토 및 라벨 할당을 위해 사용자에게 다량의 체계화되지 않은 이미지들이 단순히 제공될 수 있는 다른 기술에 비해 유리할 수 있다. 본 명세서에 기술된 클러스터링 및 시각화 역량은 전문가(38)를 위해 데이터 탐색 작업을 단순화할 수 있으며, 전문가가 대표적 트레이닝 데이터 내에 존재하는 결함의 유형을 신속하게 식별하는 것을 가능하게 한다.To explore in more detail, the expert 38 can then select (eg, click) a representative image or identifier for any cluster 92 to view the images contained therein within the right panel 91B. have. In the example of FIG. 6, expert 38 has selected
도 6에 나타낸 바와 같이, 클러스터 관찰 윈도우(90)는 입력 구역(96)을 포함하며, 이를 이용하여 전문가(38)는, 이미지를 상이한 클러스터 또는 새로운 클러스터로 이동시키는 능력을 포함하여, 개별적인 이미지의 클러스터 할당을 수정하기 위해 상호작용한다. 몇몇 경우들에서, 등급화 도구(37)는 이미지가 상이한 클러스터에 재할당되어야 하는 것을 사용자가 지시할 때를 기록하고, 이 정보를 이용하여 이 새로운 입력을 기반으로 클러스터링을 자동으로 업데이트한다. 예를 들어, 등급화 도구(37)는 이동된 이미지와 유사한 원래의 클러스터 내의 이미지들을 자동으로 결정할 수 있으며, 또한 이 결정을 기반으로 이들 이미지들을 새로운 클러스터로 이동시킨다. 게다가, 입력 구역(98)은, 2개의 클러스터를 합병하는 능력, 및 표시 순서의 상이한 위치로 클러스터를 물리적으로 이동시키는 능력을 포함하여, 사용자가 클러스터 자체와 상호작용하는 것을 가능하게 한다. 등급화 도구(37)는 클러스터 관찰 윈도우(90) 내의 디스플레이 패널(91A, 91B)을 실시간으로 자동 업데이트하여 클러스터 할당 중에 생긴 변화를 반영한다. 이러한 방식으로, 등급화 도구(37)는 전문가(38)가 트레이닝 데이터(35) 내의 대표적 이미지의 그룹화 또는 할당의 임의의 유형에 관한 최종 결정(final say)을 가질 수 있도록 하는 방식으로 사용될 수 있다. 궁극적으로 클러스터링 및 오더링 작동의 목적은 트레이닝 데이터를 시각화하고 등급화하는 향상된 능력을 제공하는 것이므로, 이는 또한 시각화의 관점에서 유연한 추가 수단을 제공한다.As shown in FIG. 6, the
게다가, 클러스터 관찰 윈도우(90)는 트레이닝 데이터(35) 내에 존재하는 결함 클래스들의 수를 정의하기 위한 입력 구역(100)을 포함한다. 클러스터 관찰 윈도우(90)는 또한, 이미지에 전문 등급을 할당하기 위한 입력 구역(104)을 포함한다. 각각의 입력 구역(100, 102)은 하기에 추가로 상세히 논의된다.In addition, the
도 7은 관찰 윈도우(90)의 입력 구역(100)을 추가로 상세히 나타낸다. 이러한 예에서, 전문가(38)는 클러스터 관찰 윈도우(90)를 통한 클러스터링된 트레이닝 데이터(35)의 검토 및 탐색을 기반으로 트레이닝 데이터 내에 3개의 결함 클래스가 존재함을 지시하였다. 도 8에 나타낸 바와 같이, 일단 전문가(38)가 결함 클래스들의 수를 설정하면, 클러스터 관찰 윈도우(90)는 다른 메뉴(102)를 동일한 위치에 제공하여 사용자가 결함 클래스들의 명칭들을 입력할 수 있도록 하며, 이는 그들을 식별하기 위한 의미있는 방식을 제공한다. 도 8의 예에서, 전문가(38)는 트레이닝 데이터(35) 내에 식별된 결함 클래스들의 3개 유형들에 대해 "채터", "얼룩", 및 "줄무늬"의 명칭을 입력하였다. 대표적 트레이닝 데이터에 대한 결함 클래스들의 수 및 각각의 결함 클래스에 대한 명칭을 할당하는 동안 클러스터링된 트레이닝 데이터를 검색하고 시각화하는 선택사항을 전문가가 여전히 갖도록, 클러스터 관찰 윈도우(90) 내의 디스플레이 패널(91A, 91B)은 전문가(38)가 입력 구역(100) 및 메뉴(102)와 상호작용하는 동안 개방된 채로 유지된다.7 further illustrates the
도 9는 트레이닝 데이터(35)의 대표적 서브세트 S1 내의 이미지 클러스터에 전문 등급 라벨을 할당하기 위한 클러스터 관찰 윈도우(90)의 입력 구역(104)을 나타낸다. 일단 전문가(38)가 입력 구역(100) 및 메뉴(102)와 상호작용하여 데이터 내에 존재하는 결함 클래스들의 수 및 명칭을 할당하였으면, 등급화 도구(37)는 전문가가 입력 구역(104)과 상호작용하여 트레이닝 데이터(35)의 이미지에 전문 등급을 할당하게 한다. 이 작업을 크게 단순화하기 위하여, 등급화 도구(37)는 전문가(38)가 개별적인 이미지에 라벨링해야 하는 대신에(이는 상당히 지루하고 오차가 발생하기 쉬울 수 있음), 전체 클러스터에 등급 라벨을 할당하게 한다. 게다가, 전문가(38)는 어떠한 클러스터도 라벨링하지 않는 선택사항을 갖는다. 후속 처리에서, 서브세트 S1 내에 있지 않은 나머지 이미지에 라벨이 전파될 때, 라벨링되지 않은 임의의 클러스터 내의 이미지에도 라벨이 전파된다. 도 9에서 알 수 있는 바와 같이, 클러스터 관찰 윈도우(90)는 전문가(38)가 클러스터 내의 모든 결함 클래스들을 동시에 라벨링하게 한다. 예를 들어, 도 9에서, 전문가(38)는 트레이닝 데이터의 클러스터 "13" 내에서 결함 "채터", "얼룩" 및 "줄무늬"에 대한 "5", "1" 및 "1"의 특정 라벨들을 갖는다. 추가로, 일례에서는, 할당될 수 있는 전문 등급의 유형에 등급화 도구(37)가 제한을 두지 않는다. 라벨은 여기에 나타낸 "1" 및 "5" 라벨과 같이 수치화될 수도 있거나, 이들은 문자형 "합격" 및 "불합격" 라벨일 수도 있을 것이다. 일단 클러스터에 전문 등급이 할당되었으면, 패널 디스플레이(91)는 실시간으로 업데이트되어 이들 변화를 반영한다.9 shows a representative subset S 1 of
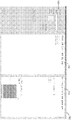
도 10은 등급화 도구(37)에 의해 제공되는 최종 전문 등급 관찰 윈도우(110)의 도시이며, 이를 이용하여 전문가(38)는 각각의 결함 클래스 내의 전문 등급을 시각화하고 수정할 수 있다. 전문 등급 관찰 윈도우(110)는 모든 이미지에 대해 최종 전문 등급 라벨을 표시한다. 도 10에 나타낸 바와 같이, 전문 등급 관찰 윈도우(110)는 2개의 병렬 HTML 디스플레이 패널(112, 114)들을 포함하며, 이를 통해 사용자는 내장된 하이퍼링크를 사용하여 페이지 전반을 검색함으로써 결과를 시각화할 수 있다. 전문 등급 관찰 윈도우(110)는 또한 전문 등급을 수정하기 위한 메뉴 선택사항(120)을 좌측에 포함한다.10 is an illustration of the final expert
시각화의 관점에서, 전문 등급 관찰 윈도우(110)는 직관적이고 전문가(38) 또는 다른 사용자가 이해하기 용이한 방식으로 라벨링 공정의 결과를 표시한다. 일례로서, 전문 등급 관찰 윈도우(110)는 별도의 HTML 페이지 내의 각각의 결함 클래스에 대한 결과를 표시한다. 각각의 결함 클래스에서, 각각의 가능한 전문 등급을 가진 이미지를 그 결함 클래스에 대한 HTML 페이지의 별도 부분으로서 패널(114) 내에 나타낸다. 예를 들어, 도 9에 나타낸 바와 같이, HTML 패널(112)은 결함 클래스를 열거한다. 결함 클래스 중 하나의 선택시에, HTML 패널(114)은 각각의 가능한 전문 등급에 대한 이미지를 나타낸다. 이는 이미지에 할당된 바와 같은 그 결함의 상이한 라벨을 기반으로 전문가(38)가 클러스터 의존적 방식으로 결함을 관찰하는 것을 가능하게 한다. 도 9의 예에서, 소프트웨어 도구는 페이지의 상단에 "1"의 라벨을 받은 이미지로 시작하여 "결함 클래스 1 (채터)" 내의 결과를 제공한다. 결함 클래스에 이용된 각각의 라벨 및, 그 라벨에 대하여, 그 라벨로 할당된 각각의 이미지를 전문가(38)가 검토할 수 있도록, HTML 패널(114)은 수직으로 스크롤이 가능하다.In terms of visualization, the expert
데이터를 이해하는 사용자의 능력을 추가로 향상시키기 위하여, 등급화 도구(37)는 다른 클러스터링 작동을 수행하여 주어진 결함 클래스 내의 각각의 가능한 전문 등급 내에서 이미지를 유사한 이미지의 상대적으로 작은 그룹으로 클러스터링한다. 등급화 도구(37)는 각각의 클러스터의 중심 이미지만을 도시하는 현재 선택된 결함 클래스(예컨대, "결함 클래스 1(채터)")에 대한 HTML 패널(114)을 생성한다. 이것은 작은 관리가능한 수의 이미지들만을 디스플레이 상에서 유지하는 것을 돕는다. 예를 들어, "채터" 결함 클래스 내의 라벨 "1"에 대해, 등급화 도구(37)는 HTML 패널(114)을 생성시켜 중심 이미지(116)를 표시했다. 전문가(38)는 각각의 클러스터에 대한 중심 이미지를 클릭하여, 그 클러스터 내에 포함된 모든 이미지가 표시되는 다른 HTML 페이지를 검색할 수 있다.In order to further enhance the user's ability to understand the data, the grading tool 37 performs different clustering operations to cluster the image into relatively small groups of similar images within each possible professional grade within a given defect class. . The grading tool 37 generates an
HMTL 패널(114)을 생성시키기 위한 클러스터링 작동에 관하여, 등급화 도구(37)는 각각의 가능한 전문 등급 내에서 모든 결함 클래스에 대해 별도의 클러스터링 계산을 수행한다. 즉, 기술된 바와 같이, 모든 결함 클래스 내에서 각각의 이미지는 전문 등급을 받는다. 다시 말하면, 각각의 결함 클래스는 모든 이미지를 포함하지만, 일반적으로 이미지는 각각의 결함 클래스 내에서 가능한 전문 등급들 사이에 상이하게 분포한다. 예를 들어, 소정의 이미지는 결함 클래스 "채터" 내에서 "1"의 전문 등급을 가질 수 있으나, 결함 클래스 "얼룩" 내에서는 "5"의 전문 등급을 가질 수 있다. 등급화 도구(37)는 별도의 클러스터링을 수행하여 각각의 결함 클래스의 각각의 라벨에 대해 독립적인 연결 트리를 계산한다. 일례로서, 등급화 도구(37)는 결함 클래스 "채터" 내에서 전문 등급 "1"을 가진 이미지 및 전문 등급 "5"를 가진 것들에 대해 클러스터링을 계산할 수 있으며, 다른 결함 클래스 내에서도 마찬가지이다.Regarding the clustering operation to generate the
예시적인 일 실시예에서, 클러스터들은 다음과 같이 계산된다. 결함 클래스 c 내에서 전문 등급 e를 가진 이미지들의 세트를 ![]()
![]()
![]()
![]()
![]()
![]()
![]()
![]()
![]()
![]()
![]()
![]()
![]()
![]()
![]()
![]()
![]()
![]()
![]()
![]()
![]()
![]()
전문 등급 관찰 윈도우(110)는 또한, 이미지 명칭을 입력함으로써 임의의 이미지에 대한 전문 등급을 수정하기 위한 좌측의 메뉴 선택사항(120)을 포함한다. 메뉴 선택사항(120)을 사용하여, 사용자는 모든 결함 클래스 내의 이미지의 현재 전문 등급을 관찰함과 더불어 필요한 경우에 그들을 변경하는 것 둘 모두를 할 수 있다.The Expert
등급화 도구(37)에 의해 궁극적으로 생성된 전문 등급(53)들은, 트레이닝 이미지들의 연속 순위를 생성하고 그리고 그들의 불균일성의 심각도를 기반으로 연속 순위 모델(34)을 생성하도록 트레이닝 모듈(41)에 의해 이용될 수 있다. 도 11은 "매니폴드"(116)라고 지칭되는 연속 3차원(3D) 표면을 도시하며, 이를 참조하여 연속 순위 모델(34)을 생성시키기 위해 트레이닝 모듈(41)에 의해 적용되는 알고리즘이 용이하게 이해된다. 각각의 이미지에 연계된 특징부 벡터는 고차원 공간에서 단일한 점이라고 생각할 수 있다. 그러나, 모든 이미지가 동일한 유형의 재료의 이미지가고 동일한 이미지화 조건 및 기하형태 하에서 동일한 이미지화 장치 또는 다른 센서를 이용하여 채취되므로, 자유도의 기본 수(underlying number)는 내장된 특징부 공간의 차원수(dimensionality)보다 낮을 수 있다. 그러므로, 각각의 트레이닝 이미지를 매니폴드(116)(즉, 연속 3D 표면) 또는 매니폴드의 집합 상에 놓인 고차원의 점 중의 하나로서 관찰하는 것이 유용하며, 이는 이 공간 내에 내장되지만, 전체 공간에 비해 낮은 고유 차원수(intrinsic dimensionality)(자유도)를 가질 수 있다. 2차원 물체가 그 안에 내장된 3차원 공간의 단순한 경우에 대하여 도시된 예를 도 11에 나타내지만, 실제로 특징부 벡터의 차원수는 전형적으로 훨씬 더 높다. 고차원 공간 내의 매니폴드 내장에 관한 추가의 예시적인 상세 사항은 문헌[H.S. Seung and Daniel D. Lee, "Cognition: The Manifold Ways of Perception," Science, vol. 290, no. 5500, pp. 2268-2269, Dec. 22, 2000]에 기술되어 있다.The
도 11에 대한 단순한 일례로서, 모든 트레이닝 이미지가 상이한 수준의 웨브-하류측 채터(down-web chatter)를 가진 동일한 웨브 재료를 나타내는 트레이닝 이미지의 세트를 나타낸다. 이러한 단순한 경우에, 각각의 트레이닝 이미지가 다양한 텍스처-관련 특징을 포착하는 고차원 특징부 벡터에 의해 나타내어질 수 있지만, 이 경우에는 채터의 수준에 상응하는 단 하나의 기본 자유도(underlying degree of freedom)만이 이러한 이미지의 세트 내에 존재할 수 있다. 이와 같이, 이들 트레이닝 이미지가 1차원 매니폴드, 예를 들어, 도 11의 고차원 공간 내의 곡선형 경로를 통해 만곡하는 선 상에 놓인 점으로서 관찰될 수 있다.As a simple example for FIG. 11, all training images represent a set of training images representing the same web material with different levels of web-downstream chatter. In this simple case, each training image can be represented by a high-dimensional feature vector that captures a variety of texture-related features, but in this case there is only one underlying degree of freedom corresponding to the level of chatter. Only may be present in this set of images. As such, these training images can be observed as points lying on a line that curves through a one-dimensional manifold, eg, a curved path in the high-dimensional space of FIG. 11.
매니폴드 상의 점으로서의 특징부 벡터의 이러한 표현의 한가지 이점은 트레이닝 모듈(41)의 알고리즘이 트레이닝 데이터 내의 이러한 기본 구조를 탐색하여 그 안에 포함된 가장 관련이 있고 유용한 정보만을 이용한다는 것이다. 추가로, 상대적으로 적은 고차원 특징부 벡터로부터 학습하는 경우에는, 더 낮은 차원의 공간 내에 내장되는 것이 유용할 수 있다. 매니폴드 내장을 수행하기 위한 알고리즘이 존재하며, 이는 기본 구조를 보존하는 중에 고차원 데이터의 저차원 표현을 회복하는 작업에 대해 본 명세서에서 사용하는 용어이다. 이러한 알고리즘의 일부 예는 자기조직화(코호넨(Kohonen)) 맵, 다차원 척도화(Multi-Dimensional Scaling), 아이소맵(Isomap), 및 국소-선형 내장(Locally-Linear Embedding)을 포함한다. 하기에 추가로 상세하게 기술되는 바와 같이, 하나의 예시적 알고리즘은 확산 맵(Diffusion Map)이다. 확산 맵에 관한 추가의 상세 사항을 문헌[S. Lafon and A.B. Lee, "Diffusion Maps and Coarse-Graining: A Unified Framework for Dimensionality Reduction, Graph Partitioning, and Data Set Parameterization," IEEE Transactions on Pattern Analysis and Machine Intelligence, vol. 28, no. 9, pp.1393-1403, Sep. 2006]에서 볼 수 있다.One advantage of this representation of the feature vector as a point on the manifold is that the algorithm of the
각각의 트레이닝 이미지의 표현이 특징부 공간 내의 매니폴드 상에 점으로서 주어지면, 트레이닝 모듈(41)의 알고리즘은 특징부 공간 주위에서 이산적 무작위 행보(discrete random walk)를 수행한다. 이러한 무작위 행보 동안에, 각각의 시간 단계에 있어서, 무작위 행보체(random walker)는 매니폴드를 전혀 이탈하지 않으면서 매니폴드 상의 한 점으로부터 다른 점으로 이동할 수 있다. 이러한 맥락에서, 알고리즘은 매니폴드 상의 한 점으로부터 다른 모든 점으로 이행하는 확률을 계산한다. 일반적으로, 이러한 이행 확률은 전형적으로 매니폴드 내의 가까운 점에서 더 높고 먼 점에서 더 낮다. 그러나, 알고리즘은 전문 등급을 고려하여, 상이한 이산 라벨들을 가진 점들 사이의 이행에 페널티를 부과한다. 이어서, 이들 이행 확률을 사용하여 각각의 점으로부터 주변의 모든 점으로 전문 등급을 전파함으로써, 모든 점이 다른 점으로부터의 이산 라벨의 일부 분율로 마감되며, 이는 본 발명자들이 연속 표면을 따라 트레이닝 이미지들 중 하나에 상응하는 각각의 점에 대한 연속 심각도값을 계산하게 한다. 추출된 특징부 및 제공된 (전문) 순위 둘 모두를 이 단계에서 탐색한다.Given a representation of each training image as a point on a manifold in the feature space, the algorithm of the
도 12는, 트레이닝 모듈(41)이 특징부 벡터를 처리하여 트레이닝 이미지들의 연속 순위를 학습하고 연속 순위 모델(34)을 생성시키는 예시적인 공정을 더욱 상세하게 나타내는 흐름도이다.12 is a flow diagram illustrating in more detail an exemplary process by which
먼저, 트레이닝 모듈(41)은 크기가 N x N인 친화도 매트릭스 K를 계산하며, 여기서 N은 트레이닝 샘플의 수이다(단계(120)). 예를 들어, N개의 트레이닝 이미지들의 연속 순위를 학습하기 위하여, 특징부 벡터들의 세트를 상응하는 전문 등급 ![]()
![]()
![]()
![]()
![]()
![]()
![]()
![]()
친화도 매트릭스는 특징부 공간 내의 각 쌍의 트레이닝 샘플들 사이의 유사성의 측정값을 제공하며, 수학식 8과는 상이한 다른 것들, 예를 들어 다항식을 사용할 수 있다. 대역폭(bandwidth) 파라미터 σ는 한 쌍의 점들 사이의 거리가 증가함에 따라 얼마나 신속하게 지수함수가 감쇠하는지를 정의한다. 실제로, 국소 파라미터 σ는, 그의 k-최근방 이웃까지의 중앙값 거리와 같이 발견법(heuristic)에 따라 각각의 트레이닝 샘플에 대해 추산된다. 이 경우에, 수학식 8의 분모는 샘플 xi 및 xj에 상응하는 국소 대역폭의 곱이 된다.The affinity matrix provides a measure of similarity between each pair of training samples in the feature space, and other than
친화도 매트릭스에 사용되는 거리는 수학식 8의 예에서와 같이 단순히 유클리드 거리(Euclidean distance)이거나, 공분산 거리 또는 쿨백-라이블러 거리(Kullback-Leibler distance)와 같이 특징부에 따라 더 복잡한 것들일 수 있다.The distances used in the affinity matrix can be simply Euclidean distance, as in the example of
그 다음에, 친화도 매트릭스로부터, 하기 수학식에 따라 이행 확률을 계산할 수 있다(단계 122):Then, from the affinity matrix, the transition probability can be calculated according to the following equation (step 122):
![]()
![]()
이는 점들 사이의 친화도만을 기반으로 하는, 특징부 공간 내의 무작위 행보 상에서 xi로부터 xj로 이행할 확률에 상응한다. 이는 친화도 매트릭스 K의 정규화한 것으로서, 그것의 행이 타당한 확률 분포임을(즉, 1로 합산됨) 보장한다.This corresponds to the probability of transitioning from x i to x j on a random walk in the feature space based only on the affinity between the points. This is a normalization of the affinity matrix K, which ensures that its row is a reasonable probability distribution (ie, summed to 1).
전문 등급에 의해 주어진 이산 라벨을 감안하기 위하여, 트레이닝 모듈(41)은 xi로부터 xj로 이행할 사전 확률을 계산한다:To take into account the discrete labels given by the professional grade, the
![]()
![]()
여기서 σp는 이러한 사전 확률 항에 대한 대역폭 파라미터이다(단계(123)). pb(i,j)에 대한 표현은 더 먼 부분인 전문 등급에 더 무거운 페널티를 부과하므로, 이산 라벨에 할당된 수치값의 선택이 이러한 맥락에서 중요하다.Where σ p is the bandwidth parameter for this prior probability term (step 123). Since the expression for p b (i, j) imposes a heavier penalty on the farther part of the professional grade, the choice of numerical values assigned to discrete labels is important in this context.
이어서, 트레이닝 모듈(41)은 pa(i,j) 및 pb(i,j)의 곱에 의해 각 쌍의 트레이닝 샘플에 대한 전체 이행 확률을 계산한다(단계(124)에서):The
![]()
![]()
자동 확산 매트릭스의 구성요소 및 전문 등급 위반에 대한 페널티를 다른 방식으로 조합할 수 있다. 종합적으로, 전체 이행 확률 p(i,j)는 매트릭스 P를 형성한다. P 내의 각각의 성분은 하나의 시간 단계에서 상응하는 점들의 쌍 사이의 이행 확률을 나타낸다.The components of the automatic spreading matrix and the penalty for professional grade violations can be combined in different ways. Overall, the overall transition probability p (i, j) forms the matrix P. Each component in P represents the probability of transition between a pair of corresponding points in one time step.
트레이닝 모듈(41)은 매트릭스 P를 거듭제곱 t로 상승시킴으로써 t 시간 단계에 대한 무작위 행보 이행 확률을 전파한다(단계(125)):
![]()
![]()
여기서 Pt(i,j)는 t 시간 단계에서 xi로부터 xj로 이행할 확률에 상응한다. 시간 단계 t의 수는 물리적 의미를 갖지 않으나, 사용자에 의해 소프트웨어 적용 중에 설정될 수 있는 구성가능한 파라미터이다.Where P t (i, j) corresponds to the probability of transitioning from x i to x j in the t time step. The number of time steps t has no physical meaning but is a configurable parameter that can be set during software application by the user.
이들 이행 확률을 기반으로, 트레이닝 모듈(41)은 확산 거리를 계산한다(단계(126)). 이러한 각각의 거리는 매니폴드 상의 각 쌍의 점들 사이의 비유사성의 측정값이다. 2개의 점들의 이행 확률의 분포가 유사하다면, 더 낮은 확산 거리가 그들에게 할당된다(즉, 확산 공간 내에서 서로 더 가깝다고 표현함). 다시 말하면, 그들의 매트릭스의 각 행 Pt가 서로 유사하다면, 2개의 점들에 더 낮은 확산 거리가 할당된다. 일례에서, 확산 거리의 제곱은 하기의 균등한 표현에 따라 계산된다:Based on these transition probabilities,
![]()
![]()
여기서 ![]()
![]()
샘플들의 쌍 사이의 비유사성에 비례하는 이들 확산 거리는, 트레이닝 모듈(41)에 의해 하기 수학식에 따라 유사성에 비례하는 가중치로 전환된다(단계(129)):These diffusion distances, which are proportional to the dissimilarity between the pairs of samples, are converted by the
![]()
![]()
여기서 σw는 다른 대역폭 파라미터이고, η는 단순히 정규화 상수로서 가중치 매트릭스 W의 행들이 1로 합산됨을 보장한다. 최종적으로, 트레이닝 모듈(41)은 하기 수학식에 의해 각각의 트레이닝 샘플 xi에 대한 불균일성 심각도 순위값을 계산함으로써 연속 순위 모델(34)("모델(34)")을 생성시킨다(단계(130)):Where σ w is another bandwidth parameter and η is simply a normalization constant to ensure that the rows of the weight matrix W sum to one. Finally,
![]()
![]()
얻어진 순위값 ri는 모든 트레이닝 이미지들의 전문 등급들의 가중 평균이다. 그러나, 전문 등급들이 고도로 이산적일 수 있어도(예를 들어, "1", "3", 또는 "5"), 순위값은 연속 미세 척도 상에 있다. 또한, 전체적으로 연속 순위를 제공하도록 사용자 인터페이스에 의해 알고리즘 파라미터를 조정할 수 있다. 수학식 15)의 가중치는 전문 순위와의 자동 이미지/특징부 비교를 조합하는 확산 거리 공정에 의해 유도된다. 정규화 가중(normalized weighting)의 다른 방식, 예를 들어, 지수 가중 함수를 고려할 수 있다.The rank value r i obtained is the weighted average of the professional grades of all training images. However, although professional grades may be highly discrete (eg, "1", "3", or "5"), the rank value is on a continuous fine scale. In addition, algorithm parameters may be adjusted by the user interface to provide a continuous ranking as a whole. The weight in equation (15) is derived by a diffusion distance process that combines automatic image / feature comparisons with full rank. Other ways of normalized weighting can be considered, for example, exponential weighting functions.
도 12에 대한 상기 공정은 전문 등급 내의 부정확한 라벨을 무시할 수 있다. 즉, 전문가가 실수로 소정 이미지에, 예를 들어 "5" 대신에 "1"로 라벨링했다면, 본 공정은 여전히 이 점에, 다른 "5" 점들에 더 가까운 순위값을 할당할 수 있을 것이다. 이는 주로 수학식 14의 곱의 상이한 2개의 항들의 영향에 기인한다. 두번째 항은 이산 라벨을 감안하는 반면에, 첫번째 항은 매니폴드 상의 데이터의 고유 구조만을 기반으로 한다. 이들 항의 상대적 효과는 그들 각각의 대역폭 파라미터에 의해 제어된다. σp가 큰 값으로 설정된다면, 사전 확률 항은 이행 확률에 아주 작은 영향을 가질 것이다.The process for FIG. 12 may ignore inaccurate labels within the professional grade. In other words, if the expert accidentally labeled a given image as "1" instead of "5", for example, the process would still be able to assign this point a ranking value closer to the other "5" points. This is mainly due to the influence of two different terms of the product of equation (14). The second term takes into account discrete labels, while the first term is based solely on the unique structure of the data on the manifold. The relative effects of these terms are controlled by their respective bandwidth parameters. If σ p is set to a large value, the prior probability term will have a very small impact on the transition probability.
더욱이, 다수의 전문가들을 또한 조합할 수 있다. 이러한 경우에, 트레이닝 모듈(41)은 각자의 전문가에 대해 친화도 매트릭스의 계산에 추가의 가중치를 이용한다. 상이한 전문가들의 신뢰도를 동일한 양식으로 평가할 수 있다.Moreover, multiple experts can also be combined. In this case,
도 13은 차트화 모듈(39)이 실시간으로 연속 순위 모델(34)("모델(34)")을 이용하여 불균일성 결함의 존재를 검출하고 각각의 결함에 대한 심각도 수준의 연속 차트화를 제공하는 예시적인 공정을 더욱 상세하게 나타내는 흐름도이다.FIG. 13 shows that the
제조되는 웨브의 새로운 이미지가 포착됨에 따라(130), 트레이닝 이미지에서와 동일한 방식으로 특징부를 추출한다(132). 구체적으로, 트레이닝 샘플의 특징부 벡터 ![]()
![]()
![]()
![]()
![]()
![]()
초기에, 차트화 모듈(39)은 주어진 결함에 대해 트레이닝 샘플 ![]()
![]()
![]()
![]()
![]()
![]()
차트화 모듈(39)은 인터페이스를 제공할 수 있으며, 이에 의해 사용자는 최근방 이웃의 수, k를 구성가능한 파라미터로서 특정할 수 있다. 도 14는 2차원 특징부 공간 내에서 k-최근방 이웃을 찾는 논리적 표현을 제공하는 그래프이다. 이러한 예에서는, 특징부 공간 내의 쿼리 점(135)에 대해 6개의 최근방 이웃이 식별된다.
몇몇 기술을 사용하여 k-최근방 이웃의 위치를 정할 수 있다. 하나의 기술은 ![]()
![]()
![]()
![]()
더 효율적인 k-최근방 이웃(kNN) 검색을 수행하지만, 전체 검색과 동일한 결과를 여전히 제공하는 하나의 기술은, 먼저 트레이닝 샘플 ![]()
![]()
일단 트레이닝 샘플이 이러한 계층형 볼 트리 내에 조직화되면, 그들을 효율적으로 검색하여 새로운 쿼리 점의 kNN을 정확하게 찾을 수 있다. 이러한 검색을 수행하기 위한 알고리즘은 반복성일 수 있으며, 트레이닝 데이터의 고유 구조를 탐색하여 그것을 효율적으로 검색한다. 예를 들어, 쿼리 점 ![]()
![]()
두번째 예로서, 전체 검색의 결과와 정확하게 동일함이 보장되지는 않지만 유사한 결과를 제공하도록 설계된 근사 kNN 검색을 사용함으로써 추가의 계산 효율을 달성할 수 있다. 하나의 이러한 접근 방법은 국소성-감지 해싱(LSH: Locality-Sensitive Hashing)이다. 앞에서와 같이, 신속한 kNN 검색을 가능하게 하기 위하여 차트화 모듈(39)은 트레이닝 샘플을 특징부 공간 내의 그들의 구조를 기반으로 조직화한다. 이 경우에, 트레이닝 샘플을 지표화하는 몇몇 해시 표(hash table)가 형성된다. 각각의 해시 표는, 각각의 샘플에 대한 1차원 표현을 유발하는 트레이닝 샘플의 무작위 투영(random projection)을 취한 후에 이 선을 따라 샘플을 이산 그룹의 세트로 비닝(binning)함으로써 형성된다. 이러한 절차를 반복하여, 몇몇 해시 표를 형성시키고 이들 해시 표를 기반으로 점의 근사 kNN을 높은 확률로 신속하게 찾을 수 있다. 3개 해시 표(140)(그 안에 3개의 트레이닝 샘플(141A, 141B, 및 141C) 및 쿼리 샘플(142) 각각이 해싱됨)의 단순한 경우에 대하여 이것의 도시를 도 15에 나타낸다. 이 경우에, 얻어지는 해시 표의 지표화는 쿼리 샘플의 2개의 최근방-이웃(141A, 141B)의 정확한 식별을 유발한다. 국소성-감지 해싱(LSH)에 관한 추가의 상세 사항은 문헌["Locality-sensitive hashing: A. Andoni and P. Indyk, Near-Optimal Hashing Algorithms for Approximate Nearest Neighbor in High Dimensions," Communications of the ACM, vol. 51, no. 1, pp. 117-122, Jan. 2008]에 기술되어 있다.As a second example, additional computational efficiency can be achieved by using an approximate kNN search that is not guaranteed to be exactly the same as the results of the entire search but designed to provide similar results. One such approach is Locality-Sensitive Hashing (LSH). As before, the charting
도 13의 흐름도로 돌아가면, k-최근방 이웃을 식별한 후에, 차트화 모듈(39)은 쿼리 점을 그의 k-최근방 이웃의 선형 조합으로서 가장 잘 표현하는 쿼리 점에 대한 재건 가중치(reconstruction weight)를 계산한다(136). 가중치는 양성 또는 음성일 수 있으며, 하기의 오차를 최소화함으로써 계산할 수 있다:Returning to the flow chart of FIG. 13, after identifying the k-nearest neighbors, the charting
![]()
![]()
여기서 wi는 재건 가중치이고, Ω는 k-최근방 이웃의 세트이다. 오차 함수(17)는 폐쇄형으로 최소화할 수 있다. 가중치 또한 폐쇄형으로 계산할 수 있다.Where w i is the reconstruction weight and Ω is the set of k-nearest neighbors. The error function 17 can be closed and minimized. The weight can also be calculated closed.
그 다음에, 차트화 모듈(39)은 특정 결함에 대한 쿼리 점의 심각도 순위값을, 그 결함에 대한 그의 k-최근방 이웃의 순위값의 가중 평균으로서 계산한다(138). 일례에서는, 심각도 순위값을 하기와 같이 계산할 수 있다:The
![]()
![]()
앞에서와 같이, 쿼리 점의 불균일성 심각도 순위값은 연속적인 척도 상에 있다. 이러한 접근 방법은, 쿼리 점이 트레이닝 세트 내의 가장 유사한 이미지의 순위값에 가까운 순위값을 받는 것을 가능하게 한다. 최근방-이웃 기술 대신에 다른 표본외(out-of-sample) 기술을 사용할 수 있다는 것이 고려된다.As before, the nonuniformity severity ranking value of a query point is on a continuous scale. This approach allows the query point to receive a ranking value that is close to the ranking value of the most similar image in the training set. It is contemplated that other out-of-sample techniques may be used instead of the nearest-neighbor technique.
최종적으로, 차트화 모듈(39)은 계산된 심각도 순위값을 작업자에게 출력한다(140). 결함에 대한 심각도 순위의 경향을 나타내도록 출력은 차트를 업데이트하는 형태를 취할 수 있거나, 차트화 모듈(39)이 심각도 순위값을 단일 숫자로서 단순히 출력할 수 있다. 예를 들어, 시간이 흐름에 따라 웨브 재료에 대한 불균일 결함의 심각도 수준을 그래프화하도록, 차트화 모듈(39)은 각각의 새로운 이미지의 처리시에 차트를 업데이트할 수 있다. 그 후에, 전산화 검사 시스템 또는 다른 구성요소는 제조 공정을 위한 공정 제어 파라미터에 대한 변화를 특정하는 입력을 사용자로부터 받을 수 있으며, 입력에 반응하여 공정 제어 파라미터를 조정할 수 있다. 부가적으로, 사용자는 결함의 시각화를 향상시키는 이미지들의 필터링된 버전 또는 웨브로부터 포착된 실시간 이미지들을 관찰할 수 있다. 예를 들어, 가보어(Gabor) 필터 또는 다른 처리 필터가 적용될 수 있다. 사용자에게 이용될 수 있는 필터들은 모델을 개발할 때 트레이닝 이미지들로부터 특징부들을 추출하는 데 사용되는 필터(들)를 기반으로 할 수 있다. 이 방식으로, 사용자는 공정 파라미터들을 조절할 수 있으며, 웨브로부터 실시간으로 얻어진 필터링된 이미지들을 관찰함으로써 특정 불균일성 패턴들에 대한 조절의 효과를 관찰할 수 있다.Finally, the charting
도 16은 분석 컴퓨터(28)의 특징부 추출 모듈(43)이 획득 컴퓨터(27)들로부터의 이미지 데이터의 스트림들을 처리하여 웨브 재료(20)의 제조 동안에 어느 이미지 특징부를 실시간으로 이미지 단위로 계산할지를 동적으로 결정하는 동적 시스템 아키텍처의 일례를 나타내는 흐름도이다. 나타낸 바와 같이, 특징부 추출 모듈(43)은 연이어 더 큰 특징부 세트들로부터의 결과들을 사용하여 부가적 특징부 계산들을 트리거링함으로써 "최상의 특징부 세트"를 동적으로 구축한다.FIG. 16 shows that the
웨브 재료의 새로운 이미지를 포착한 후에, 분석 컴퓨터(28)는 에지 트리밍(edge trimming) 또는 편평화(flattening) 등과 같은 일부 예비-처리를 수행할 수 있으며, 디스플레이 표현을 기록하거나 출력하기 위한 일부 소정의 통계를 계산한다. 그 다음에, 특징부 추출 모듈(43)은 제1 트리거 지점(160)에 도달하며, 여기에서는 유동 중의 그 지점까지의 새로운 이미지에 대해 계산된 특징부를 분석함으로써 부가적 처리를 트리거링할 것인지를 결정한다. 예를 들어, 특징부 추출 모듈(43)은 다른 특징부 추출 계산에 비교하여 더 단순하고 빠른 처리로서 작업자에 의해 식별된 기초 특징부 세트를 적용할 수 있다. 트리거 지점(160)에서, 특징부 추출 모듈(43)은 기초 특징부 세트를 사용하여 점 결함을 검출하기 위하여 소위 방울(blob) 레시피를 사용하는 일부 형태학적(방울) 분석을 적용할 수 있다. 동시에, 특징부 추출 모듈(43)은 기초 특징부 세트가 새로운 이미지 내의 불균일성 변동을 신뢰 수준 내에서 평가하기에 충분한 증거를 제공하는지를 결정한다. 예를 들어, 현재 이미지의 분류를 보조하기 위해 더 많은 특징부를 트리거링할 것인지 여부에 관한 결정을 단순 발견법(heuristic)에 따라 내릴 수 있다. 예를 들어, 동적으로 결정된 차선의 특징부 세트의 첨가로부터 불균일성 결함에 대한 이미지의 오분류의 비용의 예상되는 감소가 소정의 임계치를 초과한다면 특징부 추출 모듈이 부가적 특징부의 추출을 트리거링하도록, 단순한 결정 규칙을 설정할 수 있다. 비용의 예상되는 감소, 즉, 필요한 신뢰 수준은, 하기에 추가로 기술되는 바와 같이 학습된 마르코프 모델을 사용하여 결정할 수 있다. 그렇지 않다면, 특징부 추출 모듈(43)은 트리거 지점(162)까지 진행하여 더 복잡한 처리를 연이어 트리거링시킨다. 즉, 제2 트리거 지점(162)에서, 특징부 추출 모듈(43)은 부가적 특징부를 추출하기 위하여 제2 특징부 세트 추출 계산, 예를 들어, 이미지 필터링/주변화(marginalization)를 수행한다. 이러한 제2 특징부 세트 추출 계산은 초기에 수행된 기초 특징부 세트보다 더 복잡하고 계산 집약적일 수 있다. 유동 중의 이 지점까지의 새로운 이미지에 대해 추출된 특징부의 일부 또는 전부를 입력으로 하는 수학적 모델인, 분류기라고도 지칭되는 이미지 레시피를 사용하여, 특징부 추출 모듈(43)이 불균일성의 정도 및 유형의 식별을 재시도한다.After capturing a new image of the web material, the
공정들은 트리거 지점들의 체인으로서 반복하며, 여기서 각각의 트리거 지점에서는 임의의 유형의 불균일성이 이미지 내에서 존재하는 정도를 결정하기 위해 부가적인 더 복잡한 이미지 처리 계산이 필요한지가 결정된다. 각각의 트리거 지점에서의 이러한 결정은 유동 중의 그 지점까지의 새로운 이미지에 대해 계산된 특징부를 기반으로 내려진다.The processes repeat as a chain of trigger points, where each trigger point is determined whether additional more complex image processing calculations are needed to determine the degree to which any type of non-uniformity exists in the image. This determination at each trigger point is made based on the calculated feature for the new image up to that point in the flow.
일부 상황에서는, 웨브 재료로부터 실시간으로 포착된 샘플 이미지가 다중의 패턴을 포함할 수 있다. 도 16에 제시된 공정에 따라, 임의의 불균일성의 가장 정확한 분류를 가능하게 할 것으로 보이는 특징부가 트리거링되도록 특징부 추출 모듈(43)이 작동한다. 전산화 검사 시스템에 의해 이미지화된 모든 개별 샘플들에 대해 이 공정을 수행할 수 있다. 대안적으로, 특징부 추출 모듈(43)은 폴링 스킴(polling scheme) 하에 작동할 수 있으며, 여기에서 공정 구성요소를 트리거링하거나 철회할 필요성을 매 X 샘플 후에 확인한다(여기서, X는 구성가능 파라미터임).In some situations, sample images captured in real time from the web material may include multiple patterns. In accordance with the process shown in FIG. 16, the
일례에서, 특징부 추출 모듈(43)이 동적 트리거링을 위한 제어된 마르코프 모델에 따라 작동하도록 구성된다. 이 실시예에서, 특징부 추출 모듈(43)은 향후의 트리거링 사건에 관련된 임의의 트리거링 단계 t에서 충분한 정보의 요약으로서 작용하는 상태 벡터 x(t)를 정의하는 구성 데이터를 포함한다. 완전성을 위하여, 공정 중의 임의의 지점에서 단일 영상 샘플을 분석하기 위한 트리거링 사건이 일어나며, 여기서 특징부 추출 모듈(43)은 계산할 부가적 특징부를 선택할 기회를 갖는다.In one example, the
일례에서, 상태 벡터는 분류기 패밀리 {Φi(t)}i=1 N을 통해 정의되며, 트리거링 단계 t에서, Φi(t) 는 단계 t에서 트리거링되는 특징부들 및 이전 단계 {Φi(t - 1)}i=1 N에서의 분류기 패밀리에만 의존한다. ROC-최적 분류기 향상 알고리즘을 사용하여 그러한 순서의 분류기 패밀리를 어떻게 구성할 수 있는지의 예가 PCT 국제특허공개 WO/2010/059679호에 기술되어 있다. 이러한 예에서, 이진 분류기는 라벨링된 트레이닝 데이터로부터 학습된 결정 규칙의 세트(즉, 아마도 다중 변수 상의 임계치)로 구성된다. 그러나, 일반적으로 임의의 이산 분류 알고리즘을 사용할 수 있을 것이다. 다른 예는 서포트 벡터 머신(SVM: Support Vector Machine), 로지스틱 회귀분석(Logistic Regression), 또는 결정 트리(Decision Tree)를 포함하였다.In one example, the state vector is defined via the classifier family {Φ i (t)} i = 1 N , in the triggering step t, Φ i (t) is the features triggered in step t and the previous step {Φ i (t -1)} only depends on the classifier family at i = 1 N. An example of how such an ordered classifier family can be constructed using the ROC-Optimized Classifier Enhancement algorithm is described in PCT International Publication WO / 2010/059679. In this example, the binary classifier consists of a set of decision rules learned from labeled training data (ie, perhaps a threshold on multiple variables). In general, however, any discrete classification algorithm may be used. Other examples included a Support Vector Machine (SVM), Logistic Regression, or Decision Tree.
특징부 추출 모듈(43)의 상태 벡터를 정의하는 단계와 관련하여, 단계 t에서의 상태 벡터의 i 번째 요소를 Φi(t)에 의해 할당된 분류로서 취한다(즉, xi(t) = Φi(t)). 일례는 이진 분류이어서, x(t) ![]()
![]()
특징부 추출 모듈(43)의 구성 데이터는 주어진 트리거 사건에서 작용을 결정하는 제어 변수, 즉, 다음에 계산할 것으로 지정된 이미 계산되지 않은 하나 이상의 특징부의 부가적 세트를 포함한다. 논의를 단순화하기 위하여, 각각의 트리거 사건에서 단일 특징부 f가 선택될 것임을 가정한다. 그러나, 그 대신에 복수의 특징부를 나타내도록 f를 취한다면, 알고리즘은 유사하다. 분류기는 현재 샘플 이미지에 대한 판단을 통해 상태 벡터를 결정하며, 그들은 f 및 이전 단계에서의 분류기 패밀리에만 의존하므로, 특징부 추출 모듈(43)은 최적으로 선택될 제어 f에 의해 파라미터화된 조건부 분포 Pf(x(t + 1)|x(t))를 사용하여 현재 상태 벡터를 기반으로 미래 상태 벡터의 예측을 계산한다. 즉, Pf를 마르코프 체인의 이행 함수라고 지칭한다. 제어 전략을 시행하기 위하여 특징부 추출 모듈(43)은 이행 함수를 추산한다. 샘플 이미지의 트레이닝 세트 및 분류기 패밀리의 연계된 순서가 주어지면, 특징부 추출 모듈(43)은 단순 히스토그램 추산 ![]()
![]()
![]()
![]()
![]()
![]()
![]()
![]()
이들 구성요소가 준비되면, 특징부 추출 모듈(43)은 일부 예상 손실을 최소화하는 f를 선택하기 위한 이행 함수 추산을 이용하여 임의의 트리거링 사건에서 f를 동적으로 선택한다. 예를 들어, 값 ca |b가 a를 b로 오분류한 비용으로서 할당된다고 가정(a,b ![]()
![]()
![]()
![]()
일례로서, 특징부 추출 모듈(43)은 모든 트리거 사건들에 대한 총 예상 비용 ∑ tct(x,f)를 최소화하는 제어 전략을 이용한다. 상태 및 제어 공간의 크기가 너무 크지 않다면, 동적 프로그래밍을 통해 이 문제점을 정확히 해결할 수 있다. 대안적으로, 각각의 단계에서, 그리디 발견법을 적용하여, 합리적인 차선 해결책을 찾기 위해 ft * = min fct(x,f)를 선택할 수 있다. 일 실시예에서는, 모든 가능한 트리거 사건 궤도를 오프라인으로 계산하며, 특징부 추출 모듈(43)은 온라인으로 순람표(look-up table)를 사용하도록 프로그래밍된다. 이러한 방식으로, 현재 샘플에 대해 가장 변별적인 특징부를 트리거링하기 위한 제어된 마르코프 체인 모델을 사용하여 각각의 샘플 이미지에 대해 계산되는 특징부의 수를 감소시킬 수 있다. 따라서, 임의의 트리거링 사건에 대응하여 선택된 특징부는 현재 추출된 특징부 및 계산된 이행 함수를 기반으로 동적으로 결정될 수 있다.As an example, the
상기 기술된 기술은, 예를 들어, 단일 분류기 손실 함수의 단순 합계를 사용하는 다중-분류기의 경우까지 용이하게 연장될 수 있다. 또한, ca |b는 상이한 결함 카테고리에 대해 상이하게 척도화되어 상대적 중요성을 포착하거나 특징부 의존성 계산 시간에 상응하는 부가적 인자를 포함할 수 있다. 또한, 상기 기술을 예시적 손실 함수와 관련하여 설명하였다. 다른 가능성이 존재한다. 예를 들어, 클래스 사후 분포(class posterior distribution)의 엔트로피에 페널티를 부과하는 비용 함수 또한 고려할 수 있을 것이다.The technique described above can easily be extended to the case of a multi-classifier, for example using a simple sum of a single classifier loss function. In addition, c a | b may be scaled differently for different defect categories to capture relative importance or include additional factors corresponding to feature dependency calculation times. The technique has also been described in connection with an exemplary loss function. There is another possibility. For example, a cost function that imposes a penalty on the entropy of a class posterior distribution may also be considered.
예Yes
공정 개발 라인으로부터 수집된 필름 이미지들을 사용하여 시뮬레이션 연구를 수행하였다. 완전한 샘플 세트는 다양한 불균일성을 나타낸 8767개의 이미지들을 포함한다. 대략, 불균일성은 7개의 카테고리들로 그룹화될 수 있다. 채터 및 (큰) 얼룩 카테고리에 더하여, 작은 얼룩, 막대 마크/밴딩, 큰 반점(splotch)/워터마크(watermark), 줄무늬, 및 대각선 변동(diagonal variation) 결함이 있다. 각각의 별개의 카테고리에 대하여 분류기 패밀리의 순서를 설계하였다. 즉, 히스토그램 및 가보어 필터 처리를 사용하여 추출된 세트인 26개 통계적 및 스펙트럼 특징부들로부터 선택된 특징부를 임계치화함으로써 불균일성의 존재/부재를 결정하는 7개의 상이한 부울(Boolean) 분류기 패밀리 순서(각각의 불균일성 카테고리에 하나씩)를 설계하였다. 분류기들은 PCT 국제특허공개 WO/2010/059679에 설명된 기술들에 따라 설계되었으며, 완전한 샘플 세트 상에서 트레이닝되었다.Simulation studies were performed using film images collected from the process development line. The complete sample set contains 8767 images representing various nonuniformities. Roughly, the nonuniformity can be grouped into seven categories. In addition to the chatter and (large) blob categories, there are small blobs, bar marks / banding, large spots / watermarks, streaks, and diagonal variation defects. For each distinct category, the order of classifier families was designed. That is, seven different Boolean classifier family sequences (each of which determines the presence / absence of nonuniformity by thresholding a selected feature from 26 statistical and spectral features, a set extracted using histogram and gabor filter processing). One for each non-uniformity category). Classifiers were designed according to the techniques described in PCT International Publication WO / 2010/059679 and trained on a complete sample set.
각각의 분류기 패밀리 순서는 연이어 더 복잡한 분류기(즉, 더 많은 특징부를 사용함)들을 포함하도록 설계되었으며, 여기서 주어진 패밀리 순서 내의 각각의 연이은 분류기는 더 높은 정확도를 가진 그의 목표 카테고리에 불균일성을 할당하는 경향이 있다. 트리거 사건은, 단일 선택된 분류기 패밀리가 그의 순서 내에서 그 다음의 가장 복잡한 분류기 세트로 전진하는 단계로서 정의되었다. 분류기 패밀리 순서 내의 전진을 가능하게 하는 것은 부가적 특징부이므로, 이는 각각의 트리거 사건에서 현재 샘플에 대한 부가적 특징부 세트를 계산하는 단계에 직접 상응한다.Each classifier family order is designed to include more complex classifiers (ie, using more features) in turn, where each successive classifier within a given family order tends to assign non-uniformity to its target category with higher accuracy. have. A trigger event is defined as the step in which a single selected classifier family advances to the next most complex set of classifiers in its order. Since enabling advances in the classifier family order is an additional feature, this corresponds directly to calculating an additional feature set for the current sample in each trigger event.
도 17은 ROC-공간 내의 3-단계 순서의 성능을 나타낸다. 나타낸 바와 같이, 각각의 패밀리(180A, 180B, 180C)는 8개의 분류기들로 구성되었다. 순서가 ROC 플롯의 좌상단 코너에 접근한다는 사실은 각각의 단계에서 성능이 개선됨을 나타낸다(적색, 이어서 녹색, 이어서 청색).17 shows the performance of a three-step sequence in ROC-space. As shown, each
단일 시뮬레이션 시험은 8767개의 세트들로부터 50개의 랜덤 이미지 샘플들을 선택하고, 10개의 트리거 사건들에 걸쳐 각각을 분석하는 단계를 포함하였으며, 여기서 각각의 사건은 단일 결함 카테고리의 분류기 패밀리의 전진이었다. 본 발명자들은 "1 단계 앞으로" 그리디 최적화를 동반하는 본 명세서에 기술된 방법을 사용하여 각각의 샘플에 대해 "최상의" 10개 트리거를 계산하였으며, 모든 오분류 오차는 단위 비용을 할당하였다. 이를 각각의 샘플에 대한 랜덤 트리거 선택에 비교하였으며, 여기서 모든 가능한 트리거들의 세트로부터 10개의 트리거 사건을 무작위로 선택하였다. 평균 성능을 평가하기 위하여, 1000회의 시뮬레이션 시험들을 수행하였다. 도 18은 베이스라인 랜덤(A)과 그리디 최적(B) 사이의 차이를 도시하는 히스토그램이다. 이들 히스토그램은 1000회의 시험 및 각각의 시험에서의 50개의 이미지 샘플에 걸쳐 종합되었다.The single simulation test included selecting 50 random image samples from 8767 sets and analyzing each over 10 trigger events, where each event was the advance of the classifier family of a single defect category. We calculated the "best" 10 triggers for each sample using the method described herein with "one step forward" greedy optimization, and all misclassification errors assigned unit cost. This was compared to the random trigger selection for each sample, where 10 trigger events were randomly selected from the set of all possible triggers. To evaluate the average performance, 1000 simulation tests were performed. 18 is a histogram showing the difference between baseline random (A) and greedy optimal (B). These histograms were synthesized over 1000 tests and 50 image samples in each test.
도 19 및 도 20은 시뮬레이션 연구를 기반으로 성능 결과를 나타내는 플롯이다. 도 19는 시험/이미지들에 걸쳐 평균 오분류 비용을 도시한다. 전술된 바와 같이, 모든 오분류들에는 단위 비용이 할당되었다. 나타낸 바와 같이, 그리디 최적 제어된 트리거는 트리거의 제1 커플 후에 관찰되는 가장 확고한 차이와 함께 모든 사건에 걸쳐 랜덤 트리거보다 낮은 평균 비용을 가지고 있다. 도 20은, 특정 트리거링 전략이 더 낮은 비용을 산출한 50개 샘플들의 (시험 전체에 걸친) 평균 분율을 나타내는 비교 플롯이다. 나타낸 바와 같이, 그리디 트리거는 50개 샘플들의 더 큰 비율에 대해 평균적으로 더 양호한 성능을 제공하였다.19 and 20 are plots showing performance results based on simulation studies. 19 shows the average misclassification cost over test / images. As mentioned above, all misclassifications have been assigned a unit cost. As shown, the greedy optimally controlled trigger has a lower average cost than the random trigger over all events with the firmest difference observed after the first couple of triggers. 20 is a comparison plot showing the average fraction (over the test) of 50 samples for which a particular triggering strategy yielded a lower cost. As shown, the greedy trigger provided on average a better performance for a larger ratio of 50 samples.
명확한 개선을 제공하기 위하여, 특징부 트리거링을 위한 제어된 마르코프 체인 모델을 설명한다. 그리디 알고리즘은 단순하지만 효율적인 스킴으로 생각될 수 있으므로, 더 정교한 제어 최적화를 사용함으로써 추가의 개선을 얻을 수 있다. 또한, 본 연구에서 고려된 특징부 세트는 상대적으로 작다(26개 특징부). 본 기술은 더 큰 특징부 세트로부터 선택하는 것이 필요한 경우에 더욱 더 유리할 수 있다. 이러한 경우, 계산할 최상의 특징부를 동적으로 찾아내는 것은 실제 제조 라인에서 더욱 더 많은 이점을 가질 수 있다. 일 실시예에서, 이 기술은 표 색인을 통해 시행될 수 있으며, 색인표의 고가의 구성은 오프라인에서 실행될 수 있으므로, 이 기술에 연계된 온라인 계산은 매우 적다.To provide a clear improvement, we describe a controlled Markov chain model for feature triggering. Since the greedy algorithm can be thought of as a simple but efficient scheme, further improvements can be obtained by using more sophisticated control optimization. In addition, the feature set considered in this study is relatively small (26 features). The technique can be even more advantageous when it is necessary to select from a larger set of features. In this case, dynamically finding the best features to calculate can have even more advantages in the actual manufacturing line. In one embodiment, this technique can be implemented through a table index, and the expensive construction of the index table can be performed off-line, so there are very few online calculations associated with this technique.
트리거링의 대안적인 경우는, 이미지를 최근의 과거 프레임에 비교하여 현재 품질의 지속을 위해 제어하고, 변화가 검출되면 더 상세한 분석을 트리거링하는 경우이다. 예를 들어, 현재 웨브가 "양호한 웨브"의 상태에 있다면, 흔히 분산과 같은 단순 특징부를 사용하여 새로운 불균일성의 출현을 검출할 수 있다. 이러한 검출은 더 상세한 분석을 트리거링하며, 이는 이어서 부가적 특징부의 계산을 요청한다. 예를 들어, 온라인 제조 라인에서 재료로부터 얻은 최근의 과거 샘플 이미지들은 본 명세서에서 설명되는 절차에 이어서 차트화될 수 있다. 이전에 라벨링된 트레이닝 데이터(최근에 차트화된 프레임으로 증대될 수 있는 세트)로 이를 실행할 수 있다. 일단 차트화 값의 현저한 변화를 찾아내면, 트리거링이 일어나 증대된 특징부 세트를 요청함으로써 새로운 프레임 내의 임의의 불균일성의 클래스 및 심각도를 검출한다.An alternative case of triggering is when the image is compared to the last past frame to control for the continuation of the current quality, and triggering a more detailed analysis when a change is detected. For example, if the current web is in a "good web" state, simple features such as dispersion can often be used to detect the appearance of new non-uniformities. This detection triggers a more detailed analysis, which then requires calculation of additional features. For example, recent historical sample images obtained from materials on an online manufacturing line can be charted following the procedure described herein. You can do this with previously labeled training data (a set that can be augmented with recently charted frames). Once a significant change in the charting value is found, triggering occurs to detect the class and severity of any non-uniformity in the new frame by requesting an increased feature set.
몇몇 실시예들에서, 컴퓨터 하드웨어는 동적 특징부 트리거링 알고리즘을 보완하여 온라인 환경에서 특징부 추출 시간을 더 감소시키도록 선택될 수 있다. 전술된 바와 같이, 특징부 추출은 보통 몇몇 표준 이미지 처리 루틴들을 수반한다. 균일성 처리를 위한 온라인 특징부 추출에 대한 그러한 동작들은 표준 CPU들보다는 그래픽 처리 유닛(GPU)들 상에서 더욱 신속하게 수행될 수 있다.In some embodiments, computer hardware may be selected to complement the dynamic feature triggering algorithm to further reduce feature extraction time in the online environment. As mentioned above, feature extraction usually involves some standard image processing routines. Such operations for on-line feature extraction for uniformity processing can be performed more quickly on graphics processing units (GPUs) than on standard CPUs.
GPU들은 전통적으로 컴퓨터 디스플레이 상에서 3D 장면들을 렌더링하기 위한 그래픽 파이프라인으로 설계되었다. 파이프라인을 따르는 특정 처리 구성요소들은 종종 셰이더(shader)들로 지칭된다. 기하학적 원형(전형적으로 삼각형)들의 세트는 먼저 GPU 좌표계에서 도형의 기본 형상을 생성하도록 버텍스 셰이더(vertex shader)들에 의해 처리된다. 이어서, 조명이 화소 셰이더들에 의해 그리고 기하학적 셰이더들을 통한 카메라 투사에 의해 적용될 수 있다. 래스터화 및 텍스처링이 다음이다. 마지막으로, 가시적 장면들이 선택되고, 이미지가 렌더링된다.GPUs have traditionally been designed as graphics pipelines for rendering 3D scenes on computer displays. Certain processing components along the pipeline are often referred to as shaders. The set of geometric circles (typically triangles) is first processed by vertex shaders to create the basic shape of the figure in the GPU coordinate system. The illumination can then be applied by pixel shaders and by camera projection through the geometric shaders. Rasterization and texturing are next. Finally, visible scenes are selected and the image is rendered.
파이프라인에서 여러 주요 단계들은 행렬-벡터 동작들이 되며, 이는 정확히 특정 유형들의 특징부 추출 조작들, 예컨대 가보어 유형의 필터들을 웨브 재료로부터 포착된 이미지에 적용하는 데 요구되는 동작들인 것으로 드러난다. GPU들은 다수의 프로세서들을 사용하여 상이한 화소 구역들을 동시에 분석함으로써 이들 계산들을 수행하고 병렬성을 이용하도록 고도로 최적화된다. GPU의 표준 파이프라인에서 모든 단계들이 요구되지 않을 수 있으며, 이와 같이, 소정의 특수화된 셰이더들은 충분히 이용되지 않을 수 있다. 다행히도, 현재의 GPU들은 임의의 처리 단계를 수행할 수 있는 통합형 셰이더들을 사용한다. 또한, 보다 입상인 API는 현재의 GPU들에 의해 노출되고 있어서, GPU 처리를 위한 잠재적 응용 범주를 넓힌다. 일례는 엔비디아 코포레이션(NVidia Corporation)에 의해 최근에 공개된 C 프로그래밍 언어에 대한 CUDA (Compute Unified Device Architecture) API 확장이다. 노출된 공유 메모리 구역 및 드라이버 CPU와의 고속 통신과 같은 이러한 아키텍처를 수반하는 개선점들은 GPU를 범용의 고성능 계산에 적합하게 하는 것을 지향한다.Several major steps in the pipeline become matrix-vector operations, which turn out to be exactly the operations required to apply certain types of feature extraction operations, such as Gabor type filters, to an image captured from the web material. GPUs are highly optimized to perform these calculations and exploit parallelism by simultaneously analyzing different pixel regions using multiple processors. Not all steps in the GPU's standard pipeline may be required, and as such, certain specialized shaders may not be fully utilized. Fortunately, current GPUs use integrated shaders that can perform arbitrary processing steps. In addition, more granular APIs are exposed by current GPUs, broadening the potential application scope for GPU processing. One example is the CUDA (Compute Unified Device Architecture) API extension to the C programming language recently published by Nvidia Corporation. Improvements involving this architecture, such as high speed communication with exposed shared memory regions and driver CPUs, aim to make the GPU suitable for general purpose high performance computing.
균일성 처리의 많은 응용들에 대해, 다수의 가보어 필터들은 주파수 도메인 필터링을 이용하여 특징부들을 추출하는 데 사용될 것이다. 전통적인 CPU 구현에 비해 GPU들 상에서 공간 및 주파수 도메인 필터링을 구현할 때 상당한 성능 이득들이 성취될 수 있다. 큰 특징부 세트들에 대해, 주파수 도메인에서 필터링을 수행하는 것이 종종 더 효율적이다. 이는, 표적 이미지의 FFT가 단 한번만 계산될 필요가 있고, 그것이 이어서 다수의 필터들에 의해 병렬로 처리될 수 있다는 사실에 기인한다.For many applications of uniformity processing, multiple Gabor filters will be used to extract features using frequency domain filtering. Significant performance gains can be achieved when implementing spatial and frequency domain filtering on GPUs over traditional CPU implementations. For large feature sets, it is often more efficient to perform filtering in the frequency domain. This is due to the fact that the FFT of the target image only needs to be calculated once, which can then be processed in parallel by multiple filters.
몇몇 예들에서, 균일성 처리는 기준 축들 중 하나에 정렬되는 사인파 성분 방향들을 갖는 가보어 필터들 및 국부화를 제공하는 가우시안 윈도우(Gaussian window)를 사용한다. 이는 유사하게 배향된 예상 결함들(예컨대, 채터)로부터 자연스럽게 발생한다. 그러한 필터들은 분리가능한데, 이는 그들이 2개의 1차원 필터들의 외적으로부터 형성될 수 있다는 것을 의미한다. 공간 컨볼루션은 이 경우에 전체 2차원 컨볼루션을 개별 1D 컨볼루션들로 분해함으로써 가속될 수 있다. 이는 더 작은 필터들을 처리하여 최상의 성능을 성취할 때 활용될 수 있다.In some examples, the uniformity process uses Gaussian filters with localized sinusoidal component directions aligned to one of the reference axes and a Gaussian window that provides localization. This naturally occurs from similarly oriented expected defects (eg, chatter). Such filters are separable, meaning that they can be formed from the cross product of two one-dimensional filters. Spatial convolution can in this case be accelerated by decomposing the entire two-dimensional convolution into individual 1D convolutions. This can be utilized when processing smaller filters to achieve the best performance.
병렬 화소 계산 및 최적화된 행렬-벡터 동작들을 포함하는 GPU들의 태양들은, 그들이 신속한 균일성 처리 시에 특징부 추출을 위한 유용한 하드웨어 구성요소들이 되게 한다. 데이터 처리를 가속하는 다른 방법은 ASIC(application-specific integrated circuit) 또는 FPGA(field-programmable gate array)들을 사용하여 하드웨어에서의 구현을 통한 것이다.Aspects of GPUs, including parallel pixel computation and optimized matrix-vector operations, make them useful hardware components for feature extraction in rapid uniformity processing. Another way to accelerate data processing is through hardware implementation using application-specific integrated circuits (ASICs) or field-programmable gate arrays (FPGAs).
본 발명의 다양한 실시예들이 설명되었다. 이들 및 다른 실시예가 이하의 특허청구범위의 범주 내에 속한다.Various embodiments of the present invention have been described. These and other embodiments are within the scope of the following claims.
Claims (18)
전산화 검사 시스템 내에 통합된 파이프라인형(pipelined) 그래픽 처리 유닛(graphical processing unit, GPU)의 하드웨어 구성요소들을 사용하여, 제조된 웨브(web) 재료로부터 포착된 샘플 이미지를 실시간으로 처리하여 상기 이미지로부터 제1 복수의 특징부들을 병렬로 추출하는 단계와,
상기 분류 모델에 따라 제1 복수의 특징부들로부터 상기 전산화 검사 시스템을 사용하여 웨브 재료의 샘플 이미지에 대한 불균일성 패턴의 심각도 수준을 계산하는 단계를 포함하는
방법.
Grading software that automatically assigns discrete rating labels for non-uniform patterns to each of the plurality of training images and calculates a classification model based on the rating labels assigned to the training samples. Grading software receives an input from the user for only a subset of the training images and calculates rating labels for all remaining training images based on the input;
Using hardware components of a pipelined graphical processing unit (GPU) integrated within a computerized inspection system, sample images captured from fabricated web materials can be processed in real time from the images. Extracting the first plurality of features in parallel,
Calculating a severity level of a non-uniformity pattern for a sample image of web material using the computerized inspection system from a first plurality of features according to the classification model.
Way.
이산 등급 라벨들을 자동으로 할당하는 단계는,
등급화 소프트웨어로, 트레이닝 이미지들의 대표적인 서브세트에 대한 복수의 이미지 클러스터들을 계산하는 단계와,
사용자에 의해 이미지 클러스터들에 할당된 개별 등급 라벨들을 수신하는 단계와,
사용자에 의해 이미지 클러스터들에 할당된 개별 등급 라벨들을 각자의 이미지 클러스터들 내의 트레이닝 이미지들 모두에게 자동으로 전파하는 단계와,
등급 라벨들을 자동으로 계산하고, 계산된 등급 라벨들을 패턴들의 클래스들의 각각에 대한 트레이닝 이미지들의 대표적인 서브세트 내에 포함되지 않는 트레이닝 이미지들 중 나머지 모든 트레이닝 이미지들에게 할당하는 단계를 포함하는
방법.
The method of claim 1,
Automatically assigning discrete grade labels is
Calculating with the grading software a plurality of image clusters for a representative subset of training images,
Receiving individual rating labels assigned to image clusters by a user;
Automatically propagating individual rating labels assigned to image clusters by a user to all training images in their respective image clusters,
Automatically calculating rank labels and assigning the calculated rank labels to all remaining training images of the training images that are not included in the representative subset of training images for each of the classes of patterns.
Way.
모델에 따라 이미지로부터 추출할 제2 복수의 특징부들을 동적으로 선택하도록 트리거(trigger)들의 체인(chain)을 정의하는 의사 결정 모델을 갖는 검사 시스템으로 제1 복수의 특징부들을 처리하는 단계와,
의사 결정 모델에 따라, 제2 복수의 특징부들이 샘플 이미지로부터 추출되면, 불균일성 패턴에 대해 샘플 이미지를 오분류하는 비용의 예상되는 감소를 결정하는 단계와,
비용의 예상되는 감소가 임계치를 초과할 때, 검사 시스템의 파이프라인형 GPU의 하드웨어 구성요소들로 샘플 이미지를 처리하여 제2 특징부 세트를 추출하는 단계와,
이미지로부터 추출된 제1 복수의 특징부들 및 제2 복수의 특징부들을 사용하여 검사 시스템으로 웨브 재료에 대한 불균일성 패턴의 심각도 수준을 계산하는 단계를 더 포함하는
방법.
The method of claim 1,
Processing the first plurality of features with an inspection system having a decision model that defines a chain of triggers to dynamically select a second plurality of features to extract from the image according to the model;
According to the decision model, if the second plurality of features are extracted from the sample image, determining an expected reduction in the cost of misclassifying the sample image for a non-uniformity pattern;
When the expected reduction in cost exceeds a threshold, processing the sample image with the hardware components of the pipelined GPU of the inspection system to extract a second set of features;
Calculating a severity level of the non-uniformity pattern for the web material with the inspection system using the first plurality of features and the second plurality of features extracted from the image.
Way.
등급 라벨들을 자동으로 할당하는 단계는, 트레이닝 이미지들의 대표적인 서브세트 내에 포함되지 않는 라벨링되지 않은 트레이닝 이미지들의 각각에 대해,
라벨링되지 않은 트레이닝 이미지의 수치화된 디스크립터(descriptor)에 대해 트레이닝 이미지들의 대표적인 서브세트 내의 라벨링된 이미지들 각각의 수치화된 디스크립터까지의 쌍대 거리(pair-wise distance)를 계산하는 단계와,
각각의 특정된 패턴 클래스에 대해 확률 세트를 계산하는 단계 - 각각의 패턴 클래스에 대한 확률 세트는 패턴 클래스에 대해 특정된 등급 라벨들의 각각에 대한 확률을 포함하며, 라벨링되지 않은 트레이닝 이미지가 그 특정 패턴 클래스에 대한 그 특정 라벨을 할당받은 트레이닝 이미지들의 구성원일 확률을 나타냄 - 와,
패턴 클래스들의 각각 내에서 최고 확률을 갖는 등급 라벨들을 라벨링되지 않은 트레이닝 이미지에 할당하는 단계를 포함하는
방법.
The method of claim 1,
Automatically assigning rating labels includes: for each of the unlabeled training images not included in the representative subset of training images,
Calculating a pair-wise distance to the digitized descriptor of each of the labeled images in the representative subset of training images for the digitized descriptor of the unlabeled training image;
Calculating a set of probabilities for each specified pattern class, wherein the set of probabilities for each pattern class includes probabilities for each of the class labels specified for the pattern class, wherein an unlabeled training image is selected for that particular pattern. Indicates a probability of being a member of training images assigned that particular label for the class-and,
Assigning class labels having the highest probability within each of the pattern classes to an unlabeled training image.
Way.
등급화 소프트웨어를 이용하여, 트레이닝 이미지들에게 할당된 이산 등급 라벨들을 기반으로 트레이닝 이미지들의 연속 순위를 계산하는 단계와,
전산화 검사 시스템을 이용하여, 트레이닝 이미지의 연속 순위를 기반으로 웨브에 대한 불균일 패턴의 심각도 수준을 계산하는 단계를 더 포함하는
방법.
The method of claim 1,
Using the grading software, calculating successive ranks of the training images based on discrete grade labels assigned to the training images,
Using a computerized test system, calculating the severity level of the non-uniform pattern for the web based on the continuous ranking of the training images.
Way.
온라인 전산화 검사 시스템을 이용하여, 제조되고 있는 웨브 재료로부터 포착된 이미지를 수신하는 단계와,
상기 검사 시스템으로 상기 이미지를 처리하여 제1 특징부 세트를 추출하는 단계와,
의사 결정 모델에 따라 상기 이미지로부터 추출할 제2 특징부 세트를 동적으로 선택하기 위해 트리거들의 체인을 정의하는 의사 결정 모델을 갖는 상기 검사 시스템으로 상기 제1 특징부 세트를 처리하는 단계와,
상기 제2 특징부 세트가 상기 이미지로부터 추출되는 경우, 상기 불균일성 패턴에 대한 상기 이미지의 오분류의 비용의 예상되는 감소를 상기 의사 결정 모델에 따라 결정하는 단계와,
상기 비용의 예상되는 감소가 임계치를 초과할 때, 상기 검사 시스템 내에 통합된 파이프라인형 그래픽 처리 유닛(GPU)의 하드웨어 구성요소들을 호출하여 상기 검사 시스템과 함께 상기 이미지를 처리하여 상기 제2 특징부 세트를 추출하는 단계와,
상기 이미지로부터 추출된 상기 제1 특징부 세트 및 상기 제2 특징부 세트를 사용하여 상기 검사 시스템으로 상기 웨브 재료에 대한 불균일성 패턴의 심각도 수준을 계산하는 단계를 포함하는
방법.
A method of inspecting a web material in real time when a web material is manufactured to calculate the severity of the non-uniformity pattern,
Receiving an image captured from the web material being manufactured using an online computerized inspection system,
Processing the image with the inspection system to extract a first set of features;
Processing the first set of features with the inspection system having a decision model defining a chain of triggers to dynamically select a second set of features to extract from the image according to a decision model;
When the second set of features is extracted from the image, determining an expected reduction in the cost of misclassification of the image for the non-uniformity pattern according to the decision model;
When the expected decrease in cost exceeds a threshold, the hardware features of a pipelined graphics processing unit (GPU) integrated within the inspection system are invoked to process the image with the inspection system to provide the second feature. Extracting the set,
Calculating a severity level of a non-uniformity pattern for the web material with the inspection system using the first feature set and the second feature set extracted from the image.
Way.
모델은 이미지로부터 추출할 제2 특징부 세트 및 추출할 임의의 부가적 특징부 세트의 선택을 제어하기 위한 하나 이상의 동적 트리거들의 체인을 정의하는 마르코프 모델(Markov model)을 포함하는
방법.
The method according to claim 6,
The model includes a Markov model that defines a second set of features to extract from the image and a chain of one or more dynamic triggers for controlling the selection of any additional feature set to extract.
Way.
심각도 수준을 사용자에게 출력하기 위한 사용자 인터페이스를 제공하는 단계를 추가로 포함하는
방법.
The method according to claim 6,
Further comprising providing a user interface for outputting the severity level to the user.
Way.
사용자 인터페이스를 제공하는 단계는, 차트를 업데이트하여 시간의 흐름에 따라 웨브 재료에 대한 불균일 패턴의 심각도 수준을 그래프화하는 단계를 포함하는
방법.
The method of claim 8,
Providing a user interface includes updating the chart to graph the severity level of the non-uniform pattern for the web material over time.
Way.
사용자로부터 입력을 받는 단계와,
입력에 응답하여, 제조된 웨브 재료에 대한 하나 이상의 공정 제어 파라미터들을 조절하는 단계를 더 포함하는
방법.
The method of claim 8,
Receiving input from the user,
In response to the input, adjusting one or more process control parameters for the manufactured web material;
Way.
이미지로부터 어느 특징부를 추출할 것인지를 실시간으로 선택하기 위해 동적 트리거들의 체인을 정의하는 의사 결정 모델을 저장하기 위한 메모리와,
현재 제조되고 있는 제조된 웨브 재료로부터 포착된 샘플 이미지를 처리하여 제1 특징부 세트를 추출하는 소프트웨어를 실행하는 컴퓨터를 포함하고,
상기 소프트웨어는 의사 결정 모델을 적용하여 샘플 이미지로부터 추출할 부가적 특징부 세트들의 선택을 반복적으로 동적으로 트리거링하며, 추출된 특징부들이 상기 웨브 재료에 대한 불균일성 패턴의 심각도 수준을 정의된 신뢰 수준 내에서 계산하기에 충분할 때까지 부가적인 특징부 세트들을 추출하도록 상기 검사 시스템의 파이프라인형 그래픽 처리 유닛(GPU)의 하드웨어 구성요소들을 호출하는
온라인 전산화 검사 시스템.
An online computerized inspection system that inspects web material in real time as the web material is manufactured, and calculates the severity of the non-uniformity pattern.
Memory for storing a decision model that defines a chain of dynamic triggers to select in real time which features to extract from the image;
A computer executing software to process a sample image captured from a manufactured web material currently being manufactured to extract a first set of features,
The software applies a decision model to recursively and dynamically trigger the selection of additional feature sets to extract from the sample image, wherein the extracted features within the defined confidence level severity levels of the non-uniformity pattern for the web material. Calling the hardware components of the pipelined graphics processing unit (GPU) of the inspection system to extract additional feature sets until it is sufficient to calculate
Online computerized inspection system.
소프트웨어가 모델을 적용하여 새로운 이미지로부터 추출할 제2 특징부 세트의 선택을 트리거링하며,
트리거링될 경우에 소프트웨어는 이미지로부터 추출된 제1 특징부 세트를 기반으로 전체 특징부 세트로부터 제2 특징부 세트를 동적으로 선택하고,소프트웨어는 샘플 이미지를 처리하여 이미지로부터 제2 특징부 세트를 추출하고 제1 특징부 세트 및 제2 특징부 세트를 기반으로 불균일성 패턴의 심각도 수준을 계산하는
온라인 전산화 검사 시스템.
The method of claim 11,
The software applies the model to trigger the selection of a second set of features to extract from the new image,
When triggered, the software dynamically selects a second set of features from the full set of features based on the first set of features extracted from the image, and the software processes the sample image to extract the second set of features from the image. And calculate the severity level of the nonuniformity pattern based on the first feature set and the second feature set.
Online computerized inspection system.
모델은 마르코프 모델을 포함하는
온라인 전산화 검사 시스템.
13. The method of claim 12,
The model contains a Markov model
Online computerized inspection system.
다차원 특징부 공간 내의 복수의 지점들 - 다차원 공간 내의 지점들의 각각은 트레이닝 이미지들 중 상이한 트레이닝 이미지에 대한 특징부 벡터에 대응함 - 로서 트레이닝 이미지들의 연속 순위를 나타내는 모델을 저장하는 메모리와,
상기 검사 시스템의 파이프라인형 그래픽 처리 유닛(GPU) - 상기 GPU는 GPU의 병렬 하드웨어 구성요소들을 사용하여 샘플 이미지로부터 복수의 특징부들을 병렬로 추출하도록, 제조된 웨브 재료로부터 포착된 샘플 이미지를 처리함 - 을 포함하며,
상기 전산화 검사 시스템은 상기 트레이닝 이미지들의 모델을 기반으로 상기 웨브 재료의 샘플 이미지에 대한 추출된 특징부들로부터의 불균일 패턴의 심각도 수준을 연속적인 척도로 계산하는
온라인 전산화 검사 시스템.
An online computerized inspection system for inspecting web materials in real time,
A memory storing a model indicative of a continuous ranking of training images as a plurality of points in the multidimensional feature space, each of the points in the multidimensional space corresponding to a feature vector for a different training image of the training images;
Pipelined Graphics Processing Unit (GPU) of the inspection system, wherein the GPU processes sample images captured from the manufactured web material to extract in parallel a plurality of features from the sample image using parallel hardware components of the GPU. Contains-
The computerized inspection system calculates, on a continuous scale, the severity level of the non-uniform pattern from the extracted features for the sample image of the web material based on the model of the training images.
Online computerized inspection system.
대표적인 트레이닝 이미지들 내에 존재하는 하나 이상의 패턴 클래스들 및 패턴 클래스들의 각각에 대한 등급 라벨 세트를 특정하는 입력을 사용자로부터 수신하는 입력 메커니즘들을 가지며, 등급화 소프트웨어에 의해 제공되며, 특정된 패턴 클래스들의 각각에 대한 이미지 클러스터들의 각각에 개별 등급 라벨을 할당하는 입력을 수신하는 입력 메커니즘들을 추가로 포함하는 사용자 인터페이스 - 이미지 클러스터들의 각각에 대해, 등급화 소프트웨어는 이미지 클러스터에 대한 패턴 클래스들에 할당된 개별 등급 라벨들의 각각을 그 이미지 클러스터 내의 모든 트레이닝 이미지들에 자동으로 전파시킴 - 와,
트레이닝 샘플들에게 할당된 등급 라벨들을 기반으로 분류 모델을 계산하는 트레이닝 소프트웨어와,
제조된 웨브 재료로부터 포착된 새로운 이미지를 처리하여, 상기 새로운 이미지로부터 복수의 특징부들을 병렬로 추출하고 상기 분류 모델을 기반으로 상기 웨브 재료에 대한 분균일 패턴의 심각도 수준을 연속적인 척도로 계산하는 파이프라인형 그래픽 처리 유닛(GPU)을 포함하는 온라인 전산화 검사 시스템을 포함하는
시스템.
A first clustering process for extracting features from each training image and processing the digitized descriptors of the training images by calculating a digitized descriptor for each of the training images from the pixel values of the respective training image of the plurality of training images. Grading software running on the processor that performs a method to automatically select a representative subset of training images and computes a plurality of image clusters for the representative subset of training images;
One or more pattern classes present in representative training images and input mechanisms for receiving input from a user that specifies a rating label set for each of the pattern classes, provided by the grading software, each of the specified pattern classes A user interface further comprising input mechanisms for receiving an input for assigning an individual rating label to each of the image clusters for each of the image clusters, wherein the grading software assigns an individual rating assigned to the pattern classes for the image cluster. Automatically propagate each of the labels to all training images in the image cluster;
Training software that calculates a classification model based on class labels assigned to training samples,
Process a new image captured from the manufactured web material, extracting a plurality of features from the new image in parallel and calculating the severity level of the uniformity pattern for the web material on a continuous scale based on the classification model Including an online computerized inspection system including a pipelined graphics processing unit (GPU)
system.
복수의 트레이닝 이미지들의 각각에 불균일 패턴에 대한 이산 등급 라벨을 자동으로 할당하고, 하나 이상의 전문가들에 의해 트레이닝 샘플들에게 할당된 등급 라벨들을 기반으로 분류 모델을 계산하는 등급화 소프트웨어를 컴퓨터 상에서 실행하는 단계와,
전산화 검사 시스템을 사용하여, 제조된 웨브 재료로부터 포착된 샘플 이미지를 실시간으로 처리하여 상기 이미지로부터 제1 복수의 특징부들을 추출하는 단계와,
상기 분류 모델에 따라 제1 복수의 특징부들로부터 전산화 검사 시스템을 사용하여 상기 웨브 재료의 샘플 이미지에 대한 불균일성 패턴의 심각도 수준을 계산하는 단계와,
전문가들과 동일한 방식으로 불균일성 패턴을 시각화하기 위한 트레이닝 정보로서, 상기 분류 모델로부터 계산된 심각도 수준 및 샘플 이미지 둘 모두를 사용자에게 표시하는 단계를 포함하는
방법.
As a method of training a user,
Running grading software on a computer that automatically assigns a discrete grade label for the non-uniform pattern to each of the plurality of training images and calculates a classification model based on the grade labels assigned to the training samples by one or more experts. Steps,
Processing a sample image captured from the manufactured web material in real time using a computerized inspection system to extract a first plurality of features from the image,
Calculating a severity level of the non-uniformity pattern for the sample image of the web material using a computerized inspection system from a first plurality of features according to the classification model;
Training information for visualizing a non-uniformity pattern in the same manner as experts, including displaying to the user both a severity level and a sample image calculated from the classification model
Way.
불균일성 패턴에 대한 심각도 수준의 증가 또는 감소를 요청하는 입력을 사용자로부터 수신하는 단계와,
입력에 응답하여, 제조된 웨브 재료에 대한 하나 이상의 공정 제어 파라미터들을 조절하는 단계를 포함하는
방법.
17. The method of claim 16,
Receiving input from a user requesting an increase or decrease in the severity level for the non-uniformity pattern,
In response to the input, adjusting one or more process control parameters for the manufactured web material.
Way.
등급화 소프트웨어는 트레이닝 이미지들의 서브세트만에 대한 입력을 사용자로부터 수신하고, 입력을 기반으로 모든 나머지 트레이닝 이미지들에 대한 등급 라벨들을 계산하는
방법.17. The method of claim 16,
The grading software receives an input from the user for only a subset of the training images and calculates rating labels for all remaining training images based on the input.
Way.
Applications Claiming Priority (3)
| Application Number | Priority Date | Filing Date | Title |
|---|---|---|---|
| US201161446404P | 2011-02-24 | 2011-02-24 | |
| US61/446,404 | 2011-02-24 | ||
| PCT/US2012/024987 WO2012115819A1 (en) | 2011-02-24 | 2012-02-14 | System for detection of non-uniformities in web-based materials |
Publications (1)
| Publication Number | Publication Date |
|---|---|
| KR20140031201A true KR20140031201A (en) | 2014-03-12 |
Family
ID=46721183
Family Applications (1)
| Application Number | Title | Priority Date | Filing Date |
|---|---|---|---|
| KR1020137024934A KR20140031201A (en) | 2011-02-24 | 2012-02-14 | System for detection of non-uniformities in web-based materials |
Country Status (8)
| Country | Link |
|---|---|
| US (1) | US9002072B2 (en) |
| EP (1) | EP2678665A4 (en) |
| JP (1) | JP2014511530A (en) |
| KR (1) | KR20140031201A (en) |
| CN (1) | CN103392125B (en) |
| BR (1) | BR112013020467A2 (en) |
| SG (1) | SG192768A1 (en) |
| WO (1) | WO2012115819A1 (en) |
Families Citing this family (32)
| Publication number | Priority date | Publication date | Assignee | Title |
|---|---|---|---|---|
| US20140031964A1 (en) * | 2012-07-27 | 2014-01-30 | Geoffrey Rajay Sidhu | Method and system for manufacturing an article |
| US9322653B2 (en) * | 2013-01-16 | 2016-04-26 | Disney Enterprises, Inc. | Video-based motion capture and adaptation |
| KR20150140644A (en) | 2013-02-08 | 2015-12-16 | 이모션트 | Collection of machine learning training data for expression recognition |
| US9923892B1 (en) * | 2013-06-14 | 2018-03-20 | Whitehat Security, Inc. | Enhanced automatic response culling with signature generation and filtering |
| CN103344648A (en) * | 2013-07-10 | 2013-10-09 | 鞍钢股份有限公司 | Steel plate surface quality detection method and system based on GPU |
| US9841383B2 (en) | 2013-10-31 | 2017-12-12 | 3M Innovative Properties Company | Multiscale uniformity analysis of a material |
| JP6080740B2 (en) * | 2013-11-07 | 2017-02-15 | 日本電信電話株式会社 | Image area dividing apparatus, image area dividing method, and image area dividing program |
| US9558712B2 (en) | 2014-01-21 | 2017-01-31 | Nvidia Corporation | Unified optimization method for end-to-end camera image processing for translating a sensor captured image to a display image |
| US9454806B2 (en) * | 2014-01-21 | 2016-09-27 | Nvidia Corporation | Efficient approximate-nearest-neighbor (ANN) search for high-quality collaborative filtering |
| JP6643856B2 (en) * | 2014-11-28 | 2020-02-12 | キヤノン株式会社 | Classification method, inspection method, inspection device, and program |
| US9443320B1 (en) * | 2015-05-18 | 2016-09-13 | Xerox Corporation | Multi-object tracking with generic object proposals |
| JP6404794B2 (en) * | 2015-09-16 | 2018-10-17 | 日本電信電話株式会社 | Image information acquisition method, image evaluation method, image information acquisition device, image evaluation device, and image processing program |
| GB201517462D0 (en) * | 2015-10-02 | 2015-11-18 | Tractable Ltd | Semi-automatic labelling of datasets |
| US10198576B2 (en) | 2015-12-10 | 2019-02-05 | AVAST Software s.r.o. | Identification of mislabeled samples via phantom nodes in label propagation |
| EP3309753A1 (en) * | 2016-10-14 | 2018-04-18 | Mettler-Toledo, LLC | Display of measurement results in a continuously updated time graph |
| CN107154041B (en) * | 2017-05-16 | 2019-08-09 | 武汉精测电子集团股份有限公司 | A kind of learning method for defects of display panel classification |
| US10229092B2 (en) | 2017-08-14 | 2019-03-12 | City University Of Hong Kong | Systems and methods for robust low-rank matrix approximation |
| CN108242054A (en) * | 2018-01-09 | 2018-07-03 | 北京百度网讯科技有限公司 | A kind of steel plate defect detection method, device, equipment and server |
| BR112020021919A2 (en) | 2018-04-24 | 2021-05-11 | Indigo Ag, Inc. | interaction management in an online farming system |
| WO2020121075A1 (en) * | 2018-12-12 | 2020-06-18 | Cheriyan Anish | System and method for quality assessment of a product |
| US12094019B1 (en) * | 2019-08-01 | 2024-09-17 | Apple Inc. | Electronic asset management |
| JP7502345B2 (en) * | 2019-11-29 | 2024-06-18 | 京東方科技集團股▲ふん▼有限公司 | System and method for analyzing product defect factors, computer-readable medium |
| US11256967B2 (en) | 2020-01-27 | 2022-02-22 | Kla Corporation | Characterization system and method with guided defect discovery |
| CN111950528B (en) * | 2020-09-02 | 2023-10-31 | 北京猿力未来科技有限公司 | Graph recognition model training method and device |
| WO2022144733A1 (en) * | 2020-12-28 | 2022-07-07 | 3M Innovative Properties Company | Active learning management system for automated inspection systems |
| WO2023034118A1 (en) * | 2021-08-30 | 2023-03-09 | Indigo Ag, Inc. | Systems for management of location-aware market data |
| CN116433561A (en) * | 2021-12-31 | 2023-07-14 | 中兴通讯股份有限公司 | Image processing method, electronic device, storage medium, and program product |
| US11836909B2 (en) * | 2022-01-26 | 2023-12-05 | Mellanox Technologies, Ltd. | Active learning of product inspection engine |
| IT202200011345A1 (en) * | 2022-05-30 | 2023-11-30 | Sacmi | METHOD AND SYSTEM FOR PERFORMING A QUALITY CONTROL OF OBJECTS IN AN APPARATUS THAT PRODUCES OBJECTS IN A CONTINUOUS CYCLE |
| US20240112436A1 (en) * | 2022-09-30 | 2024-04-04 | Zebra Technologies Corporation | Ranked adaptive roi for vision cameras |
| CN115496760B (en) * | 2022-11-17 | 2023-04-07 | 澳润(山东)药业有限公司 | Donkey-hide gelatin quality identification method |
| CN118262175B (en) * | 2024-04-17 | 2024-08-16 | 陕西天域新型环保建材有限公司 | Environment-friendly gypsum mortar quality rapid detection method based on artificial intelligence |
Family Cites Families (26)
| Publication number | Priority date | Publication date | Assignee | Title |
|---|---|---|---|---|
| US4728800A (en) * | 1985-04-24 | 1988-03-01 | Young Engineering, Inc. | Apparatus and method for detecting defects in a moving web |
| DE69209609T2 (en) * | 1991-05-03 | 1996-10-31 | Eastman Kodak Co | CONTROL FOR RAILWAY |
| FR2761475B1 (en) * | 1997-03-28 | 1999-06-11 | Lorraine Laminage | METHOD FOR INSPECTING THE SURFACE OF A SCROLLING STRIP BY IMAGE SEGMENTATION IN SUSPECTED AREAS |
| JPH10318937A (en) * | 1997-05-22 | 1998-12-04 | Dainippon Screen Mfg Co Ltd | Optical irregularity inspection device and method |
| US5893055A (en) * | 1997-05-30 | 1999-04-06 | Abb Industrial Systems, Inc. | Two-dimensional web property variation modeling and control |
| US5999636A (en) * | 1997-10-10 | 1999-12-07 | Printprobe Technology, Llc | Apparatus and process for inspecting print material |
| US6411860B1 (en) * | 1998-02-10 | 2002-06-25 | Abb Industrial Systems, Inc. | Method for extracting and classifying sheet variation patterns from two-dimensional sheet measurements |
| JP4132229B2 (en) * | 1998-06-03 | 2008-08-13 | 株式会社ルネサステクノロジ | Defect classification method |
| US6999614B1 (en) * | 1999-11-29 | 2006-02-14 | Kla-Tencor Corporation | Power assisted automatic supervised classifier creation tool for semiconductor defects |
| AU1553601A (en) | 1999-11-29 | 2001-06-12 | Olympus Optical Co., Ltd. | Defect inspecting system |
| KR100355404B1 (en) | 1999-12-03 | 2002-10-11 | 삼성전자 주식회사 | Texture description method and texture retrieval method using Gabor filter in frequency domain |
| US6950547B2 (en) * | 2001-02-12 | 2005-09-27 | 3M Innovative Properties Company | Web inspection method and device |
| JP2003344300A (en) * | 2002-05-21 | 2003-12-03 | Jfe Steel Kk | Surface defect determination method |
| US7359544B2 (en) * | 2003-02-12 | 2008-04-15 | Kla-Tencor Technologies Corporation | Automatic supervised classifier setup tool for semiconductor defects |
| JP4253522B2 (en) * | 2003-03-28 | 2009-04-15 | 株式会社日立ハイテクノロジーズ | Defect classification method and apparatus |
| US7027934B2 (en) * | 2003-09-24 | 2006-04-11 | 3M Innovative Properties Company | Apparatus and method for automated web inspection |
| US7295700B2 (en) | 2003-10-24 | 2007-11-13 | Adobe Systems Incorporated | Object extraction based on color and visual texture |
| JP2006048370A (en) * | 2004-08-04 | 2006-02-16 | Kagawa Univ | Method for recognizing pattern, method for generating teaching data to be used for the method and pattern recognition apparatus |
| US7545985B2 (en) * | 2005-01-04 | 2009-06-09 | Microsoft Corporation | Method and system for learning-based quality assessment of images |
| JP4799329B2 (en) * | 2006-09-07 | 2011-10-26 | 株式会社東芝 | Unevenness inspection method, display panel manufacturing method, and unevenness inspection apparatus |
| US8175739B2 (en) * | 2007-07-26 | 2012-05-08 | 3M Innovative Properties Company | Multi-unit process spatial synchronization |
| JP2009098053A (en) * | 2007-10-18 | 2009-05-07 | Toppan Printing Co Ltd | Apparatus and method for inspecting unevenness of periodic pattern |
| JP5255953B2 (en) | 2008-08-28 | 2013-08-07 | 株式会社日立ハイテクノロジーズ | Defect inspection method and apparatus |
| WO2010059679A2 (en) | 2008-11-19 | 2010-05-27 | 3M Innovative Properties Company | Constructing enhanced hybrid classifiers from parametric classifier families using receiver operating characteristics |
| JP5250871B2 (en) * | 2008-12-24 | 2013-07-31 | インターナショナル・ビジネス・マシーンズ・コーポレーション | Unevenness evaluation apparatus, unevenness evaluation method, display inspection apparatus, and program |
| EP2638384A4 (en) * | 2010-11-12 | 2017-04-19 | 3M Innovative Properties Company | Rapid processing and detection of non-uniformities in web-based materials |
-
2012
- 2012-02-14 JP JP2013555447A patent/JP2014511530A/en active Pending
- 2012-02-14 EP EP12749012.6A patent/EP2678665A4/en not_active Withdrawn
- 2012-02-14 CN CN201280010360.9A patent/CN103392125B/en not_active Expired - Fee Related
- 2012-02-14 BR BR112013020467A patent/BR112013020467A2/en not_active IP Right Cessation
- 2012-02-14 KR KR1020137024934A patent/KR20140031201A/en active IP Right Grant
- 2012-02-14 WO PCT/US2012/024987 patent/WO2012115819A1/en active Application Filing
- 2012-02-14 SG SG2013061676A patent/SG192768A1/en unknown
- 2012-02-14 US US13/984,764 patent/US9002072B2/en active Active
Also Published As
| Publication number | Publication date |
|---|---|
| BR112013020467A2 (en) | 2016-10-25 |
| EP2678665A1 (en) | 2014-01-01 |
| US20130322733A1 (en) | 2013-12-05 |
| SG192768A1 (en) | 2013-09-30 |
| CN103392125B (en) | 2015-09-09 |
| CN103392125A (en) | 2013-11-13 |
| EP2678665A4 (en) | 2017-07-05 |
| JP2014511530A (en) | 2014-05-15 |
| WO2012115819A1 (en) | 2012-08-30 |
| US9002072B2 (en) | 2015-04-07 |
Similar Documents
| Publication | Publication Date | Title |
|---|---|---|
| US9002072B2 (en) | System for detection of non-uniformities in web-based materials | |
| US8965116B2 (en) | Computer-aided assignment of ratings to digital samples of a manufactured web product | |
| US10115040B2 (en) | Convolutional neural network-based mode selection and defect classification for image fusion | |
| US9031312B2 (en) | Rapid processing and detection of non-uniformities in web-based materials | |
| US20130208978A1 (en) | Continuous charting of non-uniformity severity for detecting variability in web-based materials | |
| Bisheh et al. | A layer-by-layer quality monitoring framework for 3D printing | |
| TW202209153A (en) | Automatic optimization of an examination recipe | |
| US20240071059A1 (en) | Active Learning Management System for Automated Inspection Systems | |
| US11972552B2 (en) | Abnormal wafer image classification | |
| KR20240140120A (en) | Computer-implemented methods for detecting and classifying anomalies in imaging datasets of wafers, and systems utilizing such methods | |
| Dhivya et al. | Detection of structural defects in fabric parts using a novel edge detection method | |
| Thakur et al. | Automated fabric inspection through convolutional neural network: an approach | |
| CN115667915A (en) | Root cause analysis based on wafer bin maps | |
| US20240281953A1 (en) | Adaptive spatial pattern recognition for defect detection | |
| TW202435124A (en) | Adaptive spatial pattern recognition for defect detection |
Legal Events
| Date | Code | Title | Description |
|---|---|---|---|
| E902 | Notification of reason for refusal | ||
| E701 | Decision to grant or registration of patent right |