KR102758552B1 - A method for generating a learning model used when performing image measurement of a semiconductor including a predetermined structure, a measurement system, and a storage medium storing a program for causing a computer to execute processing for generating a learning model used when performing image measurement of a semiconductor including a predetermined structure - Google Patents
A method for generating a learning model used when performing image measurement of a semiconductor including a predetermined structure, a measurement system, and a storage medium storing a program for causing a computer to execute processing for generating a learning model used when performing image measurement of a semiconductor including a predetermined structure Download PDFInfo
- Publication number
- KR102758552B1 KR102758552B1 KR1020227004040A KR20227004040A KR102758552B1 KR 102758552 B1 KR102758552 B1 KR 102758552B1 KR 1020227004040 A KR1020227004040 A KR 1020227004040A KR 20227004040 A KR20227004040 A KR 20227004040A KR 102758552 B1 KR102758552 B1 KR 102758552B1
- Authority
- KR
- South Korea
- Prior art keywords
- image
- measurement
- teacher data
- learning model
- region
- Prior art date
- Legal status (The legal status is an assumption and is not a legal conclusion. Google has not performed a legal analysis and makes no representation as to the accuracy of the status listed.)
- Active
Links
Images


Classifications
-
- G—PHYSICS
- G06—COMPUTING OR CALCULATING; COUNTING
- G06T—IMAGE DATA PROCESSING OR GENERATION, IN GENERAL
- G06T7/00—Image analysis
- G06T7/0002—Inspection of images, e.g. flaw detection
- G06T7/0004—Industrial image inspection
- G06T7/001—Industrial image inspection using an image reference approach
-
- G—PHYSICS
- G01—MEASURING; TESTING
- G01B—MEASURING LENGTH, THICKNESS OR SIMILAR LINEAR DIMENSIONS; MEASURING ANGLES; MEASURING AREAS; MEASURING IRREGULARITIES OF SURFACES OR CONTOURS
- G01B11/00—Measuring arrangements characterised by the use of optical techniques
-
- G—PHYSICS
- G06—COMPUTING OR CALCULATING; COUNTING
- G06T—IMAGE DATA PROCESSING OR GENERATION, IN GENERAL
- G06T7/00—Image analysis
- G06T7/0002—Inspection of images, e.g. flaw detection
- G06T7/0004—Industrial image inspection
-
- G—PHYSICS
- G01—MEASURING; TESTING
- G01B—MEASURING LENGTH, THICKNESS OR SIMILAR LINEAR DIMENSIONS; MEASURING ANGLES; MEASURING AREAS; MEASURING IRREGULARITIES OF SURFACES OR CONTOURS
- G01B15/00—Measuring arrangements characterised by the use of electromagnetic waves or particle radiation, e.g. by the use of microwaves, X-rays, gamma rays or electrons
-
- G—PHYSICS
- G01—MEASURING; TESTING
- G01N—INVESTIGATING OR ANALYSING MATERIALS BY DETERMINING THEIR CHEMICAL OR PHYSICAL PROPERTIES
- G01N21/00—Investigating or analysing materials by the use of optical means, i.e. using sub-millimetre waves, infrared, visible or ultraviolet light
- G01N21/84—Systems specially adapted for particular applications
- G01N21/88—Investigating the presence of flaws or contamination
- G01N21/95—Investigating the presence of flaws or contamination characterised by the material or shape of the object to be examined
- G01N21/9501—Semiconductor wafers
- G01N21/9505—Wafer internal defects, e.g. microcracks
-
- G—PHYSICS
- G01—MEASURING; TESTING
- G01N—INVESTIGATING OR ANALYSING MATERIALS BY DETERMINING THEIR CHEMICAL OR PHYSICAL PROPERTIES
- G01N21/00—Investigating or analysing materials by the use of optical means, i.e. using sub-millimetre waves, infrared, visible or ultraviolet light
- G01N21/84—Systems specially adapted for particular applications
- G01N21/88—Investigating the presence of flaws or contamination
- G01N21/95—Investigating the presence of flaws or contamination characterised by the material or shape of the object to be examined
- G01N21/956—Inspecting patterns on the surface of objects
-
- G—PHYSICS
- G03—PHOTOGRAPHY; CINEMATOGRAPHY; ANALOGOUS TECHNIQUES USING WAVES OTHER THAN OPTICAL WAVES; ELECTROGRAPHY; HOLOGRAPHY
- G03F—PHOTOMECHANICAL PRODUCTION OF TEXTURED OR PATTERNED SURFACES, e.g. FOR PRINTING, FOR PROCESSING OF SEMICONDUCTOR DEVICES; MATERIALS THEREFOR; ORIGINALS THEREFOR; APPARATUS SPECIALLY ADAPTED THEREFOR
- G03F7/00—Photomechanical, e.g. photolithographic, production of textured or patterned surfaces, e.g. printing surfaces; Materials therefor, e.g. comprising photoresists; Apparatus specially adapted therefor
- G03F7/70—Microphotolithographic exposure; Apparatus therefor
- G03F7/70483—Information management; Active and passive control; Testing; Wafer monitoring, e.g. pattern monitoring
- G03F7/70605—Workpiece metrology
- G03F7/70616—Monitoring the printed patterns
- G03F7/70633—Overlay, i.e. relative alignment between patterns printed by separate exposures in different layers, or in the same layer in multiple exposures or stitching
-
- G—PHYSICS
- G06—COMPUTING OR CALCULATING; COUNTING
- G06N—COMPUTING ARRANGEMENTS BASED ON SPECIFIC COMPUTATIONAL MODELS
- G06N3/00—Computing arrangements based on biological models
- G06N3/02—Neural networks
- G06N3/08—Learning methods
-
- G—PHYSICS
- G06—COMPUTING OR CALCULATING; COUNTING
- G06T—IMAGE DATA PROCESSING OR GENERATION, IN GENERAL
- G06T7/00—Image analysis
-
- G—PHYSICS
- G06—COMPUTING OR CALCULATING; COUNTING
- G06T—IMAGE DATA PROCESSING OR GENERATION, IN GENERAL
- G06T7/00—Image analysis
- G06T7/10—Segmentation; Edge detection
- G06T7/11—Region-based segmentation
-
- G—PHYSICS
- G06—COMPUTING OR CALCULATING; COUNTING
- G06T—IMAGE DATA PROCESSING OR GENERATION, IN GENERAL
- G06T7/00—Image analysis
- G06T7/60—Analysis of geometric attributes
- G06T7/66—Analysis of geometric attributes of image moments or centre of gravity
-
- G—PHYSICS
- G06—COMPUTING OR CALCULATING; COUNTING
- G06V—IMAGE OR VIDEO RECOGNITION OR UNDERSTANDING
- G06V10/00—Arrangements for image or video recognition or understanding
- G06V10/70—Arrangements for image or video recognition or understanding using pattern recognition or machine learning
- G06V10/72—Data preparation, e.g. statistical preprocessing of image or video features
-
- G—PHYSICS
- G06—COMPUTING OR CALCULATING; COUNTING
- G06V—IMAGE OR VIDEO RECOGNITION OR UNDERSTANDING
- G06V10/00—Arrangements for image or video recognition or understanding
- G06V10/70—Arrangements for image or video recognition or understanding using pattern recognition or machine learning
- G06V10/764—Arrangements for image or video recognition or understanding using pattern recognition or machine learning using classification, e.g. of video objects
-
- G—PHYSICS
- G06—COMPUTING OR CALCULATING; COUNTING
- G06V—IMAGE OR VIDEO RECOGNITION OR UNDERSTANDING
- G06V10/00—Arrangements for image or video recognition or understanding
- G06V10/70—Arrangements for image or video recognition or understanding using pattern recognition or machine learning
- G06V10/77—Processing image or video features in feature spaces; using data integration or data reduction, e.g. principal component analysis [PCA] or independent component analysis [ICA] or self-organising maps [SOM]; Blind source separation
- G06V10/774—Generating sets of training patterns; Bootstrap methods, e.g. bagging or boosting
-
- G—PHYSICS
- G06—COMPUTING OR CALCULATING; COUNTING
- G06V—IMAGE OR VIDEO RECOGNITION OR UNDERSTANDING
- G06V10/00—Arrangements for image or video recognition or understanding
- G06V10/70—Arrangements for image or video recognition or understanding using pattern recognition or machine learning
- G06V10/82—Arrangements for image or video recognition or understanding using pattern recognition or machine learning using neural networks
-
- G—PHYSICS
- G01—MEASURING; TESTING
- G01B—MEASURING LENGTH, THICKNESS OR SIMILAR LINEAR DIMENSIONS; MEASURING ANGLES; MEASURING AREAS; MEASURING IRREGULARITIES OF SURFACES OR CONTOURS
- G01B2210/00—Aspects not specifically covered by any group under G01B, e.g. of wheel alignment, caliper-like sensors
- G01B2210/56—Measuring geometric parameters of semiconductor structures, e.g. profile, critical dimensions or trench depth
-
- G—PHYSICS
- G01—MEASURING; TESTING
- G01N—INVESTIGATING OR ANALYSING MATERIALS BY DETERMINING THEIR CHEMICAL OR PHYSICAL PROPERTIES
- G01N21/00—Investigating or analysing materials by the use of optical means, i.e. using sub-millimetre waves, infrared, visible or ultraviolet light
- G01N21/84—Systems specially adapted for particular applications
- G01N21/88—Investigating the presence of flaws or contamination
- G01N21/8851—Scan or image signal processing specially adapted therefor, e.g. for scan signal adjustment, for detecting different kinds of defects, for compensating for structures, markings, edges
- G01N2021/8883—Scan or image signal processing specially adapted therefor, e.g. for scan signal adjustment, for detecting different kinds of defects, for compensating for structures, markings, edges involving the calculation of gauges, generating models
-
- G—PHYSICS
- G06—COMPUTING OR CALCULATING; COUNTING
- G06T—IMAGE DATA PROCESSING OR GENERATION, IN GENERAL
- G06T2207/00—Indexing scheme for image analysis or image enhancement
- G06T2207/20—Special algorithmic details
- G06T2207/20021—Dividing image into blocks, subimages or windows
-
- G—PHYSICS
- G06—COMPUTING OR CALCULATING; COUNTING
- G06T—IMAGE DATA PROCESSING OR GENERATION, IN GENERAL
- G06T2207/00—Indexing scheme for image analysis or image enhancement
- G06T2207/20—Special algorithmic details
- G06T2207/20081—Training; Learning
-
- G—PHYSICS
- G06—COMPUTING OR CALCULATING; COUNTING
- G06T—IMAGE DATA PROCESSING OR GENERATION, IN GENERAL
- G06T2207/00—Indexing scheme for image analysis or image enhancement
- G06T2207/20—Special algorithmic details
- G06T2207/20084—Artificial neural networks [ANN]
-
- G—PHYSICS
- G06—COMPUTING OR CALCULATING; COUNTING
- G06T—IMAGE DATA PROCESSING OR GENERATION, IN GENERAL
- G06T2207/00—Indexing scheme for image analysis or image enhancement
- G06T2207/30—Subject of image; Context of image processing
- G06T2207/30108—Industrial image inspection
- G06T2207/30148—Semiconductor; IC; Wafer
Landscapes
- Engineering & Computer Science (AREA)
- Physics & Mathematics (AREA)
- General Physics & Mathematics (AREA)
- Theoretical Computer Science (AREA)
- Computer Vision & Pattern Recognition (AREA)
- General Health & Medical Sciences (AREA)
- Health & Medical Sciences (AREA)
- Evolutionary Computation (AREA)
- Artificial Intelligence (AREA)
- Computing Systems (AREA)
- Software Systems (AREA)
- Life Sciences & Earth Sciences (AREA)
- Multimedia (AREA)
- Medical Informatics (AREA)
- Databases & Information Systems (AREA)
- Chemical & Material Sciences (AREA)
- Analytical Chemistry (AREA)
- Biochemistry (AREA)
- Immunology (AREA)
- Pathology (AREA)
- Quality & Reliability (AREA)
- Biomedical Technology (AREA)
- Molecular Biology (AREA)
- General Engineering & Computer Science (AREA)
- Mathematical Physics (AREA)
- Data Mining & Analysis (AREA)
- Geometry (AREA)
- Computational Linguistics (AREA)
- Biophysics (AREA)
- Electromagnetism (AREA)
- Image Analysis (AREA)
- Testing Or Measuring Of Semiconductors Or The Like (AREA)
- Image Processing (AREA)
- Length-Measuring Devices Using Wave Or Particle Radiation (AREA)
Abstract
노하우를 요하는 화상 처리의 파라미터 조정이나 입수 곤란한 경우가 있는 설계도의 참조를 따르지 않고 계측 처리의 실행을 가능하게 하는 기술을 제안한다. 본 개시에 관한 계측 시스템은, 반도체의 샘플 화상으로부터 생성된 교사 데이터와 샘플 화상에 기초하여 생성된 학습 모델을 참조하여, 소정의 구조를 갖는 반도체의 입력 화상(계측 대상)으로부터 영역 분할 화상을 생성하고, 당해 영역 분할 화상을 사용하여 화상 계측을 행한다. 여기서, 교사 데이터는, 샘플 화상에 있어서의 반도체의 구조를 포함하는 라벨이 화상의 각 화소에 할당된 화상이며, 학습 모델은, 샘플 화상으로부터 교사 데이터를 추론하기 위한 파라미터를 포함하고 있다(합성도 1 참조).A technology is proposed that enables execution of measurement processing without following parameter adjustment of image processing that requires know-how or reference to design drawings that are sometimes difficult to obtain. The measurement system according to the present disclosure generates a region-segmented image from an input image (measurement target) of a semiconductor having a predetermined structure by referring to teacher data generated from a sample image of a semiconductor and a learning model generated based on the sample image, and performs image measurement using the region-segmented image. Here, the teacher data is an image in which a label including a structure of a semiconductor in the sample image is assigned to each pixel of the image, and the learning model includes parameters for inferring the teacher data from the sample image (see Composite Figure 1).
Description
본 개시는 계측 시스템, 소정의 구조를 포함하는 반도체의 화상 계측을 행할 때 사용하는 학습 모델을 생성하는 방법, 및 컴퓨터에, 소정의 구조를 포함하는 반도체의 화상 계측을 행할 때 사용하는 학습 모델을 생성하는 처리를 실행시키기 위한 프로그램을 저장하는 기억 매체에 관한 것이다.The present disclosure relates to a measurement system, a method for generating a learning model used when performing image measurement of a semiconductor including a predetermined structure, and a storage medium storing a program for causing a computer to execute processing for generating a learning model used when performing image measurement of a semiconductor including a predetermined structure.
근년의 반도체 프로세스에 의해 제조되는 패턴은 미세화가 진행되고, 노광 장치의 복수층간에 걸친 패턴의 중첩, 즉 오버레이의 정밀도 향상이 요구되고 있다. 또한, 오버레이를 고정밀도로 계측하여 노광 장치에 피드백하는 것의 중요성은 금후 점점 높아질 것으로 예상된다.Patterns manufactured by recent semiconductor processes are becoming increasingly refined, and the precision of overlay, that is, the overlapping of patterns across multiple layers of exposure devices, is required to be improved. In addition, the importance of measuring overlay with high precision and feeding it back to the exposure device is expected to increase in the future.
오버레이 계측에 관하여, 예를 들어 특허문헌 1에는, 화상 처리에 의해 입력 화상 상의 휘도 경계에 의해 구획된 휘도 영역을 복수 추출하고, 휘도 영역의 무게 중심의 위치 관계로부터 오버레이 계측을 하는 기술이 개시되어 있다. 또한, 특허문헌 2에는, CAD 화상 등의 설계 화상 혹은 설계 화상으로부터 추측한 입력 화상의 예측 화상을 참조하여, 입력 화상을 화소 단위로 영역 분할하고, 영역 분할된 영역의 무게 중심의 위치 관계로부터 오버레이 계측을 하는 기술이 개시되어 있다. 또한, 특허문헌 3에는, 사전에 수집된 오버레이 계측 대상의 화상의 샘플을 사용하여 화상으로부터 오버레이양(오버레이 계측의 대상인 반도체의 구조의 위치 어긋남양)을 추론하는 기계 학습 모델을 학습해 두고, 기계 학습 모델을 참조하여 입력 화상으로부터 오버레이양을 계측하는 기술이 개시되어 있다.Regarding overlay measurement, for example,
그러나, 특허문헌 1에 개시된 기술에는, 입력 화상에 따라 화상 처리 중의 파라미터를 사람 손으로 조정할 필요가 있고, 또한 파라미터의 조정에 노하우도 필요하기 때문에, 오버레이 계측을 하는 작업자가 전문가에 한정된다고 하는 과제가 있다.However, the technology disclosed in
또한, 특허문헌 2에 개시된 기술에는, 설계 화상이 개시되지 않는 등의 이유로 입수할 수 없는 경우에 운용할 수 없다고 하는 과제가 있다.In addition, the technology disclosed in
또한, 특허문헌 3에 개시된 기술에는, 입력 화상으로부터 오버레이양을 계측하는 과정을 눈으로 보아 확인할 수 없기 때문에, 입력 화상으로부터 예기되지 않는 오버레이양이 계측된 경우에 요인 해석이 곤란하다는 과제가 있다.In addition, the technology disclosed in
본 개시는 이러한 상황을 감안하여 이루어진 것이며, 노하우를 요하는 화상 처리의 파라미터 조정이나 입수 곤란한 경우가 있는 설계도의 참조를 따르지 않고 계측 처리의 실행을 가능하게 하는 기술을 제안한다.The present disclosure has been made in consideration of such circumstances, and proposes a technology that enables execution of measurement processing without following the adjustment of image processing parameters that require know-how or reference to design drawings that are sometimes difficult to obtain.
이상 설명한 과제를 달성하기 위해, 본 개시의 실시 형태는, 소정의 구조를 포함하는 반도체의 화상 계측을 행할 때 사용하는 학습 모델을 생성하는 방법으로서, 적어도 하나의 프로세서가, 반도체의 샘플 화상으로부터 얻어지는 영역 분할 화상에 대하여 적어도 하나의 계측 대상의 구조를 포함하는 라벨을 할당함으로써 교사 데이터를 생성하는 것과, 적어도 하나의 프로세서가, 복수의 층으로 구성되는 네트워크 구조에 기초하여, 샘플 화상의 영역 분할 화상과 교사 데이터를 사용하여, 학습 모델을 생성하는 것을 포함하고, 학습 모델은, 샘플 화상으로부터 교사 데이터를 추론하기 위한 파라미터를 포함하는 방법에 대하여 제안한다.In order to achieve the above-described task, an embodiment of the present disclosure proposes a method for generating a learning model used when performing image measurement of a semiconductor including a predetermined structure, the method including: at least one processor assigning a label including at least one structure of a measurement target to a region-segmented image obtained from a sample image of the semiconductor to generate teacher data; and at least one processor generating a learning model using the region-segmented image of the sample image and the teacher data based on a network structure including a plurality of layers, wherein the learning model includes parameters for inferring the teacher data from the sample image.
본 개시에 관련된 한층 더한 특징은, 본 명세서의 기술, 첨부 도면으로부터 밝혀질 것이다. 또한, 본 개시의 양태는, 요소 및 다양한 요소의 조합 및 이후의 상세한 기술과 첨부되는 청구범위의 양태에 의해 달성되며, 실현된다.Further features related to the present disclosure will be apparent from the description of the present specification and the accompanying drawings. Furthermore, aspects of the present disclosure are achieved and realized by the elements and combinations of various elements and aspects of the detailed description and appended claims.
본 명세서의 기술은 전형적인 예시에 지나지 않으며, 본 개시의 청구범위 또는 적용예를 어떠한 의미에 있어서도 한정하는 것은 아니다.The techniques described herein are merely typical examples and are not intended to limit the scope or applicability of the present disclosure in any way.
본 개시에 따르면, 노하우를 요하는 화상 처리의 파라미터 조정이나 입수 곤란한 경우가 있는 설계도의 참조를 수반하지 않고, 계측 처리를 실행하는 것이 가능하게 된다.According to the present disclosure, it becomes possible to perform measurement processing without involving parameter adjustment of image processing requiring know-how or reference to design drawings that are sometimes difficult to obtain.
도 1은 실시예 1에 의한 교사 데이터 작성부터 오버레이 계측까지의 기능 구성의 일례를 도시하는 도면이다.
도 2는 샘플 화상의 예를 도시하는 도면이다.
도 3은 영역 분할 화상의 예를 도시하는 도면이다.
도 4는 교사 작성부(1)에 의해 제공되는, 샘플 화상(13)으로부터 교사 데이터(14)를 작성하기 위한 유저 인터페이스의 구성예를 도시하는 도면이다.
도 5는 학습 모델(11)에 있어서의 딥 뉴럴 네트워크 구조(179)의 예를 도시하는 도면이다.
도 6은 뉴럴 네트워크 구조(179)와 화상의 기하적인 관계에 대하여 보충 설명하기 위한 도면이다.
도 7은 입력 화상(12)의 일례인 화상(50)을 도시하는 도면이다.
도 8은 그룹화부(4)의 출력의 예를 도시하는 도면이다.
도 9는 그룹화부(4)가 실행하는 그룹화 처리의 상세를 설명하기 위한 흐름도이다.
도 10은 오버레이 계측의 제1 및 제2 계측 대상의 라벨의 예를 도시하는 도면(표)이다.
도 11은 오버레이 계측부(5)가 실행하는 오버레이 계측 처리의 상세를 설명하기 위한 흐름도이다.
도 12는 템플릿 데이터(85)의 구성예를 도시하는 도면이다.
도 13은 오버레이 계측의 제1 및 제2 계측 대상의 라벨의 다른 예를 도시하는 도면(표)이다.
도 14는 실시예 2에 의한 교사 데이터 작성부터 오버레이 계측까지의 기능 구성예를 도시하는 도면이다.
도 15는 샘플 화상의 조(30a 및 30b)와, 영역 분할 화상(라벨이 할당된 교사 데이터)(40a 및 40b)의 예를 도시하는 도면이다.
도 16은 실시예 3에 의한 교사 데이터 작성부터 오버레이 계측까지의 기능 구성예를 도시하는 도면이다.
도 17은 샘플 화상(213)의 구성예를 도시하는 도면이다.
도 18은 교사 데이터(214)의 구성예를 도시하는 도면이다.
도 19는 교사 작성부(201)에 의한 교사 데이터 작성 처리를 설명하기 위한 흐름도이다.
도 20은 스텝 S204의 통계 처리에 의한 보정의 예를 설명하기 위한 도면이다.
도 21은 스텝 S204의 통계 처리에 의한 보정의 다른 예를 설명하는 도면이다.
도 22는 실시예 4의 교사 데이터 작성부터 오버레이 계측까지의 기능 구성예를 도시하는 도면이다.
도 23은 위치 정보 화상(340)의 예를 도시하는 도면이다.
도 24는 위치 정보 화상(360)의 예를 도시하는 도면이다.
도 25는 오버레이 계측부(305)에 의한 오버레이 계측 처리를 설명하기 위한 흐름도이다.
도 26은 실시예 5에 의한 교사 데이터 작성부터 오버레이 계측까지의 기능 구성예를 도시하는 도면이다.
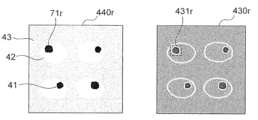
도 27은 영역 분할 화상(440)으로부터 추론된 화상(430)의 예를 도시하는 도면이다.
도 28은 영역 분할 화상(440) 중에서 소영역(71q)을 레이아웃 변경한 경우의 예를 도시하는 도면이다.
도 29는 영역 분할 화상(440) 중에서 소영역(71q)을 레이아웃 변경하였을 때에 차폐가 생겼을 때의 예(라벨 43, 41 및 42의 순으로 전방측에 있다고 정하였을 때의 예)를 도시하는 도면이다.
도 30은 실시예 6에 의한 교사 데이터 작성부터 화상 계측 검사까지의 기능 구성예를 도시하는 도면이다.
도 31은 본 실시 형태(각 실시예 공통)에 의한 계측 시스템(310)의 개략 구성예를 도시하는 도면이다.Figure 1 is a diagram showing an example of the functional configuration from teacher data creation to overlay measurement according to Example 1.
Figure 2 is a drawing showing an example of a sample image.
Figure 3 is a drawing showing an example of a region segmentation image.
Figure 4 is a diagram showing an example configuration of a user interface for creating teacher data (14) from a sample image (13) provided by the teacher writing unit (1).
Figure 5 is a diagram illustrating an example of a deep neural network structure (179) in a learning model (11).
Figure 6 is a drawing for supplementary explanation of the geometric relationship between the neural network structure (179) and the image.
Figure 7 is a drawing showing an image (50) which is an example of an input image (12).
Figure 8 is a drawing showing an example of the output of the grouping unit (4).
Figure 9 is a flow chart for explaining the details of the grouping process executed by the grouping unit (4).
Figure 10 is a drawing (table) showing examples of labels of first and second measurement targets of overlay measurement.
Figure 11 is a flow chart for explaining the details of the overlay measurement processing executed by the overlay measurement unit (5).
Figure 12 is a drawing showing an example of the configuration of template data (85).
FIG. 13 is a drawing (table) showing another example of labels of first and second measurement targets of overlay measurement.
Figure 14 is a diagram showing an example of a functional configuration from teacher data creation to overlay measurement according to Example 2.
Figure 15 is a diagram showing examples of sample images (30a and 30b) and region segmentation images (teacher data with assigned labels) (40a and 40b).
Figure 16 is a diagram showing an example of a functional configuration from teacher data creation to overlay measurement according to Example 3.
Figure 17 is a drawing showing an example of the configuration of a sample image (213).
Figure 18 is a diagram showing an example of the configuration of teacher data (214).
Figure 19 is a flow chart for explaining the teacher data creation process by the teacher writing section (201).
Figure 20 is a drawing for explaining an example of correction by statistical processing of step S204.
Figure 21 is a drawing explaining another example of correction by statistical processing of step S204.
Figure 22 is a diagram showing an example of the functional configuration from teacher data creation to overlay measurement in Example 4.
Figure 23 is a drawing showing an example of a location information image (340).
Figure 24 is a drawing showing an example of a location information image (360).
Figure 25 is a flow chart for explaining overlay measurement processing by the overlay measurement unit (305).
Figure 26 is a diagram showing an example of a functional configuration from teacher data creation to overlay measurement according to Example 5.
Figure 27 is a drawing showing an example of an image (430) inferred from a region segmentation image (440).
Figure 28 is a drawing showing an example of a case where the layout of a small area (71q) among the area segmentation images (440) has been changed.
Figure 29 is a drawing showing an example of when a shield is created when the layout of a small area (71q) among the area segmentation images (440) is changed (an example when
Figure 30 is a diagram showing an example of a functional configuration from teacher data creation to image measurement inspection according to Example 6.
Fig. 31 is a drawing showing a schematic configuration example of a measurement system (310) according to the present embodiment (common to each embodiment).
본 실시 형태 및 각 실시예는, 소정의 구조(예를 들어, 다층 구조)를 갖는 반도체에 있어서의 화상 계측을 행하는 계측 시스템에 관한 것으로, 보다 구체적으로는 반도체가 다층 구조인 경우, 층간의 어긋남양을 계측하는 오버레이 계측을 행하는 계측 시스템에 관한 것이다. 단, 본 개시에 의한 기술은, 오버레이 계측에 한정하여 적용되는 것은 아니며, 넓게 화상 계측 일반에 적용할 수 있는 것이다.The present embodiment and each example relate to a measurement system for performing image measurement in a semiconductor having a predetermined structure (e.g., a multilayer structure), and more specifically, to a measurement system for performing overlay measurement for measuring the amount of misalignment between layers when the semiconductor has a multilayer structure. However, the technology according to the present disclosure is not limited to overlay measurement, and can be broadly applied to image measurement in general.
이하, 첨부 도면을 참조하여 본 개시의 실시 형태 및 실시예에 대하여 설명한다. 첨부 도면에서는, 기능적으로 동일한 요소는 동일한 번호로 표시되는 경우도 있다. 또한, 첨부 도면은 본 개시의 원리에 준한 구체적인 실시 형태와 실시예를 도시하고 있지만, 이들은 본 개시의 이해를 위한 것이며, 결코 본 개시를 한정적으로 해석하기 위해 사용되는 것은 아니다.Hereinafter, embodiments and examples of the present disclosure will be described with reference to the accompanying drawings. In the accompanying drawings, functionally identical elements may be represented by the same numbers. In addition, although the accompanying drawings illustrate specific embodiments and examples based on the principles of the present disclosure, these are provided for understanding the present disclosure and are by no means intended to limit the present disclosure.
본 실시 형태에서는, 당업자가 본 개시를 실시하는 데 충분히 상세하게 그 설명이 이루어져 있지만, 다른 실장ㆍ형태도 가능하며, 본 개시의 기술적 사상의 범위와 정신을 일탈하지 않고 구성ㆍ구조의 변경이나 다양한 요소의 치환이 가능한 것을 이해할 필요가 있다. 따라서, 이후의 기술을 이것에 한정하여 해석해서는 안된다.In this embodiment, the description is provided in sufficient detail to enable a person skilled in the art to practice the present disclosure, but it should be understood that other implementations and forms are possible, and that changes in the configuration and structure or substitution of various elements are possible without departing from the scope and spirit of the technical idea of the present disclosure. Accordingly, the following description should not be interpreted as being limited thereto.
또한, 본 개시의 실시 형태는, 후술되는 바와 같이, 범용 컴퓨터 상에서 가동하는 소프트웨어로 실장해도 되고 전용 하드웨어 또는 소프트웨어와 하드웨어의 조합으로 실장해도 된다.In addition, embodiments of the present disclosure may be implemented as software running on a general-purpose computer, as described below, or may be implemented as dedicated hardware or a combination of software and hardware.
또한, 이후의 설명에서는 「테이블」 형식에 의해 본 개시의 각 정보에 대하여 설명하지만, 이들 정보는 반드시 테이블에 의한 데이터 구조로 표현되어 있지 않아도 되며, 리스트, DB, 큐 등의 데이터 구조나 그 이외로 표현되어 있어도 된다. 그 때문에, 데이터 구조에 의존하지 않는 것을 나타내기 위해 「테이블」, 「리스트」, 「DB」, 「큐」 등에 대하여 간단히 「정보」라고 칭하는 경우가 있다.In addition, although the following description describes each piece of information of the present disclosure in the form of a "table", this information does not necessarily have to be expressed in a data structure using a table, and may be expressed in a data structure such as a list, DB, queue, or something else. Therefore, in order to indicate that it is not dependent on a data structure, "table", "list", "DB", "queue", etc. are sometimes simply referred to as "information".
또한, 각 정보의 내용을 설명할 때, 「번호」, 「식별 정보」, 「식별자」, 「명」, 「이름」, 「ID」라는 표현을 사용하는 것이 가능하며, 이들에 대해서는 서로 치환이 가능하다.In addition, when explaining the contents of each piece of information, it is possible to use the expressions “number,” “identification information,” “identifier,” “name,” “name,” and “ID,” and these can be interchanged with each other.
(1) 실시 형태(1) Implementation form
본 실시 형태(및 실시예 1 내지 6)는, 예를 들어 소정의 구조(예를 들어, 다층 구조)를 포함하는 반도체의 화상 계측을 행하는 계측 시스템에 관한 것이다. 당해 계측 시스템은, 반도체의 샘플 화상으로부터 생성된 교사 데이터와 샘플 화상에 기초하여 생성된 학습 모델을 참조하여, 소정의 구조를 갖는 반도체의 입력 화상(계측 대상)으로부터 영역 분할 화상을 생성하고, 당해 영역 분할 화상을 사용하여 화상 계측을 행한다. 여기서, 교사 데이터는, 샘플 화상에 있어서의 반도체의 구조를 포함하는 라벨이 화상의 각 화소에 할당된 화상이며, 학습 모델은, 샘플 화상으로부터 교사 데이터를 추론하기 위한 파라미터를 포함하고 있다. 이 학습 모델을 사용함으로써, 샘플 화상으로부터 교사 데이터로의 추론이 입력 화상에 대하여 적용되므로, 입력 화상의 설계 데이터를 사용하지 않고 계측 처리를 실행하는 것이 가능하게 된다.The present embodiment (and Examples 1 to 6) relate to a measurement system that performs image measurement of a semiconductor including, for example, a predetermined structure (for example, a multilayer structure). The measurement system generates a region-segmented image from an input image (a measurement target) of a semiconductor having a predetermined structure by referring to teacher data generated from a sample image of the semiconductor and a learning model generated based on the sample image, and performs image measurement using the region-segmented image. Here, the teacher data is an image in which a label including the structure of the semiconductor in the sample image is assigned to each pixel of the image, and the learning model includes parameters for inferring the teacher data from the sample image. By using this learning model, inference from the sample image to the teacher data is applied to the input image, so that it becomes possible to perform measurement processing without using design data of the input image.
도 31은, 본 실시 형태(각 실시예 공통)에 의한 계측 시스템(310)의 개략 구성예를 도시하는 도면이다. 계측 시스템(310)은, 예를 들어 오버레이 계측을 실행하는 오버레이 계측 시스템, 반도체 화상 중의 윤곽 추출이나 홀 형상 등의 치수를 계측하는 치수 계측 시스템, 결함 패턴 등을 검출하는 결함 패턴 검출 시스템, 설계도의 추론과 실제의 설계도의 대조 위치를 탐색하는 패턴 매칭 시스템 등에 상당한다.Fig. 31 is a diagram illustrating a schematic configuration example of a measurement system (310) according to the present embodiment (common to each embodiment). The measurement system (310) corresponds to, for example, an overlay measurement system that performs overlay measurement, a dimension measurement system that measures dimensions such as outline extraction or hole shape in a semiconductor image, a defect pattern detection system that detects defect patterns, etc., a pattern matching system that searches for a comparison position between a design drawing inference and an actual design drawing, etc.
계측 시스템(310)은, 예를 들어 메인 프로세서(190)를 포함하는 메인 계산기(191)와, 메인 계산기(191)에 지시나 데이터를 입력함과 함께, 연산 결과를 출력하는 입출력 장치(192)와, 측정 대상의 화상을 공급하는 전자 현미경 혹은 전자 현미경의 화상을 축적하는 서버 계산기(193)(이하, 전자 현미경 등이라고 함)와, 제1 서브 프로세서(190a)를 포함하는 제1 서브 계산기(191a)와, 제2 서브 프로세서(190b)를 포함하는 제2 서브 계산기(191b)를 구비하고, 각각의 구성 요소가 네트워크(예를 들어, LAN 등)에 의해 접속되어 있다. 또한, 도 31에 있어서, 제1 및 제2 서브 계산기(191a 및 191b)가 2개 마련되어 있지만, 모든 연산을 메인 계산기 중에서 실행해도 되고, 메인 계산기(191)를 보조하기 위한 서브 계산기를 1 이상 마련해도 된다.The measuring system (310) comprises, for example, a main computer (191) including a main processor (190), an input/output device (192) for inputting instructions or data into the main computer (191) and outputting calculation results, an electron microscope for supplying an image of a measurement target or a server computer (193) (hereinafter referred to as an electron microscope, etc.) for accumulating images of the electron microscope, a first sub-computer (191a) including a first sub-processor (190a), and a second sub-computer (191b) including a second sub-processor (190b), and each component is connected by a network (for example, a LAN, etc.). In addition, although two first and second sub-computers (191a and 191b) are provided in FIG. 31, all calculations may be executed in the main computer, or one or more sub-computers may be provided to assist the main computer (191).
메인 계산기(191)는, 후술하는, 도 1, 14, 16, 22, 26 및 30에 있어서의 교사 작성 처리 및 학습 모델 작성 처리(각 도면에 있어서의 교사 작성부 및 학습부에 대응하는 처리)를 실행한다. 또한, 추론 처리 및 계측 처리(각 도면에 있어서의 영역 분할부, 그룹화부 및 계측부(오버레이 계측부)에 대응하는 처리)는, 메인 계산기(191) 혹은 제1 서브 계산기(191a) 및 제2 서브 계산기(191b)에서 분산하여 처리해도 된다. 또한, 제1 서브 계산기(191a) 및 제2 서브 계산기(191b)에서는, 추론 처리 및 계측 처리만 실행하고, 교사 작성 처리 및 학습 모델 작성 처리는 실행하지 않도록 구성할 수 있다. 또한, 서브 계산기가 복수 설치되어 있는 경우(예를 들어, 제1 서브 계산기(191a) 및 제2 서브 계산기(191b))에는, 각 서브 계산기간에서 추론 처리 및 계측 처리를 분산시켜도 된다.The main calculator (191) executes the teacher writing processing and the learning model writing processing (processing corresponding to the teacher writing section and the learning section in each drawing) in FIGS. 1, 14, 16, 22, 26, and 30, which will be described later. In addition, the inference processing and the measurement processing (processing corresponding to the area division section, the grouping section, and the measurement section (overlay measurement section) in each drawing) may be processed in a distributed manner in the main calculator (191) or in the first sub-computer (191a) and the second sub-computer (191b). In addition, the first sub-computer (191a) and the second sub-computer (191b) may be configured to execute only the inference processing and the measurement processing, and not the teacher writing processing and the learning model writing processing. In addition, in a case where a plurality of sub-computers are installed (for example, the first sub-computer (191a) and the second sub-computer (191b)), the inference processing and the measurement processing may be distributed among the respective sub-computer periods.
전자 현미경 등(193)은, 예를 들어 웨이퍼 상에 형성된 반도체 패턴 화상을 취득(촬상)하고, 메인 계산기(191)나 서브 계산기(191a 및 191b)에 제공한다. 전자 현미경 등(193)이 서버 계산기인 경우, 서버 계산기는, 전자 현미경에 의해 촬상된 반도체 패턴 화상을 기억 디바이스(예를 들어, 하드 디스크 드라이브(HDD))에 저장하고, 메인 계산기(191)의 지시에 응답하여, 지시에 대응하는 화상을 메인 계산기(191) 등에 제공한다.An electron microscope, etc. (193) acquires (captures) an image of a semiconductor pattern formed on, for example, a wafer, and provides the image to a main computer (191) or a sub-computer (191a and 191b). When the electron microscope, etc. (193) is a server computer, the server computer stores the semiconductor pattern image captured by the electron microscope in a storage device (e.g., a hard disk drive (HDD)) and, in response to an instruction from the main computer (191), provides an image corresponding to the instruction to the main computer (191), etc.
이하, 계측 시스템(310)에 있어서 실행되는 처리의 각 실시예에 대하여 상세하게 설명한다. 또한, 실시예 1부터 5까지는, 계측예로서 오버레이 계측을 예시하고 있다. 실시예 6에 있어서는, 본 개시의 기술을 모든 계측 처리에 적용할 수 있는 것이 명시되어 있다.Hereinafter, each embodiment of the processing executed in the measurement system (310) will be described in detail. In addition,
(2) 실시예 1(2) Example 1
도 1은, 실시예 1에 의한 교사 데이터 작성부터 오버레이 계측까지의 기능 구성의 일례를 도시하는 도면이다. 교사 작성부(1) 및 학습부(2)의 기능은, 메인 계산기(191)의 메인 프로세서(190)가 도시하지 않은 기억부로부터 대응하는 각 처리 프로그램을 읽어들임으로써 실현된다. 또한, 영역 분할부(3), 그룹화부(4) 및 오버레이 계측부(5)의 기능은, 메인 계산기(191)의 메인 프로세서(190) 혹은 서브 계산기(191a나 191b)의 서브 프로세서(190a나 190b)가 도시하지 않은 기억부로부터 대응하는 각 프로그램을 읽어들임으로써 실현된다.Fig. 1 is a diagram showing an example of a functional configuration from teacher data creation to overlay measurement according to Example 1. The functions of the teacher creation section (1) and the learning section (2) are realized by the main processor (190) of the main computer (191) reading the corresponding processing programs from a memory section (not shown). In addition, the functions of the area division section (3), the grouping section (4), and the overlay measurement section (5) are realized by the main processor (190) of the main computer (191) or the subprocessor (190a or 190b) of the subcomputer (191a or 191b) reading the corresponding programs from a memory section (not shown).
<기능 구성의 개요><Overview of the functional configuration>
우선, 도 1에 도시되는 교사 데이터 작성부터 오버레이 계측까지의 기능 구성의 개요에 대하여 설명한다. 샘플 화상(13)은, 사전에 수집된 오버레이 계측의 대상으로 하는 화상의 샘플이다. 교사 데이터(14)는, 오버레이 계측의 계측 대상으로 되는 반도체 내의 구조를 포함하는 라벨을 화상 중의 각 화소에 할당한 영역 분할 화상을, 샘플 화상(13)의 각각에 대하여 준비한 것이다.First, an outline of the functional configuration from teacher data creation to overlay measurement as shown in Fig. 1 is explained. The sample image (13) is a sample of an image that is the target of overlay measurement collected in advance. The teacher data (14) is an area-divided image that assigns a label including a structure in a semiconductor that is the target of overlay measurement to each pixel in the image, prepared for each of the sample images (13).
교사 작성부(1)는, 샘플 화상(13)으로부터 교사 데이터(14)를 작성함과 함께, 교사 데이터(14)를 작성하기 위한 유저 인터페이스도 제공한다. 학습 모델(11)은, 화상(예를 들어, 샘플 화상)으로부터 영역 화상 분할을 구하는 기계 학습 모델 중의 계수 등의 파라미터이다. 학습부(2)는, 샘플 화상(13)이 입력되었을 때 교사 데이터(14)에 가능한 한 가까운 영역 분할 화상을 추론하는 학습 모델(11)을 계산한다.The teacher creation unit (1) creates teacher data (14) from a sample image (13), and also provides a user interface for creating the teacher data (14). The learning model (11) is a parameter such as a coefficient in a machine learning model that obtains a region image segmentation from an image (e.g., a sample image). The learning unit (2) calculates a learning model (11) that infers a region segmentation image that is as close as possible to the teacher data (14) when a sample image (13) is input.
입력 화상(12)은, 오버레이 계측 시에 있어서, 계측의 대상으로 되는 화상이다. 영역 분할부(3)는, 학습 모델(11)을 참조하여, 입력 화상(12)으로부터 영역 분할 화상을 추론한다. 그룹화부(4)는, 영역 분할 화상 중의 오버레이 계측의 계측 대상을 소영역의 단위로 그룹화를 행한다. 오버레이 계측부(5)는, 그룹화부(4)가 그룹화한 소영역의 위치로부터 오버레이 계측을 행한다.The input image (12) is an image to be measured in overlay measurement. The region segmentation unit (3) infers a region segmentation image from the input image (12) by referring to the learning model (11). The grouping unit (4) groups measurement targets of overlay measurement among the region segmentation images into small-area units. The overlay measurement unit (5) performs overlay measurement from the position of the small-area grouped by the grouping unit (4).
이상의 교사 작성부(1), 학습부(2), 영역 분할부(3), 그룹화부(4) 및 오버레이 계측부(5)의 각 기능은, 임의의 계산기 상에 있어서의 신호 처리에 의해 실현할 수 있다.Each function of the above teacher writing section (1), learning section (2), area division section (3), grouping section (4), and overlay measurement section (5) can be realized by signal processing on any calculator.
<각 기능 구성의 상세><Details of each function configuration>
이하, 실시예 1의 각 기능 구성의 상세에 대하여 설명한다. 샘플 화상(13)은, 오버레이 계측을 운용하는 것보다도 전에 촬상된 화상으로서, 계측 대상으로 되는 반도체의 시료 혹은 계측 대상으로 되는 반도체의 시료에 화상의 외관이 가까운 시료의 화상이다. 샘플 화상(13)은, 오버레이 계측을 운용하는 전자 현미경 혹은 이 전자 현미경과 촬영 화상의 화질이 가까운 전자 현미경에 의해 수집할 수 있다.Hereinafter, the details of each functional configuration of Example 1 will be described. The sample image (13) is an image captured before operating the overlay measurement, and is an image of a semiconductor sample to be measured or an image of a sample whose image appearance is close to that of the semiconductor sample to be measured. The sample image (13) can be collected by an electron microscope that operates the overlay measurement or an electron microscope whose image quality is close to that of the captured image.
(i) 도 2는, 샘플 화상의 예를 도시하는 도면이다. 도 2에 있어서의 화상(30)은, 예를 들어 샘플 화상의 일부를 도시하고 있다. 화상(30) 내에는 오버레이의 계측 대상의 반도체 내의 구조가 포함되어 있다. 샘플 화상은, 화상(30)과 마찬가지의 화상 1매 이상으로 구성된다.(i) Fig. 2 is a drawing showing an example of a sample image. The image (30) in Fig. 2 shows, for example, a part of a sample image. The image (30) includes a structure within a semiconductor that is a measurement target of the overlay. The sample image is composed of one or more images similar to the image (30).
(ii) 교사 데이터(14)는, 샘플 화상(13) 중의 각각의 화상(30)으로부터 구한 영역 분할 화상으로 구성된다. 도 3은, 영역 분할 화상의 예를 도시하는 도면이다. 도 3에 있어서, 영역 분할 화상(40)에는, 화상(30) 중의 각 화소에 있어서, 제1 계측 대상, 제2 계측 대상 및 배경을 나타내는 라벨 41, 라벨 42 및 라벨 43이 할당되어 있다. 라벨 41 및 42에 대응하는 제1 계측 대상 및 제2 계측 대상은 오버레이의 계측 대상이며, 예를 들어 비아나 트렌치 및 그 밖의 반도체 내의 구조에 상당한다. 반도체 내의 구조를 어떻게 정할지는, 오버레이 계측의 운용에 따라 사전에 결정된다. 또한, 영역 분할 화상(40)에는 라벨 41, 42 및 43 이외에도 부가적인 라벨이 할당되도록 해도 된다. 예를 들어, 도 3 중에 있어서 영역 분할 화상(40) 중에는, 학습부(2)가 제외하는 무효 영역에 따른 라벨 49가 할당되어 있다.(ii) The teacher data (14) is composed of region segmentation images obtained from each image (30) among the sample images (13). Fig. 3 is a diagram showing an example of a region segmentation image. In Fig. 3, labels 41, 42, and 43 indicating a first measurement target, a second measurement target, and a background are assigned to the region segmentation image (40) for each pixel in the image (30). The first measurement target and the second measurement target corresponding to
(iii) 도 4는, 교사 작성부(1)에 의해 제공되는, 샘플 화상(13)으로부터 교사 데이터(14)를 작성하기 위한 유저 인터페이스의 구성예를 도시하는 도면이다. 도 4에 있어서, 당해 유저 인터페이스는, 예를 들어 주 화면(90)과, 입력 화면(91)과, 입력 선택 영역(92)과, 입력 펜(93)을 포함한다. 입력 화면(91)에서는, 작업자가 입력 선택(92)의 라디오 버튼 중에서 어느 항목을 선택한 상태에서, 화상(30) 상에 있어서 입력 펜(93)을 조작(예를 들어, 라벨 지정하는 영역을 빈틈없이 칠함) 함으로써, 라벨이 입력 펜으로 조작된 영역에 할당된다. 입력 선택(92)은, 제1 계측 대상, 제2 계측 대상, 배경의 라디오 버튼의 항목의 선택에 따라, 순서대로 라벨 41, 42 및 43이 선택된다. 입력 펜(93)에 의해 입력된 개소에는, 입력 선택(92)에서 선택된 라벨에 따라, 소정의 색 혹은 해조(계조)가 할당된다.(iii) Fig. 4 is a diagram showing an example of a configuration of a user interface for creating teacher data (14) from a sample image (13) provided by a teacher writing unit (1). In Fig. 4, the user interface includes, for example, a main screen (90), an input screen (91), an input selection area (92), and an input pen (93). In the input screen (91), when a worker selects an item from among the radio buttons of the input selection (92) and operates the input pen (93) on the image (30) (for example, by filling in the area to be labeled without gaps), a label is assigned to the area operated by the input pen. In the input selection (92), labels 41, 42, and 43 are selected in order according to the selection of the items of the first measurement target, the second measurement target, and the background radio buttons. A predetermined color or tone (gradation) is assigned to a location entered by the input pen (93) according to the label selected in the input selection (92).
입력 선택(92)은, 무효 영역(49)과 같은 부가적인 라벨을 선택할 수 있는 항목을 포함하고 있어도 된다. 또한, 입력 선택(92)에 있어서의 유저 인터페이스는 일례로서, 라디오 버튼에 첨부된 문자열을 바꾸는 것이나, 라디오 버튼 이외의 유저 인터페이스를 마련해도 된다. 선택용 영역(94)은, 화상(30) 중의 일부에 라벨 41, 42 및 43이 할당된 예를 나타내고 있다. 그리고, 화상(30)의 전체 영역에 마찬가지의 라벨이 할당됨으로써 영역 분할 화상(40)이 작성된다.The input selection (92) may include an item that can select an additional label, such as an invalid area (49). In addition, the user interface in the input selection (92) may be, for example, a user interface other than a radio button, such as changing a string attached to a radio button. The selection area (94) shows an example in which labels 41, 42, and 43 are assigned to a part of the image (30). Then, a region-segmented image (40) is created by assigning the same label to the entire area of the image (30).
이상 설명한 교사 작성부(1)를 사용함으로써, 노하우를 필요로 하는 파라미터 조정이나 설계도의 참조를 필요로 하지 않고, 작업자는 샘플 화상(13)으로부터 교사 데이터(14)를 평이한 작업으로 작성할 수 있다.By using the teacher writing section (1) described above, the worker can easily write teacher data (14) from a sample image (13) without needing parameter adjustment or reference to a design drawing that requires know-how.
(iv) 도 5는, 학습 모델(11)에 있어서의 딥 뉴럴 네트워크 구조(179)의 예를 도시하는 도면이다. 딥 뉴럴 네트워크 구조(179)는, 예를 들어 입력층(170)과, 출력층(171)과, 복수의 중간층(172, 173 및 174)에 의해 구성할 수 있다.(iv) Fig. 5 is a diagram illustrating an example of a deep neural network structure (179) in a learning model (11). The deep neural network structure (179) can be composed of, for example, an input layer (170), an output layer (171), and a plurality of intermediate layers (172, 173, and 174).
입력층(170)에는, 화상(30)이 저장된다. 입력층(170)으로부터 중간층(172), 그리고 중간층(172)으로부터 중간층(173)으로는, 소정 계수 필터에 의한 컨볼루션 연산이나 화상 축소에 의해 층 내의 데이터가 집약된다. 한편, 중간층(173)으로부터 중간층(174), 및 중간층(174)으로부터 출력층(171)에는, 소정 계수 필터에 의한 컨볼루션 연산이나 화상 확대에 의해 층 내의 데이터가 전개된다. 이러한 네트워크 구조는 일반적으로 콘벌루션 뉴럴 네트워크라고 불린다. 출력층(최종층)(171) 내의 데이터는, 영역 분할 화상(40) 중의 라벨별의 우도를 나타낸다. 우도가 최대로 되는 라벨이 각 화소에 할당됨으로써 영역 분할 화상(40)을 구할 수 있다. 학습 모델(11)은, 중간층에 있어서의 필터의 계수에 상당한다. 또한, 딥 뉴럴 네트워크 구조(179)는, 학습 모델(11)에 있어서의 네트워크 구조의 일례이며, 172 등의 중간층의 수는 도 5에 나타내는 3개에 한정되지 않는다. 또한, 중간층(172과 174)을 연결하는 바이패스 구조와 같은 부가적인 구조를 취하는 것이나 필터 연산에 더한 부가적인 연산을 첨가할 수 있다. 학습 모델(11)에 있어서의 네트워크 구조에 대한 부가적인 구조나 부가적인 연산의 추가에 수반하여 부가적인 파라미터가 추가되는 경우에는, 학습 모델(11)에는 부가적인 파라미터도 추가되게 된다.In the input layer (170), an image (30) is stored. From the input layer (170) to the intermediate layer (172), and from the intermediate layer (172) to the intermediate layer (173), data within the layer is concentrated by a convolution operation using a predetermined coefficient filter or an image reduction. On the other hand, from the intermediate layer (173) to the intermediate layer (174), and from the intermediate layer (174) to the output layer (171), data within the layer is expanded by a convolution operation using a predetermined coefficient filter or an image enlargement. This network structure is generally called a convolutional neural network. Data within the output layer (final layer) (171) represents the likelihood of each label in the region-segmented image (40). The region-segmented image (40) can be obtained by assigning a label with a maximum likelihood to each pixel. The learning model (11) corresponds to the coefficients of the filter in the intermediate layer. In addition, the deep neural network structure (179) is an example of the network structure in the learning model (11), and the number of intermediate layers such as 172 is not limited to three as shown in Fig. 5. In addition, an additional structure such as a bypass structure connecting the intermediate layers (172 and 174) may be adopted, or an additional operation in addition to the filter operation may be added. In the case where an additional parameter is added along with the addition of an additional structure or an additional operation to the network structure in the learning model (11), the additional parameter is also added to the learning model (11).
(v) 도 6은, 뉴럴 네트워크 구조(179)와 화상의 기하적인 관계에 대하여 보충 설명하기 위한 도면이다. 도 6에서는, 화상(30) 중의 화소(175) 및 영역 분할 화상(40)에 있어서 화소(175)와 동일 좌표의 화소(177)에 착안한다. 이때, 입력층(170) 중에 있어서, 수용야(176)(수용야란, 라벨의 결정에 관여하는 화상 범위이며, 그 크기는 뉴럴 네트워크 구조(179)에 따라 정해짐)라고 불리는 화소(175)의 소정 범위의 근방 영역이 관여한다. 그리고, 입력층(170) 중의 수용야(176)의 데이터로부터는, 컨볼루션 연산이나 화상 확대와 화상 축소에 의해 중간층(172, 173 및 174)의 데이터가 구해지고, 출력층(171) 중에 있어서 화소(177)의 라벨이 정해진다. 또한, 실제로는 화상(30) 중의 각 화소로부터 영역 분할 화상(40) 중의 각 화소의 라벨이 병렬 연산적으로 보다 효율적으로 구해진다.(v) Fig. 6 is a drawing for supplementary explanation of the geometric relationship between the neural network structure (179) and the image. In Fig. 6, the pixel (175) in the image (30) and the pixel (177) in the region-divided image (40) with the same coordinates as the pixel (175) are focused on. At this time, in the input layer (170), a neighborhood of a predetermined range of the pixel (175) called the receptive field (176) (the receptive field is an image range involved in determining the label, and its size is determined according to the neural network structure (179)) is involved. Then, from the data of the receptive field (176) in the input layer (170), data of the intermediate layers (172, 173, and 174) are obtained by a convolution operation or image enlargement and reduction, and the label of the pixel (177) in the output layer (171) is determined. In addition, in reality, the label of each pixel in the region segmented image (40) is obtained more efficiently through parallel computation from each pixel in the image (30).
학습부(2)는, 샘플 화상(13)과 교사 데이터(14)를 참조하여, 화상(30)이 부여되었을 때 영역 분할 화상(40)을 추론하기 위한 학습 모델(11)의 파라미터를 계산한다. 구체적으로는, 학습부(2)는, 예를 들어 샘플 화상(13) 중의 화상(30)으로부터 영역 분할 화상(40)을 추론하고, 추론된 영역 분할 화상(40)과 교사 데이터(14) 중의 화상(30)에 대응한 영역 분할 화상(40)을 비교하여, 양자의 영역 분할 화상(40)의 차가 최적 또한 최소인 학습 모델(11)을 산출한다. 예를 들어, 양쪽 영역 분할 화상(40)의 차를 양자의 전체 화소 중에서 라벨이 다른 화소의 수로 하고, 화소의 수에 대한 학습 모델(11)(뉴럴 네트워크 구조(179)) 중의 각 요소의 편미분 계수를 구한다. 그리고, 학습 모델(11) 중의 각 요소에 편미분 계수에 마이너스의 소정 계수를 승산한 것을 가산하여 갱신하는(화소의 수가 줄어들도록 조금씩 갱신하는) 것을 샘플 화상(13) 중의 각각의 화상(30)에서 축차적으로 행하는 방법이 있다. 단, 이 방법에 한하지 않는다. 여기서, 교사 데이터(14) 중의 대응한 영역 분할 화상(40)에 라벨 49(무효 영역)가 포함되어 있던 경우에는, 그 부분을 라벨이 다른 화소의 수의 집계로부터 제외한다.The learning unit (2) calculates parameters of a learning model (11) for inferring a region segmentation image (40) when an image (30) is given by referring to a sample image (13) and teacher data (14). Specifically, the learning unit (2) infers a region segmentation image (40) from an image (30) in the sample image (13), for example, and compares the inferred region segmentation image (40) with a region segmentation image (40) corresponding to the image (30) in the teacher data (14), and calculates a learning model (11) in which the difference between the region segmentation images (40) of the two is optimal and minimum. For example, the difference between the two region segmentation images (40) is taken as the number of pixels having different labels among all pixels of the two, and the partial differential coefficients of each element in the learning model (11) (neural network structure (179)) with respect to the number of pixels are obtained. And, there is a method of sequentially performing the update (updating little by little so that the number of pixels decreases) by adding the result of multiplying the partial differential coefficient by a predetermined negative coefficient to each element of the learning model (11) in each image (30) of the sample image (13). However, this method is not limited to this method. Here, if the corresponding region segmentation image (40) in the teacher data (14) includes the label 49 (invalid region), that part is excluded from the aggregation of the number of pixels with different labels.
또한, 학습부(2)는, 학습 모델(11)을 생성할 때, 샘플 화상(13) 중의 화상(30)에 랜덤 노이즈를 더하거나, 확대나 축소 그리고 좌우 반전이나 상하 반전 등의 기하 변환을 실시하는 등의 합성 처리를 행한 합성 화상을 더하거나 해도 된다. 합성 화상을 더함으로써, 학습부(2)는 보다 풍부한 수의 화상(30)으로부터 학습 모델(11)을 구할 수 있다.In addition, when generating a learning model (11), the learning unit (2) may add a synthetic image that has undergone a synthetic process, such as adding random noise to an image (30) among the sample images (13), or performing a geometric transformation, such as enlargement or reduction, left-right inversion, or up-down inversion. By adding a synthetic image, the learning unit (2) can obtain a learning model (11) from a richer number of images (30).
(vi) 입력 화상(12)은, 오버레이 계측 시에 촬영된 화상이다. 도 7는, 입력 화상(12)의 일례인 화상(50)을 도시하는 도면이다. 도 7의 화상(50)에 있어서의 영역(59)은, 샘플 화상(13) 중의 화상(30)과 동일 정도의 치수의 영역이며, 오버레이 계측 대상으로 되는 반도체 내의 구조를 포함하고 있다. 화상(50)의 영역(59)의 밖에는, 영역(59)과 마찬가지로 오버레이 계측 대상으로 되는 반도체 내의 구조가 주기적으로 비치고 있다.(vi) The input image (12) is an image captured during overlay measurement. Fig. 7 is a drawing showing an image (50) which is an example of the input image (12). The area (59) in the image (50) of Fig. 7 is an area having the same dimensions as the image (30) in the sample image (13), and includes a structure within the semiconductor that is the target of the overlay measurement. Outside the area (59) of the image (50), the structure within the semiconductor that is the target of the overlay measurement is periodically reflected, similarly to the area (59).
영역 분할부(3)는, 학습 모델(11)을 참조하여, 입력 화상(12)으로부터 도 7 중의 영역 분할 화상(60)을 추론한다. 영역 분할 화상(60) 중의 영역(69)은, 영역(59)과 동일한 범위의 영역이다. 여기서 추론이란, 학습 모델(11)의 네트워크 구조에 데이터를 입력하여, 네트워크 구조의 각 층(입력층(170), 출력층(171) 및 중간층(172, 173 및 174))의 컨볼루션 연산 등의 계산을 행하여, 계산 결과를 취득하는 것을 의미한다. 영역 분할 화상(60) 중의 영역(69)의 각 화소에는, 영역 분할 화상(40)과 마찬가지로 라벨 41, 42 및 43 중 어느 것이 할당된다. 영역(59)의 화상이 샘플 화상(13) 중의 화상(30)의 어느 것과 유사한 경우, 학습부(2)가 학습 모델(11)을 구하는 과정에 있어서 화상(30)에 따른 영역 분할 화상(40)을 추론하는 특질이 학습 모델(11)에 구비된다. 이 때문에, 영역(69)에는 정확한 라벨을 할당할 수 있다. 영역 분할 화상(60) 중의 영역(69) 이외의 남은 영역도 마찬가지이다. 여기서, 「유사」의 척도(기준)는, 수용야(176)(화상(30) 중의 소영역)의 단위에 있어서, 내부의 화상이 유사한 것으로 한다. 특히, 오버레이 계측에 있어서는, 계측 대상으로 되는 반도체 내의 구조가 주기적이다. 이 때문에, 샘플 화상(13) 중의 화상이 영역 분할 화상(60)보다 치수가 작은 것이라도, 영역 분할 화상(60)과 유사한 조건을 충족하는 화상(30)이 샘플 화상(13) 내에 존재하여, 정확한 라벨이 할당되는 것을 기대할 수 있다.The region segmentation unit (3) infers the region segmentation image (60) in Fig. 7 from the input image (12) by referring to the learning model (11). The region (69) in the region segmentation image (60) is an area in the same range as the region (59). Here, inference means inputting data into the network structure of the learning model (11), performing calculations such as convolution operations of each layer (input layer (170), output layer (171), and intermediate layers (172, 173, and 174)) of the network structure, and obtaining calculation results. Each pixel of the region (69) in the region segmentation image (60) is assigned one of the
(vii) 그룹화부(4)는, 도 9의 흐름도로 나타내어지는 처리를 실행함으로써 영역 분할 화상(60) 중에 있어서의 오버레이의 계측 대상을 소영역 단위로 그룹화한다. 그룹화 처리의 상세에 대해서는 후술한다.(vii) The grouping unit (4) groups the measurement targets of the overlay in the region segmentation image (60) into small region units by executing the processing shown in the flow chart of Fig. 9. The details of the grouping processing will be described later.
(viii) 오버레이 계측부(5)는, 도 11의 흐름도로 나타내어지는 처리를 실행함으로써, 그룹화 화상(70)으로부터 오버레이 계측을 행한다. 오버레이 계측 처리의 상세에 대해서는 후술한다.(viii) The overlay measurement unit (5) performs overlay measurement from a grouped image (70) by executing the processing shown in the flow chart of Fig. 11. The details of the overlay measurement processing will be described later.
<그룹화 처리의 상세><Details of grouping processing>
도 9는, 그룹화부(4)가 실행하는 그룹화 처리의 상세를 설명하기 위한 흐름도이다. 그룹화 처리는, 도 10의 표 80에 의해 지정되는 계측 대상의 항목에 따라, 영역 분할 화상(60)의 소정의 영역에 부여된 라벨에 따라 관련되는 소영역별로 그룹화한다Fig. 9 is a flow chart for explaining the details of the grouping process executed by the grouping unit (4). The grouping process groups related subregions according to the labels given to the predetermined regions of the region segmentation image (60) according to the items of the measurement target specified by Table 80 of Fig. 10.
그룹화부(4)는, 스텝 S1부터 스텝 S4에 있어서, 도 10 중의 표 80에 지정된 계측 대상의 항목별로(제1 계측 대상과 제2 계측 대상), 스텝 S2 및 스텝 S3의 처리를 반복하여 실행한다.The grouping unit (4) repeatedly executes the processing of steps S2 and S3 for each item of the measurement target specified in Table 80 of Fig. 10 (first measurement target and second measurement target) in steps S1 to S4.
스텝 S2에 있어서, 그룹화부(4)는, 영역 분할 화상(60) 중의 대상 라벨의 화소를 1, 그 이외를 0으로 한 2치 화상을 구한다. 도 10에 따르면, 대상 라벨은, 제1 계측 대상에 대하여 라벨 41, 제2 계측 대상에 대하여 라벨 41과 라벨 42로 된다. 제2 계측 대상에 대하여 복수의 라벨이 지정되는 것은, 화상(50) 중에 있어서 라벨 41에 따른 구조가 라벨 42에 따른 구조보다 전방측에 있기 때문에, 영역 분할 화상(60)에 있어서 라벨 42의 일부가 라벨 41에 차폐되어 있기 때문이다.In step S2, the grouping unit (4) obtains a binary image in which pixels of target labels in the region segmentation image (60) are set to 1 and the others are set to 0. According to Fig. 10, the target labels are
스텝 S3에 있어서, 그룹화부(4)는, 스텝 S2에서 얻은 2치 화상으로부터, 소영역의 단위로 그룹화한다. 소영역 단위의 그룹화의 방법으로서, 2치 화상 중의 값 1의 화소가 이루는 연결 영역의 단위로 그룹화하는 라벨링이라고 불리는 방법을 적용할 수 있다. 단, 라벨링에 한하지 않고 소영역 단위의 그룹화가 가능한 다른 방법을 적용할 수 있다.In step S3, the grouping unit (4) groups the binary image obtained in step S2 into units of small regions. As a method of grouping into units of small regions, a method called labeling can be applied, which groups into units of connected regions formed by pixels of
이상과 같이 하여 그룹화 처리가 실행된다. 여기서, 도 8은, 그룹화부(4)의 출력의 예를 도시하는 도면이다. 도 8에 있어서, 화상(70)은, 그룹화 처리(도 9)에 의해 구한 그룹화 화상의 예를 도시하고 있다. 소영역(71a, 71b, 71c 및 71d)은, 표 80 중의 제1 계측 대상에 대응하는 소영역이다. 또한, 소영역(72a, 72b, 72c 및 72d)은, 표 80 중의 제2 계측 대상에 대응하는 소영역이다. 그룹화 화상(70) 중의 영역(79)은, 영역(59)(도 7 참조)과 동일한 범위의 영역이다. 예를 들어, 반도체 패턴의 경우, 영역 분할 화상(60)(도 7 참조)에 있어서의 영역(59)의 밖에는, 영역(59)과 마찬가지의 소영역이 반복하여 출현한다. 즉, 반도체 패턴의 경우, 유사 패턴이 반복해서 나타나게 되므로, 교사 데이터를 화상 중의 전체 화소에 대하여 작성하지 않아도 된다. 예를 들어, 소영역인 수용야(176)(도 6 참조)의 교사 데이터가 얻어지면, 수용야(176)보다 큰 영역의 화상 전체를 추론하는 것이 가능한 학습 모델을 구축할 수 있어, 작업자(오퍼레이터)의 수고를 줄일 수 있다.The grouping process is executed as described above. Here, Fig. 8 is a diagram showing an example of the output of the grouping unit (4). In Fig. 8, the image (70) shows an example of a grouped image obtained by the grouping process (Fig. 9). The subregions (71a, 71b, 71c, and 71d) are subregions corresponding to the first measurement target in Table 80. In addition, the subregions (72a, 72b, 72c, and 72d) are subregions corresponding to the second measurement target in Table 80. The region (79) in the grouped image (70) is a region having the same range as the region (59) (see Fig. 7). For example, in the case of a semiconductor pattern, subregions similar to the region (59) appear repeatedly outside the region (59) in the region segmentation image (60) (see Fig. 7). That is, in the case of semiconductor patterns, since similar patterns appear repeatedly, it is not necessary to create teacher data for all pixels in the image. For example, if teacher data for a small area, the receptive field (176) (see Fig. 6), is obtained, a learning model capable of inferring the entire image in an area larger than the receptive field (176) can be constructed, thereby reducing the effort of the operator.
<오버레이 계측 처리의 상세><Details of overlay measurement processing>
도 11은, 오버레이 계측부(5)가 실행하는 오버레이 계측 처리의 상세를 설명하기 위한 흐름도이다.Figure 11 is a flow chart for explaining the details of the overlay measurement processing executed by the overlay measurement unit (5).
(i) 스텝 S11(i) Step S11
오버레이 계측부(5)는, 제1 계측 대상에 대하여 템플릿의 위치 정렬을 한다. 여기서, 템플릿이란, 제1 계측 대상의 각 요소의 X 좌표와 Y 좌표이며, 오버레이 계측의 운용보다 사전에 준비된 데이터이다. 도 12는, 템플릿 데이터(85)의 구성예를 도시하는 도면이다. 도 12에 있어서, 템플릿 데이터(85)는, 제1부터 제N까지의 각 요소의 X 좌표 및 Y 좌표로 구성된다. 템플릿 데이터(85)는, 대표예로 되는 그룹화 화상(70)에 있어서의 소영역(71a, 71b, 71c 및 71d) 등의 무게 중심의 X 좌표 및 Y 좌표로부터 구해진다. 혹은, 템플릿 데이터(85)는, 반도체의 설계도 등으로부터 구해도 된다.The overlay measurement unit (5) aligns the position of the template with respect to the first measurement target. Here, the template is the X-coordinate and Y-coordinate of each element of the first measurement target, and is data prepared in advance of the operation of the overlay measurement. Fig. 12 is a diagram showing an example of the configuration of template data (85). In Fig. 12, the template data (85) is composed of the X-coordinate and Y-coordinate of each element from the first to the Nth. The template data (85) is obtained from the X-coordinate and Y-coordinate of the center of gravity of small areas (71a, 71b, 71c, and 71d) in the grouped image (70) as a representative example. Alternatively, the template data (85) may be obtained from a design drawing of a semiconductor, etc.
위치 정렬의 기준으로서는, 템플릿 중의 전점의 무게 중심과, 제1 계측 대상의 소영역(71a) 등의 무게 중심이 맞도록 맞추는 것을 들 수 있지만, 이 방법에 제한되지 않는다.As a criterion for position alignment, it is possible to align the center of gravity of all points in the template with the center of gravity of the small area (71a) of the first measurement target, but it is not limited to this method.
(ii) 스텝 S12(ii) Step S12
오버레이 계측부(5)는, 위치 정렬한 템플릿 데이터(85)에 있어서의 요소 각각에 대응한 소영역(71a) 등을 선택한다. 선택의 기준은, 소영역(71a) 등 중에서 무게 중심이 가장 템플릿 데이터(85)의 요소에 가까운 것으로 할 수 있지만, 꼭 그렇지만은 않다.The overlay measurement unit (5) selects a small area (71a) corresponding to each element in the aligned template data (85). The selection criterion may be that the center of gravity of the small area (71a) is closest to the element of the template data (85), but this is not necessarily the case.
(iii) 스텝 S13부터 S18 (iii) Steps S13 to S18
오버레이 계측부(5)는, 스텝 S12에서 선택된 소영역별로 스텝 S14부터 S17의 처리를 반복하여 실행한다. 이하의 설명에서는 소영역(71a)을 대상으로 한 경우를 예로 들어 설명한다.The overlay measurement unit (5) repeatedly executes the processing of steps S14 to S17 for each subarea selected in step S12. The following description will be given as an example a case targeting a subarea (71a).
(iii-1) 스텝 S14(iii-1) Step S14
오버레이 계측부(5)는, 제1 계측 대상의 대표 위치인 위치 1을 계산한다. 위치 1은, X 좌표의 X1과 Y 좌표의 Y1이라는 2개의 요소로 구성된다. 위치 1은, 소영역(71a) 등의 무게 중심 위치의 X 좌표와 Y 좌표로부터 계산한다.The overlay measurement unit (5) calculates
(iii-2) 스텝 S15(iii-2) Step S15
오버레이 계측부(5)는, 제2 계측 대상의 소영역 중에서, 소영역(71a)과 오버레이양을 계측하는 것을 선택한다. 이 선택의 기준에는 무게 중심의 위치가 가장 가까운 것을 선택한다고 하는 기준을 적용할 수 있다. 도 8의 경우, 예를 들어 소영역(72a)이 선택된다.The overlay measurement unit (5) selects a sub-area (71a) among the sub-areas of the second measurement target and measures the overlay amount. A criterion for this selection may be a criterion that selects the one with the closest center of gravity. In the case of Fig. 8, for example, a sub-area (72a) is selected.
(iii-3) 스텝 S16(iii-3) Step S16
오버레이 계측부(5)는, 스텝 S14와 마찬가지의 수순으로, 스텝 S15에서 선택한 제2 계측 대상의 소영역(예를 들어, 소영역(72a))의 대표 위치인 위치 2를 구한다. 위치 2는, X 좌표의 X2와 Y 좌표의 Y2라고 하는 2개의 요소로 구성된다.The overlay measurement unit (5) obtains
(iii-4) 스텝 S17(iii-4) Step S17
오버레이 계측부(5)는, 위치 2와 위치 1로부터, 하기 식 1 및 식 2에서 X 좌표 및 Y 좌표의 변위량인 Dx 및 Dy를 계산한다.The overlay measuring unit (5) calculates Dx and Dy, which are the displacements of the X-coordinate and Y-coordinate, from
Dx=X2-X1 … (식 1)Dx=X2-X1 … (Formula 1)
Dy=Y2-Y1 … (식 2)Dy=Y2-Y1 … (Formula 2)
(iv) 스텝 S19(iv) Step S19
오버레이 계측부(5)는, 식 1 및 식 2에 기초하여 구한 Dx 및 Dy의 변위량의 통계량을 계산한다. 당해 통계량을 산출할 때에는 상가 평균을 적용할 수 있지만, 이에 한하지 않고 상승 평균이나 중앙값이어도 된다. 오버레이 계측부(5)는 스텝 S19에서 구한 변위량의 통계량을 화상(50)의 오버레이양으로 한다.The overlay measuring unit (5) calculates the statistics of the displacement amounts of Dx and Dy obtained based on
<실시예 1에 의한 기술적 효과><Technical effect by Example 1>
실시예 1에 따르면, 사전에 교사 작성부(1)에 있어서 샘플 화상(13)으로부터 작성한 교사 데이터(14)를 사용하여 학습부(2)가 학습 모델(11)을 구하는 과정을 마련해 둔다. 그리고, 영역 분할부(3)가 학습 모델(11)을 참조하여 입력 화상(12)으로부터 구한 영역 분할 화상(60)을 사용함으로써, 그룹화부(4)와 오버레이 계측부(5)에 의해 오버레이양을 계측할 수 있다. 이에 의해 특허문헌 1과는 달리, 노하우를 요하는 파라미터의 조정을 요하지 않고, 또한 특허문헌 2와는 달리, 입력 화상(12)의 설계 데이터를 필요로 하지 않고, 영역 분할 화상(60)을 추론함으로써 정확한 오버레이 계측이 가능하게 된다. 또한, 영역 분할 화상(60)이나 그룹화 화상(70)이라고 하는 중간 처리 데이터를 가시화할 수 있기 때문에, 특허문헌 3과 달리 예기치 않은 오버레이양이 계측된 경우에 중간 처리 데이터를 화면 표시함으로써 요인의 파악이 가능하게 된다. 즉, 영역 분할부(3)에서는 학습 모델(11)을 참조하여 입력 화상(12)을 영역 분할하기 때문에, 상술한 제1 및 제2 과제가 해결된다. 또한, 영역 분할 화상은 가시화할 수 있는 데이터이기 때문에 작업자가 확인하는 것이 용이하다. 이 때문에, 제3 과제도 해결된다.According to Example 1, a process is provided in which the learning unit (2) obtains a learning model (11) by using teacher data (14) created from a sample image (13) in the teacher creation unit (1) in advance. Then, the region division unit (3) uses the region division image (60) obtained from the input image (12) with reference to the learning model (11), thereby enabling the grouping unit (4) and the overlay measurement unit (5) to measure the overlay amount. As a result, unlike
또한, 실시예 1에 따르면, 학습 모델(11)이 수용야(176)의 단위로 영역 분할 화상(40)을 추론한다. 또한, 오버레이 계측 처리에서는, 일반적으로 입력 화상(12)(화상(60): 도 7 참조)이 주기적인 반도체 내의 구조를 비추고 있다. 이 때문에, 교사 작성부(1)에 있어서 주 화면(90)의 유저 인터페이스를 사용하여 교사 데이터(14)를 할당하는 샘플 화상(13)에 있어서의 화상(30)의 치수가, 입력 화상(12) 중의 화상(60)보다 작은 치수로 끝난다. 이에 의해, 작업자가 교사 데이터(14)를 할당할 때의 공정수를 저감할 수 있다.In addition, according to Example 1, the learning model (11) infers the region-segmented image (40) in units of the receiving field (176). In addition, in the overlay measurement processing, the input image (12) (image (60): see Fig. 7) generally reflects a periodic structure within the semiconductor. For this reason, in the teacher creation section (1), the size of the image (30) in the sample image (13) to which the teacher data (14) is assigned using the user interface of the main screen (90) ends up being smaller than the size of the image (60) among the input images (12). As a result, the number of processes required for the worker to assign the teacher data (14) can be reduced.
<실시예 1의 변형예><Modification of Example 1>
이상 설명한 실시예 1에서는 구성 요소를 변경할 수 있다. 예를 들어, 학습 모델(11)은, 상술한 뉴럴 네트워크 구조 이외에도, 수용야(176)의 단위로 화상(30)으로부터 영역 분할 화상(40)을 추론하는 임의의 기계 학습 모델을 적용할 수 있다. 예를 들어, 화상(30)의 수용야(176)의 전체 화소로부터 화소(177)의 라벨을 정하는 선형 판별기여도 된다.In the above-described
스텝 S16에서는 위치 2의 X2와 Y2의 좌표를, 다른 라벨의 소영역으로부터 구해도 된다. 예를 들어, 도 13에 도시되는 표 81을 참조한 경우, 스텝 S16에 있어서, 오버레이 계측부(5)는, 좌표 X2를 라벨 41 및 라벨 42의 소영역, 좌표 Y2를 라벨 44(도 3의 영역 분할 화상(40)의 예 중에 도시하지 않은 반도체 내의 소정의 구조에 할당한 라벨)의 소영역으로부터 구한다. 라벨 42에 대응하는 반도체 내의 구조의 종방향의 윤곽(콘트라스트)이 불선명하기 때문에 라벨 41 및 라벨 42와 맞춘 소영역으로부터는 정확한 Y2가 구해지지 않는 경우가 있다. 이러한 경우, 도 3에 있어서 종방향에 있어서의 콘트라스트(가로 줄무늬)가 선명한 구조에 할당한 라벨 44(예를 들어, 실시예 2의 도 15의 라벨 42b)를 추가함으로써 정확한 좌표 Y2가 구해진다. 즉, 라벨 42에 대응하는 반도체 내의 구조의 종방향의 콘트라스트가 불선명한 경우에는, 오버레이 계측 대상을 새롭게 할당한 라벨 44로 변경함으로써, 정확하게 좌표 Y2를 구할 수 있게 된다.In step S16, the coordinates of X2 and Y2 of
또한, 스텝 S16에 있어서 표 81을 참조하는 경우, 스텝 S16에 있어서 표 80을 참조하는 경우와 비교하여, 교사 작성부(1)는, 라벨 44를 라벨의 할당의 대상에 더한다. 그리고, 영역 분할부(3)는 라벨 44를 추론의 대상에 더하고, 그룹화부(4)는 라벨 44를 그룹화의 대상에 더한다. 마찬가지로, 스텝 S14에서는, 위치 1의 X1과 Y1의 좌표를 다른 라벨의 소영역으로부터 구해도 된다.In addition, when referring to Table 81 in Step S16, compared to the case where referring to Table 80 in Step S16, the teacher writing unit (1) adds label 44 to the target of label assignment. Then, the region division unit (3) adds label 44 to the target of inference, and the grouping unit (4) adds label 44 to the target of grouping. Similarly, in Step S14, the coordinates of X1 and Y1 of
스텝 S11의 처리는, 오버레이 계측으로서 일반적이지만, 제외해도 된다. 그 경우, 스텝 S12에서는 그룹화 화상(70) 중의 소영역(71a) 등의 전부가 선택된다. 혹은, 스텝 S12에서는 소영역(71a) 등 중에서 면적이 노이즈 정도로 작은 등의 부가적인 취사 선택을 행해도 된다.The processing of step S11 is general as an overlay measurement, but may be excluded. In that case, in step S12, all of the small areas (71a) and the like among the grouped images (70) are selected. Alternatively, in step S12, additional selection may be performed among the small areas (71a) and the like, such as those whose area is small enough to be noise-like.
(3) 실시예 2(3) Example 2
<기능 구성예><Function configuration example>
도 14는, 실시예 2에 의한 교사 데이터 작성부터 오버레이 계측까지의 기능 구성예를 도시하는 도면이다. 도 14에 있어서, 샘플 화상(113)은, 예를 들어 촬영 조건을 바꾸어 반도체 웨이퍼에 있어서의 동일 개소를 복수회 촬영한 화상의 조이다. 여기서, 촬영 조건이란, 전자 현미경의 가속 전압이나, 반사 전자상이나 2차 전자상을 촬상하는 것이나 양자의 합성 화상을 구할 때의 합성 비율 등이지만, 꼭 그렇지만은 않다.Fig. 14 is a diagram showing an example of a functional configuration from teacher data creation to overlay measurement according to Example 2. In Fig. 14, a sample image (113) is a set of images taken multiple times of the same location on a semiconductor wafer under, for example, different shooting conditions. Here, shooting conditions include, but are not limited to, an acceleration voltage of an electron microscope, a reflected electron image or a secondary electron image, or a synthesis ratio when obtaining a composite image of the two.
도 15는, 샘플 화상의 조(30a 및 30b)와, 영역 분할 화상(라벨이 할당된 교사 데이터)(40a 및 40b)의 예를 도시하는 도면이다. 화상(30a)은, 영역(31a) 내에 가로로 긴 구조가 있지만, 그 상하의 윤곽(종방향의 콘트라스트)은 불선명하다. 한편, 화상(30b)은, 영역(31a)과 동일 개소의 영역(31b)의 화상을 포함한다. 화상(30b)에 있어서, 상하의 윤곽(종방향의 콘트라스트)은 선명한 구조로 되어 있다.Fig. 15 is a diagram showing examples of sample images (30a and 30b) and region-segmented images (teacher data to which labels are assigned) (40a and 40b). The image (30a) has a horizontally long structure within the region (31a), but its upper and lower outlines (vertical contrast) are unclear. On the other hand, the image (30b) includes an image of the region (31b) at the same location as the region (31a). In the image (30b), the upper and lower outlines (vertical contrast) have a clear structure.
오버레이 계측 처리에서는, 다층의 반도체를 촬영 대상으로 하고, 전자 현미경으로부터 보아 다층 중의 각 층에 핀트가 맞는 심도는 달라서 층별로 가장 선명한 촬영 조건이 다르다. 이 때문에, 촬영 조건을 바꾸어 복수회 촬영함으로써 화상 중의 모든 구조로부터 선명한 상을 취득할 수 있는 경우가 존재한다. 교사 작성부(1)는, 샘플 화상(113)에 있어서의 화상의 조에 라벨을 할당하여, 교사 데이터(114)를 작성함과 함께, 그를 위한 유저 인터페이스를 제공한다. 도 15에 있어서의 교사 데이터(40a 및 40b)는 교사 데이터(114)의 일례이며, 화상(30a) 및 화상(30b) 중에, 각각 라벨 41a, 42a 및 43a와, 라벨 42b 및 42c를 할당한 영역 분할 화상의 조이다.In overlay measurement processing, a multilayer semiconductor is used as a photographing target, and the depth at which each layer in the multilayer is focused is different when viewed through an electron microscope, so the clearest photographing conditions are different for each layer. Therefore, there are cases where clear images can be acquired from all structures in the image by changing the photographing conditions and taking multiple photographs. The teacher creation unit (1) assigns labels to groups of images in the sample image (113) and creates teacher data (114), and provides a user interface therefor. The teacher data (40a and 40b) in Fig. 15 are examples of the teacher data (114), and are groups of area-segmented images to which labels 41a, 42a, and 43a, and labels 42b and 42c are assigned, respectively, among the images (30a) and (30b).
학습부(102)는, 샘플 화상(113)과, 교사 데이터(114)와, 화상의 조(30a 및 30b)와, 영역 분할 화상의 조(40a 및 40b)로부터, 학습 모델(111)을 산출한다. 학습 모델(111)은, 화상(30a)으로부터 영역 분할 화상(40a)을 추론하는 뉴럴 네트워크 구조와, 화상(30b)으로부터 영역 분할 화상(40b)을 추론하는 뉴럴 네트워크 구조를 포함한다. 이들 뉴럴 네트워크 구조는, 완전 독립된 2개의 뉴럴 네트워크 구조로 해도 되고, 혹은 중간층(173) 등의 일부를 공유한(공통으로 한) 뉴럴 네트워크 구조로 해도 된다.The learning unit (102) derives a learning model (111) from a sample image (113), teacher data (114), a group of images (30a and 30b), and a group of region segmented images (40a and 40b). The learning model (111) includes a neural network structure that infers a region segmented image (40a) from an image (30a), and a neural network structure that infers a region segmented image (40b) from an image (30b). These neural network structures may be two completely independent neural network structures, or may be a neural network structure that shares (commonly shares) a part of an intermediate layer (173), etc.
입력 화상(112)은, 샘플 화상(113)과 동일하거나, 혹은 가까운 촬영 조건에서 촬영된 화상의 조이다. 영역 분할부(103)는, 입력 화상(112)으로부터 영역 분할 화상의 조(40a 및 40b)와 구성을 동일하게 한 영역 분할 화상의 조를 출력한다. 그룹화부(104)는, 영역 분할부(103)가 출력한 영역 분할 화상의 조로부터 라벨 41a와, 라벨 41a 및 42a와, 라벨 42b의 3종류의 라벨이 각각 할당된 소영역을 구하는 연산을 실행한다.The input image (112) is a group of images captured under shooting conditions identical to or close to those of the sample image (113). The region segmentation unit (103) outputs a group of region segmentation images having the same configuration as the group (40a and 40b) of the region segmentation images from the input image (112). The grouping unit (104) executes an operation to obtain small regions to which three types of labels, namely,
오버레이 계측부(105)는, 도 11에 도시되는 스텝 S14에 있어서의 위치 1을 라벨 41로부터 구하고, 스텝 S16에 있어서의 위치 2의 X 좌표(X2)를 라벨 41a 및 42a로부터 구하고, Y 좌표(Y2)를 라벨 42b로부터 구하도록 하여 오버레이양을 계측한다.The overlay measurement unit (105) measures the overlay amount by obtaining the
<실시예 2에 의한 기술적 효과><Technical effect by Example 2>
실시예 2에서는, 이상 설명한 구성에 의해, 단일의 촬영 조건에서는 정확한 오버레이 계측이 곤란한 경우에 있어서도, 동일 개소를 복수의 촬영 조건에서 화상의 조를 사용한다. 이에 의해, 영역 분할부(103)가 추론하는 라벨이 정확하게 되고, 오버레이 계측부(105)는 정확한 오버레이 계측이 가능하게 된다. 또한, 교사 작성부(101)가 샘플 화상(113) 중의 선명한 부분에 라벨을 할당하기 때문에, 교사 작성부(101)는, 정확하게 라벨을 소영역에 할당하여 교사 데이터(114)를 작성할 수 있다.In Example 2, by the configuration described above, even in cases where accurate overlay measurement is difficult under a single shooting condition, a set of images is used for the same location under multiple shooting conditions. As a result, the label inferred by the region division unit (103) becomes accurate, and the overlay measurement unit (105) becomes capable of accurate overlay measurement. In addition, since the teacher creation unit (101) assigns a label to a clear part in the sample image (113), the teacher creation unit (101) can accurately assign a label to a small area and create teacher data (114).
(4) 실시예 3(4) Example 3
실시예 3은, 라벨 할당의 대상을 샘플 화상의 일부로 좁힘으로써, 작업자가 교사 데이터의 라벨 할당 작업의 작업량을 저감하는 기술에 대하여 개시한다.Example 3 discloses a technique for reducing the workload of a worker in label assignment work of teacher data by narrowing the target of label assignment to a portion of a sample image.
<기능 구성의 개요><Overview of the functional configuration>
도 16은, 실시예 3에 의한 교사 데이터 작성부터 오버레이 계측까지의 기능 구성예를 도시하는 도면이다. 먼저 실시예 3에 의한 기능 구성예의 개요에 대하여 설명한다.Figure 16 is a diagram showing an example of a functional configuration from teacher data creation to overlay measurement according to Example 3. First, an outline of an example of a functional configuration according to Example 3 will be described.
교사 작성부(201)는, 샘플 화상(213) 중의 부분 집합인 화상군(231)에 라벨을 할당한(즉, 화상군(231) 중의 각각의 화상(30)에 라벨을 할당한) 영역 분할 화상군(241)으로부터 중간 학습 모델을 학습한다. 여기서, 중간 학습 모델이라는 문언을 사용하고 있는 것은, 화상군(231)(샘플 화상(213)의 부분 집합)으로부터 영역 분할 화상군(241)을 생성하기 위한 학습 모델로서, 입력 화상(12)으로부터 영역 분할 화상을 생성하기 위한 최종 학습 모델은 아니기 때문이다.The teacher writing unit (201) learns an intermediate learning model from a region segmentation image group (241) in which labels are assigned to image groups (231), which are a subset of sample images (213) (i.e., labels are assigned to each image (30) in the image group (231). Here, the phrase intermediate learning model is used because it is a learning model for generating a region segmentation image group (241) from image groups (231) (a subset of sample images (213)), and is not a final learning model for generating a region segmentation image from an input image (12).
교사 작성부(201)는, 계속해서 중간 학습 모델을 참조하여 남은 샘플 화상(233)으로부터 영역 분할 화상군(243)을 추론하고, 또한 영역 분할 화상군(243)을 보정하는 처리를 실행하거나, 혹은 보정을 위한 유저 인터페이스를 제공한다. 학습부(2), 영역 분할부(3), 그룹화부(4) 및 오버레이 계측부(5)의 각 기능과, 학습 모델(11) 및 입력 화상(12)의 데이터는, 실시예 1과 공통이므로, 설명은 생략한다.The teacher writing unit (201) continuously infers a region segmentation image group (243) from the remaining sample images (233) by referring to the intermediate learning model, and also performs a process for correcting the region segmentation image group (243), or provides a user interface for correction. Since the functions of the learning unit (2), the region segmentation unit (3), the grouping unit (4), and the overlay measurement unit (5), and the data of the learning model (11) and the input image (12) are common to those of Example 1, a description thereof is omitted.
<교사 데이터 작성 처리의 상세><Details of teacher data creation processing>
도 17 내지 도 19를 참조하여, 교사 데이터 작성 처리의 상세에 대하여 설명한다. 도 17은, 샘플 화상(213)의 구성예를 도시하는 도면이다. 도 18은, 교사 데이터(214)의 구성예를 도시하는 도면이다. 도 19는, 교사 작성부(201)에 의한 교사 데이터 작성 처리를 설명하기 위한 흐름도이다.Referring to FIGS. 17 to 19, the details of the teacher data creation process will be described. FIG. 17 is a diagram showing an example of the configuration of a sample image (213). FIG. 18 is a diagram showing an example of the configuration of teacher data (214). FIG. 19 is a flowchart for explaining the teacher data creation process by the teacher creation unit (201).
(i) 스텝 S201(i) Step S201
도 17에 도시되는 바와 같이, 샘플 화상(213)은, 사전에 화상군(231)과 화상군(233)의 부분 집합으로 분할된다.As illustrated in Fig. 17, the sample image (213) is divided into a subset of the image group (231) and the image group (233) in advance.
스텝 S201에 있어서, 교사 작성부(201)는, 도 18에 도시하는 영역 분할 화상군(241)을 작성하기 위한 유저 인터페이스(주 화면(90): 도 4 참조)를 작업자에 제공하고, 작업자의 입력에 응답하여 화상군(231)에 라벨을 할당한다.In step S201, the teacher writing unit (201) provides the worker with a user interface (main screen (90): see Fig. 4) for writing a region segmentation image group (241) as shown in Fig. 18, and assigns a label to the image group (231) in response to the worker's input.
(ii) 스텝 S202(ii) Step S202
교사 작성부(201)는, 학습부(2)와 동일한 수순에 따라, 화상군(231)과 영역 분할 화상군(241)으로부터 중간 학습 모델(화상분(231)으로부터 영역 분할 화상군(241)을 생성하기 위한 학습 모델)을 구한다.The teacher writing unit (201) obtains an intermediate learning model (a learning model for generating a region-segmented image group (241) from an image group (231)) according to the same procedure as the learning unit (2).
(iii) 스텝 S203(iii) Step S203
교사 작성부(201)는, 영역 분할부(3)와 마찬가지로, 스텝 S202에서 구한 중간 학습 모델을 참조하여, 화상군(233)으로부터 영역 분할 화상군(243) 내를 추론한다(정확하게는 화상군(233) 중의 화상(30) 각각으로부터 영역 분할 화상(40)을 추론함으로써 영역 분할 화상군(243)을 구함).The teacher writing unit (201), like the region division unit (3), infers the region division image group (243) from the image group (233) by referring to the intermediate learning model obtained in step S202 (more precisely, the region division image group (243) is obtained by inferring the region division image (40) from each image (30) in the image group (233).
(iv) 스텝 S204(iv) Step S204
샘플 화상의 부분 집합인 화상군(231)이 화상군(233)에 포함되는 모든 화상의 성질을 완전히 망라하는 것은 곤란하기 때문에, 대부분의 경우에 있어서 영역 분할 화상군(243)에는 잘못된 라벨이 포함된다. 그래서, 교사 작성부(201)는, 영역 분할 화상군(243)에 있어서의 라벨에 대하여 통계 처리에 의한 보정을 실행한다. 통계 처리에 의한 보정으로서, 예를 들어 반도체 칩 내에 있어서의 동일 촬영 개소를 반복하여 촬영한 영역 분할 화상군(243) 중의 부분 집합 내에 있어서 라벨의 최빈값을 취하는 보정을 행할 수 있다.Since it is difficult for the image group (231), which is a subset of the sample images, to completely encompass the properties of all images included in the image group (233), in most cases, the region-segmented image group (243) includes incorrect labels. Therefore, the teacher creation unit (201) performs correction by statistical processing on the labels in the region-segmented image group (243). As correction by statistical processing, for example, correction can be performed by taking the mode of the label in a subset of the region-segmented image group (243) in which the same shooting location in a semiconductor chip is repeatedly shot.
여기서, 도 17에 도시하는 화상군(233) 내의 부분 집합의 화상군(232) 중의 화상(32a, 32b로부터 32m(m은 임의의 숫자))은, 반도체 웨이퍼 내의 동일 개소를 반복하여 촬영한 화상이다. 이때, 스텝 S204에 있어서, 화상군(232)으로부터 추론된 영역 분할 화상군(242) 내의 영역 분할 화상(42a, 42b로부터 42m)에는 모두, 최빈값을 취하는 보정에 의해 최빈값의 라벨이 할당된다. 또한, 영역 분할 화상(42a, 42b로부터 42m) 내의 동일 좌표의 화소(43a, 43b로부터 43m)에 착안하였을 때, 보정 전에 있어서 각 화소 중에서 가장 출현 빈도가 높은 라벨이, 최빈값을 취하는 보정에 의해 보정 후에 할당된다. 최빈값을 취하는 보정에 의해, 동일 개소를 반복하여 촬영하였을 때의 화상(30)의 화질이나 중첩되는 노이즈에 의해, 영역 분할 화상(40)의 라벨이 변화해 버리는 것을 보정할 수 있다.Here, the images (from 32a, 32b to 32m (m is an arbitrary number)) in the image group (232) of the subset of the image group (233) illustrated in Fig. 17 are images repeatedly captured at the same location in the semiconductor wafer. At this time, in step S204, the labels of the region segmentation images (from 42a, 42b to 42m) in the region segmentation image group (242) inferred from the image group (232) are all assigned the labels of the most frequent values by correction that takes the most frequent value. In addition, when focusing on the pixels (from 43a, 43b to 43m) of the same coordinates in the region segmentation images (from 42a, 42b to 42m), the label with the highest appearance frequency among each pixel before correction is assigned after correction by correction that takes the most frequent value. By taking the most frequent value as a correction, it is possible to correct the change in the label of the region segmented image (40) due to the image quality of the image (30) or overlapping noise when repeatedly photographing the same location.
또한, 화상(232) 중의 화상(32a, 32b로부터 화상(32m)의 촬영 개소가 다소 위치 어긋남되는 경우에는 사전에 위치 정렬을 행하도록 해도 된다. 당해 위치 정렬은, 화상(32a)에 대한 화상(32b로부터 화상(32m)의 각 화상 사이에서 화상간의 변위량을 구하고, 화상(32b로부터 화상(32m)을 화상의 변위량분만큼 평행 이동함으로써 이루어지지만, 이외의 방법으로 위치 정렬해도 된다. 화상간의 변위량은, 화상(32b)과 화상(32a)의 경우, 변위량에 따라 화상(32b)을 평행 이동하였을 때, 화상(32b와 32a)의 각 화소의 명도의 차분의 합이 최소로 되는 조건에서 구할 수 있다. 변위량은, 그 밖에도 변위량에 따라 영역 분할 화상(42b)을 평행 이동하였을 때, 영역 분할 화상(42b와 42a)의 사이에 라벨이 일치하지 않는 화소의 수가 최소로 되는 조건에서 구해진다. 화상간의 변위량을 구하는 대상은 선두의 화상(32a) 이외여도 된다.In addition, in the case where the shooting location of the image (32m) from the image (32a, 32b) among the images (232) is slightly misaligned, position alignment may be performed in advance. The position alignment is performed by obtaining the displacement amount between the images from the image (32b) to the image (32m) with respect to the image (32a) and moving the image (32m) from the image (32b) in parallel by the displacement amount of the images, but position alignment may be performed by another method. The displacement amount between the images can be obtained under the condition that the sum of the differences in brightness of each pixel of the images (32b and 32a) is minimized when the image (32b) is moved in parallel according to the displacement amount. The displacement amount can also be obtained under the condition that the number of pixels whose labels do not match between the region-divided images (42b and 42a) is minimized when the region-divided image (42b) is moved in parallel according to the displacement amount. The object for which the displacement between images is to be obtained may be other than the leading image (32a).
(v) 스텝 S205(v) Step S205
교사 작성부(201)는, 영역 분할 화상군(233) 중에 할당된 라벨이 정확한 것인지를 작업자가 확인하기 위한 유저 인터페이스를 제공한다. 당해 유저 인터페이스는, 영역 분할 화상군(243) 내를 구성하는 각각의 영역 분할 화상(40)을 표시한다. 이때, 영역 분할 화상(40)에 할당된 라벨의 적부를 판단하기 쉽도록, 스텝 S205의 유저 인터페이스에는 화상군(233) 중의 화상(30)을 나란히 표시하거나, 화상(30) 상에 영역 분할 화상(40)을 투과시킨 블렌드 화상을 부가적으로 표시하거나 하도록 해도 된다. 스텝 S205에서 제공되는 유저 인터페이스에는, 영역 분할 화상군(243) 내의 영역 분할 화상(40)의 라벨을 수정하는 기능을 마련해도 된다. 당해 라벨을 수정하는 기능은, 입력 화면(91)(도 4 참조) 중에 영역 분할 화상군(243) 중의 영역 분할 화상(40) 혹은 블렌드 화상의 표시를 행하여, 입력 화면(91)에 있어서의 입력 펜(93)의 조작에 의해 표시 중인 라벨을 수정할 수 있도록 하는 것이다.The teacher writing unit (201) provides a user interface for a worker to check whether the assigned label among the region-segmented image group (233) is correct. The user interface displays each region-segmented image (40) constituting the region-segmented image group (243). At this time, in order to easily determine the appropriateness of the label assigned to the region-segmented image (40), the user interface of step S205 may display the images (30) among the image group (233) side by side, or additionally display a blended image in which the region-segmented image (40) is transmitted over the image (30). The user interface provided in step S205 may be provided with a function for modifying the label of the region-segmented image (40) within the region-segmented image group (243). The function of modifying the label in question is to display an area division image (40) or blend image among the area division image group (243) in the input screen (91) (see Fig. 4), so that the label being displayed can be modified by operating the input pen (93) on the input screen (91).
(vi) 스텝 S206(vi) Step S206
교사 작성부(201)는, 영역 분할 화상군(241)과 영역 분할 화상군(243)을 합쳐서 교사 데이터(214)로서 출력한다.The teacher writing section (201) combines the area division image group (241) and the area division image group (243) and outputs them as teacher data (214).
<실시예 3에 의한 기술적 효과><Technical effect by Example 3>
실시예 3에 따르면, 샘플 화상(213)(즉 화상군(233))에 있어서, 교사 작성부(201)가 제공하는 유저 인터페이스(주 화면(90))를 사용하여 라벨을 할당하는 작업의 대상을 부분 집합인 화상군(231)으로 좁히고, 또한 샘플 화상(213) 내의 모든 화상(30)에 라벨을 할당하여 교사 데이터(214)를 취득하는 것이 가능하게 된다. 실시예 1에 있어서는, 학습 모델(11)은 샘플 화상(13) 중의 모수가 많을수록 추론 결과가 보다 정확하게 된다. 한편, 작업자가 교사 데이터(14)의 라벨을 할당하는 작업의 작업량이 많아져 버린다고 하는 트레이드오프가 있었다. 그러나, 실시예 3에 따르면, 라벨 할당의 작업량을 저감함으로써 상기 트레이드오프를 해소할 수 있게 된다. 특히, 오버레이 계측에서는 일반적으로, 반도체 화상 중에 있어서 반복하여 나타나는 구조를 오버레이 계측의 대상으로 한다. 따라서, 화상분(231)의 모수를 크게 좁혀도, 스텝 S204에 있어서의 통계 처리에 의한 보정이나 스텝 S205에 있어서의 유저 인터페이스에 의한 보정이 곤란한 정도까지 스텝 S203의 추론 결과의 정밀도가 낮아지는 일은 적다고 예기할 수 있다. 따라서, 실시예 3에 따르면, 작업량의 저감에 유효하다고 생각된다.According to Example 3, in the sample image (213) (i.e., the image group (233)), the target of the work of assigning labels using the user interface (main screen (90)) provided by the teacher creation unit (201) is narrowed to the image group (231), which is a subset, and it is also possible to acquire teacher data (214) by assigning labels to all images (30) in the sample image (213). In Example 1, the learning model (11) becomes more accurate in the inference result as the number of parameters in the sample image (13) increases. On the other hand, there was a trade-off in that the workload of the worker for assigning labels to the teacher data (14) increases. However, according to Example 3, it is possible to resolve the above trade-off by reducing the workload of label assignment. In particular, in overlay measurement, a structure that appears repeatedly in a semiconductor image is generally the target of the overlay measurement. Accordingly, even if the parameters of the image fraction (231) are greatly narrowed, it can be expected that the accuracy of the inference result of step S203 will not be reduced to the extent that correction by statistical processing in step S204 or correction by the user interface in step S205 becomes difficult. Therefore, according to Example 3, it is thought to be effective in reducing the workload.
또한, 스텝 S204에 있어서의 통계 처리에 있어서의 보정을 실행하면, 오버레이 계측의 재현성을 개선하는 것이 가능하게 된다. 여기서, 오버레이 계측의 재현성이란, 반도체 웨이퍼 중의 동일 개소를 반복하여 촬영하였을 때에 있어서의 상기 식 1 및 식 2에 나타내는 오버레이양의 변동 정도의 지표이다. 일반적으로, 지표로서 표준 편차 σ의 3배인 3σ가 사용된다. 오버레이 계측의 재현성을 개선하는 효과는, 스텝 S204에 있어서의 통계 처리에 의한 보정을 행하면, 동일 개소를 반복하여 촬영한 화상군(232) 등에 대한 영역 분할 화상군(242) 등의 라벨이 동일해지기 때문이다. 그 결과, 반도체 웨이퍼 중에 있어서 화상군(231)과 동일 개소의 복수의 화상이 입력 화상(12)으로 되었을 때에는, 복수의 화상으로부터 영역 분할부(3)가 추론하는 영역 분할 화상(60)의 라벨은 접근한다. 이 때문에, 오버레이 계측부(5)가 S19에서 구하는 오버레이양은 균일하게 접근하고, 오버레이 계측의 재현성은 개선된다(작아진다). 또한, 이 효과가 있는 점에서, 스텝 S201에서 제공되는 유저 인터페이스를 사용하여 작성된 영역 분할 화상군(241)에도, 스텝 S204의 통계 처리에 의한 보정을 실시해도 된다.In addition, when correction is performed in the statistical processing in step S204, it becomes possible to improve the reproducibility of the overlay measurement. Here, the reproducibility of the overlay measurement is an index of the degree of variation in the overlay amount shown in the
<실시예 3의 변형예><Modification of Example 3>
(i) 도 19에서 도시하는 흐름도에 있어서, 스텝 S204 혹은 스텝 S205 중 한쪽을 삭제해도 된다. 이것은 스텝 S204만이라도 영역 분할 화상군(243)의 라벨을 보정하는 효과가 있고, 스텝 S205만이라도 영역 분할 화상군(243)의 라벨을 확인 및 보정하는 효과가 있기 때문이다.(i) In the flow chart illustrated in Fig. 19, either step S204 or step S205 may be deleted. This is because even if only step S204 is performed, the effect of correcting the label of the region-segmented image group (243) is present, and even if only step S205 is performed, the effect of confirming and correcting the label of the region-segmented image group (243) is present.
(ii) 스텝 S204의 통계 처리에 의한 보정에서는, 최빈값 이외의 통계량을 적용해도 되고, 또한 최빈값을 취하는 이외에 부가적인 처리를 행해도 된다. 예를 들어, 32a, 32b로부터 32m와 같은 동일 좌표의 화소의 라벨에서, 최빈값의 빈도가 낮을 경우에는, 화소의 라벨의 변동이 크다고 보아, 무효 영역(49)의 라벨을 할당해도 된다.(ii) In the correction by statistical processing of step S204, statistics other than the most frequent value may be applied, and additional processing may be performed other than taking the most frequent value. For example, in the case where the frequency of the most frequent value is low in the labels of pixels of the same coordinates, such as 32a, 32b to 32m, it may be considered that the variation in the labels of the pixels is large, and a label of an invalid area (49) may be assigned.
스텝 S204의 통계 처리에 의한 보정에서는, 반도체 웨이퍼 중의 동일 개소를 반복하여 촬영한 화상군(232) 중의 화상을 사용하는 대신에, 화상군(232) 중에 있어서 유사한 복수의 부분 영역을 추출해도 된다. 여기서 부분 영역이란, 도 4에 있어서의 영역(94)과 같은 화상(30) 중의 부분 영역이다. 또한, 유사한 복수의 부분 영역이란, 화상군(232) 중에 있어서의 32a 등의 1매의 화상 혹은 복수의 화상(32a로부터 32m) 등의 복수의 화상으로부터, 유사도가 높은 것을 조건으로 동일 치수의 부분 영역을 복수 추출한 것이다. 또한, 여기서 유사도는, 부분 영역에 있어서의 2매의 화상(30)의 화소의 명도의 상관값에 의해 판단하거나, 부분 영역에 있어서의 2매의 영역 분할 화상(40) 내의 화소 중에서 라벨이 일치하는 화소의 비율로 판단하거나 할 수 있다. 오버레이 계측의 대상으로 하는 반도체 화상은 반복 패턴이기 때문에, 유사한 복수의 부분 영역은 찾기 쉽다.In the correction by statistical processing of step S204, instead of using an image from among the image group (232) in which the same location in the semiconductor wafer is repeatedly photographed, a plurality of similar partial regions may be extracted from among the image group (232). Here, the partial region is a partial region from among the image (30) such as the region (94) in Fig. 4. In addition, the plurality of similar partial regions means a plurality of partial regions having the same dimensions extracted from a single image such as 32a or a plurality of images such as 32a to 32m in the image group (232) on the condition that the similarity is high. In addition, the similarity here can be judged by the correlation value of the brightness of the pixels of the two images (30) in the partial region, or by the ratio of pixels with matching labels among the pixels in the two region-divided images (40) in the partial region. Since the semiconductor image to be subjected to overlay measurement has a repetitive pattern, it is easy to find a plurality of similar partial regions.
(iii) 스텝 S204의 통계 처리에 의한 보정은, 영역 분할 화상군(243) 중의 라벨에 소영역 단위의 보정으로 할 수 있다. 여기서, 도 20을 사용하여, 통계 처리에 의한 보정에 대하여 설명한다. 도 20은, 스텝 S204의 통계 처리에 의한 보정의 예를 설명하기 위한 도면이다. 도 20은, 영역 분할 화상군(243) 중의 어느 영역 분할 화상(40)으로부터 그룹화부(4)에서 구한 보정 전의 그룹화 화상(270)의 예와, 보정 후의 그룹화 화상(270')의 예를 도시하고 있다.(iii) Correction by statistical processing of step S204 can be performed by correcting a small area unit of a label in the region segmentation image group (243). Here, correction by statistical processing will be described using Fig. 20. Fig. 20 is a drawing for explaining an example of correction by statistical processing of step S204. Fig. 20 shows an example of a grouped image (270) before correction, obtained by a grouping unit (4) from a region segmentation image (40) in the region segmentation image group (243), and an example of a grouped image (270') after correction.
도 20에 있어서, 당해 통계 처리에 의한 보정에 의해, 소영역(71h)이 소영역(71h')으로 평행 이동하고 있다. 소영역(71h)의 평행 이동의 양은, 소영역(71h 및 72h)의 무게 중심의 변위량(스텝 S17의 방법으로 구한 변위량)이, 다른 소영역(71i 및 72i, 71j 및 72j, 71k 및 72k)의 무게 중심의 변위량의 평균값으로 정렬되도록 정할 수 있다. 소영역 단위의 보정은, 그 밖에도 스텝 S19에서 구한 변위량의 통계량이 목표값으로 되도록 소영역(71h) 등의 모든 소영역을 일률적으로 평행 이동해도 된다. 예를 들어, 영역 분할 화상군(243) 내에 있어서 그룹화 화상(270)과 반도체 웨이퍼 중의 촬영 개소가 동일한 부분 집합에 있어서, 부분 집합 중의 각 요소로부터 스텝 S19에서 구한 변위량의 통계량을 구하였을 때의 평균값을 목표값으로서 사용할 수 있다. 혹은, 샘플 화상(213) 중의 화상의 각각을 촬영한 반도체 웨이퍼가 인위적인 오버레이양을 부여하여 제조(다층의 반도체에 있어서의 소정의 층 사이를 인위적인 오버레이양만큼 어긋나게 하여 제조)한 것으로서, 또한 인위적인 오버레이양을 알고 있는 경우에는, 샘플 화상(213) 중의 화상 중에 있어서 그룹화와 인위적인 오버레이양이 화상(270)과 동일한 것으로부터 부분 집합을 구해도 된다. 본 명세서에 있어서는, 인위적인 오버레이양을 오버레이양의 설계값이라고 칭하는 경우가 있다.In Fig. 20, the small region (71h) is moved in parallel to the small region (71h') by correction by the statistical processing. The amount of the parallel movement of the small region (71h) can be determined so that the displacement of the center of gravity of the small regions (71h and 72h) (the displacement obtained by the method of step S17) is aligned with the average value of the displacements of the centers of gravity of the other small regions (71i and 72i, 71j and 72j, 71k and 72k). In addition to the correction of the small region unit, all small regions such as the small region (71h) may be moved in parallel uniformly so that the statistical amount of the displacement obtained in step S19 becomes the target value. For example, in the region segmentation image group (243), in the subset where the grouped image (270) and the photographing location in the semiconductor wafer are the same, the average value when the statistics of the displacement amount obtained in step S19 from each element in the subset are obtained can be used as the target value. Alternatively, in the case where the semiconductor wafer in which each image in the sample image (213) was photographed was manufactured by applying an artificial overlay amount (manufactured by displacing a predetermined layer in a multilayer semiconductor by the artificial overlay amount), and further, the artificial overlay amount is known, the subset may be obtained from images in the sample image (213) in which the grouping and the artificial overlay amount are the same as those in the image (270). In this specification, the artificial overlay amount may be referred to as the design value of the overlay amount.
(iv) 또한, 화상군(233)의 오버레이양의 설계값을 미리 알고 있는 경우에는, 오버레이양의 감도 특성이 좋아지도록 목표값을 정해도 된다. 도 21은, 스텝 S204의 통계 처리에 의한 보정의 다른 예를 설명하는 도면이다. 도 21에 기초하여, 보정 전의 그룹화 화상(270)으로부터 보정 후의 그룹화 화상(270')을 생성할 때의 기준(이동량을 정하기 위한 기준)을 설명할 수 있다.(iv) In addition, if the design value of the overlay amount of the image group (233) is known in advance, the target value may be set so that the sensitivity characteristic of the overlay amount is improved. Fig. 21 is a drawing explaining another example of correction by statistical processing of step S204. Based on Fig. 21, the criterion (criteria for determining the amount of movement) when generating the grouped image (270') after correction from the grouped image (270) before correction can be explained.
도 21에 있어서, 예를 들어 오버레이양의 설계값의 X 성분을 U축(295), 오버레이양의 X 성분(상기 식 1의 Dx)을 V축(296)으로 한 그래프(290)를 생각한다. 이때, U축(295)에 대한 V축(296)의 이상값을 연결한 직선을 297(기울기 1 또한 절편 0 직선이나, 기울기를 1로 하여 점(292a, 293b, 293c)의 무게 중심을 통과하는 직선, 혹은 기울기 1을 소정의 기울기로 한 직선 등)로 한다. 그리고, 영역 분할 화상(270)의 오버레이양의 X 성분을 나타내는 점(292a)을 직선(297)에 내린 점(294a)을 목표값의 X 성분으로 할 수 있다. 즉, 벡터(293a)를 평행 이동의 Xb로 할 수 있다. 또한, 도 21에 있어서, 점(292b) 및 점(292c)을 벡터(293b 및 293c)에 의해 점(294b) 및 점(294c)으로 이동하도록, 영역 분할 화상군(243) 중의 270 이외의 영역 분할 화상 전부에 대한 스텝 S19의 오버레이양의 X 성분의 목표값을 정한다. 이와 같이 하면, 평행 이동 후에는 영역 분할 화상군(243) 중에 있어서의 오버레이양의 X 성분은 전부 직선(297) 상에 오른다. 이것은, 영역 분할 화상군(243)에 있어서 오버레이 계측의 감도 특성이 최선으로 되는 조건에 해당한다. 즉, 점(294a, 294b 및 294c) 등으로부터 회귀 직선을 구하였을 때의 회귀 직선의 기울기가 직선(297)에 가깝거나, 혹은 회귀 직선의 회귀 잔차(벡터(293a, 293b 및 293c) 등의 평균적인 2승 거리에 해당함)가 최소로 된다. 오버레이양의 Y 성분(상기 식 2에 나타내는 Dy)에 대해서도, 그래프(290)와 마찬가지의 그래프로부터 오버레이 계측의 감도 특성이 최선으로 되는 목표값을 구할 수 있다.In Fig. 21, for example, a graph (290) is considered in which the X component of the design value of the overlay amount is the U-axis (295) and the X component of the overlay amount (Dx in the above formula 1) is the V-axis (296). At this time, a straight line connecting the ideal value of the V-axis (296) to the U-axis (295) is 297 (a straight line with a slope of 1 and an intercept of 0, a straight line passing through the centers of gravity of points (292a, 293b, 293c) with a slope of 1, or a straight line with a predetermined slope of 1, etc.). Then, a point (294a) where a point (292a) representing the X component of the overlay amount of the region segmentation image (270) is lowered onto the straight line (297) can be the X component of the target value. That is, the vector (293a) can be Xb of the parallel translation. In addition, in Fig. 21, the target value of the X component of the overlay amount of step S19 for all region-segmented images other than 270 in the region-segmented image group (243) is set so that the point (292b) and the point (292c) are moved to the point (294b) and the point (294c) by the vectors (293b and 293c). In this way, after the parallel movement, the X components of the overlay amount in the region-segmented image group (243) all fall on the straight line (297). This corresponds to the condition for the sensitivity characteristic of the overlay measurement in the region-segmented image group (243) to be optimal. That is, when a regression line is obtained from points (294a, 294b, and 294c), etc., the slope of the regression line is close to the straight line (297), or the regression residual of the regression line (corresponding to the average square distance of vectors (293a, 293b, and 293c), etc.) is minimized. For the Y component of the overlay amount (Dy shown in the above equation 2), a target value that optimizes the sensitivity characteristic of the overlay measurement can also be obtained from a graph similar to graph (290).
예를 들어, 복수의 화상 그룹 A, B 및 C가 있는 경우, 이상적으로는 직선(297) 상에 모든 값이 플롯되는 것이 요망된다. 그러나, 실제로는 그러한 이상적인 상태를 얻기는 어렵다. 그래서, 변위량이 있을 때에는, 화상 그룹 단위로 변위량을 보정하면, 적어도 교사 데이터는 직선(297) 상에 플롯되게 된다(학습 모델의 범위에서는 직선(297) 상에 정확하게 플롯되게 할 수 있음). 이 교사 데이터의 변위량을 학습 모델의 관습 및 교사 데이터의 관습으로서 인식할 수 있으므로, 각 화상에 있어서의 변위량의 변동을 억제할 수 있다. 즉, 통계 처리에 의한 보정을 실행함으로써, 오버레이 계측의 감도 특성을 개선할 수 있다.For example, when there are multiple image groups A, B, and C, ideally, it is desired that all values are plotted on a straight line (297). However, in reality, it is difficult to obtain such an ideal state. Therefore, when there is a displacement, if the displacement is corrected for each image group, at least the teacher data is plotted on the straight line (297) (in the range of the learning model, it can be accurately plotted on the straight line (297)). Since the displacement of this teacher data can be recognized as a custom of the learning model and a custom of the teacher data, the variation of the displacement in each image can be suppressed. That is, by performing correction by statistical processing, the sensitivity characteristic of the overlay measurement can be improved.
(v) 스텝 S204의 통계 처리에 의한 보정을 소영역 단위로 행할 때에는, 이상 설명한 몇 개의 보정을 조합하여 행해도 된다. 또한, 소영역 단위의 보정에서는, 평행 이동 이외에도 소영역(71h) 등의 무게 중심이 변화하는 기하적인 변형을 행해도 된다. 예를 들어, 기하적인 변형으로서, 소영역(71h)의 우측 절반을 깎는 것을 들 수 있다. 이에 의해 소영역(71h)의 무게 중심을 좌측으로 이동시킨다.(v) When performing correction by statistical processing of step S204 in small area units, several corrections described above may be combined and performed. In addition, in correction in small area units, in addition to parallel translation, geometric deformation that changes the center of gravity of the small area (71h) or the like may be performed. For example, as a geometric deformation, cutting off the right half of the small area (71h) can be mentioned. As a result, the center of gravity of the small area (71h) is moved to the left.
(vi) 교사 작성부(201)는, 주 화면(90) 등에 있어서 스텝 S204의 통계 처리에 의한 보정을 확인할 수 있도록, 보정 전후의 그룹화 화상(270 및 270')이나, 이에 따른 화상(30)이나 영역 분할 화상(40)을 표시하도록 해도 된다.(vi) The teacher's writing section (201) may display grouped images (270 and 270') before and after correction, or an image (30) or an area-divided image (40) according to the grouped images so that correction by statistical processing of step S204 can be confirmed on the main screen (90), etc.
(vii) 교사 작성부(201)에서는, 스텝 S202에 나타내는 중간 학습 모델을 몇단계인가로 나누어 구해도 된다. 예를 들어, 화상군(231)과 영역 분할 화상군(241)으로부터 제1 중간 학습 모델, 화상군(231)과 영역 분할 화상군(241)에 더하여 화상군(232)과 제1 중간 학습 모델을 참조한 추론 결과로부터 라벨을 구한 영역 분할 화상군(242)으로부터 제2 중간 학습 모델을 구한다. 그리고, 제2 중간 학습 모델을 참조하여 화상군(233) 중의 화상군(232) 이외를 추론함으로써 교사 데이터(214) 중의 영역 분할 화상(40) 전부에 라벨이 할당되도록 해도 된다.(vii) In the teacher writing section (201), the intermediate learning model shown in step S202 may be obtained by dividing it into several stages. For example, a first intermediate learning model is obtained from the image group (231) and the region-segmented image group (241), and a second intermediate learning model is obtained from the region-segmented image group (242) whose label is obtained from the inference result referring to the image group (231) and the region-segmented image group (241) in addition to the image group (232) and the first intermediate learning model. In addition, by inferring other than the image group (232) among the image groups (233) with reference to the second intermediate learning model, labels may be assigned to all region-segmented images (40) in the teacher data (214).
(5) 실시예 4(5) Example 4
도 22 내지 도 25를 사용하여 실시예 4에 대하여 설명한다. 도 22는, 실시예 4의 교사 데이터 작성부터 오버레이 계측까지의 기능 구성예를 도시하는 도면이다.Example 4 will be described using FIGS. 22 to 25. FIG. 22 is a diagram showing an example of the functional configuration from teacher data creation to overlay measurement in Example 4.
<기능 구성의 개요><Overview of the functional configuration>
먼저 기능 구성의 개요에 대하여 설명한다. 교사 작성부(301)는, 교사 작성부(1)의 기능에 더하여, 주 화면(90)(도 4 참조)에서 작성된 영역 분할 화상(40)에 있어서의 각 화소로부터 영역 분할 화상(40) 내의 소영역(71a) 등(도 8 참조)의 대표 위치까지의 변위량을 유지한 위치 정보 화상을 작성하는 기능을 구비한다. 그리고, 교사 작성부(301)는, 교사 데이터(14)에 위치 정보 화상을 더한 교사 데이터(314)를 작성한다. 학습부(302)는, 샘플 화상(13) 중의 화상(30)으로부터, 교사 데이터(314) 중의 영역 분할 화상(40) 및 위치 정보 화상을 가능한 한 정확하게 추론할 수 있는 학습 모델(311)을 계산한다.First, an outline of the functional configuration will be described. In addition to the function of the teacher creation unit (1), the teacher creation unit (301) has a function of creating a position information image that maintains the displacement amount from each pixel in the region segmentation image (40) created on the main screen (90) (see Fig. 4) to the representative position of the small region (71a) etc. (see Fig. 8) within the region segmentation image (40). Then, the teacher creation unit (301) creates teacher data (314) by adding the position information image to the teacher data (14). The learning unit (302) calculates a learning model (311) that can infer the region segmentation image (40) and the position information image among the teacher data (314) as accurately as possible from the image (30) among the sample images (13).
영역 분할부(303)는, 학습 모델(311)을 참조하여, 입력 화상(12)으로부터 영역 분할 화상(60) 및 위치 정보 화상을 추론한다. 그룹화부(304)는, 그룹화부(4)와 마찬가지의 수순으로 영역 분할 화상(60)으로부터 그룹화 화상(70)을 생성하여 출력한다. 오버레이 계측부(305)는, 그룹화부(304)가 출력한 그룹화 화상 내의 소영역(71a) 등에 포함되는 위치 정보 화상의 위치 정보를 이용하여 오버레이 계측을 행한다.The region segmentation unit (303) infers a region segmentation image (60) and a position information image from the input image (12) by referring to the learning model (311). The grouping unit (304) generates and outputs a grouping image (70) from the region segmentation image (60) in the same order as the grouping unit (4). The overlay measurement unit (305) performs overlay measurement by using the position information of the position information image included in a small area (71a), etc., in the grouping image output by the grouping unit (304).
<기능 구성의 상세><Details of functional configuration>
이하, 개요 이외에 특기가 없는 그룹화부(304)를 제외하고, 실시예 4에 있어서의 각 기능 구성의 상세에 대하여 설명한다.Below, the details of each functional configuration in Example 4 are described, excluding the grouping section (304) that has no special features other than the outline.
(i) 교사 작성부(301)는, 작업자에 의한 주 화면(90)의 조작에 응답하여, 샘플 화상(13)으로부터 교사 데이터(14)를 작성한 후, 교사 데이터 중의 영역 분할 화상(40)에 이하에 설명하는 위치 정보 화상(340)을 더하여 교사 데이터(314)를 출력한다. 도 23을 참조하여, 위치 정보 화상(340)에 대하여 설명한다.(i) The teacher writing unit (301) writes teacher data (14) from a sample image (13) in response to the operator's operation of the main screen (90), and then adds a location information image (340) described below to a region segmentation image (40) among the teacher data to output teacher data (314). The location information image (340) will be described with reference to Fig. 23.
도 23은, 위치 정보 화상(340)의 예를 도시하는 도면이다. 도 23에 있어서, 화상(370)은, 샘플 화상(13) 중의 영역 분할 화상(40)으로부터 그룹화부(4)에 의해 구한 그룹화 화상이다. 그룹화 화상(370)은, 표 80(도 10 참조)에 포함되는 제1 계측 대상의 라벨로부터 구해진다. 위치 정보 화상(340)은, 그룹화 화상(370) 중에 있어서의 소영역(71m, 71n, 71o 및 71p)에 대응하는 소영역(371m, 371n, 371o, 371p) 내의 각 화소에 위치 정보를 부여한 화상이다. 소영역(371m)의 범위는, 소영역(71m)과 동일한 범위, 혹은 소영역(71m)으로부터 팽창 처리를 하거나, 소영역(71m)의 외접 직사각형을 구하는 등을 한 소영역(71m)의 근방의 범위이다. 다른 소영역(371n) 등의 범위도 소영역(71n) 등과 동일 혹은 근방의 범위이다. 소영역(371m) 내의 어떤 화소(342m)의 좌표를 (Xp, Yp), 대표 위치(341m)의 좌표를 (Xc, Yc)라고 하면, 화소(342m)에는 하기 식 3 및 식 4에 따라 구한 변위량(Rx, Ry)이 할당된다. 이 변위량(Rx, Ry)은, 화소(342m)로부터 대표 위치(341m)까지의 변위량에 해당한다. 여기서 대표 위치(341m)는 소영역(371m)의 무게 중심의 좌표로 한다. 소영역(371m) 내의 각각의 화소에는, 화소(342m)와 마찬가지로 대표 위치(341m)까지의 변위량이 할당된다.Fig. 23 is a diagram showing an example of a position information image (340). In Fig. 23, the image (370) is a grouped image obtained by the grouping unit (4) from the region segmented image (40) among the sample image (13). The grouped image (370) is obtained from the label of the first measurement target included in Table 80 (see Fig. 10). The position information image (340) is an image in which position information is assigned to each pixel within the subregions (371m, 371n, 371o, 371p) corresponding to the subregions (71m, 71n, 71o, and 71p) among the grouped image (370). The range of the subregion (371m) is the same range as the subregion (71m), or the range near the subregion (71m) that is expanded from the subregion (71m) or obtained by obtaining the circumscribed rectangle of the subregion (71m). The range of another subregion (371n), etc., is also the same as or near the subregion (71n), etc. When the coordinates of a pixel (342m) in the subregion (371m) are (Xp, Yp) and the coordinates of the representative position (341m) are (Xc, Yc), the displacement amount (Rx, Ry) obtained according to the following
Rx=Xc-Xp … (식 3)Rx=Xc-Xp … (Formula 3)
Ry=Yc-Yp … (식 4)Ry=Yc-Yp… (Formula 4)
위치 정보 화상(340)에 있어서의 소영역(371n, 371o, 371p) 내의 각각의 화소에는, 마찬가지로 각각의 화소로부터 각 소영역의 대표 위치(341n, 341o, 341p)까지의 변위량이 할당된다. 위치 정보 화상(340)에 있어서, 소영역(371m, 371n, 371o, 371p) 이외의 영역에는, 학습부(302)가 학습 모델(311)을 구하는 계산에서 제외하는 무효 영역의 속성이 할당된다.Similarly, for each pixel in the subregions (371n, 371o, 371p) of the position information image (340), a displacement amount from each pixel to the representative position (341n, 341o, 341p) of each subregion is assigned. In the position information image (340), for regions other than the subregions (371m, 371n, 371o, 371p), an attribute of an invalid region that the learning unit (302) excludes from the calculation for obtaining the learning model (311) is assigned.
또한, 교사 작성부(301)는, 표 80 중의 제2 계측 대상의 라벨에 대해서도, 위치 정보 화상(340)과 마찬가지의 위치 정보 화상을 부여한다.In addition, the teacher writing section (301) also provides a location information image similar to the location information image (340) to the label of the second measurement target in Table 80.
(ii) 학습부(302)는, 샘플 화상(13)에 있어서의 화상(30)으로부터, 교사 데이터(314) 중의 영역 분할 화상(40) 및 위치 정보 화상(340)을 가능한 한 정확하게 추론할 수 있는 학습 모델(311)을 계산한다. 화상(30)으로부터 영역 분할 화상(40)을 추론하는 학습 모델과, 화상(30)으로부터 위치 정보 화상(340)을 추론하는 학습 모델의 각각에 대하여, 독립된 뉴럴 네트워크 구조(179)를 할당할 수 있다. 혹은, 2개의 학습 모델에서, 뉴럴 네트워크 구조(179)의 전부 혹은 일부의 층을 공유시켜도 된다. 예를 들어, 입력층(170)에 화상(30)을 입력하였을 때, 출력층(171)의 일부로부터 영역 분할 화상(40)을 출력하고, 출력층(171)의 그 일부 이외의 개소 혹은 중간층(174) 등의 기타층으로부터 위치 정보 화상(340)을 출력하도록 해도 된다.(ii) The learning unit (302) calculates a learning model (311) that can infer the region segmentation image (40) and the position information image (340) among the teacher data (314) from the image (30) in the sample image (13) as accurately as possible. An independent neural network structure (179) can be assigned to each of the learning model that infers the region segmentation image (40) from the image (30) and the learning model that infers the position information image (340) from the image (30). Alternatively, all or part of the layers of the neural network structure (179) can be shared by the two learning models. For example, when an image (30) is input to an input layer (170), a region segmentation image (40) may be output from a part of an output layer (171), and a location information image (340) may be output from a location other than that part of the output layer (171) or from other layers such as an intermediate layer (174).
학습부(302)는, 학습부(2)와 마찬가지로, 샘플 화상(13) 중의 화상(30)으로부터 추론한 영역 분할 화상(40) 및 위치 정보 화상(340)과, 교사 데이터(314) 중의 대응하는 영역 분할 화상(40) 및 위치 정보 화상(340)을 비교하였을 때의 차가 작아지도록, 학습 모델(311) 중의 파라미터를 최적화한다. 예를 들어, 학습 모델(311) 중의 파라미터가 난수로 초기화된다. 그 후, 2개의 영역 분할 화상(40)의 오차(오차 1)가 라벨이 일치하지 않는 화소의 수, 2개의 위치 정보 화상(340)의 오차(오차 2)가 각 화소에 있어서의 변위량의 차의 절댓값의 총합으로 된다. 또한, 학습 모델(311) 중의 각각의 파라미터에, 오차 1과 오차 2에 대한 편미분 계수에 마이너스의 소정 계수를 승산한 것이 순차적으로 가산된다. 이러한 처리를 샘플 화상(13) 중의 화상(30)에 대하여 반복함으로써 최적화가 가능하다. 단, 이러한 방법에 한정되는 것은 아니다.The learning unit (302), like the learning unit (2), optimizes the parameters in the learning model (311) so that the difference between the region segmentation image (40) and the position information image (340) inferred from the image (30) in the sample image (13) and the corresponding region segmentation image (40) and the position information image (340) in the teacher data (314) is reduced. For example, the parameters in the learning model (311) are initialized to random numbers. Thereafter, the error (error 1) of the two region segmentation images (40) becomes the sum of the absolute values of the difference in the displacement amounts in each pixel, and the error (error 2) of the two position information images (340) becomes the sum of the absolute values of the difference in the displacement amounts in each pixel. In addition, the partial differential coefficients for
(iii) 도 24는, 위치 정보 화상(360)의 예를 도시하는 도면이다. 영역 분할부(303)는, 학습 모델(311)을 참조하여, 입력 화상(12)(즉 화상(50))으로부터 영역 분할 화상(60) 및 도 24에 도시하는 위치 정보 화상(360)의 추론을 행한다. 추론이 정확한 경우, 도 24에 있어서의 영역(369)은, 위치 정보 화상(360) 중에 있어서의 영역(59)과 동일한 범위의 영역으로 된다. 영역(369)에 있어서 소영역(371a) 내의 화소(342a)에는, 소영역(371a)의 대표 위치(341a)까지의 변위량의 추론값(Rix, Riy)의 정보가 포함된다. 화소(342a)의 좌표를 (Xip, Yip)라고 하면, 대표 위치(341a)의 위치의 추론값(Xic, Yic)은 하기 (식 5) 및 (식 6)에 의해 구할 수 있다.(iii) Fig. 24 is a diagram showing an example of a position information image (360). The region segmentation unit (303) infers the region segmentation image (60) and the position information image (360) shown in Fig. 24 from the input image (12) (i.e., the image (50)) by referring to the learning model (311). If the inference is correct, the region (369) in Fig. 24 becomes an area having the same range as the region (59) in the position information image (360). In the region (369), the pixel (342a) in the small region (371a) includes information on the inferred value (Rix, Riy) of the displacement amount to the representative position (341a) of the small region (371a). If the coordinates of pixel (342a) are (Xip, Yip), the inferred value (Xic, Yic) of the position of the representative position (341a) can be obtained by the following (Equation 5) and (Equation 6).
Xic=Rix+Xip … (식 5)Xic=Rix+Xip … (Formula 5)
Yic=Riy+Yip … (식 6)Yic=Riy+Yip… (Formula 6)
여기서, 그룹화부(4)가 표 80에 있어서의 제1 계측 대상의 라벨에 대하여 구한 소영역(71a, 71b, 71c 및 71d)에 대하여, 소영역(371a, 371b, 371c 및 371d)은 각각, 소영역(71a) 등과 범위를 동일하게 하는 소영역으로 된다. 소영역(371b, 371c 및 371d)에 있어서의 각 화소로부터도 마찬가지로 대표 위치(341b, 341c 및 341d)의 위치를, 식 5 및 식 6에 의해 추론할 수 있다(추론값을 계산할 수 있음). 위치 정보 화상(360)에 있어서 영역(369) 외의 부분에도 화소(342a)와 마찬가지의 위치 정보가 저장되어 있다.Here, the grouping section (4) obtains the sub-regions (71a, 71b, 71c and 71d) for the labels of the first measurement targets in Table 80, and the sub-regions (371a, 371b, 371c and 371d) are each sub-regions having the same range as the sub-region (71a). Similarly, the positions of the representative positions (341b, 341c and 341d) can be inferred from each pixel in the sub-regions (371b, 371c and 371d) by
또한, 영역 분할부(303)는, 표 80 중의 제2 계측 대상의 라벨로부터도, 위치 정보 화상(360)과 마찬가지의 위치 정보 화상을 출력한다.In addition, the area division unit (303) outputs a position information image similar to the position information image (360) from the label of the second measurement target in Table 80.
(iv) 오버레이 계측부(305)는, 도 25에 도시하는 흐름도에 따라 오버레이 계측 처리를 실행한다.(iv) The overlay measurement unit (305) executes overlay measurement processing according to the flow chart shown in Fig. 25.
도 25에 있어서, 스텝 S314 및 스텝 S316 이외는, 오버레이 계측부(5)가 오버레이 계측 처리 시에 실행하는 흐름도(도 11)와 공통이므로, 설명은 생략한다. 이하, 스텝 S13 내지 스텝 S18의 루프가, 소영역(371a)을 대상으로 하는 경우에 대하여 설명한다.In Fig. 25, except for Step S314 and Step S316, since they are common to the flowchart (Fig. 11) that the overlay measurement unit (5) executes during overlay measurement processing, their description is omitted. Hereinafter, the loop of Steps S13 to S18 will be described for the case where the small area (371a) is targeted.
스텝 S314에 있어서, 오버레이 계측부(305)는, 위치 정보 화상(360)에 있어서의 소영역(371a) 중의 각각의 화소(화소(342a) 등)로부터 상기 식 5와 식 6을 사용하여 대표 위치(341a)의 추론값을 구한다. 다음에, 오버레이 계측부(305)는, 각각의 화소로부터 대표 위치(341a)의 추론값을 구하여 그들의 통계량을 계산하고, 당해 통계량을 위치 1로 한다. 통계량은 중앙값으로서 산출할 수 있지만, 기타 상가 평균 등의 통계량이어도 된다.In step S314, the overlay measurement unit (305) obtains an inference value of the representative position (341a) from each pixel (such as pixel (342a)) in the small area (371a) of the position information image (360) using the
스텝 S316에 있어서, 오버레이 계측부(305)는, 표 80에 나타내어지는 제2 계측 대상에 대해서도 마찬가지로, 제2 계측 대상의 라벨에 대하여 구한 소영역에 대한 위치 정보 화상으로부터, 스텝 S314와 마찬가지의 처리를 행함으로써, 위치 2(대표 위치의 추론값의 통계량)를 구한다.In step S316, the overlay measurement unit (305) performs the same processing as step S314 for the second measurement target shown in Table 80, from the position information image for the small area obtained for the label of the second measurement target, thereby obtaining position 2 (statistics of the inference value of the representative position).
<실시예 4의 기술적 효과><Technical effect of Example 4>
실시예 4에 따르면, 위치 정보 화상(360)을 사용하여 오버레이양을 계측할 수 있다. 입력 화상(12)에 랜덤 노이즈가 중첩되거나, 콘트라스트가 저하되거나 하는 등으로 화질이 저하되는 경우가 있다. 이러한 경우에는, 영역 분할 화상(60) 중의 라벨이 부정확하게 되고, 그룹화 화상(70) 중의 소영역(71a) 등의 범위가 부정확하게 되지만, 실시예 4에 개시된 기술을 사용하면, 이러한 경우라도 정확한 오버레이 계측을 실행할 수 있게 된다. 예를 들어, 소영역(71a)의 우측 절반이 결여되어 버린 경우, 소영역(71a)의 무게 중심이 본래의 위치로부터 좌측으로 어긋나 버리고, 이 결과 스텝 S14에서는 정확한 위치 1을 구할 수 없다. 이에 비해, 스텝 S314에서는 위치 정보 화상(370) 중의 소영역(371a)의 어느 화소로부터도 대표 위치(341a)를 식 5 및 식 6으로부터 산출할 수 있다. 이 때문에, 소영역(71a)(즉 소영역(371a))의 우측 절반이 결여된 경우라도 스텝 S314에 있어서 정확한 위치 1을 계산할 수 있다.According to Example 4, the overlay amount can be measured using the position information image (360). There are cases where the image quality deteriorates, such as when random noise is superimposed on the input image (12), or when the contrast is reduced. In such cases, the label in the region segmentation image (60) becomes inaccurate, and the range of the small region (71a) in the grouped image (70) becomes inaccurate. However, if the technique disclosed in Example 4 is used, accurate overlay measurement can be performed even in such cases. For example, if the right half of the small region (71a) is missing, the center of gravity of the small region (71a) shifts to the left from the original position, and as a result, the
<실시예 4의 변형예><Modification of Example 4>
(i) 교사 작성부(301)는, 교사 데이터(14) 중의 영역 분할 화상(40)에 대하여 스텝 S204의 통계 처리에 의한 보정을 행해도 된다. 이에 의해, 영역 분할 화상(40) 중의 소영역(71a) 등의 무게 중심은 오버레이 계측부(5)에 있어서의 오버레이 계측의 재현성 혹은 감도 특성이 개선되도록 보정할 수 있다. 이 때문에, 영역 분할 화상(40) 중의 소영역(71a 등)의 무게 중심 등에 따라 정해지는 교사 데이터(314) 중의 위치 정보 화상(370) 중의 각 화소(342m 등)도 오버레이 계측의 재현성 혹은 감도 특성이 개선되도록 보정할 수 있다.(i) The teacher preparation unit (301) may perform correction by statistical processing of step S204 on the region segmentation image (40) of the teacher data (14). As a result, the center of gravity of the small region (71a), etc., of the region segmentation image (40) can be corrected so that the reproducibility or sensitivity characteristic of the overlay measurement in the overlay measurement unit (5) is improved. Therefore, each pixel (342m, etc.) of the position information image (370) of the teacher data (314) determined according to the center of gravity of the small region (71a, etc.) of the region segmentation image (40) can also be corrected so that the reproducibility or sensitivity characteristic of the overlay measurement is improved.
(ii) 그룹화부(304)는, 영역 분할 화상(60)으로부터 그룹화 화상(70)을 구할 때, 위치 정보 화상(360)을 참조해도 된다. 예를 들어, 그룹화 화상(70) 중에 있어서 2개의 소영역(예를 들어, 소영역(71m 및 71n))이 본래의 범위보다 부풀어 버림으로써 연결되어 1개의 소영역을 형성하는 경우가 있다. 이 경우, 위치 정보 화상(360)에 있어서 1개의 소영역 내에서 식 5 및 식 6에 의해 구한 대표 위치가 분리(위치 정보 화상(360) 중에서 71m과 71n 중에 대응한 371m과 371의 대표 위치로 분리)되는 경우가 있다. 그래서, 대표 위치가 분리되어 버리는 경우에는, 1개의 소영역을 대표 위치의 분리를 참조하여 분할해도 된다. 이와 같이 소영역을 분할하는 것은, 예를 들어 입력 화상(12)의 화질이 샘플 화상(30)보다 불선명한 것이 영향을 주어 그룹화 화상(70) 중의 소영역이 부정확해지는 경우에 유용하다.(ii) When the grouping unit (304) obtains the grouping image (70) from the region segmentation image (60), it may refer to the position information image (360). For example, in the grouping image (70), there is a case where two small regions (for example, small regions (71m and 71n)) are connected to form one small region by being inflated beyond their original range. In this case, in the position information image (360), there is a case where the representative positions obtained by
(6) 실시예 5(6) Example 5
실시예 5는, 한정된 양의 샘플 화상으로부터 영역 분할 화상(교사 데이터에 대응)을 생성하고, 영역 분할 화상 내의 소영역을 평행 이동하여 영역 분할 화상 및 샘플 화상의 레이아웃 변경을 행함으로써(영역 분할 화상과 샘플 화상을 합성함으로써), 교사 데이터와 샘플 화상을 축적해 나가는 기술에 대하여 개시한다.Example 5 discloses a technique for accumulating teacher data and sample images by generating region-segmented images (corresponding to teacher data) from a limited amount of sample images, and changing the layout of the region-segmented images and sample images by moving small regions within the region-segmented images in parallel (by synthesizing the region-segmented images and sample images).
<기능 구성의 개요><Overview of the functional configuration>
도 26은, 실시예 5에 의한 교사 데이터 작성부터 오버레이 계측까지의 기능 구성예를 도시하는 도면이다. 교사 작성부(401)는, 교사 작성부(1)와 마찬가지로, 샘플 화상(13)으로부터 교사 데이터(14)를 작성함과 함께, 그를 위한 유저 인터페이스를 제공한다. 또한, 교사 작성부(401)는, 교사 데이터(14) 중에 있어서의 영역 분할 화상(40)의 레이아웃을 변경시킨 교사 데이터(414)를 생성하여 출력한다. 또한, 교사 작성부(401)는, 영역 분할 화상(40)으로부터 화상(30)을 추론하는 기능을 구비하고(이하, 이 기능을 교사 작성부(401)의 화상 추론 기능이라고 칭함), 교사 데이터(414) 중의 영역 분할 화상(40)으로부터 대응한 화상(30)의 각각을 추론함으로써, 샘플 화상(413)을 출력한다. 또한, 학습부(2), 영역 분할부(3), 그룹화부(4) 및 오버레이 계측부(5)의 각 기능은 실시예 1과 동일하므로, 설명은 생략한다. 즉, 실시예 5에 있어서의 학습부(2)는, 교사 데이터(14)와 교사 데이터(414) 및 샘플 화상(13)과 샘플 화상(413)을 동질의 데이터로 간주하여, 실시예 1과 동일한 수순으로 학습 모델(11)을 계산한다.Fig. 26 is a diagram showing an example of a functional configuration from teacher data creation to overlay measurement according to Example 5. The teacher creation unit (401), like the teacher creation unit (1), creates teacher data (14) from a sample image (13) and provides a user interface therefor. In addition, the teacher creation unit (401) generates and outputs teacher data (414) in which the layout of the region-segmented image (40) in the teacher data (14) is changed. In addition, the teacher creation unit (401) is provided with a function of inferring an image (30) from the region-segmented image (40) (hereinafter, this function is referred to as an image inference function of the teacher creation unit (401)), and outputs a sample image (413) by inferring each of the corresponding images (30) from the region-segmented image (40) in the teacher data (414). In addition, since the functions of the learning unit (2), the region division unit (3), the grouping unit (4), and the overlay measurement unit (5) are the same as in Example 1, the description is omitted. That is, the learning unit (2) in Example 5 considers the teacher data (14) and the teacher data (414) and the sample image (13) and the sample image (413) as homogeneous data, and calculates the learning model (11) in the same procedure as in Example 1.
<기능 구성의 상세><Details of functional configuration>
이하, 도 27 내지 도 29를 참조하면서, 교사 작성부(401)가 교사 데이터(414) 및 샘플 화상(413)을 출력할 때의 처리에 대하여 상세하게 설명한다.Hereinafter, with reference to FIGS. 27 to 29, the processing when the teacher writing unit (401) outputs teacher data (414) and sample image (413) will be described in detail.
(i) 도 27은, 영역 분할 화상(440)으로부터 추론된 화상(430)의 예를 도시하는 도면이다. 도 27에 있어서, 화상(440)은, 교사 작성부(401)가 제공하는 유저 인터페이스를 사용하여 작업자에 의해 작성된 영역 분할 화상의 예를 도시하고, 라벨 41, 42 및 43으로 구성되어 있다. 또한, 소영역(71q)은, 그룹화부(4)에 의해 구해진 영역 분할 화상 내의 라벨 41의 소영역의 일례를 나타내고 있다. 또한, 화상(430)은, 교사 작성부(401)가 화상 추론 기능을 사용하여, 영역 분할 화상(440)으로부터 추론한 화상을 나타내고 있다. 여기서, 교사 작성부(401)의 화상 추론 기능은, (a) 학습부(2)와 마찬가지로, 사전에, 샘플 화상(13)과 교사 데이터(14)와 같이, 임의의 화상(30)과 영역 분할 화상(40)의 조의 샘플을 수집해 두는 것, 및 (b) 하나의 영역 분할 화상(40)으로부터 추론된 화상(30)과, 상기 임의의 화상(30)과 영역 분할 화상(40)의 조에 포함되는 화상으로서 하나의 영역 분할 화상(40)에 대응하는 화상의 오차가 최소로 되는 뉴럴 네트워크(179)에 유사한 구조에 있어서의 파라미터를 구하는 학습을 실행함으로써 실현할 수 있다. 여기서, 영역 분할 화상(40)에 대응하는 화상과 추론된 화상(30)의 오차는, 각 화소의 명도 차분의 절대합을 집계함으로써 구할 수 있지만, 이 방법에 한정되는 것은 아니다. 또한, 교사 작성부(401)의 화상 추론 기능은, 상술한 방법 이외에도, 예를 들어 적대적 생성 네트워크라고 불리는 난수 혹은 기호로부터 화상을 생성함으로써 우수한 기계 학습 알고리즘을 사용하여, 뉴럴 네트워크 구조(179)와 유사한 네트워크 구조 중의 파라미터를 정함으로써도 실현할 수 있다.(i) Fig. 27 is a drawing showing an example of an image (430) inferred from a region segmentation image (440). In Fig. 27, the image (440) shows an example of a region segmentation image created by a worker using a user interface provided by a teacher creation unit (401), and is composed of
또한, 뉴럴 네트워크 구조(179)에 유사한 네트워크 구조에서는, 네트워크 구조(179)와 마찬가지로, 수용야(176) 단위의 추론을 행하도록 해도 된다. 즉, 영역 분할 화상(40)의 화소의 각각에 대하여, 영역 분할 화상(40)에 있어서의 화소 주위의 수용야(176)의 범위로부터, 화상(30) 중에 있어서 화소와 동일한 좌표의 화소의 명도가 정해진다.In addition, in a network structure similar to a neural network structure (179), inference may be performed in units of receptive fields (176), similarly to the network structure (179). That is, for each pixel of a region-segmented image (40), the brightness of a pixel having the same coordinates as the pixel in the image (30) is determined from the range of the receptive field (176) around the pixel in the region-segmented image (40).
(ii) 도 28은, 영역 분할 화상(440) 중에서 소영역(71q)을 레이아웃 변경한 경우의 예를 도시하는 도면이다. 도 28에 있어서, 영역 분할 화상(440r)은, 영역 분할 화상(440) 중의 소영역(71q)을 소영역(71r)으로 평행 이동하는 레이아웃의 변경을 행한 것이다. 수용야(176) 단위의 추론의 효과에 의해, 영역 분할 화상(440r)으로부터 추론된 화상(430r)을, 영역 분할 화상(440)에 대응하는 화상(430)과 비교하면, 소영역(71q)에 따른 소영역(431q) 내의 화상이 소영역(71r) 내의 소영역(431r)으로 이동하고 있는 것을 알 수 있다. 소영역(431q) 및 소영역(431r) 내에 착안하면, 소영역(71q)으로부터 소영역(71r)으로 평행 이동시킨 분만큼, 오버레이양이 변화한 화상에 상당한다. 따라서, 영역 분할 화상(440r)에 있어서, 소영역(71r) 등의 전부를 균일한 양만큼 평행 이동시키면, 화상(430r)은 화상(430)으로부터 균일한 양만큼 오버레이양을 변화시킨 화상으로 된다.(ii) Fig. 28 is a drawing showing an example of a case where the layout of a small region (71q) in a region-segmented image (440) is changed. In Fig. 28, a region-segmented image (440r) is a layout change in which a small region (71q) in a region-segmented image (440) is moved in parallel to a small region (71r). By comparing an image (430r) inferred from a region-segmented image (440r) with an image (430) corresponding to a region-segmented image (440) by the effect of inference in units of accommodation fields (176), it can be seen that an image in a small region (431q) according to a small region (71q) is moved to a small region (431r) in a small region (71r). Focusing on the small area (431q) and the small area (431r), it corresponds to an image in which the overlay amount has changed by the amount of parallel movement from the small area (71q) to the small area (71r). Therefore, in the area-divided image (440r), if all of the small areas (71r) etc. are parallel moved by a uniform amount, the image (430r) becomes an image in which the overlay amount has changed by a uniform amount from the image (430).
<실시예 5의 기술적 효과><Technical effect of Example 5>
실시예 5에 따르면, 레이아웃의 변경에 의해, 교사 데이터(14)에 교사 데이터(414)를 축적해 나갈 수 있다. 또한, 레이아웃의 변경과 교사 작성부(401)의 화상 추론 기능을 사용함으로써, 샘플 화상(13)에 샘플 화상(413)을 축적해 나갈 수 있다. 예를 들어, 샘플 화상(13)이 오버레이양이 균일한 화상(30)으로 구성된 경우라도, 레이아웃의 변경에 의해, 여러 가지 오버레이양의 영역 분할 화상(40) 및 화상(30)을 교사 데이터(14)와 샘플 화상(13)에 축적해 나갈 수 있다. 따라서, 작업자는, 사전에 여러 가지 레이아웃을 구비하는 많은 샘플 화상을 준비할 필요가 없어져, 오버레이 계측을 위한 수고를 줄이는 것이 가능하게 된다.According to Example 5, by changing the layout, teacher data (414) can be accumulated in teacher data (14). In addition, by changing the layout and using the image inference function of the teacher creation section (401), the sample image (413) can be accumulated in the sample image (13). For example, even if the sample image (13) is composed of an image (30) having a uniform overlay amount, by changing the layout, area segmentation images (40) and images (30) having various overlay amounts can be accumulated in the teacher data (14) and the sample image (13). Therefore, the operator does not need to prepare many sample images having various layouts in advance, and it becomes possible to reduce the effort for overlay measurement.
<실시예 5의 변형예><Modification of Example 5>
(i) 레이아웃의 변경에는, 상술한 평행 이동 이외에도, 확대나 축소 등의 오버레이양의 변화를 수반하는 임의의 기하적인 변형도 적용할 수 있다.(i) In addition to the above-described parallel translation, changes in the layout may also include any geometric transformation that involves a change in the amount of overlay, such as enlargement or reduction.
(ii) 사전에, 영역 분할 화상(440) 중의 라벨 41, 42 및 43의 깊이 정보를 정해 두도록 해도 된다. 이에 의해, 교사 작성부(401)는, 라벨간의 차폐를 고려한 화상을 추론할 수 있다. 도 29는, 영역 분할 화상(440) 중에서 소영역(71q)을 레이아웃 변경하였을 때에 차폐가 생겼을 때의 예(라벨 43, 41 및 42의 순으로 전방측에 있다고 정하였을 때의 예)를 도시하는 도면이다. 도 29에 도시되는 바와 같이, 영역 분할 화상 중의 소영역(71q)을 소영역(71s)까지 평행 이동시켰을 때 생기는, 라벨 43과 겹치는 범위는 삭제된다. 그 결과, 영역 분할 화상(440s)으로부터 추론된 화상(430s)에 있어서, 소영역(71s)에 대응하는 소영역(431s)에 관해서는 차폐가 고려된 화상이 추론된다. 이에 의해, 라벨간의 차폐에 의해 보다 현실에 가까운 영역 분할 화상(430)을 합성하는 것이 가능하게 된다.(ii) In advance, the depth information of
(iii) 이상 설명한 실시예 1부터 실시예 5는, 각각 단독으로 실시하는 것 이외에, 각 실시예의 일부 혹은 전부를 조합하여 실시해도 된다.(iii) In addition to carrying out each of the
(7) 실시예 6(7) Example 6
실시예 6은, 실시예 1부터 5에 있어서의 교사 데이터 작성 처리, 학습 모델 작성 처리, 영역 분할 처리를 오버레이 계측 이외의 계측 처리에 적용한 경우의 실시예에 대하여 설명한다.Example 6 describes an embodiment in which the teacher data creation processing, learning model creation processing, and region division processing of Examples 1 to 5 are applied to measurement processing other than overlay measurement.
도 30은, 실시예 6에 의한 교사 데이터 작성부터 화상 계측 검사까지의 기능 구성예를 도시하는 도면이다. 도 30에 있어서, 교사 작성부(501)는, 실시예 1부터 5에 의한 교사 작성부(1, 101, 201, 301 및 401) 중 어느 것에 대응한다. 마찬가지로, 교사 데이터(514), 학습부(502), 학습 모델(511), 영역 분할부(503)는 순서대로, 실시예 1부터 5 중 어느 것에 있어서의 교사 데이터, 학습부, 학습 모델, 영역 분할부에 대응한다.Fig. 30 is a diagram showing an example of a functional configuration from teacher data creation to image measurement inspection according to Example 6. In Fig. 30, a teacher creation section (501) corresponds to any one of the teacher creation sections (1, 101, 201, 301, and 401) according to Examples 1 to 5. Similarly, teacher data (514), a learning section (502), a learning model (511), and a region division section (503) correspond, in order, to the teacher data, learning section, learning model, and region division section of any one of Examples 1 to 5.
화상 계측 검사부(505)는, 입력 화상(12)으로부터 영역 분할부(503)가 추론한 영역 분할 화상(60)을 사용하여, 오버레이 계측에 한하지 않는 화상의 검사나 계측을 행한다. 화상 계측 검사부(505)에 있어서의 화상의 검사나 계측으로서, 예를 들어 반도체 화상 중의 윤곽선 추출이나 홀 형상 등의 치수 계측, 단락 결함 등의 결함 패턴의 검출, 화상으로부터 설계도의 추론을 구하여 설계도의 추론과 실제의 설계도의 대조 위치를 찾는 패턴 매칭 등을 들 수 있다. 단, 이들에 한정되는 것은 아니며, 영역 분할부(503)가 추론한 영역 분할 화상(60)을 사용하여 화상 계측을 행하는 임의의 용도에 적용할 수 있다. 또한, 화상 계측 검사부(505)에 있어서는, 영역 분할 화상(60)의 보정 등을 위해, 입력 화상(12)이나 도 30 중에 도시되지 않는 그 밖의 데이터를 보조적으로 참조해도 된다. 또한, 실시예 6에서는 샘플 화상(13) 및 입력 화상(12)을 반도체 이외의 화상을 촬영한 것으로 해도 된다.The image measurement inspection unit (505) uses the region segmentation image (60) inferred by the region segmentation unit (503) from the input image (12) to perform inspection or measurement of the image, not limited to overlay measurement. Examples of the inspection or measurement of the image in the image measurement inspection unit (505) include: outline extraction or dimension measurement of hole shapes, etc. in semiconductor images; detection of defect patterns, such as short-circuit defects; pattern matching for finding a comparison position between the inference of the design drawing and the actual design drawing by inferring the design drawing from the image; etc. However, the present invention is not limited to these, and can be applied to any purpose of performing image measurement using the region segmentation image (60) inferred by the region segmentation unit (503). In addition, the image measurement inspection unit (505) may auxiliaryly refer to the input image (12) or other data not shown in FIG. 30 for correction of the region segmentation image (60), etc. In addition, in Example 6, the sample image (13) and the input image (12) may be images other than semiconductors.
(i) 교사 작성부(501), 학습부(502) 및 영역 분할부(503)의 각 기능이 실시예 1의 그들의 기능을 구비하는 경우(i) If each function of the teacher writing section (501), learning section (502) and area division section (503) has their functions in Example 1.
예를 들어, 학습 모델(511)이 수용야(176) 단위로 추론하기 때문에, 입력 화상(12) 내에 주기적인 패턴이 비추는 경우라면, 교사 작성부(501)에 있어서 교사 데이터(14)의 라벨을 할당할 때의 샘플 화상(13) 중의 화상(30)의 치수는, 입력 화상(12) 중의 화상(60)보다 작은 치수로 끝난다. 이에 의해, 작업자가 교사 데이터(14)의 라벨을 할당하는 공정수를 저감하는 것이 가능하게 된다.For example, since the learning model (511) infers in units of receptive fields (176), if a periodic pattern is reflected in the input image (12), the dimensions of the image (30) among the sample images (13) when assigning the label of the teacher data (14) in the teacher writing unit (501) end up being smaller than the dimensions of the image (60) among the input images (12). This makes it possible for the worker to reduce the number of processes for assigning the label of the teacher data (14).
(ii) 교사 작성부(501), 학습부(502) 및 영역 분할부(503)의 각 기능이 실시예 2의 그들의 기능을 구비하는 경우(ii) When each function of the teacher writing section (501), learning section (502) and area division section (503) has their functions of Example 2.
예를 들어, 촬영 조건을 바꾼 복수의 화상조를 사용함으로써, 화상(30a 및 30b) 등 중에서 대상으로 되는 구조가 선명하게 비추는 화상을 사용하여 교사 데이터(114)를 정확하게 작성하는 것이나, 영역 분할부(503)의 추론을 정확하게 행하는 것이 가능하다.For example, by using multiple image sets with different shooting conditions, it is possible to accurately create teacher data (114) or accurately perform inference of the area division section (503) by using an image in which the target structure is clearly illuminated among images (30a and 30b).
(iii) 교사 작성부(501), 학습부(502) 및 영역 분할부(503)의 각 기능이 실시예 3의 그들의 기능을 구비하는 경우(iii) If each function of the teacher writing section (501), learning section (502) and area division section (503) has their functions in Example 3.
예를 들어, 샘플 화상(213) 중에서 주 화면(90)을 사용하여 교사 데이터를 할당하는 대상을 화상군(231)으로 좁힘으로써, 작업자의 공정수를 줄일 수 있다. 또한, 실시예 3의 도 19의 스텝 S202 및 S203을 실행함으로써, 샘플 화상(13)(샘플 화상(213)에 대응)의 남은 전수에 대하여 교사 데이터(514)(교사 데이터(214)에 대응)를 취득할 수 있다. 또한, 스텝 S204나 S205를 실행함으로써, 교사 데이터(514)(교사 데이터(214)에 대응)를 보정할 수도 있다.For example, by narrowing the target of assigning teacher data to the image group (231) using the main screen (90) among the sample images (213), the number of processes for the worker can be reduced. In addition, by executing steps S202 and S203 of FIG. 19 of Example 3, it is possible to acquire teacher data (514) (corresponding to the teacher data (214)) for the remaining number of sample images (13) (corresponding to the sample images (213)). In addition, by executing steps S204 or S205, it is also possible to correct the teacher data (514) (corresponding to the teacher data (214)).
(iv) 교사 작성부(501), 학습부(502) 및 영역 분할부(503)의 각 기능이 실시예 4의 그들의 기능을 구비하는 경우(iv) If each function of the teacher writing section (501), learning section (502) and area division section (503) has their functions of Example 4.
입력 화상(12)으로부터 구한 영역 분할 화상(60)과 함께 위치 정보 화상(360)을 사용한 화상 계측이 가능하게 된다.Image measurement using a location information image (360) together with a region segmentation image (60) obtained from an input image (12) becomes possible.
(v) 교사 작성부(501), 학습부(502) 및 영역 분할부(503)의 각 기능이 실시예 5의 그들의 기능을 구비하는 경우(v) When each function of the teacher writing section (501), learning section (502) and area division section (503) has their functions in Example 5.
예를 들어, 교사 작성부(501)에 있어서의 화상 추론 기능을 사용하여, 영역 분할 화상(40) 중의 레이아웃을 변경함으로써, 샘플 화상(13) 및 교사 데이터(14)에 샘플 화상(413) 및 교사 데이터(414)(교사 데이터(14)와 교사 데이터(414)를 합쳐서 교사 데이터(514)라고 함)를 축적해 가게 한다.For example, by using the image inference function in the teacher writing section (501), the layout of the region segmentation image (40) is changed, so that the sample image (13) and the teacher data (14) are accumulated into the sample image (413) and the teacher data (414) (the teacher data (14) and the teacher data (414) are combined and called teacher data (514)).
<실시예 6의 기술적 효과><Technical effect of Example 6>
실시예 6에 따르면, 실시예 1부터 5에서 개시된 기술을 오버레이 계측뿐만 아니라, 영역 분할 화상을 사용하여 화상 계측이나 화상 검사를 행하는 시스템 전반에 적용할 수 있는 것이 나타났다.According to Example 6, it was shown that the techniques disclosed in Examples 1 to 5 can be applied not only to overlay measurement, but also to a system in general for performing image measurement or image inspection using region-segmented images.
(8) 그 밖의 실시예(8) Other examples
각 실시예는, 소프트웨어의 프로그램 코드에 의해서도 실현할 수 있다. 이 경우, 프로그램 코드를 기록한 기억 매체를 시스템 혹은 장치에 제공하고, 그 시스템 혹은 장치의 컴퓨터(또는 CPU나 MPU)가 기억 매체에 저장된 프로그램 코드를 판독한다. 이 경우, 기억 매체로부터 판독된 프로그램 코드 자체가 전술한 실시 형태의 기능을 실현하게 되고, 그 프로그램 코드 자체, 및 그것을 기억한 기억 매체는 본 개시를 구성하게 된다. 이러한 프로그램 코드를 공급하기 위한 기억 매체로서는, 예를 들어 플렉시블 디스크, CD-ROM, DVD-ROM, 하드 디스크, 광 디스크, 광 자기 디스크, CD-R, 자기 테이프, 불휘발성 메모리 카드, ROM 등이 사용된다.Each embodiment can also be realized by the program code of the software. In this case, a storage medium recording the program code is provided to a system or device, and a computer (or CPU or MPU) of the system or device reads the program code stored in the storage medium. In this case, the program code itself read from the storage medium realizes the function of the above-described embodiment, and the program code itself and the storage medium storing it constitute the present disclosure. As a storage medium for supplying such a program code, for example, a flexible disk, a CD-ROM, a DVD-ROM, a hard disk, an optical disk, a magneto-optical disk, a CD-R, a magnetic tape, a nonvolatile memory card, a ROM, etc. are used.
또한, 프로그램 코드의 지시에 기초하여, 컴퓨터 상에서 가동하고 있는 OS(오퍼레이팅 시스템) 등이 실제의 처리의 일부 또는 전부를 행하고, 그 처리에 의해 전술한 실시 형태의 기능이 실현되도록 해도 된다. 또한, 기억 매체로부터 판독된 프로그램 코드가 컴퓨터 상의 메모리에 기입된 후, 그 프로그램 코드의 지시에 기초하여, 컴퓨터의 CPU 등이 실제의 처리의 일부 또는 전부를 행하고, 그 처리에 의해 전술한 실시 형태의 기능이 실현되도록 해도 된다.In addition, based on the instructions of the program code, an OS (operating system) running on the computer may perform part or all of the actual processing, and the functions of the above-described embodiment may be realized by the processing. In addition, after the program code read from the storage medium is written into the memory of the computer, based on the instructions of the program code, the CPU of the computer may perform part or all of the actual processing, and the functions of the above-described embodiment may be realized by the processing.
또한, 실시 형태의 기능을 실현하는 소프트웨어의 프로그램 코드를, 네트워크를 통하여 배신함으로써, 그것을 시스템 또는 장치의 하드 디스크나 메모리 등의 기억 수단 또는 CD-RW, CD-R 등의 기억 매체에 저장하고, 사용 시에 그 시스템 또는 장치의 컴퓨터(또는 CPU나 MPU)가 당해 기억 수단이나 당해 기억 매체에 저장된 프로그램 코드를 판독하여 실행하도록 해도 된다.In addition, the program code of the software that realizes the function of the embodiment may be distributed over a network, thereby storing it in a storage means such as a hard disk or memory of a system or device, or a storage medium such as a CD-RW or CD-R, and when used, the computer (or CPU or MPU) of the system or device may read and execute the program code stored in the storage means or the storage medium.
1, 101, 201, 301, 401, 501: 교사 작성부
2, 102, 302, 502: 학습부
3, 103, 303, 503: 영역 분할부
4, 104, 304: 그룹화부
5, 105, 305: 오버레이 계측부
11, 111, 311, 511: 학습 모델
12, 112: 입력 화상
13, 113, 213, 413: 샘플 화상
14, 114, 214, 314, 414, 514: 교사 데이터
190: 메인 프로세서
190a: 제1 서브 프로세서
190b: 제2 서브 프로세서
191: 메인 계산기
191a: 제1 서브 계산기
191b: 제2 서브 계산기
192: 입출력 장치
193: 전자 현미경 등
505: 화상 계측 검사부1, 101, 201, 301, 401, 501: Teacher's Notes
2, 102, 302, 502: Learning Department
3, 103, 303, 503: Area division
4, 104, 304: Grouping Section
5, 105, 305: Overlay Instrumentation
11, 111, 311, 511: Learning Model
12, 112: Input image
13, 113, 213, 413: Sample images
14, 114, 214, 314, 414, 514: Teacher Data
190: Main Processor
190a: First subprocessor
190b: Second subprocessor
191: Main Calculator
191a: 1st sub calculator
191b: Second sub calculator
192: Input/output devices
193: Electron microscope, etc.
505: Image Measurement Inspection Department
Claims (19)
상기 화상 계측에 관계된 각종 처리를 실행하는 적어도 하나의 프로세서와,
상기 화상 계측의 결과를 출력하는 출력 디바이스를 구비하고,
상기 적어도 하나의 프로세서는,
반도체의 샘플 화상으로부터 교사 데이터를 생성하는 처리와,
상기 샘플 화상과 상기 교사 데이터에 기초하여 학습 모델을 생성하는 처리와,
상기 학습 모델에 기초하여, 상기 반도체에 관련된 입력 화상으로부터 영역 분할 화상을 생성하는 처리와,
상기 영역 분할 화상을 사용하여 화상 계측을 행하는 계측 처리와,
상기 계측 처리의 결과를 상기 출력 디바이스에 출력하는 처리를 실행하고,
상기 교사 데이터는, 상기 샘플 화상에 있어서의 상기 반도체의 구조를 포함하는 라벨이 화상의 각 화소에 할당된 화상이고,
상기 학습 모델은, 상기 샘플 화상 혹은 상기 입력 화상으로부터 상기 교사 데이터 혹은 상기 영역 분할 화상을 추론하기 위한 파라미터를 포함하고,
상기 샘플 화상 및 상기 교사 데이터는, 상기 입력 화상보다 작은 사이즈이며, 상기 주기적인 구조에 대응하는 화상 영역을 포함하며,
상기 적어도 하나의 프로세서는, 상기 학습 모델을 생성하는 처리에 있어서, 상기 샘플 화상 및 상기 교사 데이터로부터 상기 학습 모델의 상기 파라미터를 생성하는, 계측 시스템.A measuring system for performing image measurement of a semiconductor including a periodic structure,
At least one processor for executing various processes related to the above image measurement,
Equipped with an output device that outputs the results of the above image measurement,
At least one processor of the above,
Processing of generating teacher data from sample images of semiconductors,
Processing for generating a learning model based on the above sample image and the above teacher data,
Based on the above learning model, a process of generating a region segmented image from an input image related to the semiconductor;
Measurement processing for performing image measurement using the above-mentioned area segmentation image,
Execute a process for outputting the result of the above measurement processing to the above output device,
The above teacher data is an image in which a label including the structure of the semiconductor in the sample image is assigned to each pixel of the image,
The above learning model includes parameters for inferring the teacher data or the region segmentation image from the sample image or the input image,
The above sample image and the above teacher data are smaller in size than the input image and include an image area corresponding to the periodic structure,
A measurement system wherein said at least one processor generates said parameters of said learning model from said sample image and said teacher data in the process of generating said learning model.
상기 화상 계측에 관계된 각종 처리를 실행하는 적어도 하나의 프로세서와,
상기 화상 계측의 결과를 출력하는 출력 디바이스를 구비하고,
상기 적어도 하나의 프로세서는,
반도체의 샘플 화상으로부터 교사 데이터를 생성하는 처리와,
상기 샘플 화상과 상기 교사 데이터에 기초하여 학습 모델을 생성하는 처리와,
상기 학습 모델에 기초하여, 상기 반도체에 관련된 입력 화상으로부터 영역 분할 화상을 생성하는 처리와,
상기 영역 분할 화상을 사용하여 화상 계측을 행하는 계측 처리와,
상기 계측 처리의 결과를 상기 출력 디바이스에 출력하는 처리를 실행하고,
상기 교사 데이터는, 상기 샘플 화상에 있어서의 상기 반도체의 구조를 포함하는 라벨이 화상의 각 화소에 할당된 화상이고,
상기 학습 모델은, 상기 샘플 화상 혹은 상기 입력 화상으로부터 상기 교사 데이터 혹은 상기 영역 분할 화상을 추론하기 위한 파라미터를 포함하고,
상기 적어도 하나의 프로세서는, 또한 상기 라벨에 대응하여 상기 영역 분할 화상을 더 화상 사이즈가 작은 소영역으로 나누고, 당해 소영역의 종별마다 그룹화하는 처리를 실행하고,
상기 적어도 하나의 프로세서는, 상기 계측 처리로서, 상기 그룹화된 상기 소영역별의 무게 중심으로부터 오버레이 계측을 실행하는, 계측 시스템.A measuring system for performing image measurement of a semiconductor including a predetermined structure,
At least one processor for executing various processes related to the above image measurement,
Equipped with an output device that outputs the results of the above image measurement,
At least one processor of the above,
Processing of generating teacher data from sample images of semiconductors,
Processing for generating a learning model based on the above sample image and the above teacher data,
Based on the above learning model, a process of generating a region segmented image from an input image related to the semiconductor;
Measurement processing for performing image measurement using the above-mentioned area segmentation image,
Execute a process for outputting the result of the above measurement processing to the above output device,
The above teacher data is an image in which a label including the structure of the semiconductor in the sample image is assigned to each pixel of the image,
The above learning model includes parameters for inferring the teacher data or the region segmentation image from the sample image or the input image,
The at least one processor further executes a process of dividing the region segmented image into smaller regions corresponding to the label and grouping the regions by type.
A measurement system in which at least one processor, as the measurement processing, executes overlay measurement from the center of gravity of each of the grouped sub-regions.
상기 적어도 하나의 프로세서는, 상기 위치 정보 화상을 포함하는 상기 학습 모델에 기초하여, 상기 입력 화상의 상기 영역 분할 화상 및 상기 위치 정보 화상을 생성하고, 상기 그룹화된 소영역에 있어서의 상기 위치 정보 화상을 사용하여 상기 오버레이 계측을 실행하는, 계측 시스템.In the sixth paragraph, the teacher data includes a position information image representing the displacement amount from each pixel to the representative position of the small area to which the label is assigned.
A measurement system, wherein said at least one processor generates said region segmentation image and said position information image of said input image based on said learning model including said position information image, and executes said overlay measurement using said position information image in said grouped small region.
상기 화상 계측에 관계된 각종 처리를 실행하는 적어도 하나의 프로세서와,
상기 화상 계측의 결과를 출력하는 출력 디바이스를 구비하고,
상기 적어도 하나의 프로세서는,
반도체의 샘플 화상으로부터 교사 데이터를 생성하는 처리와,
상기 샘플 화상과 상기 교사 데이터에 기초하여 학습 모델을 생성하는 처리와,
상기 학습 모델에 기초하여, 상기 반도체에 관련된 입력 화상으로부터 영역 분할 화상을 생성하는 처리와,
상기 영역 분할 화상을 사용하여 화상 계측을 행하는 계측 처리와,
상기 계측 처리의 결과를 상기 출력 디바이스에 출력하는 처리를 실행하고,
상기 교사 데이터는, 상기 샘플 화상에 있어서의 상기 반도체의 구조를 포함하는 라벨이 화상의 각 화소에 할당된 화상이고,
상기 학습 모델은, 상기 샘플 화상 혹은 상기 입력 화상으로부터 상기 교사 데이터 혹은 상기 영역 분할 화상을 추론하기 위한 파라미터를 포함하고,
상기 샘플 화상은, 다른 촬상 조건에서 상기 반도체에 있어서의 동일 개소를 복수회 촬상하여 얻어지는 화상의 조를 포함하고,
상기 적어도 하나의 프로세서는, 상기 샘플 화상으로부터 상기 촬상 조건에 대응하여 상기 교사 데이터를 생성하고, 상기 촬상 조건에 대응하여 생성된 상기 교사 데이터와 상기 샘플 화상에 기초하여 상기 학습 모델을 생성하는, 계측 시스템.A measuring system for performing image measurement of a semiconductor including a predetermined structure,
At least one processor for executing various processes related to the above image measurement,
Equipped with an output device that outputs the results of the above image measurement,
At least one processor of the above,
Processing of generating teacher data from sample images of semiconductors,
Processing for generating a learning model based on the above sample image and the above teacher data,
Based on the above learning model, a process of generating a region segmented image from an input image related to the semiconductor;
Measurement processing for performing image measurement using the above-mentioned area segmentation image,
Execute a process for outputting the result of the above measurement processing to the above output device,
The above teacher data is an image in which a label including the structure of the semiconductor in the sample image is assigned to each pixel of the image,
The above learning model includes parameters for inferring the teacher data or the region segmentation image from the sample image or the input image,
The above sample image includes a set of images obtained by capturing the same location in the semiconductor multiple times under different capturing conditions,
A measurement system wherein said at least one processor generates said teacher data corresponding to said shooting conditions from said sample image, and generates said learning model based on said teacher data generated corresponding to said shooting conditions and said sample image.
상기 화상 계측에 관계된 각종 처리를 실행하는 적어도 하나의 프로세서와,
상기 화상 계측의 결과를 출력하는 출력 디바이스를 구비하고,
상기 적어도 하나의 프로세서는,
반도체의 샘플 화상으로부터 교사 데이터를 생성하는 처리와,
상기 샘플 화상과 상기 교사 데이터에 기초하여 학습 모델을 생성하는 처리와,
상기 학습 모델에 기초하여, 상기 반도체에 관련된 입력 화상으로부터 영역 분할 화상을 생성하는 처리와,
상기 영역 분할 화상을 사용하여 화상 계측을 행하는 계측 처리와,
상기 계측 처리의 결과를 상기 출력 디바이스에 출력하는 처리를 실행하고,
상기 교사 데이터는, 상기 샘플 화상에 있어서의 상기 반도체의 구조를 포함하는 라벨이 화상의 각 화소에 할당된 화상이고,
상기 학습 모델은, 상기 샘플 화상 혹은 상기 입력 화상으로부터 상기 교사 데이터 혹은 상기 영역 분할 화상을 추론하기 위한 파라미터를 포함하고,
상기 적어도 하나의 프로세서는, 상기 샘플 화상을 2개 이상의 샘플 화상군으로 분할하고, 제1 샘플 화상군에 포함되는 화상에 상기 라벨을 할당함으로써 제1 교사 데이터를 생성하고, 상기 제1 샘플 화상군의 화상과 상기 제1 교사 데이터에 기초하여 중간 학습 모델을 생성하고, 당해 중간 학습 모델에 기초하여 상기 제1 샘플 화상군 이외의 화상군에 포함되는 화상을 추론함으로써 생성된 교사 데이터를 상기 제1 교사 데이터에 추가하여 제2 교사 데이터를 생성하고, 상기 샘플 화상과 상기 제2 교사 데이터에 기초하여, 상기 입력 화상에 적용하기 위한 상기 학습 모델을 생성하는, 계측 시스템.A measuring system for performing image measurement of a semiconductor including a predetermined structure,
At least one processor for executing various processes related to the above image measurement,
Equipped with an output device that outputs the results of the above image measurement,
At least one processor of the above,
Processing of generating teacher data from sample images of semiconductors,
Processing for generating a learning model based on the above sample image and the above teacher data,
Based on the above learning model, a process of generating a region segmented image from an input image related to the semiconductor;
Measurement processing for performing image measurement using the above-mentioned area segmentation image,
Execute a process for outputting the result of the above measurement processing to the above output device,
The above teacher data is an image in which a label including the structure of the semiconductor in the sample image is assigned to each pixel of the image,
The above learning model includes parameters for inferring the teacher data or the region segmentation image from the sample image or the input image,
A measurement system wherein the at least one processor generates first teacher data by dividing the sample image into two or more sample image groups, assigning the label to images included in the first sample image group, generating an intermediate learning model based on images of the first sample image group and the first teacher data, inferring images included in image groups other than the first sample image group based on the intermediate learning model, adding the generated teacher data to the first teacher data to generate second teacher data, and generating the learning model for application to the input image based on the sample image and the second teacher data.
상기 화상 계측에 관계된 각종 처리를 실행하는 적어도 하나의 프로세서와,
상기 화상 계측의 결과를 출력하는 출력 디바이스를 구비하고,
상기 적어도 하나의 프로세서는,
반도체의 샘플 화상으로부터 교사 데이터를 생성하는 처리와,
상기 샘플 화상과 상기 교사 데이터에 기초하여 학습 모델을 생성하는 처리와,
상기 학습 모델에 기초하여, 상기 반도체에 관련된 입력 화상으로부터 영역 분할 화상을 생성하는 처리와,
상기 영역 분할 화상을 사용하여 화상 계측을 행하는 계측 처리와,
상기 계측 처리의 결과를 상기 출력 디바이스에 출력하는 처리를 실행하고,
상기 교사 데이터는, 상기 샘플 화상에 있어서의 상기 반도체의 구조를 포함하는 라벨이 화상의 각 화소에 할당된 화상이고,
상기 학습 모델은, 상기 샘플 화상 혹은 상기 입력 화상으로부터 상기 교사 데이터 혹은 상기 영역 분할 화상을 추론하기 위한 파라미터를 포함하고,
상기 적어도 하나의 프로세서는, 또한 상기 교사 데이터의 레이아웃을 변경하여 변경 교사 데이터를 생성하고, 당해 변경 교사 데이터를 레이아웃 변경 전의 상기 교사 데이터에 추가하여 갱신 교사 데이터로 하는 처리와, 상기 변경 교사 데이터로부터 추론한 화상을 상기 샘플 화상에 추가하여 갱신 샘플 화상으로 하는 처리를 실행하고,
상기 적어도 하나의 프로세서는, 상기 갱신 교사 데이터와 상기 갱신 샘플 화상에 기초하여, 상기 학습 모델로 생성하는, 계측 시스템.A measuring system for performing image measurement of a semiconductor including a predetermined structure,
At least one processor for executing various processes related to the above image measurement,
Equipped with an output device that outputs the results of the above image measurement,
At least one processor of the above,
Processing of generating teacher data from sample images of semiconductors,
Processing for generating a learning model based on the above sample image and the above teacher data,
Based on the above learning model, a process of generating a region segmented image from an input image related to the semiconductor;
Measurement processing for performing image measurement using the above-mentioned area segmentation image,
Execute a process for outputting the result of the above measurement processing to the above output device,
The above teacher data is an image in which a label including the structure of the semiconductor in the sample image is assigned to each pixel of the image,
The above learning model includes parameters for inferring the teacher data or the region segmentation image from the sample image or the input image,
The at least one processor also executes a process of changing the layout of the teacher data to generate changed teacher data, adding the changed teacher data to the teacher data before the layout change to make it updated teacher data, and a process of adding an image inferred from the changed teacher data to the sample image to make it an updated sample image.
A measurement system wherein said at least one processor generates said learning model based on said updated teacher data and said updated sample image.
적어도 하나의 프로세서가, 반도체의 샘플 화상으로부터 얻어지는 영역 분할 화상에 대하여 적어도 하나의 계측 대상의 구조를 포함하는 라벨을 할당함으로써 교사 데이터를 생성하는 것과,
상기 적어도 하나의 프로세서가, 복수의 층으로 구성되는 네트워크 구조에 기초하여, 상기 샘플 화상의 상기 영역 분할 화상과 상기 교사 데이터를 사용하여, 상기 학습 모델을 생성하는 것을 포함하고,
상기 학습 모델은, 상기 샘플 화상 혹은 상기 반도체에 관련된 입력 화상으로부터 상기 교사 데이터 혹은 상기 영역 분할 화상을 추론하기 위한 파라미터를 포함하고,
상기 적어도 하나의 프로세서는, 또한 상기 라벨에 대응하여 상기 영역 분할 화상을 더 화상 사이즈가 작은 소영역으로 나누고, 해당 소영역의 종별마다 그룹화하는 처리를 실행하고,
상기 적어도 하나의 프로세서는, 상기 그룹화된 상기 소영역별의 무게 중심으로부터 오버레이 계측을 실행하는, 방법.A method for generating a learning model used when performing image measurement of a semiconductor including a predetermined structure,
At least one processor generates teacher data by assigning a label including a structure of at least one measurement target to a region segmentation image obtained from a sample image of a semiconductor, and
The at least one processor comprises generating the learning model using the region segmented image of the sample image and the teacher data based on a network structure composed of a plurality of layers,
The above learning model includes parameters for inferring the teacher data or the region segmentation image from the sample image or the input image related to the semiconductor,
The at least one processor further executes a process of dividing the region segmented image into smaller regions corresponding to the label and grouping the regions by type.
A method wherein said at least one processor executes overlay measurement from the center of gravity of said grouped subregions.
상기 프로그램은, 상기 컴퓨터에,
반도체의 샘플 화상으로부터 얻어지는 영역 분할 화상에 대하여 적어도 하나의 계측 대상의 구조를 포함하는 라벨을 할당함으로써 교사 데이터를 생성하는 처리와,
복수의 층으로 구성되는 네트워크 구조에 기초하여, 상기 샘플 화상의 상기 영역 분할 화상과 상기 교사 데이터를 사용하여, 상기 학습 모델을 생성하는 처리를 실행시키고,
상기 학습 모델은, 상기 샘플 화상 혹은 상기 반도체에 관련된 입력 화상으로부터 상기 교사 데이터 혹은 상기 영역 분할 화상을 추론하기 위한 파라미터를 포함하고,
상기 프로그램은, 상기 컴퓨터에 또한,
상기 라벨에 대응하여 상기 영역 분할 화상을 더 화상 사이즈가 작은 소영역으로 나누고, 해당 소영역의 종별마다 그룹화하는 처리와,
상기 그룹화된 상기 소영역별의 무게 중심으로부터 오버레이 계측하는 처리를 실행시키는, 기억 매체.A storage medium storing a program for executing a process of generating a learning model used when performing image measurement of a semiconductor including a predetermined structure on a computer,
The above program is, on the computer,
Process for generating teacher data by assigning a label including the structure of at least one measurement target to a region segmentation image obtained from a sample image of a semiconductor;
Based on a network structure composed of multiple layers, a process is executed to generate the learning model using the region segmentation image of the sample image and the teacher data,
The above learning model includes parameters for inferring the teacher data or the region segmentation image from the sample image or the input image related to the semiconductor,
The above program also, on the computer,
Process of dividing the above region segmented image into smaller regions corresponding to the above label and grouping each type of the respective regions,
A storage medium that executes a process of measuring an overlay from the center of gravity of each of the above grouped sub-regions.
Applications Claiming Priority (1)
| Application Number | Priority Date | Filing Date | Title |
|---|---|---|---|
| PCT/JP2019/034050 WO2021038815A1 (en) | 2019-08-30 | 2019-08-30 | Measurement system, method for generating learning model to be used when performing image measurement of semiconductor including predetermined structure, and recording medium for storing program for causing computer to execute processing for generating learning model to be used when performing image measurement of semiconductor including predetermined structure |
Publications (2)
| Publication Number | Publication Date |
|---|---|
| KR20220029748A KR20220029748A (en) | 2022-03-08 |
| KR102758552B1 true KR102758552B1 (en) | 2025-01-23 |
Family
ID=74683410
Family Applications (1)
| Application Number | Title | Priority Date | Filing Date |
|---|---|---|---|
| KR1020227004040A Active KR102758552B1 (en) | 2019-08-30 | 2019-08-30 | A method for generating a learning model used when performing image measurement of a semiconductor including a predetermined structure, a measurement system, and a storage medium storing a program for causing a computer to execute processing for generating a learning model used when performing image measurement of a semiconductor including a predetermined structure |
Country Status (6)
| Country | Link |
|---|---|
| US (1) | US12198327B2 (en) |
| JP (1) | JP7341241B2 (en) |
| KR (1) | KR102758552B1 (en) |
| CN (1) | CN114270484B (en) |
| TW (1) | TWI766303B (en) |
| WO (1) | WO2021038815A1 (en) |
Families Citing this family (13)
| Publication number | Priority date | Publication date | Assignee | Title |
|---|---|---|---|---|
| US11967058B2 (en) * | 2020-06-24 | 2024-04-23 | Kla Corporation | Semiconductor overlay measurements using machine learning |
| CN112785575B (en) * | 2021-01-25 | 2022-11-18 | 清华大学 | Image processing method, device and storage medium |
| JP7812684B2 (en) * | 2022-02-22 | 2026-02-10 | 株式会社Screenホールディングス | Teacher data generation device, teacher data generation method, and program |
| US12175652B2 (en) * | 2022-02-23 | 2024-12-24 | Nanya Technology Corporation | System and non-transitory computer-readable medium for identifying cause of manufacturing defects |
| US12118709B2 (en) | 2022-02-23 | 2024-10-15 | Nanya Technology Corporation | Method for identifying cause of manufacturing defects |
| CN114549589B (en) * | 2022-03-01 | 2024-09-27 | 昆明理工大学 | A method and system for measuring vibration displacement of rotating body based on lightweight neural network |
| US12105504B2 (en) | 2022-04-27 | 2024-10-01 | Applied Materials, Inc. | Run-to-run control at a manufacturing system using machine learning |
| KR20250002463A (en) * | 2022-06-10 | 2025-01-07 | 주식회사 히타치하이테크 | Sample observation method |
| US12535744B2 (en) * | 2022-10-31 | 2026-01-27 | Kla Corporation | Overlay estimation based on optical inspection and machine learning |
| CN120826604A (en) * | 2023-06-22 | 2025-10-21 | 株式会社日立高新技术 | Measurement system, computer and measurement method |
| KR20260016453A (en) * | 2024-07-25 | 2026-02-03 | 주식회사 히타치하이테크 | Data set generation device, data set generation method, imaging device, imaging method, microscope device, data set generation system, imaging system, and semiconductor device manufacturing system |
| JP2026025460A (en) * | 2024-08-02 | 2026-02-16 | オムロン株式会社 | Information processing device, information display device, information processing method, information display method, and program |
| CN119739011B (en) * | 2025-02-18 | 2025-12-02 | 浙江大学杭州国际科创中心 | Methods, apparatus, electronic devices, and storage media for determining the photolithography process window |
Citations (2)
| Publication number | Priority date | Publication date | Assignee | Title |
|---|---|---|---|---|
| JP2018522238A (en) | 2015-07-13 | 2018-08-09 | アプライド マテリアルズ イスラエル リミテッド | Techniques for measuring the overlay between layers of multilayer structures. |
| JP2019110120A (en) * | 2017-12-18 | 2019-07-04 | エフ イー アイ カンパニFei Company | Method, device, and system for remote deep learning for microscopic image reconstruction and segmentation |
Family Cites Families (8)
| Publication number | Priority date | Publication date | Assignee | Title |
|---|---|---|---|---|
| JP3524819B2 (en) * | 1999-07-07 | 2004-05-10 | 株式会社日立製作所 | Pattern inspection method and apparatus by image comparison |
| US7873585B2 (en) | 2007-08-31 | 2011-01-18 | Kla-Tencor Technologies Corporation | Apparatus and methods for predicting a semiconductor parameter across an area of a wafer |
| US10650508B2 (en) | 2014-12-03 | 2020-05-12 | Kla-Tencor Corporation | Automatic defect classification without sampling and feature selection |
| TWI797699B (en) * | 2015-12-22 | 2023-04-01 | 以色列商應用材料以色列公司 | Method of deep learning - based examination of a semiconductor specimen and system thereof |
| KR102137454B1 (en) * | 2016-01-29 | 2020-07-24 | 주식회사 히타치하이테크 | Overlay error measurement device, and computer program |
| JP6542824B2 (en) * | 2017-03-13 | 2019-07-10 | ファナック株式会社 | Image processing apparatus and image processing method for calculating likelihood of image of object detected from input image |
| TW201923776A (en) | 2017-10-27 | 2019-06-16 | 美商蝴蝶網路公司 | Automated measurements on ultrasound images and collected quality indicators for automated measurements |
| US10794839B2 (en) * | 2019-02-22 | 2020-10-06 | Kla Corporation | Visualization of three-dimensional semiconductor structures |
-
2019
- 2019-08-30 JP JP2021541913A patent/JP7341241B2/en active Active
- 2019-08-30 KR KR1020227004040A patent/KR102758552B1/en active Active
- 2019-08-30 CN CN201980099234.7A patent/CN114270484B/en active Active
- 2019-08-30 US US17/634,805 patent/US12198327B2/en active Active
- 2019-08-30 WO PCT/JP2019/034050 patent/WO2021038815A1/en not_active Ceased
-
2020
- 2020-07-01 TW TW109122244A patent/TWI766303B/en active
Patent Citations (2)
| Publication number | Priority date | Publication date | Assignee | Title |
|---|---|---|---|---|
| JP2018522238A (en) | 2015-07-13 | 2018-08-09 | アプライド マテリアルズ イスラエル リミテッド | Techniques for measuring the overlay between layers of multilayer structures. |
| JP2019110120A (en) * | 2017-12-18 | 2019-07-04 | エフ イー アイ カンパニFei Company | Method, device, and system for remote deep learning for microscopic image reconstruction and segmentation |
Also Published As
| Publication number | Publication date |
|---|---|
| JPWO2021038815A1 (en) | 2021-03-04 |
| TWI766303B (en) | 2022-06-01 |
| WO2021038815A1 (en) | 2021-03-04 |
| JP7341241B2 (en) | 2023-09-08 |
| CN114270484A (en) | 2022-04-01 |
| US20220277434A1 (en) | 2022-09-01 |
| US12198327B2 (en) | 2025-01-14 |
| CN114270484B (en) | 2025-12-23 |
| TW202109339A (en) | 2021-03-01 |
| KR20220029748A (en) | 2022-03-08 |
Similar Documents
| Publication | Publication Date | Title |
|---|---|---|
| KR102758552B1 (en) | A method for generating a learning model used when performing image measurement of a semiconductor including a predetermined structure, a measurement system, and a storage medium storing a program for causing a computer to execute processing for generating a learning model used when performing image measurement of a semiconductor including a predetermined structure | |
| JP7265592B2 (en) | Techniques for Measuring Overlay Between Layers in Multilayer Structures | |
| JP5948138B2 (en) | Defect analysis support device, program executed by defect analysis support device, and defect analysis system | |
| US7256799B2 (en) | Image synthesizer, image synthesis method and computer readable recording medium having image synthesis processing program recorded thereon | |
| US11663713B2 (en) | Image generation system | |
| US9177378B2 (en) | Updating landmarks to improve coregistration as regions of interest are corrected | |
| JPWO2021038815A5 (en) | ||
| WO2013136591A1 (en) | Image inspection method and inspection region setting method | |
| CN114097067B (en) | Dimension measuring devices, semiconductor manufacturing equipment, and semiconductor device manufacturing systems | |
| US20160350905A1 (en) | Method of inspecting a specimen and system thereof | |
| CN110555860A (en) | Method, electronic device and storage medium for marking rib region in medical image | |
| CN114266781A (en) | Defect inspection apparatus, defect inspection method, and information recording medium | |
| KR102690867B1 (en) | Pattern matching devices, pattern measurement systems, and non-transitory computer-readable media. | |
| JP2000124281A (en) | Pattern search method and pattern search device | |
| CN114187294B (en) | Regular wafer positioning method based on prior information | |
| KR20250016301A (en) | Measuring system, model making system and measuring method | |
| JPH10320556A (en) | Electronic image area determination method, electronic image area determination system, SEM device including electronic image area determination system, and computer-readable recording medium storing electronic image area determination program |
Legal Events
| Date | Code | Title | Description |
|---|---|---|---|
| PA0105 | International application |
Patent event date: 20220207 Patent event code: PA01051R01D Comment text: International Patent Application |
|
| PA0201 | Request for examination | ||
| PG1501 | Laying open of application | ||
| E902 | Notification of reason for refusal | ||
| PE0902 | Notice of grounds for rejection |
Comment text: Notification of reason for refusal Patent event date: 20240318 Patent event code: PE09021S01D |
|
| E701 | Decision to grant or registration of patent right | ||
| PE0701 | Decision of registration |
Patent event code: PE07011S01D Comment text: Decision to Grant Registration Patent event date: 20241121 |
|
| PG1601 | Publication of registration |