KR101606322B1 - Method and apparatus for evaluating value of used car - Google Patents
Method and apparatus for evaluating value of used car Download PDFInfo
- Publication number
- KR101606322B1 KR101606322B1 KR1020150074838A KR20150074838A KR101606322B1 KR 101606322 B1 KR101606322 B1 KR 101606322B1 KR 1020150074838 A KR1020150074838 A KR 1020150074838A KR 20150074838 A KR20150074838 A KR 20150074838A KR 101606322 B1 KR101606322 B1 KR 101606322B1
- Authority
- KR
- South Korea
- Prior art keywords
- vehicle
- value
- data
- used vehicle
- scatter
- Prior art date
Links
Images


Classifications
-
- G—PHYSICS
- G06—COMPUTING; CALCULATING OR COUNTING
- G06Q—INFORMATION AND COMMUNICATION TECHNOLOGY [ICT] SPECIALLY ADAPTED FOR ADMINISTRATIVE, COMMERCIAL, FINANCIAL, MANAGERIAL OR SUPERVISORY PURPOSES; SYSTEMS OR METHODS SPECIALLY ADAPTED FOR ADMINISTRATIVE, COMMERCIAL, FINANCIAL, MANAGERIAL OR SUPERVISORY PURPOSES, NOT OTHERWISE PROVIDED FOR
- G06Q30/00—Commerce
- G06Q30/02—Marketing; Price estimation or determination; Fundraising
- G06Q30/0283—Price estimation or determination
-
- G—PHYSICS
- G06—COMPUTING; CALCULATING OR COUNTING
- G06Q—INFORMATION AND COMMUNICATION TECHNOLOGY [ICT] SPECIALLY ADAPTED FOR ADMINISTRATIVE, COMMERCIAL, FINANCIAL, MANAGERIAL OR SUPERVISORY PURPOSES; SYSTEMS OR METHODS SPECIALLY ADAPTED FOR ADMINISTRATIVE, COMMERCIAL, FINANCIAL, MANAGERIAL OR SUPERVISORY PURPOSES, NOT OTHERWISE PROVIDED FOR
- G06Q30/00—Commerce
- G06Q30/02—Marketing; Price estimation or determination; Fundraising
- G06Q30/0201—Market modelling; Market analysis; Collecting market data
- G06Q30/0206—Price or cost determination based on market factors
-
- G—PHYSICS
- G06—COMPUTING; CALCULATING OR COUNTING
- G06Q—INFORMATION AND COMMUNICATION TECHNOLOGY [ICT] SPECIALLY ADAPTED FOR ADMINISTRATIVE, COMMERCIAL, FINANCIAL, MANAGERIAL OR SUPERVISORY PURPOSES; SYSTEMS OR METHODS SPECIALLY ADAPTED FOR ADMINISTRATIVE, COMMERCIAL, FINANCIAL, MANAGERIAL OR SUPERVISORY PURPOSES, NOT OTHERWISE PROVIDED FOR
- G06Q30/00—Commerce
- G06Q30/02—Marketing; Price estimation or determination; Fundraising
- G06Q30/0241—Advertisements
- G06Q30/0251—Targeted advertisements
- G06Q30/0265—Vehicular advertisement
-
- G—PHYSICS
- G06—COMPUTING; CALCULATING OR COUNTING
- G06Q—INFORMATION AND COMMUNICATION TECHNOLOGY [ICT] SPECIALLY ADAPTED FOR ADMINISTRATIVE, COMMERCIAL, FINANCIAL, MANAGERIAL OR SUPERVISORY PURPOSES; SYSTEMS OR METHODS SPECIALLY ADAPTED FOR ADMINISTRATIVE, COMMERCIAL, FINANCIAL, MANAGERIAL OR SUPERVISORY PURPOSES, NOT OTHERWISE PROVIDED FOR
- G06Q30/00—Commerce
- G06Q30/02—Marketing; Price estimation or determination; Fundraising
- G06Q30/0281—Customer communication at a business location, e.g. providing product or service information, consulting
Landscapes
- Business, Economics & Management (AREA)
- Development Economics (AREA)
- Strategic Management (AREA)
- Engineering & Computer Science (AREA)
- Accounting & Taxation (AREA)
- Finance (AREA)
- Entrepreneurship & Innovation (AREA)
- Economics (AREA)
- Game Theory and Decision Science (AREA)
- Marketing (AREA)
- Physics & Mathematics (AREA)
- General Business, Economics & Management (AREA)
- General Physics & Mathematics (AREA)
- Theoretical Computer Science (AREA)
- Data Mining & Analysis (AREA)
- Management, Administration, Business Operations System, And Electronic Commerce (AREA)
Abstract
The method comprising the steps of: receiving used vehicle sales data including a value of a continuous variable corresponding to a selling price and a selling price of a used vehicle; receiving a linearization conversion of a continuous variable; The method comprising: Calculating a predicted value of the used vehicle based on the result of the regression analysis and the information on the used vehicle that is the subject of the valuation; Converting the used vehicle and used vehicle sales data, which are subject to valuation, into coordinates of the multidimensional space; Searching for a used vehicle and a similar vehicle that are subject to valuation; A method and an apparatus for evaluating a used vehicle value including a step of calculating an indirect predicted value of a used car using a relative distance of used vehicle sales data in a multidimensional space.
Description
The present invention relates to a method and system for evaluating a used vehicle value, which calculates a predicted value of a used vehicle through regression analysis.
Determining the purchase price of a used car requires the intuition of an experienced person. These pricing decisions are made by estimating the vehicle prices based on similar vehicles that have recently been traded. However, the method is not standardized and depends on experience and speculation.
SUMMARY OF THE INVENTION It is an object of the present invention to provide a method and an apparatus for presenting an accurate estimated price of a used car in a quantified manner using regression analysis.
It is another object of the present invention to provide a method and apparatus for viewing predicted value of a used car by simply inputting simple information to a terminal such as a smart phone so that a non-specialist and a non-specialist can easily calculate a vehicle estimate.
According to an aspect of the present invention, there is provided a method for evaluating a used vehicle value, comprising: inputting used vehicle sales data including a selling price of a used vehicle and a value of a continuous variable corresponding to the selling price; Receiving; wherein the x-axis represents a value obtained by multiplying the continuous variable by an arbitrary number from -2 to 2 excluding 0 and a y-axis represents a value obtained by multiplying each point on the scattergram and corresponding coordinates on the regression line Performing a linear transformation of the continuous variable by deriving a power sum applied to a scattergram that minimizes a sum of y-axis-based distances between the centers; Performing a multiple regression analysis on the used-car sales data by including the selling price as a dependent variable y and the continuous variable as one of the independent variables x, and applying the result of the linearization conversion; Inputting information on a used vehicle to be evaluated; And calculating the predicted value of the used car by using the result of the regression analysis and the information on the used car that is the subject of the valuation.
According to another aspect of the present invention, there is provided a method for evaluating a used vehicle value, comprising: receiving used vehicle sales data including a selling price of a used vehicle and a value of a continuous variable corresponding to the selling price; wherein the x-axis represents a value obtained by multiplying the continuous variable by an arbitrary number from -2 to 2 excluding 0 and a y-axis represents a value obtained by multiplying each point on the scattergram and corresponding coordinates on the regression line Performing a linear transformation of the continuous variable by deriving a power sum applied to a scattergram that minimizes a sum of areas of a square having a length of a side of the y axis as a length of one side; Performing a multiple regression analysis on the used-car sales data by including the selling price as a dependent variable y and the continuous variable as one of the independent variables x, and applying the result of the linearization conversion; Inputting information on a used vehicle to be evaluated; And calculating the predicted value of the used car by using the result of the regression analysis and the information on the used car that is the subject of the valuation.
According to another aspect of the present invention, there is provided a method for evaluating a used vehicle value, comprising: receiving used vehicle sales data including a selling price of a used vehicle and a value of a continuous variable corresponding to the selling price; wherein the x-axis represents a value obtained by multiplying the continuous variable by an arbitrary number from -2 to 2 excluding 0 and a y-axis represents a value obtained by multiplying each point on the scattergram and corresponding coordinates on the regression line Performing a linear transformation of the continuous variable by deriving a power sum applied to a scattergram that minimizes the sum of the volumes of the cubes having the length of one side of the y axis as a reference distance; Performing a multiple regression analysis on the used-car sales data by including the selling price as a dependent variable y and the continuous variable as one of the independent variables x, and applying the result of the linearization conversion; Inputting information on a used vehicle to be evaluated; And calculating the predicted value of the used car by using the result of the regression analysis and the information on the used car that is the subject of the valuation.
According to another aspect of the present invention, there is provided a method for evaluating a used vehicle value, comprising: receiving used vehicle sales data including a selling price of a used vehicle and a value of a continuous variable corresponding to the selling price; the x-axis represents a value obtained by multiplying the continuous variable by an arbitrary number from -2 to 2 excluding 0, and the y-axis represents the shortest distance from the regression line Performing a linear transformation of the continuous variable by deriving a power sum applied to a scattergram including all the points within a range of < RTI ID = 0.0 > Performing a multiple regression analysis on the used-car sales data by including the selling price as a dependent variable y and the continuous variable as one of the independent variables x, and applying the result of the linearization conversion; Inputting information on a used vehicle to be evaluated; And calculating the predicted value of the used car by using the result of the regression analysis and the information on the used car that is the subject of the valuation.
According to another aspect of the present invention, there is provided a method for evaluating a used vehicle value, comprising: receiving used vehicle sales data including a selling price of a used vehicle and a value of a continuous variable corresponding to the selling price; wherein the x-axis represents a value obtained by multiplying the continuous variable by an arbitrary number from -2 to 2, except for 0, and the y-axis represents the selling price, The linear transformation of the continuous variable is performed by deriving the power multiplication applied to the scatter diagram having the smallest gradient of the tangents of the tangents at a position spaced apart by a predetermined distance on the Y axis with respect to an arbitrary point on the regression curve of the continuous variable ; Performing a multiple regression analysis on the used-car sales data by including the selling price as a dependent variable y and the continuous variable as one of the independent variables x, and applying the result of the linearization conversion; Inputting information on a used vehicle to be evaluated; And calculating the predicted value of the used car by using the result of the regression analysis and the information on the used car that is the subject of the valuation.
The method for evaluating a used vehicle value includes the steps of: selecting a predetermined number of variables among variables included in the used-for-sale vehicle sales data; setting sales information of each used vehicle as coordinates of a multi- Converting; Converting information on the used vehicle that is the subject of the valuation to coordinates in the multidimensional space; And providing the user with a selling price of the used car corresponding to the coordinates close to the coordinates of the used car that is the subject of the value evaluation among the coordinates converted from the used car sales data.
The method for evaluating a used vehicle value includes the steps of: selecting a predetermined number of variables among variables included in the used-for-sale vehicle sales data; setting sales information of each used vehicle as coordinates of a multi- Converting; Converting information on the used vehicle that is the subject of the valuation to coordinates in the multidimensional space; Obtaining respective weights in inverse proportion to the distance between the used vehicle that is the value evaluation target and the used used vehicle sales data using the transformed multi-dimensional spatial data coordinates; Obtaining a deviation between the used vehicle and the used-for-sale data, which is the object of the valuation; Obtaining a difference between a sale amount of each of the used-for-sale vehicle sales data and a sumproduct operation of the deviation and a regression coefficient of the corresponding used vehicle; Calculating a relative predicted value of the used vehicle that is the subject of the value evaluation by adding both the weights of the used vehicle sales data and the product of the differences to the weight of the used vehicle sales data; The method may further include the step of providing the user with a predicted value that satisfies a predetermined criterion among the relative price calculated as the relative predicted value and the predicted absolute price through the multiple regression analysis.
The predictor satisfying the predetermined criterion may be a low predicted value among the calculated relative price and the absolute price through the multiple regression analysis.
According to the present invention as described above, it is possible to present an accurate estimated price of a used car in a quantified manner using a multiple regression analysis.
In addition, according to the present invention, by using the distance from the existing sales data in the multidimensional space in addition to the absolute price through the regression analysis, the search result of the vehicles similar to the used car which is the object of the estimate, and the relative price of the used vehicle, .
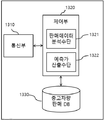
1 is a diagram illustrating a network configuration of a used vehicle value evaluation system according to an embodiment of the present invention.
2 is a functional block diagram illustrating a configuration of a used vehicle value evaluation system according to an embodiment of the present invention.
3 illustrates an example of a scatter diagram illustrating a relationship between a selling price and a mileage of a specific vehicle according to an embodiment of the present invention.
FIG. 4 illustrates another example of a scattergram showing a relationship between a selling price and a mileage of a specific vehicle according to an embodiment of the present invention.
FIG. 5 is an example of a modification of the graph showing the relationship between the selling price and the running distance of FIG. 3 by an index capable of improving the linearity most in accordance with an embodiment of the present invention.
FIG. 6 is an example of a modification of the graph showing the relationship between the selling price and the mileage of FIG. 4 according to an index capable of improving the linearity in the embodiment of the present invention.
FIG. 7 illustrates a result of performing multiple regression analysis using linearized variables according to an embodiment of the present invention.
8 to 11 illustrate a user interface screen according to an embodiment of the present invention.
12 is a functional block diagram for explaining a configuration of a used vehicle value evaluating apparatus according to another embodiment of the present invention.
13 is a flowchart illustrating a method for evaluating a used vehicle value according to an embodiment of the present invention.
The terms used in this specification will be briefly described and the present invention will be described in detail.
While the present invention has been described in connection with what is presently considered to be the most practical and preferred embodiment, it is to be understood that the invention is not limited to the disclosed embodiments. Also, in certain cases, there may be a term selected arbitrarily by the applicant, in which case the meaning thereof will be described in detail in the description of the corresponding invention. Therefore, the term used in the present invention should be defined based on the meaning of the term, not on the name of a simple term, but on the entire contents of the present invention.
When an element is referred to as "including" an element throughout the specification, it is to be understood that the element may include other elements as well, without departing from the spirit or scope of the present invention. The term " means ", "part "," module ", etc. in the specification means units for processing at least one function or operation, Lt; / RTI >
Hereinafter, embodiments of the present invention will be described in detail with reference to the accompanying drawings so that those skilled in the art can easily carry out the present invention. The present invention may, however, be embodied in many different forms and should not be construed as limited to the embodiments set forth herein. In order to clearly illustrate the present invention, parts not related to the description are omitted, and similar parts are denoted by like reference characters throughout the specification.
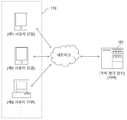
1 is a diagram illustrating a network configuration of a used vehicle value evaluation system according to an embodiment of the present invention.
Referring to FIG. 1, the used vehicle value evaluation system includes a used vehicle
The
The used vehicle
The network may be a wired network such as a local area network (LAN), a wide area network (WAN), or a wireless network such as a mobile communication network, a satellite communication network, a WIFI, or a Bluetooth network. It is not limited.
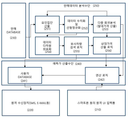
FIG. 2 is a functional block diagram for explaining a configuration of a used vehicle value evaluation system according to an embodiment of the present invention, and arrows indicate the flow of data.
2, the used vehicle value evaluation system includes a remote UI (User Interface)
The used-
The factor group calculation module 251 derives a factor that affects the price of the used car from the used
Factors such as "vehicle type / trim level / vehicle registration date / mileage / fuel type / vehicle status / accident history / export status / color / usage purpose / existence of various options / structure change / total loss / immersion history" Group can be calculated.
Since the factor group obtained for a specific vehicle reflects the characteristic of the vehicle, unless the inevitable factor caused by a change in external environmental factors such as laws or regulations occurs, the vehicle continues to be in the market Can be used.
The data quantization and linear normalization module 252 performs data quantization and linear normalization on the selected factors.
Once the primary factors affecting the price of a particular car are selected, the data group containing the selected factors and the sales price is extracted on the used
Each factor can be divided into a continuous variable and a discrete dummy variable (0 or 1). In the case of a dummy variable, not a continuous variable, a quantification process is necessary to allow the computer to recognize it for analysis. In this case, the model is not a variable because it is used as a criterion for distinguishing data groups, and the remaining factors are converted into numerical values for analysis.
For example, if the trim level of 'Grandeur (5G)' is 5 in total, the corresponding column value of each trim level can be set to a discrete variable, 0 or 1, Can be specified as a dummy variable.

That is, as shown in Table 1, in the case of the luxury grade, all the columns such as the
In addition, the annual cost of the vehicle also has a significant effect on the price of the vehicle. In fact, in the case of used cars, the yearly price is also an important factor in determining the price of the vehicle, since the representative price of the corresponding vehicle is indicated for each year. However, in Korea, the registration age is more important in the used car industry due to the industry practice of recording the year of the vehicle in the future year than the release year. In the present invention, the number of months between the registration date and the sales year and month of a specific vehicle is parameterized and analyzed.
In addition, the status of the vehicle at the time of sale can be used as parameters for analysis. Table 2 shows specific examples of the evaluation method. Through this, the accident evaluation points (A to F) of the vehicle and the comprehensive evaluation point (9 to 1) including the appearance state are calculated. The product value obtained by quantifying these two values can be used as the vehicle state variable in the present invention.

In the case of mileage, the data is already continuous data and can be used for analysis. In summary, the factors affecting the price of a used car are a series of consecutive months including the number of months (AGE), mileage (KM), vehicle condition and accident history (CHK) Type variable such as type variable, trim level (TRIM), type of fuel, whether or not it is exported, color, usage, various options, structure change, total loss and immersion history.
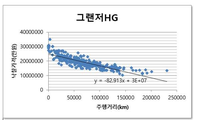
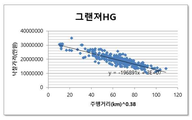
However, in order to check whether the linearity of the regression analysis satisfies the linearity (independent and dependent variables have a linear relationship), the results of the scatter plot can be obtained as shown in FIG. 3 or FIG.
FIG. 3 shows the relationship between the running distance and the selling price of the Grandeur HG model sold in a predetermined store for the past two months.
Referring to FIG. 3, as the mileage increases, the winning price tends to decrease, but the decrease decreases gradually. That is, the relationship between mileage and selling price is not linear.
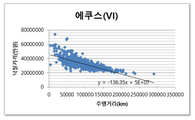
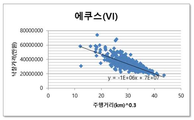
FIG. 4 shows the relationship between the distance traveled and the selling price of an EXEX (VI) vehicle sold in a predetermined store for the past six months.
Although there is a difference in degree as compared with the example of FIG. 3, it can be seen that the relationship between the mileage and the selling price similarly does not appear linearly in the other vehicles shown in FIG.
That is, when the other conditions are all the same and there is a difference in mileage, the price difference between the vehicles using 10,000 km and 20,000 km is larger than the difference between the prices of vehicles driving 110,000 km and 120,000 km, respectively It is. Therefore, if the mileage is not properly corrected, a distortion phenomenon will be expected in the case of a vehicle having a long driving distance at the time of prediction after the regression analysis.
In order to compensate for this, according to the embodiment of the present invention, the linearization conversion of the continuous variable is performed, and this process is automated through a computer algorithm to improve the linearity of all the vehicles to be included in the used vehicle evaluation system Can be calculated. A graph in which the relationship between the mileage and the selling price of the specific vehicle type shown in Figs. 3 and 4 is improved by calculation of such an index is shown in Fig. 5 and Fig. In this way, continuous variables such as mileage are firstly linearized and then used for regression analysis to obtain better results
The multiple regression analysis module 253 performs regression analysis using the linearized variables as described above. That is, a multiple regression analysis can be performed using the data and factors as described above, and in the case of a Grandeur HG vehicle sold for the past two months, the regression analysis result as shown in FIG. 7 can be calculated.
In FIG. 7, the result of NA indicates that the variable is irrelevant to the analyzed data, i.e., can be excluded. However, the LV9 values in the dummy variables LV1 to LV9 indicating the trim levels are considered to be the same as those in other LV1 to LV8 values, indicating that the LV9 variable is not necessary.
From the result of Fig. 7, it can be seen that the derived regression coefficient is R ^ 2 = 0.9518, and the regression equation model explains the fluctuation of the selling price by 95.18%. It can be seen that the fluctuation caused by not included in this model reflects the actual selling price just 4.82%. In the embodiment shown in FIG. 8, the meaning of each variable is as follows.

In the case of the Granger HG vehicle of the embodiment, there is no variable corresponding to the classification of the fuel by separately analyzing the trim level for the LPG fuel. However, if the LPG vehicle is passed five years after the registration of the disabled person, In the case of a five-year LPG, the price of a vehicle tends to rise sharply. Therefore, in some vehicles, the fuel parameter should be added as a dummy variable. In the case of ordinary LPG and LPG (self) Should be analyzed.
The data multi-dimensional coordinate conversion module 254 selects a predetermined number of variables included in the used-car sales data, and stores the sales information of each used-used vehicle as coordinates of the multi-dimensional space having the respective selected axes as respective axes And converts the information on the used vehicle that is the subject of the valuation to the coordinates of the multidimensional space.
The similar vehicle search module 255 searches for the similar vehicle corresponding to the coordinates close to the coordinates of the used vehicle that is the target of the value evaluation among the coordinates converted from the used-car sales data through the data multi-dimensional coordinate conversion module 254 Function, so that it can confirm the actual transaction price, thereby helping to estimate the value of the used vehicle.
The relative price calculation module 256 assigns a weight to each data in inverse proportion to the relative distance to the coordinates of the used vehicle that is the subject of the value evaluation through the data multidimensional coordinate module 254, It is possible to provide the user with a relative price, which is an indirect predicted price calculated by weighted summing up the estimated value derived by deducing the used vehicle as the value evaluation target from the regression coefficient.
The provision of the additional information will be described in detail below.
The data multidimensional coordinate module (254) comprises three consecutive variables (AGE, KM, CK) which are considered to have the greatest effect on the vehicle price among the variables derived from the used vehicle sales data (AGE, KM, CK) (TRIM), can be used as a basis for visualizing data on multidimensional space. These reference variables can be increased or decreased according to the user 's needs. As the number of variables increases, the number of dimensions of the space to represent the distribution of data also increases. Here, the data is PLOTed in the four-dimensional space with the four variables for convenience.
The following steps can now be taken to represent the vehicle data on multidimensional space.
First, when the user queries a search for a condition of the variable with respect to an arbitrary vehicle, the system stores the data in the temporary variable through the " variable quantification process "through the data quantization and linear normalization module 252 .
Next, the user finds the maximum value of each of the four parameters in a data set limited to a specific model requiring price analysis or search. For example, if the vehicle inputted by the user is a Grandeur HG, AGE_MAX: 24, KM_MAX: 217, 388, CHK_MAX: 40, TRIM_MAX: 13 are derived from the data set of the corresponding vehicle.
Alternatively, to shorten the computation time, the maximum value of each of the four variables may be searched for every vehicle type in the database before the user's search and analysis request.
Next, in order to visualize and express the vehicle data on the multidimensional space, the vehicles of the data set should be expressed in coordinates. The data of a specific vehicle data set is expressed in a four-dimensional space having the axes AGE, KM, CHK, and TRIM as axes. For this purpose, the value obtained by dividing the corresponding variable of each data by the maximum value obtained is the coordinates . Assuming that the coordinates thus calculated are (AGE_C, KM_C, CHK_C, TRIM_C), the variable values normalized to the coordinates have the relationship as shown in the following Equation (1).
![]()
The reason why the original data is divided into the maximum values and converted into the coordinates as described above is as follows. First, it is difficult to uniformly express the data in the multidimensional space due to a relatively large number of factors (for example, KM, etc.) compared with other variables when the existing values are used without such conversion process, . Second, it is for comparison with other data as relative magnitude relative to maximum value, that is, relative influence, not absolute magnitude of each variable.
Next, the input data of the user stored in the temporary variable is converted into the coordinates in the multidimensional space through the same process as the "vehicle data visualization ". Let the translated coordinates be (AGE_N, KM_N, CHK_N, TRIM_N).
(AGE_C 1 , KM_C 1 , CHK_C 1 , TRIM_C 1 ), (AGE_C 2 , KM_C 2 , CHK_C 2 , TRIM_C 2 ), and , There is a total of N + 1 pieces of data of (N AGE_C, KM_C N, N CHK_C, TRIM_C N) and, after conversion to the user of the input data coordinates (AGE_N, KM_N, CHK_N, TRIM_N).
Now, the similar vehicle search module 255 obtains the geometric distance between each coordinate converted from the existing sales data and the coordinates converted from the user input data. the distance D i between the i-th sales data and the user input data can be obtained as shown in equation (2).
![]()
This short sales data means data that is close to the specific vehicle entered by the user. In other words, it means a vehicle similar to the specific vehicle entered by the user. Now, from the existing used vehicle sales database, it is possible to find the vehicle most similar to the specific vehicle entered by the user.
When the user inputs an arbitrary vehicle, the system can display the data having the smallest D in the multidimensional space in order from the first order through the "multidimensional PLOT procedure" Through this, the user can check the sales history of the vehicle most similar to the vehicle he entered, that is, the selling price, and utilize it to deduce the price of his own vehicle.
The relative price calculation module may take the reciprocal of the data distance D obtained through the similar vehicle search module 255 to give the largest weight to the data closest to (256). The reciprocal is 1 / D 1 , 1 / D 2 , ... 1 / D N , which are denoted as E 1 , E 2 , ... , E N. In this way, the shortest distance D has the largest value E.
The relative distance sum RSUM can be obtained by Equation (3).
![]()
If the price derived from substituting the data of the predicted vehicle into the derived regression equation is referred to as "ABSOLUTE price ", the method of deriving the" RELATIVE price " Is the method of using the distance on the plane. Relative prices are derived by the following method.
First, the "regression coefficient" for each vehicle type is firstly calculated by regression analysis by vehicle type and stored in the database. At this time, the regression coefficient stored through the regression analysis is not performed every time a user query is made but is data that is periodically executed and stored in the multiple regression analysis module 253 together with the upload of new vehicle data.
Next, when querying the search by specifying the condition of the variables for the vehicle desired by the user, the system stores the data in the temporary variable through the " variable valuation process "through the data quantification and linear normalization module 252, It is converted into coordinates through the same process as "multidimensional PLOT process ".
Next, through the similar vehicle search module (255), in the database storing the sales history of the existing vehicles, data corresponding to the vehicle type inputted by the user, The distance between the input data is derived through the same process as the above-mentioned " multidimensional PLOT process " to the data distance D and the reciprocal number E of D.
Next, the data of the data stored in the temporary variable and the data of the actually sold vehicle, which is inquired by the user, and the data "sold within the latest specific period of the data matching the vehicle type inputted by the user" are found. For example, the deviation between the vehicle data inputted by the user and the specific vehicle on the data set is derived as shown in Table 4 below,

In Table 4, the "deviation" is the result of "any data in the dataset - user input value" for each variable. Here, the remainder excluding the "price" variable is the independent variable, the "price" variable is the dependent variable, and only the independent variable is calculated. In this way, the deviation for all the vehicles corresponding to the "data sold within the recent specific period of the data matching the vehicle type inputted by the user" is obtained.
Next, the actually sold price of each vehicle sales data N, that is, the dependent variable value (the rightmost variable in the above table), of data sold within a recent specific period among the data matching the vehicle type inputted by the user is expressed as BASE 1 , BASE 2 , ... , BASE N , and the "regression coefficient for each variable " of the corresponding vehicle stored and stored through the first step of the " relative price derivation process" ADJ 1 , ADJ 2 , ..., < RTI ID = 0.0 > ... < / RTI & gt ; derived from the SUMPRODUCT operation with each vehicle ' , ADJ N.
Here, the SUMPRODUCT operation is the (luxury variable regression coefficient) * (the luxury variable deviation N ) + (the prime variable regression coefficient) * (the prime variable deviation N ) + ... + (Navigational regression coefficient) * (navigation variable deviation N ).
And performs the operation of Equation (4) through the derived results.

The reason why En / RSUM is multiplied for each (BASEn-ADJn) in the calculation of Equation (4) is that when the user knows the price, the user carries the most weighted data with the geometric closest data to be. If we use D N , which is the geometric distance between data without taking a reciprocal number like E N , we give the least weight to the nearest vehicle and give the largest weight to the farthest vehicle, to be.
Relative pricing has the advantage of being able to better reflect recent trends in that it is an indirect pricing forecast through the price of vehicles sold within a specific period of time recently. At this time, depending on how the extraction period of the new vehicle data is designated, it is possible to adjust whether to reflect more recent trends or less. For example, if the current tendency is more positively reflected, the extraction period of new vehicle data can be shortened. However, if the extraction period of the data is short, the amount of data to be extracted is small, so that there is a risk that the variability becomes relatively large.
The predictive value calculation means 240 may calculate the predicted value of the used vehicle requested by the user using the analysis result data, and may include a
Information on a used car that the user inputs through a remote
The
A remote

The final estimate only has an error of 1.9% compared to the actual sales price of 23.8 million won, which can be multiplied by a specific margin rate to avoid the risk that the actual selling price may be lower than the forecasted price.
8 to 11 illustrate user interface screens according to an embodiment of the present invention, and are examples of input forms that a user accesses through a device such as a smart phone.
As shown in FIGS. 8 to 11, the user interface screen is composed of four pages, and information can be received from the user through each page.
The result of the estimation of the price of the used vehicle corresponding to the data input by the user may be provided through the user interface screen or may be returned from the
The vehicle status dialogue shown in FIGS. 8 to 11 reflects only the vehicle status score and does not reflect the accident score, and the possibility of the result being influenced by the subject of the user, Can be replaced by a direct input method.
12 is a functional block diagram for explaining a configuration of a used vehicle value evaluating apparatus according to another embodiment of the present invention.
Referring to FIG. 12, the used vehicle evaluation apparatus includes a
The
13 is a flowchart illustrating a method for evaluating a used vehicle value according to an embodiment of the present invention.
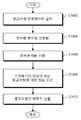
Referring to FIG. 13, the used car sales data including the sales price of the used car and the value of the continuous variable corresponding to the selling price is inputted (S1402). The used-car sales data can be derived from the used-
Next, the sales
The sales price of the used car is set as the dependent variable y and the continuous variable is set as the independent variable x, and the result of the linearization of the continuous variable is applied (S1406).
When the information about the used car which is inputted by the user through the user terminal is received (S1408), the user is requested to estimate the used car by using the result of the regression analysis and the information about the used car, The predicted value of the used vehicle is calculated (S1410).
The formula reference symbols used in the present invention are as follows.
(X i hat, Y i hat): Predicted coordinates (regression linear value) of i th data on scatter map
(X i , Y i ): Actual coordinates (actual data) of the ith data on the scattergram
A: Slope of simple regression line
B: constant linear of the simple regression line
ABS (): Absolute value
The relationship between the x value, that is, the sales price, which is the y value according to the change of the continuous variable, is shown in the scatter diagram. The actual observation value Y for the specific x value and the corresponding x value corresponding to the specific x value on the regression line A difference is inevitably generated in the predicted value Y_hat. Thus, by finding the power multiplication factor that minimizes the sum of the "y-axis-based distance" of the actual observation y and the predicted value y on the regression line for a particular x value, we can find the power multiplier that maximizes linearity.
Considering the above points, the present invention proposes the following five methods as a method of finding the power multiplication which maximizes the linearity.
The first method is a method in which the x-axis represents a value obtained by squaring an arbitrary number from -2 to 2 except for 0 in the continuous variable and a y-axis represents the selling price, The linear transformation of the continuous variable is performed by deriving the power multiplication applied to the scattergram which minimizes the sum of the y-axis reference distances between corresponding coordinates on the straight line. This method can be expressed by the following equation (5).

The second method is a method in which among the plurality of scattergrams in which the x-axis represents the value obtained by squaring an arbitrary number from -2 to 2 except 0 in the continuous variable and the y-axis represents the selling price, The linear transformation of the continuous variable is performed by deriving the power multiplication applied to the scatter diagram which minimizes the sum of the areas of the squares having the length of one side of the y-axis reference distance between corresponding coordinates on the straight line. This method can be expressed by Equation (6).

The third method is a method in which the x-axis represents a value obtained by squaring an arbitrary number from -2 to 2 except for 0 in the continuous variable and a y-axis represents the selling price, The linear transformation of the continuous variable is performed by deriving the power multiplication applied to the scatter diagram which minimizes the sum of the volumes of the cubes having the length of one side of the y-axis reference distance between corresponding coordinates on the straight line. This method can be expressed by Equation (7).

The fourth method is a method of calculating a sales price by multiplying an arbitrary number of powers of -2 to 2 except for 0 in the continuous variable by a power of a certain number, The linear transformation of the continuous variable is performed by deriving a power multiplication applied to the scattergram including all the points within the range of the shortest distance from the straight line.
That is, starting from a set of scattergrams in which all the data are contained within an arbitrary range as far as a certain distance from the regression line of each scatter plot (on the y-axis basis), when the range is gradually narrowed and only one scatter plot is derived, To apply a linear transformation of the variable through a power exponent applied to the variable. This method can be expressed by Equation (8).


In the fifth method, the x-axis represents a value obtained by multiplying an arbitrary number from -2 to 2 except for 0 in the continuous variable, and the y-axis represents the selling price. By taking a power point applied to the scatter diagram having the smallest difference in the slopes of the respective tangents at a certain distance apart at a certain distance up and down with respect to an arbitrary point on the regression curve of the exponential function form to be expressed, And performs a linear transformation. This method can be expressed by the following equation (9).

The method according to an embodiment of the present invention can be implemented in the form of a program command which can be executed through various computer means and recorded in a computer-readable medium. The computer-readable medium may include program instructions, data files, data structures, and the like, alone or in combination. The program instructions recorded on the medium may be those specially designed and constructed for the present invention or may be available to those skilled in the art of computer software. Examples of computer-readable media include magnetic media such as hard disks, floppy disks and magnetic tape; optical media such as CD-ROMs and DVDs; magnetic media such as floppy disks; Magneto-optical media, and hardware devices specifically configured to store and execute program instructions such as ROM, RAM, flash memory, and the like. Examples of program instructions include machine language code such as those produced by a compiler, as well as high-level language code that can be executed by a computer using an interpreter or the like.
While the present invention has been particularly shown and described with reference to exemplary embodiments thereof, it is to be understood that the invention is not limited to the disclosed exemplary embodiments, It belongs to the scope of right.
Claims (14)
Receiving used vehicle sales data from the used vehicle sales database, the value of the continuous vehicle variable that is a parameter that affects the selling price of the used vehicle and the selling price of the used vehicle;
A plurality of scatter diagrams - each scatter diagram represents a value obtained by multiplying an arbitrary number from -2 to 2 by the x-axis, excluding 0 in the continuous variable, and the y-axis represents the selling price,
Performing a linear transformation of the continuous variable by deriving a power sum applied to a scattergram that minimizes a sum of y-axis-based distances between corresponding points on the regression line derived through data of each point on the scattergram and the scatter plot;
Performing a multiple regression analysis on the used-car sales data by including the selling price as a dependent variable y and the continuous variable as one of the independent variables x, and applying the result of the linearization conversion;
Inputting information on a used vehicle to be evaluated;
Calculating a predicted value of the used car by using the result of the regression analysis and the information on the used car that is the subject of the valuation,
The scatter diagram for minimizing the sum of the y-axis reference distances may be expressed as follows: when the number of the used-for-sale vehicle sales data is N,
Receiving used vehicle sales data from the used vehicle sales database, the value of the continuous vehicle variable that is a parameter that affects the selling price of the used vehicle and the selling price of the used vehicle;
A plurality of scatter diagrams - each scatter diagram represents a value obtained by multiplying an arbitrary number from -2 to 2 by the x-axis, excluding 0 in the continuous variable, and the y-axis represents the selling price,
By deriving a power multiplication applied to a scattergram that minimizes the sum of the areas of the squares having the length of one side as the y-axis reference distance between the corresponding coordinates on the regression line derived from the respective points on the scatter map and the data of the scatter map, Performing a linear transformation;
Performing a multiple regression analysis on the used-car sales data by including the selling price as a dependent variable y and the continuous variable as one of the independent variables x, and applying the result of the linearization conversion;
Inputting information on a used vehicle to be evaluated;
Calculating a predicted value of the used car by using the result of the regression analysis and the information on the used car that is the subject of the valuation,
Wherein a scatter diagram for minimizing a sum of areas of squares having a length of one side of the y-axis reference distance is calculated as N when the number of the used used vehicle sales data is N,
Receiving used vehicle sales data from the used vehicle sales database, the value of the continuous vehicle variable that is a parameter that affects the selling price of the used vehicle and the selling price of the used vehicle;
A plurality of scatter diagrams - each scatter diagram represents a value obtained by multiplying an arbitrary number from -2 to 2 by the x-axis, excluding 0 in the continuous variable, and the y-axis represents the selling price,
By deriving a power multiplication applied to a scattergram that minimizes the sum of the volumes of the cubes having the length of one side as the y-axis reference distance between the corresponding coordinates on the regression line derived from the data of each point on the scatter map and the data of the scatter map, Performing a linear transformation;
Performing a multiple regression analysis on the used-car sales data by including the selling price as a dependent variable y and the continuous variable as one of the independent variables x, and applying the result of the linearization conversion;
Inputting information on a used vehicle to be evaluated;
Calculating a predicted value of the used car by using the result of the regression analysis and the information on the used car that is the subject of the valuation,
Wherein a scatter diagram for minimizing the sum of the volumes of the cube having the y-axis reference distance as one side thereof is calculated as N when the number of the used used vehicle sales data is N,
Receiving used vehicle sales data from the used vehicle sales database, the value of the continuous vehicle variable that is a parameter that affects the selling price of the used vehicle and the selling price of the used vehicle;
A plurality of scatter diagrams - each scatter diagram represents a value obtained by multiplying an arbitrary number from -2 to 2 by the x-axis, excluding 0 in the continuous variable, and the y-axis represents the selling price,
performing a linear transformation on the continuous variable by deriving a power sum applied to a scatter diagram including all the points within a range of a shortest distance from a regression line derived through the data of the scatter map based on the y axis;
Performing a multiple regression analysis on the used-car sales data by including the selling price as a dependent variable y and the continuous variable as one of the independent variables x, and applying the result of the linearization conversion;
Inputting information on a used vehicle to be evaluated;
Calculating a predicted value of the used car by using the result of the regression analysis and the information on the used car that is the subject of the valuation,
In order to derive the power multiplication applied to the scattergram including all the points within the range of the shortest distance from the regression line with respect to the y axis, all the data on the scatter diagram are included in the predetermined distance range from the regression line of each scatter plot, Wherein a power sum applied to said unique scatter diagram is derived starting from a set of scatter charts and gradually narrowing said distance range to obtain a unique scatter diagram including all the data on scatter diagrams within said distance range.
Receiving used vehicle sales data from the used vehicle sales database, the value of the continuous vehicle variable that is a parameter that affects the selling price of the used vehicle and the selling price of the used vehicle;
A plurality of scatter diagrams - each scatter diagram represents a value obtained by multiplying an arbitrary number from -2 to 2 by the x-axis, excluding 0 in the continuous variable, and the y-axis represents the selling price,
Based on an arbitrary point on the regression curve of the exponential shape that best represents each scatter plot, the difference between the slopes of the two tangent points at the same distance up and down with respect to the y-axis is the power multiplied by the scatter plot Performing a linear transformation of the continuous variable;
Performing a multiple regression analysis on the used-car sales data by including the selling price as a dependent variable y and the continuous variable as one of the independent variables x, and applying the result of the linearization conversion;
Inputting information on a used vehicle to be evaluated;
And calculating a predicted value of the used car using the result of the regression analysis and the information on the used car that is the subject of the valuation.
Selecting a plurality of variables included in the used vehicle sales data and converting sales information of each used vehicle into coordinates of a multidimensional space having each axis selected as each axis;
Converting information on the used vehicle that is the subject of the valuation to coordinates in the multidimensional space;
Further comprising the step of providing the user with a selling price of the used car corresponding to the coordinates close to the coordinates of the used car that is the subject of the value evaluation among the coordinates converted from the used car sales data Assessment Methods.
Selecting a plurality of variables included in the used vehicle sales data and converting sales information of each used vehicle into coordinates of a multidimensional space having each axis selected as each axis;
Converting information on the used vehicle that is the subject of the valuation to coordinates in the multidimensional space;
Obtaining respective weights in inverse proportion to the distance between the used vehicle that is the value evaluation target and the used used vehicle sales data using the transformed multi-dimensional spatial data coordinates;
Obtaining a deviation between the used vehicle and the used-for-sale data, which is the object of the valuation;
Obtaining a difference between a sale amount of each of the used-for-sale vehicle sales data and a sumproduct operation of the deviation and a regression coefficient of the corresponding used vehicle;
Calculating a relative predicted value of the used vehicle that is the subject of the value evaluation by adding both the weights of the used vehicle sales data and the product of the differences to the weight of the used vehicle sales data;
Further comprising the step of providing the user with a lower predicted value of the relative price, which is the calculated relative predicted value, and the absolute price of the predicted value through the multiple regression analysis.
A database for storing used vehicle sales data including values of continuous variables that parameterize factors affecting the selling price of the used vehicle and the selling price of the used vehicle;
A plurality of scatter diagrams - each scatter diagram represents a value obtained by multiplying an arbitrary number from -2 to 2 by the x-axis, excluding 0 in the continuous variable, and the y-axis represents the selling price,
The linearization transformation of the continuous variable is performed by deriving a power multiplication applied to a scattergram which minimizes a sum of y-axis-based distances between corresponding points on the regression line derived through data of each point on the scattergram and the scatter plot,
Sales data analyzing means for performing a multiple regression analysis on the used-car sales data by including the selling price as a dependent variable y and the continuous variable as one of the independent variables x, and applying the result of the linearization conversion; and
And a predictive value calculating means for calculating a predictive value of the used car by using the result of the regression analysis and the information on the used car that is the subject of the valuation,
The scatter diagram for minimizing the sum of the y-axis reference distances, when the number of inputted used-car sales data is N,
A database for storing used vehicle sales data including values of continuous variables that parameterize factors affecting the selling price of the used vehicle and the selling price of the used vehicle;
A plurality of scatter diagrams - each scatter diagram represents a value obtained by multiplying an arbitrary number from -2 to 2 by the x-axis, excluding 0 in the continuous variable, and the y-axis represents the selling price,
By deriving a power multiplication applied to a scattergram that minimizes the sum of the areas of the squares having the length of one side as the y-axis reference distance between the corresponding coordinates on the regression line derived from the respective points on the scatter map and the data of the scatter map, Performing a linear transformation;
Sales data analyzing means for performing a multiple regression analysis on the used-car sales data by including the selling price as a dependent variable y and the continuous variable as one of the independent variables x, and applying the result of the linearization conversion; and
And a predictive value calculating means for calculating a predictive value of the used car by using the result of the regression analysis and the information on the used car that is the subject of the valuation,
The scatter diagram for minimizing the sum of the areas of the squares having the y-axis reference distance as the length of one side is calculated as follows. When the number of used used vehicle sales data is N,
A database for storing used vehicle sales data including values of continuous variables that parameterize factors affecting the selling price of the used vehicle and the selling price of the used vehicle;
A plurality of scatter diagrams - each scatter diagram represents a value obtained by multiplying an arbitrary number from -2 to 2 by the x-axis, excluding 0 in the continuous variable, and the y-axis represents the selling price,
By deriving a power multiplication applied to a scatter diagram which minimizes the sum of the volumes of the cubes having the length of one side as the y-axis reference distance between the corresponding coordinates on the regression line derived from the respective points on the scatter map and the data of the scatter map, Performs a linear transformation,
Sales data analyzing means for performing a multiple regression analysis on the used-car sales data by including the selling price as a dependent variable y and the continuous variable as one of the independent variables x, and applying the result of the linearization conversion; and
And a predictive value calculating means for calculating a predictive value of the used car by using the result of the regression analysis and the information on the used car that is the subject of the valuation,
The scatter diagram for minimizing the sum of the volumes of the cube having the y-axis reference distance as one side is calculated as follows. When the number of used used vehicle sales data is N,
A database for storing used vehicle sales data including values of continuous variables that parameterize factors affecting the selling price of the used vehicle and the selling price of the used vehicle;
A plurality of scatter diagrams - each scatter diagram represents a value obtained by multiplying an arbitrary number from -2 to 2 by the x-axis, excluding 0 in the continuous variable, and the y-axis represents the selling price,
a linear transformation of the continuous variable is performed by deriving a power multiplication applied to a scatter diagram including all points within a range of a shortest distance from a regression line derived through data of the scatter diagram on the basis of the y axis,
Selling data analyzing means for performing a multiple regression analysis on the used-car sales data by including the sales price as a dependent variable y and the continuous type variable as one of the independent variables x, and applying a result of the linearization conversion; And
And a predictive value calculating means for calculating a predictive value of the used car by using the result of the regression analysis and the information on the used car that is the subject of the valuation,
The sales data analyzing means analyzes the sales data in a range of a predetermined distance based on the y axis from the regression line of each scatter plot to derive a power sum applied to the scatter plot including all the points within the range of the shortest distance from the regression line with respect to the y- Wherein a power range applied to the unique scatter diagram is derived from a set of scatter charts including all the data on the scatter chart when the distance range is gradually narrowed and a single scatter chart including all data on the scatter chart is derived within the distance range. Used vehicle valuation device.
A database for storing used vehicle sales data including values of continuous variables that parameterize factors affecting the selling price of the used vehicle and the selling price of the used vehicle;
A plurality of scatter diagrams - each scatter diagram represents a value obtained by multiplying an arbitrary number from -2 to 2 by the x-axis, excluding 0 in the continuous variable, and the y-axis represents the selling price,
Based on an arbitrary point on the regression curve of the exponential function shape that best represents each scatter plot, we derive the power multiplication applied to the scatter plot with the smallest slope of each tangent at two points spaced by the same distance up and down with respect to the y-axis To perform a linear transformation of the continuous variable,
Selling data analyzing means for performing a multiple regression analysis on the used-car sales data by including the sales price as a dependent variable y and the continuous type variable as one of the independent variables x, and applying a result of the linearization conversion; And
And a predictive value calculation means for calculating a predictive value of the used car by using the result of the regression analysis and the information on the used car that is the subject of the valuation.
Priority Applications (1)
| Application Number | Priority Date | Filing Date | Title |
|---|---|---|---|
| KR1020150074838A KR101606322B1 (en) | 2015-05-28 | 2015-05-28 | Method and apparatus for evaluating value of used car |
Applications Claiming Priority (1)
| Application Number | Priority Date | Filing Date | Title |
|---|---|---|---|
| KR1020150074838A KR101606322B1 (en) | 2015-05-28 | 2015-05-28 | Method and apparatus for evaluating value of used car |
Related Child Applications (1)
| Application Number | Title | Priority Date | Filing Date |
|---|---|---|---|
| KR1020160028980A Division KR20160140353A (en) | 2016-03-10 | 2016-03-10 | Method for evaluating value of used car |
Publications (1)
| Publication Number | Publication Date |
|---|---|
| KR101606322B1 true KR101606322B1 (en) | 2016-04-01 |
Family
ID=55799351
Family Applications (1)
| Application Number | Title | Priority Date | Filing Date |
|---|---|---|---|
| KR1020150074838A KR101606322B1 (en) | 2015-05-28 | 2015-05-28 | Method and apparatus for evaluating value of used car |
Country Status (1)
| Country | Link |
|---|---|
| KR (1) | KR101606322B1 (en) |
Cited By (4)
| Publication number | Priority date | Publication date | Assignee | Title |
|---|---|---|---|---|
| KR101829741B1 (en) * | 2016-11-07 | 2018-03-29 | (주)미스터즈가라지 | Server, Method, and Computer-Readable Medium for Providing Used Car Information |
| KR102146249B1 (en) | 2019-10-16 | 2020-08-20 | 임명택 | Method of selling damaged cars and system of selling damaged cars |
| KR20220096290A (en) * | 2020-12-31 | 2022-07-07 | (주)자스텍엠 | Vehicle price estimating method |
| KR102654020B1 (en) * | 2023-03-21 | 2024-04-05 | 주식회사 온더클래식 | Stringed instrument value evaluating method and computer program |
Citations (3)
| Publication number | Priority date | Publication date | Assignee | Title |
|---|---|---|---|---|
| JP2002149998A (en) | 2000-11-15 | 2002-05-24 | Buaatekkusu Vision:Kk | Method and device for managing vehicle information in client server computer environment |
| JP2009076035A (en) | 2007-08-30 | 2009-04-09 | Aioi Insurance Co Ltd | Article residual value predicting device, article residual value predicting system, car residual value predicting device and car residual value predicting system |
| JP2012502375A (en) | 2008-09-09 | 2012-01-26 | トゥルーカー インコーポレイテッド | System and method for calculating and displaying price distribution based on transaction analysis |
-
2015
- 2015-05-28 KR KR1020150074838A patent/KR101606322B1/en active IP Right Grant
Patent Citations (3)
| Publication number | Priority date | Publication date | Assignee | Title |
|---|---|---|---|---|
| JP2002149998A (en) | 2000-11-15 | 2002-05-24 | Buaatekkusu Vision:Kk | Method and device for managing vehicle information in client server computer environment |
| JP2009076035A (en) | 2007-08-30 | 2009-04-09 | Aioi Insurance Co Ltd | Article residual value predicting device, article residual value predicting system, car residual value predicting device and car residual value predicting system |
| JP2012502375A (en) | 2008-09-09 | 2012-01-26 | トゥルーカー インコーポレイテッド | System and method for calculating and displaying price distribution based on transaction analysis |
Cited By (5)
| Publication number | Priority date | Publication date | Assignee | Title |
|---|---|---|---|---|
| KR101829741B1 (en) * | 2016-11-07 | 2018-03-29 | (주)미스터즈가라지 | Server, Method, and Computer-Readable Medium for Providing Used Car Information |
| KR102146249B1 (en) | 2019-10-16 | 2020-08-20 | 임명택 | Method of selling damaged cars and system of selling damaged cars |
| KR20220096290A (en) * | 2020-12-31 | 2022-07-07 | (주)자스텍엠 | Vehicle price estimating method |
| KR102540693B1 (en) * | 2020-12-31 | 2023-06-12 | (주)자스텍엠 | Vehicle price estimating method |
| KR102654020B1 (en) * | 2023-03-21 | 2024-04-05 | 주식회사 온더클래식 | Stringed instrument value evaluating method and computer program |
Similar Documents
| Publication | Publication Date | Title |
|---|---|---|
| Nahm et al. | New rating methods to prioritize customer requirements in QFD with incomplete customer preferences | |
| US10108989B2 (en) | System and method for analysis and presentation of used vehicle pricing data | |
| KR101606322B1 (en) | Method and apparatus for evaluating value of used car | |
| US10685363B2 (en) | System, method and computer program for forecasting residual values of a durable good over time | |
| US9727905B2 (en) | Systems and methods for determining cost of vehicle ownership | |
| US20140074553A1 (en) | System and method for constructing spatially constrained industry-specific market areas | |
| CN110910180B (en) | Information pushing method and device, electronic equipment and storage medium | |
| US20210158382A1 (en) | System and method for dealer evaluation and dealer network optimization using spatial and geographic analysis in a network of distributed computer systems | |
| CN102004982A (en) | Model optimization system using variable scoring | |
| US20220335359A1 (en) | System and method for comparing enterprise performance using industry consumer data in a network of distributed computer systems | |
| CN103714238A (en) | System and method for rating computer model relative to empirical results for dynamic systems | |
| US20220058673A1 (en) | System and method for determination and use of spatial and geography based metrics in a network of distributed computer systems | |
| CN114493443A (en) | Data processing method and device, electronic equipment and computer readable storage medium | |
| CN107545457A (en) | The competing product vehicle of automobile determines method and device | |
| US20180144353A1 (en) | Identifying installation sites for alternative fuel stations | |
| KR20160140353A (en) | Method for evaluating value of used car | |
| US20190318371A1 (en) | Computing systems and methods for improving content quality for internet webpages | |
| KR101829741B1 (en) | Server, Method, and Computer-Readable Medium for Providing Used Car Information | |
| KR102370650B1 (en) | real estate investment curation system based on artificial neural network and method therefor | |
| CN101799925A (en) | Performance analysis method for automatic segmentation result of image | |
| JP2003187051A (en) | Business management plan support system | |
| US20230274336A1 (en) | Apparatus and method for generating positioning indicator | |
| US20230195969A1 (en) | Method for automatic design concept definition and archetype selection for large sets of designs respecting multiple description spaces | |
| Brint | Predicting a house's selling price through inflating its previous selling price | |
| Zhao | Research on E-Commerce Retail Demand Forecasting Based on SARIMA Model and K-means Clustering Algorithm |
Legal Events
| Date | Code | Title | Description |
|---|---|---|---|
| E701 | Decision to grant or registration of patent right | ||
| A107 | Divisional application of patent | ||
| GRNT | Written decision to grant | ||
| FPAY | Annual fee payment |
Payment date: 20190311 Year of fee payment: 4 |