KR100737029B1 - Angle independent ultrasound volume flow measurement - Google Patents
Angle independent ultrasound volume flow measurement Download PDFInfo
- Publication number
- KR100737029B1 KR100737029B1 KR1020010004211A KR20010004211A KR100737029B1 KR 100737029 B1 KR100737029 B1 KR 100737029B1 KR 1020010004211 A KR1020010004211 A KR 1020010004211A KR 20010004211 A KR20010004211 A KR 20010004211A KR 100737029 B1 KR100737029 B1 KR 100737029B1
- Authority
- KR
- South Korea
- Prior art keywords
- data
- delete delete
- fluid
- scan plane
- flow rate
- Prior art date
Links
Images


Classifications
-
- G—PHYSICS
- G01—MEASURING; TESTING
- G01F—MEASURING VOLUME, VOLUME FLOW, MASS FLOW OR LIQUID LEVEL; METERING BY VOLUME
- G01F1/00—Measuring the volume flow or mass flow of fluid or fluent solid material wherein the fluid passes through a meter in a continuous flow
- G01F1/66—Measuring the volume flow or mass flow of fluid or fluent solid material wherein the fluid passes through a meter in a continuous flow by measuring frequency, phase shift or propagation time of electromagnetic or other waves, e.g. using ultrasonic flowmeters
-
- G—PHYSICS
- G01—MEASURING; TESTING
- G01S—RADIO DIRECTION-FINDING; RADIO NAVIGATION; DETERMINING DISTANCE OR VELOCITY BY USE OF RADIO WAVES; LOCATING OR PRESENCE-DETECTING BY USE OF THE REFLECTION OR RERADIATION OF RADIO WAVES; ANALOGOUS ARRANGEMENTS USING OTHER WAVES
- G01S15/00—Systems using the reflection or reradiation of acoustic waves, e.g. sonar systems
- G01S15/88—Sonar systems specially adapted for specific applications
- G01S15/89—Sonar systems specially adapted for specific applications for mapping or imaging
- G01S15/8906—Short-range imaging systems; Acoustic microscope systems using pulse-echo techniques
- G01S15/8959—Short-range imaging systems; Acoustic microscope systems using pulse-echo techniques using coded signals for correlation purposes
-
- A—HUMAN NECESSITIES
- A61—MEDICAL OR VETERINARY SCIENCE; HYGIENE
- A61B—DIAGNOSIS; SURGERY; IDENTIFICATION
- A61B8/00—Diagnosis using ultrasonic, sonic or infrasonic waves
- A61B8/06—Measuring blood flow
-
- A—HUMAN NECESSITIES
- A61—MEDICAL OR VETERINARY SCIENCE; HYGIENE
- A61B—DIAGNOSIS; SURGERY; IDENTIFICATION
- A61B8/00—Diagnosis using ultrasonic, sonic or infrasonic waves
- A61B8/13—Tomography
-
- G—PHYSICS
- G01—MEASURING; TESTING
- G01S—RADIO DIRECTION-FINDING; RADIO NAVIGATION; DETERMINING DISTANCE OR VELOCITY BY USE OF RADIO WAVES; LOCATING OR PRESENCE-DETECTING BY USE OF THE REFLECTION OR RERADIATION OF RADIO WAVES; ANALOGOUS ARRANGEMENTS USING OTHER WAVES
- G01S15/00—Systems using the reflection or reradiation of acoustic waves, e.g. sonar systems
- G01S15/88—Sonar systems specially adapted for specific applications
- G01S15/89—Sonar systems specially adapted for specific applications for mapping or imaging
- G01S15/8906—Short-range imaging systems; Acoustic microscope systems using pulse-echo techniques
- G01S15/8959—Short-range imaging systems; Acoustic microscope systems using pulse-echo techniques using coded signals for correlation purposes
- G01S15/8961—Short-range imaging systems; Acoustic microscope systems using pulse-echo techniques using coded signals for correlation purposes using pulse compression
-
- G—PHYSICS
- G01—MEASURING; TESTING
- G01S—RADIO DIRECTION-FINDING; RADIO NAVIGATION; DETERMINING DISTANCE OR VELOCITY BY USE OF RADIO WAVES; LOCATING OR PRESENCE-DETECTING BY USE OF THE REFLECTION OR RERADIATION OF RADIO WAVES; ANALOGOUS ARRANGEMENTS USING OTHER WAVES
- G01S15/00—Systems using the reflection or reradiation of acoustic waves, e.g. sonar systems
- G01S15/88—Sonar systems specially adapted for specific applications
- G01S15/89—Sonar systems specially adapted for specific applications for mapping or imaging
- G01S15/8906—Short-range imaging systems; Acoustic microscope systems using pulse-echo techniques
- G01S15/8979—Combined Doppler and pulse-echo imaging systems
- G01S15/8984—Measuring the velocity vector
Abstract
용기(VE)내에서 유체의 유량이 초음파 시스템에 의해 측정된다. 용기 내에서 유체로부터 후방산란된 초음파 파동은 스캔 평면(IP)에서 유체의 유속(Vx 및 Vy)의 구성요소를 나타내는 속도 값이 계산되는 데이터를 발생시킨다. 그레이 스케일 데이터는 상관되고 데이터의 비상관 비율(D)은 계산된다. 유체의 유량(F)은 속도 신호와 비상관 비율(D)에 응답하여 추정된다.
The flow rate of the fluid in the vessel VE is measured by an ultrasonic system. The ultrasonic wave backscattered from the fluid in the vessel generates data in which velocity values are calculated that represent the components of the flow rates V x and V y of the fluid in the scan plane IP. The gray scale data is correlated and the uncorrelated ratio D of the data is calculated. The flow rate F of the fluid is estimated in response to the velocity signal and the uncorrelated ratio D.
Description
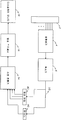
도 1은 바람직한 실시예와 관련하여 사용하기 적합한 B-모드 초음파 촬상 시스템 및 컬러 이동에 관한 신호 프로세싱 체인을 도시하는 개략적인 블록도,1 is a schematic block diagram illustrating a signal processing chain for color shifting and a B-mode ultrasound imaging system suitable for use in connection with a preferred embodiment;
도 2는 도 1에 도시된 중간 프로세서 컬러 이동 장치를 도시하는 개략적인 블록도,FIG. 2 is a schematic block diagram showing the intermediate processor color mobile device shown in FIG. 1;
도 3은 도 1에 도시된 중간 프로세서 B-모드 장치를 도시하는 개략적인 블록도,FIG. 3 is a schematic block diagram illustrating the intermediate processor B-mode apparatus shown in FIG. 1;
도 4는 도 1에 도시된 시스템의 일부의 추가적인 세부사항을 도시하는 개략적인 블록도,4 is a schematic block diagram showing additional details of a portion of the system shown in FIG. 1;
도 5는 유체가 이동하는 용기에 관해 도 1에 도시된 초음파 변환기의 예시적인 오리엔테이션을 도시하는 개략적인 블록도,FIG. 5 is a schematic block diagram illustrating an exemplary orientation of the ultrasonic transducer shown in FIG. 1 with respect to a vessel in which fluid moves; FIG.
도 6은 Bx(측면)와 By(축)로부터의 이론적인 타원형 맞춤 및 정면/측면 평면에 대한 15°증가에 관해 도 5에 도시된 변환기에 의해 발생된 초음파 빔의 계산된 빔 상관 폭을 도시하는 그래프. FIG. 6 shows the calculated beam correlation width of the ultrasonic beam generated by the transducer shown in FIG. 5 with respect to the theoretical elliptical fit from B x (side) and B y (axis) and a 15 ° increase to the front / side plane. Graph showing the.
도면의 주요 부분에 대한 부호의 설명Explanation of symbols for the main parts of the drawings
B : 빔 FL : 이동 방향B: beam FL: direction of movement
VE : 관심 영역(예를 들어, 용기) IP : 스캔 평면VE: region of interest (eg, container) IP: scan plane
F : 유체의 유량 D1, D2 : 스캔 각도F: flow rate of fluid D1, D2: scan angle
D : 비상관 비율 2 : 초음파 변환기 어레이D: Uncorrelated ratio 2: Ultrasonic transducer array
4 : 빔형성기 6 : 복조기4: beamformer 6: demodulator
7 : 코너 터너 메모리 8G : 중간 프로세서7:
8C : 중간 프로세서 9 : 월 필터8C: Intermediate Processor 9: Wall Filter
10 : 포락선 검출기 11 : 파라미터 추정기10: envelope detector 11: parameter estimator
11A, 11B 및 11C : 컨덕터 12 : 대수적 압축11A, 11B, and 11C: Conductor 12: Algebraic Compression
13 : 데이터 압축 모듈 14 : 스캔 변환기13: Data Compression Module 14: Scan Converter
16 : 영상 프로세서 18 : 디스플레이 모니터16: image processor 18: display monitor
22 : 음향 라인 메모리 24 : X-Y 메모리22: sound line memory 24: X-Y memory
24C, 24G : 메모리 위치 26 : 주 제어기24C, 24G: memory location 26: main controller
28C, 28G : 메모리 위치 29 : 키보드28C, 28G: Memory Locations 29: Keyboard
30 : 중앙 처리 장치(CPU) 32 : RAM30: central processing unit (CPU) 32: RAM
34 : 제어 버스
34: control bus
본 발명의 배경은 본 명세서의 종래기술 하단에 나타나는 다수의 참조 문헌의 도움으로 설명될 것이다. 유체(예를 들어, 혈액)의 유량의 수량화(quantification of volumetric fluid flow)는 심장 질환의 진단, 경동맥 협착(cartoid stenosis), 관상동맥 경화증(coronary arteriosclerosis), 및 신부전증(renal failure)과 같은 임상 응용을 포함하는 다양한 응용에서 이로울 것이다. 도플러(Doppler)는 초음파로 혈액 이동을 측정하기 위한 전류 임상 표준이다. 초음파 빔 펄스에 가까워지거나 멀어지는 유체 이동은 고주파 펄스(insonifying pulse)의 파장을 수정한다. 유체 운반 용기(예를 들어, 혈관)의 오리엔테이션과 빔 사이의 각도를 알고 있다고 가정한다면, 용기에서의 유체의 유속은 결과적인 도플러 주파수 쉬프트로부터 계산된다. 체적 이동 측정에 관한 현재의 방법은 초음파 빔의 스캔 평면에서 용기의 중앙 축을 맞추고(orient), 그 후 원형적으로 대칭인 루멘(circularly symmetrical lumen)을 가정하여 총 이동 체적을 계산하기 위해 음파촬영기(sonographer)를 필요로 한다. 흔히 맞지 않는 이러한 가정은 많은 에러를 야기하여 그 방법의 응용을 매우 어렵게 한다.The background of the present invention will be illustrated with the aid of a number of references appearing below the prior art herein. Quantification of volumetric fluid flow of fluids (eg, blood) may be used in clinical applications such as diagnosis of heart disease, cartoid stenosis, coronary arteriosclerosis, and renal failure. It will be beneficial in a variety of applications, including. Doppler is the current clinical standard for measuring blood migration by ultrasound. Fluid movement near or away from the ultrasonic beam pulse modifies the wavelength of the insonifying pulse. Assuming that the angle between the orientation of the fluid delivery vessel (eg, a vessel) and the beam is known, the flow velocity of the fluid in the vessel is calculated from the resulting Doppler frequency shift. Current methods for volumetric movement measurements have been performed by sonication (or sonicator) to calculate the total volume of movement assuming a central axis of the vessel in the scan plane of the ultrasound beam, and then a circularly symmetrical lumen. sonographer). This assumption, which is not often correct, causes a lot of errors and makes the application very difficult.
평면 이동 속도(즉, 초음파 빔 스캔 평면에서의 속도)를 결정하기 위해 복수의 도플러 빔을 사용하는 것이 수 십년 동안 알려져 왔다(Wang 1982)[1]. 두 개의 결합평면(co-planar) 빔과 삼각 관계(trigonometric relations)를 이용함에 있어서, 유도된 측정 속도는 각도와 무관하다. It has been known for decades to use multiple Doppler beams to determine planar travel speeds (ie, speeds in the ultrasound beam scan plane) (Wang 1982) [1]. Using two co-planar beams and trigonometric relations, the measured measurement speed is independent of the angle.
연속적인 초음파 A-라인의 교차-상관(cross-correlation)은 도플러의 엘리어 싱 모호성(aliasing ambiguity)을 제거한다(Bonnefous 1986)[13].Cross-correlation of continuous ultrasound A-lines eliminates Dossier aliasing ambiguity (Bonnefous 1986) [13].
순차적인 프레임 사이에서 패턴의 상관인 스페클 트래킹(speckle tracking)이 1차원과 2차원 이동 벡터를 결정하는데 사용되어 왔다(Trahey 1987)[2]. 체적 초음파 스캔의 발전에 따라서, 상관 검사 알고리즘은 다소 성공적으로 3차원에서 적용되어 왔다(Morsy 1999)[3].Speckle tracking, the correlation of patterns between sequential frames, has been used to determine one- and two-dimensional motion vectors (Trahey 1987) [2]. With the development of volumetric ultrasound scanning, correlation inspection algorithms have been successfully applied in three dimensions (Morsy 1999) [3].
축이 아닌(non-axial) 이동 요소의 크기를 수량화하는 첫 번째 방법의 하나는 뉴하우스(Newhouse 1987)[4]에 의해 개발되었고 초음파 RF 신호의 스펙트럼 확장(spectral broadening)에 근거하였다.One of the first methods for quantifying the size of non-axial moving elements was developed by Newhouse (1987) [4] and was based on the spectral broadening of ultrasonic RF signals.
최근에는, 앤더슨(Anderson 1998)[5]이 측면 이동을 수량화하기 위해 포인트 확산 함수의 공간 웨이팅(spatial weighting)을 사용하였다. 유사 연구에 있어서, 젠센(Jensen 1998)[6]은 변환기 요소의 애퍼디에이션(apodization)에 의해 발생된 횡 공간 변조를 축 이동에 횡으로 하나 또는 두 개의 방향으로 이동을 수량화하는데 적용하였다. 이러한 방법 모두는 2차원 이동만을 결정한다.Recently, Anderson (5) used spatial weighting of the point spread function to quantify lateral movement. In a similar study, Jensen 1998 [6] applied lateral spatial modulation generated by the apodization of transducer elements to quantify the movement in one or two directions transverse to the axial movement. All of these methods determine only two-dimensional movements.
에코 신호의 비상관을 사용하여 혈액 속도를 추정하는 것은 또한 상당히 잘 입증되어 왔다. time rate-of-change of A-lines을 사용함에 있어서, 뱀버(Bamber 1988)[7]는 비상관이 조직 이동과 혈액 이동을 이미지화하는데 사용될 수 있다는 것을 입증하였다. 더 정량적으로, 리(Li 1997)[8]등은 RF 신호의 비상관이 측면 변위와 선형적으로 관련된다는 것을 입증하였다. 그레이스케일 비상관을 사용하여 조영증강된(contrast-enhanced) 혈액 이동에서 변화율을 검출하는 것이 또한 동물 연구에서 이전부터 입증되어 왔다(Rubin 1999)[9]. Estimating blood velocity using noncorrelation of echo signals has also been fairly well demonstrated. In using the time rate-of-change of A-lines, Bamber (1988) [7] demonstrated that uncorrelation can be used to image tissue and blood migration. More quantitatively, Li 1997 [8] et al. Demonstrated that the uncorrelation of RF signals is linearly related to lateral displacement. Detecting the rate of change in contrast-enhanced blood migration using grayscale decorrelation has also been demonstrated previously in animal studies (Rubin 1999) [9].
참조 문헌Reference


바람직한 실시예는 관심 영역 내에서 유체의 유량을 측정하기 위한 초음파 시스템에서 유용하다. 그 환경에 있어서, 초음파 파동은 바람직하게 초음파 변환기에 의해 스캔 평면을 규정하는 전송 방향으로 용기에 전송된다. 데이터 신호는 용기 내에서 유체로부터 후방산란된 초음파 파동에 응답하여 발생된다. 스캔 평면에서 유체의 유속의 구성요소를 나타내는 속도 값을 갖는 속도 신호는 데이터 신호로부터 발생된 데이터에 응답하여 발생된다. 데이터의 일부는 상관되고, 비상관 부분의 비율은 계산된다. 유체의 유량은 속도 신호와 비상관 비율에 응답하여 추정된다. 방법은 바람직하게 초음파 변환기와 데이터 프로세서로 구현된다.Preferred embodiments are useful in ultrasonic systems for measuring the flow rate of a fluid within a region of interest. In that environment, the ultrasonic wave is preferably transmitted to the container in a transmission direction defining a scan plane by the ultrasonic transducer. The data signal is generated in response to ultrasonic waves backscattered from the fluid in the vessel. A velocity signal having a velocity value representing a component of the flow velocity of the fluid in the scan plane is generated in response to the data generated from the data signal. Some of the data are correlated and the proportion of uncorrelated parts is calculated. The flow rate of the fluid is estimated in response to the velocity signal and the uncorrelated ratio. The method is preferably implemented with an ultrasonic transducer and a data processor.
전술한 방법을 사용함으로써, 용기 내에서의 유체의 유량이 스캔 각도와 무관하고 용기 형태 또는 이동 경로(geometry)에 대한 어떤 가정도 없이 결정될 수 있다. 예를 들어, 본 발명의 방법은 상술한 종래의 방법이 전형적으로 취한 어떤 가정도 없이 진정한 혈액 체적 이동을 추정하게 한다. 바람직한 실시예의 방법은 현재 시장에서 대부분의 표준 초음파 변환기 어레이 스캔헤드와 결합될 수 있다. 본 발명의 방법은 견실하고 실시간으로 구현될 수 있다.
By using the method described above, the flow rate of the fluid in the vessel can be determined irrespective of the scan angle and without any assumptions about the vessel shape or geometry. For example, the method of the present invention allows the conventional method described above to estimate true blood volume shift without any assumptions typically taken. The method of the preferred embodiment can be combined with most standard ultrasound transducer array scanheads on the market today. The method of the present invention can be implemented robustly and in real time.
도 1을 참조하면, 본 발명의 실시예에 적합한 그레이 스케일 촬상 시스템과 컬러 이동에 관한 기본 신호 프로세싱 체인은 초음파 변환기 어레이(2)를 포함하는데, 여기서 초음파 변환기 어레이(2)는 전형적으로 킬로헤르츠 범위인 펄스 반복 주파수(Pulse Repetition Frequency : PRF)에서 반복적으로 점호되는 길이(P)의 톤버스트(tone burst)를 포함하는 펄스 시퀀스를 전송하도록 활성화된다. 버스트 길이(P)를 포함하는 펄스 시퀀스는 컬러 이동과 B-모드 프로세싱에서 상이하다. 컬러 이동 촬상에 있어서, P는 4에서 8까지의 주기일 수 있으며, 톤버스트는 동일한 전송 특성을 갖는 동일한 전송 초점 위치에서 초점이 맞춰진다.Referring to Fig. 1, a basic signal processing chain for color shift and gray scale imaging system suitable for an embodiment of the present invention includes an
동일한 전송 초점 위치에서 초점이 맞춰진 일련의 컬러 이동 전송 점호는 "패킷"으로 지칭된다. 각각의 전송 빔은 스캔되는 물체를 통해 전달되고 물체에서 초음파 산란자(scatter)에 의해 반사된다.A series of color shifting transmission firings that are focused at the same transmission focus position is referred to as a "packet." Each transmission beam is transmitted through an object to be scanned and reflected by an ultrasonic scatterer in the object.
복귀 RF 신호는 변환기 소자에 의해 검출되고 빔형성기(4)에서 개별적인 수신 채널에 의해 수신된다. 빔형성기는 지연된 채널 데이터를 합산하고 복조기(6)에 의해 동상(in-phase) 및 정방형(I/Q) 신호 요소로 복조되는 빔 합산 신호로 출력한다. 복조기(6)로부터 출력된 B-모드(I, Q)는 그레이 스케일 B-모드 프로세싱 을 위해 중간 프로세서(8G)에 전송되고, 복조기(6)로부터 출력된 컬러 이동(I, Q)은 컬러 프로세싱을 위해 중간 프로세서(8C)에 전송된다.The return RF signal is detected by the transducer element and received by a separate receive channel at the
도 2는 중간 프로세서(8C)를 도시한다. 복조기(6)로부터의 I/Q 신호 요소는 코너 터너 메모리(corner turner memory : 7)에 저장되는데, 코너 터너 메모리의 목적은 혹 인터리브된(possibly interleaved) 점호로부터의 데이터를 버퍼하고 주어진 영역 셀에서 점호동안에 포인트의 벡터로서 데이터를 출력한다. 데이터는 각각의 점호를 위해 "고속", 또는 순차적으로 영역이 줄어들면서(down range)(벡터를 따라서) 수신된다. 코너 터너 메모리의 출력은 각각의 영역 셀을 위해 "저속", 또는 점호에 의해 순차적으로 재정돈된다. 결과적인 "저속" I/Q 신호 샘플은 정지 또는 매우 저속 이동 조직에 대응하는 어느 클러터(clutter)를 거절하는 월 필터(9)를 통과한다. 그 후 필터된 출력은 영역 셀 정보를 매개 자동상관 파라미터(N, D 및 R(0))로 변환하는 파라미터 추정기(11)에 삽입된다. N과 D는 다음과 같이 자동상관 방정식에 관한 계산자(numerator and denominator)이다 : 2 shows an
![]()
![]()
![]()
![]()
여기서, Ii와 Qi는 점호(i)에 관해 복조되고, 기저대역된 입력 데이터이며, M은 패킷에서 점호수이다. R(0)은 다음과 같이 패킷에서 점호수 동안의 제한된 합 산으로서 근사화된다 :Where I i and Q i are demodulated with respect to the call i, the baseband input data, and M is the number of calls in the packet. R (0) is approximated as a limited sum for the number of trails in the packet as follows:
![]()
![]()
여기서 R(0)은 컬러 이동 전송 점호로부터의 후방산란의 컬러 이동 파워를 나타낸다.Where R (0) represents the color shift power of the backscatter from the color shift transmission call.
프로세서는 N과 D를 각각의 영역 셀에 관한 크기와 위상으로 변환한다. 사용되는 방정식은 다음과 같다 :The processor converts N and D into magnitude and phase for each area cell. The equation used is as follows:
![]()
![]()
![]()
![]()
여기서 R(T) 및 Φ(T) 각각은 제 1 래그(lag) 자동상관 함수의 크기와 위상이다. 래그란 용어는 시간 간격을 나타내는데 사용된다. 예를 들어, 래그는 프레임간(frame-to-frame) 증가 또는 점호간(firing-to-firing) 증가일 수도 있다. 방정식 (A) 내지 (C)가 나타내는 바와 같이, 정확한 자동상관 함수는 패킷에서 점호수내에서 알려진 데이터를 한정 합산함으로써 근사화된다.Where R (T) and Φ (T) are each the magnitude and phase of the first lag autocorrelation function. The term lag is used to refer to a time interval. For example, the lag may be frame-to-frame increase or firing-to-firing increase. As the equations (A) to (C) show, the exact autocorrelation function is approximated by finite summation of known data in the number of numbers in the packet.
파라미터 추정기는 크기와 위상값을 컨덕터(11A, 11B 및 11C)상으로 제각기 전송되는 파워, 속도 및 난류(turbulence) 또는 분산(variance)의 추정치를 나타내는 값을 갖는 신호로 처리한다. 위상은 아래에 나타나는 바와 같이 속도에 비례하는 평균 도플러 주파수를 계산하는데 사용된다 ; R(0) 및|R(T)|(크기)는 난류를 추정하는데 사용된다.The parametric estimator processes the magnitude and phase values into signals having values representing estimates of power, velocity and turbulence or variance transmitted over the
헤르츠인 평균 도플러 주파수는 N과 D의 위상 및 T에서의 펄스 반복으로부터 얻어진다 :Hertzian average Doppler frequency is obtained from the phases of N and D and the pulse repetition at T:
![]()
![]()
평균 속도는 아래의 도플러 쉬프트 방정식을 사용하여 계산된다. 이동 방향과 샘플링 방향 사이의 각도(θ)를 알지 못하기 때문에, 코사인 θ는 1.0이라고 가정된다. The average speed is calculated using the Doppler shift equation below. Since the angle θ between the moving direction and the sampling direction is unknown, the cosine θ is assumed to be 1.0.
![]()
![]()
바람직하게, 파라미터 추정기는 매개 출력으로서 평균 도플러 주파수를 계산하지는 않지만, 순람표(look-up table)를 사용하여 프로세서의 위상 출력으로부터 ![]()
![]()
![]()
![]()
난류는 평균 도플러 주파수의 분산의 2차 시리즈 확장으로서 시간 도메인에서 계산될 수도 있다. 난류에 관한 시간 도메인 표현은 제로 래그(zero-lag) 및 일 래그(one-lag) 자동상관 함수(R(0) 및 R(T))를 제각기 계산하는 것을 수반한다.Turbulence may be calculated in the time domain as a second series extension of the variance of the average Doppler frequency. The time domain representation of turbulence involves calculating the zero-lag and one-lag autocorrelation functions R (0) and R (T), respectively.
난류에 관한 시간 도메인 표현은 다음과 같이 표현될 수도 있다 :The time domain representation for turbulence may be expressed as follows:
![]()
![]()
평균값 신호 Φ(T)는 이동 반사기의 평균 도플러 주파수 쉬프트의 추정치인데, 차례로 평균 혈액 이동 속도에 비례한다. 분산 신호 σ2는 기저대역 에코 신호 의 이동 신호 요소의 주파수 확산을 나타낸다. 이 값은 다수의 속도의 혼합을 수반하는 이동 난류를 나타낸다. 이동 반사기로부터의 신호의 강도를 나타내기 위해, 신호 R(0)는 도플러 쉬프트된 이동 신호로 복귀 파워의 양을 나타낸다.The mean value signal φ (T) is an estimate of the mean Doppler frequency shift of the moving reflector, which in turn is proportional to the mean blood movement speed. The variance signal σ 2 represents the frequency spread of the moving signal component of the baseband echo signal. This value represents moving turbulence involving the mixing of multiple velocities. To indicate the strength of the signal from the moving reflector, signal R (0) represents the amount of return power to the Doppler shifted moving signal.
컨덕터(11A)상의 신호 파워는 데이터 압축 커브군에 따라 데이터를 압축하는 데이터 압축 모듈(13)을 통과한다. 상이한 커브군이 상이한 스캐닝 응용에 제공될 수 있다. 예를 들어, 하나의 커브군은 신장 스캐닝에 제공되지만, 다른 커브군은 경동맥(carotid artery) 스캐닝에 제공된다. 제어기(26)는 사용자가 스캔 응용을 선택할 때 디폴토(default) 커브를 세팅한다. 동적 범위는 디스플레이(18)상에 발생되는 루멘 또는 강도의 범위를 제어한다.The signal power on the
도 3을 참조하면, 그레이 스케일 B-모드 중간 프로세서(8G)는 (I2 + Q2)1/2의 양을 계산함으로써 빔합산 수신 신호의 포락선(envelope)을 형성하기 위한 포락선 검출기(10)를 포함한다. 신호의 포락선은 스캔 변환기(14)(도 1)에 출력되는 디스플레이 데이터를 형성하기 위해 대수적 압축(도 3에서 블록(12))같은 소정의 추가적인 B-모드 프로세싱을 경험한다.Referring to FIG. 3, the gray scale B-mode
도 1을 다시 참조하면, 컬러 이동 추정치와 그레이 스케일 디스프레이 데이터는 영상 디스플레이를 위해 데이터를 X-Y 포맷으로 변환하는 스캔 변환기(14)에 전송된다. X-Y 포맷의 스캔 변환 프레임은 영상 디스플레이를 위해 영상 데이터를 디스플레이 컬러 맵과 그레이 스케일 이미지 프레임으로 기본적으로 매핑하는 영상 프로세서(16)에 전송된다. 그 후 이미지 프레임은 디스플레이를 위해 영상 모니터(18)에 전송된다. 전형적으로, 컬러 이미지에 있어서 속도 또는 파워중 어느 하나가 단독으로 디스플레이되거나, 속도가 파워 또는 난류중 어느 하나와 관련되어 디스플레이된다. 시스템 제어는 운영자 인터페이스(예를 들어, 키보드)를 통해 운영자 입력을 수신하고 차례로 다양한 서브시스템을 제어하는 호스트 컴퓨터(도시되지 않음)가 담당한다.Referring back to FIG. 1, the color shift estimates and gray scale display data are sent to a
영상 모니터(18)에 의해 디스플레이되는 이미지는 각각의 정보가 디스플레이에서 개별적인 픽셀의 강도 또는 밝기뿐만 아니라 이동 속도를 나타내는 데이터의 이미지 프레임으로부터 발생된다. 예를 들어, 이미지 프레임은 각각의 강도 정보가 픽셀 컬러와 밝기를 나타내는 이진수인 데이터 어레이를 포함할 수도 있다. 디스플레이 모니터(18)상의 각각의 픽셀의 밝기는 잘 알려진 방식으로 데이터 어레이에서 자신의 대응하는 요소의 값을 판독함으로써 연속적으로 새로워진다. 각각의 픽셀은 사용되는 그레이 맵과 질의(interrogating)하는 초음파 펄스에 응답하여 개별적인 샘플 체적의 후방산란 단면과 이동 평균 속도 및/또는 파워를 나타내는 컬러 값의 함수인 강도 값을 갖는다.The image displayed by the
도 4를 참조하면, 시스템 제어는 운영자 인터페이스(도시되지 않음)를 통해 운영자 입력을 수신하고 차례로 다양한 서브시스템을 제어하는 주 제어기 또는 호스트 컴퓨터가 담당한다. 주 제어기(26)는 또한 시스템 타이밍과 제어 신호를 발생시킨다. 주 제어기(26)는 중앙 처리 장치(CPU : 30)와 RAM(32)을 포함한다. 키보드(29)는 데이터를 CPU(30)에 입력하는데 사용된다. CPU(30)는 획득된 생(raw) 데이터를 근거로 컬러 맵과 그레이를 구현하는데 사용되는 루틴(routines)을 저장 하기 위해 결합된 판독 전용 메모리를 갖는다.Referring to FIG. 4, system control is handled by a host controller or host computer that receives operator input through an operator interface (not shown) and in turn controls the various subsystems. The
스캔 변환기(14)는 음향 라인 메모리(22)와 X-Y 메모리(24)를 포함한다. 음향 라인 메모리(22)에 극좌표(R-θ) 섹터 포맷으로 저장된 컬러 모드 강도 데이터 및 B-모드는 X-Y 메모리(24)에 저장되는 적절히 스케일된 직각 좌표 픽셀 디스플레이 데이터로 변환된다. 컬러 데이터는 메모리 위치(24C)에 저장되고, 그레이 스케일 데이터는 메모리 위치(24G)에 저장된다. 스캔 변환 프레임은 영상 디스플레이를 위해 데이터를 그레이 맵으로 매핑하는 영상 프로세서(16)에 전송된다. 그 후 그레이 스케일 이미지 프레임은 디스플레이를 위해 영상 모니터에 전송된다.The
음향 샘플 데이터의 연속적인 프레임은 선입 선출(first-in, first-out) 방식으로 시네 메모리(28)에 저장된다. 컬러 프레임은 메모리 위치(28C)에 저장되고, 그레이 스케일 프레임은 메모리 위치(28G)에 저장된다. 관심 컬러 영역에 있어서, 디스플레이 픽셀에 대응하는 컬러 데이터의 모든 워드(word)에 대해서, 그 픽셀에 대응하는 B-모드 그레이 스케일 데이터의 대응하는 워드가 존재한다. 시네 메모리는 백그라운드(background)에서 동작하는 원형 이미지 버퍼와 유사한데, 사용자에게 실시간으로 디스플레이되는 음향 샘플 데이터를 지속적으로 포착한다. 사용자가 시스템을 동결(freeze)할 때, 사용자는 시네 메모리에 이전에 포착된 음향 샘플 데이터를 검색할 수 있다.Continuous frames of acoustic sample data are stored in the
CPU(30)는 시스템 제어 버스(34)를 통해 XY 메모리(24)와 시네 메모리(28)를 제어한다. 특히, CPU(30)는 XY 메모리(24)에서 영상 처리기(16)와 시네 메모리(28)로의 생 데이터의 이동을 제어하고 시네 메모리에서 영상 프로세서(16) 와 CPU(26) 자신으로의 생 데이터의 이동을 제어한다. CPU는 또한 그레이 맵과 컬러 맵을 영상 프로세서에 로드한다.The
이미지 프레임은 연속적으로 시네 메모리(28)에 수집된다. 시네 메모리(28)는 단일 이미지 검색, 복수 이미지 루프 검색, 및 다양한 제어 기능을 위한 상주 디지털 이미지 저장매체를 제공한다. 단일 이미지 시네 재생 동안에 디스플레이되는 관심 영역은 이미지 획득 동안에 사용되는 영역이다. 시네 메모리는 또한 주 제어기(26)를 통해 디지털 문서 보관 장치(도시되지 않음)로의 이미지의 전송을 위한 버퍼로서 동작한다.Image frames are continuously collected in the
바람직한 실시예는 표준 도플러 측정치를 에코 크기 비상관과 결합하는 체적 혈액 이동 측정에 관한 방법을 달성하기 위해 도 1 내지 도 4에서 설명된 형태의 시스템을 사용한다. 유체의 유량이 측정되는 용기의 오리엔테이션에 관한 지식없이 단일 임상 변환기(2)를 사용함에 있어서, 3차원 벡터 이동 필드가 초음파 촬상 평면상으로 계산된다. 일반적으로, 체적 이동은 용기 단면(즉, 촬상 평면과 용기의 교차부)상의 비평면(out-of-plane) 이동(예를 들어, 촬상 평면을 교차하는 이동)을 적분함으로써 계산된다.
Preferred embodiments use a system of the type described in FIGS. 1-4 to achieve a method for volumetric blood flow measurements that combines standard Doppler measurements with echo size decorrelations. In using a single
평면 속도Plane speed
도 5는 관심 영역(용기(VE, 예를 들어 혈관)일 수도 있는)과 변환기(2)의 오리엔테이션에서 유체(예를 들어, 혈액)의 이동 방향(FL)을 디스플레이한다. 유체는 바람직하게 대비자(contrast agent : CA)를 포함한다. 빔(B)에서 도플러 초음 파 파동은 방향(D1 및 D2)(예를 들어, 변환기의 표면(3)에 수직한 축(A1)으로부터 θ = +20°및 -20°)으로 스티어링(steer)된다. 스티어링은 분리된 B-모드 빔 펄스 점호를 사용하여 달성된다. 방향(D1 및 D2)은 사용자가 각도를 알지 못하더라도 예를 들어 60°일 수 있는 소정의 결정되지 않는 각도에서 용기(VE)를 교차하는 스캔 평면(IP)과 촬상을 규정한다. 평면(IP)에서 빔(B)을 방향짓는 삼각법(triangulation), 교차 상관등과 같은 어느 2차원 방법이 사용될 수 있다. 이와 달리, 빔(B)의 스캐닝은 본 명세서에서 참조한 미합중국 특허 제 5,398,216호(1995년 3월 14일 홀(Hall)등이 출원한)에 개시된 스플릿 개구(split aperture) 방법을 사용하여 수행될 수도 있다. 스플릿 개구 방법을 사용함에 있어서, 빔(B)은 상이한 각도에서 용기(VE)내의 공통(common) 포인트를 향할 것이다.FIG. 5 displays the direction of movement FL of the fluid (eg blood) in the region of interest (which may be a vessel (VE, eg a vessel)) and the orientation of the
도 5에서 축(x 및 y) 모두는 평면(IP)내에 존재한다. 축(z)은 정면 방향으로 향하고, 축(y)은 축 방향으로 향하고, 및 축(x)은 측면 방향으로 향한다. 축(x, y 및 z)은 직교한다.In FIG. 5 both axes x and y are in plane IP. Axis z faces in the front direction, axis y faces in the axial direction, and axis x faces in the lateral direction. The axes x, y and z are orthogonal.
방향(D1 및 D2)으로 스티어링된 빔에 응답하여 용기(VE)로부터 후방산란된 초음파 파동은 변환기(2)에 의해 수신되고 두개의 대응하는 "축" 유체 속도(V1 및 V2)가 측정되는 데이터를 발생시키는데 사용된다. 평면(즉, 평면(IP)) 유체 속도 구성요소(Vx 및 Vy)는 그 후 다음과 같이 계산될 수 있다 :Ultrasonic waves backscattered from the vessel VE in response to beams steered in directions D1 and D2 are received by the
![]()
![]()
![]()
![]()
![]()
![]()
Vy에 관한 측정치 에러는 코사인(θ)에 반비례하여, 큰 각도일 수록 더 정확한 결과를 제공할 것이라는 것에 유의해야 한다.
It should be noted that the measurement error with respect to V y is inversely proportional to the cosine (θ), the larger the angle the more accurate the result will be provided.
비상관Uncorrelated
유체에서 스페클의 비상관 비율은 이동 속도 또는 빔 펄스 반복 주파수(PRF)(프로세싱 방법에 의존하는) 및 변환기(2)의 빔 특성의 함수이다. 비상관 비율은 전술한 형태의 컬러 이동 전송 점호로부터 계산될 수 있다. 구체적으로, 비상관 비율은 제로 래그 자동 상관 방정식(C)이 표현하는 바와 같이 컬러 이동 파워에 근거할 수 있다. 비상관 비율은 하나의 점호 패킷에서 다른 점호 패킷으로의 시간에서 R(0)의 값의 변화에 의해 결정된다.The uncorrelated rate of speckle in the fluid is a function of the speed of travel or the beam pulse repetition frequency (PRF) (depending on the processing method) and the beam characteristics of the
비상관 비율은 또한 용기(VE)로부터 후방산란된 초음파 RF 데이터를 나타내는 그레이 스케일 데이터로부터 계산될 수 있다. 그레이 스케일 데이터에 근거한 비상관 비율은 이하에서 상세히 설명할 것이나, 당업자라면 컬러 이동 전송 점호로부터 비상관 비율을 계산하는데 원리를 적용할 수 있다. 스페클 정보를 세부적으로 통계적 분석하는 것이 전술한 참조 문헌(Tuthill et al 1998)[10]에 개시되어 있지만, 본질적인 요점과 가정은 본 명세서에도 적용된다.The uncorrelated ratio can also be calculated from gray scale data representing ultrasonic RF data backscattered from the vessel VE. The uncorrelated ratio based on gray scale data will be described in detail below, but one skilled in the art can apply the principle to calculating the uncorrelated ratio from the color shift transmission call. Although a detailed statistical analysis of speckle information is disclosed in the aforementioned references (Tuthill et al 1998) [10], the essential points and assumptions also apply here.
완전히 현상된 스페클에 있어서, 적어도 10개의 산란자가 3차원 포인트 확산 함수에 의해 규정된 샘플 체적에 존재해야 한다. 초음파 강도의 공간 분포는 1.0 의 일정 평균 표준 편차(constant mean to standard deviation)(MSD) 비율을 갖는 지수 분포여야 한다. 펄스에서 펄스로(또는 프레임에서 프레임으로)의 스페클 변화의 양은 스페클 패턴의 제 2차 통계에 직접 관련된다.For fully developed speckles, at least 10 scatterers must be present in the sample volume defined by the three-dimensional point spreading function. The spatial distribution of the ultrasound intensity should be an exponential distribution with a constant mean to standard deviation (MSD) ratio of 1.0. The amount of speckle change from pulse to pulse (or frame to frame) is directly related to the second order statistics of the speckle pattern.
정면 축(즉, 평면(IP)에 수직한)에서 스페클 상관 함수의 유도는 본 명세서에서 설명되며, 평면(IP)에서의 측면과 축 방향으로 쉽게 확장될 수 있다. 코히어런트하게 형성된 스페클에 있어서, 강도 상관 함수는 차례로 포인트 확산 함수(PSF) 자동상관에 비례하는 크기 상관 함수에 직접 관련된다. 초점이 맞은 변환기(2)를 가정하면, 빔 패턴은 그 후 빔이 초점 범위를 들어오고 나감에 따라 깊이 의존성 폭을 갖는 가우스 함수에 의해 근사화될 수 있다. 결과적으로, 측면 방향에서 강도 자동상관은 또한 획득된 프레임 사이의 유체 이동(translation)에 관한 가우스 함수로 기록될 수 있고 σx(z)의 표준 편차, 깊이 의존성 빔 상관 폭(BCW)을 가질 것이다. 초점에서 상관 폭은 변환기의 물리적 특성에 의해 계산될 수 있거나, 더 긴 범위에 관한 상관 폭은 완전히 현상된 스페클을 발생시키는 산란자를 포함하는 팬톰(phantom)을 사용하여 캘리브레이트(calibrate)될 수 있다.The derivation of the speckle correlation function in the frontal axis (ie, perpendicular to the plane IP) is described herein and can easily be extended in the lateral and axial directions in the plane IP. For coherently formed speckles, the intensity correlation function is directly related to the magnitude correlation function, which in turn is proportional to the point spread function (PSF) autocorrelation. Assuming the
단일 픽셀 위치에 관한 시간 정규화 강도 공분산(temporal normalized intensity covariance)(C)은 그 후 가우스 형태을 갖는다(Wear 1987)[11].The temporal normalized intensity covariance (C) for a single pixel location then takes the form of a Gaussian (Wear 1987) [11].

여기서 변환기 특성에 의해 결정되는 바와 같이 Vx는 측면 속도이고, σx(z) 는 깊이 의존성 빔 상관 폭이다. Rf의 빔(B) 펄스 점호 비율에 있어서, 연속적인 A-라인으로부터 획득된 특정한 깊이에서 한 세트의 픽셀로부터의 정규화된 공분산은 그 후 점호수(n)의 함수로서 가우스 함수로 커브 맞춤될 수 있다, Where V x is the lateral velocity and σ x (z) is the depth dependent beam correlation width as determined by the transducer characteristics. For the beam (B) pulse firing ratio of R f , the normalized covariance from a set of pixels at a particular depth obtained from successive A-lines will then be curve-fit to a Gaussian function as a function of the firing number n. You can,
![]()
![]()
여기서 인버스 세컨드(inverse second)의 단위로 비상관 값의 비율(D)은 그 깊이에 관해 빔 상관 폭에 의해 나뉘는 속도에 등가이다. 최종 결과는 한 세트의 그레이 스케일 A-라인 또는 한 세트의 그레이 스케일 B-스캔 프레임으로부터 스페클 범위에 관한 상관 함수를 가우스 커브에 맞춤으로써, 그 세트에 대한 평균 속도가 계산될 수 있다. 비상관 비율은 Tuthill(1998)[10] 및 Rubin(1999)[9], 다른 참조 문헌에서 설명되는 방법에 의해 계산될 수 있다. 비상관은 또한 도플러 정보(Adler 1995)[12] 및 (Chen 1996)[15]로부터 계산될 수 있으나, 어떤 응용에서는 바람직한 방법이 아닐 수도 있다.Here the ratio D of uncorrelated value in units of inverse second is equivalent to the speed divided by the beam correlation width with respect to its depth. The final result is that by fitting a correlation function on the speckle range from a set of gray scale A-line or a set of gray scale B-scan frames to a Gaussian curve, the average speed for that set can be calculated. Uncorrelated ratios can be calculated by methods described in Tuthill (1998) [10] and Rubin (1999) [9], other references. Uncorrelated can also be calculated from Doppler information (Adler 1995) [12] and (Chen 1996) [15], but may not be the preferred method for some applications.
체적 이동에 있어서, 비상관은 현재 모든 3차원을 포함하다록 확장될 수 있다. 타원형 샘플 체적을 가정한다면, 커브-맞춤 비상관 값(D)은 속도 요소에 직접 관련된다,In volumetric movement, the decorrelation can be expanded to include all three dimensions now. Assuming an elliptical sample volume, the curve-fit uncorrelated value D is directly related to the velocity factor.
![]()
![]()
여기서 Bi는 i차 방향으로의 빔 상관 폭(BCW)이다. BCW는 스페클 팬톰을 사용하여 캘리브레이트되고 깊이와 변환기의 초점 파라미터에 의존하나, 촬상 평면을 통해 측정 가능하다.
Where B i is the beam correlation width BCW in the i-th direction. BCW is calibrated using a speckle phantom and depends on the depth and focus parameters of the transducer, but can be measured through the imaging plane.
3차원 이동 벡터 및 체적 이동3-D move vector and volume move
도플러 측정치(또는 스페클 트래킹)로부터 평면 속도(Vx 및 Vy)(즉, 평면(IP)에서의 속도)를 결정하였다면, 스캔 평면(IP)에 수직한 속도 구성요소의 크기(Vz)는 방정식(6)으로부터 계산될 수 있다. 따라서 3차원 이동 벡터는 세 개의 측정치(예를 들어, 두 개의 도플러 및 하나의 그레이스케일 비상관)에 대해 두 개의 상이한 모드에서 동작하는 단일 변환기(2)로부터 계산될 수 있다. 각각의 값(Vx, Vy 및 D)을 구하는 데이터 수집과 프로세싱의 방법은 다양한 형태를 가질 수 있다는 것을 이해해야 한다.If the plane velocities V x and V y (ie, velocity in plane IP) were determined from the Doppler measurements (or speckle tracking), then the magnitude Vz of the velocity component perpendicular to the scan plane IP is It can be calculated from equation (6). The three-dimensional motion vector can thus be calculated from a
용기(VE)를 통한 총 체적 이동이 또한 계산될 수 있다. 가우스 이론은 폐쇄된 표면 밖으로의 체적 이동 또는 플럭스(flux)는 둘러싸인 체적상으로의 벡터장의 다이버전스(divergence)의 적분과 동일하다고 것을 입증한다. 따라서, 총 체적 이동(F)은 교차 영역 상으로 적분된 평균 속도 요소이다,Total volume movement through the vessel VE can also be calculated. Gaussian theory demonstrates that the volumetric displacement or flux out of the closed surface is equal to the integral of the divergence of the vector field onto the enclosed volume. Thus, the total volumetric movement F is the mean velocity component integrated over the cross section,
![]()
![]()
평면(IP)에 의해 교차되는 용기 영역상에 촬상 및 스캔 평면(IP)에 수직인 속도 구성요소(Vz)을 합산함으로써, 총 체적 이동이 계산될 수 있다. 방정식 (A) 내지 (H)와 (1) 내지 (7)의 계산은 CPU(30)(도 4)에 의해 수행될 수 있다. CPU(30)는 방정식 (A) 내지 (H)와 (1) 내지 (7)의 다양한 파라미터에 대응하는 신 호를 발생시킨다.By summing the velocity components Vz perpendicular to the imaging and scanning planes IP on the container region intersected by the planes IP, the total volumetric movement can be calculated. The calculation of equations (A) to (H) and (1) to (7) can be performed by the CPU 30 (FIG. 4). The
다양한 디지털 프로세서가 본 명세서에서 설명되는 계산을 수행하는데 사용될 수 있다. 예를 들어, 마이크로프로세서 또는 디지털 신호 프로세서뿐만 아니라 논리와 산술 동작을 수행할 수 있는 특정 용도 주문형 집적 회로(ASIC)가 사용될 수 있다. 그 프로세서는 도 1 내지 도 4에서 설명된 시스템의 어느 곳에나 배치될 수 있거나, 시스템 외부에 배치될 수도 있다.
Various digital processors may be used to perform the calculations described herein. For example, a special purpose application specific integrated circuit (ASIC) capable of performing logic and arithmetic operations as well as a microprocessor or digital signal processor may be used. The processor may be located anywhere in the system described in FIGS. 1-4, or may be located outside the system.
실시예Example
이하는 실험에 의해 입증되어 왔다는 점에서 본 발명의 최상의 모드를 나타낸다. 그러나, 컬러 이동 전송 점호에 의해 비상관을 측정하는 것과 같은 본 발명의 다른 형태가 어떤 응용을 달성하는데 쉬울 수도 있다.The following represents the best mode of the present invention in that it has been demonstrated by experiments. However, other forms of the present invention, such as measuring decorrelations by color shift transmission call, may be easy to achieve certain applications.
7.5MHz 선형 어레이 변환기를 갖는 GE Logic 700 임상 스캐너(GE Medical Systems, Milwaukee, WI)는 단일 초점으로 사용된다. GE Logic 700 스캐너는 일반적으로 도 1 내지 도 4에 의해 표현될 수 있으며 7.5MHz 선형 어레이 변환기는 변환기(2)에 의해 표현될 수 있다. 에지 증강(edge enhancement) 및 평균화 같은 모든 내부 포스트-프로세싱 세팅(internal post-processing settings)은 턴오프되었고, 깊이는 30Hz의 최대 허용가능 프레임 비율을 달성하기 위해 3cm의 최소 값으로 세팅되었다. 출력 파워는 음향 방사선 힘으로 인해 추가 비상관으로부터의 효과를 줄이기 위해 최저 수준으로 세팅되었다. B-모드에 있어서, 선형 그레이스케일 매핑이 적용되었고 스캔은 크기에 비례하는 픽셀 값을 갖는 이미지를 얻기 위해 감압 되었다. 도플러 획득에 있어서, 월 필터(9)의 최저 세팅 및 최저 속도가 적용되었다. 모든 이미지는 8비트로 스캐너상에 디지털적으로 저장되었고 CPU(30)(도 4)에 의해 표현될 수 있는 UNIX 컴퓨터에 전송되었다. 3cm by 4cm 디지털화된 이미지는 메모리(32)(도 4)에서 84.5㎛ 길이의 정방형 픽셀 사이즈에 대한 355 by 478 픽셀로 저장되었다.The GE Logic 700 clinical scanner (GE Medical Systems, Milwaukee, WI) with a 7.5 MHz linear array transducer is used as a single focal point. The GE Logic 700 scanner can generally be represented by FIGS. 1 to 4 and the 7.5 MHz linear array converter can be represented by the
변환기 샘플 체적은 조직-모방 팬톰(tissue-mimicking phantom)(CIRS ; Computerized Imaging Reference Systems, Norfolk, VA)상의 각 방향(측면, 정면, 및 축)으로 증가된 스페이싱을 갖는 일련의 B-모드 스캔을 수집함으로써 캘리브레이트되었다. 팬톰은 완전히 현상된 스페클을 발생시키기 위해 촘촘하게 봉해지고(densely packed), 랜덤하게 분포된(randomly distributed) 산란자를 포함한다. 선형 마이크로포지셔너(micropositioner)는 측면과 정면 방향에 대해 50㎛ 의 스페이싱을 허용하고, 축 방향에 대해서는 25㎛의 스페이싱을 허용한다. 각각의 변환기 오리엔테이션에 있어서, 한 세트의 60개의 이미지가 얻어졌고, 대응하는 빔 상관 폭은 그 후 깊이의 함수로서 계산되었다.The transducer sample volume is a series of B-mode scans with increased spacing in each direction (side, front, and axis) on a tissue-mimicking phantom (CIRS; Computerized Imaging Reference Systems, Norfolk, VA). It was calibrated by collection. The phantom contains densely packed and randomly distributed scatterers to generate fully developed speckle. Linear micropositioners allow spacing of 50 μm in the lateral and front directions and spacing of 25 μm in the axial direction. For each transducer orientation, a set of 60 images were obtained and the corresponding beam correlation width was then calculated as a function of depth.
이동 튜브 실험에 있어서, 6.4mm의 분자막 튜브(molecularporous membrane tube)(Spectrum Laboratories, Laguna Hill, CA)는 기체가 제거된 물로 채워진 물 용기(water bath)내에 배치된다. 주사기 펌프(Harvard Apparatus, Holliston, MA)는 12에서 20ml/min의 이동을 발생시키는데 사용되었다. 튜브 시스템에 기체 거품을 삽입하지 않도록 주의가 필요하다. 시스템의 유출구는 막튜브의 완전한 팽창을 보장하고 압력을 유지하도록 탱크 보다 10cm 위로 유지되었다. In the transfer tube experiments, a 6.4 mm molecular membrane tube (Spectrum Laboratories, Laguna Hill, Calif.) Was placed in a water bath filled with degassed water. Syringe pumps (Harvard Apparatus, Holliston, Mass.) Were used to generate a migration of 12 to 20 ml / min. Care must be taken not to insert gas bubbles into the tube system. The outlet of the system was kept 10 cm above the tank to ensure complete expansion of the membrane tube and to maintain pressure.
혈액 모방 유체는 5:1 물/글리세롤 혼합물로 1 내지 35㎛ 직경의 폴리스티렌 구로 구성되었다. 높은 농도는 더 균일한 스페클을 위해 후방산란을 증가시키는데 사용되었다.The blood mimicking fluid consisted of polystyrene spheres of 1 to 35 μm diameter with a 5: 1 water / glycerol mixture. Higher concentrations were used to increase backscatter for more uniform speckle.
변환기(2)는 도 5에 도시된 바와 같이 독립적으로 y-축과 x-축 주위 모두의 회전을 허용하도록 고정되었다. 변환기는 세 개의 상이한 체적 이동 각각에 대해 y-축을 30˚증가하면서 회전하였다.The
각각의 체적 이동 세팅에 있어서, 60개의 그레이스케일 이미지의 시네 루프(cine loop)가 먼저 수집되고 메모리(28G(도 4)에 저장되는데, 한 세트의 도플러 이미지가 후속한다. 열 개의 비상관된 이미지가 두 개의 도플러 각도(+/-20˚)의 각각에 대해 수집되고 그 후 평균된다.For each volumetric shift setting, a cine loop of 60 grayscale images is first collected and stored in
저장된 이미지는 매트랩(MATLAB)(Mathworks, Natwick, MA)이란 프로그램을 사용하여 후에 처리되었다. 스페클 비상관에 있어서, 공분산 함수는 각각의 픽셀에 대해 계산되고 5 by 5 픽셀 윈도우 상으로 평균된다. 공분산 함수는 그 후 정규화되고, 오직 첫 번째의 두 개의 래그만이 비상관 값을 판정하기 위해 가우스 맞춤(Gaussian fit)에 사용되었다.The saved image was later processed using a program called MATLAB (Mathworks, Natwick, Mass.). For speckle uncorrelation, the covariance function is calculated for each pixel and averaged over a 5 by 5 pixel window. The covariance function was then normalized, and only the first two lags were used for a Gaussian fit to determine the uncorrelated value.
결과적인 비상관 이미지는 용기의 윤곽을 결정하도록 임계화되었다. 도 6을 사용함에 있어서, 비평면 속도(즉, 도 5에 도시된 바와 같이 z축을 따라서의 속도)는 총 체적 이동을 결정하기 위해 밀봉된 용기(VE)에서 계산되고 합산된다.The resulting uncorrelated image was critical to determine the contour of the vessel. In using FIG. 6, the non-planar velocity (ie, velocity along the z axis as shown in FIG. 5) is calculated and summed in the sealed vessel VE to determine the total volumetric movement.
초음파 RF 신호를 사용하는 방법의 유효성을 입증하기 위해, 이동 튜브는 변환기(2)로서 사용되는 5.0MHz 선형 어레이를 갖는 Diasonics 스캐너(Diasonics Ultrasound, Milpitas, CA)를 사용하는 제 2 셋업(setup)에서 사용되었다. 시네 루프의 RF 획득이 극도로 낮은 프레임 비율을 가졌기 때문에, M-모드 데이터만이 비상관 프로세싱을 위해 수집되었다. 이것은 획득된 A-라인에 대해 786Hz의 점호비를 제공하였다.
To validate the method of using ultrasonic RF signals, the moving tube is in a second setup using a Diasonics scanner (Diasonics Ultrasound, Milpitas, Calif.) With a 5.0 MHz linear array used as transducer (2). Was used. Since the RF acquisition of the cine loop had an extremely low frame rate, only M-mode data was collected for uncorrelated processing. This gave a firing ratio of 786 Hz for the obtained A-line.
결과result
단일 초점을 갖는 주어진 스캐너 세팅에 있어서, GE 7.5MHz 변환기는 초점 근처에 측면, 정면, 및 축 방향 각각에 대해 170㎛, 280㎛, 및 150㎛의 BCW를 가졌다. 도 6은 정면/측면 평면에 대해 15°증가에 관한 계산된 BCW 및 Bx(측면)와 By(정면)로부터의 이론적인 타원형 맞춤을 도시한다.For a given scanner setting with a single focal point, the GE 7.5 MHz transducer had BCWs of 170 μm, 280 μm, and 150 μm for the lateral, front, and axial directions, respectively, near the focal point. 6 shows the theoretical elliptical fits from the calculated BCW and B x (side) and B y (front) for a 15 ° increase for the front / side plane.
RF 데이터를 사용하는 Diasonics 변환기(2)의 캘리브레이션은 정면과 측면 방향 모두에 대해 깊이 의존 BCW가 검출된 BCW 커브의 포락선과 크게 다르지 않다는 것을 입증하였다. 기대된 바와 같이, 축 RF 신호는 검출된 스캔 라인의 포락선보다 훨씬 빨리 비상관한다. 초점 근처에서, RF BCW는 총 파장의 1/6인 대략 25㎛이다. 포락선 신호에 대해 대응하는 BCW는 복수의 파장 펄스에 조화되는 135㎛이다.Calibration of the
-20°스티어링과 +20°스티어링(도 5) 도플러 이미지 모두는 디스플레이될 수 있는 결합된 총 평면 속도 크기를 형성하는데 사용된다.Both -20 ° steering and + 20 ° steering (Figure 5) Doppler images are used to form the combined total plane velocity magnitude that can be displayed.
임계화된 비상관 이미지는 마스크로서 적용되었고, 정규 속도는 총 체적 이 동을 계산하기 위해 둘러싸인 영역에서 합산되었다. 비상관 마스크는 도플러와 달리 이동 각도에 상관없이 용기(VE) 루멘의 검출가능한 이미지를 제공하기 때문에 선택되었다. 마스크된 단면 영역에서 합산된 체적 이동은 0.25ml/s이다.The critical uncorrelated image was applied as a mask, and the normal velocities were summed in the enclosed area to calculate the total volume shift. The uncorrelated mask was chosen because, unlike Doppler, it provides a detectable image of the vessel (VE) lumen regardless of the angle of movement. The combined volume shift in the masked cross-sectional area is 0.25 ml / s.
본 명세서에서 설명하는 알고리즘에 있어서, 사용자는 용기가 임계화된 비상관 이미지로부터 결정되기 때문에 총 단면 영역에 관해 용기(VE)내에서의 영역에만 초점을 맞출 필요가 있다. 감소된 각도 의존성을 갖는 비상관 임계치를 사용하는 것(Rubin 1999)[9]은 도플러 보다 더 신뢰있는 이동 경계의 윤관묘사(delineation)를 제공한다.In the algorithm described herein, the user needs to focus only on the area within the container VE with respect to the total cross-sectional area since the container is determined from the critical uncorrelated image. Using uncorrelated thresholds with reduced angle dependence (Rubin 1999) [9] provides a more delineation of the boundary of motion than Doppler.
본 발명자들의 방법으로 계산된 속도 추정치에 관한 공간 해상도는 B-모드 이미지 보다 더 낮은 해상도를 갖는 도플러 신호에 의해 주로 제한된다. 비상관 방법은 B-스캔내의 각각의 픽셀 또는 A-라인의 각 포인트 상에서 계산되며, 공간 해상도는 디지털화된 샘플링 비율에 의해 결정된다. 그러나 정확한 상관 커브를 계산하기 위해 소정의 공간 평균화가 필요하다.The spatial resolution with respect to the velocity estimate calculated by our method is mainly limited by the Doppler signal with a lower resolution than the B-mode image. The uncorrelated method is calculated on each point in each pixel or A-line in the B-scan, and the spatial resolution is determined by the digitized sampling rate. However, some spatial averaging is required to calculate the correct correlation curve.
시간 해상도는 도플러 주파수 쉬프트와 비상관의 정확한 추정치를 위해 필요한 순차적인 A 라인의 수에 의해 결정된다. 대부분의 임상 스캐너에 있어서, 대략 10 내지 15 점호 라인이 도플러 출력을 계산하는데 사용된다. 평면 속도가 또한 2 타임(2 time) 상관 또는 스페클 트래킹을 사용하여 결정될 수 있다는 것에 유의해야 한다.The temporal resolution is determined by the number of sequential A lines needed for an accurate estimate of Doppler frequency shift and decorrelation. For most clinical scanners, approximately 10 to 15 firing lines are used to calculate the Doppler output. Note that plane velocity can also be determined using two time correlation or speckle tracking.
인간의 혈액 이동은 격렬한 운동시 대동맥에서 30 l/min에서 단일 모세혈관에서 10 nl/min의 범위이다(mm/s에 유사한 속도). 본 발명자들의 방법은 측정될 수 있는 속도의 범위에서 상한과 하한(upper and lower limits) 모두를 갖는다. 미약한 이동은 "월-덤프(wall-thump)" 필터가 상대적으로 느린 조직 이동에서 신호를 제거하는데 사용되기 때문에 도플러를 사용하여 검출하기 어렵다. 유사하게, 이동으로 인한 연조직(soft tissue)에서의 비상관은 미약한 맥박(bound)을 규정한다.Human blood migration ranges from 30 l / min in the aorta to 10 nl / min in a single capillary during vigorous exercise (rate similar to mm / s). Our method has both upper and lower limits in the range of speeds that can be measured. Weak movements are difficult to detect using Doppler because "wall-thump" filters are used to remove signals from relatively slow tissue movements. Similarly, uncorrelation in soft tissues due to migration defines a weak pulse.
높은 속도에 있어서, 분석의 비상관 구성요소는 브레이크다운(break down)된다. 이동이 점호 사이에서 BCW의 두 배 이상이라면, 신호는 완전히 비상관이고 어떠한 속도 추정도 할 수 없다. 따라서 샘플 체적의 BCW와 PRF는 상한 속도를 결정한다, 즉 최대 속도< PRF*(2 BCW)이다. 예를 들어, 10kHz 점호율과 400㎛의 상관 폭이라면, 최대 측정가능 속도는 80cm/s일 것이다. RF 분석에 있어서, 축 BCW는 정면 또는 측면 요소중 어느 하나 보다 더 작은 크기에 유사할 것이다. 도플러 측정치에 비해서, 빔에 수직한 이동이 높은 속도를 검출하는데 바람직한 방향이다.At high speeds, the uncorrelated component of the analysis breaks down. If the movement is more than twice the BCW between firings, the signal is completely uncorrelated and no speed estimate can be made. The BCW and PRF of the sample volume thus determine the upper limit speed, ie the maximum speed <PRF * (2 BCW). For example, with a correlation width of 400 um and a 10 kHz firing rate, the maximum measurable speed would be 80 cm / s. For RF analysis, the axis BCW will be similar in size to either smaller than either the front or side elements. Compared to the Doppler measurements, the movement perpendicular to the beam is the preferred direction for detecting high velocities.
바람직한 방법은 또한 이동이 모두 한 방향이라고 가정한다. 전단 이동(shear motion) 또는 난류 이동은 체적 이동 측정치를 상방으로 바이어스할 추가적인 비상관을 야기할 수도 있다. 전술한 바와 같이, σ2의 고찰은 본 발명의 방법의 부적절한 사용을 피하기 위해 이 조건을 나타낼 수 있다.The preferred method also assumes that the movements are all in one direction. Shear motion or turbulent movement may cause additional uncorrelation to bias the volumetric movement measurements upwards. As mentioned above, consideration of σ 2 may indicate this condition in order to avoid improper use of the method of the present invention.
이동의 표시(sign)는 비상관 측정치에서 결정될 수 없다. 따라서, 비평면 이동의 방향은 알지 못한 채로 남아 있다. 이것은 심장 주기 동안에 역 이동이 일어날 수 있는 동맥 이동의 문제일 수 있다. 이동 방향을 결정하기 위한 하나의 가 능성은 1.75 차원 어레이로 정면 방향에서 위상 구적법 분석(phase quadrature analysis)을 하는 것일 것이다.The sign of movement cannot be determined from uncorrelated measurements. Thus, the direction of non-planar movement remains unknown. This may be a problem of arterial migration where reverse migration may occur during the cardiac cycle. One possibility for determining the direction of movement would be to perform phase quadrature analysis in the front direction with a 1.75 dimensional array.
당업자라면 바람직한 실시예가 첨부한 청구범위에서 규정되는 바와 같이 본 발명의 진정한 사상과 범주를 벗어나지 않고 변경되고 수정될 수 있다는 것을 이해할 것이다.
Those skilled in the art will appreciate that the preferred embodiments can be changed and modified without departing from the true spirit and scope of the invention as defined in the appended claims.
본 발명은 초음파 시스템 및 유체의 유량 측정 방법을 제공하여 용기 내에서의 유체의 유량이 스캔 각도와 무관하게 결정될 수 있으며 대부분의 표준 초음파 변환기 어레이 스캔헤드와 결합될 수 있는 효과가 있다.The present invention provides an ultrasonic system and a method for measuring the flow rate of a fluid so that the flow rate of the fluid in the vessel can be determined irrespective of the scan angle and can be combined with most standard ultrasound transducer array scanheads.
Claims (36)
Applications Claiming Priority (2)
| Application Number | Priority Date | Filing Date | Title |
|---|---|---|---|
| US09/495,231 US6535835B1 (en) | 2000-01-31 | 2000-01-31 | Angle independent ultrasound volume flow measurement |
| US09/495,231 | 2000-01-31 |
Publications (2)
| Publication Number | Publication Date |
|---|---|
| KR20010087166A KR20010087166A (en) | 2001-09-15 |
| KR100737029B1 true KR100737029B1 (en) | 2007-07-09 |
Family
ID=23967806
Family Applications (1)
| Application Number | Title | Priority Date | Filing Date |
|---|---|---|---|
| KR1020010004211A KR100737029B1 (en) | 2000-01-31 | 2001-01-30 | Angle independent ultrasound volume flow measurement |
Country Status (5)
| Country | Link |
|---|---|
| US (1) | US6535835B1 (en) |
| EP (1) | EP1121901A3 (en) |
| JP (1) | JP4716346B2 (en) |
| KR (1) | KR100737029B1 (en) |
| CN (1) | CN1222757C (en) |
Families Citing this family (52)
| Publication number | Priority date | Publication date | Assignee | Title |
|---|---|---|---|---|
| GB2374744B (en) * | 2001-04-18 | 2003-04-16 | Voxar Ltd | Correction of boundary artefacts in image data processing |
| GB2373058B (en) * | 2001-09-18 | 2003-02-19 | Tayside Flow Technologies Ltd | Spiral flow testing |
| US6726628B2 (en) * | 2002-05-07 | 2004-04-27 | Dvx, Llc | Angle-independent doppler system for screening |
| JP3669580B2 (en) * | 2002-05-24 | 2005-07-06 | 学校法人慶應義塾 | Ultrasonic flow velocity distribution and flow meter |
| US7399278B1 (en) | 2003-05-05 | 2008-07-15 | Los Angeles Biomedical Research Institute At Harbor-Ucla Medical Center | Method and system for measuring amniotic fluid volume and/or assessing fetal weight |
| JP3669588B2 (en) * | 2003-05-06 | 2005-07-06 | 学校法人慶應義塾 | Ultrasonic flow velocity distribution meter and flow meter, ultrasonic flow velocity distribution and flow measurement method, ultrasonic flow velocity distribution and flow measurement processing program |
| US7013240B2 (en) * | 2003-07-14 | 2006-03-14 | Daniel Industries, Inc. | Method to snapshot and playback raw data in an ultrasonic meter |
| US7559894B2 (en) * | 2003-09-18 | 2009-07-14 | New Paradigm Concepts, LLC | Multiparameter whole blood monitor and method |
| US20060287590A1 (en) * | 2003-09-18 | 2006-12-21 | Mceowen Edwin L | Noninvasive vital sign measurement device |
| US7892188B2 (en) | 2003-10-22 | 2011-02-22 | Hemosonics, Llc | Method and apparatus for characterization of clot formation |
| US7004906B1 (en) * | 2004-07-26 | 2006-02-28 | Siemens Medical Solutions Usa, Inc. | Contrast agent imaging with agent specific ultrasound detection |
| US20070083099A1 (en) * | 2005-09-29 | 2007-04-12 | Henderson Stephen W | Path related three dimensional medical imaging |
| KR100798406B1 (en) * | 2005-11-04 | 2008-01-28 | 한국수자원공사 | A System for Measuring Flow Velocity using Real Time Locating System and a Measuring Float used in the Said System |
| KR100798391B1 (en) * | 2005-11-04 | 2008-01-28 | 한국수자원공사 | A Method for Measuring Flow Velocity using Real Time Locating System |
| US8251944B2 (en) * | 2006-03-29 | 2012-08-28 | Novartis Ag | Surgical system having a cassette with an acoustic coupling |
| US8348879B2 (en) * | 2006-08-28 | 2013-01-08 | Novartis Ag | Surgical system having a cassette with an acoustic air reflector |
| JP5294295B2 (en) * | 2007-12-07 | 2013-09-18 | ジーイー・メディカル・システムズ・グローバル・テクノロジー・カンパニー・エルエルシー | Ultrasonic diagnostic apparatus and ultrasonic diagnostic treatment system |
| US8306293B2 (en) * | 2008-05-15 | 2012-11-06 | University Of Virginia Patent Foundation | Reduction of echo decorrelation facilitating motion estimation |
| US8394027B2 (en) * | 2008-06-06 | 2013-03-12 | Siemens Medical Solutions Usa, Inc. | Multi-plane/multi-slice processing for 2-D flow imaging in medical diagnostic ultrasound |
| US20100022887A1 (en) * | 2008-07-21 | 2010-01-28 | Joan Carol Main | Method for imaging intracavitary blood flow patterns |
| EP2189812B1 (en) * | 2008-11-25 | 2016-05-11 | Samsung Medison Co., Ltd. | Providing volume information on a periodically moving target object in an ultrasound system |
| US8448499B2 (en) | 2008-12-23 | 2013-05-28 | C A Casyso Ag | Cartridge device for a measuring system for measuring viscoelastic characteristics of a sample liquid, a corresponding measuring system, and a corresponding method |
| CN102396000B (en) * | 2009-04-17 | 2013-08-21 | 香港科技大学 | Method, device and system for facilitating motion estimation and compensation of feature-motion decorrelation |
| JP5396173B2 (en) * | 2009-07-01 | 2014-01-22 | 日立アロカメディカル株式会社 | Ultrasonic diagnostic equipment |
| CN101738489B (en) * | 2009-12-16 | 2012-01-11 | 清华大学深圳研究生院 | Method for measuring transverse flow speed of scattering fluid |
| US8731333B2 (en) * | 2010-04-06 | 2014-05-20 | Jeffrey M. Sieracki | Inspection of hidden structure |
| WO2011127436A2 (en) | 2010-04-08 | 2011-10-13 | Hemosonics, Llc | Hemostatic parameter display |
| US8622913B2 (en) | 2010-09-28 | 2014-01-07 | General Electric Company | Method and system for non-invasive monitoring of patient parameters |
| US9272280B2 (en) | 2011-02-15 | 2016-03-01 | Hemosonics Llc | Device, systems and methods for evaluation of hemostasis |
| WO2013105987A2 (en) | 2011-02-15 | 2013-07-18 | Hemosonics, Llc | Characterization of blood hemostasis and oxygen transport parameters |
| WO2012159021A2 (en) | 2011-05-19 | 2012-11-22 | Hemosonics, Llc | Portable hemostasis analyzer |
| US10786223B2 (en) * | 2011-06-30 | 2020-09-29 | Koninklijke Philips N.V. | Method and apparatus for automated ultrasonic doppler angle and flow velocity estimation |
| US9696190B2 (en) * | 2011-08-23 | 2017-07-04 | Cidra Corporate Services, Inc. | Acoustic probing technique for the determination of multiple liquid/froth interfaces in separation and storage vessels based on an oblique tomographic analysis approach |
| WO2014083373A1 (en) * | 2012-11-28 | 2014-06-05 | B-K Medical Aps | Angle independent velocity spectrum determination |
| CN103340621B (en) * | 2013-06-04 | 2014-12-03 | 中国科学院苏州生物医学工程技术研究所 | Device and method for removing motion artifacts |
| CN103743360B (en) * | 2013-11-28 | 2016-08-24 | 无锡市迈日机器制造有限公司 | The high-performance pneumoelectric post of online edition Tape movement storage medium |
| JP5837641B2 (en) * | 2014-04-08 | 2015-12-24 | 日立アロカメディカル株式会社 | Ultrasonic diagnostic equipment |
| CN104997532A (en) * | 2014-04-24 | 2015-10-28 | 中国人民解放军总后勤部卫生部药品仪器检验所 | Correction method for color doppler ultrasonic diagnostic instrument detection device |
| US10175225B2 (en) | 2014-09-29 | 2019-01-08 | C A Casyso Ag | Blood testing system and method |
| US9726647B2 (en) | 2015-03-17 | 2017-08-08 | Hemosonics, Llc | Determining mechanical properties via ultrasound-induced resonance |
| US10448926B2 (en) * | 2016-02-26 | 2019-10-22 | B-K Medical Aps | Transverse oscillation vector estimation in ultrasound imaging |
| US10206646B2 (en) * | 2016-03-10 | 2019-02-19 | Siemens Healthcare Gmbh | Method and system for extracting centerline representation of vascular structures in medical images via optimal paths in computational flow fields |
| KR101716208B1 (en) * | 2016-04-28 | 2017-03-14 | 한국건설기술연구원 | Despiking method of abnormal signal data acquired with using three-dimensional doppler velocimetry in open channel flow and system for the same |
| US10408648B2 (en) * | 2016-06-30 | 2019-09-10 | Hach Company | Flow meter with adaptable beam characteristics |
| US10161770B2 (en) | 2016-06-30 | 2018-12-25 | Ott Hydromet Gmbh | Flow meter with adaptable beam characteristics |
| US10295385B2 (en) | 2016-06-30 | 2019-05-21 | Hach Company | Flow meter with adaptable beam characteristics |
| CA3065331A1 (en) | 2017-04-20 | 2018-10-25 | Hemosonics, Llc | Disposable system for analysis of hemostatic function |
| GB2570131A (en) * | 2018-01-11 | 2019-07-17 | Imperial Innovations Ltd | Fluid flow analysis |
| US11957441B2 (en) * | 2018-05-10 | 2024-04-16 | ContinUse Biometrics Ltd. | System and method for depth flow inspection |
| US20240111046A1 (en) * | 2019-11-12 | 2024-04-04 | GE Precision Healthcare LLC | Method and system for flow processing on channel data for application of nonlinear beamforming |
| CN111397697B (en) * | 2020-04-08 | 2021-09-17 | 河海大学常州校区 | Water level ultrasonic detection method |
| WO2022171465A1 (en) | 2021-02-11 | 2022-08-18 | Koninklijke Philips N.V. | Apparatuses, systems and methods for providing acquisition feedback |
Citations (1)
| Publication number | Priority date | Publication date | Assignee | Title |
|---|---|---|---|---|
| KR950006432A (en) * | 1993-08-25 | 1995-03-21 | 남상룡 | Ultrasonic Flow Measurement Method and Device |
Family Cites Families (18)
| Publication number | Priority date | Publication date | Assignee | Title |
|---|---|---|---|---|
| US4265126A (en) * | 1979-06-15 | 1981-05-05 | General Electric Company | Measurement of true blood velocity by an ultrasound system |
| US5291892A (en) | 1991-11-04 | 1994-03-08 | General Electric Company | Ultrasonic flow imaging |
| US5349524A (en) | 1993-01-08 | 1994-09-20 | General Electric Company | Color flow imaging system utilizing a time domain adaptive wall filter |
| GB9309861D0 (en) | 1993-05-13 | 1993-06-23 | Univ Hospital London Dev Corp | Ultrasonic blood volume flow rate meter |
| US5398216A (en) | 1993-08-30 | 1995-03-14 | General Electric Company | Method for detecting two-dimensional flow for ultrasound color flow imaging |
| US6029116A (en) * | 1994-08-05 | 2000-02-22 | Acuson Corporation | Method and apparatus for a baseband processor of a receive beamformer system |
| US5617862A (en) * | 1995-05-02 | 1997-04-08 | Acuson Corporation | Method and apparatus for beamformer system with variable aperture |
| US5573001A (en) * | 1995-09-08 | 1996-11-12 | Acuson Corporation | Ultrasonic receive beamformer with phased sub-arrays |
| US5793883A (en) * | 1995-09-29 | 1998-08-11 | Siemens Medical Systems, Inc. | Method for enhancing ultrasound image |
| US5682896A (en) | 1996-03-28 | 1997-11-04 | Diasonics Ultrasound, Inc. | Method and apparatus for generating volume flow measurement |
| EP0839497A1 (en) * | 1996-11-01 | 1998-05-06 | EndoSonics Corporation | A method for measuring volumetric fluid flow and its velocity profile in a lumen or other body cavity |
| US6193659B1 (en) * | 1997-07-15 | 2001-02-27 | Acuson Corporation | Medical ultrasonic diagnostic imaging method and apparatus |
| US5967987A (en) | 1997-12-18 | 1999-10-19 | Acuson Corporation | Ultrasonic system and method for measurement of fluid flow |
| US6186949B1 (en) * | 1998-03-31 | 2001-02-13 | General Electric Company | Method and apparatus for three-dimensional flow imaging using coded excitation |
| US5934288A (en) | 1998-04-23 | 1999-08-10 | General Electric Company | Method and apparatus for displaying 3D ultrasound data using three modes of operation |
| US6213946B1 (en) * | 1998-12-24 | 2001-04-10 | Agilent Technologies, Inc. | Methods and apparatus for speckle reduction by orthogonal pulse compounding in medical ultrasound imaging |
| US6245016B1 (en) * | 1999-03-12 | 2001-06-12 | General Electric Company | Ultrasound imaging system having post-beamformer signal processing using deconvolution algorithm |
| US6213947B1 (en) * | 1999-03-31 | 2001-04-10 | Acuson Corporation | Medical diagnostic ultrasonic imaging system using coded transmit pulses |
-
2000
- 2000-01-31 US US09/495,231 patent/US6535835B1/en not_active Expired - Lifetime
-
2001
- 2001-01-26 EP EP20010300701 patent/EP1121901A3/en not_active Withdrawn
- 2001-01-30 JP JP2001020888A patent/JP4716346B2/en not_active Expired - Fee Related
- 2001-01-30 KR KR1020010004211A patent/KR100737029B1/en not_active IP Right Cessation
- 2001-01-31 CN CNB011033274A patent/CN1222757C/en not_active Expired - Lifetime
Patent Citations (1)
| Publication number | Priority date | Publication date | Assignee | Title |
|---|---|---|---|---|
| KR950006432A (en) * | 1993-08-25 | 1995-03-21 | 남상룡 | Ultrasonic Flow Measurement Method and Device |
Non-Patent Citations (1)
| Title |
|---|
| 공개특허1995-6432호 |
Also Published As
| Publication number | Publication date |
|---|---|
| US6535835B1 (en) | 2003-03-18 |
| CN1332360A (en) | 2002-01-23 |
| EP1121901A2 (en) | 2001-08-08 |
| JP4716346B2 (en) | 2011-07-06 |
| JP2001258887A (en) | 2001-09-25 |
| EP1121901A3 (en) | 2002-08-07 |
| EP1121901A9 (en) | 2002-06-12 |
| KR20010087166A (en) | 2001-09-15 |
| CN1222757C (en) | 2005-10-12 |
Similar Documents
| Publication | Publication Date | Title |
|---|---|---|
| KR100737029B1 (en) | Angle independent ultrasound volume flow measurement | |
| EP1122556A2 (en) | Enhanced tissue-generated harmonic imaging using coded excitation | |
| US9351707B2 (en) | Methods and apparatus to determine shear wave propagation property | |
| JP5882447B2 (en) | Ultrasonic imaging method and ultrasonic imaging apparatus | |
| US5910119A (en) | Ultrasonic color doppler velocity and direction imaging | |
| US10359515B2 (en) | Angle independent velocity spectrum determination | |
| Jensen et al. | Directional synthetic aperture flow imaging | |
| EP2830508B1 (en) | Methods and apparatus for ultrasound imaging | |
| US9211111B2 (en) | Determination of shear wave characteristics | |
| US20200037994A1 (en) | Device and method for generating ultrasound vector doppler image using plane wave synthesis | |
| EP1021129B1 (en) | Ultrasound imaging for displaying strain | |
| Rubin et al. | Volume flow measurement using Doppler and grey-scale decorrelation | |
| WO2013147297A1 (en) | Methods and apparatus for ultrasound imaging | |
| US20230329670A1 (en) | Ultrasonic measurement of vessel stenosis | |
| Li et al. | Doppler angle estimation using correlation | |
| Jensen | Algorithms for estimating blood velocities using ultrasound | |
| JP3357000B2 (en) | Ultrasound diagnostic equipment | |
| ECKERSLEY¹ et al. | Methodology for imaging time-dependent phenomena | |
| Tuthill et al. | Three-dimensional flow vectors from rf ultrasound signals | |
| Jensen et al. | Imaging blood's velocity using synthetic aperture ultrasound | |
| Udesen et al. | Blood vector velocity estimation using an autocorrelation approach: In vivo Investigation |
Legal Events
| Date | Code | Title | Description |
|---|---|---|---|
| N231 | Notification of change of applicant | ||
| A201 | Request for examination | ||
| E701 | Decision to grant or registration of patent right | ||
| GRNT | Written decision to grant | ||
| FPAY | Annual fee payment |
Payment date: 20120622 Year of fee payment: 6 |
|
| FPAY | Annual fee payment |
Payment date: 20130624 Year of fee payment: 7 |
|
| LAPS | Lapse due to unpaid annual fee |