JP7559639B2 - Analysis device, method, and program - Google Patents
Analysis device, method, and program Download PDFInfo
- Publication number
- JP7559639B2 JP7559639B2 JP2021046464A JP2021046464A JP7559639B2 JP 7559639 B2 JP7559639 B2 JP 7559639B2 JP 2021046464 A JP2021046464 A JP 2021046464A JP 2021046464 A JP2021046464 A JP 2021046464A JP 7559639 B2 JP7559639 B2 JP 7559639B2
- Authority
- JP
- Japan
- Prior art keywords
- time series
- series data
- groundwater
- periodic component
- components
- Prior art date
- Legal status (The legal status is an assumption and is not a legal conclusion. Google has not performed a legal analysis and makes no representation as to the accuracy of the status listed.)
- Active
Links
- 238000004458 analytical method Methods 0.000 title claims description 125
- 238000000034 method Methods 0.000 title claims description 29
- 230000000737 periodic effect Effects 0.000 claims description 92
- 239000003673 groundwater Substances 0.000 claims description 75
- 238000006073 displacement reaction Methods 0.000 claims description 73
- 230000005484 gravity Effects 0.000 claims description 60
- 238000000605 extraction Methods 0.000 claims description 31
- 238000004364 calculation method Methods 0.000 claims description 14
- 239000000284 extract Substances 0.000 claims description 11
- 230000008569 process Effects 0.000 claims description 8
- 238000013500 data storage Methods 0.000 description 47
- 230000007774 longterm Effects 0.000 description 40
- 230000010287 polarization Effects 0.000 description 8
- 238000004891 communication Methods 0.000 description 7
- 230000006870 function Effects 0.000 description 6
- 230000015654 memory Effects 0.000 description 5
- 238000010586 diagram Methods 0.000 description 4
- 238000005305 interferometry Methods 0.000 description 4
- 238000012545 processing Methods 0.000 description 4
- XLYOFNOQVPJJNP-UHFFFAOYSA-N water Substances O XLYOFNOQVPJJNP-UHFFFAOYSA-N 0.000 description 4
- 230000008859 change Effects 0.000 description 3
- 230000000875 corresponding effect Effects 0.000 description 3
- 230000001932 seasonal effect Effects 0.000 description 3
- 239000004065 semiconductor Substances 0.000 description 3
- 238000012731 temporal analysis Methods 0.000 description 3
- 238000000700 time series analysis Methods 0.000 description 3
- 239000013598 vector Substances 0.000 description 3
- 238000007726 management method Methods 0.000 description 2
- 230000003287 optical effect Effects 0.000 description 2
- PEDCQBHIVMGVHV-UHFFFAOYSA-N Glycerine Chemical compound OCC(O)CO PEDCQBHIVMGVHV-UHFFFAOYSA-N 0.000 description 1
- 238000005311 autocorrelation function Methods 0.000 description 1
- 239000003086 colorant Substances 0.000 description 1
- 230000002596 correlated effect Effects 0.000 description 1
- 238000005553 drilling Methods 0.000 description 1
- 238000005516 engineering process Methods 0.000 description 1
- 230000003993 interaction Effects 0.000 description 1
- 238000005259 measurement Methods 0.000 description 1
- 238000012986 modification Methods 0.000 description 1
- 230000004048 modification Effects 0.000 description 1
- 238000012544 monitoring process Methods 0.000 description 1
- 239000013307 optical fiber Substances 0.000 description 1
- 230000001151 other effect Effects 0.000 description 1
- 239000007787 solid Substances 0.000 description 1
- 238000001228 spectrum Methods 0.000 description 1
- 230000003068 static effect Effects 0.000 description 1
Images


Landscapes
- Geophysics And Detection Of Objects (AREA)
- Radar Systems Or Details Thereof (AREA)
Description
本開示は、解析装置、方法、及びプログラムに関する。 This disclosure relates to an analysis device, method, and program.
地下水領域の探査及び把握は、地下資源探索、利用計画立案及び施策推進、農地利用、工農業地帯でのリスク管理、並びに水管理施設等の漏水監視において重要である。関連技術における探査は、電気探査(比抵抗法等)、地震探査、電磁探査、放射能探査、及びボーリング調査を含む。これら探索は、候補地に赴いて行う観測を行う必要があり、広範囲でかつ高分解能の調査を行うためには人員と時間が必要であった。 Exploring and understanding groundwater areas is important for underground resource exploration, utilization planning and policy promotion, agricultural land use, risk management in industrial and agricultural areas, and water leakage monitoring of water management facilities. Related exploration techniques include electrical exploration (resistivity method, etc.), seismic exploration, electromagnetic exploration, radioactivity exploration, and drilling surveys. These explorations require observations to be conducted at candidate sites, and manpower and time are required to conduct wide-area, high-resolution surveys.
関連技術として、特許文献1は、合成開口レーダ(SAR:Synthetic Aperture Radar)技術を用いた地下水領域探査法を開示する。SARは、人工衛星や飛行機などの飛翔体が移動しながら電波を送受信することで、大きな開口を持つアンテナの場合と等価な観測画像が得られる技術である。SARは、例えば、地表からの反射波を信号処理することで、地表の起伏や構造物などを画像化するために利用される。SARは、およそ数百km四方の範囲を、数mから数百mの水平分解能で観測する。特許文献1には、SARの2偏波以上の複数の偏波観測を利用することが記載されている。特許文献1では、ある偏波中の電磁雑音を別の偏波観測で得られる情報を用いて除去し、電気比抵抗値を求めることで、地下水領域が推定される。 As a related technique, Patent Document 1 discloses a method for exploring groundwater areas using synthetic aperture radar (SAR) technology. SAR is a technique that obtains observation images equivalent to those obtained by an antenna with a large aperture by transmitting and receiving radio waves while a flying object such as an artificial satellite or an airplane is moving. SAR is used, for example, to image the undulations and structures of the ground surface by signal processing the waves reflected from the ground surface. SAR observes an area of approximately several hundred square kilometers with a horizontal resolution of several meters to several hundred meters. Patent Document 1 describes the use of multiple polarization observations of SAR with two or more polarizations. In Patent Document 1, electromagnetic noise in one polarization is removed using information obtained from another polarization observation, and the electrical resistivity value is obtained to estimate the groundwater area.
別の関連技術として、非特許文献1は、干渉SAR(InSAR:Interferometric synthetic aperture radar)を用いて農業領域の水頭の季節変化を観測することを開示する。非特許文献1には、あらかじめ地下水領域が既知の場合において、当該領域の地下水量と相関がある水理水頭の変化量の時系列変化と、InSAR解析により得られる地表変位量の時系列変化とに、高い相関があることが示されている。 As another related technique, Non-Patent Document 1 discloses observing seasonal changes in hydraulic head in agricultural areas using an interferometric synthetic aperture radar (InSAR). Non-Patent Document 1 shows that when the groundwater area is known in advance, there is a high correlation between the time series changes in the amount of hydraulic head change, which is correlated with the groundwater volume of the area, and the time series changes in the amount of ground surface displacement obtained by InSAR analysis.
特許文献1では、SAR観測を用いることで、広範囲の地下水頭領域の探査を行うことができる。しかし、特許文献1は、複数の偏波情報を使用することを前提としている。現在利用可能な高分解能のSAR画像は、単偏波観測で得られたものが多く、地下水頭領域の探査を行うためには、独自に複数の偏波観測を行う必要がある。 In Patent Document 1, by using SAR observations, it is possible to explore a wide area of groundwater head regions. However, Patent Document 1 is premised on the use of multiple polarization information. Most of the high-resolution SAR images currently available are obtained by single polarization observations, and in order to explore groundwater head regions, it is necessary to independently conduct multiple polarization observations.
また、非特許文献1では、InSAR解析が利用されており、複数の偏波情報は必要ない。しかしながら、非特許文献1は、InSAR解析で得られる地表変位量と地下水量との相関性を示しているものの、地下水領域探査における具体的な手段を開示していない。 In addition, Non-Patent Document 1 uses InSAR analysis, and does not require multiple polarization information. However, although Non-Patent Document 1 shows the correlation between the amount of ground surface displacement obtained by InSAR analysis and the amount of groundwater, it does not disclose any specific means for exploring groundwater areas.
本開示は、上記事情に鑑み、地表変位量の時系列データから地下水含有領域を解析できる解析装置、方法、及びプログラムを提供することを目的とする。 In view of the above circumstances, the present disclosure aims to provide an analysis device, method, and program capable of analyzing groundwater-containing areas from time-series data on ground surface displacement.
上記目的を達成するために、本開示は、地表変位量の時系列データから所定周期以上の成分を除去する除去手段と、前記所定周期以上の成分が除去された時系列データから特定の周期成分を抽出する抽出手段と、前記抽出された特定の周期成分と重力周期成分との相関値を算出する相関算出手段と、前記相関値に基づいて地下水含有確率に関する解析結果を生成する解析結果生成手段とを備える解析装置を提供する。 To achieve the above object, the present disclosure provides an analysis device including a removal means for removing components with a predetermined period or more from time series data of ground surface displacement, an extraction means for extracting a specific periodic component from the time series data from which the components with the predetermined period or more have been removed, a correlation calculation means for calculating a correlation value between the extracted specific periodic component and a gravity periodic component, and an analysis result generation means for generating an analysis result regarding the probability of groundwater inclusion based on the correlation value.
本開示は、また、地表変位量の時系列データから所定周期以上の成分を除去し、前記所定周期以上の成分が除去された時系列データから特定の周期成分を抽出し、前記抽出された特定の周期成分と重力周期成分との相関値を算出し、前記相関値に基づいて地下水含有確率に関する解析結果を生成する解析方法を提供する。 The present disclosure also provides an analysis method that removes components with a predetermined period or more from time-series data of ground surface displacement, extracts a specific periodic component from the time-series data from which the components with the predetermined period or more have been removed, calculates a correlation value between the extracted specific periodic component and a gravity periodic component, and generates an analysis result regarding the probability of groundwater inclusion based on the correlation value.
本開示は、更に、地表変位量の時系列データから所定周期以上の成分を除去し、前記所定周期以上の成分が除去された時系列データから特定の周期成分を抽出し、前記抽出された特定の周期成分と重力周期成分との相関値を算出し、前記相関値に基づいて地下水含有確率に関する解析結果を生成する処理をコンピュータに実行させるためのプログラムを提供する。 The present disclosure further provides a program for causing a computer to execute a process of removing components having a period equal to or greater than a predetermined period from time series data of ground surface displacement, extracting a specific periodic component from the time series data from which the components having a period equal to or greater than the predetermined period have been removed, calculating a correlation value between the extracted specific periodic component and a gravity periodic component, and generating an analysis result regarding the probability of groundwater inclusion based on the correlation value.
本開示に係る解析装置、方法、及びプログラムは、地表変位量の時系列データから地下水含有領域を解析できる。 The analysis device, method, and program disclosed herein can analyze groundwater-containing areas from time-series data on ground surface displacement.
本開示の実施形態の説明に先立って、本開示の概要を説明する。図1は、本開示の解析装置の概略的な構成を示す。解析装置10は、除去手段11、抽出手段12、相関算出手段13、及び解析結果生成手段14を有する。
Before describing the embodiments of the present disclosure, an overview of the present disclosure will be described. FIG. 1 shows a schematic configuration of an analysis device of the present disclosure. The
除去手段11は、地表変位量の時系列データから所定周期以上の成分を除去する。抽出手段12は、所定周期以上の成分が除去された時系列データから特定の周期成分を抽出する。相関算出手段13は、抽出された特定の周期成分と重力周期成分との相関値を算出する。解析結果生成手段14は、相関値に基づいて地下水含有確率に関する解析結果を生成する。 The removal means 11 removes components with a predetermined period or more from the time series data of the ground surface displacement. The extraction means 12 extracts a specific periodic component from the time series data from which the components with a predetermined period or more have been removed. The correlation calculation means 13 calculates a correlation value between the extracted specific periodic component and the gravity periodic component. The analysis result generation means 14 generates an analysis result regarding the groundwater inclusion probability based on the correlation value.
本開示では、地表変位量の時系列データから所定周期以上の長期トレンド成分が除去され、長期トレンド成分が除去された時系列データから特定の周期成分が抽出される。さらに、抽出された特定の周期成分と重力周期成分との相関値が計算され、相関値に基づいて地下水含有確率に関する解析結果が生成される。本開示では、相対量である周期成分が解析されるため、観測装置固有のノイズや地下水以外の地表変化などの阻害を受けずに、地表変位量の時系列データから、地下水を含有しているか否かを示す解析結果を生成することができる。 In the present disclosure, long-term trend components of a predetermined period or more are removed from the time series data of the amount of ground surface displacement, and a specific periodic component is extracted from the time series data from which the long-term trend components have been removed. Furthermore, a correlation value between the extracted specific periodic component and the gravity periodic component is calculated, and an analysis result regarding the probability of groundwater inclusion is generated based on the correlation value. In the present disclosure, because the periodic component, which is a relative amount, is analyzed, an analysis result indicating whether or not groundwater is included can be generated from the time series data of the amount of ground surface displacement, without being hindered by noise specific to the observation device or surface changes other than groundwater.
以下、図面を参照しつつ、本開示の実施の形態を詳細に説明する。図2は、本開示の第1実施形態に係る解析装置を示す。解析装置100は、地下水領域解析部101、時系列データ保存部201、重力周期データ保存部202、及び出力部210を有する。地下水領域解析部101は、時系列データ取得部111、重力周期データ取得部112、長期トレンド除去部113、中短期周期抽出部114、マッチング部115、及び解析結果生成部116を有する。解析装置100は、図1の解析装置10に対応する。
Below, an embodiment of the present disclosure will be described in detail with reference to the drawings. FIG. 2 shows an analysis device according to a first embodiment of the present disclosure. The
時系列データ保存部201は、地表変位量の時系列データを保存する。時系列データ保存部201は、例えば所定範囲(注目領域)内の複数の地点のそれぞれにおける地表変位量の時系列データを保存する。時系列データ保存部201は、例えば、地表変位量の時系列データを保存するデータベースとして構成される。地表変位量の時系列データは、例えば、複数の観測日時のSAR画像(時系列観測データ)に対して干渉解析を行うことにより作成される。時系列データ保存部201は、例えば、SAR画像内の所定の領域の各画素(各地点)について、地表変位量の時系列データを保存する。
The time series
重力周期データ保存部202は、重力周期データを保存する。ここで、重力周期データとは、重力の大きさと日時との関係を表すデータを示す。重力周期データは、例えば潮位などの時系列データである。あるいは、重力周期データは、日時を変数とし、その日時での重力の大きさを計算するための計算式のパラメータであってもよい。重力周期データ保存部202は、例えば、重力周期データを保存するデータベースとして構成される。重力周期データ保存部202は、例えば地表変位量の時系列データが作成される各地点に対して、重力周期データを保存する。あるいは、重力周期データ保存部202は、SAR画像を複数の局所領域に分割した場合の各局所領域に対して、重力周期データを保存してもよい。
The gravity period
ここで、重力周期データは、例えば地球と月などの衛星との相互作用により生じる潮汐を示すデータを含む。重力周期データは、地球と他の惑星や恒星との重力摂動を示すデータを含んでいてもよい。潮汐は、惑星の自転に由来する一日から半日周期のものや、衛星の公転に由来する数日程度の周期のものを含む。重力周期データ保存部202は、重力周期データそのものではなく、種々の地球物理現象のうち、重力周期データと高い相関を持つことが知られている現象を示すデータを保存していてもよい。重力周期データは、例えば人工衛星などや沿岸河川に設置された水位計などを用いて観測された実測値、或いは、数値計算モデルを用いて算出されたモデル値を含んでいてもよい。
Here, the gravitational period data includes data indicating tides caused by interactions between the Earth and a satellite such as the Moon. The gravitational period data may also include data indicating gravitational perturbations between the Earth and other planets or stars. Tides include those with a period of one day to half a day caused by the rotation of a planet, and those with a period of about several days caused by the revolution of a satellite. The gravitational period
時系列データ保存部201及び重力周期データ保存部202は、例えば、HDD(Hard disk drive)、SSD(Solid State Drive)、又はメモリなどの物理的な記憶装置を含む。時系列データ保存部201及び重力周期データ保存部202は、時系列データ保存部201及び重力周期データ保存部202は、地下水領域解析部101からアクセス可能であればよく、必ずしも解析装置100の一部を構成する必要はない。例えば、時系列データ保存部201及び重力周期データ保存部202は、地下水領域解析部101にネットワークを介して接続されたデータサーバに配置されていてもよい。
The time series
地下水領域解析部101は、時系列データ保存部201に保存された注目領域のそれぞれの地点に対する地表変位量の時系列データと、重力周期データ保存部202に保存された重力周期データとに基づいて、注目領域における地下水含有領域を推定する。地下水領域解析部101は、推定結果が反映された注目領域の地図を表す画像を生成し、生成した画像を出力部210に出力する。地下水領域解析部101の機能は、例えば、プログラムを実行する1つ又は複数のCPU(Central Processing Unit)を用いて実現され得る。
The groundwater
時系列データ取得部111は、時系列データ保存部201から地表変位量の時系列データを読み出す。時系列データ取得部111は、時系列データ保存部201から、例えば注目領域内の複数の地点のそれぞれについて地表変位量の時系列データを読み出す。時系列データ取得部111は、例えばインターネットなどのネットワークを介して、時系列データ保存部201から時系列データを取得してもよい。時系列データ取得部111は、読み出した地表変位量の時系列データを長期トレンド除去部113に出力する。
The time series
重力周期データ取得部112は、重力周期データ保存部202から注目領域に関連する重力周期データを読み出す。重力周期データ取得部112は、読み出した重力周期データをマッチング部115に出力する。重力周期データ取得部112は、例えば時系列データ取得部111が取得した時系列データに対応した地点の重力周期データを重力周期データ保存部202から読み出す。
The gravity period
長期トレンド除去部113は、地表変位量の時系列データから所定周期以上の周期成分やトレンドを除去する。ここで、所定周期とは、例えば潮汐や重力摂動の周期に対して十分長い周期を指し、例えばそれらの10倍以上の周期を指す。以下では、地表変位量の時系列データから所定周期以上の周期成分やトレンドを除去する処理を、長期トレンド除去処理とも呼ぶ。長期トレンド除去部113は、時系列データ取得部111が複数の地点の時系列データを読み出した場合、それら複数の地点の時系列データのそれぞれから長期トレンド成分を除去する。長期トレンド除去部113は、図1の除去手段11に対応する。
The long-term
図3(a)は、長期トレンド除去処理前の地表変位量の時系列データを示し、(b)は、長期トレンド除去処理後の地表変位量の時系列データを示す。図3(a)及び(b)において、横軸は時間を表し、縦軸はある地点における地表変位量を表す。地表変位量の時系列データは、物理的要因に基づく中短期周期成分に加えて、気候トレンド又は季節変動などの比較的長い周期の成分(長期トレンド成分)を含む。長期トレンド除去部113は、地表変位量の時系列データに対して時系列解析を行い、時系列データから、例えば図3(a)中に点線で示される長期的に変動する成分を除去する。
Figure 3 (a) shows the time series data of the amount of ground surface displacement before the long-term trend removal process, and (b) shows the time series data of the amount of ground surface displacement after the long-term trend removal process. In Figures 3 (a) and (b), the horizontal axis represents time, and the vertical axis represents the amount of ground surface displacement at a certain point. The time series data of the amount of ground surface displacement includes components with relatively long periods (long-term trend components) such as climate trends or seasonal fluctuations, in addition to medium- to short-term periodic components based on physical factors. The long-term
長期トレンド成分は、例えば数か月単位又は年単位で増加又は減少する成分や、所定周期以上の成分を含む。長期トレンド成分は、地下水含有領域推定のための解析の阻害要因となる。長期トレンド成分の除去の方法として、例えば、地表変位量の移動平均を算出し、地表変位量の時系列データとの差分をとる方法、或いは、任意の期間ごとに回帰直線を求める方法などが挙げられる。長期トレンド成分を除去する方法は特に例示したものには限定されず、一般的な時系列解析を用いた別の手法が用いられてもよい。 Long-term trend components include components that increase or decrease on a monthly or yearly basis, or components with a certain period or longer. Long-term trend components are an impediment to analysis for estimating groundwater-containing areas. Methods for removing long-term trend components include, for example, calculating a moving average of the amount of ground surface displacement and taking the difference from the time series data of the amount of ground surface displacement, or finding a regression line for each arbitrary period. The method for removing long-term trend components is not limited to the examples given above, and another method using general time series analysis may be used.
長期トレンド除去部113は、例えば地点ごとに(画素単位で)長期トレンド成分を推定する。あるいは、一般的に、長期トレンド成分は局所的な変化が少ないと考えられるため、長期トレンド除去部113は、地表変位量の時系列データを任意の領域ごとに平均化し、平均化された時系列データから長期トレンド成分を推定してもよい。長期トレンド除去部113は、長期トレンド成分が除去された時系列データを中短期周期抽出部114に出力する。
The long-term
中短期周期抽出部114は、長期トレンド成分が除去された地表変位量の時系列データから特定の周期成分を抽出する。ここで、特定の周期成分とは、例えば潮汐や重力摂動に対応した周期成分を指す。特定の周期成分は、長期トレンド成分に比べて周期が短い中短期周期成分である。中短期周期抽出部114は、例えば、所定範囲の複数の地点について、長期トレンド成分が除去された時系列データから中短期周期成分を抽出する。中短期周期抽出部114は、図1の抽出手段12に対応する。
The short- and medium-term
中短期周期抽出部114は、例えば地表変位量の時系列データに対してフーリエ変換を行い、中短期周期成分を抽出する。例えば、一次元の時系列データを対象とした場合、対象の時系列データをf(t)、角周波数をω=2nfとした場合、フーリエ変換式は下記式で表される。
![]()
![]()
中短期周期抽出部114は、フーリエ変換を用いる場合、画素ごとの地表変位量の一次元ベクトルに対して一次元フーリエ変換を行う。あるいは、中短期周期抽出部114は、画像全体や画像の任意の局所領域に対応する画素に対して、横軸が時間、縦軸が画素番号になるように時系列データを配列化し、二次元の画像のようにすることで二次元フーリエ変換を行ってもよい。
When using a Fourier transform, the medium- to short-term
上記中短期周期成分は、例えば周波数スペクトルの形で表される。あるいは、中短期周期成分は、各画素に対して1以上の周期の数値を格納した配列の形で表されてもよい。中短期周期抽出部114は、時系列データから特定の周期成分を抽出すればよく、その抽出手法は特に上記したものには限定されない。中短期周期抽出部114は、例えば自己相関関数を使用した手法を用いて、特定の周期成分を抽出してもよい。中短期周期抽出部114は、抽出した中短期周期成分から、数時間程度の短い周期を雑音として除去してもよい。中短期周期抽出部114は、抽出した中短期周期成分を、マッチング部115に出力する。
The short-term and medium-term periodic components are expressed, for example, in the form of a frequency spectrum. Alternatively, the short-term and medium-term periodic components may be expressed in the form of an array in which one or more periodic values are stored for each pixel. The short-term and medium-term
マッチング部115は、中短期周期抽出部114が抽出した中短期期成分と、重力周期データ取得部112が取得した重力周期データとの相関値を算出する。マッチング部115は、例えば、フーリエ変換を行うことで抽出された中短期周期成分に対して逆フーリエ変換を行い、中短期周期成分を表す時系列データと、重力周期データとの相関値を算出する。この相関値は、時系列データの中短期周期成分と重力周期成分との類似度を示す。マッチング部115は、相関値の算出では、時系列データの中短期周期成分の振幅、及び重力周期データの振幅をそれぞれ正規化する。マッチング部115は、時間範囲などの他の条件も揃えた上で、時系列データの中短期周期成分と重力周期データとの相関値を算出する。マッチング部115は、例えば、所定範囲の複数の地点について、抽出された中短期周期成分と重力周期成分との相関値を算出する。マッチング部115は、図1の相関算出手段13に対応する。
The
マッチング部115は、例えば、画素ごと、又は局所領域ごとに、時系列データの中短期周期成分と重力周期成分との共分散と標準偏差とを算出する。例えば、ある任意の領域内の時系列データの中短期周期成分をX、重力周期成分Yとし、その共分散をσXY、標準偏差をσX、σYとすると、相関値は、下記式で表される。
![]()
![]()
マッチング部115は、例えば任意のサイズの小領域を機械的に切り出し、切り出した領域ごとに相関値を算出してもよい。あるいは、マッチング部115は、時系列データの類似度に基づいて各地点(画素)をクラスタリングし、クラスタごとに相関値を算出してもよい。類似度の計算手法は上記したものには特に限定されず、マッチング部115は、時系列データの中短期周期成分と重力周期成分との類似度を算出できる他の計算手法を用いて、類似度を示す指標を計算してもよい。例えば、マッチング部115は、各画素における時系列データの中短期周期成分と重力周期成分とをそれぞれ一次元ベクトルとした場合のコサイン類似度を計算してもよい。
The
ここで、地下水を含有する土地(地盤)は、潮汐などの重力摂動の影響を受け、重力摂動の周期で微小に変動する。このため、重力周期成分と高い相関を示した地点は、地下水を含有している確率が高い。解析結果生成部116は、マッチング部115が算出した相関値に基づいて、地下水含有確率に関する解析結果を生成する。解析結果生成部116は、算出された相関値そのものを解析結果としてもよい。解析結果生成部116は、例えば相関値に基づいて、地下水含有確率を示す地下水含有領域画像を生成する。地下水含有領域画像において、相関値が高い領域は、地下水を含有している確率が高い領域を示す。
Here, land (ground) containing groundwater is affected by gravitational perturbations such as tides, and fluctuates minutely with the period of the gravitational perturbation. Therefore, points that show a high correlation with the gravitational period component have a high probability of containing groundwater. The analysis
解析結果生成部116は、例えば、注目領域内の複数の地点について、相関値に基づいて、地下水含有確率に関連する指標(例えばスコア)を算出してもよい。解析結果生成部116は、算出したスコアを、地下水含有領域画像の各画素の画素値に変換してもよい。あるいは、解析結果生成部116は、任意の複数の地点(画素)について算出された相関値から内挿して各画素の画素値を決定してもよい。解析結果生成部116は、例えば、注目領域の地図上に、各画素に対する相関値の値を反映した画像を地下水含有領域画像として生成してもよい。別の言い方をすれば、解析結果生成部116は、注目領域の地図を表す画像に、スコアを表す画像を重ねた画像を地下水含有領域画像として生成してもよい。
The analysis
解析結果生成部116は、例えば、カラーマップを使用し、相関値の大きさの違いを色の違いで表現した画像を、地下水含有領域画像として生成してもよい。解析結果生成部116は、相関値を直接スコアとしてカラーマップに適用してもよいし、相関値を所定の関数でスコア化し、スコアをカラーマップに適用してもよい。解析結果生成部116は、生成した地下水含有領域画像を出力部210に出力する。解析結果生成部116は、図1の解析結果生成手段14に対応する。
The analysis
出力部210は、地下水領域解析部101が生成した解析結果を出力する。出力部210は、例えば地下水領域解析部101が生成した地下水含有領域画像を出力する。出力部210は、ディスプレイ、プリンタ、画像データを保持するハードディスク装置やメモリカードなどの記憶媒体、及びそれらが接続されるネットワークなどを用いて実現される。出力部210は、画像の表示や蓄積或いは伝送を行う。出力部210の機能は、例えば、プログラムを実行する1つ又は複数のCPUを用いて実現され得る。
The
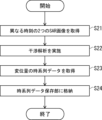
続いて、本実施形態における動作手順(解析方法)を説明する。図4は、地下水領域解析部101における動作手順を示す。時系列データ取得部111は、時系列データ保存部201から地表変位量の時系列データを取得する(ステップS11)。時系列データ取得部111は、取得した時系列データを長期トレンド除去部113に出力する。
Next, the operation procedure (analysis method) in this embodiment will be described. FIG. 4 shows the operation procedure in the groundwater
長期トレンド除去部113は、例えば地表変位量の時系列データに対して時系列解析を行うことで、時系列データから長期的に変動する成分(長期トレンド成分)を除去する(ステップS12)。長期トレンド除去部113は、長期トレンド成分が除去された時系列データを中短期周期抽出部114に出力する。中短期周期抽出部114は、長期トレンドが除去された時系列データから中短期周期成分を抽出する(ステップS13)。中短期周期抽出部114は、ステップS13では、例えばフーリエ変換を用いて時系列データを周波数領域のデータに変換し、変換された周波数領域のデータから中短期周期成分を抽出する。中短期周期抽出部114は、抽出した中短期周期成分をマッチング部115に出力する。
The long-term
重力周期データ取得部112は、重力周期データ保存部202から重力周期データを取得する(ステップS14)。重力周期データ取得部112は、取得した重力周期データをマッチング部115に出力する。マッチング部115は、ステップS13で抽出された中短期周期成分と、ステップS14で取得された重力周期データとの相関値を計算する(ステップS15)。マッチング部115は、ステップS15では、例えば、ステップS13において周波数領域のデータから抽出された中短期周期成分を、逆フーリエ変換により時間領域のデータに変換する。マッチング部115は、時間領域のデータに変換された中短期周期成分と重力周期データとの相関値を計算する。マッチング部115は、計算した相関値を解析結果生成部116に出力する。
The gravity period
解析結果生成部116は、ステップS15で計算された相関値に基づいて、地下水含有領域画像を生成する(ステップS16)。解析結果生成部116は、生成した地下水含有領域画像を出力部210に出力する。出力部210は、ステップS16で生成された地下水含有領域画像を出力する(ステップS17)。出力部210は、ステップS17では、例えばディスプレイ装置に地下水含有領域画像を表示する。
The analysis
本実施形態では、長期トレンド除去部113は、地表変位量の時系列データから長期トレンド成分を除去する。中短期周期抽出部114は、長期トレンド成分が除去された時系列データから中短期周期成分を抽出する。マッチング部115は、中短期周期成分と重力周期成分との相関値を算出する。解析結果生成部116は、相関値に基づいて地下水含有領域画像を生成する。本実施形態では、マッチング部115において、相対量である周期成分の相関値を算出する。このため、観測装置固有のノイズや地下水以外に起因する地表変化などの阻害を受けずに、地表変位量の時系列データから地下水含有領域を解析することができる。従って、解析装置100は、異なる衛星を用いて観測されたSARデータから得られる地表変位量がセンサ依存性を有している場合であっても、安定的に地下水含有確率の推定値を得ることができる。
In this embodiment, the long-term
次いで、本開示の第2実施形態を説明する。図5は、本開示の第2実施形態に係る解析装置を示す。本実施形態に係る解析装置100aは、図2に示される解析装置100の構成要素に加えて、時系列データ生成部102及びSARデータ保存部203を有する。時系列データ生成部102の機能は、例えば、プログラムを実行する1つ又は複数のCPUを用いて実現される。
Next, a second embodiment of the present disclosure will be described. FIG. 5 shows an analysis device according to the second embodiment of the present disclosure. The
SARデータ保存部203は、SARの観測データを保存する。SARデータ保存部203は、例えばメモリやハードディスクなどの補助記憶装置を有し、補助記憶装置にSARの観測データを記憶する。SARデータ保存部203は、観測日時が異なる複数の観測データを記憶する。各観測データは、2次元の位相情報を含む画像データとして構成される。位相は、レーダ信号の遅延量を表し、位相情報は複素数データとして表され得る。SARデータ保存部203は、観測データが蓄積されるデータベースとして構成される。
The SAR
時系列データ生成部(時系列データ生成手段)102は、SARデータ保存部203からSARの観測データを取得し、地表変位量の時系列データを生成する。なお、SARデータ保存部203は、時系列データ生成部102からアクセス可能であればよく、必ずしも解析装置100aの一部である必要はない。SARデータ保存部203は、外部のデータサーバとして構成されていてもよく、時系列データ生成部102は、ネットワークを介してSARデータ保存部203にアクセスしてもよい。
The time series data generating unit (time series data generating means) 102 acquires SAR observation data from the SAR
時系列データ生成部102は、SARデータ取得部121、干渉解析部122、及び時系列データ出力部123を有する。SARデータ取得部121は、SARデータ保存部203からSARデータを読み出し、時系列観測データを生成する。ここで、時系列観測データは、SARによって得られる、異なる2観測日時以上の観測データを結合したデータである。時系列データ生成部102は、生成したSARの時系列観測データを干渉解析部122に出力する。
The time series
干渉解析部122は、SARの時系列観測データに基づいて、各画素における地表の変位量を算出する。干渉解析部122は、時系列観測データに対して差分干渉解析を実施し、各画素における地表の変位量を算出する。差分干渉処理では、2つの観測日時の間に生じた地表の変位量が解析される。変位量は、例えば衛星から地表を見たときの視線(LOS:Line of Sight)方向の変位として検出される。
The
一般的に、SARには、Cバンド(波長37.5mm~75mm)のレーダやLバンド(波長150mm~300mm)のレーダが用いられる。SARに、Xバンド(波長24mm~37.5mm)のレーダが用いられてもよい。差分干渉解析において、検出可能な変位量は、用いられる波長の1/10~1/20である。差分干渉処理による解析結果は、一般的に、位相差画像(インターフェログラム)として出力される。算出される変位量は、例えば位相差画像として表される。あるいは、算出される変位量は、位相アンラッピング処理を行うことによりLOS方向の変位量に変換された画像として表されてもよい。 Generally, C-band (wavelength 37.5 mm to 75 mm) radar or L-band (wavelength 150 mm to 300 mm) radar is used for SAR. X-band (wavelength 24 mm to 37.5 mm) radar may also be used for SAR. In differential interferometry analysis, the detectable displacement amount is 1/10 to 1/20 of the wavelength used. The analysis result by differential interferometry is generally output as a phase difference image (interferogram). The calculated displacement amount is represented, for example, as a phase difference image. Alternatively, the calculated displacement amount may be represented as an image converted into the displacement amount in the LOS direction by performing phase unwrapping processing.
時系列データ出力部123は、干渉解析部122が出力する各画素における地表の変位量データを取得する。時系列データ出力部123は、取得した各画素における変位量データを観測時刻順に結合することで地表変位量の時系列データを生成する。生成される時系列データは、観測時刻をチャンネルとする画像の形であってもよく、或いは、画素ごとのベクトルの形であってもよい。時系列データ出力部123は、生成した時系列データを時系列データ保存部201に記憶する。
The time series
続いて、時系列データ生成部102の動作手順を説明する。図6は、時系列データ生成の動作手順を示す。SARデータ取得部121は、SARデータ保存部203から、相互に異なる時刻に観測された、同一領域についての複数のSAR観測データ(SAR画像)を取得する(ステップS21)。SARデータ取得部121は、例えばある観測日時に取得されたSAR画像と、別の観測日時に取得されたSAR画像とを取得する。
Next, the operation procedure of the time series
干渉解析部122は、ステップS21で取得された複数の観測データに対して干渉解析を行い、各画素における変位量を算出する(ステップS22)。時系列データ出力部123は、ステップS22で算出された各画素における変位量を観測時間に従って統合し、地表変位量の時系列データを生成する(ステップS23)。時系列データ出力部123は、生成した地表変位量の時系列データを時系列データ保存部201に格納する(ステップS24)。
The
本実施形態において、地下水領域解析部101は、時系列データ保存部201から、時系列データ生成部102が生成した地表変位量の時系列データを読み出す。本実施形態における地下水領域解析部101の動作は、第1実施形態において説明した動作と同様でよい。
In this embodiment, the groundwater
本実施形態では、時系列データ生成部102は、SARデータ保存部203に保存されたSAR観測データに基づいて、地表変位量の時系列データを生成する。本実施形態において、地表変位量の時系列データは、単偏波観測から得られたSAR観測データから生成できる。このため、特許文献1とは異なり、複数偏波の観測データを必要とせずに、地下水含有領域を推定することができる。他の効果は、第1実施形態と同様である。
In this embodiment, the time series
続いて、解析装置の物理構成を説明する。図7は、解析装置100として用いられ得るコンピュータ装置の構成例を示す。コンピュータ装置300は、制御部(CPU)310、記憶部320、ROM(Read Only Memory)330、RAM(Random Access Memory)340、通信インタフェース(IF:Interface)350、及びユーザインタフェース360を有する。
Next, the physical configuration of the analysis device will be described. FIG. 7 shows an example of the configuration of a computer device that can be used as the
通信インタフェース350は、有線通信手段又は無線通信手段などを介して、コンピュータ装置300と通信ネットワークとを接続するためのインタフェースである。ユーザインタフェース360は、例えばディスプレイなどの表示部を含む。また、ユーザインタフェース360は、キーボード、マウス、及びタッチパネルなどの入力部を含む。
The
記憶部320は、各種のデータを保持できる補助記憶装置である。記憶部320は、必ずしもコンピュータ装置300の一部である必要はなく、外部記憶装置であってもよいし、ネットワークを介してコンピュータ装置300に接続されたクラウドストレージであってもよい。記憶部320は、例えば図2に示される時系列データ保存部201、及び重力周期データ保存部202の少なくとも1つとして用いられ得る。また、記憶部320は、図5に示されるSARデータ保存部203として用いられ得る。
The
ROM330は、不揮発性の記憶装置である。ROM330には、例えば比較的容量が少ないフラッシュメモリなどの半導体記憶装置が用いられる。CPU310が実行するプログラムは、記憶部320又はROM330に格納され得る。記憶部320又はROM330は、例えば解析装置100内の各部の機能を実現するための各種プログラムを記憶する。
上記プログラムは、様々なタイプの非一時的なコンピュータ可読媒体を用いて格納され、コンピュータ装置300に供給することができる。非一時的なコンピュータ可読媒体は、様々なタイプの実体のある記憶媒体を含む。非一時的なコンピュータ可読媒体の例は、例えばフレキシブルディスク、磁気テープ、又はハードディスクなどの磁気記録媒体、例えば光磁気ディスクなどの光磁気記録媒体、CD(compact disc)、又はDVD(digital versatile disk)などの光ディスク媒体、及び、マスクROM、PROM(programmable ROM)、EPROM(erasable PROM)、フラッシュROM、又はRAMなどの半導体メモリを含む。また、プログラムは、様々なタイプの一時的なコンピュータ可読媒体を用いてコンピュータに供給されてもよい。一時的なコンピュータ可読媒体の例は、電気信号、光信号、及び電磁波を含む。一時的なコンピュータ可読媒体は、電線及び光ファイバなどの有線通信路、又は無線通信路を介して、プログラムをコンピュータに供給できる。
The above program can be stored and supplied to the
RAM340は、揮発性の記憶装置である。RAM340には、DRAM(Dynamic Random Access Memory)又はSRAM(Static Random Access Memory)などの各種半導体メモリデバイスが用いられる。RAM340は、データなどを一時的に格納する内部バッファとして用いられ得る。CPU310は、記憶部320又はROM330に格納されたプログラムをRAM340に展開し、実行する。CPU310がプログラムを実行することで、解析装置100内の各部の機能が実現され得る。CPU310は、データなどを一時的に格納できる内部バッファを有してもよい。
RAM 340 is a volatile storage device. Various semiconductor memory devices such as DRAM (Dynamic Random Access Memory) or SRAM (Static Random Access Memory) are used for RAM 340. RAM 340 can be used as an internal buffer for temporarily storing data, etc.
以上、本開示の実施形態を詳細に説明したが、本開示は、上記した実施形態に限定されるものではなく、本開示の趣旨を逸脱しない範囲で上記実施形態に対して変更や修正を加えたものも、本開示に含まれる。 Although the embodiments of the present disclosure have been described in detail above, the present disclosure is not limited to the above-described embodiments, and the present disclosure also includes changes and modifications to the above-described embodiments that do not deviate from the spirit of the present disclosure.
例えば、上記の実施形態の一部又は全部は、以下の付記のようにも記載され得るが、以下には限られない。 For example, some or all of the above embodiments may be described as follows, but are not limited to the following:
[付記1]
地表変位量の時系列データから所定周期以上の成分を除去する除去手段と、
前記所定周期以上の成分が除去された時系列データから特定の周期成分を抽出する抽出手段と、
前記抽出された特定の周期成分と重力周期成分との相関値を算出する相関算出手段と、
前記相関値に基づいて地下水含有確率に関する解析結果を生成する解析結果生成手段とを備える解析装置。
[Appendix 1]
a removing means for removing components having a period equal to or greater than a predetermined period from the time series data of the ground surface displacement;
an extraction means for extracting a specific periodic component from the time series data from which components having a period equal to or greater than a predetermined period have been removed;
a correlation calculation means for calculating a correlation value between the extracted specific periodic component and a gravity periodic component;
and an analysis result generating means for generating an analysis result regarding the probability of groundwater inclusion based on the correlation value.
[付記2]
前記解析結果生成手段は、地下水含有確率を示す地下水含有領域画像を前記解析結果として生成する付記1に記載の解析装置。
[Appendix 2]
The analysis device according to claim 1, wherein the analysis result generating means generates, as the analysis result, a groundwater-containing area image indicating a groundwater inclusion probability.
[付記3]
前記除去手段は、所定範囲の複数の地点のそれぞれについて、前記地表変位量の時系列データから所定周期以上の成分を除去し、
前記抽出手段は、所定範囲の複数の地点のそれぞれについて、前記所定周期以上の成分が除去された時系列データから特定の周期成分を抽出し、
前記相関算出手段は、所定範囲の複数の地点について、前記抽出された特定の周期成分と重力周期成分との相関値を算出し、
前記解析結果生成手段は、所定範囲の複数の地点について、前記相関値に基づいて地下水含有確率に関連する指標を算出し、前記所定範囲の地図に、前記地下水含有確率に関連する指標を重ねた画像を、前記地下水含有領域画像として生成する付記2に記載の解析装置。
[Appendix 3]
The removing means removes components having a period equal to or longer than a predetermined period from the time-series data of the amount of ground surface displacement for each of a plurality of points within a predetermined range,
The extraction means extracts a specific periodic component from the time series data from which components having periods equal to or greater than the predetermined period have been removed for each of a plurality of points within a predetermined range;
the correlation calculation means calculates a correlation value between the extracted specific periodic component and a gravity periodic component for a plurality of points within a predetermined range;
The analysis device described in Appendix 2, wherein the analysis result generating means calculates an index related to the groundwater inclusion probability for a plurality of points within a specified range based on the correlation value, and generates an image in which the index related to the groundwater inclusion probability is overlaid on a map of the specified range as the groundwater inclusion area image.
[付記4]
前記相関算出手段は、前記抽出された特定の周期成分と前記重力周期成分との共分散及び標準偏差とを算出し、該算出した共分散及び標準偏差に基づいて前記相関値を計算する付記1から3何れか1つに記載の解析装置。
[Appendix 4]
The analysis device according to any one of appendices 1 to 3, wherein the correlation calculation means calculates a covariance and a standard deviation between the extracted specific periodic component and the gravity periodic component, and calculates the correlation value based on the calculated covariance and standard deviation.
[付記5]
前記抽出手段は、前記地表変位量の時系列データに対してフーリエ変換を行い、前記特定の周期成分を抽出する付記1から4何れか1つに解析装置。
[Appendix 5]
5. The analysis device according to claim 1, wherein the extraction means performs a Fourier transform on the time series data of the amount of ground surface displacement to extract the specific periodic component.
[付記6]
前記地表変位量の時系列データは、合成開口レーダの時系列観測データに対して干渉解析を実施することにより取得される付記1から5何れか1つに記載の解析装置。
[Appendix 6]
6. The analysis device according to claim 1, wherein the time series data of the amount of ground displacement is obtained by performing interference analysis on time series observation data of a synthetic aperture radar.
[付記7]
合成開口レーダの時系列観測データに対して干渉解析を実施し、前記地表変位量の時系列データを生成する時系列データ生成手段を更に有する付記1から6何れか1つに記載の解析装置。
[Appendix 7]
7. The analysis device according to claim 1, further comprising a time-series data generating means for performing interference analysis on time-series observation data of a synthetic aperture radar and generating time-series data of the amount of ground surface displacement.
[付記8]
前記重力周期成分は、衛星、惑星、及び恒星間の引力に由来する摂動周期成分を含む付記1から7何れか1つに記載の解析装置。
[Appendix 8]
8. The analysis device according to claim 1, wherein the gravitational periodic components include perturbation periodic components resulting from gravitational forces between satellites, planets, and stars.
[付記9]
前記重力周期成分は潮汐を含む付記1から8何れか1つに記載の解析装置。
[Appendix 9]
9. The analysis device of claim 1, wherein the gravitational periodic component includes a tide.
[付記10]
地表変位量の時系列データから所定周期以上の成分を除去し、
前記所定周期以上の成分が除去された時系列データから特定の周期成分を抽出し、
前記抽出された特定の周期成分と重力周期成分との相関値を算出し、
前記相関値に基づいて地下水含有確率に関する解析結果を生成する解析方法。
[Appendix 10]
Remove components with periods longer than a specified period from the time series data of the ground surface displacement,
extracting a specific periodic component from the time series data from which components having a period equal to or greater than the predetermined period have been removed;
Calculating a correlation value between the extracted specific periodic component and a gravity periodic component;
An analytical method for generating an analytical result regarding the probability of groundwater inclusion based on the correlation value.
[付記11]
前記解析結果を生成することは、地下水含有確率を示す地下水含有領域画像を生成することを含む付記10に記載の解析方法。
[Appendix 11]
The analysis method of
[付記12]
地表変位量の時系列データから所定周期以上の成分を除去し、
前記所定周期以上の成分が除去された時系列データから特定の周期成分を抽出し、
前記抽出された特定の周期成分と重力周期成分との相関値を算出し、
前記相関値に基づいて地下水含有確率に関する解析結果を生成する処理をコンピュータに実行させるためのプログラム。
[Appendix 12]
Remove components with periods longer than a specified period from the time series data of the ground surface displacement,
extracting a specific periodic component from the time series data from which components having a period equal to or greater than the predetermined period have been removed;
Calculating a correlation value between the extracted specific periodic component and a gravity periodic component;
A program for causing a computer to execute a process for generating an analysis result regarding the probability of groundwater inclusion based on the correlation value.
10:解析装置
11:除去手段
12:抽出手段
13:相関算出手段
14:解析結果生成手段
100:解析装置
101:地下水領域解析部
102:時系列データ生成部
111:時系列データ取得部
112:重力周期データ取得部
113:長期トレンド除去部
114:中短期周期抽出部
115:マッチング部
121:SARデータ取得部
122:干渉解析部
123:時系列データ出力部
201:時系列データ保存部
202:重力周期データ保存部
203:SARデータ保存部
210:出力部
10: Analysis device 11: Removal means 12: Extraction means 13: Correlation calculation means 14: Analysis result generation means 100: Analysis device 101: Groundwater area analysis unit 102: Time series data generation unit 111: Time series data acquisition unit 112: Gravity cycle data acquisition unit 113: Long-term trend removal unit 114: Medium- to short-term cycle extraction unit 115: Matching unit 121: SAR data acquisition unit 122: Interference analysis unit 123: Time series data output unit 201: Time series data storage unit 202: Gravity cycle data storage unit 203: SAR data storage unit 210: Output unit
Claims (10)
前記所定周期以上の成分が除去された時系列データから特定の周期成分を抽出する抽出手段と、
前記抽出された特定の周期成分と重力周期成分との相関値を算出する相関算出手段と、
前記相関値に基づいて地下水含有確率に関する解析結果を生成する解析結果生成手段とを備える解析装置。 a removing means for removing components having a period equal to or greater than a predetermined period from the time series data of the ground surface displacement;
an extraction means for extracting a specific periodic component from the time series data from which components having a period equal to or greater than a predetermined period have been removed;
a correlation calculation means for calculating a correlation value between the extracted specific periodic component and a gravity periodic component;
and an analysis result generating means for generating an analysis result regarding the probability of groundwater inclusion based on the correlation value.
前記抽出手段は、所定範囲の複数の地点のそれぞれについて、前記所定周期以上の成分が除去された時系列データから特定の周期成分を抽出し、
前記相関算出手段は、所定範囲の複数の地点について、前記抽出された特定の周期成分と重力周期成分との相関値を算出し、
前記解析結果生成手段は、所定範囲の複数の地点について、前記相関値に基づいて地下水含有確率に関連する指標を算出し、前記所定範囲の地図に、前記地下水含有確率に関連する指標を重ねた画像を、前記地下水含有領域画像として生成する請求項2に記載の解析装置。 The removing means removes components having a period equal to or longer than a predetermined period from the time-series data of the amount of ground surface displacement for each of a plurality of points within a predetermined range,
The extraction means extracts a specific periodic component from the time series data from which components having periods equal to or greater than the predetermined period have been removed for each of a plurality of points within a predetermined range;
the correlation calculation means calculates a correlation value between the extracted specific periodic component and a gravity periodic component for a plurality of points within a predetermined range;
The analysis device described in claim 2, wherein the analysis result generating means calculates an index related to the groundwater inclusion probability for a plurality of points within a specified range based on the correlation value, and generates an image in which the index related to the groundwater inclusion probability is superimposed on a map of the specified range as the groundwater inclusion area image.
前記所定周期以上の成分が除去された時系列データから特定の周期成分を抽出し、
前記抽出された特定の周期成分と重力周期成分との相関値を算出し、
前記相関値に基づいて地下水含有確率に関する解析結果を生成する解析方法。 Remove components with periods longer than a specified period from the time series data of the ground surface displacement,
extracting a specific periodic component from the time series data from which components having a period equal to or greater than the predetermined period have been removed;
Calculating a correlation value between the extracted specific periodic component and a gravity periodic component;
An analytical method for generating an analytical result regarding the probability of groundwater inclusion based on the correlation value.
前記所定周期以上の成分が除去された時系列データから特定の周期成分を抽出し、
前記抽出された特定の周期成分と重力周期成分との相関値を算出し、
前記相関値に基づいて地下水含有確率に関する解析結果を生成する処理をコンピュータに実行させるためのプログラム。 Remove components with periods longer than a specified period from the time series data of the ground surface displacement,
extracting a specific periodic component from the time series data from which components having a period equal to or greater than the predetermined period have been removed;
Calculating a correlation value between the extracted specific periodic component and a gravity periodic component;
A program for causing a computer to execute a process for generating an analysis result regarding the probability of groundwater inclusion based on the correlation value.
Priority Applications (1)
| Application Number | Priority Date | Filing Date | Title |
|---|---|---|---|
| JP2021046464A JP7559639B2 (en) | 2021-03-19 | 2021-03-19 | Analysis device, method, and program |
Applications Claiming Priority (1)
| Application Number | Priority Date | Filing Date | Title |
|---|---|---|---|
| JP2021046464A JP7559639B2 (en) | 2021-03-19 | 2021-03-19 | Analysis device, method, and program |
Publications (2)
| Publication Number | Publication Date |
|---|---|
| JP2022145168A JP2022145168A (en) | 2022-10-03 |
| JP7559639B2 true JP7559639B2 (en) | 2024-10-02 |
Family
ID=83453573
Family Applications (1)
| Application Number | Title | Priority Date | Filing Date |
|---|---|---|---|
| JP2021046464A Active JP7559639B2 (en) | 2021-03-19 | 2021-03-19 | Analysis device, method, and program |
Country Status (1)
| Country | Link |
|---|---|
| JP (1) | JP7559639B2 (en) |
Citations (5)
| Publication number | Priority date | Publication date | Assignee | Title |
|---|---|---|---|---|
| JP2004061220A (en) | 2002-07-26 | 2004-02-26 | Gosei:Kk | Exploration method of ground water |
| JP2018512558A (en) | 2015-03-24 | 2018-05-17 | ユーティリス イスラエル リミテッド | Groundwater detection system and method |
| JP2018179604A (en) | 2017-04-06 | 2018-11-15 | 日本電気株式会社 | Ground reference point device and SAR geodetic system |
| JP2020020740A (en) | 2018-08-03 | 2020-02-06 | 日本電気株式会社 | SAR image analysis system |
| JP2020106460A (en) | 2018-12-28 | 2020-07-09 | 株式会社パスコ | Ground surface movement representing device and program |
-
2021
- 2021-03-19 JP JP2021046464A patent/JP7559639B2/en active Active
Patent Citations (5)
| Publication number | Priority date | Publication date | Assignee | Title |
|---|---|---|---|---|
| JP2004061220A (en) | 2002-07-26 | 2004-02-26 | Gosei:Kk | Exploration method of ground water |
| JP2018512558A (en) | 2015-03-24 | 2018-05-17 | ユーティリス イスラエル リミテッド | Groundwater detection system and method |
| JP2018179604A (en) | 2017-04-06 | 2018-11-15 | 日本電気株式会社 | Ground reference point device and SAR geodetic system |
| JP2020020740A (en) | 2018-08-03 | 2020-02-06 | 日本電気株式会社 | SAR image analysis system |
| JP2020106460A (en) | 2018-12-28 | 2020-07-09 | 株式会社パスコ | Ground surface movement representing device and program |
Non-Patent Citations (1)
| Title |
|---|
| 福田洋一 他,精密重力測定による別府地域の地下水変動の研究,測地学会誌,1996年,第42巻,第2号,85~97頁 |
Also Published As
| Publication number | Publication date |
|---|---|
| JP2022145168A (en) | 2022-10-03 |
Similar Documents
| Publication | Publication Date | Title |
|---|---|---|
| Herring et al. | Plate Boundary Observatory and related networks: GPS data analysis methods and geodetic products | |
| Gualandi et al. | Variational Bayesian independent component analysis for InSAR displacement time‐series with application to central California, USA | |
| Simons et al. | Spatiospectral localization of isostatic coherence anisotropy in Australia and its relation to seismic anisotropy: Implications for lithospheric deformation | |
| Ubelmann et al. | Dynamic mapping of along-track ocean altimetry: Method and performance from observing system simulation experiments | |
| Chen et al. | ARU-net: Reduction of atmospheric phase screen in SAR interferometry using attention-based deep residual U-net | |
| Yan et al. | Coseismic displacement field and slip distribution of the 2005 Kashmir earthquake from SAR amplitude image correlation and differential interferometry | |
| Tong et al. | Surface creep rate and moment accumulation rate along the Aceh segment of the Sumatran fault from L‐band ALOS‐1/PALSAR‐1 observations | |
| Dalaison et al. | The interplay between seismic and aseismic slip along the Chaman fault illuminated by InSAR | |
| Zhang et al. | Monitoring landslide activities in the three gorges area with multi-frequency satellite SAR data sets | |
| Cao et al. | Mapping ground displacement by a multiple phase difference-based InSAR approach: with stochastic model estimation and turbulent troposphere mitigation: Y. Cao et al. | |
| Shih et al. | Forecasting of global ionosphere maps with multi‐day lead time using transformer‐based neural networks | |
| Klos et al. | Introducing the idea of classifying sets of permanent GNSS stations as benchmarks for hydrogeodesy | |
| Elliott et al. | Coseismic deformation of the 2002 Denali fault earthquake: Contributions from synthetic aperture radar range offsets | |
| Scott et al. | Sensitivity of earthquake source inversions to atmospheric noise and corrections of InSAR data | |
| Ji et al. | Historical reconstruction of storm surge activity in the southeastern coastal area of China for the past 60 years | |
| Zhang et al. | Time series land subsidence monitoring and prediction based on SBAS-InSAR and GeoTemporal transformer model | |
| Cerbelaud et al. | Peak flow event durations in the Mississippi River basin and implications for temporal sampling of rivers | |
| Alizadeh Zakaria et al. | Investigation of the application of geospatial artificial intelligence for integration of earthquake precursors extracted from remotely sensed SAR and thermal images for earthquake prediction | |
| Li et al. | The 1998 Mw 5.7 Zhangbei‐Shangyi (China) earthquake revisited: A buried thrust fault revealed with interferometric synthetic aperture radar | |
| Samsonov et al. | Deformation retrievals for North America and Eurasia from Sentinel-1 DInSAR: big data approach, processing methodology and challenges | |
| Huang et al. | Mapping vertical land motion in challenging terrain: Six‐year trends on Tutuila Island, American Samoa, with PS‐InSAR, GPS, tide gauge, and satellite altimetry data | |
| Hay et al. | Small scale variability in the wet troposphere impacts the interpretation of SWOT satellite observations | |
| Koros et al. | Subsidence surveys at Olkaria geothermal field, Kenya | |
| Takagawa et al. | Adjoint synthesis for trans‐oceanic tsunami waveforms and simultaneous inversion of fault geometry and slip distribution | |
| Xu et al. | Reconstruction of geodetic time series with missing data and time-varying seasonal signals using Gaussian process for machine learning |
Legal Events
| Date | Code | Title | Description |
|---|---|---|---|
| A621 | Written request for application examination |
Free format text: JAPANESE INTERMEDIATE CODE: A621 Effective date: 20240207 |
|
| A977 | Report on retrieval |
Free format text: JAPANESE INTERMEDIATE CODE: A971007 Effective date: 20240808 |
|
| TRDD | Decision of grant or rejection written | ||
| A01 | Written decision to grant a patent or to grant a registration (utility model) |
Free format text: JAPANESE INTERMEDIATE CODE: A01 Effective date: 20240820 |
|
| A61 | First payment of annual fees (during grant procedure) |
Free format text: JAPANESE INTERMEDIATE CODE: A61 Effective date: 20240902 |
|
| R150 | Certificate of patent or registration of utility model |
Ref document number: 7559639 Country of ref document: JP Free format text: JAPANESE INTERMEDIATE CODE: R150 |