JP7326316B2 - Method for detecting cells with at least one abnormality in a cytological sample - Google Patents
Method for detecting cells with at least one abnormality in a cytological sample Download PDFInfo
- Publication number
- JP7326316B2 JP7326316B2 JP2020552248A JP2020552248A JP7326316B2 JP 7326316 B2 JP7326316 B2 JP 7326316B2 JP 2020552248 A JP2020552248 A JP 2020552248A JP 2020552248 A JP2020552248 A JP 2020552248A JP 7326316 B2 JP7326316 B2 JP 7326316B2
- Authority
- JP
- Japan
- Prior art keywords
- cells
- cell
- abnormality
- nucleus
- image
- Prior art date
- Legal status (The legal status is an assumption and is not a legal conclusion. Google has not performed a legal analysis and makes no representation as to the accuracy of the status listed.)
- Active
Links
- 238000000034 method Methods 0.000 title claims description 149
- 230000005856 abnormality Effects 0.000 title claims description 92
- 230000002380 cytological effect Effects 0.000 title claims description 58
- 210000004027 cell Anatomy 0.000 claims description 266
- 238000001514 detection method Methods 0.000 claims description 45
- 230000002159 abnormal effect Effects 0.000 claims description 44
- 238000012545 processing Methods 0.000 claims description 38
- 238000004364 calculation method Methods 0.000 claims description 21
- 230000001413 cellular effect Effects 0.000 claims description 16
- 238000004737 colorimetric analysis Methods 0.000 claims description 15
- 238000000635 electron micrograph Methods 0.000 claims description 8
- 238000001000 micrograph Methods 0.000 claims description 8
- 230000011218 segmentation Effects 0.000 claims description 8
- 238000002073 fluorescence micrograph Methods 0.000 claims description 7
- 238000001914 filtration Methods 0.000 claims description 5
- 210000002700 urine Anatomy 0.000 claims description 5
- 230000002269 spontaneous effect Effects 0.000 claims description 3
- 210000004940 nucleus Anatomy 0.000 description 124
- 239000012634 fragment Substances 0.000 description 37
- 230000000875 corresponding effect Effects 0.000 description 28
- 206010028980 Neoplasm Diseases 0.000 description 20
- 238000013135 deep learning Methods 0.000 description 16
- 201000011510 cancer Diseases 0.000 description 14
- 125000005843 halogen group Chemical group 0.000 description 14
- 206010005003 Bladder cancer Diseases 0.000 description 12
- 208000007097 Urinary Bladder Neoplasms Diseases 0.000 description 12
- 201000005112 urinary bladder cancer Diseases 0.000 description 12
- 230000006870 function Effects 0.000 description 11
- 230000009466 transformation Effects 0.000 description 10
- 238000004458 analytical method Methods 0.000 description 8
- 238000013528 artificial neural network Methods 0.000 description 8
- 238000003745 diagnosis Methods 0.000 description 7
- 238000005259 measurement Methods 0.000 description 7
- 238000012549 training Methods 0.000 description 6
- 238000004422 calculation algorithm Methods 0.000 description 5
- 230000001788 irregular Effects 0.000 description 5
- 229910052704 radon Inorganic materials 0.000 description 5
- SYUHGPGVQRZVTB-UHFFFAOYSA-N radon atom Chemical compound [Rn] SYUHGPGVQRZVTB-UHFFFAOYSA-N 0.000 description 5
- 238000000844 transformation Methods 0.000 description 5
- 238000012512 characterization method Methods 0.000 description 4
- 238000013527 convolutional neural network Methods 0.000 description 4
- 238000000605 extraction Methods 0.000 description 4
- 230000000877 morphologic effect Effects 0.000 description 4
- 210000000633 nuclear envelope Anatomy 0.000 description 4
- 230000035945 sensitivity Effects 0.000 description 4
- 230000008901 benefit Effects 0.000 description 3
- 210000003855 cell nucleus Anatomy 0.000 description 3
- 238000005094 computer simulation Methods 0.000 description 3
- 230000008569 process Effects 0.000 description 3
- 238000012360 testing method Methods 0.000 description 3
- 238000004627 transmission electron microscopy Methods 0.000 description 3
- 208000037842 advanced-stage tumor Diseases 0.000 description 2
- 238000013459 approach Methods 0.000 description 2
- 230000005540 biological transmission Effects 0.000 description 2
- 230000007423 decrease Effects 0.000 description 2
- 238000010586 diagram Methods 0.000 description 2
- 238000009826 distribution Methods 0.000 description 2
- 238000013399 early diagnosis Methods 0.000 description 2
- 239000011159 matrix material Substances 0.000 description 2
- 238000005316 response function Methods 0.000 description 2
- 238000012216 screening Methods 0.000 description 2
- 238000000926 separation method Methods 0.000 description 2
- 230000017105 transposition Effects 0.000 description 2
- 210000003741 urothelium Anatomy 0.000 description 2
- 239000013598 vector Substances 0.000 description 2
- KRQUFUKTQHISJB-YYADALCUSA-N 2-[(E)-N-[2-(4-chlorophenoxy)propoxy]-C-propylcarbonimidoyl]-3-hydroxy-5-(thian-3-yl)cyclohex-2-en-1-one Chemical compound CCC\C(=N/OCC(C)OC1=CC=C(Cl)C=C1)C1=C(O)CC(CC1=O)C1CCCSC1 KRQUFUKTQHISJB-YYADALCUSA-N 0.000 description 1
- 238000005267 amalgamation Methods 0.000 description 1
- 230000002547 anomalous effect Effects 0.000 description 1
- 238000010420 art technique Methods 0.000 description 1
- 125000004429 atom Chemical group 0.000 description 1
- 210000001124 body fluid Anatomy 0.000 description 1
- 239000003086 colorant Substances 0.000 description 1
- 230000002596 correlated effect Effects 0.000 description 1
- 210000000805 cytoplasm Anatomy 0.000 description 1
- 230000001086 cytosolic effect Effects 0.000 description 1
- 238000000354 decomposition reaction Methods 0.000 description 1
- 230000002708 enhancing effect Effects 0.000 description 1
- 238000003384 imaging method Methods 0.000 description 1
- 230000000873 masking effect Effects 0.000 description 1
- 238000012067 mathematical method Methods 0.000 description 1
- 239000000203 mixture Substances 0.000 description 1
- 230000006740 morphological transformation Effects 0.000 description 1
- 210000002569 neuron Anatomy 0.000 description 1
- 238000005457 optimization Methods 0.000 description 1
- 230000007170 pathology Effects 0.000 description 1
- 238000007781 pre-processing Methods 0.000 description 1
- 230000001629 suppression Effects 0.000 description 1
- 230000004083 survival effect Effects 0.000 description 1
- 238000012546 transfer Methods 0.000 description 1
Images


Classifications
-
- G—PHYSICS
- G06—COMPUTING; CALCULATING OR COUNTING
- G06V—IMAGE OR VIDEO RECOGNITION OR UNDERSTANDING
- G06V20/00—Scenes; Scene-specific elements
- G06V20/60—Type of objects
- G06V20/69—Microscopic objects, e.g. biological cells or cellular parts
- G06V20/698—Matching; Classification
-
- G01N15/1433—
-
- G—PHYSICS
- G01—MEASURING; TESTING
- G01N—INVESTIGATING OR ANALYSING MATERIALS BY DETERMINING THEIR CHEMICAL OR PHYSICAL PROPERTIES
- G01N21/00—Investigating or analysing materials by the use of optical means, i.e. using sub-millimetre waves, infrared, visible or ultraviolet light
- G01N21/17—Systems in which incident light is modified in accordance with the properties of the material investigated
- G01N21/25—Colour; Spectral properties, i.e. comparison of effect of material on the light at two or more different wavelengths or wavelength bands
- G01N21/251—Colorimeters; Construction thereof
-
- G—PHYSICS
- G01—MEASURING; TESTING
- G01N—INVESTIGATING OR ANALYSING MATERIALS BY DETERMINING THEIR CHEMICAL OR PHYSICAL PROPERTIES
- G01N21/00—Investigating or analysing materials by the use of optical means, i.e. using sub-millimetre waves, infrared, visible or ultraviolet light
- G01N21/17—Systems in which incident light is modified in accordance with the properties of the material investigated
- G01N21/25—Colour; Spectral properties, i.e. comparison of effect of material on the light at two or more different wavelengths or wavelength bands
- G01N21/29—Colour; Spectral properties, i.e. comparison of effect of material on the light at two or more different wavelengths or wavelength bands using visual detection
-
- G—PHYSICS
- G06—COMPUTING; CALCULATING OR COUNTING
- G06V—IMAGE OR VIDEO RECOGNITION OR UNDERSTANDING
- G06V20/00—Scenes; Scene-specific elements
- G06V20/60—Type of objects
- G06V20/69—Microscopic objects, e.g. biological cells or cellular parts
- G06V20/695—Preprocessing, e.g. image segmentation
-
- G—PHYSICS
- G01—MEASURING; TESTING
- G01N—INVESTIGATING OR ANALYSING MATERIALS BY DETERMINING THEIR CHEMICAL OR PHYSICAL PROPERTIES
- G01N15/00—Investigating characteristics of particles; Investigating permeability, pore-volume, or surface-area of porous materials
- G01N15/10—Investigating individual particles
- G01N2015/1006—Investigating individual particles for cytology
-
- G—PHYSICS
- G01—MEASURING; TESTING
- G01N—INVESTIGATING OR ANALYSING MATERIALS BY DETERMINING THEIR CHEMICAL OR PHYSICAL PROPERTIES
- G01N15/00—Investigating characteristics of particles; Investigating permeability, pore-volume, or surface-area of porous materials
- G01N15/10—Investigating individual particles
- G01N15/14—Electro-optical investigation, e.g. flow cytometers
- G01N2015/1402—Data analysis by thresholding or gating operations performed on the acquired signals or stored data
Description
本発明は、細胞学的試料の1つのデジタル化された画像、又はいくつかのデジタル化された画像に基づき、同じ試料中の少なくとも1つの異常を有する細胞を検出するための方法に関する。本発明はまた、この方法を実行する装置に関する。 The present invention relates to a method for detecting cells with at least one abnormality in the same sample based on a digitized image or several digitized images of a cytological sample. The invention also relates to a device for carrying out this method.
本発明は、スライド上に固定した後の細胞学的試料からの細胞の微視的研究である細胞学の分野に関する。より正確には、当該研究は、正常な細胞の、又は少なくとも1つの異常を有する細胞を意味する異常な細胞の、形態学的、放射分析的、又は生化学的側面の研究を含む。 The present invention relates to the field of cytology, the microscopic study of cells from a cytological sample after fixation on slides. More precisely, the study includes the study of morphological, radiometric or biochemical aspects of normal cells or of abnormal cells meaning cells with at least one abnormality.
癌スクリーニングは、細胞学の応用分野の1つであり、被験者から採取した細胞学的試料を用いて癌を探索、及び発見することからなる。スクリーニングは、部分的には、解剖学-病理学的試験室で、異常な細胞を検出するための方法について訓練された細胞技師及び細胞病理学者によって、行われる。細胞学は、例えば「低悪性度」と呼ばれる早期段階の癌、及び「高悪性度」と呼ばれるより進行した段階の癌等、様々な段階での癌の診断が可能となるため、一部の癌の検出に非常に有用である(悪性度はまた、癌の種類に対応し得る。)。癌の早期診断は、罹患患者の生存率、及び対応する罹患患者の看護費に重大な影響を及ぼす、明らかに重要な事項である。例えば、毎年、膀胱癌に関して、膀胱癌診断を補助するための1000万件の尿の細胞学的研究が世界中で行われた;自然排尿から得られた細胞学的スライド上の試料の分析は、膀胱癌を診断するための最新の手法である。 Cancer screening is one of the applications of cytology and consists of searching for and detecting cancers using cytological samples taken from subjects. Screening is performed in part in an anatomy-pathology laboratory by cytotechnologists and cytopathologists trained in methods for detecting abnormal cells. Cytology is used by some because it allows the diagnosis of cancers at various stages, for example, early-stage cancers called "low-grade" and more advanced-stage cancers called "high-grade." Very useful for cancer detection (grade can also correspond to cancer type). Early diagnosis of cancer is clearly a matter of great importance with a significant impact on the survival rate of afflicted patients and the corresponding cost of care for afflicted patients. For example, for bladder cancer each year, 10 million urine cytological studies are performed worldwide to aid in diagnosing bladder cancer; , is the state-of-the-art technique for diagnosing bladder cancer.
しかしながら、細胞学的試料の分析によるこの診断方法は、細胞病理学者及び細胞技師の経験、及び人数の減少を意味する人間的側面、また、特定の癌に対する感度の低さの両方から制限される。典型的には、異常な細胞又は正常でない細胞はまだ顕著な形態学的変形を受けておらず、したがって人間の眼による検出が困難であるため、低悪性度の膀胱癌の診断に関する感度は非常に低い。したがって、この手法全体の性能、また信頼性も向上させることに役立ち得る、日常的にかつ低コストで使用することができる手順を探す必要がある。 However, this method of diagnosis by analysis of cytological samples is limited both by the experience of cytopathologists and cytotechnologists, and by the human aspects that imply reduced numbers, and by the low sensitivity to certain cancers. . The sensitivity for diagnosing low-grade bladder cancer is very high because typically abnormal or non-normal cells have not yet undergone significant morphological transformation and are therefore difficult to detect by the human eye. to low. Therefore, there is a need to look for procedures that can be used routinely and at low cost that can help improve the performance of the overall technique, as well as its reliability.
この状況に基づいて、本発明の目的の1つは、続く癌、特に膀胱癌の検出を補助するために、デジタル化されたスライド画像に基づき、細胞学的試料中の少なくとも1つの細胞の異常を有する細胞を検出するための方法を提供することからなる。有利には、本発明は、コンピュータ実行処理モジュールを用いた、スライド上に存在する試料からの細胞の自動化された網羅的な分析を提供する。したがって、細胞学的試料の分析、及び潜在的には正常でない全ての細胞の分析は、完全であり、迅速であり、より正確であり、細胞病理学者及び細胞技師の一般的な分析エラーを克服するために役立つ。さらに、この方法は、試料の細胞学的分析結果の標準化を保証する。しかし、この方法はさらに、小さな異常を有する細胞を検出することによって、低悪性度と呼ばれる癌、特に低悪性度の膀胱癌の早期診断に役立つ。 Based on this situation, one of the objects of the present invention is the detection of at least one cell abnormality in a cytological sample, based on the digitized slide image, in order to aid in the subsequent detection of cancer, in particular bladder cancer. to provide a method for detecting a cell having Advantageously, the present invention provides automated global analysis of cells from a sample present on a slide using a computer-implemented processing module. Analysis of cytological samples, and potentially of all cells that are not normal, is therefore complete, rapid, more accurate, and overcomes common analytical errors of cytopathologists and cytotechnologists. help to do. Furthermore, this method ensures standardization of the cytological analysis results of the samples. However, the method also aids in the early diagnosis of so-called low-grade cancers, especially low-grade bladder cancer, by detecting cells with small abnormalities.
本発明は、前述した最新技術の欠点を改善することを目的とし、代替的な解決策がないことによって動機付けられる。この目的、又は他の目的を達成するために、本発明の第1の態様は、細胞学的試料の少なくとも1つの第1のデジタル化された電子顕微鏡画像(1)に基づき、前記試料中の少なくとも1つの異常を有する細胞を検出するための方法を提案し、前記方法は、コンピュータ実行処理モジュールを用いて行われ、特に、完全にコンピュータ実行処理モジュールを用いて行われることを特徴とする。 SUMMARY OF THE INVENTION The present invention aims to remedy the shortcomings of the state of the art mentioned above and is motivated by the lack of alternative solutions. To achieve this object, or other objects, a first aspect of the invention is based on at least one first digitized electron microscope image (1) of a cytological sample, wherein in said sample A method for detecting cells with at least one abnormality is proposed, said method being performed using a computer-implemented processing module, in particular characterized in that it is performed entirely using a computer-implemented processing module.
前記方法は、以下のサブ工程を含む、前記第1の画像を処理する工程を含む:
-前記第1の画像から開始して、比色検出を用いて、少なくとも1つの孤立した細胞又は1つの細胞群から選択された、前記試料中に存在する各要素を検出する;
-比色検出を用いて、孤立した各細胞及び/又は各細胞群をフィルターする;
-検出された各細胞群から開始して、前記細胞群の輪郭の検出に基づく少なくとも1つのセグメンテーション法を用いて、核を有する少なくとも1つの細胞を個別化する。
The method includes processing the first image, including the following substeps:
- starting from said first image, detecting each element present in said sample, selected from at least one isolated cell or one group of cells, using colorimetric detection;
- filtering isolated cells and/or groups of cells using colorimetric detection;
- Starting from each detected cell population, individualizing at least one cell with a nucleus using at least one segmentation method based on detection of the contours of said cell population.
さらに、前記方法は、以下のサブ工程を含む、細胞の異常を検出する工程をさらに含む:
-先行する工程における孤立した各細胞又は個別化された各細胞について、「異常のエキスパート特性」と呼ばれる別個の異常の2つの特性に関するデータを計算し、これらの計算されたデータを参照データと比較することによって、前記細胞が少なくとも1つの異常を有するかを判定する;
-次いで、前記試料中の少なくとも1つの異常を有する細胞の総数を数える。
In addition, the method further comprises the step of detecting cellular abnormalities, comprising the following substeps:
- For each isolated cell or individualized cell in the preceding step, calculate data on two properties of a separate abnormality, called "expert properties of the abnormality", and compare these calculated data with the reference data. determining whether the cell has at least one abnormality by
- Then count the total number of cells with at least one abnormality in said sample.
最後に、前記方法は、以下のサブ工程を含む、前記試料の異常レベルにしたがって、前記試料を特性付ける第1の工程をさらに含む:
-少なくとも1つの異常を有する細胞の前記総数を、前記異常レベルの閾値と、好ましくは各々が少なくとも1つの異常を有する少なくとも3つの細胞に等しい閾値と比較する;
-少なくとも1つの異常を有する細胞の前記総数が前記異常レベルの前記閾値未満である場合には、異常レベルがゼロである試料を表すクラスに前記試料を分類する;
-少なくとも1つの異常を有する細胞の前記総数が前記異常レベルの前記閾値よりも高い場合には、異常レベルが証明された試料を表し、異常レベルが低いこと又は異常レベルが高いことを意味するクラスに前記試料を分類する。
Finally, the method further comprises a first step of characterizing the sample according to the abnormal level of the sample, comprising the following substeps:
- comparing said total number of cells with at least one abnormality to a threshold for said level of abnormality, preferably equal to at least three cells each having at least one abnormality;
- if said total number of cells with at least one abnormality is less than said threshold of said level of abnormality, classifying said sample into a class representing samples with zero level of abnormality;
- a class representing a sample with a proven level of abnormality, meaning low level of abnormality or high level of abnormality, if said total number of cells with at least one abnormality is higher than said threshold of said level of abnormality; classify the sample into
本発明のこの態様によれば、本検出方法は最後に、少なくとも1つの第1の画像に基づき、好ましくはさらに第2の画像の分析にも基づき、細胞の異常レベルにしたがって細胞学的試料を分類する。本発明で使用される処理モジュールは、試料の第1のデジタル化された透過型電子顕微鏡画像及び/又は試料の第2のデジタル化された蛍光顕微鏡画像から計算されたデータを、細胞学で公知の参照データと組み合わせることができる。 According to this aspect of the invention, the detection method finally comprises, based on at least one first image, preferably also based on analysis of the second image, a cytological sample according to the abnormal level of cells. Classify. The processing module used in the present invention provides data calculated from the first digitized transmission electron microscopy image of the sample and/or the second digitized fluorescence microscopy image of the sample as known in cytology. can be combined with reference data from
前述の第1の画像を処理する工程中には、第1の画像からのいくつかの構成要素、特に孤立した細胞、細胞群、除去されるべき要素、又は分析することができないため本方法を進めるために除外される細胞クラスタが検出されることが理解されるであろう。 During the aforementioned step of processing the first image, some components from the first image, particularly isolated cells, clusters of cells, elements to be removed or not able to be analyzed, make the method unusable. It will be appreciated that cell clusters that are excluded from proceeding are detected.
本解決策によって、2つのクラスにしたがって試料を分類することにより恩恵を受けることができるようになり、試料の細胞の異常レベルがゼロであるか、又は試料が証明された細胞の異常レベルを有するかどうかを診断することができるようになる。次いで、この結果は、専門医による癌か否かの診断を大いに助けるであろう。 The present solution allows one to benefit from classifying a sample according to two classes, wherein the sample has zero abnormal level of cells or the sample has a proven abnormal level of cells. It will be possible to diagnose whether This result would then greatly aid the diagnosis of cancer or not by a specialist.
さらに、本発明によれば、細胞の異常のエキスパート特性を、細胞の適合性(conformity)の優れた指標として見なすことができることに留意されたい。 Furthermore, it should be noted that, according to the present invention, expert properties of cell abnormalities can be viewed as good indicators of cell conformity.
好ましくは、前記異常のエキスパート特性の1つは、前記細胞中の前記核の表面積比、又は前記核の不規則性、又は前記核の斑状比色(mottled colorimetry)、又は前記核のハイパー比色(hyper-colorimetry)である。「斑状比色」とは、特定の点又はスポットの色強度を測定することを意味すると理解される。 Preferably, one of the expert characteristics of said abnormality is the surface area ratio of said nucleus in said cell, or said nuclear irregularity, or said mottled colorimetry of said nucleus, or said hypercolorimetry of said nucleus. (hyper-colorimetry). "Pochal colorimetry" is understood to mean measuring the color intensity of a particular point or spot.
さらに好ましくは、異常のエキスパート特性は、核の特性、特に細胞のサイズに照らした核のサイズ比、細胞中の核の位置、又は核の比色特性である。より正確には、異常のエキスパート特性は、細胞中の核の表面積比、又は核の不規則性、又は斑状比色、又は核のハイパー比色である。 More preferably, the expert characteristic of the abnormality is a characteristic of the nucleus, in particular the ratio of the size of the nucleus to the size of the cell, the location of the nucleus in the cell, or the colorimetric characteristic of the nucleus. More precisely, the expert characteristic of the abnormality is the surface area ratio of the nucleus in the cell, or the irregularity of the nucleus, or the patchy colorimetry, or the hypercolorimetry of the nucleus.
有利には、少なくとも1つの前記異常のエキスパート特性は、前記核の不規則性であり、前記核の前記不規則性の計算は、分析された各細胞の核と細胞学において「参照」と呼ばれる細胞の参照と呼ばれる核型との間の比較に対応する偏差計算である。この偏差計算は、以下のリスト:表面の差、周の差、前記核の凸性の差、重心の差、検出された各核の前記輪郭の長さの差、前記核の輪郭の不規則性の差、各核内の画素数の差、及び前記細胞内の前記核の偏心の差から選択される。 Advantageously, at least one expert characteristic of said abnormality is an irregularity of said nucleus, said calculation of said irregularity of said nucleus being referred to as a "reference" in the nucleus and cytology of each cell analyzed. Deviation calculations corresponding to comparisons between cell reference karyotypes. This deviation calculation uses the following list: surface difference, perimeter difference, convexity difference of the nuclei, centroid difference, length difference of the contours of each detected nucleus, irregularity of the contours of the nuclei. a difference in sex, a difference in the number of pixels within each nucleus, and a difference in eccentricity of the nucleus within the cell.
特定の実施形態によれば、少なくとも1つの異常のエキスパート特性は、核の輪郭の長さであり、この特性の計算は、以下のサブ工程をさらに含む:
-核の輪郭抽出法を使用することによって、実際の核の輪郭を計算する;
-核の境界包絡線(bounding envelope)をトレースすることによって、核の直径、好ましくは最大直径を決定する;
-参照核の境界包絡線であるC2ランクの閉じた凸曲線境界包絡線(C2 rank closed convex curve bounding envelope)をトレースする;
-実際の核の輪郭と、参照核の輪郭を表すトレースされた凸曲線との間の差を計算する。
According to a particular embodiment, the at least one anomaly expert property is the nuclear contour length, and the calculation of this property further comprises the following sub-steps:
- Calculate the actual nucleus contour by using the nucleus contour extraction method;
- determining the diameter of the nucleus, preferably the maximum diameter, by tracing the bounding envelope of the nucleus;
- trace the C2 rank closed convex curve bounding envelope, which is the bounding envelope of the reference nucleus;
- Calculate the difference between the contour of the actual nucleus and the traced convex curve representing the contour of the reference nucleus.
特定の実施形態によれば、少なくとも1つの異常のエキスパート特性は、核の輪郭の不規則性であり、この特性の計算は、以下のサブ工程をさらに含む:
-検出された核の輪郭における少なくとも1つの角点を検出する;
-核の輪郭における角点の総数を計算する;
-対応する各角点について角度を測定する;次いで、
-核当たりの検出された角点の数及びそれらの角度についてのデータを組み合わせることによって、核の輪郭の不規則性の程度を決定する。
According to a particular embodiment, the at least one anomalous expert property is nuclear contour irregularity, and the calculation of this property further comprises the following sub-steps:
- detecting at least one corner point in the contour of the detected nuclei;
- calculate the total number of corner points in the contour of the nucleus;
- measure the angle for each corresponding corner point;
- Determine the degree of irregularity of the contour of the nucleus by combining data on the number of corner points detected per nucleus and their angles.
特定の実施形態によれば、本発明に係る方法は、以下のサブ工程を含む、類型選択する工程を含む:
-前記試料の前記第1のデジタル化された画像から開始して、前記細胞のサイズを測定し、次いで、前記細胞のサイズにしたがって前記細胞を分類する;
-細胞の各クラスを対応する細胞型と一致させ、次いで、細胞のサイズに対応して選択された、尿路上皮細胞型等の、少なくとも1つの細胞型を選択する。
According to a particular embodiment, the method according to the invention comprises a typing step comprising the following substeps:
- starting from said first digitized image of said sample, measuring the size of said cells and then sorting said cells according to said cell size;
- Matching each class of cells with a corresponding cell type and then selecting at least one cell type, such as a urothelial cell type, selected according to the size of the cells.
特定の実施形態によれば、本発明は、前記試料からの前記細胞の前記異常レベルにしたがって、前記試料を特性付ける第2の工程をさらに含んでもよい。この第2の工程は、以下のサブ工程をさらに含む:
-前記試料の第2のデジタル化された蛍光画像から開始して、尿路上皮等の選択された細胞型の全ての前記細胞を、前記第1のデジタル化された画像において予め定義された前記試料における細胞の位置にしたがって、選択する;
-予め選択された各細胞の周りの蛍光ハローの存在を検出する、好ましくは前記蛍光のレベルを測定する、さらに好ましくは前記蛍光の広がりのレベルを測定する;
-蛍光ハローが検出される場合には、好ましくは最小の蛍光のレベルが測定された場合には、また好ましくは前記蛍光の最小の広がりのレベルが測定された場合には、低い異常レベルを有する試料を表すクラスに前記試料を分類する。
According to certain embodiments, the invention may further comprise a second step of characterizing said sample according to said abnormal level of said cells from said sample. This second step further includes the following substeps:
- starting from a second digitized fluorescence image of said sample, all said cells of a selected cell type, such as urothelium, in said first digitized image, said predefined Select according to the location of the cells in the sample;
- detecting the presence of a fluorescent halo around each preselected cell, preferably measuring the level of said fluorescence, more preferably measuring the level of spread of said fluorescence;
- has a low abnormal level when a fluorescence halo is detected, preferably when a minimal level of fluorescence is measured, and preferably when a minimal spread of said fluorescence is measured; Classify the samples into classes that represent the samples.
別の特定の実施形態によれば、本発明は、核を含む細胞の数にしたがって、及び最小の有用性閾値にしたがって、前記試料の有用性をリコメンドする工程を含み、好ましくは前記最小の有用性閾値は、核を含む前記第1の画像における少なくとも7つの細胞に等しい。 According to another particular embodiment, the invention comprises recommending the utility of said sample according to the number of cells containing nuclei and according to a minimum usefulness threshold, preferably said minimum usefulness The sex threshold is equal to at least 7 cells in the first image containing nuclei.
本発明によれば、本方法は、前記処理モジュールを用いて、全ての結果データを結合し、前記第1の画像及び前記第2の画像に基づいて分析された前記細胞学的試料を、前記細胞の異常レベルに関連する3つのクラス、すなわち、0、低、又は高、のうちの1つに分類する。 According to the invention, the method combines all resulting data using the processing module to generate the cytological sample analyzed on the basis of the first image and the second image as the Cells are classified into one of three classes associated with abnormal levels: 0, low, or high.
本発明の第2の態様は、第1の画像及び/又は第2の画像に基づき、深層学習法を用いて、細胞学的試料中の少なくとも1つの異常を有する細胞を検出するための方法であって、コンピュータによって実行される処理モジュールを用いて、試料を、試料の細胞の異常レベルに関連する3つのクラス、すなわち、0、低、又は高、のうちの1つに割り当てる方法を提案する。 A second aspect of the invention is a method for detecting cells with at least one abnormality in a cytological sample based on a first image and/or a second image and using a deep learning method. and proposes a method of assigning a sample to one of three classes associated with abnormal levels of cells in the sample, namely 0, low, or high, using a computer-implemented processing module. .
この方法は、本発明の第1の態様のうちの少なくとも1つの変形例によって提供されるデータを使用するという点で有利である。 The method is advantageous in that it uses data provided by at least one variant of the first aspect of the invention.
好ましくは、前記細胞学的試料は、自然排尿からの尿試料である。 Preferably, said cytological sample is a urine sample from spontaneous voiding.
本発明の第3の態様は、前述のような方法を実行する装置を提案する。 A third aspect of the invention proposes an apparatus for carrying out a method as described above.
本発明の第4の態様は、膀胱癌の診断を補助するための、以下に記載されるような方法の使用を提案する。 A fourth aspect of the invention proposes the use of a method as described below to aid in the diagnosis of bladder cancer.
本発明の他の詳細及び利点は、添付の図面を参照してなされる非限定的な実行例の以下の説明において、明らかになるであろう。 Other details and advantages of the invention will become apparent in the following description of non-limiting examples of implementation made with reference to the accompanying drawings.
図1は、本発明の好ましいモードにしたがって実施される方法の様々な工程を示す図である。 FIG. 1 is a diagram showing various steps of a method implemented according to a preferred mode of the invention.
図2は、処理する工程の前後の、試料のデジタル化された電子顕微鏡像の第1の例を示す。ここで、第1の画像は特に、孤立した細胞、細胞クラスタ、細胞群、及び除去されるべき要素を含む。 FIG. 2 shows a first example of digitized electron microscope images of a sample before and after the processing step. Here, the first image contains in particular isolated cells, cell clusters, cell groups and elements to be removed.
図3は、第1の画像を処理する工程の前後の、第2の試料のデジタル化された電子顕微鏡画像の第2の例を示す。ここで、第1の画像は特に、孤立した細胞、細胞クラスタ、細胞群、及び除去されるべき要素を含む。 FIG. 3 shows a second example of digitized electron microscope images of a second sample before and after processing the first image. Here, the first image contains in particular isolated cells, cell clusters, cell groups and elements to be removed.
図4は、孤立した細胞の2つの電子顕微鏡画像と、コンピュータによって実行される処理モジュールを用いて抽出された細胞の核の2つの電子顕微鏡画像とを表す。 FIG. 4 represents two electron microscopy images of isolated cells and two electron microscopy images of cell nuclei extracted using a computer-implemented processing module.
図5は、孤立した細胞、その抽出された核、及びコンピュータによって実行される処理モジュールを用いて核細胞のサイズ比を測定するためのトレースの一例を表す。 FIG. 5 represents an example of an isolated cell, its extracted nucleus, and a trace for measuring the nuclear cell size ratio using a computer-implemented processing module.
図6は、第2のデジタル化された画像に基づき、試料を特性付ける第2の工程を含む、別の実施形態にしたがって実施される方法の様々な段階を示す図である。 FIG. 6 illustrates various steps of a method performed according to another embodiment, including a second step of characterizing the sample based on the second digitized image.
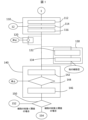
図7は、本発明の第2の態様、より正確には、画像断片のセットに対応する少なくとも1つの細胞学的試料の画像の分類に適用される、深層学習のための実行方法を示す図である。 Figure 7 shows a second aspect of the invention, more precisely a method implementation for deep learning, applied to the classification of images of at least one cytological sample corresponding to a set of image fragments; is.
最初に、図面は、本発明を概略的に開示するものであることに注意しなければならない。これらの図面は、限定することなく与えられた実行例を表し、必ずしも特定の時系列に従うものではない。 At the outset, it should be noted that the drawings disclose the invention schematically. These figures represent examples of implementation given without limitation and do not necessarily follow a particular timeline.
本発明は、複雑で多数の対象のデジタル化された画像のコンピュータビジョンの用途の一般的なカテゴリに属する。本発明は、第1のデジタル化された画像に基づき、好ましくは同じ試料の第2のデジタル化された画像を使用して、細胞学的試料中の少なくとも1つの異常を有する細胞を検出するための独自の方法を取り扱う。第1の画像は透過型電子顕微鏡により得られ、第2の画像は蛍光顕微鏡により得られる。使用される画像は、本方法に適した調製をされ、次いで、細胞学的スライド上に広げられた細胞学的試料の特定のデジタル化から得られる。本発明に係る方法は、所望の分析にしたがって、区別無く、体液に由来する、又は人体からの要素の採取に由来する細胞学的試料を使用することができる。ここで提示される実施形態では、自然排尿からの尿試料が採取される。この文脈においては、細胞学的試料中の少なくとも1つの異常を有する細胞を検出するためのこの方法の結果は、膀胱癌、特に早期段階の膀胱癌、又はいわゆる低悪性度の膀胱癌の診断を助けることに役立つであろう。 The present invention belongs to the general category of computer vision applications of digitized images of complex, large numbers of objects. The present invention is based on a first digitized image, preferably using a second digitized image of the same sample, for detecting cells with at least one abnormality in a cytological sample. handles its own method. A first image is obtained with a transmission electron microscope and a second image is obtained with a fluorescence microscope. The images used are obtained from specific digitization of cytological samples that have been prepared suitable for this method and then spread out on cytological slides. The method according to the invention can use cytological samples, indiscriminately derived from bodily fluids or derived from the collection of elements from the human body, according to the desired analysis. In the embodiment presented here, a urine sample is collected from spontaneous voiding. In this context, the results of this method for detecting cells with at least one abnormality in a cytological sample are diagnostic of bladder cancer, particularly early-stage bladder cancer, or so-called low-grade bladder cancer. would be helpful to help.
以下の説明では、図1に示すように、予備工程、中間工程、又は後続工程であり得るいくつかの工程を含む、好ましい実施形態を説明していく。選択された実施形態によれば、これらの工程のうちの1つ以上が、本発明に係る方法に追加され得るか、又は本発明に係る方法から除外され得ることは理解されるであろう。 The following description describes a preferred embodiment, including several steps that may be preliminary, intermediate, or subsequent, as shown in FIG. It will be appreciated that one or more of these steps may be added to or excluded from the method of the present invention, according to selected embodiments.
有利には、本発明に係る検出方法は、試料から計算されたデータと細胞学から公知の参照データとを組み合わせることができるコンピュータによって実行される処理モジュールを用いて実行される工程を含む。計算されたデータと呼ばれるデータは、少なくとも1つの試料のスライドの少なくとも1つのデジタル化された画像から、処理モジュールによって計算され、収集される。したがって、学習法を使用して、処理モジュールは、試料から又はいくつかの試料から計算され、収集された全てのデータと、細胞学から公知の参照データとを組み合わせることができる。 Advantageously, the detection method according to the invention comprises steps carried out using a computer-implemented processing module capable of combining data calculated from samples and reference data known from cytology. Data, referred to as calculated data, are calculated and collected by the processing module from at least one digitized image of at least one sample slide. Thus, using a learning method, the processing module can combine all data calculated and collected from a sample or from several samples with reference data known from cytology.
ここで提示される好ましい実施形態によれば、本発明に係る検出方法は、予備画像処理工程110を含む。この予備画像処理工程110の目的は、図1~図3に示すように、特に検出方法の結果に干渉し精密度を下げる可能性がある第1のデジタル化された画像1を構成する要素4を無視することによって、細胞の開始選択を可能な限り改善することである。これを行うために、この予備処理工程110は、第1の画像1中に存在する要素4を検出するサブ工程112を含む。この検出するサブ工程112は、少なくとも部分的に比色検出に基づく。当該比色検出は、少なくとも部分的に、第1の画像1からの色の全範囲をいくつかのグループにセグメンテーションすることから構成され得る。最も明るく最も広いグループは画像の背景の色6に対応し、最も暗いグループは細胞核の色に対応する。画像の背景6からの画素ではない画素はいずれも、要素4からの画素であり、生物学的物体からの画素を意味すると考えられる。したがって、画像の背景6が決定され、画像の背景6の部分ではない全てのものが、要素4、すなわち、細胞、細胞群、細胞クラスタ、又は除去されるべき要素に対応する。次に、セグメンテーション法を用いていくつかの画像断片8を生成することによって、画像の背景6から要素4全てが抽出される。検出された様々な要素4を分類するために、核を検出するこの比色検出がさらに使用され、ここでは、このサブ工程は「粗いサブ工程」と呼ばれる。
According to the preferred embodiment presented here, the detection method according to the invention comprises a preliminary
さらに、比色検出を意味する、この核を検出する第1のサブ工程は、検出された各要素4の寸法の測定と組み合わせることができる。例えば、いくつかの核が比色検出によって検出される場合、この要素の測定は、検出された要素4の型を同定することに役立つ。
Furthermore, this first sub-step of detecting nuclei, which means colorimetric detection, can be combined with the measurement of the dimensions of each
したがって、検出するサブ工程112の結果として、核の比色検出を用いて、場合によってはこれらの要素4の測定から、第1の画像1を構成する要素4の、以下のような様々な予備クラスを同定することができる:
-除去されるべき要素:これは、核を有する細胞を構成しない全てのものである。実際に、核を有していない要素はいずれも、判断できず、これは無駄であるか、又は誤った検出であるかのいずれかであり得るので、除去される。
-孤立した細胞:これらは、単一の核のみを含み、結果として孤立した細胞である画像断片である。
-細胞群:これらは、群を成す(接触するか、又は重なり合う)細胞であり、したがっていくつかの核を含む。
-クラスタ:これらは、非常に密な(非常に暗い)細胞の特定の群であり、細胞が非常にはっきりと重なり合う。クラスタを従来の細胞群と区別するのは、クラスタの中に「核」クラスのより大きな表面積を有するという事実である。
Thus, as a result of the detecting
- Elements to be removed: this is everything that does not constitute a cell with a nucleus. In fact, any element that does not have a kernel is removed because it cannot be determined and this can either be futile or a false detection.
- Isolated cells: These are image fragments that contain only a single nucleus and are consequently isolated cells.
- Cell clusters: these are clustered (contacting or overlapping) cells and thus contain several nuclei.
- Clusters: These are specific groups of cells that are very dense (very dark) and the cells overlap very clearly. What distinguishes clusters from conventional cell groups is the fact that they have a larger surface area of the 'nuclear' class within the cluster.
より詳細には、図3は、予備処理工程110を受ける試料の第1の画像1を示す。前述したように、この工程110の間に、第1の画像1は、暗色を有する要素4を取り囲む画像断片8を得るためにセグメンテーションされ、これらの画像断片8は次いで、4つのクラス、すなわち、除去されるべき要素12、孤立した細胞10、細胞群14、及び細胞クラスタ16(これらもまた除去される)に予め分類される。本発明の良好な操作のために、本発明に係る検出方法は、細胞から開始して行われなければならず、当該細胞は、核を含む、孤立した細胞、又は細胞群から個別化された細胞でなければならない。孤立した細胞10及び細胞群14は、フィルタリングサブ工程114の間に、比色検出を使用してフィルターされる。
More particularly, FIG. 3 shows a
結果として、予め分類された細胞群14は、フィルタリングサブ工程114の後に、個別化するサブ工程116を受ける。このサブ工程116は、細胞群14から細胞を個別化することからなる。「個別化する」とは、細胞群14から、核を含む少なくとも1つの細胞を抽出することを意味すると理解される。この個別化するサブ工程116は、「細胞クラスタ」16として予め分類されたものに対しては実行されないことに留意されたい。実際、細胞クラスタ16は、個別化するには複雑すぎる構造であり、それらを考慮すると、使用可能な関連情報よりも多くのエラーが生じることになる。このため、本発明によれば、クラスタ16は使用されない。細胞を個別化するサブ工程116は、第1の画像の勾配の計算を介した輪郭の検出に基づくか、又はラドン(Radon)、ガボール(Gabor)、若しくは多方向多重スケール変換のような多方向性の態様を有する数学的変換の使用を介した輪郭の検出に基づく、新しいセグメンテーションを用いて行われる。場合によっては数理形態学的手法を用いて輪郭を決定した後、閉輪郭に含まれ、したがって細胞に対応するあらゆる構造が抽出される。それは、個別化された細胞であり、本発明に係る方法の以降の工程の対象となるものとして定義される。
As a result,
ここで好ましい実施形態によれば、潜在的に癌性である細胞を検出するための、試料の有用性をリコメンドする任意の工程120を行ってもよい。本実施形態によれば、この有用性をリコメンドする工程120は、本発明に係る方法の進行中に、好ましくは予備処理工程110の最後に、いくつかのレベルで1回以上行うことができる。この有用性をリコメンドする工程120は、試料中での検出に偏りがないように、第1の画像1が核を含む細胞を十分な数含むかどうかを推定することに相当する。これを行うために、第1の画像1中に存在する核を有する細胞の総数が決定される。この細胞の総数は、本発明に係る方法を継続するか否かを決定するユーザに伝達される。好ましくは、この核を有する細胞の総数は、ユーザによって事前に決定される最小の有用性閾値の値と比較される。変形例として、ユーザは、本発明による方法を自動的に継続するか否かを許可するために、処理モジュール内の試料についての最小の有用性閾値の所望の値を再入力してもよい。したがって、本検出方法は、第1の画像1中の核を有する細胞が非常に少ない場合であっても、これらの細胞の総数が最小の有用性閾値の値以上である限り、継続してもよい。例えば、最小の有用性閾値の値は、試料中で検出された核を有する少なくとも7つの細胞に等しく、したがって、核を有する細胞の総数が7以上である場合、本方法は継続する。逆に、核を有する細胞の数が不十分である場合、有用性をリコメンドする工程120は、本検出方法を中断することができる。
According to a preferred embodiment herein, an
ここで好ましい実施形態によれば、試料中の、少なくとも1つの細胞の異常を有する細胞、より正確には潜在的に癌性である細胞を、選択された細胞型から検出するために、類型選択する任意の予備工程130を行うことができる。これを行うために、第1の画像1から開始して、試料からの細胞が測定され、次いで、それらのサイズにしたがって分類される(工程132)。処理モジュールを用いて、それらのサイズにしたがって分類された細胞は、細胞型によってグループ化され、次いで、例えば尿路上皮細胞型又は任意の他の細胞型等の、選択された細胞型にしたがって選択される(工程134)。選択された細胞型について、細胞の異常レベルは、癌の型と相関し得る。変形例によれば、ユーザは、好ましい細胞型自体を定義してもよい。例えば、膀胱癌の診断を補助するために尿の細胞学的試料に適用される検出方法については、好ましい細胞型は、尿路上皮型である。一般に、尿路上皮細胞の調査は、特に遭遇する異常に基づいて癌の段階を決定するために、膀胱癌の診断を補助するための良い指標である。
According to a preferred embodiment here, the type selection is performed in order to detect from the selected cell types cells with at least one cell abnormality, more precisely cells that are potentially cancerous, in the sample. Any
予備画像処理工程110、試料の有用性をリコメンドする任意の工程120、及び類型分類の任意の予備工程130の後に、1つの核を含み、1つの選択された細胞型を含む、孤立した細胞、又は個別化された細胞の精密な選択が達成される。
isolated cells containing one nucleus and containing one selected cell type, after a
思い出されるように、本発明に係る方法は、少なくとも1つの第1の画像に基づき、細胞学的試料中の少なくとも1つの異常を有する細胞の検出をもたらす。試料の細胞の異常レベルは、細胞学的試料で遭遇する細胞の異常の数及び型と相関している。言い換えれば、本発明に係る方法は、証明された異常レベルと呼ばれる細胞の異常レベルのクラス、又はゼロと呼ばれる細胞の異常レベルのクラスのいずれかに試料を分類することに役立てることができる。 Recall that the method according to the invention results in the detection of cells with at least one abnormality in the cytological sample based on at least one first image. The level of cellular abnormalities in a sample correlates with the number and type of cellular abnormalities encountered in the cytological sample. In other words, the method according to the invention can serve to classify a sample either into a class of abnormal levels of cells called proven abnormal levels or into a class of abnormal levels of cells called zero.
これを行うために、図1に示される好ましい実施形態は、試料中の細胞の異常を検出する工程140をさらに含む。本発明によれば、異常を有する細胞は、参照と呼ばれるデータから逸脱した、すなわち基準から逸脱した異常のエキスパート特性を有する細胞として定義される。言い換えれば、それは少なくとも1つの異常を有する細胞を含み、1つの異常のエキスパート特性が正常でないことを意味する。したがって、1つの異常のエキスパート特性の計算は、基準からの偏差を決定し、したがって異常の有無を決定することに役立つデータを得ることに役立つ。異常のエキスパート特性の計算は、測定、又は任意の他の型の数学的方法を意味すると理解される。本発明によれば、計算される異常のエキスパート特性は、核の特性であり、特に、細胞の核と細胞質との間のサイズ比、又は核の位置の測定、又は核の比色測定に対応する。より正確には、異常のエキスパート特性は、細胞中の核の表面積比、又は核の不規則性、又は斑状比色、又は核のハイパー比色に対応する。前述した様々な異常のエキスパート特性は、限定するものではないが、試料において計算された値にしたがって異常を発見することができる。他の型の異常のエキスパート特性を計算し、区別することなく、細胞を分類するためのパラメータとして使用してもよいことを理解されたい。
To do this, the preferred embodiment shown in FIG. 1 further includes a
各細胞において探索され検出された異常は、より具体的には、各細胞の核に関連している。そのためには、それに関連する異常を検出できるようにするために、核の精密な検出が必要である。 The abnormalities sought and detected in each cell are more specifically related to the nucleus of each cell. This requires precise detection of nuclei in order to be able to detect abnormalities associated therewith.
核の精密な検出は、セグメンテーションによって行われる。このセグメンテーションは特に、比色のみを使用した粗いセグメンテーションを改善することによって行うことができる。本明細書で先に説明したこの技術は、境界包絡線に基づき、核の周りに矩形を形成することからなることが好ましい。この境界包絡線は、常に細胞に含まれ、(核の全表面の)10~40%、好ましくは20~30%だけ核を越えて延在する、核の周りの区域の境界を定める。図4及び5は、それぞれ、精密な核の検出結果を示す。 Precise detection of nuclei is performed by segmentation. This segmentation can be done in particular by improving the coarse segmentation using only colorimetry. This technique, previously described herein, preferably consists of forming a rectangle around the kernel based on the bounding envelope. This bounding envelope delimits an area around the nucleus that is always contained in the cell and extends beyond the nucleus by 10-40%, preferably 20-30% (of the total surface of the nucleus). Figures 4 and 5 show the fine nuclear detection results, respectively.
本実施形態によれば、核は、第1のセグメンテーションを用いた核の粗い検出の間の予備画像処理工程110の間にすでに検出されていてもよい。実行例は、核の粗い検出に使用される境界包絡線を考慮することと、ガウス混合モデルを使用することによって、この包絡線内の核の色分布及び背景の色分布を推定することと、からなる。その後、同じラベルを有する連結領域を好むエネルギー関数を用いて画素のラベル上にランダムマルコフ連鎖を構築し、その値を干渉するためにグラフカットに基づいて最適化を実行するために使用される。この推定は、バウンディングボックスから抽出されたオリジナルよりも正確であり得るので、これらの2つの工程は収束するまで繰り返される。
According to this embodiment, the nuclei may already be detected during the preliminary
試料からの細胞における細胞の異常を検出する工程140は、部分的には、少なくとも2つの別個の異常のエキスパート特性の計算によって、行われる(工程142)。 Detecting 140 cellular anomalies in cells from the sample is performed, in part, by computing expert properties of at least two distinct anomalies (step 142).
以下の説明では、それぞれ形態学的な細胞の異常の有無を示す4つの型の異常のエキスパート特性の計算について説明する。 The following discussion describes the calculation of expert properties for four types of abnormalities, each indicative of the presence or absence of morphological cellular abnormalities.
第1に、細胞内の核/細胞質の比率の異常のエキスパート特性の計算について説明していく。 First, we describe the calculation of the expert properties of abnormal nuclear/cytoplasmic ratios in cells.
自動処理モジュールを用いてNCR(Nucleus Cell Ratio(核細胞比率))を計算することが提案される。当該比率は、以下の式によって定義される:
NCR=核の最大直径の長さ/対応する細胞の最大直径の長さ。
It is proposed to calculate the NCR (Nucleus Cell Ratio) using an automated processing module. The ratio is defined by the following formula:
NCR=Length of maximal diameter of nucleus/Length of maximal diameter of corresponding cell.
図5は、NCR比率の計算の実行例を示す。以下は、処理モジュールによる計算の工程である:
1.細胞に対応する最長軸をトレースする;
2.細胞によって区切られた軸の長さを計算する;
3.核によって区切られたこの同じ軸の長さを計算する。
FIG. 5 shows an example implementation of the calculation of the NCR ratio. The following are the steps of computation by the processing module:
1. trace the longest axis corresponding to the cell;
2. Calculate the length of the axis bounded by the cell;
3. Calculate the length of this same axis bounded by the nucleus.
この比率を計算する別の方法も、表面積の計算に基づき提案される。
NCR=(核の表面積/細胞の表面積)1/2
式中:
細胞の表面積=細胞中の画素数;核の表面積=核中の画素数。
Another method of calculating this ratio is also proposed based on surface area calculations.
NCR = (nuclear surface area/cell surface area) 1/2
In the formula:
Cell surface area = number of pixels in the cell; nuclear surface area = number of pixels in the nucleus.
この比率は、核が細胞内にあるので、1未満の数である。NCRが1に非常に近い場合、細胞は「裸核」であると見なされ、したがって、本方法の間に処理モジュールによって除去され得る。したがって、それを超えると細胞が「裸核」と見なされる閾値を入力することができるように、ユーザに制御させることが提案される。正常なNCR、臨界のNCR、又は正常でないNCRを示す閾値についても、同じことが提案される。これらの閾値は、デフォルトで以下の値に初期化され得る:
a)NCR<0.5 正常なNCRに対応する
b)0.5<NCR<0.7 臨界のNCRに対応する
c)NCR>0.7 正常でないNCRに対応する
d)NCR>0.9 裸核に対応し、カウントされず、「除去されるべき」
より正確には、核/細胞比率は、細胞の最大直径と核の最大直径との間の比率から計算される。細胞があまり球形でない場合、実際の直径は使用されず、代わりに、細胞の最大直径に対応する、細胞の端から端までの距離又は長さが使用される。0.9~1の間に含まれる全ての比率は、裸核に対応するので、解釈不可能である。0.7を超える比率は、大きな異常に対応し、0.5~0.7の間に含まれる比率は、小さな異常に対応する。
This ratio is a number less than one because the nucleus is inside the cell. If the NCR is very close to 1, the cell is considered "naked nucleus" and can therefore be removed by the processing module during the method. Therefore, it is proposed to let the user control the ability to enter a threshold above which cells are considered "naked". The same is suggested for thresholds indicating normal NCR, critical NCR, or non-normal NCR. These thresholds may be initialized by default to the following values:
a) NCR<0.5 corresponding to normal NCR b) 0.5<NCR<0.7 corresponding to critical NCR c) NCR>0.7 corresponding to abnormal NCR d) NCR>0.9 Corresponds to bare nuclei, not counted and "should be removed"
More precisely, the nucleus/cell ratio is calculated from the ratio between the maximum diameter of the cell and the maximum diameter of the nucleus. If the cells are less spherical, the actual diameter is not used, but instead the distance or length across the cell that corresponds to the maximum diameter of the cell is used. All ratios contained between 0.9 and 1 correspond to bare nuclei and are therefore uninterpretable. A ratio above 0.7 corresponds to a large anomaly and a ratio comprised between 0.5 and 0.7 corresponds to a small anomaly.
第2に、別の異常のエキスパート特性、核の不規則性の計算を説明していく。 Second, we describe another anomaly expert property, the computation of kernel irregularities.
不規則な核とは、その輪郭が、参照と呼ばれる非常に滑らかで規則的な従来の核輪郭形状から逸脱する、任意の核を意味すると理解される。それは、角点又はコーナー(corner)を有する輪郭とみなすこともできる。 An irregular nucleus is understood to mean any nucleus whose contour deviates from a very smooth and regular conventional nucleus contour shape called reference. It can also be viewed as a contour with corner points or corners.
これを行うために、3つの方法を介して核の不規則性を計算することが提案される。記載される第3の方法は、他の2つの方法を合わせたものである。 To do this, it is proposed to compute the kernel irregularities via three methods. The third method described is an amalgamation of the other two methods.
最初に、参照細胞からの参照核からの差の計算に基づく第1の方法を説明する。 First, we describe the first method, which is based on calculating the difference from the reference cell to the reference nucleus.
計算される差は、表面積の差、又は周の差、又は重心の差、核の各領域における画素の差、各核(参照の核および実際の核)の輪郭の長さの間の差、各核の重心の間の線形差、各核にリンクする凸領域の画素数の間の差、実際の核の偏心と参照の核の偏心との間の差等の任意の他の差であり得る。円の場合は偏心e=0、楕円(ellipse)の場合は0<e<1、放物線の場合はe=1であり、凸領域に関しての違いを思い出してほしい。 The difference calculated is the difference in surface area, or the difference in perimeter, or the difference in centroids, the pixel difference in each region of the nucleus, the difference between the contour lengths of each nucleus (reference nucleus and the actual nucleus), Any other difference, such as the linear difference between the centroids of each kernel, the difference between the number of pixels in the convex region linked to each kernel, the difference between the eccentricity of the actual nucleus and the eccentricity of the reference nucleus, etc. obtain. Eccentricity e=0 for a circle, 0<e<1 for an ellipse, e=1 for a parabola, and recall the difference for convex regions.
とりわけ、この方法は、核の実際の輪郭と、核の境界包絡線に含まれるC2ランクの閉じた凸曲線に対応する核の参照輪郭との間の差の計算に基づく。核の参照輪郭を決定するために、核の境界包絡線は、トレースされた長さが核の最大直径に対応する境界矩形として定義される。境界矩形を使用して、処理モジュールは、核の輪郭を形成するその内側のC2曲線を決定していく。 In particular, this method is based on calculating the difference between the actual contour of the nucleus and the reference contour of the nucleus corresponding to a closed convex curve of C2 rank contained in the boundary envelope of the nucleus. To determine the nuclear reference contour, the nuclear bounding envelope is defined as the bounding rectangle whose traced length corresponds to the maximum diameter of the nucleus. Using the bounding rectangle, the processing module determines the inner C2 curve that forms the outline of the nucleus.
例えば、楕円(oval)はC2ランクの閉じた凸曲線である。同様に、円又は楕円(ellipse)は、楕円(oval)型のC2の閉じた凸曲線の特定の場合である。 For example, an oval is a closed convex curve of C2 rank. Similarly, a circle or ellipse is a particular case of a closed convex curve of C2 of oval type.
次に、線形フィルタリング又はマスキング(Sobel、Prewitt、又はRoberts等)による勾配検出器、輪郭の抽出のための解析的アプローチ(canny又はDericheフィルタ等)、初期輪郭として以前に見られた境界包絡線をとることによる活性輪郭、レベルセット、多重スケール及び多方向変換によって抽出された輪郭等の、輪郭の抽出のための任意の方法によって、核の輪郭が抽出される。核の輪郭の計算を用いた核の不規則性の異常のエキスパート特性を計算するための工程は、以下に要約される:
1.輪郭抽出法を使用することによって核の実際の輪郭を計算する;
2.核の最大直径を決定する;
3.長さが核の最大直径に等しい、核を囲む矩形を意味する、核の境界包絡線をトレースする;
4.境界包絡線に基づいて、推定される輪郭を形成するC2ランクの閉じた凸曲線をトレースする;
5.核の実際の輪郭と、対応する工程4でトレースされた曲線に対応する参照核の参照輪郭との間の差の値を、試料からのデータと、様々な形状の異常のエキスパート特性からの参照データとを計算および結合することによって計算する;
6.核の参照輪郭と実際の輪郭との間の値の差を使用して、ユーザによって予め定められた若しくは入力された閾値の関数として異常の存在を決定するか、又はこのデータを異常のエキスパート特性における他のデータと組み合わせ、ユーザによって予め定められた若しくは入力された閾値の関数として異常の存在を決定する。
Next, gradient detectors by linear filtering or masking (Sobel, Prewitt, or Roberts, etc.), analytical approaches for contour extraction (canny or Deriche filters, etc.), and the previously seen boundary envelopes as initial contours. The core contours are extracted by any method for contour extraction, such as active contours by taking, contours extracted by level sets, multi-scale and multi-directional transforms. The steps for calculating the expert properties of nuclear irregularity anomalies using the nuclear contour calculation are summarized below:
1. Calculate the actual contour of the nucleus by using the contour extraction method;
2. determining the maximum diameter of the nucleus;
3. trace the boundary envelope of the nucleus, which means a rectangle enclosing the nucleus whose length is equal to the maximum diameter of the nucleus;
4. Based on the boundary envelope, trace a closed convex curve of rank C2 that forms the estimated contour;
5. The value of the difference between the actual contour of the nucleus and the reference contour of the reference nucleus corresponding to the corresponding curve traced in
6. Differences in values between reference and actual contours of the nuclei are used to determine the presence of anomalies as a function of thresholds predetermined or entered by the user, or this data is used to determine the expert properties of anomalies. to determine the presence of anomalies as a function of thresholds predetermined or input by the user.
これらの特性は、ラージマージンセパレータ型分類器(large margin separator type classifier)(マージンの最大化に基づく教師あり学習技術。マージンとは、サポートベクトルと呼ばれる、分離境界と、最も近い試料との間の距離である。この技術は、学習例に基づいて最大マージン分離境界を見つけることからなる。)、及び/又は学習によって核の不規則性を決定し得るニューラルネットワークによる入力で使用することができることが理解されよう。 These properties are called the large margin separator type classifier (a supervised learning technique based on maximizing the margin. Margin is the distance between the separation boundary, called the support vector, and the nearest sample). This technique consists of finding the maximum margin separation boundary based on training examples), and/or can be used with input by a neural network that can determine kernel irregularities by training. be understood.
次に、核の輪郭内の角点の検出に基づいて、核の不規則性を計算する第2の方法を説明していく。 A second method of calculating kernel irregularities based on the detection of corner points within the contour of the kernel will now be described.
ここでの目的は、「コーナー」型の特性点を検出し、対応する形成された角度を計算し、検出されたコーナーの数とそれに対応する角度を考慮して核の不規則性の程度を推定することにより、角点を検出することである。 The aim here is to detect characteristic points of the 'corner' type, calculate the corresponding formed angles, and consider the number of detected corners and their corresponding angles to estimate the degree of irregularity of the nucleus. It is to detect corner points by estimating.
ここで、コーナーは、核膜輪郭の角度として定義される。コーナーは、核膜の2つの線の交点、又は核膜の2つの輪郭の交点に対応し、コーナーの近傍とは十分に異なる方位を有する。 Here the corner is defined as the angle of the nuclear envelope contour. A corner corresponds to the intersection of two lines of the nuclear envelope, or the intersection of two contours of the nuclear envelope, and has a sufficiently different orientation than the neighborhood of the corner.
コーナーは一般に、ハリス検出器(Harris detector)によって検出されるが、これはスケール不変性の特性を検証せず、単一スケール内のコーナーのみを検出することができ、特に画像が低コントラストである場合に、誤ったコーナーを検出するか、又はいくつかの重要なコーナーを無視することにつながり得る場合を除く。 Corners are commonly detected by a Harris detector, which does not verify the scale-invariant property and can only detect corners within a single scale, especially when the image is of low contrast. Except in some cases it can lead to detecting false corners or ignoring some important corners.
ハリス検出器の別の大きな欠点は、一般的にコーナーの過剰検出を生じることである。これを改善するために、ハリス検出器の後に、Edward Roston及びTom Drummondによって最初に開発されたFASTアルゴリズム(Accelerated Segment Testの機能)を使用することが提案される。実際、この後者のアルゴリズムは、余分なコーナーを除去するのに有用であることが分かる。その結果、それは、ハリス検出器によって検出された誤ったコーナーを除去するために適用され得る。 Another major drawback of Harris detectors is that they typically result in overdetection of corners. To remedy this, it is proposed to use the FAST algorithm (a function of Accelerated Segment Test) originally developed by Edward Roston and Tom Drummond after the Harris detector. In practice, this latter algorithm turns out to be useful for removing superfluous corners. As a result, it can be applied to remove false corners detected by the Harris detector.
さらに、本発明の範囲で提案される独創的で進歩性があるアイデアは、輪郭変換(多重スケール多方位変換)、核の輪郭に対応するコーナーを検出し、次いで方位を抽出し、核の不規則性を推定するためのハリス検出器及びFASTアルゴリズム(Accelerated Segment Testの機能)を組み合わせることである。目的は、核膜を定義する核の輪郭の不規則性を適切に推定することである。当該独創的なアイデアは、核の輪郭の不規則性を適切に推定することができるように、輪郭を明らかにし、輪郭を完全に強調することに優れた変換を使用することである。そのようにして、推定は、従来通り初期の画像領域で行われるのではなく、核の輪郭の不規則性を適切に検出するために、輪郭が明瞭に示され、十分に強調され得る様々なスケールで構成される領域で行われ得る。したがって、変換は、曲線及び輪郭を完全に表す輪郭型の多重スケール及び多方向の変換である。これは、各スケールに対して様々な方位角に沿った分解を可能にする多重スケール幾何解析ツールである。従来の波型変換とは異なり、輪郭型は画像の異方性の特性(輪郭、端及びテクスチャ情報)を完全に捉える。したがって、核の輪郭の不規則性を明らかにするためのその使用は、明らかに非常に適切である。 In addition, the original and inventive idea proposed within the scope of the present invention is contour transformation (multi-scale multi-orientation transformation), detecting the corner corresponding to the contour of the nucleus, then extracting the orientation, It is to combine the Harris detector and the FAST algorithm (a function of Accelerated Segment Test) for estimating regularity. The goal is to adequately estimate the irregularities of the nuclear contours that define the nuclear envelope. The original idea is to use transforms that are good at revealing contours and perfectly enhancing contours so that irregularities in the contours of the nuclei can be properly estimated. As such, the estimation is not conventionally performed on the initial image region, but rather on various images whose contours are clearly visible and can be sufficiently enhanced in order to adequately detect irregularities in the contours of the nuclei. It can be done in a region composed of scales. The transformation is therefore a contour-type multi-scale and multi-directional transformation that perfectly represents curves and contours. This is a multi-scale geometric analysis tool that allows decomposition along different azimuthal angles for each scale. Unlike conventional wave transforms, the contour model fully captures the anisotropic properties of the image (contours, edges and texture information). Its use to reveal irregularities in the contour of the nucleus is therefore clearly very relevant.
以下の説明は、この第2の方法の範囲において提案される核の不規則性の計算のための工程を詳述する:
1.輪郭変換を使用することによって第1の画像を分解する。様々なスケール及び様々な方位に対応するいくつかの画像が存在し得る;
2.各スケールの各画素について、相関行列Me(ハリス検出器に関連する行列)を計算する;
3.下記式によって推定される、各スケールに対応する各画素についてのコーナーの強度(コーナー応答関数)の推定:
![]()
より正確には、コーナーの強度は、コーナーの検出時に高い値を返す関数である「コーナー応答関数」を介して検出される。ある点におけるこの関数の値が大きいほど、又は強いほど、それがコーナーである可能性が高くなる。係数αは、検出器の感度を定義する。αが大きくなるにつれて、感度は低くなり、コーナーの数は少なくなる。一般に、αの値は、0.04~0.06に設定される。この値は、より大きくてもよいが、0.25を超えない。
4.各画素のコーナー強度を計算した後、検出されたコーナーに対応し得る高い値のRθを有する点の位置を保存する。この第1の検出は、実際のコーナーと誤ったコーナーの両方が含まれている可能性があるため(コーナーの過剰検出の問題)、後で改善され得る;
5.検出された点pを囲む円の周りの密度を判定する目的で、FASTアルゴリズムを適用する。円の中に、全ての点が強度(p)+tより明るい、又は終点(end)強度(p)-tより暗い(tは閾値)、n個の連続する点のセットがあるかどうかを検証する。pがコーナーである場合;
6.互いに隣接する検出されたコーナーを除去するために、ノンマキシマルサプレッション(non-maximal suppression)を使用する:
6.1.全ての検出されたコーナーについてスコア関数Vを算出する。ここで、Vは、コーナーpとそれを取り囲む16画素との間の絶対差の和である;
6.2.最も低いスコアVを有するコーナーを除去するために、隣接するコーナーのスコアVを比較する。
7.それをなす2つのセグメント間の方位の差を計算することによって、検出された各コーナー又は角点の角度を計算する;
例えば、1つ目のセグメントの方位が60°であり、2つ目のセグメントの方位が45°である場合、絶対値の差は60°-45°=15°である。
あるいは、角度の計算は、推定されたセグメントからではなく、第1の画像1の画素の値を直接使用して行われてもよい。
8.検出された角点又はコーナーの数からのデータとそれぞれの角度からのデータとを組み合わせることにより、核の不規則性の程度を計算する;
不規則性の程度の計算の例:

9.工程9で得られた結果に基づき、核の不規則性のレベルを、ユーザによって予め決定された、又は入力された閾値の関数として、決定する。
The following description details the steps for the computation of nuclear irregularities proposed in the scope of this second method:
1. Decompose the first image by using a contour transform. There may be several images corresponding to different scales and different orientations;
2. Compute the correlation matrix Me (the matrix associated with the Harris detector) for each pixel of each scale;
3. An estimate of the intensity of the corner (corner response function) for each pixel corresponding to each scale, estimated by the following formula:
![]()
More precisely, corner strength is detected via a "corner response function," which is a function that returns a high value when a corner is detected. The larger or stronger the value of this function at a point, the more likely it is a corner. The factor α defines the sensitivity of the detector. As α increases, the sensitivity decreases and the number of corners decreases. Generally, the value of α is set between 0.04 and 0.06. This value may be higher, but does not exceed 0.25.
4. After calculating the corner intensity for each pixel, save the locations of points with high values of R θ that may correspond to detected corners. This first detection may contain both real and false corners (corner overdetection problem), so it can be improved later;
5. In order to determine the density around the circle surrounding the detected point p, we apply the FAST algorithm. Test if there is a set of n consecutive points in the circle, all points brighter than intensity(p)+t or darker than end(end) intensity(p)−t, where t is a threshold do. if p is a corner;
6. Use non-maximal suppression to eliminate detected corners that are adjacent to each other:
6.1. Compute a score function V for all detected corners. where V is the sum of absolute differences between corner p and the 16 pixels surrounding it;
6.2. To remove the corner with the lowest score V, compare the scores V of adjacent corners.
7. Calculate the angle of each detected corner or corner point by calculating the difference in orientation between the two segments that form it;
For example, if the orientation of the first segment is 60° and the orientation of the second segment is 45°, the absolute difference is 60° - 45° = 15°.
Alternatively, the angle calculation may be done using the pixel values of the
8. Calculate the degree of nuclear irregularity by combining the data from the number of detected corner points or corners with the data from each angle;
An example of calculating the degree of irregularity:
9. Based on the results obtained in step 9, the level of nuclear irregularity is determined as a function of a threshold predetermined or entered by the user.
次に、核の不規則性を計算する第1の方法及び第2の方法を合わせることからなる第3の方法を説明する。 A third method, which consists of combining the first and second methods of calculating the kernel irregularity, will now be described.
2つの前述の方法を合わせることが提案される。2つの前述の方法からの結果は、例えばファジー論理のようなデータマージ手法によって、組み合わせられてもよい。ここで、以下では、適用可能なルールの例を示す。 It is proposed to combine the two aforementioned methods. The results from the two aforementioned methods may be combined, for example by data merging techniques such as fuzzy logic. Here below are examples of applicable rules.
1.第1の方法が結果として「規則的な核」を与え、第2の方法が結果として「低い程度の不規則性を有する核」を与える場合、最終決定は「規則的な核」となる;
2.第1の方法が結果として「不規則な核」を与え、第2の方法が結果として「中程度の不規則性を有する核」を与える場合、最終決定は「不規則な核」となる;
3.第1の方法が結果として「不規則な核」を与え、第2の方法が結果として「不規則性がゼロの核」を与える場合、最終決定は「規則的な核」となる。
1. If the first method results in "regular nuclei" and the second method results in "nuclei with a low degree of irregularity", the final determination is "regular nuclei";
2. If the first method results in "irregular nuclei" and the second method results in "moderately irregular nuclei", the final determination is "irregular nuclei";
3. If the first method results in an "irregular kernel" and the second method results in a "zero irregularity kernel", the final decision is a "regular kernel".
第3に、別の異常のエキスパート特性、核のハイパー比色の計算を説明していく。 Third, we describe the calculation of another anomaly expert property, the kernel hypercolorimetric.
ここでは、核のハイパー比色の程度を計算することが提案される。以下は、工程である:
1.各細胞について、核を構成する画素の光強度の和を核内の画素数で割ったものに対応する、その核の平均光強度を計算する;
2.第1の画像1に存在する全ての細胞の核の平均光強度の平均Irefを計算する。Irefは、細胞の全ての核の平均光強度の和を細胞の数で割ったものである;
3.チェックされる細胞の核の平均光強度とIrefとの間の差として、ハイパー比色の強度を計算する:
ハイパー比色閾値は、分類方法によって(例えば、SVM又はニューラルネットワーク型学習によって)決定される。このようにして、得られた値及びハイパー比色閾値にしたがって、細胞がハイパー比色であるか否かが決定される。
Here, it is proposed to calculate the degree of nuclear hypercolorimetry. Below are the steps:
1. For each cell, calculate the average light intensity of that nucleus, which corresponds to the sum of the light intensities of the pixels that make up the nucleus divided by the number of pixels in the nucleus;
2. Calculate the average Iref of the average light intensity of the nuclei of all cells present in the
3. Calculate the hypercolorimetric intensity as the difference between the average light intensity of the nucleus of the cell being checked and Iref:
A hypercolorimetric threshold is determined by a classification method (eg, by SVM or neural network-based learning). Thus, according to the value obtained and the hypercolorimetric threshold, it is determined whether the cell is hypercolorimetric.
核のハイパー比色を計算するために、前述の一連の工程において、平均の計算は、中央値の計算によって任意に置き換えることができる。 To calculate the nuclear hypercolorimetry, in the above sequence of steps, the average calculation can optionally be replaced by the median calculation.
第4に、別の異常のエキスパート特性の計算、核の斑状比色について説明していく。 Fourth, we describe the computation of another anomaly expert characteristic, the nuclear patchy colorimetry.
これを行うために、核の斑状比色を推定するための3つの方法が提案される。第1の方法は、画像からの画素の光強度の値に基づいている。第2の方法は、変換された領域における推定に基づいており、画像領域における推定には基づかない(言い換えれば、画像からの画素の値には適用されず、変換された領域における係数の値に適用される)。第3の方法は、前述の2つの方法を合わせることからなる。 To do this, three methods are proposed for estimating the patchy colorimetry of nuclei. The first method is based on pixel light intensity values from the image. The second method is based on estimation in the transformed domain and not in the image domain (in other words, it is not applied to the values of the pixels from the image, but to the values of the coefficients in the transformed domain). applicable). A third method consists of combining the two methods described above.
まず、画像領域における推定に基づく第1の方法を説明していく:
1.分散Vを計算する;
2.画像のヒストグラムを計算し、ヒストグラム内の多数のピーク(Num peaks)を検出する(2つ以上のピークがある場合、核は均一な色を有していないことを意味する);
3.コヒーレンスマップを形成するために、画像(又はブロック)からの各画素について、勾配に基づいてテンソルを計算する。画素が位置するゾーンに対するコヒーレンスの平均よりも大きなコヒーレンスを画素が有する場合、それは不均一ゾーンの特性である:
コヒーレンス(x,y)>平均((x,y)を囲むゾーン)+3*標準偏差((x,y)を囲むゾーン)である場合、(x,y)は不均一ゾーンに属する;
コヒーレンスによって検出された不均一点(又はブロック)の和(Num coh)を計算する;
4.これらの特性[V、Num peaks及びNum coh]を合わせ、それらを用いて核の斑状比色を検出する。
First, we describe the first method based on estimation in the image domain:
1. Calculate the variance V;
2. Compute a histogram of the image and detect a number of peaks (Num peaks) in the histogram (if there are more than 2 peaks, it means the nuclei do not have a uniform color);
3. To form the coherence map, for each pixel from the image (or block) we compute a tensor based on the gradient. If a pixel has coherence greater than the average coherence for the zone in which it is located, it is characteristic of a non-uniform zone:
(x,y) belongs to the heterogeneous zone if coherence (x,y)>mean(zone around (x,y))+3*standard deviation(zone around (x,y));
Calculate the sum (Num coh) of nonuniform points (or blocks) detected by coherence;
4. These properties [V, Num peaks and Num coh] are combined and used to detect nuclear patchy colorimetry.
これらの特性は、SVM又はニューラルネットワーク型分類器への入力として使用され得ることが理解される。 It is understood that these properties can be used as inputs to SVM or neural network type classifiers.
次に、変換された領域における推定に基づく第2の方法を説明していく:
罹患したゾーン(核を意味する)中の最低3つの斑点の存在によって斑状比色を定義する。ここで、目的は、ゾーン内の最低3つの閉じた輪郭を検出することである。そのために、輪郭変換等の適切な変換によって輪郭を検出することが提案される。この変換は、均一ゾーンでは低いエネルギー係数(0近傍)を有し、一般的に画像輪郭に対応する異方性ゾーン(不均一)では非常に高いエネルギー係数を有する、という違いを有する。斑状比色の推定は、以下の工程によって行われる:
1.輪郭変換又は波動原子変換(wave atom transformation)等の、適切な多重スケール、多方向の変換により画像を分解する;
2.画像の輪郭に対応する係数のみを維持するために閾値処理を適用することにより、高エネルギー成分ゾーンを検出する;
3.輪郭において選択された(閾値処理された)係数に非線形コントラスト強調関数を適用する;
4.逆変換を使用することによって、選択された係数から輪郭画像を再構成する;
5.輪郭画像内の閉輪郭を検出し、それらをカウントする;
6.3つより多い閉輪郭がある場合、核は斑状比色を有すると結論づけられる。
We now describe a second method based on estimation in the transformed domain:
A patchy colorimetry is defined by the presence of a minimum of 3 patches in the affected zone (meaning the nucleus). Here, the goal is to detect at least three closed contours within the zone. For this purpose, it is proposed to detect contours by suitable transformations such as contour transformation. This transform has the difference that uniform zones have low energy coefficients (near 0) and very high energy coefficients in anisotropic zones (inhomogeneous), which typically correspond to image contours. Estimation of patchy colorimetry is done by the following steps:
1. decompose the image by suitable multi-scale, multi-directional transformations, such as contour transformations or wave atom transformations;
2. detecting high-energy component zones by applying thresholding to retain only coefficients corresponding to image contours;
3. applying a non-linear contrast enhancement function to selected (thresholded) coefficients in the contour;
4. reconstruct a contour image from the selected coefficients by using an inverse transform;
5. Detect closed contours in the contour image and count them;
6. If there are more than 3 closed contours, it is concluded that the nucleus has patchy colorimetry.
次に、斑状比色を計算する第1の方法及び第2の方法を合わせることからなる第3の方法を説明する。 A third method, which consists of combining the first and second methods of calculating the mottled colorimetry, will now be described.
核の不規則性の計算と同様に、各細胞の核に対する斑状比色の異常のエキスパート特性のための精密な結果を得るために、前述の2つの方法それぞれによって得られた結果を組み合わせることが、ここで提案される。 Similar to the calculation of nuclear irregularities, it is possible to combine the results obtained by each of the two methods described above to obtain precise results for the expert characterization of patchy colorimetric abnormalities for each cell's nucleus. , as suggested here.
処理モジュールを用いて、一連の計算された異常のエキスパート特性(核/細胞比率、核の不規則性、ハイパー比色、及び斑状比色)は、細胞学から公知の参照データからなる参照データと組み合わされることが理解されるであろう。特に、これらの計算されたデータは、細胞が正常であるか、又は少なくとも1つの異常を有するかどうかを判定する(工程144)ために、そのままで、又は分類器によって、又は深層学習によって計算され生成された他の特性と合わせて、使用され得る。試料が少なくとも1つの異常を有する少なくとも1つの細胞を含まない場合、本検出方法はここで停止し、試料が少なくとも1つの異常を有する少なくとも1つの細胞を有する場合、本検出方法は継続する。 Using the processing module, a series of calculated abnormality expert characteristics (nucleus/cell ratio, nuclear irregularities, hypercolorimetry, and patchy colorimetry) are obtained with reference data consisting of reference data known from cytology. It will be understood that they are combined. In particular, these calculated data are calculated as is or by a classifier or by deep learning to determine whether the cell is normal or has at least one abnormality (step 144). It can be used in conjunction with other generated properties. If the sample does not contain at least one cell with at least one abnormality, the detection method stops here, and if the sample does have at least one cell with at least one abnormality, the detection method continues.
細胞の異常を検出する工程140の最後に、処理モジュールは、細胞学的試料中の少なくとも1つの異常を有する細胞の総数を決定する(工程146)。 At the end of detecting cellular abnormalities step 140, the processing module determines the total number of cells with at least one abnormality in the cytological sample (step 146).
次に、ここでは、全体としての試料の異常レベルにしたがって、試料を特性付ける第1の工程150を含んでもよい。これを行うために、検出された少なくとも1つの異常を有する細胞の総数は、試料の異常レベルの閾値と比較される。この試料の異常レベルの閾値は、本方法のためにユーザによって予め定義される。閾値は、各々が少なくとも1つの異常を有する少なくとも3つの細胞に対応する。この異常レベルの閾値は、分類結果の所望の精密度に応じて、ユーザによって予め任意の方法で定義されてもよい。
Next, this may include a
本発明によれば、少なくとも1つの異常を有する細胞の総数が異常レベルの閾値未満である場合、細胞学的試料は、異常レベルがゼロである試料を表すクラス152に分類され、少なくとも1つの異常を有する細胞の総数が異常レベルの閾値以上である場合、細胞学的試料は、無視できない異常レベルを有するクラスである試料を表すクラス154に分類され、これは低い異常レベル及び高い異常レベルを意味する(154)。
According to the present invention, if the total number of cells with at least one abnormality is below the threshold level of abnormality, the cytological sample is classified into
端的には、別の態様によれば、本発明は、この段階でこのようにして、細胞学的試料を、細胞の異常レベルがゼロであるクラス152と、無視できない細胞の異常レベルを有するクラス154と、の2つのクラスにしたがって分類することに役立つ。この結果は、癌性細胞の特性である細胞の異常を指摘することに役立つ。このように、迅速かつ信頼性の高い標準化された結果を提供することで、細胞技師及び細胞病理学者が癌を診断することに役立つ。
Briefly, according to another aspect, the present invention at this stage thus divides the cytological sample into
図6に示されるように、本検出方法は、試料の細胞の異常レベルにしたがって、特に試料中の細胞の異常レベルが低いことを具体的に示す、試料を特性付ける第2の工程160を含んでもよい。この異常レベルは、まだ顕著な形態学的変形を受けていない細胞に対応する。好ましくは、この特定の実施形態によれば、本発明は、「低」と呼ばれる細胞の異常レベルのクラス、又は「高」と呼ばれる細胞の異常クラス、又は「ゼロ」と呼ばれる細胞の異常レベルのクラスのいずれかに、試料をより正確に分類することに役立つ。
As shown in FIG. 6, the detection method includes a
正常でない細胞の検出の後の、試料からのこれらの細胞の形態学的異常レベル又は放射分析的異常レベルによる試料の分類は、癌の診断に関連する医師のための確かな助けとなる。実際、「低」と呼ばれる細胞の異常レベルは、「低悪性度」呼ばれる早期段階の癌と関連し、「高」と呼ばれる異常レベルは、「高悪性度」と呼ばれる進行した段階の癌と関連している可能性がある。 After the detection of abnormal cells, the classification of the sample according to the morphological or radiometric abnormal levels of these cells from the sample is of great help to the physician involved in diagnosing cancer. Indeed, abnormal levels of cells called "low" are associated with early stage cancers called "low grade" and abnormal levels called "high" are associated with advanced stage cancers called "high grade". It is possible that
この目的のために、低と呼ばれるレベルで異常を検出するために、本発明は、蛍光画像をデジタル化した第2の画像2を使用する。この第2の画像2に基づいて、尿路上皮等の、少なくとも1つの選択された細胞型からの細胞は、第1のデジタル化された画像1において予め定義された試料における細胞の位置のために、類型選択する工程162において選択される。次に、第1の画像1及び第2の画像は、場合によってはコンピュータによって実行される従来の位置合わせ法を用いて、位置合わせされる。
For this purpose, the invention uses a second
この特性付ける第2の工程160を実行するためには、第1の画像1に基づき類型選択する予備工程130は、選択された細胞型の細胞を位置付けることができるようにするために、本発明に係る方法において必然的により以前に行われていなければならないことが理解されるであろう。
In order to carry out this
細胞型の類型選択をするサブ工程162の後に、予め選択された各細胞の周りの蛍光ハローを検出するサブ工程164が続く。用語「ハロー」は、細胞を取り囲み、鮮明なコントラストを有する蛍光オーラ(fluorescent aura)の存在によって見られる現象として定義される。一実施態様では、ハロー強度、蛍光レベル、又は蛍光の広がりのレベルが測定される。このようにして、蛍光ハローが検出される場合には、好ましくは最小の蛍光のレベルが検出される場合には、また好ましくは最小の蛍光の広がりのレベルが検出される場合には、試料は、低い異常レベルを有する試料を表すクラス168に分類される。逆に、蛍光を有さない細胞は、異常レベルがゼロのクラス及び高い異常レベルのクラス166に分類される。
The
本発明によれば、処理モジュールを用いて試料を特性付ける第2の工程160を行うために、3つの方法が提案される。
According to the invention, three methods are proposed for performing the
試料を特性付ける第2の工程160のサブ工程は、第1の方法に関連して、以下に詳細に与えられる:
-第1の画像1を使用して、選択された細胞型の各細胞の中心を、細胞の重心の計算を使用して検出する;
-各直線セグメントに沿って、細胞の中心から始まり、様々な角度に沿って、各細胞の境界までの強度プロファイルをトレースする。例えば、8つの角度:0°、45°、90°、135°、180°、225°、270°及び315°に沿って;
-各プロファイルのピークPmax(最大点)、及び最大値より前の窪み(trough)Pmin(最小点)を検出する;
-ピークPmaxの右側の窪みPminから始まり、ピークPmaxの左側の強度プロファイルの曲線との交点Pintまで、強度プロファイルの曲線上の水平線をトレースする;
-ピークの横座標であるXmaxと、点Pintの横座標であるXintと、の間の(横座標に沿った)水平線の距離dxを計算する;
-ピークの縦座標であるYmaxと、Pint及びPmaxの縦座標Yint=Yminと、の間の(縦座標に沿った)垂直距離dyを計算する;
-各細胞について、8つの角度に沿ったdx及びdyの平均である検出されたDx及びDyを計算する。Dyはハローの蛍光ハローの強度の第1の推定値を表し、Dxはハローの広がりの第1の推定値を表す。
The sub-steps of the
- using the
- Along each straight line segment, trace the intensity profile starting from the center of the cell and along various angles to the border of each cell. For example along 8 angles: 0°, 45°, 90°, 135°, 180°, 225°, 270° and 315°;
- find the peak Pmax (maximum point) and the trough Pmin (minimum point) before the maximum of each profile;
- trace a horizontal line on the curve of the intensity profile, starting from the depression Pmin to the right of the peak Pmax, to the point of intersection Pint with the curve of the intensity profile to the left of the peak Pmax;
- Calculate the horizontal distance dx (along the abscissa) between Xmax, the abscissa of the peak and Xint, the abscissa of the point Pint;
- Calculate the vertical distance dy (along the ordinate) between the ordinate of the peak, Ymax, and the ordinate of Pint and Pmax, Yint=Ymin;
- For each cell, calculate the detected Dx and Dy, which is the average of dx and dy along the 8 angles. Dy represents a first estimate of the fluorescence halo intensity of the halo and Dx represents a first estimate of the halo spread.
試料を特性付ける第2の工程160のサブ工程は、第2の方法に関連して、以下に詳細に与えられる:
ここでは、細胞の画像断片のラドンプロファイルから蛍光ハローの広がりを測定し、計算することが提案される。
The sub-steps of the
Here it is proposed to measure and calculate the spread of the fluorescence halo from the Radon profile of image fragments of cells.
ラドン変換は、様々な方向の投影の収集として画像を表す。線に沿った各投影は、ラドンプロファイルを表す。 The Radon transform represents an image as a collection of projections in various directions. Each projection along the line represents a Radon profile.
以下は、第2の方法に従うべき工程である:
-第1の画像1において、選択された細胞型の各細胞の位置を特定する;
-選択された細胞型の各細胞に対応する画像断片を抽出するために、第2の画像2において、各核の周りの長さ及び幅を10~30%超えることによって、対応させる;
-様々な角度について、好ましくは第1の方法で使用される角度と同じ角度について、画像断片に対応するラドンプロファイルを計算する;
-各プロファイルについて、核の周りの長さ及び幅を10~30%超えて延びた各画像の各ラドンプロファイルの2つのピークPmin及びPmaxを検出し、次いで、ハロー強度及びその広がりの第2の推定値を計算するための第1の方法の工程に続く。
Below are the steps to follow for the second method:
- in the
- matched by exceeding the length and width around each nucleus by 10-30% in the
- calculating the Radon profiles corresponding to the image fragments for different angles, preferably for the same angles used in the first method;
- For each profile, find the two peaks Pmin and Pmax of each Radon profile in each image that extend 10-30% beyond the length and width around the nucleus, then a second measurement of the halo intensity and its spread. Follow the steps of the first method for calculating the estimate.
あるいは、第3の方法に関連して、処理モジュールによって行われる試料を特性付ける第2の工程160は、存在する蛍光「ハロー」の輪郭の不規則性の計算に基づく方法にある。換言すれば、細胞が高いレベルのハローの輪郭の不規則性を有する場合、それは蛍光ハローを有することを意味する。これを行うために、この第3の方法は、先に示した核の不規則性の計算の3つの方法のうちの1つにある。
Alternatively, in relation to the third method, the
一連の、前述した第2の試料の特性付け160の3つの実行方法について、限定されないが、試料のクラスを決定するために得られた結果は、ユーザによって予め決定された、又は予め入力された蛍光強度及び/又は広がりのレベルの閾値と比較される。
For the sequence of three implementations of the
記載したこれら3つの方法は、精密な結果を得るために、学習方法によって組み合わされ、処理され得ることが理解されるであろう。 It will be appreciated that these three methods described can be combined and processed by the learning method to obtain precise results.
したがって、この試料を特性付ける第2の工程160は、最終的に試料のスライドの分類、したがって試料の分類を、3つのあり得るクラスへと分類することを可能にし、これは、健康な被験者からの試料に関連し得る異常レベルがゼロであるクラス、又は早期段階の癌性細胞、若しくは「低悪性度」の癌と呼ばれる癌性細胞を有する試料に関連し得る細胞の異常レベルが低であるクラス、又は進行した段階の癌性細胞、若しくは「高悪性度」の癌と呼ばれる癌性細胞を有する試料に関連し得る細胞の異常レベルが高であるクラス、のいずれかを意味する。
This
本発明の第2の態様は、発見された細胞の異常レベルにしたがって細胞学的試料のスライド画像の直接的分類を行うために深層学習法を使用して、細胞学的試料において細胞の異常を検出する第2の方法の使用を提案する。一般に、深層学習法は、画像からの直接的分類等のタスクを実行する方法をコンピュータモデルに教示する。深層学習及び画像処理の分野で通常行われるものとは異なり、この第2の方法の独自性は、画像の全体を構成する画像断片の各々を予め分類すること無く、画像断片のセットを分類することにある。より正確には、この方法は、試料からの各画像断片又は各細胞の分類を経ることなく、試料の画像に含まれる細胞のセットを意味する、スライドからの細胞学的試料の画像の分類を直接可能にする。本発明によるこの分類方法は、異常又は病状の検出がスライド又はスライドの画像の全体を見ることによってのみ行うことができ、各細胞を他の細胞からは独立して見ることによっては行えない場合に、特に有用であることに留意されたい。これを行うために、試料中の少なくとも1つの異常を有する細胞を検出するこの第2の検出方法は、深層学習コンピュータモデルを使用し、観察のセットを入力として行い、このセットの分類を出力上に生成する。これらの観察は、細胞学的試料の直接的な生の画像、及び/又は画像断片(又は記述データ)を特性付ける値のリスト、例えば第1の方法を使用して計算された値であり得る(これらの記述データは、コンピュータモジュールに学習させることにおいて有用性を有することが理解されるであろう)。これを行うために、この第2の方法は、ディープニューラルネットワーク(deep neural network)(NN)アーキテクチャを使用する深層学習法を使用する。このディープニューラルネットワーク(NN)が生の画像断片に使用されるとき、それはディープコンボリューショナルニューラルネットワーク(deep convolutional neural network)(CNN)を含む。CNNは、学習された特性を記述子からの入力データと畳み込み、画像等の2Dデータの処理に完全に適した2D畳み込みレイヤを使用する。コンボリューショナルニューラルネットワークは、学習を介して画像のエキスパート表示を直接抽出することができる。同様に、深層学習法は、かなりの計算能力を必要とする。計算は高度に並列化可能であるので、計算は一般にグラフィックプロセッサ又はGPU上で行われる。GPUは高性能であり、この学習法を実行することに有効な並列アーキテクチャを備える。GPUは、プロセスユニット又はCPUに統合されている。同様に、メモリからCPU及びGPUへのデータの転送は、依然として時間の点で最もコストがかかる操作の1つであるため、各エントリの処理にGPUを独立して使用することはできない。一般に、この問題を改善するために、深層学習法は、一般にパケット又はバッチによってエントリを処理するために、4次元テンソル(4次元テーブル)を使用する。 A second aspect of the present invention identifies cellular abnormalities in cytological samples using deep learning methods to perform direct classification of slide images of cytological samples according to the level of cellular abnormalities found. We propose to use the second method of detection. In general, deep learning methods teach computer models how to perform tasks such as direct classification from images. Unlike what is commonly done in the field of deep learning and image processing, the uniqueness of this second method is that it classifies a set of image fragments without pre-classifying each of the image fragments that make up the entire image. That's what it is. More precisely, the method classifies an image of a cytological sample from a slide, meaning the set of cells contained in the image of the sample, without going through the classification of each image fragment or each cell from the sample. directly enable. This classification method according to the invention is useful when detection of an abnormality or pathology can only be done by looking at the entire slide or image of the slide and not by looking at each cell independently of other cells. , is particularly useful. To do this, this second detection method for detecting cells with at least one abnormality in a sample uses a deep learning computer model, taking a set of observations as input and classifying this set as output. to generate These observations can be a direct raw image of the cytological sample and/or a list of values characterizing the image fragment (or descriptive data), e.g. values calculated using the first method. (It will be appreciated that these descriptive data have utility in training computer modules). To do this, this second method uses deep learning methods using a deep neural network (NN) architecture. When this deep neural network (NN) is used on raw image fragments, it includes a deep convolutional neural network (CNN). CNNs convolve learned features with input data from descriptors and use 2D convolution layers that are perfectly suited for processing 2D data such as images. Convolutional neural networks can directly extract expert representations of images through learning. Similarly, deep learning methods require considerable computational power. Since the computation is highly parallelizable, the computation is generally performed on a graphics processor or GPU. GPUs are high performance and have a parallel architecture that is effective in carrying out this learning method. The GPU is integrated with the process unit or CPU. Similarly, transferring data from memory to the CPU and GPU is still one of the most costly operations in terms of time, so the GPU cannot be used independently to process each entry. Generally, to ameliorate this problem, deep learning methods use 4-dimensional tensors (4-dimensional tables) to process entries, typically in packets or batches.
4次元テンソルのこの独自の使用により、細胞の異常を検出するこの第2の方法は、画像断片のセットを意味する画像を、それらの各々を予め検出することなく、分類する。換言すれば、この第2の検出方法は、少なくとも1つの細胞の異常を有する細胞を検出し、画像断片ではなく、細胞学的試料のスライドの画像(スライド)を表す画像断片(別の方法で計算された値によって特性付けられた生の画像断片及び/又は画像断片)のセットを、直接分類することを提案する。この第2の方法を実行するために、深層学習コンピュータモデルの訓練は、ラベル付けされたスライドの大きなセットを使用して行われる。この訓練がなければ、第2の分類方法は機能しない。この場合、入力は(生の、及び/又は第1の方法によって特性付けられた)画像断片のセットであり、出力は、分析された試料からの画像断片のセットの各画像にクラスを最終的に割り当てるためのクラス間の確率分布である。本発明によれば、クラスは、細胞の異常レベルが低であるクラス、細胞の異常レベルが高であるクラス、及び/又は細胞の異常レベルがゼロであるクラスの中から選択される。 Due to this unique use of a 4D tensor, this second method of detecting cellular abnormalities classifies an image representing a set of image fragments without pre-detecting each of them. In other words, this second detection method detects cells with at least one cellular abnormality and is not an image fragment, but an image fragment (or otherwise We propose to directly classify the set of raw image fragments and/or image fragments characterized by the computed values. To implement this second method, a deep learning computer model is trained using a large set of labeled slides. Without this training, the second classification method will not work. In this case, the input is the set of image fragments (raw and/or characterized by the first method) and the output is the class finally assigned to each image of the set of image fragments from the analyzed sample. is the probability distribution between classes for assigning to According to the invention, the class is selected among a class with a low level of cellular abnormality, a class with a high level of cellular abnormality and/or a class with a zero level of cellular abnormality.
さらに、この方法は、細胞学的試料の画像からの各画像断片の分析の中間段階を経ることなく、入力を出力に直接結びつけることを意味する「エンドツーエンド」訓練を行う。より正確には、細胞学的試料からの細胞の画像断片のセットから開始して、ネットワークは達成されるべきタスク(例えば、分類)を割り当て、それらをどのように自動化するかを学習する。この方法の別の主要な利点には、学習法からのアルゴリズムがデータと共に発展し、データ量が増加することにつれて改善し続けるという事実がある。好ましくは、少なくとも部分的には、これらのデータは、前述の第1の態様による検出方法を通して得られたデータから得られる。さらに好ましくは、検出方法のこの第2の態様は、有利には1つの透過画像及び1つの蛍光画像(1つの第1の画像、及び1つの第2の画像を意味する)からのデータを結合することができる。 Furthermore, the method performs "end-to-end" training, meaning that it directly connects inputs to outputs without going through the intermediate stages of analysis of each image fragment from an image of a cytological sample. More precisely, starting with a set of image fragments of cells from a cytological sample, the network assigns tasks to be accomplished (eg classification) and learns how to automate them. Another major advantage of this method is the fact that the algorithm from the learning method evolves with the data and continues to improve as the amount of data increases. Preferably, at least in part, these data are derived from data obtained through the detection method according to the first aspect above. More preferably, this second aspect of the detection method advantageously combines data from one transmission image and one fluorescence image (meaning one first image and one second image). can do.
ここで提案した検出方法の第2の態様は、セットを処理できるようにするためのバッチ機能性は別として、深層学習法の実行である。 A second aspect of the detection method proposed here, apart from the batch functionality to allow processing of sets, is the implementation of deep learning methods.
従来、4次元テンソルは、画像の空間成分についての2次元(画像の高さに関する1次元、及び幅に関する1次元)、チャネルに関する1次元(赤、緑、青が使用される場合にはRGB)、及びバッチ「B」に関する1次元(B:バッチ又はパケットを構築するための画像の数に対応する)、から構成される。 Conventionally, a 4D tensor has two dimensions for the spatial components of the image (one dimension for the height of the image and one dimension for the width of the image) and one dimension for the channels (RGB if red, green and blue are used). , and one dimension for the batch 'B' (B: corresponding to the number of images to build the batch or packet).
一般に、4次元テンソルを使用することの唯一の有用性は、計算を加速させることである。我々の方法の独自性は、母集団、ここでは画像断片のセットを分類するという別の目的でこのテンソルを使用することにある。画像のバッチBを取得し、B個の決定を生成する:各画像について1つの決定(B>1を取得するという事実は、時間を節約することのみに役立つ)という他の学習法が従来行うものとは異なり、画像断片のセットに基づいて1つの決定のみを与えるために、B個の画像断片のバッチ(B:画像の全体を構成する画像断片の数に対応する)を取得する。ここで提案される独自性は、計算時間の都合で実際にはこの機能を使用して最初に存在するロットを作り、別の目標及び別の目的のためにそれを使用することによってその機能を取っておくことである。 In general, the only usefulness of using a 4D tensor is to speed up computation. The uniqueness of our method lies in the use of this tensor for the other purpose of classifying a population, here a set of image fragments. Take a batch B of images and generate B decisions: one decision for each image (the fact of taking B>1 only serves to save time) is what other training methods traditionally do In order to give only one decision based on a set of image fragments, a batch of B image fragments (B: corresponding to the number of image fragments that make up the whole image) is obtained. The peculiarity proposed here is that for computational time reasons, it is actually possible to use this function to create an existing lot and then use it for a different goal and a different purpose. It is to keep.
数B(Bは、メモリが限定されているGPUへとバッチが転送されることができるように十分に小さくなければならない)に対応する画像断片のセットを考える。従来、学習法は、計算時間を加速させるために選択される32~64個の画像断片のバッチを使用する。本発明の文脈において、この数は、対象の画像断片の数、例えばスライド画像当たりの尿路上皮細胞の画像断片の数として使用されるので、所定の数Bは選択されず、この数は(スライド上の細胞学的試料中に存在する尿路上皮細胞の数にしたがって)スライド画像ごとに異なる。したがって、これらのB個の画像断片:B×RGB×H×W(B:画像断片の数;RGB:3つのカラーチャネル赤緑青;H及びW:それぞれ画像の高さ及び幅)を用いて4次元テンソルを形成することが可能である。また、透過型電子顕微鏡のための任意の数の従来のRGBチャネル、及び、例えばRGB(赤緑蛍光)等の、透過型電子顕微鏡及び蛍光顕微鏡画像のペアのためのF(F:蛍光)に関連する任意の数のRGBチャネルを考慮することも可能である。次に、このバッチを完全に接続された層(前の層の空間的側面を考慮せず、そのため画像断片当たり1次元ベクトルしか生成しないニューロンの層を意味する)までニューラルネットワークに転送する場合、出力はしたがって、サイズB×Fを有することになり、ここで、Fはこの完全に接続された層のサイズである(したがって、4次元テンソルは2次元テンソルに変換された)。 Consider a set of image fragments corresponding to a number B (B must be small enough so that the batch can be transferred to a GPU with limited memory). Conventionally, learning methods use batches of 32-64 image fragments that are selected to speed up computation time. In the context of the present invention, this number is used as the number of image fragments of interest, e.g. the number of image fragments of urothelial cells per slide image, so that the predetermined number B is not chosen and this number is ( Different for each slide image (according to the number of urothelial cells present in the cytological sample on the slide). Thus, using these B image fragments: B×RGB×H×W (B: number of image fragments; RGB: three color channels red, green and blue; H and W: height and width of the image respectively). It is possible to form a dimensional tensor. Also, any number of conventional RGB channels for transmission electron microscopy and F (F: fluorescence) for transmission electron microscopy and fluorescence microscopy image pairs, such as RGB (red-green fluorescence). It is also possible to consider any number of relevant RGB channels. If we then transfer this batch up to a fully connected layer (meaning a layer of neurons that does not take into account the spatial aspects of the previous layer and thus only produces one-dimensional vectors per image fragment) into the neural network, The output will therefore have size B×F, where F is the size of this fully connected layer (thus the 4D tensor was transformed into a 2D tensor).
ここで、この2次元テンソルB×Fを1×F×Bテンソルに転置し、Bに対して対称操作、例えば1次元プール(最大又は平均)を適用することが可能である。完全に接続された層を使用する必要性は、実際には転置のためにこれらの3次元及び4次元を解除することであるので、この転置は、1次元ではなく3次元及び4次元で行われるために対称操作が元々プログラムされる限り、有用である。したがって、この結果は、1×Fテンソルを与え、指標Fは画像断片のセットに関する情報を含むはずである。この1は、このセットがB個の画像のバッチに関連する1つの単一分類ディジットをもたらすに違いないという事実から生じることが理解されるであろう。このようにして、細胞学的試料の画像(画像のセットを意味する)の分類問題のためのエンドツーエンドネットワークを形成するために、従来の深層学習法を使用することが可能である。 Now it is possible to transpose this 2D tensor B×F into a 1×F×B tensor and apply a symmetry operation on B, eg a 1D pool (maximum or mean). Since the need to use fully connected layers is really to release these 3 and 4 dimensions for transposition, this transposition is done in 3 and 4 dimensions instead of 1. is useful as long as the symmetry operations were originally programmed to be The result therefore gives a 1×F tensor, where index F should contain information about the set of image fragments. It will be appreciated that this 1 results from the fact that this set must yield one single classification digit associated with a batch of B images. In this way, it is possible to use conventional deep learning methods to form an end-to-end network for a classification problem of images (meaning sets of images) of cytological samples.
図7は、画像断片のセットに対応する細胞学試料の画像の分類に適用される深層学習のための実行方法を要約する。 FIG. 7 summarizes the implementation method for deep learning applied to the classification of images of cytological samples corresponding to sets of image fragments.
最終的なクラスは、画像断片のセットに割り当てられる。この実行方法は、ここでは細胞学的試料の画像分類に適用されるが、限定することなく、他の分野に任意に適用することができることが理解されるであろう。 A final class is assigned to the set of image fragments. It will be appreciated that although this method of implementation is applied here to image classification of cytological samples, it can optionally be applied to other fields without limitation.
第2の態様によれば、本発明は、コンピュータビジョンを用いて、癌診断に寄与するために、試料中に存在する細胞の異常のエキスパート特性を抽出し計算する、細胞学的試料の分類を提案する。ここで、本発明はまた、第2の態様によれば、コンピュータビジョンを用いて、癌診断に寄与することができる深層学習法を使用することによって、試料中で遭遇する細胞の異常レベルにしたがって細胞学的試料を分類する、第2の方法を提案する。本発明はまた、このような方法を実行するのに適した、少なくとも1つのデジタル化された画像に基づく細胞学的試料の分類のための装置に関する。各ユーザは、分類方法を実行するために考慮する閾値を定義してもよい。さらに、各ユーザのニーズにしたがって、すなわち、適用分野及び分類結果の所望の精密度にしたがって、各ユーザに適応可能な一般的なアプローチが提案される。 According to a second aspect, the present invention uses computer vision to classify a cytological sample to extract and calculate expert characteristics of cellular abnormalities present in the sample to contribute to cancer diagnosis. suggest. Here, the present invention also provides, according to a second aspect, computer vision, by using deep learning methods that can contribute to cancer diagnosis, according to the abnormal level of cells encountered in a sample. A second method of classifying cytological samples is proposed. The invention also relates to a device for the classification of cytological samples based on at least one digitized image, suitable for carrying out such a method. Each user may define thresholds that are considered for performing the classification method. Furthermore, a general approach is proposed that is adaptable to each user according to his needs, ie according to the field of application and the desired accuracy of the classification results.
Claims (9)
前記方法は、以下のサブ工程を含む、前記第1のデジタル化された電子顕微鏡画像(1)を処理する工程(110)を含み:
-前記第1のデジタル化された電子顕微鏡画像(1)から開始して、比色検出を用いて、前記細胞学的試料中に存在する各要素(4)を検出し(工程112)、次いで、少なくとも1つの孤立した細胞(10)又は1つの細胞群(14)から選択された各要素(4)をフィルターする;
-検出された各細胞群(14)から開始して、前記細胞群(14)の輪郭の検出に基づく少なくとも1つのセグメンテーション法を用いて、核を有する少なくとも1つの細胞を個別化する(工程116);
前記方法は、以下のサブ工程を含む、細胞の異常を検出する工程(工程140)をさらに含み:
-先行する工程における孤立した各細胞(10)又は個別化された各細胞について、「異常のエキスパート特性」と呼ばれる別個の異常の2つの特性に関するデータを計算し、これらの計算されたデータを参照データと比較する(工程142)ことによって、前記細胞が少なくとも1つの異常を有するかを判定する(工程144);
-次いで、前記細胞学的試料中の少なくとも1つの異常を有する細胞の総数を数える(工程146);
前記方法は、以下のサブ工程を含む、前記細胞学的試料の異常レベルにしたがって、前記細胞学的試料を特性付ける第1の工程(工程150)をさらに含み:
-少なくとも1つの異常を有する細胞の前記総数を、前記異常レベルの閾値と比較する;
-少なくとも1つの異常を有する細胞の前記総数が前記異常レベルの前記閾値未満である場合には、異常レベルがゼロである試料を表すクラスに前記細胞学的試料を分類する(152);
-少なくとも1つの異常を有する細胞の前記総数が前記異常レベルの前記閾値を超える場合には、異常レベルが証明された試料を表すクラスに前記細胞学的試料を分類する(154);
前記方法は、以下のサブ工程を含む、類型選択する工程(工程130)をさらに含む:
-前記細胞学的試料の前記第1のデジタル化された電子顕微鏡画像(1)から開始して、前記細胞のサイズを測定し、次いで、前記細胞のサイズにしたがって前記細胞を分類する(工程132);
-測定された細胞の各クラスを対応する細胞型と一致させ、次いで、少なくとも1つの選択された細胞型を選択する(工程134);
前記方法は、以下のサブ工程をさらに含む、前記細胞学的試料からの前記細胞の異常レベルにしたがって、前記細胞学的試料を特性付ける第2の工程(工程160)を含む:
-前記細胞学的試料の第2のデジタル化された蛍光画像(2)から開始して、選択された細胞型の全ての前記細胞を、前記第1のデジタル化された電子顕微鏡画像(1)において予め定義された(工程134)前記細胞学的試料における細胞の位置にしたがって、選択する(工程162);
-予め選択された各細胞の周りの蛍光の広がりのレベルを測定する;
-測定された前記蛍光の広がりのレベルが前記蛍光の最小の広がりのレベルを超える場合には、低い細胞の異常レベルを有する試料を表すクラスに前記試料を分類する(168);
ことを特徴とする方法。 A method for detecting cells with at least one abnormality in a cytological sample based on at least one first digitized electron microscope image (1) of the cytological sample, said method is performed using a computer-implemented processing module,
The method comprises processing (110) the first digitized electron microscope image (1) , comprising the following sub-steps:
- starting from said first digitized electron microscopy image (1), detecting each element (4) present in said cytological sample using colorimetric detection (step 112), and then , filtering each element (4) selected from at least one isolated cell (10) or one group of cells (14);
- starting from each detected cell group (14), individualizing at least one cell with a nucleus using at least one segmentation method based on detection of contours of said cell group (14) (step 116 );
The method further comprises detecting cellular abnormalities (step 140), comprising the following substeps:
- For each isolated cell (10) or for each individualized cell in the preceding step, calculate data on two properties of a separate abnormality called "expert properties of the abnormality" and refer to these calculated data. determining whether the cell has at least one abnormality (step 144) by comparing (step 142) to the data;
- then counting the total number of cells with at least one abnormality in said cytological sample (step 146);
The method further comprises a first step (step 150) of characterizing the cytological sample according to the abnormal level of the cytological sample, comprising the following substeps:
- comparing said total number of cells with at least one abnormality to said abnormality level threshold;
- if said total number of cells with at least one abnormality is less than said threshold of said level of abnormality, classifying said cytological sample into a class representing samples with zero level of abnormality (152);
- if said total number of cells with at least one abnormality exceeds said threshold of said level of abnormality, classifying said cytological sample into a class representing samples with demonstrated level of abnormality (154);
The method further comprises a step of type selection (step 130), which includes the following substeps:
- starting from said first digitized electron microscopy image (1) of said cytological sample, measuring the size of said cells and then classifying said cells according to said cell size (step 132 );
- matching each class of measured cells with a corresponding cell type and then selecting at least one selected cell type (step 134);
The method includes a second step (step 160) of characterizing the cytological sample according to the abnormal level of the cells from the cytological sample, further comprising the following substeps:
- starting from the second digitized fluorescence image (2) of said cytological sample, all said cells of a selected cell type are shown in said first digitized electron microscope image (1). selecting (step 162) according to the location of the cells in the cytological sample predefined (step 134) in
- measuring the level of fluorescence spread around each preselected cell;
- if the level of the fluorescence spread measured exceeds the level of the minimum spread of fluorescence, classifying the sample into a class representing samples with low abnormal levels of cells (168);
A method characterized by:
ことを特徴とする、請求項1~3の何れか一項に記載の方法。 recommending the utility of the cytological sample according to the number of cells containing nuclei and according to a minimum usefulness threshold (step 120);
A method according to any one of claims 1 to 3, characterized in that
Applications Claiming Priority (3)
| Application Number | Priority Date | Filing Date | Title |
|---|---|---|---|
| FR1800251A FR3079617B1 (en) | 2018-03-29 | 2018-03-29 | METHOD FOR DETECTING CELLS PRESENTING AT LEAST ONE ANOMALY IN A CYTOLOGICAL SAMPLE |
| FR1800251 | 2018-03-29 | ||
| PCT/FR2019/050718 WO2019186073A1 (en) | 2018-03-29 | 2019-03-28 | Method for detecting cells having at least one anomaly in a cytological sample |
Publications (2)
| Publication Number | Publication Date |
|---|---|
| JP2021519920A JP2021519920A (en) | 2021-08-12 |
| JP7326316B2 true JP7326316B2 (en) | 2023-08-15 |
Family
ID=63014596
Family Applications (1)
| Application Number | Title | Priority Date | Filing Date |
|---|---|---|---|
| JP2020552248A Active JP7326316B2 (en) | 2018-03-29 | 2019-03-28 | Method for detecting cells with at least one abnormality in a cytological sample |
Country Status (9)
| Country | Link |
|---|---|
| US (1) | US11790673B2 (en) |
| EP (1) | EP3775840A1 (en) |
| JP (1) | JP7326316B2 (en) |
| KR (1) | KR102624956B1 (en) |
| CN (1) | CN112088296A (en) |
| BR (1) | BR112020019709A2 (en) |
| CA (1) | CA3095089A1 (en) |
| FR (1) | FR3079617B1 (en) |
| WO (1) | WO2019186073A1 (en) |
Families Citing this family (2)
| Publication number | Priority date | Publication date | Assignee | Title |
|---|---|---|---|---|
| US11663838B2 (en) * | 2020-10-29 | 2023-05-30 | PAIGE.AI, Inc. | Systems and methods for processing images to determine image-based computational biomarkers from liquid specimens |
| WO2023195405A1 (en) * | 2022-04-04 | 2023-10-12 | 京セラコミュニケーションシステム株式会社 | Cell detection device, cell diagnosis support device, cell detection method, and cell detection program |
Citations (4)
| Publication number | Priority date | Publication date | Assignee | Title |
|---|---|---|---|---|
| JP2002520595A (en) | 1998-07-13 | 2002-07-09 | セロミックス インコーポレイテッド | System for cell-based screening |
| US20050136549A1 (en) | 2003-10-30 | 2005-06-23 | Bioimagene, Inc. | Method and system for automatically determining diagnostic saliency of digital images |
| JP2009511002A (en) | 2005-09-22 | 2009-03-19 | イコニシス インコーポレーテッド | Methods for detecting and quantifying multiple cellular components |
| WO2017194556A1 (en) | 2016-05-09 | 2017-11-16 | INSERM (Institut National de la Santé et de la Recherche Médicale) | Methods for classifying patients with a solid cancer |
Family Cites Families (11)
| Publication number | Priority date | Publication date | Assignee | Title |
|---|---|---|---|---|
| AU3490695A (en) * | 1994-09-20 | 1996-04-09 | Neopath, Inc. | Cytological slide scoring apparatus |
| AU1918100A (en) * | 1999-11-18 | 2001-05-30 | Ikonisys Inc. | Method and apparatus for computer controlled cell based diagnosis |
| KR20020080574A (en) * | 2001-04-16 | 2002-10-26 | 디엑스오 텔레콤(주) | method of enhancing a digital color image by an automatic image classification |
| US7760927B2 (en) * | 2003-09-10 | 2010-07-20 | Bioimagene, Inc. | Method and system for digital image based tissue independent simultaneous nucleus cytoplasm and membrane quantitation |
| WO2007136724A2 (en) * | 2006-05-17 | 2007-11-29 | Cellumen, Inc. | Method for automated tissue analysis |
| EP3904859B1 (en) | 2011-04-15 | 2023-08-30 | Roche Diagnostics Hematology, Inc. | System and method for determining a platelet volume for a blood sample, computer program and computer readable medium |
| US9567651B2 (en) * | 2011-09-13 | 2017-02-14 | Koninklijke Philips N.V. | System and method for the detection of abnormalities in a biological sample |
| KR101677171B1 (en) * | 2015-04-24 | 2016-11-17 | 국방과학연구소 | Moving object segmentation method by the pixel-based background estimation |
| KR101700887B1 (en) * | 2015-07-24 | 2017-02-02 | 한밭대학교 산학협력단 | Device and method for counting cells using image processing and computer-readable recording medium storing program to implement the method |
| US20170371886A1 (en) * | 2016-06-22 | 2017-12-28 | Agency For Science, Technology And Research | Methods for identifying clusters in a dataset, methods of analyzing cytometry data with the aid of a computer and methods of detecting cell sub-populations in a plurality of cells |
| CA3027158A1 (en) * | 2016-06-30 | 2018-01-04 | General Automation Lab Technologies, Inc. | High resolution systems, kits, apparatus, and methods using combinatorial media strategies for high throughput microbiology applications |
-
2018
- 2018-03-29 FR FR1800251A patent/FR3079617B1/en active Active
-
2019
- 2019-03-28 US US17/041,936 patent/US11790673B2/en active Active
- 2019-03-28 WO PCT/FR2019/050718 patent/WO2019186073A1/en active Application Filing
- 2019-03-28 JP JP2020552248A patent/JP7326316B2/en active Active
- 2019-03-28 CN CN201980028142.XA patent/CN112088296A/en active Pending
- 2019-03-28 KR KR1020207030477A patent/KR102624956B1/en active IP Right Grant
- 2019-03-28 BR BR112020019709-2A patent/BR112020019709A2/en unknown
- 2019-03-28 EP EP19719349.3A patent/EP3775840A1/en active Pending
- 2019-03-28 CA CA3095089A patent/CA3095089A1/en active Pending
Patent Citations (4)
| Publication number | Priority date | Publication date | Assignee | Title |
|---|---|---|---|---|
| JP2002520595A (en) | 1998-07-13 | 2002-07-09 | セロミックス インコーポレイテッド | System for cell-based screening |
| US20050136549A1 (en) | 2003-10-30 | 2005-06-23 | Bioimagene, Inc. | Method and system for automatically determining diagnostic saliency of digital images |
| JP2009511002A (en) | 2005-09-22 | 2009-03-19 | イコニシス インコーポレーテッド | Methods for detecting and quantifying multiple cellular components |
| WO2017194556A1 (en) | 2016-05-09 | 2017-11-16 | INSERM (Institut National de la Santé et de la Recherche Médicale) | Methods for classifying patients with a solid cancer |
Non-Patent Citations (6)
| Title |
|---|
| 塚田裕也,CNN特徴量を利用した細胞核の抽出及び分類,平成29年度修士論文概要,2017年,pp.1-2 |
| 大貫泰佳,細胞診断のための細胞核画像の輪郭複雑度による定量的評価法の検討,FIT2013 (第12回情報科学技術フォーラム),第2分冊,pp.401-402 |
| 小椋俊彦,大気圧電子顕微鏡ASEMによる水中観察法の開発,Synthesiology,2015年08月,Vol.8 No.3,pp.116-126 |
| 山本修,解説 電子顕微鏡はまだまだ活躍できる,顕微鏡,2017年,Vol. 52, No. 2,pp.90-97 |
| 早川正道,上部尿路上皮性腫瘍の臨床的ならびに細胞学的研究,日泌尿会誌,1978年,69巻11号,pp.1439-1456 |
| 鈴木徹,尿細胞診の研究(第2報) 尿路疾患患者に於ける走査電顕での尿中剥離細胞診,日泌尿会誌,1986年,77巻2号,pp.233-242 |
Also Published As
| Publication number | Publication date |
|---|---|
| KR20200136004A (en) | 2020-12-04 |
| BR112020019709A2 (en) | 2021-02-09 |
| US20210012088A1 (en) | 2021-01-14 |
| CA3095089A1 (en) | 2019-10-03 |
| WO2019186073A1 (en) | 2019-10-03 |
| JP2021519920A (en) | 2021-08-12 |
| US11790673B2 (en) | 2023-10-17 |
| FR3079617A1 (en) | 2019-10-04 |
| KR102624956B1 (en) | 2024-01-12 |
| CN112088296A (en) | 2020-12-15 |
| FR3079617B1 (en) | 2023-12-22 |
| EP3775840A1 (en) | 2021-02-17 |
Similar Documents
| Publication | Publication Date | Title |
|---|---|---|
| CN108364288B (en) | Segmentation method and device for breast cancer pathological image | |
| CN107274386B (en) | artificial intelligent auxiliary cervical cell fluid-based smear reading system | |
| MoradiAmin et al. | Computer aided detection and classification of acute lymphoblastic leukemia cell subtypes based on microscopic image analysis | |
| US7236623B2 (en) | Analyte recognition for urinalysis diagnostic system | |
| US6947586B2 (en) | Multi-neural net imaging apparatus and method | |
| US8139831B2 (en) | System and method for unsupervised detection and gleason grading of prostate cancer whole mounts using NIR fluorscence | |
| CN110120056B (en) | Blood leukocyte segmentation method based on adaptive histogram threshold and contour detection | |
| US11080830B2 (en) | Systems and methods for segmentation and analysis of 3D images | |
| Shahin et al. | A novel white blood cells segmentation algorithm based on adaptive neutrosophic similarity score | |
| US11538261B2 (en) | Systems and methods for automated cell segmentation and labeling in immunofluorescence microscopy | |
| MoradiAmin et al. | Enhanced recognition of acute lymphoblastic leukemia cells in microscopic images based on feature reduction using principle component analysis | |
| CN110148126B (en) | Blood leukocyte segmentation method based on color component combination and contour fitting | |
| JP7326316B2 (en) | Method for detecting cells with at least one abnormality in a cytological sample | |
| Xiong et al. | Automatic area classification in peripheral blood smears | |
| Qiu et al. | Feature selection for the automated detection of metaphase chromosomes: performance comparison using a receiver operating characteristic method | |
| He et al. | Multiphase level set model with local K-means energy for histology image segmentation | |
| Tikkanen et al. | Training based cell detection from bright-field microscope images | |
| Saxena et al. | Study of Computerized Segmentation & Classification Techniques: An Application to Histopathological Imagery | |
| Arunachalam | Applications of Machine learning and Image processing techniques in the detection of leukemia | |
| Deepa et al. | Classification of normal and abnormal overlapped squamous cells in pap smear image | |
| EP1301894B1 (en) | Multi-neural net imaging apparatus and method | |
| Le et al. | An automated framework for counting lymphocytes from microscopic images | |
| Amsini et al. | Enhanced type 2 triangular intuitionistic fuzzy C means clustering algorithm for breast cancer histopathology images | |
| CA2377602C (en) | Multi-neural net imaging apparatus and method | |
| Štěpka et al. | Automatic detection and segmentation of exosomes in transmission electron microscopy |
Legal Events
| Date | Code | Title | Description |
|---|---|---|---|
| A621 | Written request for application examination |
Free format text: JAPANESE INTERMEDIATE CODE: A621 Effective date: 20211227 |
|
| A977 | Report on retrieval |
Free format text: JAPANESE INTERMEDIATE CODE: A971007 Effective date: 20221130 |
|
| A131 | Notification of reasons for refusal |
Free format text: JAPANESE INTERMEDIATE CODE: A131 Effective date: 20230110 |
|
| A521 | Request for written amendment filed |
Free format text: JAPANESE INTERMEDIATE CODE: A523 Effective date: 20230406 |
|
| TRDD | Decision of grant or rejection written | ||
| A01 | Written decision to grant a patent or to grant a registration (utility model) |
Free format text: JAPANESE INTERMEDIATE CODE: A01 Effective date: 20230725 |
|
| A61 | First payment of annual fees (during grant procedure) |
Free format text: JAPANESE INTERMEDIATE CODE: A61 Effective date: 20230802 |
|
| R150 | Certificate of patent or registration of utility model |
Ref document number: 7326316 Country of ref document: JP Free format text: JAPANESE INTERMEDIATE CODE: R150 |