JP7311384B2 - Display information processing device, display information processing method, and display information processing program - Google Patents
Display information processing device, display information processing method, and display information processing program Download PDFInfo
- Publication number
- JP7311384B2 JP7311384B2 JP2019183410A JP2019183410A JP7311384B2 JP 7311384 B2 JP7311384 B2 JP 7311384B2 JP 2019183410 A JP2019183410 A JP 2019183410A JP 2019183410 A JP2019183410 A JP 2019183410A JP 7311384 B2 JP7311384 B2 JP 7311384B2
- Authority
- JP
- Japan
- Prior art keywords
- node
- application
- nodes
- infrastructure
- importance
- Prior art date
- Legal status (The legal status is an assumption and is not a legal conclusion. Google has not performed a legal analysis and makes no representation as to the accuracy of the status listed.)
- Active
Links
Images


Classifications
-
- H—ELECTRICITY
- H04—ELECTRIC COMMUNICATION TECHNIQUE
- H04L—TRANSMISSION OF DIGITAL INFORMATION, e.g. TELEGRAPHIC COMMUNICATION
- H04L41/00—Arrangements for maintenance, administration or management of data switching networks, e.g. of packet switching networks
- H04L41/08—Configuration management of networks or network elements
- H04L41/0803—Configuration setting
- H04L41/0806—Configuration setting for initial configuration or provisioning, e.g. plug-and-play
-
- G—PHYSICS
- G09—EDUCATION; CRYPTOGRAPHY; DISPLAY; ADVERTISING; SEALS
- G09G—ARRANGEMENTS OR CIRCUITS FOR CONTROL OF INDICATING DEVICES USING STATIC MEANS TO PRESENT VARIABLE INFORMATION
- G09G5/00—Control arrangements or circuits for visual indicators common to cathode-ray tube indicators and other visual indicators
- G09G5/36—Control arrangements or circuits for visual indicators common to cathode-ray tube indicators and other visual indicators characterised by the display of a graphic pattern, e.g. using an all-points-addressable [APA] memory
- G09G5/38—Control arrangements or circuits for visual indicators common to cathode-ray tube indicators and other visual indicators characterised by the display of a graphic pattern, e.g. using an all-points-addressable [APA] memory with means for controlling the display position
-
- H—ELECTRICITY
- H04—ELECTRIC COMMUNICATION TECHNIQUE
- H04L—TRANSMISSION OF DIGITAL INFORMATION, e.g. TELEGRAPHIC COMMUNICATION
- H04L41/00—Arrangements for maintenance, administration or management of data switching networks, e.g. of packet switching networks
- H04L41/08—Configuration management of networks or network elements
- H04L41/0895—Configuration of virtualised networks or elements, e.g. virtualised network function or OpenFlow elements
-
- H—ELECTRICITY
- H04—ELECTRIC COMMUNICATION TECHNIQUE
- H04L—TRANSMISSION OF DIGITAL INFORMATION, e.g. TELEGRAPHIC COMMUNICATION
- H04L41/00—Arrangements for maintenance, administration or management of data switching networks, e.g. of packet switching networks
- H04L41/12—Discovery or management of network topologies
- H04L41/122—Discovery or management of network topologies of virtualised topologies, e.g. software-defined networks [SDN] or network function virtualisation [NFV]
-
- H—ELECTRICITY
- H04—ELECTRIC COMMUNICATION TECHNIQUE
- H04L—TRANSMISSION OF DIGITAL INFORMATION, e.g. TELEGRAPHIC COMMUNICATION
- H04L41/00—Arrangements for maintenance, administration or management of data switching networks, e.g. of packet switching networks
- H04L41/22—Arrangements for maintenance, administration or management of data switching networks, e.g. of packet switching networks comprising specially adapted graphical user interfaces [GUI]
-
- H—ELECTRICITY
- H04—ELECTRIC COMMUNICATION TECHNIQUE
- H04L—TRANSMISSION OF DIGITAL INFORMATION, e.g. TELEGRAPHIC COMMUNICATION
- H04L41/00—Arrangements for maintenance, administration or management of data switching networks, e.g. of packet switching networks
- H04L41/40—Arrangements for maintenance, administration or management of data switching networks, e.g. of packet switching networks using virtualisation of network functions or resources, e.g. SDN or NFV entities
-
- G—PHYSICS
- G09—EDUCATION; CRYPTOGRAPHY; DISPLAY; ADVERTISING; SEALS
- G09G—ARRANGEMENTS OR CIRCUITS FOR CONTROL OF INDICATING DEVICES USING STATIC MEANS TO PRESENT VARIABLE INFORMATION
- G09G2354/00—Aspects of interface with display user
Description
本発明は、表示情報処理装置、表示情報処理方法および表示情報処理プログラムに関する。 The present invention relates to a display information processing device, a display information processing method, and a display information processing program.
IT(Information Technology)システム管理では、性能障害に対する対応およびキャパシティプランニング等、多種にわたる観点(性能および容量等。以降、前記観点をFeatureとも記す。)で管理業務が行われている。例えば、性能障害に対応する場合には、問題であるインフラリソースの性能状態を確認するとともに、複数問題の対処の優先順位をつけるために、影響を受ける関連アプリケーションリソースを確認する。このように、ITシステム管理を行う上では、問題の重要性を測る指標となるアプリケーションリソースと、問題のあるインフラリソースのシステム構成の両方を俯瞰することが行われる。 In IT (Information Technology) system management, management work is performed from various perspectives (performance, capacity, etc., hereinafter also referred to as Features), such as response to performance failures and capacity planning. For example, when dealing with a performance failure, the performance status of the problematic infrastructure resource is checked, and the affected related application resources are checked in order to prioritize the handling of multiple problems. In this way, when performing IT system management, an overview of both application resources, which serve as indicators for measuring the importance of problems, and the system configuration of problematic infrastructure resources is performed.
上記の通り、ITシステムの管理業務を効率的に行うためには観点を適宜切り替えつつ、インフラリソースとアプリケーションリソースの両方を含むITシステム全体を容易に俯瞰し、把握できることが求められる。このような要求に対して、ITシステムを構成する諸リソース間の関連をトポロジカルに表示する技術がある。 As described above, in order to efficiently perform IT system management work, it is required to be able to easily overview and understand the entire IT system including both infrastructure resources and application resources while switching viewpoints as appropriate. In response to such a demand, there is a technique for topologically displaying the relationships between various resources that constitute an IT system.
例えば、特許文献1では、クラウド環境上に構築されたITシステムについて、ITシステムを構成するリソースや、管理上のグループ単位(仮想DC、仮想サーバおよびセキュリティグループ等)の構成情報を収集し、それらの構成情報を基にシステム構成図を可視化する技術が開示されている。
For example, in
また、構成要素とその関係を表示するためのグラフ描画アルゴリズムとして、非特許文献1に示す杉山フレームワークが知られている。杉山フレームワークでは、ノードの種類ごとに画面上のY座標が固定されるようなグラフについて、ノードの座標を効率的に計算することができる。この杉山フレームワークを用いてITシステムの構成要素とその関係を表示できる。
Also, the Sugiyama framework shown in Non-Patent
また、特許文献2では、大規模ITシステムをトポロジカルに表示した際に、ノード数が大量となり、視認性が低下することに鑑み、ユーザがズーム操作を行った場合に、ズームの度合いに応じて適切にノードを表示する技術が開示されている。
Further, in
しかしながら、世界中に拠点を持つような大規模ITシステム環境の管理において、インフラリソースを地理的要素でグルーピングしてトポロジ上に表示すると、各インフラノードが配置され得る画面上の座標が制限されることとなる。杉山フレームワークなどのグラフ描画アルゴリズムでは、ノード間のリンクの長さおよび交点数を極小化することを目的にノード配置を調整するため、局所解に陥る可能性が高まる。 However, in managing a large-scale IT system environment that has bases all over the world, if infrastructure resources are grouped by geographical elements and displayed on a topology, the coordinates on the screen where each infrastructure node can be placed are limited. It will happen. Graph drawing algorithms such as the Sugiyama framework adjust node placement to minimize the length of links between nodes and the number of intersections, which increases the possibility of falling into local minima.
それにより、あるアプリケーションが複数の仮想マシン(Virtual Machine:VMとも言う)を利用している場合に、それらのVMノードが画面上の離れた場所に配置される場合が生じる。この場合には、例えば、アプリケーションノードとVMノード間のリンクの総距離を最小化しようとし、アプリケーションノードがどのVMノードからも離れた場所に配置されることがある。 As a result, when an application uses a plurality of virtual machines (also referred to as Virtual Machines: VMs), those VM nodes may be arranged at remote locations on the screen. In this case, for example, the application node may be located far from any VM node in an attempt to minimize the total distance of links between application nodes and VM nodes.
このように、アプリケーションノードと、それに関連するVMノードが離れた画面上の場所に配置されると、ズームアウトし、ITシステムの全体が表示される状態にしないと、アプリケーションノードとVMノードの両方を同時に、一画面で表示させることができなくなる。ITシステムの全体を表示させた状態では、一画面に表示される情報量が多く、問題個所の詳細構成を把握することができなくなる。一方で、問題個所の詳細構成を把握するために、アプリケーションノードと、それに関連するVMノードが離れた状態でズームインすると、アプリケーションノードとVMノードを一画面に同時に表示することができなくなる。 Thus, when an application node and its associated VM nodes are placed in separate screen locations, it is necessary to zoom out to a state where the entire IT system is visible to see both the application node and the VM node. cannot be displayed on one screen at the same time. When the entire IT system is displayed, the amount of information displayed on one screen is so large that it becomes impossible to grasp the detailed configuration of the problem area. On the other hand, if the application node and the VM node related to it are zoomed in to grasp the detailed configuration of the problem area, the application node and the VM node cannot be displayed on one screen at the same time.
本発明は、上記事情に鑑みなされたものであり、その目的は、ノード間の全体構成の視認性の低下を抑制しつつ、詳細構成の関連性の視認性を向上させることが可能な表示情報処理装置、表示情報処理方法および表示情報処理プログラムを提供することにある。 The present invention has been made in view of the circumstances described above, and an object of the present invention is to provide display information capable of improving the visibility of relationships between detailed configurations while suppressing deterioration in the visibility of the overall configuration between nodes. An object of the present invention is to provide a processing device, a display information processing method, and a display information processing program.
上記目的を達成するため、第1の観点に係る表示情報処理装置は、トポロジを構成するノードが割り当てられるエンティティ間の関連性に関する指標を設定し、前記指標に基づいて前記ノード間の距離を求め、前記ノード間の距離に基づいて、前記ノードの表示位置を設定する。 In order to achieve the above object, a display information processing apparatus according to a first aspect sets an index relating to the relationship between entities to which nodes constituting a topology are assigned, and obtains the distance between the nodes based on the index. , setting the display positions of the nodes based on the distances between the nodes.
本発明によれば、ノード間の全体構成の視認性の低下を抑制しつつ、詳細構成の関連性の視認性を向上させることができる。 ADVANTAGE OF THE INVENTION According to this invention, the visibility of the relationship of a detailed structure can be improved, suppressing the fall of the visibility of the whole structure between nodes.
実施形態について、図面を参照して説明する。なお、以下に説明する実施形態は特許請求の範囲に係る発明を限定するものではなく、また、実施形態の中で説明されている諸要素およびその組み合わせの全てが発明の解決手段に必須であるとは限らない。 Embodiments will be described with reference to the drawings. In addition, the embodiments described below do not limit the invention according to the claims, and all of the elements described in the embodiments and their combinations are essential to the solution of the invention. Not necessarily.
なお、以下の説明では、「aaaテーブル」の表現にて各種情報を説明することがあるが、各種情報は、テーブル以外のデータ構造で表現されていてもよい。データ構造に依存しないことを示すために、「aaaテーブル」を「aaa情報」と呼ぶことができる。さらに、テーブル内の各列の値からなる情報要素を欄またはエントリと呼び、「aaaテーブル」のエントリを、説明のために、「aaaテーブルエントリ」と称する。 In the following description, various types of information may be described using the expression "aaa table", but the various types of information may be expressed in a data structure other than a table. The "aaa table" can be referred to as "aaa information" to indicate that it is data structure independent. Further, an information element consisting of the values of each column in the table is called a column or entry, and an entry in the "aaa table" is called an "aaa table entry" for the sake of explanation.
また、以下の説明では、単に管理計算機及びサーバを主語として処理を説明する場合があるが、これら処理は、計算機が備える制御デバイスが有するプロセッサ(例えば、CPU(Central Processing Unit))によって実行されていることを示す。 Further, in the following explanation, the processing may be explained simply with the management computer and the server as subjects, but these processing are executed by a processor (for example, a CPU (Central Processing Unit)) of a control device provided in the computer. indicate that
図1は、第1実施形態に係る表示情報処理装置で制御される表示画面例を示す図である。
図1において、表示情報処理システムは、クライアント100と、トポロジ構成管理サーバ200を備える。クライアント100は、例えば、パーソナルコンピュータなどの端末である。
FIG. 1 is a diagram showing an example of a display screen controlled by the display information processing apparatus according to the first embodiment.
In FIG. 1, the display information processing system includes a
トポロジ構成管理サーバ200は、ITシステムを構成するリソース群やアプリケーションの構成情報202と、性能等の状態情報203を保持し、トポロジ構成を管理する。そして、トポロジ構成管理サーバ200は、クライアント100からの要求に応じて、トポロジデータをクライアント100に送信する。トポロジは、点(ノードとも言う)と線(エッジまたはリンクとも言う)を用いてモデル化された接続形態である。
The topology
クライアント100は、GUI(Graphical User Interface)110を表示する。ここで、クライアント100は、トポロジを構成するノードが割り当てられるエンティティ間の関連性に関する指標を設定し、その指標に基づいてノード間の距離を求め、ノード間の距離に基づいて、ノードの表示位置を設定する。エンティティは、例えば、ITシステムに用いられるインフラリソースおよびアプリケーションである。インフラリソースの少なくとも一部は仮想化されていてもよい。このとき、クライアント100は、トポロジを構成するノードをシンボル化またはアイコン化して表示してもよい。各ノードは、ユーザのクリックなどによって選択可能としてもよい。
The
また、エンティティ間の関連性に関する指標は、エンティティ間の関連性の大小を反映するように設定することができる。このとき、クライアント100は、エンティティ間の関連性が大きいときは、それらのエンティティに割り当てられたノードを結線するリンクの長さを小さくして、それらのノードが近接して表示されるようにし、エンティティ間の関連性が小さいときは、それらのエンティティに割り当てられたノードを結線するリンクの長さを大きくして、それらのノードが離れて表示されるようにすることができる。また、第1エンティティが割り当てられた第1ノードと第2エンティティが割り当てられた第2ノードが結線されているときに、第1エンティティから見た第2エンティティの重要度に基づいて、第1エンティティに対する第2エンティティの関連性に関する指標を設定することができる。
Also, an index related to the relationship between entities can be set so as to reflect the magnitude of the relationship between entities. At this time, when the relationship between entities is large, the
GUI110は、トポロジ表示部130と、サーチボックス140と、Featureセレクタ150を含む。トポロジ表示部130は、ITシステムを構成するインフラリソースとアプリケーションの関連を表現するトポロジマップを表示する。ITシステムを構成するインフラリソースは、例えば、VM、サーバ、ファブリックおよびストレージである。このとき、トポロジマップには、アプリケーションノード131と、VMノード132と、サーバノード133と、ファブリックノード134と、ストレージノード135と、それら各ノード間のリンクが含まれる。
また、トポロジマップでは、例えば、各ノードは、リソースの種類ごとに画面の同じ高さ(Y座標)に配置されていてよい。このとき、各ノードは、リソースの種類ごとに異なるシンボルで表現してもよい。また、ノードが必要以上に密集しないよう、X、Y座標ともに各ノードは、一定以上の距離を持って離れている。各ノードは、特定のリソースを表現し、複製はない。そのため、トポロジマップは、多対多のグラフの形式で表現されている。 Also, in the topology map, for example, each node may be arranged at the same height (Y coordinate) on the screen for each resource type. At this time, each node may be represented by a different symbol for each type of resource. In addition, each node is spaced apart from each other by a certain distance or more on both the X and Y coordinates so that the nodes are not densely packed more than necessary. Each node represents a specific resource and there are no duplicates. Therefore, the topology map is represented in the form of a many-to-many graph.
サーチボックス140は、ノード名を入力し、ノードを選択する。Featureセレクタ150は、例えば“Perforamce”や“Capacity”等、業務内容または目的に関連して、ユーザがリソースの状態を確認する際の観点を選択する。
A
各ノードには、リソースの状態を示すマーカ136が表示される。マーカ136は、Featureセレクタ150で選択された観点において、リソースの状態を表示する。例えば、図1の例は、現在のアプリケーションの性能状態を確認するために、Featureセレクタ150に“Performace”の値を設定した場合である。このとき、GUI110は、性能を計測する指標、例えばレスポンスタイムが異常判定閾値を超えた状態を黒塗りの丸、警告閾値を超えた状態を斜線の丸、正常な状態を白塗りの丸として表現することができる(以降、この3段階の状態をRAG(Red,Amber,Greenの各状態の集合の略字)と記す)。なお、表現形式は一例であって、GUI110は、リソースの状態に応じて、例えば、赤、黄または緑などの色を付してもよい。
Each node displays a
GUI110は、ユーザがクライアント100にアクセスすると、トポロジマップの初期状態を示した初期画面130Aをトポロジ表示部130に表示する。このとき、クライアント100は、ノード座標計算処理122を実行する。ノード座標計算処理122は、トポロジを構成するノードが割り当てられるエンティティ間の関連性に関する指標に基づいて、それらのノード間の距離を求め、それらのノード間の距離に基づいて、初期画面130Aで表示されるノードの表示座標を設定する。
When the user accesses the
例えば、ノード座標計算処理122は、インフラリソースの状態およびインフラリソースにかけられているコストを基に、各アプリケーションが同時に確認される可能性の高いインフラリソースを推定し、当該インフラリソースのより近くにアプリケーションが配置されるようにノードの表示座標を設定する。
For example, the node coordinate
図1の例では、トポロジマップは、TokyoデータセンタとNewYorkデータセンタという地理クラスタの単位でグルーピングしてインフラリソースのノードを表示し、そのインフラリソースに関連するアプリケーションのノードを結線して表示している。ここで、Tokyoデータセンタでは、例えば、最上位階層には、VM名がVM1~VM3という3つのVMノード132が表示され、NewYorkデータセンタでは、例えば、最上位階層には、VM名がVM4~VM6という3つのVMノード132が表示されている。VM名がVM1~VM6という6つのVMノード132は、TokyoデータセンタとNewYorkデータセンタを示す枠内の最も高い位置にY座標を揃えてX軸に沿って並べて配置されている。
In the example of FIG. 1, the topology map displays infrastructure resource nodes by grouping them by geographic cluster unit of Tokyo data center and New York data center, and displays application nodes related to the infrastructure resources by connecting them. there is Here, in the Tokyo data center, for example, three
また、アプリ名がAP1というアプリケーションに対し、VM名がVM1というVMと、VM名がVM5というVMが割り当てられ、アプリ名がAP2というアプリケーションに対し、VM名がVM3というVMが割り当てられているものとする。このとき、このトポロジマップでは、アプリ名がAP1というアプリケーションノード131が、VM名がVM1というVMノード132と、VM名がVM5というVMノード132に結線され、アプリ名がAP2というアプリケーションノード131が、VM名がVM3というVMノード132に結線される。
An application with an application name of AP1 is assigned a VM with a VM name of VM1 and a VM with a VM name of VM5, and an application with an application name of AP2 is assigned a VM with a VM name of VM3. and At this time, in this topology map, the
そして、VM名がVM1、VM4~VM6のVMノード132には、レスポンスタイムが正常な状態を示す白塗りの丸で表現されたマーカ136が付され、VM名がVM3のVMノード132には、レスポンスタイムが警告閾値を超えた状態を示す斜線の丸で表現されたマーカ136が付され、VM名がVM2のVMノード132には、レスポンスタイムが異常判定閾値を超えた状態を示す黒塗りの丸で表現されたマーカ136が付されている。
The
この場合では、ユーザは、TokyoデータセンタにあるVM名がVM2というVMについて、優先度を上げて対応すべきか否かを判断するため、そのVMに関連するアプリケーションを見る。そのため、NewYorkデータセンタにある異常の発生していないVM名がVM5というVMに比べ、TokyoデータセンタにあるVM名がVM2というVMの方が、ユーザがアプリケーションと同時に確認しようとする可能性が高い。 In this case, the user looks at the applications associated with the VM with the VM name VM2 in the Tokyo data center in order to determine whether it should be handled with a higher priority. Therefore, users are more likely to try to check the VM named VM2 in the Tokyo data center at the same time as the application than the VM named VM5 in the New York data center with no abnormalities. .
ここで、ノード座標計算処理122は、各VMのレスポンスタイムを基に、各アプリケーションが同時に確認される可能性の高いVMを推定し、当該VMのより近くにアプリケーションが配置されるようにノードの表示座標を設定する。例えば、ノード座標計算処理122は、VM名がVM2、VM5というVMに関連するアプリ名がAP1というアプリケーションについて、そのアプリケーションノード131をVM名がVM2のVMノード132の近くに配置する。
Here, based on the response time of each VM, the node coordinate
これにより、ユーザは、TokyoデータセンタとNewYorkデータセンタについて一画面上で異常のあるVMを確認することが可能となるとともに、異常のあるVMとアプリケーションとの関連性を詳細に確認するために、ユーザがズームイン操作を行った場合においても、GUI110は、異常のあるVMと、そのVMに関連するアプリケーションを一画面に含めたまま表示することができる。
As a result, the user can confirm the abnormal VMs in the Tokyo data center and the New York data center on one screen, and in order to confirm in detail the relationship between the abnormal VM and the application, Even when the user performs a zoom-in operation, the
また、GUI110は、ユーザがVMノード132を選択すると、その選択結果に応じてトポロジマップのアプリケーションノード131の位置を変更した変更画面130Bをトポロジ表示部130に表示する。ノードの選択方法は、例えば、マウスによるクリック操作であってもよいし、サーチボックス140へのノード名の入力であってもよい。
Further, when the user selects the
例えば、現状では異常は無いが異常の発生しているリソースの近傍にあるなどの場合には、ユーザが特定のノードを指定し、状態および構成を確認する場合がある。この場合では、ユーザは、仮にインフラリソースに異常が発生した場合に、影響が波及するアプリケーションを確認する動作をする。 For example, when there is no abnormality at present but it is in the vicinity of a resource in which an abnormality has occurred, the user may specify a specific node to check the state and configuration. In this case, if an infrastructure resource fails, the user checks the applications affected by the failure.
このため、ノード座標計算処理122は、ユーザのノードの選択状態も加味し、各アプリケーションから見たインフラリソースの重要度を再計算し、アプリケーションノードの配置を変更する。例えば、ユーザが、VM名がVM5というVMに注目し、VM5というVM名をサーチボックス140に入力したものとする。このとき、ノード座標計算処理122は、ノード選択情報138に基づいてノード間の距離を求め、ノード間の距離に基づいて、変更画面130Bで表示されるノードの表示座標を設定する。GUI110は、VM名がVM5というVMに関連するアプリ名がAP1というアプリケーションについて、そのアプリケーションノード131をVM名がVM5のVMノード132の近くに表示する。
For this reason, the node coordinate
これにより、ユーザは、TokyoデータセンタとNewYorkデータセンタについて一画面上で異常のあるVMに関連するアプリケーションに関連する異常のないVMを確認することが可能となるとともに、そのアプリケーションと異常のないVMとの関連性を詳細に確認するために、ユーザがズームイン操作を行った場合においても、GUI110は、そのアプリケーションと異常のないVMを一画面に含めたまま表示することができる。
As a result, the user can check the normal VMs related to the application related to the abnormal VM on one screen for the Tokyo data center and the New York data center, and Even when the user performs a zoom-in operation in order to confirm the relationship with the application in detail, the
図2は、第1実施形態に係る表示画面のズーム操作時の画面遷移例を示す図である。
図2において、図1のクライアント100は、ITシステム全体の構成を示すトポロジマップを保持し、トポロジマップの一部をトポロジ表示部130に表示する。
FIG. 2 is a diagram showing an example of screen transition during a zoom operation on the display screen according to the first embodiment.
2, the
ユーザがGUI110にアクセスすると、GUI110は、表示画面130aをトポロジ表示部130に表示する。表示画面130aには、トポロジマップの初期状態であるITシステム全体が表示される。この時、インフラリソースノード群は国の単位でクラスタ化され、トポロジマップ上には国を示す矩形(以下、国などの地理の単位でまとめられた矩形を地理クラスタ、またはまとめられている単位毎にxxクラスタ(例:国クラスタ)と呼ぶ。)が表示される。
When the user accesses the
図2の例では、日本単位およびアメリカ単位でそれぞれまとめられた国クラスタ161、162が表示範囲H1Aに表示され、国クラスタ161、162に関連するアプリケーションノード131が表示されている。
In the example of FIG. 2,
より詳細なインフラ構成を表示するため、ユーザは、例えば、マウスによる上下スクローリング操作や、タッチ操作によるピッチイン操作によって、指定箇所を中心に、トポロジマップをズームイン(拡大)することができる。これにより、トポロジマップ全体に対する表示範囲の幅および高さは小さくなり、GUI110は、その表示範囲をトポロジ表示部130に縮尺を合わせて表示することで、ノードやリンクの画面上の大きさが大きくなる。また、例えば、マウスによるグリッド操作により、ユーザは表示範囲を変更することができる。
In order to display a more detailed infrastructure configuration, the user can zoom in (enlarge) the topology map centering on a designated point, for example, by performing a vertical scrolling operation with a mouse or a pitch-in operation with a touch operation. As a result, the width and height of the display range with respect to the entire topology map are reduced, and the
表示画面130aにおいて、ユーザが表示範囲H2Aについてズームイン操作を行い、トポロジマップの一部を拡大したものとする。このとき、GUI110は、表示画面130bをトポロジ表示部130に表示する。ここで、国クラスタ161、162が表示される状態からユーザがズームイン操作を行っていくと、任意のズームの度合い(以降、ズーム率と呼ぶ)に達したタイミングで、国クラスタ161、162の内部にデータセンタクラスタが表示される。図2の例では、国クラスタ161には、Osakaデータセンタ単位でまとめられたDCクラスタ171と、Tokyoデータセンタ単位でまとめられたDCクラスタ172が表示範囲H1Bに表示され、国クラスタ162には、NewYorkデータセンタ単位でまとめられたDCクラスタ173が表示範囲H1Bに表示され、DCクラスタ172、173に関連するアプリケーションノード131が表示されている。
It is assumed that the user performs a zoom-in operation on the display range H2A on the
表示画面130bにおいて、ユーザが表示範囲H2Bについてズームイン操作を行い、トポロジマップの一部を拡大したものとする。このとき、GUI110は、表示画面130cをトポロジ表示部130に表示する。図2の例では、DCクラスタ172には、サーバノードとVMノードがまとめられたサーバクラスタ181、182とサーバクラスタ181、182に結線されたファブリックノード134と、ファブリックノード134に結線されたストレージノード135が表示範囲H1Cに表示され、DCクラスタ173には、サーバノードとVMノードがまとめられたサーバクラスタ183とサーバクラスタ183に結線されたファブリックノード134と、ファブリックノード134に結線されたストレージノード135が表示範囲H1Cに表示され、サーバクラスタ181、183に関連するアプリケーションノード131が表示されている。
It is assumed that the user performs a zoom-in operation on the display range H2B on the
表示画面130cにおいて、ユーザが表示範囲H2Cについてズームイン操作を行い、トポロジマップの一部を拡大したものとする。このとき、GUI110は、表示画面130dをトポロジ表示部130に表示する。図2の例では、アプリケーションノード131と、DCクラスタ172に含まれるVMノード132と、サーバノード133と、ファブリックノード134と、ストレージノード135が表示範囲H1Dに表示され、VMノード132に結線されたアプリケーションノード131が表示範囲H1Dに表示されている。
It is assumed that the user performs a zoom-in operation on the display range H2C on the
なお、表示画面130a~130dには地理クラスタの単位で表示する場合を例示したが、国クラスタおよびDCクラスタ以外の単位で表示するようにしてもよい。例えば、国よりも下の単位に市が含まれていてもよい。また、各地理クラスタを表示するズーム率は、各地理クラスタで一定である必要もない。例えば、データセンタまたはサーバクラスタが少ない国と、地理クラスタまたはリソースが多い国がある場合には、後者に比べ前者の構成の複雑さは低いため、クライアント100は、ズーム度合いがより低い段階で各ノードとリンクを表示してもよい。
The
図3は、第1実施形態に係る表示情報処理装置が適用されるシステムの構成を示すブロック図である。
図3において、計算機システムは、クライアント100と、トポロジ構成管理サーバ200と、ITシステム300を備える。ITシステム300は、トポロジマップに表示されるリソース群である管理対象リソース群を備える。このリソース群は、例えば、アプリケーション群310、VM群320、サーバ群330、ファブリック群340およびストレージ群350を備える。ITシステム300は、例えば、ある企業で管理されるデータセンタ群である。これらのデータセンタ群は、世界中の各国に分散配置されていてもよい。
FIG. 3 is a block diagram showing the configuration of a system to which the display information processing apparatus according to the first embodiment is applied.
3, the computer system comprises a
クライアント100と、トポロジ構成管理サーバ200と、ITシステム300は、ネットワーク400を介して通信する。これらサーバおよびツールは、それぞれがCPU、メモリおよびハードディスクなどからなる計算機で動作する。その動作形態は、それぞれ物理的に異なる計算機上で動作していてもよいし、仮想サーバと呼ばれる物理的な計算機が論理的に分割された計算機の単位で動作していてもよい。もしくは1台の計算機または複数の計算機クラスタ上で実行されるタスク(プロセスやコンテナとも呼ばれる)単位で動作してもよい。
クライアント100は、階層化されたトポロジマップおよび各種の設定値入力セレクタ等を表示するGUI110と、GUI110にトポロジマップを表示する処理を行う表示処理部120を含む。クライアント100は、ウェブブラウザ上で動作するWebアプリケーションであってもよいし、独立したデスクトップアプリケーションであってもよい。
The
表示処理部120は、イベント分析処理121と、ノード座標計算処理122を実行し、それらの処理で用いられるデータを保持する各種テーブルを備える。イベント分析処理121は、ユーザのノード選択操作に対応して、ノードの注目度を更新する。ノード座標計算処理122は、インフラリソースノードおよびアプリケーションノードの座標を計算する。
The
このとき、ノード座標計算処理122は、各ノードの配置座標の計算時に、例えば、インフラリソースの重要度(以下、インフラ重要度と言うことがある)と、アプリケーションの重要度(以下、アプリ重要度と言うことがある)を計算し、アプリケーションノードとインフラノードとの間の距離をインフラリソースの重要度の逆数で荷重し、より重要なインフラノードの近くにアプリケーションノードが配置されるよう、アプリケーションノードの配置を決める。また、ノード座標計算処理122は、アプリケーションの重要度を基に、より重要なアプリケーションがインフラノードの近くに配置されるよう、アプリケーションノードの配置を決める。
At this time, the node coordinate
このとき、例えば、インフラリソースの重要度は、アプリケーション毎にインフラリソースの状態と、コストを基に計算され、アプリケーションの重要度は、アプリケーションが関連するインフラリソースのコストの合計値から計算される。これにより、リソース数が増加した場合であっても、ユーザは、観点および着目リソースを変えつつITシステム全体の状態を容易に俯瞰し把握することが可能となる。 At this time, for example, the importance of infrastructure resources is calculated based on the state and cost of infrastructure resources for each application, and the importance of an application is calculated from the total cost of infrastructure resources related to the application. As a result, even when the number of resources increases, the user can easily overview and understand the state of the entire IT system while changing the viewpoint and focused resources.
トポロジ構成管理サーバ200は、トポロジ生成処理201を実行し、ITシステム300の構成情報およびトポロジマップの構成情報を保持する各種テーブルを備える。トポロジ構成管理サーバ200は、ITシステム300の構成情報を収集してトポロジデータを生成し、クライアント100の要求に応じて、トポロジデータを送信する。
The topology
図4は、図3のアプリ構成管理テーブルの構成例を示す図である。
図4において、アプリ構成管理テーブルT200は、アプリケーションの基本情報と、インフラリソースとの関連を保持する。
FIG. 4 is a diagram showing a configuration example of the application configuration management table of FIG.
In FIG. 4, the application configuration management table T200 holds the relationship between basic information of applications and infrastructure resources.
アプリケーション構成管理テーブルT200は、アプリケーションリソースID T2001、アプリケーション名T2002およびVMリソースID T2003の情報を含む。アプリケーションリソースID T2001は、アプリケーションを識別するためのIDである。ここで、アプリケーションとは、ビジネス部門等のエンドユーザに対してあるサービスを提供する単位であり、例えば、会計業務処理を提供するシステムなどである。その実体は、コンテナ技術を用いていてもよいし、FaaS(Function as a Service)などで構成されていてもよい。VMリソースID T2003は、アプリケーションに関係するVMリソースのIDである。 The application configuration management table T200 includes information on application resource ID T2001, application name T2002 and VM resource ID T2003. Application resource ID T2001 is an ID for identifying an application. Here, an application is a unit that provides a certain service to an end user such as a business department, and is, for example, a system that provides accounting business processing. The entity may use container technology, or may be configured by FaaS (Function as a Service) or the like. VM resource ID T2003 is the ID of the VM resource related to the application.
アプリケーション構成管理テーブルT200は、図1のGUI110で表示されるアプリケーションノード131とVMノード132の関連性を示す。図4の例では、アプリケーションリソースIDが1のアプリケーションにVMリソースIDが2と5のVMが割り当てられ、アプリケーションリソースIDが2のアプリケーションにVMリソースIDが3のVMが割り当てられていることを示し、この関係に従って、図1のAP1のアプリケーションノードがVM2とVM5のVMノードに結線され、AP2のアプリケーションノードがVM3のVMノードに結線されたトポロジマップが生成される。
The application configuration management table T200 shows the relationship between the
図5は、図3のVM構成管理テーブルの構成例を示す図である。
図5において、VM構成管理テーブルT210は、VMの基本情報と、各種インフラリソースとの関連を保持する。
FIG. 5 is a diagram showing a configuration example of the VM configuration management table of FIG.
In FIG. 5, the VM configuration management table T210 holds basic information of VMs and associations with various infrastructure resources.
VM構成管理テーブルT210は、VMリソースID T2101、VM名T2102、インスタンスタイプID T2103、サーバリソースID T2104、ボリュームリソースID T2105、国T2106およびデータセンタT2107の情報を含む。VMリソースID T2101は、VMを識別するためのIDである。インスタンスタイプID T2103は、VMのスペックおよび価格を示すインスタンスタイプの識別IDである。サーバリソースID T2104は、VMが動作するサーバリソースを識別するIDである。ボリュームリソースID T2105は、VMに対して割り当てられているストレージボリュームを識別するIDである。国T2106とデータセンタT2107は、VMが稼働する国名とデータセンタ名である。 The VM configuration management table T210 includes information on VM resource ID T2101, VM name T2102, instance type ID T2103, server resource ID T2104, volume resource ID T2105, country T2106 and data center T2107. A VM resource ID T2101 is an ID for identifying a VM. The instance type ID T2103 is an identification ID of the instance type indicating the specifications and price of the VM. The server resource ID T2104 is an ID that identifies the server resource on which the VM operates. The volume resource ID T2105 is an ID that identifies the storage volume assigned to the VM. The country T2106 and data center T2107 are the name of the country and the name of the data center where the VM operates.
VM構成管理テーブルT210は、図1のGUI110で表示されるVMノード132とサーバノード133の関連性を示す。また、VM構成管理テーブルT210は、VMノード132とサーバノード133がどの地理クラスタに属するかも示す。図5の例では、例えば、図1のVM1~VM3のVMノード132がDCクラスタ172に配置され、VM4~VM6のVMノード132がDCクラスタ173に配置される。
The VM configuration management table T210 shows the relationship between the
図6は、図3のサーバ構成管理テーブルの構成例を示す図である。
図6において、サーバ構成管理テーブルT220は、サーバの基本情報と、各種インフラリソースとの関連を保持する。
FIG. 6 is a diagram showing a configuration example of the server configuration management table of FIG.
In FIG. 6, the server configuration management table T220 holds basic information of the server and relationships with various infrastructure resources.
サーバ構成管理テーブルT220は、サーバリソースID T2201、サーバ名T2202、ファブリックリソースID T2203、サーバクラスタT2204、国T2205およびデータセンタT2206の情報を含む。サーバリソースID T2201は、サーバを識別するためのIDである。ファブリックリソースID T2203は、サーバが接続されているSAN(Storage Area Network)ファブリックを識別するためのIDである。サーバクラスタT2204は、サーバが属するサーバクラスタの名前であり、国T2205とデータセンタT2206は、サーバが稼働する国名とデータセンタ名である。 Server configuration management table T220 includes information on server resource ID T2201, server name T2202, fabric resource ID T2203, server cluster T2204, country T2205 and data center T2206. A server resource ID T2201 is an ID for identifying a server. The fabric resource ID T2203 is an ID for identifying a SAN (Storage Area Network) fabric to which the server is connected. Server cluster T2204 is the name of the server cluster to which the server belongs, and country T2205 and data center T2206 are the country name and data center name in which the server operates.
サーバ構成管理テーブルT220は、図1のGUI110で表示されるサーバノード133とファブリックノード134の関連性を示す。また、サーバ構成管理テーブルT220は、サーバノード133がどの地理クラスタに属するかも示す。
The server configuration management table T220 shows the relationship between the
図7は、図3のファブリック構成管理テーブルの構成例を示す図である。
図7において、ファブリック構成管理テーブルT230は、SANファブリックの基本情報と、各種インフラリソースとの関連を保持する。
FIG. 7 is a diagram showing a configuration example of the fabric configuration management table of FIG.
In FIG. 7, the fabric configuration management table T230 holds basic information of the SAN fabric and associations with various infrastructure resources.
ファブリック構成管理テーブルT230は、ファブリックリソースID T2301、ファブリック名T2302、国T2303、データセンタT2304の情報を含む。ファブリックリソースID T2301は、SANファブリックを識別するためのIDである。国T2305とデータセンタT2306は、SANファブリックが稼働する国名とデータセンタ名である。ファブリック構成管理テーブルT230は、ファブリックノード134がどの地理クラスタに属するかを示す。
The fabric configuration management table T230 includes information on fabric resource ID T2301, fabric name T2302, country T2303, and data center T2304. Fabric resource ID T2301 is an ID for identifying a SAN fabric. Country T2305 and Data Center T2306 are the country name and data center name where the SAN fabric operates. The fabric configuration management table T230 indicates which geographical cluster the
図8は、図3のボリューム管理テーブルの構成例を示す図である。
図8において、ボリューム構成管理テーブルT240は、ストレージボリュームの基本情報と、各種インフラリソースとの関連を保持する。
FIG. 8 is a diagram showing a configuration example of the volume management table of FIG.
In FIG. 8, the volume configuration management table T240 holds basic information of storage volumes and relationships with various infrastructure resources.
ボリューム構成管理テーブルT240は、ボリュームリソースID T2401、ボリューム名T2402、インスタンスタイプID T2403、ストレージリソースID T2404、国T2405およびデータセンタT2406の情報を含む。ボリュームリソースID T2401は、ストレージボリュームを識別するためのIDである。インスタンスタイプID T2403は、ストレージボリュームのスペックや価格を示すインスタンスタイプの識別IDである。ストレージリソースID T2404は、ストレージボリュームが属するストレージ装置を識別するIDである。国T2405とデータセンタT2406は、ストレージボリュームが稼働する国名とデータセンタ名である。 The volume configuration management table T240 includes information on volume resource ID T2401, volume name T2402, instance type ID T2403, storage resource ID T2404, country T2405 and data center T2406. A volume resource ID T2401 is an ID for identifying a storage volume. The instance type ID T2403 is an instance type identification ID that indicates the specifications and price of the storage volume. The storage resource ID T2404 is an ID that identifies the storage device to which the storage volume belongs. Country T2405 and data center T2406 are the name of the country and the name of the data center where the storage volume operates.
ボリューム構成管理テーブルT240は、図1のGUI110で表示されるストレージノード135に関連するボリュームを示す。また、ボリューム構成管理テーブルT240は、ストレージノード135に関連するボリュームがどの地理クラスタに属するかも示す。
The volume configuration management table T240 shows volumes associated with the
図9は、図3のストレージ構成管理テーブルの構成例を示す図である。
図9において、ストレージ構成管理テーブルT250は、ストレージ装置の基本情報と、各種インフラリソースとの関連を保持する。
FIG. 9 is a diagram showing a configuration example of the storage configuration management table of FIG.
In FIG. 9, the storage configuration management table T250 holds basic information of the storage device and relationships with various infrastructure resources.
ストレージ構成管理テーブルT250は、ストレージリソースID T25011、ストレージ名T2502、ファブリックリソースID T2503、国T2504およびデータセンタT2505の情報を含む。ストレージリソースID T2501は、ストレージ装置を識別するためのIDである。ファブリックリソースID T2503は、ストレージ装置が接続するSANファブリックを識別するIDである。国T2405とデータセンタT2406は、ストレージ装置が稼働する国名とデータセンタ名である。 The storage configuration management table T250 includes information on storage resource ID T25011, storage name T2502, fabric resource ID T2503, country T2504 and data center T2505. A storage resource ID T2501 is an ID for identifying a storage device. The fabric resource ID T2503 is an ID that identifies the SAN fabric to which the storage device is connected. Country T2405 and data center T2406 are the name of the country and the name of the data center where the storage device operates.
ストレージ構成管理テーブルT250は、、図1のGUI110で表示されるストレージノード135とファブリックノード134との関連性を示す。また、ストレージ構成管理テーブルT250は、ストレージノード135がどの地理クラスタに属するかも示す。
The storage configuration management table T250 shows the relationship between the
図10は、図3のカタログ管理テーブルの構成例を示す図である。
図10において、カタログ管理テーブルT260は、VMおよびストレージボリュームについて、スペックと、それに対する価格を保持する。
FIG. 10 is a diagram showing a configuration example of the catalog management table shown in FIG.
In FIG. 10, the catalog management table T260 holds specifications and prices for VMs and storage volumes.
カタログ管理テーブルT260は、インスタンスタイプID T2601、インスタンスタイプ名T2602、種類T2603、メモリT2604、CPUT2605、デバイスタイプT2606および価格T2607の情報を含む。インスタンスタイプID T2601は、VMおよびストレージボリュームのスペックと価格を示すインスタンスタイプを識別するIDである。種類T2603は、VMまたはストレージボリューム等、インスタンスタイプの種類を示す。メモリT2604とCPU T2605は、VMのスペックを保持する欄であり、デバイスタイプT2606は、ストレージボリュームのスペックを保持する欄である。価格T2607は、各スペックに対する価格である。 Catalog management table T260 includes information on instance type ID T2601, instance type name T2602, type T2603, memory T2604, CPUT2605, device type T2606 and price T2607. The instance type ID T2601 is an ID that identifies the instance type indicating the specifications and prices of the VM and storage volume. The type T2603 indicates the type of instance type, such as VM or storage volume. The memory T2604 and CPU T2605 are fields for holding VM specifications, and the device type T2606 is a field for holding storage volume specifications. The price T2607 is the price for each spec.
カタログ管理テーブルT260で管理される情報は、インフラリソースの重要度の計算に用いることができ、インフラリソースの重要度は、図1のGUI110で表示されるアプリケーションノードとインフラリソースノードの距離の計算に用いることができる。 The information managed by the catalog management table T260 can be used to calculate the importance of infrastructure resources. can be used.
図11は、図3のノードデータ管理テーブルの構成例を示す図である。
図11において、ノードデータ管理テーブルT270は、トポロジデータのノードの基本情報と、性能などの各種リソースの状態情報を保持する。
FIG. 11 is a diagram showing a configuration example of the node data management table of FIG.
In FIG. 11, the node data management table T270 holds basic node information of topology data and status information of various resources such as performance.
ノードデータ管理テーブルT270は、ノードID T2701、ノード名T2702、リソースID T2703、リソース名T2704、リソース種類T2705、応答時間T2706、国T2707およびデータセンタT2708の情報を含む。ノードID T2701は、トポロジマップのノードを識別するIDであり、ノードデータ管理テーブルT270でユニークな値である。リソース種類T2705にはリソースの種類を示す値が格納され、リソースID T2703、リソース名T2704、国T2707およびデータセンタT2708にはそれぞれ、リソース種別T2705に対応する構成管理テーブルT200~T250に格納されている対応データが格納される。応答時間T2706は、各リソースがストレージアクセスする際のレスポンスタイムが格納される。なお、あるリソースが複数のボリュームまたはストレージアクセス経路を保持している場合には、最悪値が格納される。 The node data management table T270 includes information on node ID T2701, node name T2702, resource ID T2703, resource name T2704, resource type T2705, response time T2706, country T2707 and data center T2708. A node ID T2701 is an ID that identifies a node in the topology map, and is a unique value in the node data management table T270. The resource type T2705 stores a value indicating the resource type, and the resource ID T2703, resource name T2704, country T2707, and data center T2708 are stored in configuration management tables T200 to T250 corresponding to the resource type T2705. Corresponding data is stored. The response time T2706 stores the response time when each resource accesses the storage. If a resource holds multiple volumes or storage access paths, the worst value is stored.
ノードデータ管理テーブルT270で管理される情報は、図1のGUI110で表示されるノードの生成に用いることができる。また、ノードデータ管理テーブルT270で管理される情報は、インフラリソースの重要度の計算に用いることができ、インフラリソースの重要度は、図1のGUI110で表示されるアプリケーションノードとインフラリソースノードの距離の計算に用いることができる。
Information managed by the node data management table T270 can be used to generate nodes displayed on the
図12は、図3のリンクデータ管理テーブルの構成例を示す図である。
図12において、リンクデータ管理テーブルT280は、トポロジマップのノード間の各リンクの情報を保持する。リンクデータ管理テーブルT280は、リンクの起点ノードのIDを保持する欄T2801と、終点ノードのIDを保持する欄T2802を保持する。
FIG. 12 is a diagram showing a configuration example of the link data management table of FIG.
In FIG. 12, the link data management table T280 holds information on each link between nodes in the topology map. The link data management table T280 holds a column T2801 holding the ID of the origin node of the link and a column T2802 holding the ID of the end node of the link.
リンクデータ管理テーブルT280で管理される情報は、図1のGUI110で表示されるリンクの生成に用いることができる。例えば、GUI110は、起点ノードIDが101と終点ノードIDが202という情報に従って、AP1のアプリケーションノードとVM2のVMノードを結線し、起点ノードIDが101と終点ノードIDが205という情報に従って、AP1のアプリケーションノードとVM5のVMノードを結線し、起点ノードIDが102と終点ノードIDが203という情報に従って、AP2のアプリケーションノードとVM3のVMノードを結線する。
Information managed by the link data management table T280 can be used to generate links displayed on the
図13は、図3の地理クラスタ配置情報管理テーブルの構成例を示す図である。
図13において、地理クラスタ配置管理テーブルT110は、ITシステム全体をトポロジにマッピングした際の各地理クラスタの座標および大きさを保持する。地理クラスタ配置管理テーブルT110は、クラスタ名 T1101、X座標T1102、Y座標T1103、高さT1104および幅T1105の情報を含む。各座標の値は、トポロジマップの左上頂点を原点とし、左方向にX座標が大きくなり、下方向にY座標が大きくなるような座標系の値である。値の単位は限定していない。ピクセルであってもよいし、ミリメートルであってもよい。
FIG. 13 is a diagram showing a configuration example of the geographic cluster arrangement information management table of FIG.
In FIG. 13, the geographic cluster placement management table T110 holds the coordinates and size of each geographic cluster when mapping the entire IT system to the topology. Geographic cluster placement management table T110 includes information on cluster name T1101, X coordinate T1102, Y coordinate T1103, height T1104 and width T1105. Each coordinate value is a value of a coordinate system in which the upper left vertex of the topology map is the origin, the X coordinate increases in the left direction, and the Y coordinate increases in the downward direction. The unit of value is not limited. It may be pixels or millimeters.
図14は、図3のノード配置管理テーブルの構成例を示す図である。
図14において、ノード配置管理テーブルT120は、ITシステム全体をトポロジにマッピングした際の各ノードの座標を保持する。ノード配置管理テーブルT120は、ノードID T1201、X座標T1202およびY座標T1203の情報を含む。座標系と単位は、図13の地理クラスタ配置管理テーブルT110と同様である。
FIG. 14 is a diagram showing a configuration example of the node placement management table of FIG.
In FIG. 14, the node placement management table T120 holds the coordinates of each node when the entire IT system is mapped onto the topology. Node placement management table T120 includes information on node ID T1201, X coordinate T1202 and Y coordinate T1203. The coordinate system and units are the same as in the geographic cluster arrangement management table T110 of FIG.
図15は、図3のインフラ重要度管理テーブルの構成例を示す図である。
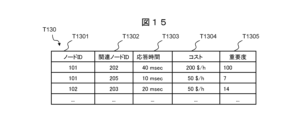
図15において、インフラ重要度管理テーブルT130は、各アプリケーションにとっての各インフラリソースの重要度を保持する。ここで、重要度とは、ユーザがトポロジマップを表示した際に、問題が発生しているなど、トポロジマップのうち優先して注目する可能性の高さを示す値である。
FIG. 15 is a diagram showing a configuration example of the infrastructure importance management table of FIG.
In FIG. 15, the infrastructure importance management table T130 holds the importance of each infrastructure resource for each application. Here, the degree of importance is a value that indicates the degree of possibility that a user will preferentially pay attention to a topology map when a problem occurs when the topology map is displayed.
インフラ重要度管理テーブルT130は、ノードID T1301、関連ノードID T1302、応答時間T1303、コストT1304、重要度T1305の情報を含む。ノードID T1301は、アプリケーションノードのIDであり、関連ノードID T1302は、ノードID T1301に関連しているインフラノードのIDである。なお、本実施形態では、インフラ重要度管理テーブルT130には、アプリケーションノードに直接関連するVMノードのIDを格納する。 The infrastructure importance management table T130 includes information on node ID T1301, related node ID T1302, response time T1303, cost T1304, and importance T1305. Node ID T1301 is the ID of the application node, and Associated Node ID T1302 is the ID of the infrastructure node associated with Node ID T1301. In this embodiment, the infrastructure importance management table T130 stores the ID of the VM node directly related to the application node.
応答時間T1303は、関連ノードにおけるストレージアクセスの応答時間である。応答時間T1303は、性能観点でのリソースの状態を示し、大きいほど性能問題が発生している可能性が高く、ユーザが着目しやすい。コストT1304は、関連ノードに対してユーザが支払っているコストである。本実施形態では、VMとボリュームにかかる費用を示す。このコストが高いほど、当該リソースは、ユーザにとって大切なアプリケーションに用いていると考えられる。重要度T1305は、ユーザがトポロジマップで優先して着目する可能性の高さであり、例えば、リソースの状態とリソースのコストから計算される。 The response time T1303 is the storage access response time at the associated node. The response time T1303 indicates the state of the resource in terms of performance, and the larger the response time, the higher the possibility that a performance problem has occurred, and the easier it is for the user to pay attention to it. The cost T1304 is the cost paid by the user for the associated node. In this embodiment, the costs for VMs and volumes are shown. It is considered that the higher the cost, the more the resource is being used for an application that is important to the user. The degree of importance T1305 is the degree of possibility that the user will preferentially focus on the topology map, and is calculated, for example, from the state of the resource and the cost of the resource.
図16は、図3のアプリ重要度管理テーブルの構成例を示す図である。
図16において、アプリ重要度管理テーブルT140は、アプリケーションの重要度を保持する。アプリ重要度管理テーブルT140は、ノードID T1401、コストT1402、重要度T1403、国T1404、データセンタT1405の情報を含む。
FIG. 16 is a diagram showing a configuration example of the application importance management table of FIG.
In FIG. 16, the application importance management table T140 holds the importance of applications. Application importance management table T140 includes information on node ID T1401, cost T1402, importance T1403, country T1404, and data center T1405.
ノードIDT1401は、アプリケーションノードのIDである。コストT1402はアプリケーションが関連するインフラリソースの総コストであり、データセンタT1405毎に保持する。重要度T1403は、コストT1402の値が大きいほど、大きくなる値である。これは、コストがより多くかけられているアプリケーションほど、ユーザにとって大切であるとの仮定による。
A
また、アプリケーションが各データセンタに使用リソースを分散させる理由が、各地域からのアクセスに対してレスポンス性能を担保するためであったり、DR(Disaster Recovery)等の可用性の向上のためであると考えられるため、アプリケーションにとって各データセンタのリソースの重要性にばらつきがある。そのため、インフラ視点から見てもデータセンタ毎にアプリケーションの重要度が変わると考えられるため、データセンタ毎に重要度T1403を計算する。 In addition, the reason why the application distributes the resources used to each data center is to ensure response performance for access from each region, or to improve availability such as DR (Disaster Recovery). Therefore, the importance of each data center's resources to the application varies. Therefore, it is considered that the degree of importance of the application varies from data center to data center even when viewed from the viewpoint of infrastructure, so the degree of importance T1403 is calculated for each data center.
図17は、図3の注目度管理テーブルの構成例を示す図である。
図17において、注目度管理テーブルT150は、トポロジマップの中でユーザが着目している箇所からの距離を示す。注目度管理テーブルT150は、ノードID T1501と、注目度T1502の情報を含む。
FIG. 17 is a diagram showing a configuration example of the attention level management table of FIG.
In FIG. 17, the attention level management table T150 indicates the distance from the location on which the user is paying attention in the topology map. The attention degree management table T150 includes node ID T1501 and attention degree T1502 information.
図3のクライアント100は、ユーザのノード選択操作に基づき注目度を計算する。ユーザがノードを選択した際には、選択されたノードの注目度T1502には1の値を登録し、その他の各ノードには選択されたノードまでのホップ数で減衰させた値を登録する。例えば、選択されたノードから直接リンクが張られているときに、1ホップで到達するノードでは0.5、2ホップで到達するノードでは0.25などの値が登録される。
The
図18は、図3のトポロジデータの構成例を示す図である。
図18において、トポロジデータT100は、例えば、JSON(JavaScript(登録商標) Object Notation)形式で記述される。トポロジデータT100は、少なくともノードデータT1010と、リンクデータT1020を含む。
18 is a diagram showing a configuration example of the topology data in FIG. 3. FIG.
In FIG. 18, the topology data T100 is described in JSON (Javascript (registered trademark) Object Notation) format, for example. Topology data T100 includes at least node data T1010 and link data T1020.
ノードデータT1010は、図11のノードデータ管理テーブルT270に含まれるデータと同等であり、例えば、ノード名や、状態のRAGを含む。また、リンクデータT1020は、図12のリンクデータ管理テーブルT280に含まれるデータと同等である。 The node data T1010 is equivalent to the data included in the node data management table T270 of FIG. 11, and includes, for example, the node name and state RAG. Also, the link data T1020 is equivalent to the data included in the link data management table T280 of FIG.
図19は、トポロジマップの描画処理の概略を示すシーケンス図である。
図19において、S1000からS1040は、図1の初期画面130AがGUI110で表示されるまでの処理の流れを示し、S1050からS1070は、図1の変更画面130BがGUI110で表示されるまでの処理の流れを示す。
FIG. 19 is a sequence diagram showing an outline of the drawing process of the topology map.
19, S1000 to S1040 show the flow of processing until the
ユーザ500がトポロジマップの初期表示をGUI110に指示すると(S1000)、GUI110は、図3の表示処理部120に対してトポロジマップの初期表示要求を行う(S1010)。表示処理部120は、初期表示要求に応じてトポロジ構成管理サーバ200に対してトポロジデータを要求する(S1020)。トポロジ構成管理サーバ200は、トポロジデータの取得要求を受けると、トポロジデータ生成処理201を実行し、トポロジデータを生成する。そして、トポロジ構成管理サーバ200は、生成したトポロジデータを表示処理部120に送信する(S1030)。
When the
表示処理部120は、受信したトポロジデータについて、ノード座標計算処理122を実行し、GUI110の描画処理を行う(S1040)。
The
次に、ユーザ500がノード選択操作を行うと(S1050)、GUI110は、操作が行われた対象ノードを特定し、表示処理部120に対して操作イベントの発生を通知する(S1060)。
Next, when the
表示処理部120は、操作イベント発生が通知されると、イベント分析処理121を実行し、各ノードの注目度を更新する。次に、表示処理部120は、ノード座標計算処理122を実行し、更新された注目度に基づいてインフラリソースの重要度を再計算し、再計算したインフラリソースの重要度に基づいて、ノードの座標を再計算する。
When notified of the occurrence of an operation event, the
次に、表示処理部120は、再計算したノードの座標をGUI110に通知し、GUI110は、再計算されたノードの座標を基にトポロジマップを更新する(S1070)。
Next, the
図20は、図3のトポロジ生成処理を示すフローチャートである。
図20において、トポロジ生成処理201は、図3の各構成管理テーブルT200~T250を参照し、ITシステム300についての各種の構成情報を収集する(S2000)。トポロジ生成処理201は、任意のタイミング、例えば、決められた時刻で、これらの構成情報をITシステム300から取得すればよい。また、トポロジ生成処理201は、ITシステム300または他の管理ソフトウェア等を参照し、各リソースの状態情報を収集する。
FIG. 20 is a flow chart showing the topology generation processing of FIG.
In FIG. 20, the
次に、トポロジ生成処理201は、これらの構成情報と状態情報を基に、ITシステム300に用いられるインフラリソースおよびアプリケーションに関するノード情報を生成し、ノードデータ管理テーブルT270を更新する(S2010)。
Next, the
次に、トポロジ生成処理201は、これらの構成情報を基に、ノード間を結線するリンク情報を生成し、リンクデータ管理テーブルT280を更新する(S2020)。トポロジ生成処理201は、S2010で更新したノードデータ管理テーブルT270と、S2020で更新したリンクデータ管理テーブルT280の値に基づいて、トポロジデータT100を生成し、処理を終了する。
Next, the
図21は、図3のノード座標計算処理を示すフローチャートである。
図21において、ノード座標計算処理122は、トポロジデータT100を参照し、インフラノードの座標を計算する(T3000)。図2に示したように、本実施形態では、地理クラスタの単位でインフラノードがまとめられ、各インフラノードは、矩形で描画される地理クラスタの内部に表示される。なお、本実施形態では、地理クラスタが表示される画面上の順番は、例えば、アルファベット順である。
FIG. 21 is a flow chart showing node coordinate calculation processing in FIG.
In FIG. 21, the node coordinate
インフラノードの座標の計算では、ノード座標計算処理122は、グラフ描画アルゴリズムを用いることができる。グラフ描画アルゴリズムは、例えば、杉山フレームワークである。このとき、ノード座標計算処理122は、地理クラスの表示領域が重複しないよう、異なる地理クラスタに属するインフラノードが入り混じらないように地理クラスタを配置する。そのため、ノード座標計算処理122は、地理クラスタ毎にインフラノードの座標を計算し、個々に計算した地理クラスタ単位でのトポロジを組み合わせて全体のトポロジマップを生成する。
In calculating the coordinates of the infra nodes, the node coordinate
次に、ノード座標計算処理122は、各インフラノードが含まれる矩形として、地理クラスタの座標と大きさを計算する(S3010)。
Next, the node coordinate
次に、ノード座標計算処理122は、アプリケーションノードの配置を計算するために、各インフラリソースとアプリケーションの重要度を推定する。すなわち、表示処理部120は、アプリケーション毎に、各アプリケーションが関連するインフラリソースの重要度を計算する(S3020)。
Next, node coordinate
インフラリソースの重要度は、例えば、リソースの状態、コストおよび注目度から求める。リソースの状態を定量的に評価するためのメトリックは、Feature Selector150で指定されている値毎に異なる。例えば、”Performance”は、性能の状態を示すストレージアクセスの応答時間の日平均値である。コストは、例えば、当該リソースが消費しているコストの日平均などである。注目度は、注目度管理テーブルT150に格納された値である。
The importance of infrastructure resources is obtained from, for example, resource states, costs, and attention. A metric for quantitatively evaluating the resource state differs for each value specified in the
インフラリソースの重要度の計算には、例えば、偏差値を用いる。このとき、リソースの状態とコストのそれぞれのメトリックについて偏差値を計算し、それらの合計と注目度の積を、そのインフラリソースが割り当てられたノードの重要度とする。ノード座標計算処理122は、インフラノードの重要度の計算結果をインフラ重要度管理テーブルT130に格納する。
A deviation value, for example, is used to calculate the importance of infrastructure resources. At this time, a deviation value is calculated for each metric of the resource state and cost, and the product of the sum of them and the degree of attention is taken as the degree of importance of the node to which the infrastructure resource is allocated. The node coordinate
次に、ノード座標計算処理122は、各アプリケーションの重要度を求める(S3030)。アプリケーションの重要度は、各地理クラスタ毎にアプリケーションが関連するインフラリソースの総コストを計算し、これをメトリックとして用いる。アプリケーションの重要度の計算には、例えば、T3020の処理と同様に偏差値を用いることができる。ノード座標計算処理122は、アプリケーションの重要度の計算結果をアプリ重要度管理テーブルT140に格納する。
Next, the node coordinate
次に、ノード座標計算処理122は、S3020とS3030で求めた計算結果を用いて、アプリケーションノードの座標を計算する(S3040)。トポロジデータT100に基づくアプリケーションノードの座標の計算では、例えば、杉山フレームワークなどのグラフ描画アルゴリズムを用いることができる。
Next, the node coordinate
また、ノード座標計算処理122は、各ノードおよびリンクの重要度を変更することで、アプリケーションノードの座標を変更する。例えば、ノード座標計算処理122は、各アプリケーションノードが、より重要なインフラノードに近づいて配置されるよう、アプリケーションノードとインフラノード間のリンクの長さに、S3020で求めたインフラリソースの重要度の逆数を掛け、全体がバランスするアプリケーションノードの座標を計算する。また、例えば、ノード座標計算処理122は、最も近い地理クラスタのアプリケーションの重要度に基づいてアプリケーションノードの座標を計算する。このとき、ノード座標計算処理122は、アプリケーションノードのY座標はアプリケーションレイヤとして固定し、アプリケーションノードのX座標を変化させることができる。
Also, the node coordinate
また、ノード座標計算処理122は、アプリケーションノード同士が過度に密集せず、より重要なアプリケーションノードがインフラノードノードの近くに配置されるよう、S3030で求めたアプリケーションの重要度の大きさでアプリケーションを順位付けし、一定距離以上の間隔を開けてインフラノードの近くから順位の高い順にアプリケーションノードを配置する。これにより、ノード座標計算処理122は、状態が悪いまたはコストが高いインフラリソースほど、アプリケーションノードの近くに配置されるトポロジマップを生成することができる。
In addition, the node coordinate
図22は、図3のイベント分析処理を示すフローチャートである。
図22において、イベント分析処理121は、ユーザが選択したノードを特定すると(S4000)、そのノードにリンクが接続されているノード群を特定する(S4010)。
FIG. 22 is a flow chart showing event analysis processing of FIG.
In FIG. 22, when the
次に、イベント分析処理121は、ユーザが最初に選択したノードの注目度を1とし、そのノードから関連ノードまでの辿る際のリンクのホップ数に基づいて、1から値を半減させつつ、注目度として設定する(S4020)。例えば、1ホップで辿れる関連ノードの注目度は0.5、2ホップで辿れる関連ノードの注目度は0.25とする。
Next, the
イベント分析処理121は、S4010およびS4020の処理を各ノードに対し、関連ノードが辿れなくなるまで繰り返す(S4030)。イベント分析処理121は、以上の処理で求めた注目度に基づいて注目度管理テーブル150を更新する。
The
以下の第2実施形態では、図3のノード座標計算処理122が、コストに関する情報、すなわちカタログ管理テーブルT260に保持する情報を取得できない場合について説明する。このとき、ノード座標計算処理122は、コストの情報を用いず、各インフラリソースの構成情報と、稼働率などの状態情報を用いてインフラ重要度と、アプリ重要度を計算する。
In the following second embodiment, a case will be described where the node coordinate
第2実施形態に係る計算機システムの構成は、第1実施形態と同様のため図示は省略する。第2実施形態に係る計算機システムでは、ノードデータ管理テーブルT270には、VMの割り当てメモリ量、割り当てCPU数、割り当てディスク量およびデバイス種類などの情報もさらに設定する。また、第1実施形態では、ノード座標計算処理122は、図21のS3020およびS3030の処理において、コストを基に重要度を計算したが、第2実施形態では、インフラリソースの規模を示すリソース量を基に重要度を計算する。例えば、VMの場合は、リソース量は、メモリ量、CPU数およびディスク容量である。アプリケーションの重要度は、そのアプリケーションの関連する少なくとも一部のインフラリソースの割り当て量に基づいて計算する。
The configuration of the computer system according to the second embodiment is the same as that of the first embodiment, so illustration is omitted. In the computer system according to the second embodiment, the node data management table T270 is further set with information such as the allocated memory amount of the VM, the number of allocated CPUs, the allocated disk amount, and the device type. In addition, in the first embodiment, the node coordinate
以下、VMの場合を例に計算方法を示す。具体的には、ノード座標計算処理122は、S3020の処理において、コストの偏差値の代わりに、各リソース毎に割り当て量の偏差値を計算し、それぞれリソースの偏差値の平均をとる。また、ノード座標計算処理122は、S3030の処理においても、コストの偏差値の代わりに、各割り当てリソースの偏差値の平均値とする。
The calculation method will be described below using the case of VM as an example. Specifically, in the processing of S3020, the node coordinate
これにより、ノード座標計算処理122は、割り当てリソース量をコストに変換せずに、インフラリソースの重要度とアプリケーションの重要度を推定することができる。
As a result, the node coordinate
以下の第3実施形態では、図3のノード座標計算処理122が、コストに関する情報、すなわちカタログ管理テーブルT260に保持する情報および状態に関する情報を取得できない場合について説明する。このとき、ノード座標計算処理122は、各インフラリソースの構成情報を用いてインフラ重要度と、アプリ重要度を計算する。
In the following third embodiment, a case where the node coordinate
図23は、第3実施形態に係る表示情報処理装置で用いられる構成情報例を示す図である。
図23において、第3実施形態に係る計算機システムの構成では、図3の表示処理部120は、図3の構成に加え、アプリケーション割り当て数管理テーブルT160をさらに備える。
FIG. 23 is a diagram showing an example of configuration information used in the display information processing apparatus according to the third embodiment.
23, in the configuration of the computer system according to the third embodiment, the
アプリケーション割り当て数管理テーブルT160は、国、データセンタおよびサーバクラスタ毎に、その地理クラスタに含まれるインフラリソースを利用しているアプリケーションの数を保持する。アプリケーション割り当て数管理テーブルT160が保持する情報は、各地理クラスタへのアプリケーションの偏り具合を示している。アプリケーションが複数の地域のリソースを用いる理由が、応答性能の向上や負荷分散である場合、アプリケーションがより多く偏って配置されている地域は、ビジネス上で重要性が高い地域の可能性が高いと考えられる。 The application allocation number management table T160 holds, for each country, data center, and server cluster, the number of applications using infrastructure resources included in the geographic cluster. The information held by the application allocation number management table T160 indicates the degree of bias of applications to each geographic cluster. If the reason why an application uses resources in multiple regions is to improve responsiveness or load balance, it is highly likely that the regions where more applications are distributed unevenly are regions with high business importance. Conceivable.
第3実施形態では、ノード座標計算処理122は、アプリケーション割り当て数管理テーブルT160を参照し、インフラリソースを利用しているアプリケーションの数に基づいて、インフラ重要度を計算する。具体的には、図21のS3020の処理において、ノード座標計算処理122は、計算対象のインフラリソースの所属する国、データセンタの地理クラスタ、およびアプリケーションからインフラリソースにまで辿る際に経由するサーバクラスタについて、アプリケーション割り当て数管理テーブルT160からアプリケーション数を抽出し、合計する。ノード座標計算処理122は、各インフラリソースについて、この合計値を計算し、この合計値の偏差値を求め、この偏差値をインフラ重要度として使用する。
In the third embodiment, the node coordinate
図24は、図3の表示情報処理装置のハードウェア構成例を示すブロック図である。
図24において、表示情報処理装置10は、図1のクライアント100として用いることができる。表示情報処理装置10は、プロセッサ11、通信制御デバイス12、通信インタフェース13、主記憶デバイス14、補助記憶デバイス15および入出力インタフェース17を備える。プロセッサ11、通信制御デバイス12、通信インタフェース13、主記憶デバイス14、補助記憶デバイス15および入出力インタフェース17は、内部バス16を介して相互に接続されている。主記憶デバイス14および補助記憶デバイス15は、プロセッサ11からアクセス可能である。
FIG. 24 is a block diagram showing a hardware configuration example of the display information processing apparatus of FIG.
In FIG. 24, the display
また、表示情報処理装置10には、入力装置20および出力装置21が設けられている。入力装置20および出力装置21は、入出力インタフェース17を介して内部バス16に接続されている。入力装置20は、例えば、キーボード、マウス、タッチパネル、カードリーダ、音声入力装置等である。出力装置21は、例えば、画面表示装置(液晶モニタ、有機EL(Electro Luminescence)ディスプレイ、グラフィックカード等)、音声出力装置(スピーカ等)、印字装置等である。
The display
プロセッサ11は、表示情報処理装置10全体の動作制御を司るハードウェアである。プロセッサ11は、CPU(Central Processing Unit)であってもよいし、GPU(Graphics Processing Unit)であってもよい。プロセッサ11は、シングルコアロセッサであってもよいし、マルチコアロセッサであってもよい。プロセッサ11は、処理の一部または全部を行うハードウェア回路(例えば、FPGA(Field-Programmable Gate Array)またはASIC(Application Specific Integrated Circuit))を備えていてもよい。プロセッサ11は、ニューラルネットワークを備えていてもよい。
The
主記憶デバイス14は、例えば、SRAMまたはDRAMなどの半導体メモリから構成することができる。主記憶デバイス14には、プロセッサ11が実行中のプログラムを格納したり、プロセッサ11がプログラムを実行するためのワークエリアを設けたりすることができる。
The
補助記憶デバイス15は、大容量の記憶容量を備える記憶デバイスであり、例えば、ハードディスク装置またはSSD(Solid State Drive)である。補助記憶デバイス15は、各種プログラムの実行ファイルやプログラムの実行に用いられるデータを保持することができる。補助記憶デバイス15には、表示情報処理プログラム15Aおよび管理情報15Bを格納することができる。表示情報処理プログラム15Aは、表示情報処理装置10にインストール可能なソフトウェアであってもよいし、表示情報処理装置10にファームウェアとして組み込まれていてもよい。管理情報15Bは、表示情報処理プログラム15Aの処理で用いられるデータであり、図3のクライアント100が保持する各種テーブルである。
The
通信制御デバイス12は、外部との通信を制御する機能を備えるハードウェアである。通信制御デバイス12は、通信インタフェース13を介してネットワーク19に接続される。ネットワーク19は、インターネットなどのWAN(Wide Area Network)であってもよいし、WiFiまたはイーサネット(登録商標)などのLAN(Local Area Network)であってもよいし、WANとLANが混在していてもよい。
The
入出力インタフェース17は、入力装置20から入力されるデータをプロセッサ11が処理可能なデータ形式に変換したり、プロセッサ11から出力されるデータを出力装置21が処理可能なデータ形式に変換したりする。
The input/
プロセッサ11が表示情報処理プログラム15Aを主記憶デバイス14に読み出し、表示情報処理プログラム15Aを実行することにより、トポロジを構成するノードが割り当てられるエンティティ間の関連性に関する指標を設定し、その指標に基づいて、それらのノード間の距離を求め、それらのノード間の距離に基づいて、ノードの表示位置を設定することができる。
The
なお、表示情報処理プログラム15Aの実行は、複数のプロセッサやコンピュータに分担させてもよい。あるいは、プロセッサ11は、ネットワーク19を介してクラウドコンピュータなどに表示情報処理プログラム15Aの全部または一部の実行を指示し、その実行結果を受け取るようにしてもよい。
Execution of the display
なお、上述した第1、第2および第3実施形態は、組み合わせて用いてもよい。例えば、第1実施形態と第3実施形態を同時に適用し、コストおよび状態情報のインフラ側の情報と、アプリケーション割り当ての偏りのビジネス側の情報を用いることで、より多角的な分析が可能となる。 Note that the first, second and third embodiments described above may be used in combination. For example, applying the first embodiment and the third embodiment at the same time and using information on the infrastructure side of cost and status information and information on the business side of biased application allocation enables more diversified analysis. .
また、上述した実施形態では、インフラリソースの重要度を計算するために、インフラリソースの構成、インフラリソースの状態、インフラリソースのコスト、インフラリソースの割り当て量、インフラリソースへの注目度およびインフラリソースへのアプリケーションの割り当て数のいずれか少なくとも1つを用いる方法について説明したが、インフラリソースへのアクセス回数などのその他の情報を用いるようにしてもよい。また、アプリケーションの重要度を計算するために、アプリケーションの起動回数などのその他の情報を用いるようにしてもよい。 In addition, in the above-described embodiment, in order to calculate the importance of infrastructure resources, the configuration of infrastructure resources, the state of infrastructure resources, the cost of infrastructure resources, the allocation amount of infrastructure resources, the degree of attention to infrastructure resources, and the importance of infrastructure resources. Although the method of using at least one of the allocated number of applications has been described, other information such as the number of accesses to infrastructure resources may be used. Other information such as the number of times the application has been started may also be used to calculate the importance of the application.
なお、本発明は上記した実施形態に限定されるものではなく、様々な変形例が含まれる。例えば、上記した実施形態は本発明を分かりやすく説明するために詳細に説明したものであり、必ずしも説明した全ての構成を備えるものに限定されるものではない。また、ある実施形態の構成の一部を他の実施形態の構成に置き換えることが可能であり、また、ある実施形態の構成に他の実施形態の構成を加えることも可能である。また、各実施形態の構成の一部について、他の構成の追加・削除・置換をすることが可能である。また、上記の各構成、機能、処理部、処理手段等は、それらの一部又は全部を、例えば集積回路で設計する等によりハードウェアで実現してもよい。 In addition, the present invention is not limited to the above-described embodiments, and includes various modifications. For example, the above-described embodiments have been described in detail in order to explain the present invention in an easy-to-understand manner, and are not necessarily limited to those having all the configurations described. Also, part of the configuration of one embodiment can be replaced with the configuration of another embodiment, and the configuration of another embodiment can be added to the configuration of one embodiment. Moreover, it is possible to add, delete, or replace a part of the configuration of each embodiment with another configuration. Further, each of the above configurations, functions, processing units, processing means, and the like may be realized by hardware, for example, by designing them in an integrated circuit.
100 クライアント、200 トポロジ構成管理サーバ、300 ITシステム、400 ネットワーク 100 client, 200 topology configuration management server, 300 IT system, 400 network
Claims (14)
前記指標に基づいて前記ノード間の距離を求め、
前記ノード間の距離に基づいて、前記ノードの表示位置を設定し、
前記エンティティは、ITシステムに用いられるインフラリソースおよびアプリケーションである、表示情報処理装置。 set an index of the relationship between the entities to which the nodes that make up the topology are assigned;
determining the distance between the nodes based on the index;
setting the display position of the node based on the distance between the nodes ;
A display information processor , wherein the entities are infrastructure resources and applications used in an IT system .
異なる階層のノードの表示位置を互いに異なる線上に設定する請求項2に記載の表示情報処理装置。 Set the display positions of nodes in the same layer on the same line,
3. The display information processing apparatus according to claim 2, wherein display positions of nodes in different hierarchies are set on different lines.
前記インフラリソースの重要度は、前記インフラリソースの構成、前記インフラリソースの状態、前記インフラリソースのコスト、前記インフラリソースの割り当て量、前記インフラリソースへの注目度および前記インフラリソースへのアプリケーションの割り当て数のいずれか少なくとも1つに基づいて計算され、
前記アプリケーションの重要度は、前記アプリケーションのコスト、前記アプリケーションの関連するインフラリソースの割り当て量のいずれか少なくとも1つに基づいて計算される請求項1に記載の表示情報処理装置。 the indicator is selected from at least one of the importance of the infrastructure resource and the importance of the application;
The degree of importance of the infrastructure resource includes the configuration of the infrastructure resource, the state of the infrastructure resource, the cost of the infrastructure resource, the allocation amount of the infrastructure resource, the degree of attention to the infrastructure resource, and the number of applications allocated to the infrastructure resource. calculated based on at least one of
2. The display information processing apparatus according to claim 1 , wherein the degree of importance of said application is calculated based on at least one of a cost of said application and an allocation amount of infrastructure resources related to said application.
前記アプリケーションの重要度を前記地理クラスタの単位で計算し、
最も近い地理クラスタのアプリケーションの重要度に基づいて前記アプリケーションのノードの表示位置を設定する請求項4に記載の表示情報処理装置。 grouping and displaying the nodes of the infrastructure resource in units of geographic clusters;
calculating the importance of the application in units of the geographic cluster;
5. The display information processing apparatus according to claim 4 , wherein the display position of the node of said application is set based on the degree of importance of the application in the closest geographical cluster.
前記指標に基づいて前記ノード間の距離を求め、
前記ノード間の距離に基づいて、前記ノードの表示位置を設定し、
前記エンティティは、ITシステムに用いられるインフラリソースおよびアプリケーションである、表示情報処理方法。 set an index of the relationship between the entities to which the nodes that make up the topology are assigned;
determining the distance between the nodes based on the index;
setting the display position of the node based on the distance between the nodes ;
A display information processing method , wherein the entities are infrastructure resources and applications used in an IT system .
前記指標に基づいて前記ノード間の距離を求める処理と、
前記ノード間の距離に基づいて、前記ノードの表示位置を設定する処理とをコンピュー
タに実行させ、
前記エンティティは、ITシステムに用いられるインフラリソースおよびアプリケーションである、表示情報処理プログラム。 a process of setting an index related to relationships between entities to which nodes constituting a topology are assigned;
a process of determining the distance between the nodes based on the index;
causing a computer to execute a process of setting the display position of the node based on the distance between the nodes ;
A display information processing program , wherein the entities are infrastructure resources and applications used in an IT system .
Priority Applications (3)
| Application Number | Priority Date | Filing Date | Title |
|---|---|---|---|
| JP2019183410A JP7311384B2 (en) | 2019-10-04 | 2019-10-04 | Display information processing device, display information processing method, and display information processing program |
| US17/016,620 US11050614B2 (en) | 2019-10-04 | 2020-09-10 | Display information processing apparatus, display information processing method and computer readable recording medium |
| US17/328,514 US11388048B2 (en) | 2019-10-04 | 2021-05-24 | Display information processing apparatus, display information processing method and computer readable recording medium |
Applications Claiming Priority (1)
| Application Number | Priority Date | Filing Date | Title |
|---|---|---|---|
| JP2019183410A JP7311384B2 (en) | 2019-10-04 | 2019-10-04 | Display information processing device, display information processing method, and display information processing program |
Publications (2)
| Publication Number | Publication Date |
|---|---|
| JP2021061490A JP2021061490A (en) | 2021-04-15 |
| JP7311384B2 true JP7311384B2 (en) | 2023-07-19 |
Family
ID=75274317
Family Applications (1)
| Application Number | Title | Priority Date | Filing Date |
|---|---|---|---|
| JP2019183410A Active JP7311384B2 (en) | 2019-10-04 | 2019-10-04 | Display information processing device, display information processing method, and display information processing program |
Country Status (2)
| Country | Link |
|---|---|
| US (2) | US11050614B2 (en) |
| JP (1) | JP7311384B2 (en) |
Families Citing this family (3)
| Publication number | Priority date | Publication date | Assignee | Title |
|---|---|---|---|---|
| JP7311384B2 (en) * | 2019-10-04 | 2023-07-19 | 株式会社日立製作所 | Display information processing device, display information processing method, and display information processing program |
| US11121917B1 (en) | 2020-06-29 | 2021-09-14 | Verizon Patent And Licensing Inc. | Systems and methods for dynamically allocating resources based on configurable resource priority |
| US20230362234A1 (en) * | 2022-05-04 | 2023-11-09 | Microsoft Technology Licensing, Llc | Method and system of managing resources in a cloud computing environment |
Citations (8)
| Publication number | Priority date | Publication date | Assignee | Title |
|---|---|---|---|---|
| US20060117038A1 (en) | 2004-12-01 | 2006-06-01 | John Toebes | Arrangement for selecting a server to provide distributed services from among multiple servers based on a location of a client device |
| US20060171333A1 (en) | 2005-02-01 | 2006-08-03 | Fujitsu Limited | Network configuration management apparatus, network configuration management program and network configuration management method |
| CN101114936A (en) | 2007-09-06 | 2008-01-30 | 华为技术有限公司 | Topological diagram display process, system and device |
| JP2011517346A (en) | 2008-03-31 | 2011-06-02 | 株式会社日立製作所 | User interface providing information system topology display |
| JP2014219870A (en) | 2013-05-09 | 2014-11-20 | 西日本電信電話株式会社 | Preparation method and preparing program of topology figure |
| US20150052441A1 (en) | 2013-07-30 | 2015-02-19 | Draios Inc. | System, method, and graphical user interface for application topology mapping in hosted computing environments |
| US20150378542A1 (en) | 2013-07-22 | 2015-12-31 | Hitachi, Ltd. | Management system for computer system |
| WO2016103421A1 (en) | 2014-12-25 | 2016-06-30 | 株式会社日立システムズ | Cloud-configuration visualization system, cloud-configuration visualization method, and cloud-configuration visualization program |
Family Cites Families (21)
| Publication number | Priority date | Publication date | Assignee | Title |
|---|---|---|---|---|
| JP3636272B2 (en) * | 1998-02-09 | 2005-04-06 | 富士通株式会社 | Icon display method, apparatus thereof, and recording medium |
| US7246370B2 (en) * | 2000-01-07 | 2007-07-17 | Security, Inc. | PDstudio design system and method |
| US20030103068A1 (en) * | 2001-12-05 | 2003-06-05 | International Business Machines Corporation | Universal server farm mass custom design tool |
| JP2005340967A (en) * | 2004-05-24 | 2005-12-08 | Funai Electric Co Ltd | Topology map display apparatus and topology map analysis method |
| US20070097883A1 (en) * | 2005-08-19 | 2007-05-03 | Yigong Liu | Generation of a network topology hierarchy |
| US9003292B2 (en) * | 2006-07-06 | 2015-04-07 | LiveAction, Inc. | System and method for network topology and flow visualization |
| US8159971B2 (en) * | 2006-08-25 | 2012-04-17 | Opnet Technologies, Inc. | System and method for inferring connectivity among network segments in the absence of configuration information |
| US8639700B2 (en) * | 2011-07-19 | 2014-01-28 | Softlayer Technologies, Inc. | System and method for efficiently representing and managing a computer facility |
| US20130321458A1 (en) * | 2012-05-30 | 2013-12-05 | Northrop Grumman Systems Corporation | Contextual visualization via configurable ip-space maps |
| WO2014073060A1 (en) * | 2012-11-07 | 2014-05-15 | 株式会社日立製作所 | System and program for managing system to be managed |
| US20140201642A1 (en) * | 2013-01-12 | 2014-07-17 | Lyatiss, Inc. | User interface for visualizing resource performance and managing resources in cloud or distributed systems |
| US10032091B2 (en) * | 2013-06-05 | 2018-07-24 | Emotient, Inc. | Spatial organization of images based on emotion face clouds |
| WO2016157276A1 (en) * | 2015-03-27 | 2016-10-06 | 株式会社日立製作所 | Method for generating display names for managed objects |
| US10547511B2 (en) * | 2016-05-04 | 2020-01-28 | Alcatel Lucent | Infrastructure resource states |
| US10489424B2 (en) * | 2016-09-26 | 2019-11-26 | Amazon Technologies, Inc. | Different hierarchies of resource data objects for managing system resources |
| US10728108B2 (en) * | 2016-10-31 | 2020-07-28 | Nicira, Inc. | Network health checker |
| US10567440B2 (en) * | 2016-12-16 | 2020-02-18 | Nicira, Inc. | Providing application visibility for micro-segmentation of a network deployment |
| US9998339B1 (en) * | 2017-02-06 | 2018-06-12 | Comtrade Software Inc. | Application awareness for virtual infrastructure environments |
| US10547521B1 (en) * | 2017-03-29 | 2020-01-28 | Juniper Networks, Inc. | Network dashboard with multifaceted utilization visualizations |
| JP7311384B2 (en) * | 2019-10-04 | 2023-07-19 | 株式会社日立製作所 | Display information processing device, display information processing method, and display information processing program |
| US11379447B2 (en) * | 2020-02-06 | 2022-07-05 | Alibaba Group Holding Limited | Method and system for enhancing IOPS of a hard disk drive system based on storing metadata in host volatile memory and data in non-volatile memory using a shared controller |
-
2019
- 2019-10-04 JP JP2019183410A patent/JP7311384B2/en active Active
-
2020
- 2020-09-10 US US17/016,620 patent/US11050614B2/en active Active
-
2021
- 2021-05-24 US US17/328,514 patent/US11388048B2/en active Active
Patent Citations (10)
| Publication number | Priority date | Publication date | Assignee | Title |
|---|---|---|---|---|
| US20060117038A1 (en) | 2004-12-01 | 2006-06-01 | John Toebes | Arrangement for selecting a server to provide distributed services from among multiple servers based on a location of a client device |
| US20060171333A1 (en) | 2005-02-01 | 2006-08-03 | Fujitsu Limited | Network configuration management apparatus, network configuration management program and network configuration management method |
| JP2006215634A (en) | 2005-02-01 | 2006-08-17 | Fujitsu Ltd | Device, program and method for managing network configuration |
| CN101114936A (en) | 2007-09-06 | 2008-01-30 | 华为技术有限公司 | Topological diagram display process, system and device |
| JP2011517346A (en) | 2008-03-31 | 2011-06-02 | 株式会社日立製作所 | User interface providing information system topology display |
| JP2014219870A (en) | 2013-05-09 | 2014-11-20 | 西日本電信電話株式会社 | Preparation method and preparing program of topology figure |
| US20150378542A1 (en) | 2013-07-22 | 2015-12-31 | Hitachi, Ltd. | Management system for computer system |
| JP2016507791A (en) | 2013-07-22 | 2016-03-10 | 株式会社日立製作所 | Computer system management system |
| US20150052441A1 (en) | 2013-07-30 | 2015-02-19 | Draios Inc. | System, method, and graphical user interface for application topology mapping in hosted computing environments |
| WO2016103421A1 (en) | 2014-12-25 | 2016-06-30 | 株式会社日立システムズ | Cloud-configuration visualization system, cloud-configuration visualization method, and cloud-configuration visualization program |
Also Published As
| Publication number | Publication date |
|---|---|
| US11388048B2 (en) | 2022-07-12 |
| US11050614B2 (en) | 2021-06-29 |
| US20210288871A1 (en) | 2021-09-16 |
| JP2021061490A (en) | 2021-04-15 |
| US20210105181A1 (en) | 2021-04-08 |
Similar Documents
| Publication | Publication Date | Title |
|---|---|---|
| JP7311384B2 (en) | Display information processing device, display information processing method, and display information processing program | |
| JP7166982B2 (en) | TOPOLOGY MAP PRESENTATION SYSTEM, TOPOLOGY MAP PRESENTATION METHOD, AND COMPUTER PROGRAM | |
| JP5719974B2 (en) | Management system for managing a computer system having a plurality of devices to be monitored | |
| CN108694071A (en) | More cluster panels for distributed virtualization infrastructure elements monitoring and policy control | |
| US20100077449A1 (en) | Calculating multi-tenancy resource requirements and automated tenant dynamic placement in a multi-tenant shared environment | |
| CN103180823A (en) | Multidimensional modeling of software offerings | |
| CN103810036A (en) | Mobility operation resource allocation | |
| JP2015516604A (en) | Management system and management method | |
| US11379138B2 (en) | Method, device, and computer program product for managing access request in storage system | |
| US10977082B2 (en) | Resource allocation optimization support system and resource allocation optimization support method | |
| JP6293683B2 (en) | Computer system and coping method for performance failure of computer system | |
| US10552513B1 (en) | Computer system entity rendering system | |
| US11086682B2 (en) | Management system for managing computer system | |
| Fujiwara et al. | A visual analytics system for optimizing communications in massively parallel applications | |
| Li et al. | PageRankVM: A pagerank based algorithm with anti-collocation constraints for virtual machine placement in cloud datacenters | |
| US11102144B2 (en) | Support apparatus and method | |
| US20210103870A1 (en) | Cost presentation apparatus, cost presentation method, computer-readable storage medium | |
| JP5955405B2 (en) | System and program for managing managed system | |
| JP2021010151A (en) | Configuration display device, configuration display method, and configuration display program | |
| JP7310378B2 (en) | Information processing program, information processing method, and information processing apparatus | |
| US11301286B2 (en) | System and method for supporting optimization of usage efficiency of resources | |
| Li et al. | Gpugraphx: A gpu-aided distributed graph processing system | |
| JP6306972B2 (en) | Screen display device | |
| JP6675023B2 (en) | Management system for managing computer systems | |
| JP5993052B2 (en) | Management system for managing a computer system having a plurality of devices to be monitored |
Legal Events
| Date | Code | Title | Description |
|---|---|---|---|
| A621 | Written request for application examination |
Free format text: JAPANESE INTERMEDIATE CODE: A621 Effective date: 20220525 |
|
| A977 | Report on retrieval |
Free format text: JAPANESE INTERMEDIATE CODE: A971007 Effective date: 20230220 |
|
| A131 | Notification of reasons for refusal |
Free format text: JAPANESE INTERMEDIATE CODE: A131 Effective date: 20230328 |
|
| A521 | Request for written amendment filed |
Free format text: JAPANESE INTERMEDIATE CODE: A523 Effective date: 20230524 |
|
| TRDD | Decision of grant or rejection written | ||
| A01 | Written decision to grant a patent or to grant a registration (utility model) |
Free format text: JAPANESE INTERMEDIATE CODE: A01 Effective date: 20230620 |
|
| A61 | First payment of annual fees (during grant procedure) |
Free format text: JAPANESE INTERMEDIATE CODE: A61 Effective date: 20230706 |
|
| R150 | Certificate of patent or registration of utility model |
Ref document number: 7311384 Country of ref document: JP Free format text: JAPANESE INTERMEDIATE CODE: R150 |