JP7311142B2 - Biological tissue identification device and biological tissue identification program - Google Patents
Biological tissue identification device and biological tissue identification program Download PDFInfo
- Publication number
- JP7311142B2 JP7311142B2 JP2019153286A JP2019153286A JP7311142B2 JP 7311142 B2 JP7311142 B2 JP 7311142B2 JP 2019153286 A JP2019153286 A JP 2019153286A JP 2019153286 A JP2019153286 A JP 2019153286A JP 7311142 B2 JP7311142 B2 JP 7311142B2
- Authority
- JP
- Japan
- Prior art keywords
- light
- measurement
- image
- tissue
- sample
- Prior art date
- Legal status (The legal status is an assumption and is not a legal conclusion. Google has not performed a legal analysis and makes no representation as to the accuracy of the status listed.)
- Active
Links
- 238000005259 measurement Methods 0.000 claims description 157
- 238000004458 analytical method Methods 0.000 claims description 76
- 238000003384 imaging method Methods 0.000 claims description 56
- 230000003287 optical effect Effects 0.000 claims description 30
- 238000000034 method Methods 0.000 claims description 25
- 238000012545 processing Methods 0.000 claims description 15
- 238000004364 calculation method Methods 0.000 claims description 5
- 230000001678 irradiating effect Effects 0.000 claims description 5
- 210000001519 tissue Anatomy 0.000 description 148
- 206010028980 Neoplasm Diseases 0.000 description 33
- 201000011510 cancer Diseases 0.000 description 32
- 230000001575 pathological effect Effects 0.000 description 12
- 230000001427 coherent effect Effects 0.000 description 11
- 210000004072 lung Anatomy 0.000 description 11
- 210000000056 organ Anatomy 0.000 description 10
- 201000008968 osteosarcoma Diseases 0.000 description 10
- 238000003745 diagnosis Methods 0.000 description 7
- 230000005284 excitation Effects 0.000 description 7
- 238000010186 staining Methods 0.000 description 6
- 238000002835 absorbance Methods 0.000 description 5
- 210000004185 liver Anatomy 0.000 description 5
- 210000004698 lymphocyte Anatomy 0.000 description 5
- 238000000862 absorption spectrum Methods 0.000 description 4
- 239000013078 crystal Substances 0.000 description 4
- 238000003708 edge detection Methods 0.000 description 4
- 230000003902 lesion Effects 0.000 description 4
- 230000010355 oscillation Effects 0.000 description 4
- 230000015572 biosynthetic process Effects 0.000 description 3
- 238000004422 calculation algorithm Methods 0.000 description 3
- 230000031700 light absorption Effects 0.000 description 3
- 238000003330 mid-infrared imaging Methods 0.000 description 3
- 210000003205 muscle Anatomy 0.000 description 3
- 238000012935 Averaging Methods 0.000 description 2
- 238000007621 cluster analysis Methods 0.000 description 2
- 238000010586 diagram Methods 0.000 description 2
- 239000000126 substance Substances 0.000 description 2
- 241001270131 Agaricus moelleri Species 0.000 description 1
- 208000037259 Amyloid Plaque Diseases 0.000 description 1
- 208000004930 Fatty Liver Diseases 0.000 description 1
- 240000006829 Ficus sundaica Species 0.000 description 1
- 229910005543 GaSe Inorganic materials 0.000 description 1
- 206010019708 Hepatic steatosis Diseases 0.000 description 1
- 102000003960 Ligases Human genes 0.000 description 1
- 108090000364 Ligases Proteins 0.000 description 1
- 241000699666 Mus <mouse, genus> Species 0.000 description 1
- 241000699670 Mus sp. Species 0.000 description 1
- 241000700159 Rattus Species 0.000 description 1
- 239000006096 absorbing agent Substances 0.000 description 1
- 238000013473 artificial intelligence Methods 0.000 description 1
- 208000019425 cirrhosis of liver Diseases 0.000 description 1
- 238000005516 engineering process Methods 0.000 description 1
- 238000011156 evaluation Methods 0.000 description 1
- 208000010706 fatty liver disease Diseases 0.000 description 1
- 238000001914 filtration Methods 0.000 description 1
- 238000009499 grossing Methods 0.000 description 1
- 238000012333 histopathological diagnosis Methods 0.000 description 1
- 238000010191 image analysis Methods 0.000 description 1
- 238000007689 inspection Methods 0.000 description 1
- 230000010354 integration Effects 0.000 description 1
- 210000005229 liver cell Anatomy 0.000 description 1
- 238000013507 mapping Methods 0.000 description 1
- 239000000463 material Substances 0.000 description 1
- 238000000491 multivariate analysis Methods 0.000 description 1
- 208000010125 myocardial infarction Diseases 0.000 description 1
- 238000010223 real-time analysis Methods 0.000 description 1
- 210000005084 renal tissue Anatomy 0.000 description 1
- 238000009738 saturating Methods 0.000 description 1
- 239000004065 semiconductor Substances 0.000 description 1
- 230000035945 sensitivity Effects 0.000 description 1
- 238000004904 shortening Methods 0.000 description 1
- 238000001228 spectrum Methods 0.000 description 1
- 231100000240 steatosis hepatitis Toxicity 0.000 description 1
- 238000003786 synthesis reaction Methods 0.000 description 1
- 238000012360 testing method Methods 0.000 description 1
Images
Classifications
-
- G—PHYSICS
- G01—MEASURING; TESTING
- G01N—INVESTIGATING OR ANALYSING MATERIALS BY DETERMINING THEIR CHEMICAL OR PHYSICAL PROPERTIES
- G01N21/00—Investigating or analysing materials by the use of optical means, i.e. using sub-millimetre waves, infrared, visible or ultraviolet light
- G01N21/17—Systems in which incident light is modified in accordance with the properties of the material investigated
- G01N21/25—Colour; Spectral properties, i.e. comparison of effect of material on the light at two or more different wavelengths or wavelength bands
- G01N21/31—Investigating relative effect of material at wavelengths characteristic of specific elements or molecules, e.g. atomic absorption spectrometry
- G01N21/35—Investigating relative effect of material at wavelengths characteristic of specific elements or molecules, e.g. atomic absorption spectrometry using infrared light
- G01N21/3563—Investigating relative effect of material at wavelengths characteristic of specific elements or molecules, e.g. atomic absorption spectrometry using infrared light for analysing solids; Preparation of samples therefor
-
- G—PHYSICS
- G01—MEASURING; TESTING
- G01N—INVESTIGATING OR ANALYSING MATERIALS BY DETERMINING THEIR CHEMICAL OR PHYSICAL PROPERTIES
- G01N33/00—Investigating or analysing materials by specific methods not covered by groups G01N1/00 - G01N31/00
- G01N33/48—Biological material, e.g. blood, urine; Haemocytometers
- G01N33/483—Physical analysis of biological material
- G01N33/4833—Physical analysis of biological material of solid biological material, e.g. tissue samples, cell cultures
-
- G—PHYSICS
- G06—COMPUTING; CALCULATING OR COUNTING
- G06T—IMAGE DATA PROCESSING OR GENERATION, IN GENERAL
- G06T7/00—Image analysis
- G06T7/0002—Inspection of images, e.g. flaw detection
- G06T7/0012—Biomedical image inspection
-
- G—PHYSICS
- G01—MEASURING; TESTING
- G01N—INVESTIGATING OR ANALYSING MATERIALS BY DETERMINING THEIR CHEMICAL OR PHYSICAL PROPERTIES
- G01N2201/00—Features of devices classified in G01N21/00
- G01N2201/06—Illumination; Optics
- G01N2201/061—Sources
- G01N2201/06113—Coherent sources; lasers
-
- G—PHYSICS
- G06—COMPUTING; CALCULATING OR COUNTING
- G06T—IMAGE DATA PROCESSING OR GENERATION, IN GENERAL
- G06T2207/00—Indexing scheme for image analysis or image enhancement
- G06T2207/30—Subject of image; Context of image processing
- G06T2207/30004—Biomedical image processing
- G06T2207/30024—Cell structures in vitro; Tissue sections in vitro
Description
本発明は、中赤外光を用いた生体組織の識別方法に用いられる生体組織識別装置に関する。さらに本発明は生体組織識別装置に処理を実行させるためのプログラムに関する。 TECHNICAL FIELD The present invention relates to a biological tissue identification device used in a biological tissue identification method using mid-infrared light. Furthermore, the present invention relates to a program for causing a biological tissue identification device to execute processing.
生体組織の種類または状態の識別、例えば、がん等の有無の識別には、生体(被験者)から採取した組織を色素で染色し、病理医が光学顕微鏡観察により診断を行う組織病理学的手法が用いられている。この方法は、診断のために時間および労力を要することや、診断結果が、病理医の判断力に大きく依存するとの点において課題がある。 A histopathological technique in which tissue taken from a living body (subject) is dyed with a dye to identify the type or state of living tissue, for example, the presence or absence of cancer, and a pathologist makes a diagnosis by observing it with an optical microscope. is used. This method has problems in that it requires time and labor for diagnosis and that the diagnosis result largely depends on the judgment of the pathologist.
組織病理学的手法よりも短時間で生体組織を識別可能な方法として、中赤外光を用いたイメージング技術が注目されている。中赤外光の振動周波数は物質の固有振動周波数と一致し、中赤外光は物質の分子振動との共鳴により吸収される特徴があるため、中赤外領域の吸収スペクトルに基づいて、検査対象が正常組織であるか、がん等を含むものであるかを識別可能である。中赤外光を用いたイメージングでは、撮影領域内の複数の微小領域で吸収スペクトルを測定し、各微小領域(ピクセル)におけるスペクトルのセット(ハイパースペクトル)を所定のアルゴリズムで解析することにより、検査者の主観に依存しない客観的な識別結果が得られる。 Imaging technology using mid-infrared light is attracting attention as a method that can identify living tissue in a shorter time than histopathological techniques. The vibrational frequency of the mid-infrared light matches the natural vibrational frequency of the substance, and the mid-infrared light has the characteristic of being absorbed by resonance with the molecular vibration of the substance. It is possible to identify whether the target is normal tissue or includes cancer or the like. In imaging using mid-infrared light, the absorption spectrum is measured in multiple minute areas within the imaging area, and the set of spectra (hyperspectrum) in each minute area (pixel) is analyzed by a predetermined algorithm to perform inspection. It is possible to obtain an objective identification result that does not depend on the subjectivity of the person.
特許文献1には、中赤外域に感度を有する2次元アレイ型のセンサーカメラを使用して、生体組織の広い範囲を一度に撮像できる技術を開示している。非特許文献1では、中赤外光の照射光源に光強度の高い量子カスケードレーザー(QCL)を用いることにより、短時間での測定を実現している。
中赤外光を利用した従来のイメージング手法では、生体組織のハイパースペクトル画像に対して、クラスター分析等の多変量解析を行い、カラーマップとして表示される組織イメージから、生体組織の識別を行っている。この手法は、組織病理学的な診断に比べると、短時間での識別が可能であるものの、データの処理量が多く、解析に時間を要するため、リアルタイムでの生体組織の識別への適用は困難である。 In conventional imaging methods using mid-infrared light, multivariate analysis such as cluster analysis is performed on hyperspectral images of living tissue, and the living tissue is identified from the tissue image displayed as a color map. there is Compared to histopathological diagnosis, this method enables identification in a short period of time. Have difficulty.
かかる現状に鑑み、本発明の一態様は、より短時間で生体組織の識別が可能な生体イメージング手法の提供を目的とする。 In view of the current situation, it is an object of one aspect of the present invention to provide a bioimaging technique that enables identification of biomedical tissue in a shorter period of time.
本発明の一形態は、生体組織の所定領域に測定光を照射し、生体組織を透過した測定光または生体組織で反射した測定光を撮像して、測定画像を取得し、測定画像の解析結果に基づいて生体組織を識別する方法に関する。測定光は中赤外光を含む光であり、コヒーレント光でもよく、インコヒーレント光でもよい。 One embodiment of the present invention is to irradiate a predetermined region of a living tissue with measurement light, capture an image of the measurement light transmitted through the living tissue or the measurement light reflected by the living tissue, acquire a measurement image, and obtain an analysis result of the measurement image. to a method of identifying biological tissue based on. The measurement light is light containing mid-infrared light, and may be coherent light or incoherent light.
生体組織を透過した測定光または生体組織で反射した測定光のうち、波長2μm~20μmの範囲の特定の波長λ1を有する光を撮像して、測定画像を取得する。測定光がコヒーレント光である場合は、波長λ1を有する光を測定光として生体組織に照射すればよい。測定光がインコヒーレント光である場合は、適宜の分光手段を用いて、測定光のうち波長λ1を有する光を撮像すればよい。 A measurement image is acquired by imaging light having a specific wavelength λ 1 in the wavelength range of 2 μm to 20 μm, out of the measurement light transmitted through the living tissue or the measurement light reflected by the living tissue. When the measurement light is coherent light, the living tissue may be irradiated with light having a wavelength λ 1 as the measurement light. When the measurement light is incoherent light, an appropriate spectroscopic means may be used to pick up an image of the light having the wavelength λ 1 among the measurement light.
測定画像の解析により、合焦測度を算出し、合焦測度に基づいて生体組織の識別を行う。合焦測度は、例えば、測定画像のエッジ解析により算出する。例えば、測定画像の微分フィルタ処理によりエッジ解析が行われる。 By analyzing the measured image, a focus measure is calculated, and the living tissue is identified based on the focus measure. The focus measure is calculated, for example, by edge analysis of the measurement image. For example, edge analysis is performed by differential filtering of the measurement image.
生体組織の識別は、例えば、生体組織にがん等が含まれているか否かの識別である。例えば、合焦測度と所定の閾値との大小関係に基づいて、生体組織が正常組織であるか否か(腫瘍が含まれているか否か)の識別が行われる。 Identification of living tissue is, for example, identification of whether or not the living tissue contains cancer or the like. For example, it is determined whether the living tissue is normal tissue (whether or not it contains a tumor) based on the magnitude relationship between the focusing measure and the predetermined threshold.
本発明の一態様は、上記の生体組織識別方法を実施するための生体組織識別装置である。生体組織識別装置は、生体組織の所定領域に、測定光を照射可能な光源と、生体組織を透過した測定光または生体組織で反射した測定光を撮像して、測定画像を取得する撮像素子とを備える。 One aspect of the present invention is a biological tissue identification device for carrying out the biological tissue identification method described above. A biological tissue identification device includes a light source capable of irradiating a predetermined area of a biological tissue with measurement light, and an imaging element that acquires a measurement image by capturing an image of the measurement light that has passed through the biological tissue or has been reflected by the biological tissue. Prepare.
生体組織識別装置は、さらに、測定画像を解析して合焦測度を算出する演算解析部を備えるコンピュータを備えていてもよい。コンピュータの記憶部には、前記撮像素子で取得した測定画像をエッジ解析して、測定画像の複数の領域における合焦測度を算出する処理を、演算解析部に実行させるためのプログラムが格納されていてもよい。コンピュータは、前記合焦測度をマッピングして解析画像を形成するイメージ形成部を備えていてもよい。 The biological tissue identification device may further include a computer including an arithmetic analysis unit that analyzes the measurement image and calculates the focus measure. The storage unit of the computer stores a program for causing the calculation analysis unit to perform edge analysis of the measurement image acquired by the image sensor and to calculate focus measures in a plurality of regions of the measurement image. may The computer may comprise an imager that maps the focus measures to form an analysis image.
光源から生体組織に照射する光(測定光)は、好ましくはコヒーレント光である。生体組織に測定光としてのコヒーレント光を照射する光源は、例えば、波長を掃引可能なレーザ光源であり、量子カスケードレーザや、光パラメトリック発振器を備えるレーザが好適である。 The light (measurement light) emitted from the light source to the living tissue is preferably coherent light. A light source that irradiates living tissue with coherent light as measurement light is, for example, a wavelength sweepable laser light source, and a quantum cascade laser or a laser with an optical parametric oscillator is suitable.
本発明の一態様では、測定画像を取得する前に、合焦調整が行われる。各光学要素の位置関係を変更しながら、波長λ1とは異なる波長λ0を有する光について合焦度合いの指標である合焦関数を算出し、合焦関数が最大または最小となる(合焦度合いが最も高くなる)ように、光学要素の位置関係を調整すればよい。一実施形態では、試料を固定した試料台の位置を変更し、それぞれの試料台の位置において、測定および合焦関数の算出を行う。 In one aspect of the present invention, focus adjustment is performed prior to acquiring the measurement image. While changing the positional relationship of each optical element, a focusing function, which is an index of the degree of focusing, is calculated for light having a wavelength λ 0 different from the wavelength λ 1 , and the focusing function is maximized or minimized (focus The positional relationship of the optical elements may be adjusted so that the degree is the highest). In one embodiment, the position of the stage on which the sample is fixed is changed, and the measurement and the calculation of the focus function are performed at each stage position.
本発明の一態様は、生体組織識別プログラムである。生体組織識別プログラムには、上記の各処理をコンピュータに実行させるための処理手順が記述されている。生体組織識別プログラムは、コンピュータが読み取り可能な可読記憶媒体として提供されてもよい。 One aspect of the present invention is a biological tissue identification program. The biological tissue identification program describes a processing procedure for causing a computer to execute each of the above processes. The biological tissue identification program may be provided as a computer-readable storage medium.
本発明の方法では、生体組織に中赤外測定光を照射して、特定波長の光を撮像した測定画像をエッジ解析し、得られた合焦測度に基づいて、がんの有無等の生体組織の識別が可能である。この方法は、データ処理を短時間で実施できるため、リアルタイム分析への適用も期待できる。 In the method of the present invention, a living tissue is irradiated with mid-infrared measurement light, a measurement image obtained by imaging light of a specific wavelength is subjected to edge analysis, and based on the obtained focusing measure, the presence or absence of cancer in the living body is determined. Tissue identification is possible. Since this method can perform data processing in a short time, it is expected to be applied to real-time analysis.
以下、本発明の実施の形態について、図面を参照しながら説明する。なお、本発明は、以下の具体的形態に限定されるものではない。 BEST MODE FOR CARRYING OUT THE INVENTION Hereinafter, embodiments of the present invention will be described with reference to the drawings. In addition, this invention is not limited to the following specific forms.
[生体組織識別装置の構成]
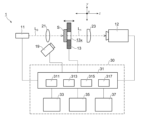
図1は、一実施形態の生体組織識識別装置の構成図である。生体組織識別装置1は、光源11からの測定光(中赤外光)L0を、試料台13に固定した試料Sに照射し、試料Sを透過した測定光L1を撮像素子12により撮像する。
[Configuration of biological tissue identification device]
FIG. 1 is a configuration diagram of a biological tissue identification device according to one embodiment. The biological
光源11、試料台13および撮像素子12は、コンピュータ30に接続されている。コンピュータ30は、光源11の出力調整、試料台13の位置調整、撮像素子12からの情報の取得および解析等を司る制御部31を備えている。撮像素子12により得られた測定画像をコンピュータ30により解析して、試料Sに含まれる生体組織の識別を行う。
The
コンピュータ30は、制御部31に加えて、表示部33、記憶部35および入力部37を備えている。表示部33は、各種の情報および測定結果を表示するディスプレイである。記憶部35は、各種のデータを記憶するハードディスクまたは半導体メモリで構成されている。入力部37は、ユーザの操作を受け付けるためのタッチパネル、キーボード、マウス等である。
The
図1に示す装置1では、試料Sを透過した測定光L1を撮像素子12により撮像するために、光源11と撮像素子12の間に試料台13が配置されている。試料を反射した測定光を撮像する場合は、試料台の光源側に撮像素子を配置すればよい。
In the
光源11から試料Sに照射される測定光L0は、中赤外光(波長2μm~20μm)を含む光である。測定光L0は、コヒーレント光でもよくインコヒーレント光でもよい。測定光がコヒーレント光である場合、測定光L0は中赤外領域の特定の波長を有する光である。測定光がインコヒーレント光である場合、測定光L0は中赤外領域以外の波長の光を含んでいてもよい。
The measurement light L0 irradiated from the
特定波長の光強度が高く、測定時間を短縮できることから、測定光L0はコヒーレント光であることが好ましい。測定光としてのコヒーレント光を試料に照射する光源11は、例えば、中赤外光を発振するレーザ光源であり、中赤外領域で波長を掃引可能なレーザ光源が好ましい。測定精度向上および測定時間短縮等の観点から、高輝度の中赤外レーザ光を発振する量子カスケードレーザ(QCL)、または光パラメトリック発振器(OPO)を備える光源を用いることが好ましい。OPOの詳細は、例えば特開2010-281891号公報に記載されている。
The measurement light L0 is preferably coherent light because the light intensity of the specific wavelength is high and the measurement time can be shortened. The
OPOの励起光源としては、パルス状、かつ中赤外光よりも短波長の励起光を発振可能なレーザが用いられ、QスイッチNd:YAGレーザ(発振波長1.064μm)や、QスイッチYb:YAGレーザ(発振波長1.030μm)が特に好ましく用いられる。これらの励起光源は、過飽和吸収体を用いてスイッチング動作を自動的に行わせることができる。そのため、QスイッチNd:YAGレーザまたはQスイッチYb:YAGレーザを励起光源として用いることにより、励起光源及びこれを制御するための構成を単純化、および小型化することができる。Qスイッチ発振においては、例えばパルス幅約8nsで10Hz以上の繰り返しで励起光を発振することができる。 As an excitation light source for the OPO, a laser capable of oscillating pulsed excitation light with a wavelength shorter than that of mid-infrared light is used, such as a Q-switched Nd:YAG laser (oscillation wavelength: 1.064 μm) or a Q-switched Yb: A YAG laser (oscillating wavelength of 1.030 μm) is particularly preferably used. These excitation sources can be automatically switched using a saturable absorber. Therefore, by using a Q-switched Nd:YAG laser or a Q-switched Yb:YAG laser as an excitation light source, the excitation light source and the configuration for controlling it can be simplified and miniaturized. In Q-switch oscillation, for example, excitation light can be oscillated with a pulse width of about 8 ns and a repetition rate of 10 Hz or more.
OPOにおいては、入射側および反射側の半透鏡の間に、非線形光学結晶が設置される。非線形光学結晶としては、例えば、AgGaS2が用いられる。その他の非線形光学結晶としては、GaSe、ZnGeP2、CdSiP2、LiInS2、LiGaSe2、LiInSe2、LiGaTe2等が挙げられる。OPO12から発せられるレーザ光は、励起光に対応した繰り返し周波数、パルス幅(例えば約8ns)となり、この短いパルス幅により尖頭出力が10W~1kWの高強度となる。
In an OPO, a nonlinear optical crystal is installed between semitransparent mirrors on the incident side and the reflecting side. AgGaS 2 , for example, is used as the nonlinear optical crystal. Other nonlinear optical crystals include GaSe, ZnGeP 2 , CdSiP 2 , LiInS 2 , LiGaSe 2 , LiInSe 2 and LiGaTe 2 . The laser light emitted from the
光源11は、制御部31の光調整部311からの信号に基づいて光量および発振波長が調整可能に構成されていてもよい。例えば、レーザの出力を調整することにより、試料Sに照射される光量を調整できる。光量調整は、レーザのパルス幅やビームサイズの調整、光学フィルタの使用、シャッター速度の調整、撮像素子の積算時間およびゲイン調整等により実施してもよい。
The
光源11と試料台13の間には、照射光のサイズ(光径)を調整するために、レンズ等の光学要素21が配置されていてもよい。光学要素21は、試料Sへの照射光の光径を大きくするものでもよく、小さくするものでもよい。光学要素21は、制御部31の位置調整部313からの信号に基づいて移動可能に構成されていてもよい。光学要素21をレーザ光の進行方向(z方向)と平行に移動させることにより、試料Sへの照射光の光径の調整や、焦点の調整(合焦調整)を行うことができる。
An
試料台13は、試料Sを固定可能である。例えば、試料台13上に試料Sを載置することにより試料Sが固定される。クリップ等を用いて試料台13に試料Sを固定してもよい。試料Sに含まれる生体組織は、ヒトから採取した組織でもよく、マウス、ラット等の非ヒト動物から採取した組織でもよい。
The sample table 13 can fix the sample S thereon. For example, the sample S is fixed by placing the sample S on the
試料台13は、試料Sを透過した測定光L1を透過可能である。例えば、試料台13は、試料Sを載置する部分が中赤外光に対して透明な材料で構成されていてもよい。図1に示すように、試料台13には、測定光L1を透過するための開口13xが設けられていてもよい。
The sample table 13 can transmit the measurement light L1 that has passed through the sample S. As shown in FIG. For example, the sample table 13 may have a portion on which the sample S is placed made of a material transparent to mid-infrared light. As shown in FIG. 1, the
試料台13は、測定光(中赤外レーザ光)L0,L1の進行方向(図1のz方向)と平行に移動可能に構成されていてもよい。試料台13を測定光の進行方向に沿って移動させることにより、光源11と試料Sとの距離(および光学要素21と試料Sとの距離)、ならびに試料Sと撮像素子12との距離(および試料Sと光学要素23との距離)を変化させ、合焦調整を実施できる。試料台の移動(位置調整)は、手動で行ってもよく、制御部31の位置調整部313からの信号に基づいて実施してもよい。
The sample table 13 may be configured to be movable in parallel with the traveling direction (z direction in FIG. 1) of the measurement light (mid-infrared laser light) L 0 and L 1 . By moving the sample table 13 along the traveling direction of the measurement light, the distance between the
試料台13は、測定光の進行方向と直交する方向(x方向およびy方向)に二次元的に移動可能に構成されていてもよい。試料台がxy方向に移動可能に構成されていれば、試料Sにおける測定光L0の照射位置を調整できる。 The sample table 13 may be configured to be two-dimensionally movable in directions (x-direction and y-direction) perpendicular to the traveling direction of the measurement light. If the sample stage is configured to be movable in the xy directions, the irradiation position of the measurement light L0 on the sample S can be adjusted.
試料Sを透過した測定光L1は、撮像素子12により検出される。撮像素子12は、複数のピクセルが2次元(x方向およびy方向)に配置されており、それぞれのピクセルに入射する測定光L1の強度を検出する。各ピクセルに入射した光強度のデータが、コンピュータ30に送信され、制御部31のイメージ形成部317で測定画像が作成される。測定画像は、撮像素子12の各ピクセルに入射した測定光L1の輝度(積算光量)に基づいて作成される。すなわち、測定画像は、各ピクセルに入射した透過光強度をマッピングしたものである。
The measurement light L 1 transmitted through the sample S is detected by the
制御部31の演算解析部315が、測定画像を解析する。解析結果に基づいて、イメージ形成部317が解析画像を作成する。作成された解析画像は、表示部33に表示される。
An
試料台13と撮像素子12との間には、撮像素子12に達する測定光L1の光径を調整するための撮像用光学要素23が配置されていてもよい。一般には、撮像素子12の受光面積は、試料Sへの測定光L0の照射領域に比べて大きい。撮像用光学要素23により測定光L1の光径を拡大して撮像素子12に入射させ、撮像素子のより広い領域を利用することにより、イメージの解像度を高めることができる。
An imaging
生体組織識別装置1は、試料Sを透過した測定光L1(または試料Sで反射した測定光)を検出するための撮像素子12に加えて、試料Sを直接撮像するための第二撮像素子19を備えていてもよい。第二撮像素子19は、試料Sから見て光源11側に配置されており、試料Sにおける測定光L0の照射部位を含む領域を撮像可能である。試料Sと第二撮像素子19との間には、適宜の光学要素(不図示)が配置されていてもよい。第二撮像素子19により撮像された試料Sの画像を表示部33に表示してもよい。ユーザは、表示部の画像を確認しながら、試料Sにおける測定光L0の照射位置を調節してもよい。なお、中赤外領域の測定光は、可視光用の撮像素子19では確認できないため、照射位置を調節する際には、不図示の光源から試料Sに可視光を照射してもよい。
The biological
[生体組織の測定およびイメージング]
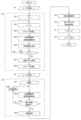
図2は、生体組織識別装置1による処理の一例を示すフローチャートである。まず、光源11から試料Sに照射するレーザ光の波長を、合焦調整用波長λ0に設定し(S1)、波長λ0の中赤外光で合焦調整を実施する(S2)。合焦調整後に、レーザ光の波長を、測定用波長λ1に変更し(S3)、必要に応じて波長λ1の中赤外光で光量調整を実施する(S4)。その後、波長λ1の中赤外光を試料Sに照射し、撮像素子12により測定画像を取得する(S5)。得られた測定画像を解析し(S6)、解析結果をマッピングしてイメージ(解析画像)を作成し(S7)、解析画像を表示部33に表示する(S7)。得られた解析画像に基づいて、病変組織の有無や、その場所の特定を行う。
[Measurement and imaging of living tissue]
FIG. 2 is a flowchart showing an example of processing by the biological
上記の各処理は、制御部31の制御ブロック(光調整部311、位置調整部313、演算解析部315、およびイメージ形成部317)により制御される。コンピュータ30の記憶部35には、これらの処理を実行するためのソフトウェアである生体組織識別プログラムが格納されていてもよい。制御部31は、1つ以上のプロセッサを備えており、プロセッサが記憶部35から生体組織識別プログラムを読み取り、各制御ブロックが生体組織識別装置の各要素を動作させることにより、処理が実行される。
Each of the processes described above is controlled by the control blocks of the control unit 31 (the
生体組織識別プログラムは、コンピュータ30の記憶部35に格納された状態で生体装置識別装置とともに提供されてもよい。また、生体組織識別プログラムは、コンピュータ読み取り可能な可読記憶媒体に格納して提供されてもよく、外部のサーバ等から優先または無線のネットワークを介して提供されてもよい。可読記憶媒体や外部のサーバ等に格納されたプログラムを、コンピュータ30の記憶部35に格納して使用してもよい。
The biological tissue identification program may be stored in the
<実施例1:肺サンプルの測定>
図3は、正常組織とがん組織を含む肺サンプルを染色し、光学顕微鏡で撮像した病理画像である。図中の破線Dで囲まれた領域Pが、がん組織を含む領域であり、その他の領域Qは正常組織である。図4は、正常組織とがん組織を含む肺サンプル(未染色)を試料として、波長9.6μmのレーザ光を試料に照射し、得られた測定画像から、対象領域の解析を行い、各ピクセルの合焦測度を20階調でマッピングした解析画像である。合焦測度は、微分フィルタの1種であるSobelフィルタを用いたエッジ解析により算出した。
<Example 1: Measurement of lung sample>
FIG. 3 is a pathological image obtained by staining a lung sample containing normal tissue and cancerous tissue and imaging it with an optical microscope. A region P surrounded by a dashed line D in the figure is a region containing cancer tissue, and the other region Q is normal tissue. FIG. 4 shows that a lung sample (unstained) containing normal tissue and cancer tissue is used as a sample, and a laser beam with a wavelength of 9.6 μm is irradiated to the sample, and the target region is analyzed from the obtained measurement image. It is an analysis image in which the focus measures of pixels are mapped in 20 gradations. The focus measure was calculated by edge analysis using a Sobel filter, which is a type of differential filter.
図4におおける破線Gの位置が、図3における破線Dの位置に対応しており、破線Gに囲まれた領域Sが、癌を含む領域Pに対応しており、外側の領域Tが正常組織の領域Qに対応している。図4において、領域Sは合焦測度が小さく、領域Tは合焦測度が大きいことから、合焦測度の大小が、がんの有無に対応していることが分かる。 The position of the broken line G in FIG. 4 corresponds to the position of the broken line D in FIG. 3, the region S surrounded by the broken line G corresponds to the region P containing cancer, and the outer region T It corresponds to the region Q of normal tissue. In FIG. 4, since the region S has a small focus measure and the region T has a large focus measure, it can be seen that the magnitude of the focus measure corresponds to the presence or absence of cancer.
以下では、正常組織とがん組織を含む肺サンプルを試料として、生体組織識別装置1により、図4のイメージを取得して生体組織を識別した実施例について、その処理の流れを、図2のフローチャートに沿って説明する。
In the following, an embodiment in which a lung sample containing normal tissue and cancerous tissue is used as a sample and the biological
本実施例では、QスイッチNd:YAGレーザ(発振波長1.064μm)と、非線形光学結晶としてAgGaS2を用いた光パラメトリック発振器とを組み合わせた光源11から、試料台13に載置した試料Sに、パルス幅8ns、測定用波長λ1=9.6μmの中赤外レーザを照射し、その透過光を、撮像素子12により撮影した。撮像素子12としては、480×640ピクセルの2次元型ボロメータアレイセンサ(14ビット)を用いた。光源11と試料台13との間、および試料台13と撮像素子12との間には、それぞれ、光学要素21,23としてレンズを配置した。
In this embodiment, from a
(合焦調整用波長の選択)
まず、光源11から試料Sに照射する中赤外光の波長を、合焦調整用の波長λ0に設定する(S1)。光源11が発振するレーザ光の波長は、光調整部311からの信号に基づいて変更可能である。本実施例では、合焦調整用の波長λ0を11μmに設定したが、他の波長でもよく、正常組織と病変組織(例えばがん)の光吸収の差異が小さい波長を選択すればよい。
(Selection of wavelength for focus adjustment)
First, the wavelength of the mid-infrared light with which the sample S is irradiated from the
生体組織(器官)の種類または状態により、吸光度が変化し難い波長の範囲が存在する。例えば、吸収スペクトルのピークまたはその近傍には、組織の状態が変化しても吸光度が変化しない波長(等吸収点)が存在する。正常組織と病変組織が混在している場合でも、等吸収点またはその近傍の波長では、正常組織と病変組織の光吸収の差が小さいため、合焦調整用波長として好適である。合焦調整用波長は、吸収スペクトルの谷に対応する波長でもよいし、吸収スペクトルのフラットな部分に対応する波長でもよい。 Depending on the type or condition of a living tissue (organ), there is a range of wavelengths in which the absorbance is difficult to change. For example, at or near the peak of the absorption spectrum, there is a wavelength (isosbestic point) at which the absorbance does not change even if the state of the tissue changes. Even when normal tissue and diseased tissue coexist, a wavelength at or near the isosbestic point is suitable as a focus adjustment wavelength because the difference in light absorption between normal tissue and diseased tissue is small. The focus adjustment wavelength may be a wavelength corresponding to a valley of the absorption spectrum or a wavelength corresponding to a flat portion of the absorption spectrum.
(合焦調整)
合焦調整や測定画像の解析は、撮像画像(中赤外光を試料に照射した領域)から、診断対象の領域を選択し、選択した領域に対して実施すればよい。本実施例では、図4に示した円形の領域を対象領域とした。
(Focus adjustment)
The focus adjustment and the analysis of the measurement image may be performed on the selected area by selecting the diagnosis target area from the captured image (the area where the sample is irradiated with the mid-infrared light). In this example, the circular area shown in FIG. 4 was used as the target area.
まず、z方向における試料台13の位置を初期位置z1に調整し(S21~23)、波長λ0(本実施例では11μm)の中赤外レーザ光を試料Sに照射し、その透過光像を撮像素子12で撮像し、合焦調整用画像A1を取得する(S24)。前述のように、測定画像は、撮像素子12の各ピクセルに入射した積算光量に基づいて作成される。合焦調整用画像A1を解析して、合焦の指標となる合焦関数f1を算出する(S25)。
First, the position of the
その後、試料台13をz方向に移動して位置z2に調整し(S26,S22,S23)、合焦調整用画像A2を取得し(S24)、合焦関数f2を算出する(S25)。試料台の位置を変化させることにより、レンズ23と試料Sとの距離を変えながら、それぞれの試料台の位置zk(kは1~Kの整数)で、合焦調整用画像Akを取得し、合焦の程度を表す評価値である合焦関数fkを算出する。合焦関数fkが最も小さくなる(または大きくなる)位置zkを合焦位置znと決定し(S27)、ステージを合焦位置znに移動させる(S28)。
After that, the
本実施例では、試料台13を移動させながら合焦調整を実施したが、試料台を移動させる代わりに、レンズ23をz方向に移動させてもよい。また、レンズ23と試料台13の両方をz方向に移動させてもよく、光源11、レンズ23、撮像素子12をz方向に移動させてもよい。
In this embodiment, focus adjustment is performed while moving the
本実施例では、合焦調整用画像Akに、微分フィルタの1種であるSobelフィルタを適用してエッジ解析を行い、対象領域の各ピクセルの微分値を合焦測度とし、対象領域内の合焦測度の最小値と最大値の差を合焦関数fkとした。 In this embodiment, edge analysis is performed by applying a Sobel filter, which is a type of differential filter, to the focus adjustment image Ak , and the differential value of each pixel in the target area is used as the focus measure. The difference between the minimum and maximum values of the focus measure was taken as the focus function fk .
Sobel法では、1つの中心ピクセルの光強度(輝度)と、中心ピクセルに隣接する8つのピクセルの光強度との微分値を算出し、8つのピクセルとの微分値を平均化することにより、中心ピクセルの微分値とする。平均化に際しては、中心ピクセルの上下と左右に位置する4つのピクセルとの微分値を加重する。上下と左右のピクセルの微分値を加重して平均化することにより、エッジ検出の精度が高められる。対象領域のすべてのピクセルに対して微分値を算出し、対象領域における微分値の最大値と最小値の差を合焦関数fkとする。合焦関数fkが最小となる位置zkで、合焦が最適化されたと判断できる。 In the Sobel method, the light intensity (brightness) of one central pixel and the light intensity of eight pixels adjacent to the central pixel are calculated, and the differential values of the eight pixels are averaged to obtain the central pixel. Let it be the differential value of the pixel. When averaging, the differential values of the four pixels positioned above, below, and to the left and right of the central pixel are weighted. By weighting and averaging the differential values of the top, bottom, left, and right pixels, edge detection accuracy is enhanced. Differential values are calculated for all pixels in the target region, and the difference between the maximum and minimum differential values in the target region is defined as the focusing function fk . It can be determined that the focus is optimized at the position zk where the focus function fk is minimized.
エッジ検出に用いる微分フィルタは、Sobelフィルタに限定されず、Prewittフィルタ、Robertsフィルタ等の各種の一次微分フィルタを用いてもよく、二次微分フィルタを用いてもよい。また、微分フィルタと他の処理(例えば、平滑化によるノイズ低減処理)を組み合わせてエッジ検出を実施してもよい。 Differential filters used for edge detection are not limited to Sobel filters, and various primary differential filters such as Prewitt filters and Roberts filters may be used, or secondary differential filters may be used. Further, edge detection may be performed by combining a differential filter and other processing (for example, noise reduction processing by smoothing).
エッジ検出では、微分法に代えて、フーリエ変換やウェーブレット変換等の周波数フィルタを用いた画像解析により合焦関数を算出してもよい。また、輝度の分散に基づいて合焦測度を算出することも可能であり、一例として、測定画像を複数の領域に分割し、各領域での輝度の分散を合焦測度として使用してもよい。合焦画像では輝度の分散が大きく、非合焦画像では輝度の分散が小さくなるため、分散が大きい領域ほど合焦されていると判断できる。合焦調整には、中赤外以外の波長(例えば可視光)用の撮像装置で利用されている各種の合焦調整法を転用することもできる。 In edge detection, the focusing function may be calculated by image analysis using a frequency filter, such as Fourier transform or wavelet transform, instead of the differential method. It is also possible to calculate the focus measure based on the luminance variance. As an example, the measurement image may be divided into multiple regions and the luminance variance in each region may be used as the focus measure. . Since a focused image has a large luminance variance and an out-of-focus image has a small luminance variance, it can be determined that an area with a larger variance is more focused. For focus adjustment, various focus adjustment methods used in imaging devices for wavelengths other than mid-infrared (for example, visible light) can be diverted.
(測定用波長の選択)
合焦調整後に、光源11から試料Sに照射する中赤外光の波長を、測定用波長λ1に変更する(S3)。本実施例では、測定用波長λ1を9.6μmに設定したが、他の波長でもよい。前述のように、中赤外領域には、正常組織と病変組織の光吸収(吸光度)の差が大きい波長が存在する。組織の種類に応じて、このような吸光度の差が大きい波長を、測定用波長λ1として選択すればよい。
(Selection of wavelength for measurement)
After the focus adjustment, the wavelength of the mid-infrared light emitted from the
合焦調整に用いる波長λ0および測定に用いる波長λ1には、識別対象の組織(器官)の種類に応じた最適値が存在する。これらの波長λ0,λ1は、ユーザが入力部37から数値を入力してもよく、表示部に表示された候補の中から選択してもよい。種々の器官について、適切な合焦波長λ0および測定用波長λ1を、記憶部35に記憶させておき、ユーザが入力または選択した識別対象の組織に応じた波長λ0,λ1を記憶部から読み出してもよい。記憶部に予め最適波長を格納しておく代わりに、外部に蓄積されたデータベースから、有線または無線のネットワークを介して波長λ0,λ1を受信してもよい。ネットワークを介して受信した波長λ0,λ1の情報を、一旦記憶部35に格納し、合焦および測定の際に、器官の種類に応じて、記憶部に格納された波長を読み出してもよい。
The wavelength λ 0 used for focus adjustment and the wavelength λ 1 used for measurement have optimum values according to the type of tissue (organ) to be identified. These wavelengths λ 0 and λ 1 may be input by the user through the
(光量調整)
光源11から発振する光の波長を測定用波長λ1に切り替えた後、測定を実施する前に光量調整(S4)を行ってもよい。光量は、光調整部311からの信号に基づいて変更可能である。光量を最適化して、撮像素子のダイナミックレンジをできる限り広い範囲で使用すれば、試料Sの透過光画像のコントラストが強調されるため、解析の精度が向上し、これに伴って組織の識別精度を高めることが可能となる。
(Light intensity adjustment)
After switching the wavelength of the light emitted from the
光量調整においては、まず、光量を初期光量I0に設定する(S41)。試料Sに波長λ1の測定光L0を照射し、試料Sを透過した測定光L1を撮像素子12が受光し、光量調整用測定画像B0を取得する(S42)。
In light amount adjustment, first, the light amount is set to the initial light amount I0 (S41). The sample S is irradiated with the measurement light L0 having the wavelength λ1 , and the
測定画像B0の中で最大の輝度(カウント数)が、予め設定された範囲内であるか否かを判定する(S43)。最大輝度は、撮像素子12の検出器が飽和しない範囲で、できるだけ高い範囲に設定することが好ましく、例えば、撮像素子の最大カウント数の55~95%程度の範囲に設定すればよい。
It is determined whether or not the maximum luminance (count number) in the measurement image B0 is within a preset range (S43). The maximum luminance is preferably set as high as possible without saturating the detector of the
光量調整用測定画像の輝度の最大値が設定範囲外である場合は、光量を変更し(S44)、変更後の光量で光量調整用画像を取得し(S42)、輝度の最大値が設定範囲内となるまでこれを繰り返し、測定用光量を決定する(S45)。本実施例では、14ビット(最大16383カウント)のダイナミックレンジに対して、測定画像の最大輝度が約10000カウントとなるように、レーザのパルス数を調整した。 If the maximum luminance value of the measurement image for light quantity adjustment is outside the set range, the light quantity is changed (S44), the image for light quantity adjustment is obtained with the changed light quantity (S42), and the maximum luminance value is within the set range. This is repeated until it becomes inside, and the amount of light for measurement is determined (S45). In this example, the number of laser pulses was adjusted so that the maximum brightness of the measured image was about 10000 counts for a dynamic range of 14 bits (maximum 16383 counts).
輝度の最大値が設定範囲内となった後に、輝度の最大値が設定範囲内の最適値に近づけるための光量を算出し、これを測定用光量としてもよい。光量変更と光量調整用測定画像の取得を繰り返す代わりに、初期光量I0で測定した光量調整用測定画像B0における輝度の最大値と、設定値との比に基づいて、最適な測定用光量を算出してもよい。 After the maximum luminance value falls within the set range, the light quantity for bringing the maximum luminance value closer to the optimum value within the set range may be calculated and used as the light quantity for measurement. Instead of repeating the light intensity change and acquisition of the light intensity adjustment measurement image, the optimum measurement light intensity is obtained based on the ratio between the maximum value of the luminance in the light intensity adjustment measurement image B0 measured at the initial light intensity I0 and the set value. may be calculated.
(撮像)
波長λ0で合焦調整を行い(S1,S2)、波長をλ1に変更し(S3)、必要に応じて光量調整(S4)を実施した後、本測定を行い、測定画像Cを取得する(S5)。本測定では、試料Sに測定光L0を照射し、試料Sを透過した波長λ1の測定光L1を撮像素子12で撮像する。
(imaging)
Focus adjustment is performed at wavelength λ 0 (S1, S2), the wavelength is changed to λ 1 (S3), light amount adjustment is performed as necessary (S4), and the main measurement is performed to obtain the measurement image C. (S5). In this measurement, the sample S is irradiated with the measurement light L 0 , and the measurement light L 1 having the wavelength λ 1 transmitted through the sample S is imaged by the
(解析)
本測定で取得した測定画像Cの解析を行い、対象領域の各ピクセルにおける合焦測度を算出する(S6)。本実施例では、合焦調整と同様、Sobelフィルタを適用して測定画像のエッジ解析を行い、各ピクセルの微分値を合焦測度とした。
(analysis)
The measurement image C acquired in the main measurement is analyzed, and the focus measure for each pixel in the target area is calculated (S6). In this embodiment, as in focus adjustment, a Sobel filter is applied to perform edge analysis of the measurement image, and the differential value of each pixel is used as the focus measure.
本実施例では、Sobel法により測定画像のエッジ解析を行った結果、対象領域における合焦測度(微分値)の最小値は130、最大値は187であった。微分値が小さいほど合焦の度合いが低く、微分値が大きいほど合焦の度合いが高いことを示す。 In this embodiment, as a result of edge analysis of the measured image by the Sobel method, the minimum value of the focus measure (differential value) in the target region was 130, and the maximum value was 187. A smaller differential value indicates a lower degree of focusing, and a larger differential value indicates a higher degree of focusing.
エッジ解析は、合焦の度合いの指標となる合焦測度をピクセルごとに算出できる手法を採用すればよく、Sobel法に限定されるものではない。例えば、Prewittフィルタ、Robertsフィルタ等の各種の一次微分フィルタや、二次微分フィルタを用いてもよい。また、微分法に代えて、フーリエ変換やウェーブレット変換等の周波数フィルタを適用して、各ピクセルの合焦測度を算出してもよい。測定画像の解像度が十分大きい場合は、複数のピクセルを平均化して1つの領域とし、解像度を落としてエッジ解析を実施してもよい。 The edge analysis is not limited to the Sobel method, as long as a method capable of calculating a focus measure, which is an index of the degree of focus, is calculated for each pixel. For example, various primary differential filters such as Prewitt filter and Roberts filter, and secondary differential filters may be used. Also, instead of the differential method, a frequency filter such as Fourier transform or wavelet transform may be applied to calculate the focus measure of each pixel. If the resolution of the measurement image is high enough, multiple pixels may be averaged into one area and edge analysis may be performed at a reduced resolution.
(マッピングおよび結果の出力)
イメージ形成部317は、エッジ解析により得られた各ピクセルの合焦測度を、マッピングして画像化する(S7)。本実施例では、合焦測度の最小値130から最大値187の範囲を20階調に分けてイメージを作成した(図4参照)。イメージ形成部317により作成された画像は、表示部33に表示される(S8)。
(mapping and resulting output)
The
本実施例では、図4の解析画像において、合焦測度の最小値(第1階調)から最大値(第20階調)までの中央の階調(第10階調:47~52%)の位置が、図3の病理画像における正常組織とがん組織との境界と概ね一致していることが確認された。図4では、図3の病理画像との対応関係に基づいて、正常組織とがん組織との境界に破線を付している。破線が付された箇所の合焦測度は157~166であり、いずれも20階調の解析画像における第10階調の範囲内であった。 In this embodiment, in the analysis image of FIG. 4, the central gradation (10th gradation: 47 to 52%) from the minimum value (first gradation) to the maximum value (20th gradation) of the focus measure It was confirmed that the position of , substantially coincides with the boundary between the normal tissue and the cancer tissue in the pathological image of FIG. 3 . In FIG. 4, the boundary between the normal tissue and the cancer tissue is indicated by a dashed line based on the correspondence relationship with the pathological image in FIG. The focus measures at the locations marked with dashed lines were 157 to 166, all of which were within the range of the 10th gradation in the 20-gradation analysis image.
図4において破線Gで囲まれた領域Sは、第9階調以下(合焦測度156以下)であり、合焦測度が閾値よりも小さく、がんを含む領域である。破線の外側の領域Tは第11階調以上(合焦測度167以上)であり、合焦測度が閾値よりも大きい正常組織領域である。すなわち、この境界線よりも高階調(第11~20階調)の領域が正常組織、低階調(第1~9階調)の領域ががんと判定される。本実施例では、合焦測度の小さい低階調領域が、がんを含む領域であり、合焦測度が大きい高階調領域は正常組織である。 A region S surrounded by a dashed line G in FIG. 4 is a region having a 9th gradation or less (a focus measure of 156 or less), a focus measure smaller than the threshold, and including cancer. A region T outside the dashed line is a normal tissue region having the 11th gradation or higher (focusing measure 167 or higher) and having a focusing measure larger than the threshold. That is, a region with higher gradation (11th to 20th gradation) than this boundary line is determined as normal tissue, and a region with lower gradation (1st to 9th gradation) is determined as cancer. In this embodiment, the low gradation region with a small focus measure is a region containing cancer, and the high gradation region with a large focus measure is normal tissue.
本実施例では、病理画像(図3)と合焦測度のマップ(図4)との対応関係を示すために、病理画像に基づいてがん組織と正常組織が既知となっている試料を用い、図3の病理画像における境界線Dに対応する位置に破線Gを付している。病変領域が未知の試料の測定においては、イメージ出力の際に、閾値となる階調の境界に境界線を付してもよい。階調分けした画像に、境界線を付加することにより、検査者の主観に依らない組織の識別を、より簡便かつ容易に実現できる。 In this embodiment, in order to show the correspondence relationship between the pathological image (FIG. 3) and the map of the focusing measure (FIG. 4), a sample in which cancer tissue and normal tissue are known based on the pathological image is used. , and a dashed line G is attached to the position corresponding to the boundary line D in the pathological image of FIG. In the measurement of a sample with an unknown lesion area, a boundary line may be attached to the threshold gradation boundary during image output. By adding a boundary line to the gradation-divided image, it is possible to easily and simply identify the tissue without relying on the examiner's subjectivity.
本実施例では、合焦測度の最小値から最大値の範囲を20階調に分けてイメージを作成したが、解析画像の階調数は20以上でもよく、2以上19以下でもよい。例えば、合焦測度が閾値以上(または閾値より大きい)領域と、合焦測度が閾値未満(または閾値以下)の2階調でイメージを表示してもよい。本実施例では、解析画像を20階調のモノクロ表示としたが、イメージをカラー化してもよい。 In this embodiment, the image is created by dividing the range from the minimum value to the maximum value of the focus measure into 20 gradations, but the number of gradations of the analysis image may be 20 or more, or may be 2 to 19. For example, the image may be displayed in two gray scales, one for regions with a focus measure above (or above) the threshold and the other for regions with a focus measure below (or below) the threshold. In this embodiment, the analysis image is displayed in monochrome with 20 gradations, but the image may be displayed in color.
解析画像とともに、第二撮像素子19により撮像された試料Sの画像を表示部33に表示してもよい。試料Sの画像と解析画像を対比することにより、試料Sにおける測定箇所(診断対象部位)を視覚的に把握することが可能となる。第二撮像素子19により撮像された試料Sの画像に、解析画像を重ね合わせてもよい。
An image of the sample S captured by the
<組織の識別原理および利点>
上記のように、本実施例では、測定光を試料Sに照射し、特定の波長λ1の透過光イメージを撮像し、得られた測定画像のエッジ解析により求めた合焦測度(微分値)の大小に基づいて、正常組織とがん組織の識別を行った。肺サンプルでは、微分値が大きい(合焦度合いが高い)場合は正常組織、微分値が小さい(合焦度合いが低い)場合はがん組織であると判定できる。これは、生体組織に所定波長の中赤外光を照射した際に、正常組織とがん等の病変組織で画像のコントラストが異なり、合焦度合いに差異が生じるとの知見を利用したものである。
<Tissue Identification Principles and Advantages>
As described above, in this embodiment, the measurement light is irradiated to the sample S, the transmitted light image of the specific wavelength λ 1 is captured, and the focus measure (differential value) obtained by edge analysis of the obtained measurement image is Normal tissue and cancer tissue were discriminated based on the size of . A lung sample can be determined to be normal tissue when the differential value is large (high degree of focus), and to be cancer tissue when the differential value is small (low degree of focus). This is based on the knowledge that when living tissue is irradiated with mid-infrared light of a predetermined wavelength, the image contrast differs between normal tissue and diseased tissue such as cancer, resulting in a difference in the degree of focusing. be.
すなわち、肺サンプルに所定波長(本実施例では9.6μm)の中赤外光を照射して透過光イメージを取得すると、がん組織は透過光輝度の変化(バラツキ)が小さく「ぼやけた」領域として認識され、正常組織は透過光輝度の変化が大きく「ピントが合った」領域として認識される。これを、微分フィルタ等を用いた解析により、領域(ピクセル)ごとに合焦測度として数値化し、階調分けを行って解析画像として出力することにより、検査者の主観に依らない組織の識別が可能となる。 That is, when a lung sample is irradiated with mid-infrared light of a predetermined wavelength (9.6 μm in this example) and a transmitted light image is acquired, the cancer tissue becomes “blurry” with small changes (variation) in transmitted light luminance. normal tissue is recognized as a "focused" region with a large change in transmitted light intensity. This is quantified as a focus measure for each region (pixel) by analysis using a differential filter, etc., and is divided into gradations and output as an analysis image. It becomes possible.
単一波長で撮像および解析を実施するため、多波長でハイパースペクトルを取得する場合に比べて、測定時間を大幅に短縮できる。本実施例における測定時間は、1秒未満である。また、合焦測度の算出は、アルゴリズムが単純であり、クラスター解析のような大量のデータ処理を必要としないため、データ処理時間を大幅に短縮できる。本実施例におけるデータ処理時間(測定画像を取得後、表示部に解析画像を表示するまでに要する時間)は1秒未満である。このように、本発明の方法によれば、測定およびデータ処理の時間を大幅に短縮可能であり、リアルタイム診断への適用も可能である。 Since imaging and analysis are performed at a single wavelength, measurement time can be significantly reduced compared to acquiring hyperspectra at multiple wavelengths. The measurement time in this example is less than 1 second. In addition, since the calculation of the focus measure has a simple algorithm and does not require a large amount of data processing such as cluster analysis, the data processing time can be greatly reduced. The data processing time (the time required to display the analysis image on the display unit after acquisition of the measurement image) in this embodiment is less than 1 second. Thus, according to the method of the present invention, the time for measurement and data processing can be greatly reduced, and application to real-time diagnosis is also possible.
<実施例2:筋肉組織と骨肉腫の識別>
実施例1では、被検試料(識別対象)として正常組織とがん組織を含む肺サンプルを使用したが、中赤外光イメージのエッジ解析による組織の識別は、肺以外の器官にも適用可能である。また、がん以外の組織の病変等の診断にも適用可能である。実施例2では、骨肉腫と正常組織である筋肉組織を含む試料を用いて、実施例1と同様に中赤外光の透過光イメージの取得、およびエッジ解析を行った。
<Example 2: Discrimination between muscle tissue and osteosarcoma>
In Example 1, lung samples containing normal tissue and cancerous tissue were used as test samples (discrimination targets), but tissue identification by edge analysis of mid-infrared light images can also be applied to organs other than the lung. is. It is also applicable to the diagnosis of tissue lesions other than cancer. In Example 2, a sample containing osteosarcoma and muscle tissue, which is normal tissue, was used to acquire a transmitted light image of mid-infrared light and perform edge analysis in the same manner as in Example 1. FIG.
図5は、筋肉組織(正常組織)と骨肉腫を含むサンプルを染色し、光学顕微鏡で撮像した病理画像である。骨肉腫を含む領域Pと正常組織領域Qとの境界では、両組織が混ざりあっているため、図5では、これらの大まかな境界を破線Dで示している。図6は、正常組織と骨肉腫を含むサンプル(未染色)を試料として、波長9.86μmの赤外線レーザを試料に照射し、得られた測定画像から、対象領域の解析を行い、各ピクセルの合焦測度を20階調でマッピングした解析画像である。図5において破線Cで囲まれた円形の領域が、図6の解析対象領域に対応している。 FIG. 5 is a pathological image obtained by staining a sample containing muscle tissue (normal tissue) and osteosarcoma and imaging it with an optical microscope. At the boundary between the osteosarcoma-containing region P and the normal tissue region Q, the two tissues are intermingled. FIG. 6 shows a sample (unstained) containing normal tissue and osteosarcoma as a sample, irradiating the sample with an infrared laser with a wavelength of 9.86 μm, and analyzing the target area from the obtained measurement image. It is an analysis image in which the focus measure is mapped with 20 gradations. A circular area surrounded by a dashed line C in FIG. 5 corresponds to the analysis target area in FIG.
本実施例では、測定画像の解析領域における合焦測度の最小値が137、最大値が199であり、この範囲を20階調に分けてイメージを作成した。図6では、図5の境界線Dに対応する位置を破線Gで示している。破線Gが付された箇所の合焦測度は163~169であり、合焦測度の最小値と最大値の42~52%の領域内であった。図6において破線Gよりも下側の領域S(図5の領域Pに対応)は、境界線Gよりも合焦測度が小さい領域であり、破線Gよりも上側の領域T(図5の領域Qに対応)は、境界線Gよりも合焦測度が大きい領域である。この結果から、骨肉腫サンプルにおいても、中赤外光の透過光イメージのエッジ解析を行い、微分フィルタ処理により算出した合焦測度と所定の閾値との大小関係に基づいて、正常組織と骨肉腫の識別が可能であることが分かる。 In this embodiment, the minimum value of the focus measure in the analysis area of the measurement image is 137 and the maximum value is 199, and the image is created by dividing this range into 20 gradations. In FIG. 6, the dashed line G indicates the position corresponding to the boundary line D in FIG. The focus measure at the point marked with a dashed line G was 163 to 169, which was within the range of 42 to 52% of the minimum and maximum values of the focus measure. In FIG. 6, a region S below the dashed line G (corresponding to region P in FIG. 5) is a region with a smaller focus measure than the boundary line G, and a region T above the dashed line G (region in FIG. Q) is an area where the focus measure is greater than that of the boundary line G. Based on this result, edge analysis of the transmitted light image of mid-infrared light was also performed for osteosarcoma samples, and normal tissue and osteosarcoma were compared based on the magnitude relationship between the focus measure calculated by differential filter processing and a predetermined threshold. can be identified.
<実施例3:肝臓細胞とがんの識別>
上記の実施例1(肺サンプル)および実施例2(骨肉腫サンプル)では、合焦測度が大きい(高階調の)領域が正常組織であり、合焦測度が小さい(低階調の)領域が病変組織を含む領域であった。一方、生体組織(器官)の種類や、測定用波長λ1の選択によっては、合焦測度が大きい領域に病変組織が含まれ、合焦測度の小さい領域が正常組織となる場合がある。実施例3では、がんと正常組織、およびリンパ球(正常組織)を含む肝臓サンプルを用いて、実施例1および実施例2と同様に中赤外光の透過光イメージの取得、および解析を行った。
<Example 3: Identification of liver cells and cancer>
In Example 1 (lung sample) and Example 2 (osteosarcoma sample) described above, the region with a large focus measure (high grayscale) is normal tissue, and the region with a small focus measure (low grayscale) is normal tissue. It was a region containing diseased tissue. On the other hand, depending on the type of living tissue (organ) and the selection of the measurement wavelength λ 1 , there are cases where diseased tissue is included in regions with a high focus rate and normal tissue is included in regions with a low focus rate. In Example 3, a liver sample containing cancer, normal tissue, and lymphocytes (normal tissue) was used to acquire and analyze transmitted light images of mid-infrared light in the same manner as in Examples 1 and 2. gone.
図7は、がんと正常組織、およびリンパ球を含む肝臓サンプルを染色し光学顕微鏡で撮像した病理画像である。図中の破線Cで囲まれた円内に、各組織の領域の境界を破線D1,D2で示した。図8は、がんと正常組織、およびリンパ球を含む肝臓サンプル(未染色)を試料として、波長9.3μmの赤外線レーザを試料照射し、得られた測定画像から、対象領域の解析を行い、各ピクセルの合焦測度を20階調でマッピングした解析画像である。 FIG. 7 is a pathological image obtained by staining a liver sample containing cancer, normal tissue, and lymphocytes and imaging it with an optical microscope. Boundaries of the tissue regions are indicated by dashed lines D 1 and D 2 within the circle surrounded by the dashed line C in the figure. Fig. 8 shows a sample of a liver sample (unstained) containing cancer, normal tissue, and lymphocytes. The sample is irradiated with an infrared laser with a wavelength of 9.3 µm, and the target area is analyzed from the obtained measurement image. , is an analysis image in which the focus measure of each pixel is mapped with 20 gradations.
本実施例では、測定画像の解析領域における合焦測度の最小値が133、最大値が163であり、この範囲を20階調に分けてイメージを作成した。図8には、各組織の大まかな境界を破線G1,G2で示している。がんを含む領域と正常組織の領域との境界の合焦測度は145~148であり、合焦測度の最小値と最大値の42~52%の領域内であった。がんを含む領域とリンパ球の領域との境界の合焦測度も145~148の範囲内であった。一方、図8の解析画像では、正常組織の領域とリンパ球の領域との境界G2には、階調の差はみられなかった。 In this embodiment, the minimum value of the focus measure in the analysis area of the measurement image is 133 and the maximum value is 163, and the image is created by dividing this range into 20 gradations. In FIG. 8, the rough boundaries of each tissue are indicated by dashed lines G1 and G2 . The focus measure of the boundary between the region containing cancer and the region of normal tissue was 145-148, within 42-52% of the minimum and maximum focus measures. The focus measure of the boundary between the cancer containing area and the lymphocyte area was also within the range of 145-148. On the other hand, in the analysis image of FIG. 8, no difference in gradation was observed at the boundary G2 between the normal tissue region and the lymphocyte region.
本実施例では、実施例1,2とは逆に、境界階調よりも高階調で合焦測度が大きい領域が病変組織(がん)を含む領域であり、境界階調よりも低階調で合焦測度が小さい領域が正常組織であった。
In the present embodiment, contrary to
実施例1~3のそれぞれについて、測定サンプル、測定用波長λ1、合焦測度の範囲(最大値および最小値)、および病変組織と正常組織との境界の合焦測度の範囲を、表1に一覧で示す。 For each of Examples 1 to 3, the measurement sample, the wavelength λ 1 for measurement, the range of focus measures (maximum and minimum values), and the range of focus measures at the boundary between diseased tissue and normal tissue are shown in Table 1. are listed in .

<応用例>
前述のように、測定用波長λ1は、測定対象の組織(器官)の種類に応じて、吸光度の差が大きい波長を選択すればよく、実施例に示した組織以外でも、測定用波長λ1を適切に選択して測定および解析を行うことにより、合焦測度に基づく生体組織の識別が可能である。
<Application example>
As described above, for the measurement wavelength λ 1 , a wavelength with a large difference in absorbance may be selected according to the type of tissue (organ) to be measured. By appropriately selecting 1 for measurement and analysis, identification of living tissue based on the focus measure is possible.
器官が未知の場合や、識別対象の器官に最適な測定用波長が未知の場合は、合焦調整を行った後に、複数の波長で測定および解析を行い、合焦測度の最大値と最小値の差が小さい波長での測定結果を採用すればよい。また、複数の波長での測定・解析結果をデータベースと照合して、器官の同定や病変種類の同定を行ってもよい。病変組織と正常組織を識別するための解析画像と病理画像のマッチングデータを蓄積してデータベース化することにより、人工知能による識別の自動化への応用も期待できる。解析結果のデータベースには、組織の識別を行うための合焦測度の閾値に関する情報等が格納されていてもよい。解析対象の病変としては、がんの他に、筋梗塞、脂肪肝、肝硬変、腎臓組織のアミロイド沈着した糸球体等の非がん組織が挙げられる。 If the organ is unknown, or if the best measurement wavelength for the organ to be identified is unknown, then after adjusting the focus, measurements and analyzes at multiple wavelengths are performed to determine the maximum and minimum focus measures. A measurement result at a wavelength with a small difference in is adopted. Moreover, the identification of the organ and the type of lesion may be performed by collating the results of measurement and analysis at a plurality of wavelengths with a database. By accumulating matching data of analysis images and pathological images for distinguishing diseased tissue from normal tissue and creating a database, application to automation of identification by artificial intelligence can also be expected. The analysis result database may store information about the threshold value of the focus measure for identifying the tissue, and the like. Lesions to be analyzed include, in addition to cancer, non-cancerous tissue such as myocardial infarction, fatty liver, liver cirrhosis, and glomerulus with amyloid deposits in renal tissue.
上記の実施例では、測定光として、コヒーレント光であるレーザを用いている。測定光が単一波長λ1のコヒーレント光であれば、撮像素子では波長λ1を有する光が撮像され、単一波長での撮像および解析が行われるため、多波長で撮像および解析を実施する場合(例えばハイパースペクトルを取得する場合)に比べて、測定・解析時間を短縮できる。 In the above embodiment, a laser, which is coherent light, is used as the measurement light. If the measurement light is coherent light with a single wavelength λ 1 , the imaging device captures light with a wavelength λ 1 , and imaging and analysis are performed at a single wavelength, so imaging and analysis are performed at multiple wavelengths. Measurement and analysis time can be shortened compared to the case (for example, when acquiring a hyperspectrum).
(インコヒーレント光の利用)
前述のように、測定光は複数の波長の光を含むインコヒーレント光でもよい。測定光がインコヒーレント光である場合、光源11と試料Sの間、または/および試料Sと撮像素子12との間に波長フィルタや分光器等の分光手段を配置すれば、光源に含まれる多波長光のうち、特定の波長λ1を有する光のみを撮像素子により撮像可能であり、測定光がコヒーレント光である場合と同様に解析を実施できる。インコヒーレント光を用いる場合は、波長フィルタの交換や、分光器の調整により、撮像素子に到達する光の波長を変更すれば同一の光源を用いて、波長λ0の光での合焦調整と、波長λ1の光での測定を実施できる。
(Use of incoherent light)
As mentioned above, the measurement light may be incoherent light including light of multiple wavelengths. When the measurement light is incoherent light, if a spectroscopic means such as a wavelength filter or a spectroscope is arranged between the
(タイリング)
上記の実施例では、1回の測定により得られた測定画像のエッジ解析を行い、算出された合焦測度に基づいて、組織の識別を行ったが、複数の測定結果を組み合わせて、画像解析および組織の識別を実施してもよい。例えば、試料台13をx,y方向に移動させて、試料Sの異なる箇所にレーザ光を照射して、測定画像を取得し、複数の測定画像を合成(タイリング)することにより、試料のより広い領域の測定画像が得られる。
(tiring)
In the above embodiment, edge analysis was performed on the measurement image obtained by one measurement, and tissue identification was performed based on the calculated focus measure. and tissue identification may be performed. For example, by moving the
タイリングにより得られた測定画像のエッジ解析を行い、合焦測度を算出することにより、1回の測定よりも広範囲での組織の識別が可能となる。測定ごとにエッジ解析を行って解析画像を作成し、複数の解析画像の合成(タイリング)を実施してもよい。複数の測定画像および/または解析画像のタイリングに際しては、光学顕微鏡や電子顕微鏡等の撮影画像のタイリングに用いられている各種のアルゴリズムを適用してもよい。 By performing edge analysis of the measurement image obtained by tiling and calculating the focus measure, it becomes possible to identify tissues in a wider range than in a single measurement. Edge analysis may be performed for each measurement to create an analysis image, and synthesis (tiling) of a plurality of analysis images may be performed. When tiling a plurality of measurement images and/or analysis images, various algorithms used for tiling images captured by an optical microscope, an electron microscope, or the like may be applied.
1 生体組織識別装置
11 光源
L0,L1 測定光(中赤外光)
12 撮像素子
13 試料台
S 試料
21,23 光学要素
30 コンピュータ
31 制御部
311 光調整部
313 位置調整部
315 演算解析部
317 イメージ形成部
33 表示部
35 記憶部
37 入力部
1 biological
REFERENCE SIGNS
Claims (8)
生体組織を透過した測定光または生体組織で反射した測定光のうち波長2μm~20μmの範囲の特定の波長λ1を有する光を撮像して、測定画像を取得する撮像素子と;
前記測定画像のエッジ解析により、前記測定画像の複数の領域における合焦測度を算出可能であり、前記合焦測度に基づいて生体組織を識別する演算解析部を備えるコンピュータと、を備える、生体組織識別装置。 a light source capable of irradiating a predetermined region of a living tissue with measurement light containing mid-infrared light;
an imaging device that acquires a measurement image by imaging light having a specific wavelength λ 1 in the wavelength range of 2 μm to 20 μm among the measurement light that has passed through the living tissue or the measurement light that has been reflected by the living tissue;
a computer that can calculate focus measures in a plurality of regions of the measurement image by edge analysis of the measurement image, and that includes an arithmetic analysis unit that identifies the body tissue based on the focus measures. identification device.
生体組織を透過した測定光または生体組織で反射した測定光のうち波長2μm~20μmの範囲の特定の波長λ1を有する光を撮像して、測定画像を取得するステップ;
前記測定画像のエッジ解析により、前記測定画像の複数の領域における合焦測度を算出するステップ;および
前記合焦測度に基づいて、生体組織を識別するステップを、
コンピュータに実行させるための処理手順が記述されている、生体組織識別プログラム。 A step of irradiating a predetermined region of the living tissue with measurement light containing mid-infrared light;
A step of acquiring a measurement image by imaging light having a specific wavelength λ 1 in the wavelength range of 2 μm to 20 μm among the measurement light transmitted through the living tissue or the measurement light reflected by the living tissue;
calculating focus measures in a plurality of regions of the measurement image by edge analysis of the measurement image; and identifying biological tissue based on the focus measures,
A biological tissue identification program that describes a processing procedure to be executed by a computer.
Priority Applications (4)
| Application Number | Priority Date | Filing Date | Title |
|---|---|---|---|
| JP2019153286A JP7311142B2 (en) | 2019-08-23 | 2019-08-23 | Biological tissue identification device and biological tissue identification program |
| PCT/JP2020/030887 WO2021039441A1 (en) | 2019-08-23 | 2020-08-14 | Biological tissue identification method, biological tissue identification device, and biological tissue identification program |
| US17/636,802 US20220299434A1 (en) | 2019-08-23 | 2020-08-14 | Biological tissue identification method, biological tissue identification device, and biological tissue identification program |
| EP20856652.1A EP4019942B1 (en) | 2019-08-23 | 2020-08-14 | Biological tissue identification method and biological tissue identification device |
Applications Claiming Priority (1)
| Application Number | Priority Date | Filing Date | Title |
|---|---|---|---|
| JP2019153286A JP7311142B2 (en) | 2019-08-23 | 2019-08-23 | Biological tissue identification device and biological tissue identification program |
Publications (3)
| Publication Number | Publication Date |
|---|---|
| JP2021032708A JP2021032708A (en) | 2021-03-01 |
| JP2021032708A5 JP2021032708A5 (en) | 2022-06-27 |
| JP7311142B2 true JP7311142B2 (en) | 2023-07-19 |
Family
ID=74676422
Family Applications (1)
| Application Number | Title | Priority Date | Filing Date |
|---|---|---|---|
| JP2019153286A Active JP7311142B2 (en) | 2019-08-23 | 2019-08-23 | Biological tissue identification device and biological tissue identification program |
Country Status (4)
| Country | Link |
|---|---|
| US (1) | US20220299434A1 (en) |
| EP (1) | EP4019942B1 (en) |
| JP (1) | JP7311142B2 (en) |
| WO (1) | WO2021039441A1 (en) |
Citations (4)
| Publication number | Priority date | Publication date | Assignee | Title |
|---|---|---|---|---|
| JP2011015163A (en) | 2009-07-01 | 2011-01-20 | Olympus Corp | Imaging apparatus |
| JP2011239195A (en) | 2010-05-11 | 2011-11-24 | Sanyo Electric Co Ltd | Electronic apparatus |
| JP2014531065A (en) | 2011-10-25 | 2014-11-20 | デイライト ソリューションズ、インコーポレイテッド | Infrared imaging microscope |
| US20170220000A1 (en) | 2014-08-01 | 2017-08-03 | The Regents Of The University Of California | Device and method for iterative phase recovery based on pixel super-resolved on-chip holography |
Family Cites Families (9)
| Publication number | Priority date | Publication date | Assignee | Title |
|---|---|---|---|---|
| US7366564B2 (en) * | 2002-08-23 | 2008-04-29 | The United States Of America As Represented By The Secretary Of The Navy | Nonlinear blind demixing of single pixel underlying radiation sources and digital spectrum local thermometer |
| JP2004135868A (en) * | 2002-10-17 | 2004-05-13 | Fuji Photo Film Co Ltd | System for abnormal shadow candidate detection process |
| JP5004478B2 (en) * | 2006-02-17 | 2012-08-22 | 日立造船株式会社 | Object discrimination method and discrimination device |
| JP5376652B2 (en) | 2009-06-02 | 2013-12-25 | 独立行政法人日本原子力研究開発機構 | Laser apparatus and laser amplification method |
| JP2013152426A (en) * | 2011-12-27 | 2013-08-08 | Canon Inc | Image processing device, image processing system, image processing method and program |
| JP2014238344A (en) * | 2013-06-07 | 2014-12-18 | 富士ゼロックス株式会社 | Image processing system, image processor and program |
| JP6197659B2 (en) * | 2014-01-20 | 2017-09-20 | 富士ゼロックス株式会社 | Detection control device, program, and detection system |
| JP6598850B2 (en) * | 2015-04-23 | 2019-10-30 | オリンパス株式会社 | Image processing apparatus, image processing method, and image processing program |
| JP6740573B2 (en) * | 2015-07-16 | 2020-08-19 | コニカミノルタ株式会社 | Image processing apparatus, image processing method, and image processing program |
-
2019
- 2019-08-23 JP JP2019153286A patent/JP7311142B2/en active Active
-
2020
- 2020-08-14 WO PCT/JP2020/030887 patent/WO2021039441A1/en unknown
- 2020-08-14 US US17/636,802 patent/US20220299434A1/en active Pending
- 2020-08-14 EP EP20856652.1A patent/EP4019942B1/en active Active
Patent Citations (4)
| Publication number | Priority date | Publication date | Assignee | Title |
|---|---|---|---|---|
| JP2011015163A (en) | 2009-07-01 | 2011-01-20 | Olympus Corp | Imaging apparatus |
| JP2011239195A (en) | 2010-05-11 | 2011-11-24 | Sanyo Electric Co Ltd | Electronic apparatus |
| JP2014531065A (en) | 2011-10-25 | 2014-11-20 | デイライト ソリューションズ、インコーポレイテッド | Infrared imaging microscope |
| US20170220000A1 (en) | 2014-08-01 | 2017-08-03 | The Regents Of The University Of California | Device and method for iterative phase recovery based on pixel super-resolved on-chip holography |
Non-Patent Citations (3)
| Title |
|---|
| Hashim MIR et al.,"An extensive empirical evaluation of focus measures for digital photography",SPIE Proceedings,2014年03月07日,DOI: 10.1117/12.2042350 |
| アンジェラ・B・セダン、外6名,"MIRを用いる光学的生検に向けた動き",Laser Focus World Japan[online],2016年5月号,2016年,p.36-39,[令和5年3月9日検索],インターネット<URL:http://ex-press.jp/wp-content/uploads/2016/07/LFWJ1605_P36-39_bo01.pdf> |
| 三浦 大輝、外4名,"エッジの合焦評価による送電線検出",映像情報メディア学会技術報告,2016年,Vol.40,No.28,p.27-30 |
Also Published As
| Publication number | Publication date |
|---|---|
| US20220299434A1 (en) | 2022-09-22 |
| EP4019942A1 (en) | 2022-06-29 |
| EP4019942B1 (en) | 2023-06-21 |
| EP4019942A4 (en) | 2022-10-12 |
| JP2021032708A (en) | 2021-03-01 |
| WO2021039441A1 (en) | 2021-03-04 |
Similar Documents
| Publication | Publication Date | Title |
|---|---|---|
| JP7023244B2 (en) | Fluorescence imaging flow cytometry with improved image resolution | |
| US8391961B2 (en) | Spectral imaging | |
| US9066657B2 (en) | Methods and systems of optical imaging for target detection in a scattering medium | |
| US7583380B2 (en) | Spectroscopic analysis apparatus and method with excitation system and focus monitoring system | |
| JP2007526457A (en) | Method and apparatus for generating image including depth information | |
| US20060142662A1 (en) | Analysis apparatus and method comprising auto-focusing means | |
| RU2747129C1 (en) | Method and apparatus for image reconstruction and apparatus for image generation in microscope | |
| JP2008281513A (en) | Cultural property inspection apparatus | |
| US7692160B2 (en) | Method and system of optical imaging for target detection in a scattering medium | |
| EP2930496B1 (en) | Raman micro-spectrometry system and method for analyzing microscopic objects in a fluidic sample | |
| KR20150088879A (en) | Detection systems and methods using coherent anti-stokes raman spectroscopy | |
| JP4043417B2 (en) | Particle size measuring device | |
| CN111912835A (en) | LIBS device with ablation amount measuring function and method | |
| Spring et al. | Image analysis for denoising full‐field frequency‐domain fluorescence lifetime images | |
| TWI819004B (en) | Tissue identification device, tissue identification system,method for identifying tissue, testing method, tissue identification program, and storage medium | |
| JP7311142B2 (en) | Biological tissue identification device and biological tissue identification program | |
| WO2021099127A1 (en) | Device, apparatus and method for imaging an object | |
| CN104990908B (en) | The confocal induced breakdown Raman spectrum imaging detection method of laser twin shaft and device | |
| JP5246798B2 (en) | Biological tissue identification apparatus and method | |
| US20160274346A1 (en) | Optical System for Fast Three-Dimensional Imaging | |
| WO2009050437A1 (en) | A system and method for infrared imaging | |
| US11796475B2 (en) | Methods for performing a Raman spectroscopy measurement on a sample and Raman spectroscopy systems | |
| Kümmel et al. | Absorption properties of lipid-based substances by non-invasive fast mid-infrared imaging | |
| WO2015037055A1 (en) | Fluorescent image acquisition device | |
| Christy et al. | Wide-Field Confocal Interferometric Backscattering (iSCAT)-Raman Microscopy |
Legal Events
| Date | Code | Title | Description |
|---|---|---|---|
| A521 | Request for written amendment filed |
Free format text: JAPANESE INTERMEDIATE CODE: A523 Effective date: 20190924 |
|
| A521 | Request for written amendment filed |
Free format text: JAPANESE INTERMEDIATE CODE: A523 Effective date: 20220526 |
|
| A621 | Written request for application examination |
Free format text: JAPANESE INTERMEDIATE CODE: A621 Effective date: 20220526 |
|
| RD02 | Notification of acceptance of power of attorney |
Free format text: JAPANESE INTERMEDIATE CODE: A7422 Effective date: 20220526 |
|
| A521 | Request for written amendment filed |
Free format text: JAPANESE INTERMEDIATE CODE: A821 Effective date: 20220526 |
|
| A131 | Notification of reasons for refusal |
Free format text: JAPANESE INTERMEDIATE CODE: A131 Effective date: 20230328 |
|
| A521 | Request for written amendment filed |
Free format text: JAPANESE INTERMEDIATE CODE: A523 Effective date: 20230526 |
|
| TRDD | Decision of grant or rejection written | ||
| A01 | Written decision to grant a patent or to grant a registration (utility model) |
Free format text: JAPANESE INTERMEDIATE CODE: A01 Effective date: 20230620 |
|
| A61 | First payment of annual fees (during grant procedure) |
Free format text: JAPANESE INTERMEDIATE CODE: A61 Effective date: 20230629 |
|
| R150 | Certificate of patent or registration of utility model |
Ref document number: 7311142 Country of ref document: JP Free format text: JAPANESE INTERMEDIATE CODE: R150 |