JP7195646B2 - Graphical representation of radiotherapy - Google Patents
Graphical representation of radiotherapy Download PDFInfo
- Publication number
- JP7195646B2 JP7195646B2 JP2020503690A JP2020503690A JP7195646B2 JP 7195646 B2 JP7195646 B2 JP 7195646B2 JP 2020503690 A JP2020503690 A JP 2020503690A JP 2020503690 A JP2020503690 A JP 2020503690A JP 7195646 B2 JP7195646 B2 JP 7195646B2
- Authority
- JP
- Japan
- Prior art keywords
- radiation
- radiation delivery
- gantry
- dose
- data
- Prior art date
- Legal status (The legal status is an assumption and is not a legal conclusion. Google has not performed a legal analysis and makes no representation as to the accuracy of the status listed.)
- Active
Links
Images


Classifications
-
- A—HUMAN NECESSITIES
- A61—MEDICAL OR VETERINARY SCIENCE; HYGIENE
- A61N—ELECTROTHERAPY; MAGNETOTHERAPY; RADIATION THERAPY; ULTRASOUND THERAPY
- A61N5/00—Radiation therapy
- A61N5/10—X-ray therapy; Gamma-ray therapy; Particle-irradiation therapy
- A61N5/1048—Monitoring, verifying, controlling systems and methods
- A61N5/1071—Monitoring, verifying, controlling systems and methods for verifying the dose delivered by the treatment plan
-
- A—HUMAN NECESSITIES
- A61—MEDICAL OR VETERINARY SCIENCE; HYGIENE
- A61B—DIAGNOSIS; SURGERY; IDENTIFICATION
- A61B6/00—Apparatus for radiation diagnosis, e.g. combined with radiation therapy equipment
- A61B6/02—Devices for diagnosis sequentially in different planes; Stereoscopic radiation diagnosis
- A61B6/03—Computerised tomographs
- A61B6/032—Transmission computed tomography [CT]
-
- A—HUMAN NECESSITIES
- A61—MEDICAL OR VETERINARY SCIENCE; HYGIENE
- A61B—DIAGNOSIS; SURGERY; IDENTIFICATION
- A61B6/00—Apparatus for radiation diagnosis, e.g. combined with radiation therapy equipment
- A61B6/46—Apparatus for radiation diagnosis, e.g. combined with radiation therapy equipment with special arrangements for interfacing with the operator or the patient
- A61B6/461—Displaying means of special interest
- A61B6/463—Displaying means of special interest characterised by displaying multiple images or images and diagnostic data on one display
-
- A—HUMAN NECESSITIES
- A61—MEDICAL OR VETERINARY SCIENCE; HYGIENE
- A61N—ELECTROTHERAPY; MAGNETOTHERAPY; RADIATION THERAPY; ULTRASOUND THERAPY
- A61N5/00—Radiation therapy
- A61N5/10—X-ray therapy; Gamma-ray therapy; Particle-irradiation therapy
- A61N5/1042—X-ray therapy; Gamma-ray therapy; Particle-irradiation therapy with spatial modulation of the radiation beam within the treatment head
- A61N5/1045—X-ray therapy; Gamma-ray therapy; Particle-irradiation therapy with spatial modulation of the radiation beam within the treatment head using a multi-leaf collimator, e.g. for intensity modulated radiation therapy or IMRT
-
- A—HUMAN NECESSITIES
- A61—MEDICAL OR VETERINARY SCIENCE; HYGIENE
- A61N—ELECTROTHERAPY; MAGNETOTHERAPY; RADIATION THERAPY; ULTRASOUND THERAPY
- A61N5/00—Radiation therapy
- A61N5/10—X-ray therapy; Gamma-ray therapy; Particle-irradiation therapy
- A61N5/1077—Beam delivery systems
- A61N5/1081—Rotating beam systems with a specific mechanical construction, e.g. gantries
-
- A—HUMAN NECESSITIES
- A61—MEDICAL OR VETERINARY SCIENCE; HYGIENE
- A61B—DIAGNOSIS; SURGERY; IDENTIFICATION
- A61B6/00—Apparatus for radiation diagnosis, e.g. combined with radiation therapy equipment
- A61B6/02—Devices for diagnosis sequentially in different planes; Stereoscopic radiation diagnosis
- A61B6/03—Computerised tomographs
- A61B6/037—Emission tomography
-
- A—HUMAN NECESSITIES
- A61—MEDICAL OR VETERINARY SCIENCE; HYGIENE
- A61N—ELECTROTHERAPY; MAGNETOTHERAPY; RADIATION THERAPY; ULTRASOUND THERAPY
- A61N5/00—Radiation therapy
- A61N5/10—X-ray therapy; Gamma-ray therapy; Particle-irradiation therapy
- A61N5/1048—Monitoring, verifying, controlling systems and methods
- A61N2005/1074—Details of the control system, e.g. user interfaces
-
- A—HUMAN NECESSITIES
- A61—MEDICAL OR VETERINARY SCIENCE; HYGIENE
- A61N—ELECTROTHERAPY; MAGNETOTHERAPY; RADIATION THERAPY; ULTRASOUND THERAPY
- A61N5/00—Radiation therapy
- A61N5/10—X-ray therapy; Gamma-ray therapy; Particle-irradiation therapy
- A61N5/1048—Monitoring, verifying, controlling systems and methods
- A61N5/1075—Monitoring, verifying, controlling systems and methods for testing, calibrating, or quality assurance of the radiation treatment apparatus
- A61N2005/1076—Monitoring, verifying, controlling systems and methods for testing, calibrating, or quality assurance of the radiation treatment apparatus using a dummy object placed in the radiation field, e.g. phantom
-
- A—HUMAN NECESSITIES
- A61—MEDICAL OR VETERINARY SCIENCE; HYGIENE
- A61N—ELECTROTHERAPY; MAGNETOTHERAPY; RADIATION THERAPY; ULTRASOUND THERAPY
- A61N5/00—Radiation therapy
- A61N5/10—X-ray therapy; Gamma-ray therapy; Particle-irradiation therapy
- A61N5/1048—Monitoring, verifying, controlling systems and methods
- A61N5/1064—Monitoring, verifying, controlling systems and methods for adjusting radiation treatment in response to monitoring
- A61N5/1065—Beam adjustment
- A61N5/1067—Beam adjustment in real time, i.e. during treatment
Description
関連出願の相互参照
本願は、2017年7月26日に出願された米国特許仮出願第62/537,422号に基づく優先権を主張し、この仮出願は、その全体が参照により本明細書に援用される。
CROSS-REFERENCE TO RELATED APPLICATIONS This application claims priority to U.S. Provisional Patent Application No. 62/537,422, filed July 26, 2017, which is incorporated herein by reference in its entirety. Incorporated into
技術分野
本開示は、放射線治療システム、および放射線送達セッション(例えば、処置セッションまたは処置計画評価セッション)中の放射線送達の進捗のグラフィック表示を生成するための方法に関する。そのグラフィック表示は、放射線治療システムが処置計画の通りに放射線フルエンスを生成しているかおよび/または放射線量を送達しているかに関する指摘を提供し得る。
TECHNICAL FIELD The present disclosure relates to radiation therapy systems and methods for generating graphical displays of radiation delivery progress during a radiation delivery session (eg, a treatment session or treatment plan evaluation session). The graphical display may provide an indication as to whether the radiation therapy system is generating radiation fluence and/or delivering radiation dose according to the treatment plan.
背景
放射線処置セッション中、患者は、放射線治療システムに配置され、放射線感受性構造(例えば、リスク臓器またはOAR)を避けながら、腫瘍領域を標的にしている治療線量の放射線に曝露される。治療用放射線源であるビーム成形コンポーネント(例えば、ジョー、マルチリーフコリメータ)、ならびにガントリーおよびモーションシステムは、1またはそれを超える腫瘍領域に処方線量の放射線を照射するという目標に合わせて、放射線治療の処置計画に従って作動する。
BACKGROUND During a radiation treatment session, a patient is placed in a radiation therapy system and exposed to a therapeutic dose of radiation that targets the tumor area while avoiding radiation sensitive structures (eg, organs at risk or OAR). The therapeutic radiation source, the beam shaping components (e.g., jaws, multi-leaf collimators), and the gantry and motion system are aligned with the goal of delivering a prescribed dose of radiation to one or more tumor regions. Act according to the treatment plan.
放射線治療システムをモニターするために、ならびに何らかの装置の不具合が検出された場合および/または患者が治療に耐えられなくなった場合に処置セッションを例えば一時停止または終了させるために、操作者(例えば、臨床医、医学物理学者、診療放射線技師)が処置セッション中にいてもよい。いくつかの放射線治療システムは、放射線治療システムの様々なコンポーネントおよび/またはハードウェアの操作に関するデータ(例えば、治療用放射線源の位置、放射パルス数、ビーム成形コンポーネントの動きおよび/または位置など)を含むログファイルを経時的に生成し得る。ログファイルをレビューすることによって、操作者は、放射線治療の処置計画の指示通りに放射線治療システムのハードウェアが作動していること、および処方線量の放射線が送達されたことを確認し得る。しかしながら、システムログファイルのレビューは、煩雑である場合があり、放射線送達が処置計画の通りに進んでいるかに関する正確な指摘が提供されない場合がある。したがって、放射線送達をモニターする改善された方法が、望まれ得る。 An operator (e.g., a clinical physician, medical physicist, radiological technologist) may be present during the treatment session. Some radiation therapy systems store data regarding the operation of various components and/or hardware of the radiation therapy system (e.g., position of therapeutic radiation source, number of pulses of radiation, movement and/or position of beam shaping components, etc.). A log file may be generated over time containing: By reviewing the log file, the operator can confirm that the radiation therapy system hardware is operating as directed by the radiation therapy treatment plan and that the prescribed dose of radiation has been delivered. However, reviewing system log files can be cumbersome and may not provide an accurate indication as to whether radiation delivery is proceeding according to the treatment plan. Accordingly, improved methods of monitoring radiation delivery would be desirable.
要旨
放射線治療処置セッション中に放射線送達をモニターするための方法、および操作者(例えば、臨床医、医学物理学者、診療放射線技師)に提供され得る放射線送達のグラフィック表示を生成するための方法が、本明細書中に記載される。計画された放射線送達(すなわち、放射線治療の処置計画の指示通りの放射線送達)を基準とした処置セッション中の放射線送達の進捗が操作者に表示され得、その操作者は、この情報を用いて、放射線送達を続けるか、放射線送達を、計画された放射線フルエンスおよび/もしくは線量プロファイルにもっと適合させるのを助けるためにある特定のパラメータを調整するか、および/または放射線送達を一時停止もしくは中止するかを決定し得る。それらのグラフィックは、放射線照射データおよび/または放射線治療システムハードウェアデータが、放射線治療システムのコントローラによって収集されると同時にリアルタイムで更新され得、いくつかのバリエーションでは、15分ごとまたはそれ未満ごと(例えば、約12分ごとまたはそれ未満ごと、約10分ごとまたはそれ未満ごと、約8分ごとまたはそれ未満ごと、約5分ごとまたはそれ未満ごと、約2分ごとまたはそれ未満ごと)に更新され得る。代替的または追加的に、それらのグラフィックは、セッション中の所定の時点またはコントロールポイントにおいて更新され得る。コントロールポイントは、治療用放射線の送達に関する放射線治療システムコンポーネントの構成のリストを含み得る。いくつかのバリエーションにおいて、コントロールポイントは、患者を基準とした治療用放射線源の発射位置または配列(例えば、放射線源ガントリーの角度、患者プラットフォームの位置、1またはそれを超えるビーム成形コンポーネント(例えば、1またはそれを超えるマルチリーフコリメータおよび/またはジョー)の配置によって定義される)のリストを含み得る。コントロールポイントは、治療用放射線源のガントリーの種々の動きおよび/もしくは位置、ならびに/または種々のマルチリーフコリメータのリーフ配置、ならびに/または患者プラットフォーム位置、ならびに/または治療用放射線源の線量率などのリストも含み得る。種々のグラフィック表示(「グラフィック」)は、計画された放射線送達を基準とした放射線送達の現状を示すために使用され得、放射線送達プロファイルを経時的に提供し得る。方法は必要に応じて、許容され得るメトリック値の範囲を計算する工程、その許容され得るメトリック値の範囲を表すグラフィックを生成する工程、およびその許容され得るメトリック値の範囲とそれらのメトリックの実際の値(リアルタイムで取得されたデータに基づいて計算される値)を比較する工程を含んでもよい。
SUMMARY A method for monitoring radiation delivery during a radiation therapy treatment session and for generating a graphical representation of radiation delivery that can be provided to an operator (e.g., clinician, medical physicist, radiological technologist) includes: described herein. The progress of radiation delivery during a treatment session relative to planned radiation delivery (i.e., radiation delivery as directed by the radiation therapy treatment plan) can be displayed to the operator, who can use this information to , continue radiation delivery, adjust certain parameters to help better match radiation delivery to the planned radiation fluence and/or dose profile, and/or suspend or discontinue radiation delivery. can determine whether These graphics may be updated in real-time as radiation exposure data and/or radiation treatment system hardware data are collected by the controller of the radiation treatment system, and in some variations every 15 minutes or less ( e.g., about every 12 minutes or less, about every 10 minutes or less, about every 8 minutes or less, about every 5 minutes or less, about every 2 minutes or less) obtain. Alternatively or additionally, those graphics may be updated at predetermined points or control points during the session. A control point may include a list of configurations of radiation therapy system components for delivery of therapeutic radiation. In some variations, the control point is the firing position or alignment of the therapeutic radiation source relative to the patient (e.g., radiation source gantry angle, patient platform position, one or more beam shaping components (e.g., one or more multi-leaf collimators and/or jaws (defined by the arrangement). Control points may include various movements and/or positions of the gantry of the therapeutic radiation source, and/or various multi-leaf collimator leaf placements, and/or patient platform positions, and/or dose rates of the therapeutic radiation source. It can also contain a list. Various graphical displays (“graphics”) can be used to show the current status of radiation delivery relative to planned radiation delivery and can provide a radiation delivery profile over time. The method optionally includes the steps of calculating a range of permissible metric values, generating a graphic representing the range of permissible metric values, and comparing the permissible metric value ranges and the actual performance of those metrics. (calculated based on data acquired in real time).
本明細書中に記載される方法は、予想されるまたは計画された放射線送達メトリックを所定のもしくは予め選択された時点および/またはチェックポイントにおいて、処置セッション前の処置計画に基づいて計算する工程、処置セッションまたは品質保証(QA)セッション中のそれらの所定の時点において、実際のまたは現在の放射線送達メトリックを計算する工程、および予想されるまたは計画された送達と比べたときのそれらの時点またはチェックポイントにおける実際のまたは現在の放射線送達の進捗を示す1またはそれを超えるグラフィックを生成する工程も含み得る。これらのグラフィックは、放射線送達の正確さおよび/または精度に関する指摘を操作者に提供することを助けることがあり、その正確さおよび/または精度は、放射線送達を続けるべきか、それとも一時停止/停止すべきかを決定する際に操作者を助け得る。本明細書中に記載される方法は必要に応じて、処置計画の検証セッションまたはQAセッション中に使用され得、計画された放射線送達と比べたときの、そのセッション中のファントムへの放射線送達のグラフィック表示を提供し得る。 The methods described herein comprise calculating expected or planned radiation delivery metrics at predetermined or preselected time points and/or checkpoints based on a treatment plan prior to a treatment session; Calculating actual or current radiation delivery metrics at those predetermined time points during a treatment session or quality assurance (QA) session and checking those time points or checks when compared to expected or planned delivery. Generating one or more graphics showing the actual or current radiation delivery progress at the point may also be included. These graphics may help provide an indication to the operator regarding the correctness and/or precision of radiation delivery, which accuracy and/or precision determines whether radiation delivery should continue or be paused/stopped. It can help the operator in deciding what to do. The methods described herein can optionally be used during a treatment plan validation session or QA session to determine the rate of radiation delivery to the phantom during that session as compared to the planned radiation delivery. A graphical representation may be provided.
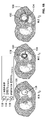
放射線送達をモニターするためおよび放射線送達のグラフィック表示を生成するための放射線治療システムの1つのバリエーションは、回転可能ガントリー、その回転可能ガントリーに連結されたガントリー位置センサー、回転可能ガントリーに搭載されており、ガントリーを回転させることによって複数のガントリー発射位置に移動可能である、治療用放射線源、その治療用放射線源の放射線ビームパスに配置された放射線検出器、治療用放射線源の放射線ビームパスに配置されたビーム成形コンポーネントであって、そのビーム成形コンポーネントは、所定のサイズおよび形状を有する放射線透過アパーチャを有するように構成される、ビーム成形コンポーネント、放射線透過アパーチャのサイズおよび形状を検出するように構成される、ビーム成形コンポーネントセンサー、およびコントローラと通信しているディスプレイを備え得る。そのコントローラは、計画された放射線送達メトリックの値を経時的に記憶する機械可読の記憶媒体およびプロセッサを備え得る。そのプロセッサは、放射線送達セッション中にガントリー位置センサーおよび/または放射線検出器および/またはビーム成形コンポーネントセンサーから取得されたデータに基づいて、放射線送達セッション中の複数の時点において放射線送達メトリックのリアルタイム値を計算するように構成され、複数の時点にわたる、計画された放射線送達メトリック値およびリアルタイムの放射線送達メトリック値を示すグラフィック表示を生成するように構成され、およびそのグラフィック表示をディスプレイに出力するように構成され得る。その機械可読の記憶媒体は、計画された放射線送達メトリックの値の予め選択された範囲を記憶するように構成され得、そのプロセッサは、計画された放射線送達メトリックの予め選択された範囲のグラフィック表示を生成するように構成され得る。そのプロセッサは、約15分ごとまたはそれ未満ごと、例えば、約10分ごとまたはそれ未満ごと、約5分ごとまたはそれ未満ごと、約1分ごとまたはそれ未満ごと、約10秒ごとまたはそれ未満ごとなどに、放射線送達メトリックのリアルタイム値を計算するように構成され、グラフィック表示を生成するように構成され、およびグラフィック表示をディスプレイに出力するように構成され得る。そのコントローラは、計画された放射線送達メトリックと放射線送達メトリックのリアルタイム値とを比較するように構成され得、リアルタイム値が、計画された放射線送達メトリックの値の予め選択された範囲内であるか否かを示すグラフィック表示を生成するように構成され得る。そのコントローラは、リアルタイムの放射線送達メトリックが、計画された放射線送達メトリックの予め選択された範囲外である場合に、放射線送達を停止するためのコマンドシグナルを生成するように構成され得る。代替的または追加的に、そのコントローラは、リアルタイムの放射線送達メトリックが、計画された放射線送達メトリックの予め選択された範囲の境界の近傍にあるとき、警告を生成し、その警告をディスプレイに出力するように構成され得る。いくつかのバリエーションにおいて、その放射線送達メトリックは、ガントリー位置センサー、放射線検出器、ビーム成形コンポーネントセンサーおよび/または患者もしくはファントムの画像によって放射線送達セッション中に取得されたデータを用いて生成された線量-体積メトリックであり得る。例えば、その放射線送達メトリックは、等線量輪郭を含み得、そのグラフィック表示は、患者またはファントムの画像に重ね合わせた等線量輪郭線を含み得る。その画像は、放射線送達セッション中に取得された患者またはファントムの構造像を含み得、例えば、その像は、放射線送達セッション中に取得された患者またはファントムのPETスキャンおよび/またはCTスキャンであり得る。代替的または追加的に、患者またはファントムの画像は、放射線送達セッション前に取得された患者またはファントムの構造像を含み得る。放射線送達メトリックは、ボリュメトリックな(volumetric)線量蓄積を含み得、グラフィック表示は、線量体積ヒストグラムを含む。その線量体積ヒストグラムは、放射線送達セッション内に所定の時間間隔で更新され得る。グラフィック表示は、計画された線量体積ヒストグラム、および線量体積ヒストグラム値の予め選択された範囲を描いている1またはそれを超える境界を含み得る。放射線送達メトリックは、線量勾配ビルドアップを含み得、グラフィック表示は、患者またはファントムの画像に重ね合わせた線量勾配を含み得る。いくつかのバリエーションにおいて、経時的な計画された放射線送達メトリックは、処置計画の通り、各ガントリー発射位置に対するビーム成形コンポーネントの放射線透過アパーチャのサイズおよび形状を指定する第1のシノグラムを含み得、グラフィック表示は、第1のシノグラム、ならびに放射線送達セッション中にビーム成形コンポーネントセンサーおよびガントリー位置センサーから取得されたデータを用いて、各ガントリー発射位置に対する放射線透過アパーチャのサイズおよび形状を表す第2のシノグラムを含み得る。 One variation of a radiation therapy system for monitoring radiation delivery and generating a graphical representation of radiation delivery includes a rotatable gantry, a gantry position sensor coupled to the rotatable gantry, mounted on the rotatable gantry. , movable to a plurality of gantry firing positions by rotating the gantry; a therapeutic radiation source; a radiation detector positioned in the radiation beam path of the therapeutic radiation source; A beam shaping component, the beam shaping component configured to have a radiation transmissive aperture having a predetermined size and shape, the beam shaping component configured to detect the size and shape of the radiation transmissive aperture. , a beam shaping component sensor, and a display in communication with the controller. The controller may comprise a machine-readable storage medium and processor that stores values of the planned radiation delivery metric over time. The processor generates real-time values of radiation delivery metrics at multiple points in time during the radiation delivery session based on data acquired from the gantry position sensors and/or radiation detectors and/or beam shaping component sensors during the radiation delivery session. configured to calculate, configured to generate a graphical display showing planned and real-time radiation delivery metric values over multiple time points, and configured to output the graphical display to a display can be The machine-readable storage medium may be configured to store a preselected range of values for the planned radiation delivery metric, and the processor may provide a graphical representation of the preselected range of values for the planned radiation delivery metric. can be configured to generate about every 15 minutes or less, e.g., about every 10 minutes or less, about 5 minutes or less, about 1 minute or less, about 10 seconds or less Etc., may be configured to calculate real-time values of radiation delivery metrics, configured to generate graphical representations, and configured to output graphical representations to a display. The controller may be configured to compare a planned radiation delivery metric to a real-time value of the radiation delivery metric, and whether the real-time value is within a preselected range of values of the planned radiation delivery metric. may be configured to generate a graphical display showing whether the The controller may be configured to generate a command signal to stop radiation delivery if the real-time radiation delivery metric is outside a preselected range of the planned radiation delivery metric. Alternatively or additionally, the controller generates a warning and outputs the warning to the display when the real-time radiation delivery metric is near the boundary of a preselected range of the planned radiation delivery metric. can be configured as In some variations, the radiation delivery metric is dose generated using data acquired during the radiation delivery session by gantry position sensors, radiation detectors, beam shaping component sensors, and/or images of the patient or phantom. It can be volumetric. For example, the radiation delivery metric may include isodose contours and the graphical representation may include the isodose contours superimposed on an image of the patient or phantom. The images may include structural images of the patient or phantom acquired during the radiation delivery session, for example the images may be PET and/or CT scans of the patient or phantom acquired during the radiation delivery session. . Alternatively or additionally, the patient or phantom image may include a structural image of the patient or phantom acquired prior to the radiation delivery session. Radiation delivery metrics may include volumetric dose accumulations, and graphical displays include dose volume histograms. The dose volume histogram may be updated at predetermined time intervals within a radiation delivery session. The graphical display may include a planned dose volume histogram and one or more boundaries depicting a preselected range of dose volume histogram values. A radiation delivery metric may include a dose gradient build-up, and a graphical display may include the dose gradient superimposed on an image of the patient or phantom. In some variations, the planned radiation delivery metric over time may include a first sinogram specifying the size and shape of the radiolucent aperture of the beam shaping component for each gantry firing position, as per the treatment plan; The display shows a first sinogram and a second sinogram representing the size and shape of the radiolucent aperture for each gantry firing position using data acquired from the beam shaping component sensors and the gantry position sensors during the radiation delivery session. can contain.
ビーム成形コンポーネントは、複数のリーフを有するダイナミックマルチリーフコリメータ(MLC)を備え得、ビーム成形コンポーネントセンサーは、複数のリーフに連結された複数のリーフ位置センサーおよび/またはリーフモーションセンサーを備え得る。第1のシノグラムは、セグメント化された処置計画フルエンスマップに基づいて各ガントリー発射位置に対する複数のリーフの位置を指定し得、第2のシノグラムは、複数のリーフ位置センサーおよび/またはリーフモーションセンサーならびにガントリー位置センサーからのデータを用いて各ガントリー発射位置に対する複数のリーフの位置を表し得る。上記システムは、必要に応じて、ガントリー開口部内の複数のプラットフォーム位置を経て移動可能な、およびガントリーの回転軸に沿って移動可能な、患者プラットフォームを備えてもよく、グラフィック表示は、必要に応じて、複数のプラットフォーム位置の各々に対する第1のシノグラムと第2のシノグラムとの組み合わせである3Dシノグラムを含んでもよい。いくつかのバリエーションにおいて、グラフィック表示は、疑似カラー発射マップを含み得、ここで、その疑似カラー発射マップ内の各セルの強度は、放射線送達セッション中に取得された、ガントリー位置センサー、放射線検出器ならびにリーフ位置センサーおよび/またはリーフモーションセンサーからのデータを用いて計算された各ガントリー発射位置における各MLCリーフに対する放射線送達の頻度または強度を表し得る。放射線送達メトリックのリアルタイム値は、放射線送達セッション中に取得されたガントリー位置センサー、放射線検出器ならびにリーフ位置センサーおよび/またはリーフモーションセンサーからのデータを用いて生成された放射線量分布であり得、グラフィック表示は、必要に応じて、ガントリーの回転軸に沿ったガントリー開口部内の放射線量分布のシミュレートビューを含み得る。例えば、シミュレートビューは、放射線送達セッション中の放射線源の放射線ビームパスを可視化し得、例えば、シミュレートビューは、ガントリー開口部内の線量蓄積を可視化し得る。 The beam shaping component may comprise a dynamic multi-leaf collimator (MLC) having multiple leaves, and the beam shaping component sensor may comprise multiple leaf position and/or leaf motion sensors coupled to the multiple leaves. A first sinogram may specify multiple leaf positions for each gantry firing position based on the segmented treatment plan fluence map, and a second sinogram may specify multiple leaf position sensors and/or leaf motion sensors and Data from the gantry position sensors may be used to represent multiple leaf positions for each gantry firing position. The system may optionally include a patient platform movable through multiple platform positions within the gantry opening and movable along the axis of rotation of the gantry; may include a 3D sinogram that is a combination of the first sinogram and the second sinogram for each of the plurality of platform positions. In some variations, the graphical display may include a pseudo-color firing map, where the intensity of each cell in the pseudo-color firing map is obtained during a radiation delivery session, gantry position sensor, radiation detector and the frequency or intensity of radiation delivery to each MLC leaf at each gantry firing position calculated using data from leaf position sensors and/or leaf motion sensors. The real-time value of the radiation delivery metric may be a radiation dose distribution generated using data from the gantry position sensor, radiation detectors and leaf position sensors and/or leaf motion sensors acquired during the radiation delivery session, graphically The display may optionally include a simulated view of the radiation dose distribution within the gantry opening along the axis of rotation of the gantry. For example, the simulated view may visualize the radiation beam path of the radiation source during the radiation delivery session, eg the simulated view may visualize dose deposition within the gantry opening.
上記放射線検出器は、電離箱を備え得る。上記回転可能ガントリーは、回転子エレメントを有する回転可能リングおよび固定子エレメントを有する固定フレームを備え得、ガントリー位置センサーは、回転子エレメントおよび固定子エレメントの相対位置を検出するように構成されるエンコーダーを備え得る。いくつかのバリエーションにおいて、ガントリー位置センサーは、傾斜計および/または加速度計を備え得る。
本願明細書は、例えば、以下の項目も提供する。
(項目1)
放射線療法のためのシステムであって、前記システムは、
回転可能ガントリー;
前記回転可能ガントリーに連結されたガントリー位置センサー;
前記回転可能ガントリーに搭載されており、前記ガントリーを回転させることによって複数のガントリー発射位置に移動可能である、治療用放射線源;
前記治療用放射線源の放射線ビームパスに配置された放射線検出器;
前記治療用放射線源の前記放射線ビームパスに配置されたビーム成形コンポーネントであって、前記ビーム成形コンポーネントは、所定のサイズおよび形状を有する放射線透過アパーチャを有するように構成される、ビーム成形コンポーネント;
前記放射線透過アパーチャの前記サイズおよび形状を検出するように構成される、ビーム成形コンポーネントセンサー;および
コントローラと通信しているディスプレイ
を備え、ここで、
前記コントローラは、計画された放射線送達メトリックの値を経時的に記憶する機械可読の記憶媒体、ならびに
放射線送達セッション中に前記ガントリー位置センサーおよび/または放射線検出器および/またはビーム成形コンポーネントセンサーから取得されたデータに基づいて、前記放射線送達セッション中の複数の時点において前記放射線送達メトリックのリアルタイム値を計算するように構成され、
前記計画された放射線送達メトリック値および前記複数の時点にわたる前記リアルタイムの放射線送達メトリック値を示すグラフィック表示を生成するように構成され、および
前記グラフィック表示を前記ディスプレイに出力するように構成されるプロセッサ
を備える、システム。
(項目2)
前記機械可読の記憶媒体が、前記計画された放射線送達メトリックの値の予め選択された範囲をさらに記憶し、前記プロセッサが、計画された放射線送達メトリックの前記予め選択された範囲のグラフィック表示を生成するように構成される、項目1に記載のシステム。
(項目3)
前記プロセッサが、約15分ごとまたはそれ未満ごとに、前記放射線送達メトリックのリアルタイム値を計算するように構成され、前記グラフィック表示を生成するように構成され、および前記グラフィック表示を前記ディスプレイに出力するように構成される、項目1~2のいずれか1項に記載のシステム。
(項目4)
前記コントローラが、前記計画された放射線送達メトリックと前記放射線送達メトリックのリアルタイム値とを比較するように構成され、前記リアルタイム値が前記計画された放射線送達メトリックの値の前記予め選択された範囲内であるか否かを示すグラフィック表示を生成するように構成される、項目2に記載のシステム。
(項目5)
前記リアルタイムの放射線送達メトリックが、前記計画された放射線送達メトリックの前記予め選択された範囲外である場合に、前記コントローラが、放射線送達を停止するためのコマンドシグナルを生成するように構成される、項目4に記載のシステム。
(項目6)
前記リアルタイムの放射線送達メトリックが、前記計画された放射線送達メトリックの前記予め選択された範囲の境界の近傍にあるとき、前記コントローラが、警告を生成し、前記警告を前記ディスプレイに出力するように構成される、項目4に記載のシステム。
(項目7)
前記プロセッサが、約10秒ごとまたはそれ未満ごとに、前記放射線送達メトリックのリアルタイム値を計算するように構成され、前記グラフィック表示を生成するように、および前記グラフィック表示を前記ディスプレイに出力するように構成される、項目3に記載のシステム。
(項目8)
前記放射線送達メトリックが、前記ガントリー位置センサー、前記放射線検出器、前記ビーム成形コンポーネントセンサーおよび/または患者もしくはファントムの画像によって前記放射線送達セッション中に取得されたデータを用いて生成された線量-体積メトリックである、上記の項目のいずれか1項に記載のシステム。
(項目9)
前記放射線送達メトリックが、等線量輪郭を含み、前記グラフィック表示が、前記患者またはファントムの前記画像に重ね合わせた等線量輪郭線を含む、項目8に記載のシステム。
(項目10)
前記画像が、前記放射線送達セッション中に取得された前記患者またはファントムの構造像を含む、項目9に記載のシステム。
(項目11)
前記画像が、前記放射線送達セッション中に取得された前記患者またはファントムのPETスキャンおよび/またはCTスキャンである、項目10に記載のシステム。
(項目12)
前記患者またはファントムの前記画像が、前記放射線送達セッション前に取得された前記患者またはファントムの構造像を含む、項目8に記載のシステム。
(項目13)
前記放射線送達メトリックが、ボリュメトリックな線量蓄積を含み、前記グラフィック表示が、線量体積ヒストグラムを含む、項目8に記載のシステム。
(項目14)
前記線量体積ヒストグラムが、前記放射線送達セッション内に所定の時間間隔で更新される、項目13に記載のシステム。
(項目15)
前記グラフィック表示が、計画された線量体積ヒストグラム、および線量体積ヒストグラム値の予め選択された範囲を描いている1またはそれを超える境界を含む、項目13に記載のシステム。
(項目16)
前記放射線送達メトリックが、線量勾配ビルドアップを含み、前記グラフィック表示が、前記患者またはファントムの前記画像に重ね合わせた線量勾配を含む、項目8に記載のシステム。
(項目17)
経時的な前記計画された放射線送達メトリックが、処置計画の通り、各ガントリー発射位置に対する前記ビーム成形コンポーネントの前記放射線透過アパーチャのサイズおよび形状を指定する第1のシノグラムを含み、
前記グラフィック表示が、前記第1のシノグラム、ならびに前記放射線送達セッション中に前記ビーム成形コンポーネントセンサーおよび前記ガントリー位置センサーから取得されたデータを用いて、各ガントリー発射位置に対する前記放射線透過アパーチャのサイズおよび形状を表す第2のシノグラムを含む、
上記の項目のいずれか1項に記載のシステム。
(項目18)
前記ビーム成形コンポーネントが、複数のリーフを有するダイナミックマルチリーフコリメータ(MLC)を備え、前記ビーム成形コンポーネントセンサーが、前記複数のリーフに連結された複数のリーフ位置センサーおよび/またはリーフモーションセンサーを備え、前記第1のシノグラムが、セグメント化された処置計画フルエンスマップに基づいて各ガントリー発射位置に対して前記複数のリーフの位置を指定し、前記第2のシノグラムが、前記複数のリーフ位置センサーおよび/またはリーフモーションセンサーならびに前記ガントリー位置センサーからのデータを用いて各ガントリー発射位置に対する前記複数のリーフの位置を表す、項目17に記載のシステム。
(項目19)
前記システムが、前記ガントリーの開口部内の複数のプラットフォーム位置を経て移動可能な、および前記ガントリーの回転軸に沿って移動可能な、患者プラットフォームをさらに備え、前記グラフィック表示が、前記複数のプラットフォーム位置の各々に対する前記第1のシノグラムと前記第2のシノグラムとの組み合わせである3Dシノグラムをさらに含む、項目17に記載のシステム。
(項目20)
前記グラフィック表示が、疑似カラー発射マップを含み、ここで、前記疑似カラー発射マップ内の各セルの強度は、前記放射線送達セッション中に取得された、前記ガントリー位置センサー、放射線検出器ならびにリーフ位置センサーおよび/またはリーフモーションセンサーからのデータを用いて計算された、各ガントリー発射位置における各MLCリーフに対する放射線送達の頻度または強度を表す、項目18に記載のシステム。
(項目21)
前記放射線送達メトリックのリアルタイム値が、前記放射線送達セッション中に取得された、前記ガントリー位置センサー、放射線検出器ならびにリーフ位置センサーおよび/またはリーフモーションセンサーからのデータを用いて生成された放射線量分布であり、前記グラフィック表示が、前記ガントリーの回転軸に沿ったガントリー開口部内の前記放射線量分布のシミュレートビューをさらに含む、項目17に記載のシステム。
(項目22)
前記シミュレートビューが、前記放射線送達セッション中の前記放射線源の放射線ビームパスを可視化する、項目21に記載のシステム。
(項目23)
前記シミュレートビューが、前記ガントリー開口部内の線量蓄積を可視化する、項目21に記載のシステム。
(項目24)
前記放射線検出器が、電離箱を備える、上記の項目のいずれか1項に記載のシステム。
(項目25)
前記回転可能ガントリーが、回転子エレメントを有する回転可能リングおよび固定子エレメントを有する固定フレームを備え、前記ガントリー位置センサーが、前記回転子エレメントおよび前記固定子エレメントの相対位置を検出するように構成されるエンコーダーを備える、上記の項目のいずれか1項に記載のシステム。
(項目26)
前記ガントリー位置センサーが、傾斜計および/または加速度計を備える、上記の項目のいずれか1項に記載のシステム。
The radiation detector may comprise an ionization chamber. The rotatable gantry may comprise a rotatable ring with rotor elements and a fixed frame with stator elements, the gantry position sensor being an encoder configured to detect relative positions of the rotor and stator elements. can be provided. In some variations, the gantry position sensors may comprise inclinometers and/or accelerometers.
This specification also provides the following items, for example.
(Item 1)
A system for radiation therapy, said system comprising:
rotatable gantry;
a gantry position sensor coupled to the rotatable gantry;
a therapeutic radiation source mounted on the rotatable gantry and movable to a plurality of gantry firing positions by rotating the gantry;
a radiation detector positioned in the radiation beam path of said therapeutic radiation source;
a beam shaping component disposed in the radiation beam path of the therapeutic radiation source, the beam shaping component configured to have a radiation transmissive aperture having a predetermined size and shape;
a beam shaping component sensor configured to detect the size and shape of the radiolucent aperture; and
A display communicating with the controller
, where
a machine-readable storage medium for storing values of planned radiation delivery metrics over time;
calculating real-time values of the radiation delivery metrics at multiple time points during the radiation delivery session based on data acquired from the gantry position sensors and/or radiation detectors and/or beam shaping component sensors during the radiation delivery session; is configured to
configured to generate a graphical display showing the planned radiation delivery metric value and the real-time radiation delivery metric value over the plurality of time points; and
a processor configured to output said graphical representation to said display
A system comprising:
(Item 2)
The machine-readable storage medium further stores a preselected range of values for the planned radiation delivery metric, and the processor generates a graphical representation of the preselected range for the planned radiation delivery metric. The system of
(Item 3)
The processor is configured to calculate a real-time value of the radiation delivery metric, is configured to generate the graphical representation, and outputs the graphical representation to the display approximately every 15 minutes or less. A system according to any one of items 1-2, configured to:
(Item 4)
The controller is configured to compare the planned radiation delivery metric to a real-time value of the radiation delivery metric, wherein the real-time value is within the preselected range of values of the planned radiation delivery metric. 3. The system of
(Item 5)
wherein the controller is configured to generate a command signal to stop radiation delivery when the real-time radiation delivery metric is outside the preselected range of the planned radiation delivery metric; The system of
(Item 6)
The controller is configured to generate an alert and output the alert to the display when the real-time radiation delivery metric is near a boundary of the preselected range of the planned radiation delivery metric. 5. The system of
(Item 7)
The processor is configured to calculate a real-time value of the radiation delivery metric approximately every 10 seconds or less, and to generate the graphical representation and to output the graphical representation to the display. 4. The system of
(Item 8)
a dose-volume metric wherein the radiation delivery metric is generated using data acquired during the radiation delivery session by the gantry position sensor, the radiation detector, the beam shaping component sensors and/or an image of the patient or phantom A system according to any one of the preceding items, wherein
(Item 9)
9. The system of
(Item 10)
10. The system of
(Item 11)
11. The system of
(Item 12)
9. The system of
(Item 13)
9. The system of
(Item 14)
14. The system of item 13, wherein the dose volume histogram is updated at predetermined time intervals within the radiation delivery session.
(Item 15)
14. The system of item 13, wherein the graphical display includes a planned dose volume histogram and one or more boundaries depicting a preselected range of dose volume histogram values.
(Item 16)
9. The system of
(Item 17)
wherein the planned radiation delivery metric over time includes a first sinogram specifying the size and shape of the radiolucent aperture of the beam shaping component for each gantry firing position as per a treatment plan;
the graphical representation uses the first sinogram and data acquired from the beam shaping component sensors and the gantry position sensors during the radiation delivery session to determine the size and shape of the radiolucent aperture for each gantry firing position; including a second sinogram representing
A system according to any one of the above items.
(Item 18)
said beam shaping component comprising a dynamic multi-leaf collimator (MLC) having a plurality of leaves, said beam shaping component sensor comprising a plurality of leaf position and/or leaf motion sensors coupled to said plurality of leaves; The first sinogram specifies the positions of the plurality of leaves for each gantry firing position based on a segmented treatment planning fluence map, and the second sinogram specifies the positions of the plurality of leaf position sensors and/or Or the system of item 17, wherein data from a leaf motion sensor and the gantry position sensor are used to represent the position of the plurality of leaves for each gantry firing position.
(Item 19)
The system further comprises a patient platform movable through a plurality of platform positions within an opening of the gantry and movable along an axis of rotation of the gantry, the graphical representation of the plurality of platform positions. 18. The system of item 17, further comprising a 3D sinogram that is a combination of the first sinogram and the second sinogram for each.
(Item 20)
The graphical display includes a pseudo-color firing map, wherein the intensity of each cell in the pseudo-color firing map is obtained during the radiation delivery session from the gantry position sensor, the radiation detector and the leaf position sensor. and/or representing frequency or intensity of radiation delivery to each MLC leaf at each gantry firing position calculated using data from leaf motion sensors.
(Item 21)
real-time values of the radiation delivery metrics are radiation dose distributions generated using data from the gantry position sensors, radiation detectors and leaf position sensors and/or leaf motion sensors acquired during the radiation delivery session; 18. The system of item 17, wherein said graphical representation further comprises a simulated view of said radiation dose distribution within a gantry opening along said gantry axis of rotation.
(Item 22)
22. The system of
(Item 23)
22. The system of
(Item 24)
The system of any one of the preceding items, wherein the radiation detector comprises an ionization chamber.
(Item 25)
The rotatable gantry comprises a rotatable ring having a rotor element and a stationary frame having a stator element, the gantry position sensor configured to detect relative positions of the rotor element and the stator element. A system according to any one of the preceding items, comprising an encoder that
(Item 26)
The system according to any one of the preceding items, wherein the gantry position sensor comprises an inclinometer and/or an accelerometer.
詳細な説明
放射線治療処置セッション中に放射線送達をモニターするための方法、および操作者(例えば、臨床医、医学物理学者、診療放射線技師)に提供され得る放射線送達のグラフィック表示を生成するための方法が、本明細書中に記載される。放射線送達のグラフィック表示(「グラフィック」)は、任意の視覚的表示物であり得、それらとしては、送達セッション(例えば、QAセッション、処置セッション)中の1またはそれを超える時点における放射線送達メトリックの値を表す、画像、グラフ、線図、記号、マップ、図、プロット、表、アルファベット文字、数字および/または英数字が挙げられるが、これらに限定されない。計画された放射線送達(すなわち、放射線治療の処置計画の指示通りの放射線送達)を基準とした処置セッション中の放射線送達の進捗が操作者に表示され得、その操作者は、この情報を用いて、放射線送達を続けるか、放射線送達を、計画されたフルエンスおよび/もしくは線量プロファイルにもっと適合させるのを助けるためにある特定のパラメータを調整するか、および/または放射線送達を一時停止もしくは中止するかを決定し得る。いくつかのバリエーションにおいて、放射線送達のグラフィック表示には、送達メトリックのリアルタイム値が、送達メトリックの計画値と視覚的に比べられるような、送達セッション中の特定の時点における放射線送達メトリックの計画値および送達メトリックの実際の値(リアルタイムで取得されたデータに基づいて計算された値)の視覚的表示物が含まれ得る。本明細書中に記載される方法は、患者処置セッションに加えて、処置計画の検証セッションまたは品質保証(QA)セッション中に使用され得、計画された放射線送達と比べたときの、そのセッション中のファントムまたは別の放射線計測デバイスへの放射線送達のグラフィック表示を提供し得る。グラフィックは、放射線照射データが放射線治療システムによって収集されると同時にリアルタイムで更新され得、いくつかのバリエーションでは、15分ごとまたはそれ未満ごと(例えば、約12分ごとまたはそれ未満ごと、約10分ごとまたはそれ未満ごと、約8分ごとまたはそれ未満ごと、約5分ごとまたはそれ未満ごと、約2分ごとまたはそれ未満ごと)に更新され得る。グラフィックは、代替的または追加的に、セッション中の所定の時点またはコントロールポイントにおいて更新され得る。種々のグラフィックは、計画された放射線送達を基準とした放射線送達の現状を示すために使用され得、放射線送達プロファイルを経時的に提供し得る。例えば、グラフィックには、1またはそれを超える、線量-体積プロット、ビーム発射パターン、4D線量画像、ならびに/または線量目標および計画品質の比較が含まれ得る。放射線送達中に操作者に表示されるグラフィックは、処置の時点において操作者によって選択され得、かつ/または臨床ガイドラインもしくは臨床要件に基づいて予め選択され得る。例えば、操作者は、放射線送達中に1つのグラフィックを表示用に選択してもよいし、複数のグラフィックを表示用に選択してもよい。本明細書中に記載されるグラフィックの例は、白黒またはグレースケールで示されるが、これらおよび他のグラフィックがカラー化されてもよい(例えば、8ビットまたは256ビットの色調レベル)ことが理解されるべきである。方法は必要に応じて、許容され得るメトリック値の範囲を計算する工程、その許容され得るメトリック値の範囲を表すグラフィックを生成する工程、およびその許容され得るメトリック値の範囲とそれらのメトリックの実際の値(リアルタイムで取得されたデータに基づいて計算される値)を比較する工程を含んでもよい。
DETAILED DESCRIPTION A method for monitoring radiation delivery during a radiation therapy treatment session and for generating a graphical representation of radiation delivery that can be provided to an operator (e.g., clinician, medical physicist, radiological technologist). are described herein. A graphical display of radiation delivery (“graphic”) can be any visual display that includes a radiation delivery metric at one or more time points during a delivery session (e.g., QA session, treatment session). Representing values include, but are not limited to, images, graphs, diagrams, symbols, maps, diagrams, plots, tables, alphanumeric characters, numbers and/or alphanumeric characters. The progress of radiation delivery during a treatment session relative to planned radiation delivery (i.e., radiation delivery as directed by the radiation therapy treatment plan) can be displayed to the operator, who can use this information to , continue radiation delivery, adjust certain parameters to help better match radiation delivery to the planned fluence and/or dose profile, and/or suspend or discontinue radiation delivery. can be determined. In some variations, the graphical display of radiation delivery includes the planned value of the radiation delivery metric and the planned value of the radiation delivery metric at a particular point in time during the delivery session such that the real-time value of the delivery metric is visually compared to the planned value of the delivery metric. A visual representation of the actual value of the delivery metric (value calculated based on data acquired in real time) may be included. The methods described herein can be used during a treatment plan validation session or a quality assurance (QA) session, in addition to a patient treatment session, during which can provide a graphical representation of radiation delivery to a phantom or another radiation measurement device. The graphics may be updated in real-time as radiation exposure data is collected by the radiation therapy system, and in some variations every 15 minutes or less (e.g., about every 12 minutes or less, about 10 minutes about every 8 minutes or less; about 5 minutes or less; about 2 minutes or less). The graphics may alternatively or additionally be updated at predetermined points or control points during the session. Various graphics can be used to show the current status of radiation delivery relative to planned radiation delivery and can provide a radiation delivery profile over time. For example, the graphics may include one or more dose-volume plots, beam firing patterns, 4D dose images, and/or dose target and plan quality comparisons. The graphics displayed to the operator during radiation delivery may be selected by the operator at the time of treatment and/or pre-selected based on clinical guidelines or requirements. For example, the operator may select one graphic for display during radiation delivery, or may select multiple graphics for display. Although examples of graphics described herein are shown in black and white or grayscale, it is understood that these and other graphics may be colorized (eg, 8-bit or 256-bit tone levels). should. The method optionally includes the steps of calculating a range of permissible metric values, generating a graphic representing the range of permissible metric values, and determining the range of permissible metric values and the actual performance of those metrics. (calculated based on data acquired in real time).
本明細書中に記載される方法は、予想されるまたは計画された放射線送達メトリックを処置セッション前の所定のもしくは予め選択された時点において処置計画に基づいて計算する工程、処置セッションまたはQAセッション中のそれらの所定の時点において、実際のまたは現在の放射線送達メトリックを計算する工程、および予想されるまたは計画された送達と比べたときの実際のまたは現在の放射線送達の進捗を示す1またはそれを超えるグラフィックを生成する工程も含み得る。これらのグラフィックは、放射線送達の正確さおよび/または精度および/または安全性に関する指摘を操作者に提供することを助けることがあり、これは、放射線送達を続けるべきか、それとも一時停止/停止すべきかを決定する際に操作者を助け得る。 The methods described herein include the steps of calculating expected or planned radiation delivery metrics based on the treatment plan at predetermined or preselected time points prior to the treatment session, during the treatment session or during the QA session. calculating an actual or current radiation delivery metric and indicating the progress of actual or current radiation delivery as compared to expected or planned delivery at those predetermined time points of It may also include the step of generating a graphic that exceeds. These graphics may help provide indications to the operator regarding the correctness and/or precision and/or safety of radiation delivery, which indicates whether radiation delivery should continue or be paused/stopped. can assist the operator in determining the
いくつかのバリエーションにおいて、放射線送達の進捗をモニターするための方法は、予想される放射線送達メトリックの値および/または予想される放射線送達プロファイルを処置セッション前に計算する工程を含み得る。例えば、1またはそれを超える標的領域に送達された蓄積線量を反映する放射線送達メトリックが、処置計画に基づいて時間の関数として計算され得、ここで、そのメトリックの値は、処置セッションの終わりに処方線量の全量が送達されるまで、徐々に増加する。放射線送達メトリックの値は、所定のまたは特定の時間間隔またはコントロールポイントにおいて、例えば、処置セッションの継続時間の10分の1ごとに(例えば、処置セッション時間の10%、20%、30%、...70%、80%、90%、100%)、またはn時間間隔(例えば、n=2秒、4秒、5秒、6秒、10秒、30秒、60秒、2分、4分、5分、10分、12分、15分または他の任意の選択された時間間隔)ごとに、計算され得る。予想される放射線送達メトリックの値は、処置計画セッション中に、および/または処置セッション前(すなわち、治療用放射線ビームが処置のために活性化される前)の任意の時点において、計算され得る。いくつかのバリエーションにおいて、方法は、処置が進み得る、許容され得る放射線送達メトリック値の範囲を計算する工程を含み得る。その許容され得る放射線送達メトリック値の範囲は、下界および上界によって定義される「帯域」によって表され得、ここで、その帯域内の(すなわち、上界と下界との間の)メトリック値は、放射線送達の進行が許容され得るメトリック値とみなされ得る。必要に応じて、放射線送達メトリック値の範囲は、処置セッション前に臨床医によって再検討され、承認されてもよい。 In some variations, a method for monitoring radiation delivery progress may include calculating expected radiation delivery metric values and/or expected radiation delivery profiles prior to a treatment session. For example, a radiation delivery metric reflecting cumulative dose delivered to one or more target areas may be calculated as a function of time based on the treatment plan, where the value of the metric is calculated at the end of the treatment session. Gradually increase until the full prescribed dose is delivered. The value of the radiation delivery metric is measured at predetermined or specific time intervals or control points, eg, every tenth of the duration of the treatment session (eg, 10%, 20%, 30%, . ..70%, 80%, 90%, 100%) or n time intervals (e.g., n = 2 seconds, 4 seconds, 5 seconds, 6 seconds, 10 seconds, 30 seconds, 60 seconds, 2 minutes, 4 minutes , 5 minutes, 10 minutes, 12 minutes, 15 minutes or any other selected time interval). Expected radiation delivery metric values may be calculated during the treatment planning session and/or at any time prior to the treatment session (ie, before the therapeutic radiation beam is activated for treatment). In some variations, the method may include calculating a range of acceptable radiation delivery metric values over which treatment may proceed. The range of acceptable radiation delivery metric values may be represented by a "band" defined by lower and upper bounds, where the metric values within the band (i.e., between the upper and lower bounds) are , can be considered a metric value for which the progress of radiation delivery is acceptable. If desired, the range of radiation delivery metric values may be reviewed and approved by the clinician prior to the treatment session.
本明細書中に記載される様々なグラフィックは、放射線送達の独立したグラフィック表示として示されるが、いくつかのバリエーションにおいて、これらのグラフィックのうちの複数が、放射線治療システムのディスプレイに同時に表示するために選択され得、かつ/または操作者によってカスタマイズされ得ることが理解されるべきである。グラフィックの選択および設定は、放射線治療システムのコントローラのメモリーに保存され得、特定の操作者が放射線治療システムにログインするたびに、彼らが以前に選択した設定および好みをグラフィカルユーザーインターフェースが反映するように、その特定の操作者と関連付けられ得る。 Although the various graphics described herein are shown as independent graphical representations of radiation delivery, in some variations multiple of these graphics are displayed simultaneously on the display of the radiation therapy system. and/or may be customized by the operator. Graphical selections and settings may be stored in the memory of the radiation therapy system controller so that each time a particular operator logs into the radiation therapy system, the graphical user interface reflects their previously selected settings and preferences. can be associated with that particular operator.
システム
本明細書中に記載される放射線送達メトリックおよびグラフィック表示は、放射線送達セッション(例えば、処置セッションおよび/またはQAセッション)の進捗をモニターおよび追跡するために、任意の放射線治療システムとともに使用され得る。例えば、本明細書中に記載される任意の放射線送達メトリックおよびグラフィック表示は、回転可能ガントリー(例えば、円形ガントリー、アーム型ガントリー、例えば、Cアームガントリーなど)、ガントリーに搭載された治療用放射線源(例えば、線形加速器またはリニアック)、治療用放射線源の放射線パスに配置された1またはそれを超えるビーム成形コンポーネントまたはビーム成形構造物(例えば、コリメータ、例えば、ダイナミックMLC、バイナリーダイナミックMLCおよび/または1もしくはそれを超えるジョー)、および放射線ビームパスにおける(例えば、治療用放射線源の反対側、すなわち真向かいの)、ガントリーに搭載された放射線検出器を備える放射線治療システムとともに使用され得る。いくつかのバリエーションにおいて、放射線治療システムは、1またはそれを超えるPET検出器および/またはX線検出器(例えば、kV X線検出器)および/またはMRI検出器および/または光学カメラもしくは光学イメージャーを備え得る。図10Aは、放射線治療システムの1つのバリエーションを模式的に示している。放射線治療システム110は、イメージングシステム112、放射線処置システム114、イメージングシステムおよび放射線処置システムと通信しているコントローラ116、ならびに通信用インターフェース118を備え得る。イメージングシステム112および放射線処置システム114は、イメージングシステムによって患者のイメージデータが取得された直後に患者がすぐに放射線処置システム内の適切な位置に置かれ得るように配置され得る。例えば、イメージングシステム112および放射線処置システム114は、同じ施設もしくは建物および/または同じ部屋もしくはバンカーに設置され得、かつ/あるいは同じシャーシまたはガントリーに搭載され得る。放射線処置システム114は、治療用放射線源(例えば、リニアック)、放射線源のビームパス内に設置された1またはそれを超えるビーム成形コンポーネント(例えば、ジョー、MLC)、および放射線源のビームパス内に設置された放射線検出器(例えば、MV検出器)を備え得る。イメージングシステム112は、そのイメージングシステムが、処置セッション中に(すなわち、リアルタイムで)データを取得できる限り、任意の1またはそれを超える撮像法(機能的および/または解剖学的な撮像法を含む)を用いてイメージングデータを取得するように構成されてよい。イメージングシステム112は、1またはそれを超える、PET検出器および/またはX線検出器(例えば、kVまたはMV検出器)および/またはMRIセンサー、超音波検出器などを備え得る。イメージングシステム112からのイメージングデータは、患者の身体および/または1もしくはそれを超える標的領域もしくは関心体積に関する生物学的活性データおよび/または生理学的データおよび/または解剖学的データを提供し得る。いくつかのイメージングシステムは、患者の身体における様々なタイプのトレーサーの取り込みに関するデータを取得し得る。例えば、患者にトレーサー(例えば、PETトレーサー、X線造影剤など)を注入し得、イメージングシステムが、そのトレーサーの蓄積に関するデータを取得し得る(定性的および/または定量的に)。トレーサーの蓄積の位置、トレーサーの蓄積体積のサイズおよび形状、ならびにトレーサーの動態は、患者の様々な生物学的活性レベルおよび/または生理現象に関する指摘を提供し得る。いくつかのイメージングシステムは、放射線処置システムの活性化状態を問わず(例えば、治療用放射線源が活性化されているかを問わず)、任意の時点(および/または所望であり得るようなコントロールポイントおよび/またはチェックポイント)においてイメージングデータを取得するように構成され得るが、放射線処置システムの治療用放射線源が活性化されていないとき(例えば、放射線ビームを発射していないとき)は、他のイメージングシステムが、イメージングデータを取得するように構成され得る。例えば、1またはそれを超えるX線検出器を備えるイメージングシステムは、治療用放射線のビームパルス間に、および/または治療用放射線源が活性化されていないときに(高エネルギー放射線源からのX線散乱の影響に起因して)、イメージングデータを取得し得る。1またはそれを超えるPET検出器を備えるイメージングシステムは、治療用放射線のビームパルス間に、および/または最初の治療用放射線パルスの前の処置セッションの開始時に、および/または最後の治療用放射線パルスの後の処置セッションの終了時に、PETデータを取得し得る。対照的に、1またはそれを超えるMRIセンサーを備えるイメージングシステムは、治療用放射線源が活性化されているかおよび/または放射線ビームパルスを適用しているかを問わず、イメージングデータを取得し得る。放射線処置システムは、治療用放射線源(例えば、リニアックなどのMV X線放射線源、コバルト-60源などの放射性同位体源、またはサイクロトロンなどの粒子ビーム源)、治療用放射線ビームを配向または制限するように構成され得る1またはそれを超えるビーム成形コンポーネント、ならびに治療用放射線源およびビーム成形コンポーネントを患者領域周辺の様々な発射位置に迅速に移動させるように構成されるモーションシステムを備え得る。治療用放射線源の他の例としては、高エネルギー光子、放射性同位体(例えば、イリジウムまたはコバルト-60)によって生成される放射線または粒子、高エネルギー電子、プロトンビーム、中性子ビームおよび重イオンビームが挙げられ得るが、これらに限定されない。1つのバリエーションにおいて、放射線処置システムは、MV X線放射線源、およびその放射線源のビームパスに配置されたダイナミックマルチリーフコリメータを備え得、その両方が、可動ガントリーを備えるモーションシステムに搭載されている。そのガントリーは、回転可能ガントリー(例えば、円形ガントリーまたはLアームもしくはCアームガントリー)、ならびに/または患者領域の周りを移動可能および/もしくは回転可能な多関節ロボットアームであり得る。そのガントリーは、必要に応じて、連続回転可能ガントリーであり得る。モーションシステムは、放射線源およびビーム成形コンポーネントをある発射位置から別の発射位置に、約10秒未満、例えば、約5秒未満、約3秒未満、約2秒未満、約1秒未満、約0.5秒未満、約0.25秒未満などで移動させるように構成され得る。
Systems The radiation delivery metrics and graphical displays described herein can be used with any radiation therapy system to monitor and track the progress of radiation delivery sessions (e.g., treatment sessions and/or QA sessions). . For example, any of the radiation delivery metrics and graphical displays described herein may be used for rotatable gantry (eg, circular gantry, arm gantry, eg, C-arm gantry, etc.), gantry-mounted therapeutic radiation source (e.g. linear accelerator or linac), one or more beam shaping components or structures (e.g. collimator, e.g. dynamic MLC, binary dynamic MLC and/or one or more jaws), and in the radiation beam path (eg, opposite or directly across from the therapeutic radiation source). In some variations, the radiotherapy system includes one or more PET detectors and/or X-ray detectors (e.g., kV X-ray detectors) and/or MRI detectors and/or optical cameras or imagers. can be provided. FIG. 10A schematically shows one variation of a radiotherapy system.
ダイナミックマルチリーフコリメータは、複数のリーフを備えていることがあり、各リーフは、そのリーフをコントローラが指定する位置に移動させるリーフ駆動機構に取り付けられている。ダイナミックマルチリーフコリメータは、バイナリーマルチリーフコリメータまたは2Dマルチリーフコリメータであり得る。他のビーム成形コンポーネントまたはコリメータ、例えば、円形の場を生成するラジアルコリメータも使用してよい。リーフ駆動機構は、放射線源が次のビームパルスを発射する前に、ある位置から別の位置へリーフを迅速に移動させるように構成され得る。例えば、バイナリーマルチリーフコリメータにおいて、リーフ駆動機構は、リーフを閉鎖位置から開放位置に(およびその逆に)約5秒未満、例えば、約3秒未満、約2秒未満、約1秒未満、約0.5秒未満、約0.75秒未満、約0.5秒未満、約0.3秒未満、約0.25秒未満、約0.2秒未満、約0.1秒未満などで動かすように構成され得る。高速移動モーションシステムと高速移行ダイナミックマルチリーフコリメータとを組み合わせることは、イメージングデータの取得と、そのイメージングデータから抽出された生物学的活性データに基づいた放射線ビームパルスの適用との間の潜時を短くする助けになり得る。特定の発射位置(例えば、治療用放射線源が放射線ビームを発射するときに位置し得る患者領域の周辺の位置)におけるリーフの位置は、処置計画に基づいて決定され得る。 A dynamic multi-leaf collimator may have multiple leaves, each leaf attached to a leaf drive mechanism that moves the leaf to a position specified by a controller. A dynamic multileaf collimator can be a binary multileaf collimator or a 2D multileaf collimator. Other beam shaping components or collimators may also be used, for example radial collimators that produce circular fields. The leaf drive mechanism may be configured to rapidly move the leaves from one position to another position before the radiation source fires the next beam pulse. For example, in a binary multi-leaf collimator, the leaf drive mechanism moves the leaves from the closed position to the open position (and vice versa) in less than about 5 seconds, e.g., less than about 3 seconds, less than about 2 seconds, less than about 1 second, about Move in less than 0.5 seconds, less than about 0.75 seconds, less than about 0.5 seconds, less than about 0.3 seconds, less than about 0.25 seconds, less than about 0.2 seconds, less than about 0.1 seconds, etc. can be configured as Combining a fast translation motion system with a fast translation dynamic multi-leaf collimator reduces the latency between acquisition of imaging data and application of radiation beam pulses based on biological activity data extracted from the imaging data. It can help you shorten. The positions of the leaves at specific firing locations (eg, locations around the patient region where the therapeutic radiation source may emit the radiation beam) may be determined based on the treatment plan.
いくつかのバリエーションにおいて、コントローラのプロセッサは、放射線ビームが、処置計画フルエンスマップに従う放射線照射の形状を有するように、各発射位置において各リーフの移動および配置を駆動するマルチリーフコリメータのコマンドセットを生成し得る。処置計画フルエンスマップは、患者の身体の各部、特に、1またはそれを超える標的領域または関心体積および/またはOARに放射される放射線の量(すなわち、放射線フルエンスまたは放射線エネルギーフルエンス)を指定し得る。フルエンスマップは、1またはそれを超えるリスク臓器またはOAR(例えば、放射線照射回避体積(irradiation-avoidance volumes))に適用される放射線の量を制限しつつ、選択された線量/処方線量の放射線が標的領域または関心体積に適用されるように、治療用放射線源を適切な位置に置くためならびに生成された放射線ビームの強度および形状を制御するために放射線治療システムによって使用され得るビームレットの強度および発射位置(例えば、発射角度)のセットを含み得る。フルエンスマップを放射線治療システムコンポーネントのコメントセットまたは命令セットに変換する方法は、処置計画フルエンスマップのセグメント化と称され得る。セグメント化されたフルエンスマップは、患者の周りの各ガントリー発射位置(例えば、ガントリー発射角度)における治療用放射線源の放射線放射(例えば、放射線発射強度レベル、適用された放射線の振幅、ならびに/または放射線パルスのデューティサイクルおよび/もしくは周波数および/もしくは幅など)、ならびに各発射位置に対応するMLCリーフ配置、および/または治療用放射線ビーム面を基準とした患者プラットフォーム位置に対するコマンドまたは命令を含み得る。コントローラ116は、イメージングシステム112および放射線処置システム114と通信していることがあり、その結果、取得されたイメージングデータおよび/または任意のシステムセンサーデータが合わさって、放射線送達の進捗を表す放射線送達メトリック値および/またはグラフィックが生成され得る。コントローラ116は、1またはそれを超えるプロセッサ(例えば、中央処理装置)および1またはそれを超えるメモリーを備え得る。コントローラのメモリーは、1またはそれを超える処置計画に関するデータ、処置計画パラメータ(例えば、フルエンスマップ、計画品質インデックス、線量体積ヒストグラムなど)、事前に収集されたイメージングデータおよび/またはセンサーデータ(例えば、診断用イメージングセッションからのデータ)、リアルタイムのイメージングデータおよび/またはセンサーデータ(例えば、処置セッション当日、処置時に取得されたデータ)、放射線処置システムのコマンドおよび命令、ユーザーによって実行されるプログラムなどを保存し得る。コントローラ116は、イメージングデータおよびイメージングコンポーネントフィードバック(例えば、画像検出器またはイメージセンサーの現状、較正データなど)をイメージングシステム112から受信し得、また、イメージングコマンド(例えば、任意のX線源の活性化および/または画像検出器もしくはイメージセンサーの活性化、検出器のゲインレベルおよび/または感度レベルの調整、患者および/または放射線処置システムを基準としたイメージングシステムのポジショニングなど)をイメージングシステムに伝送し得る。コントローラ116は、放射線処置システムの様々なコンポーネントからデータを受信し得、コマンドを放射線処置システムに伝送し得る。例えば、放射線処置システムは、モーションシステム(例えば、ガントリー)、そのモーションシステムに搭載された治療用放射線源(例えば、リニアック)およびビーム成形コンポーネント(例えば、ダイナミックMLC)、ならびにモーションシステムに搭載された放射線検出器(例えば、MV検出器)を備え得る。コントローラ116は、位置データおよび/または速度データをモーションシステムから、位置データおよび/または放射線ビーム生成データを放射線源から、リーフ配置データをビーム成形コンポーネントから、ならびに/またはより一般的には、動作状況、較正データ、エラー表示物などを、受信し得る。コントローラ116は、MLCコマンド、ガントリーの回転/運動コマンド、リニアックパルス命令などを伝送し得、ここで、これらのコマンドおよび命令は、処置計画、事前に取得された画像、リアルタイムで取得されたイメージングデータおよび/もしくはセンサーデータ、患者の生物学的活性データおよび/もしくは生理学的データ、ならびに/または放射線治療システムの状況の組み合わせに基づいて生成され得る。コントローラ116は、本明細書中に記載される任意のグラフィック表示(例えば、グラフィカルユーザーインターフェース)を操作者に投影し得るディスプレイと通信用インターフェース108を介して通信し得る。グラフィカルユーザーインターフェースは、操作者が所定の機械命令セットおよびパラメータセットを入力できるように、操作者選択用のコマンドメニューならびにプログラミングインターフェースも提供し得る。例えば、ディスプレイは、取得されたイメージングデータおよび/またはセンサーデータに基づく放射線送達メトリックおよび/またはグラフィックの現実の値と比べたときの、予想される放射線送達メトリックの値および/または予想される放射線送達プロファイルのグラフィック表示を表す1またはそれを超える視覚的表示物を提示し得る。
In some variations, the processor of the controller generates a multi-leaf collimator command set that drives the movement and positioning of each leaf at each firing position such that the radiation beam has a radiation delivery shape that follows the treatment plan fluence map. can. A treatment planning fluence map may specify the amount of radiation (ie, radiation fluence or radiation energy fluence) delivered to each part of the patient's body, particularly one or more target regions or volumes of interest and/or OARs. A fluence map targets a selected/prescribed dose of radiation while limiting the amount of radiation applied to one or more at-risk organs or OARs (e.g., irradiation-avoidance volumes). The intensity and firing of beamlets that can be used by a radiation therapy system to position a therapeutic radiation source and to control the intensity and shape of the generated radiation beam as applied to a region or volume of interest. A set of positions (eg, launch angles) may be included. The method of converting a fluence map into a comment or instruction set of radiation therapy system components may be referred to as segmenting the treatment plan fluence map. A segmented fluence map can be used to measure the radiation emissions (e.g., radiation intensity levels, applied radiation amplitudes, and/or radiation pulse duty cycle and/or frequency and/or width, etc.), and MLC leaf placement corresponding to each firing position, and/or commands or instructions for the patient platform position relative to the plane of the therapeutic radiation beam.
図10Bは、放射線治療システムの1つのバリエーションを示している。放射線治療システム120は、1またはそれを超えるPET検出器124を備えるイメージングシステム122、治療用放射線源128(例えば、リニアックなどのMV X線源)、ダイナミックMLCまたはDMLC130およびMV検出器132を備える放射線処置システム126を備え得る。このシステム120は、イメージングシステムおよび放射線処置システム126および通信用インターフェース136と通信しているコントローラ134も備え得る。放射線放射アセンブリが、回転可能ガントリーなどの可動ガントリーに搭載され得る。いくつかのバリエーションにおいて、回転可能ガントリーは、連続的に回転可能な円形ガントリーであり得る。必要に応じて、イメージングシステム122も、可動ガントリーに搭載され得る。1またはそれを超えるPET検出器124によって取得されたPETデータ(例えば、1またはそれを超える個々の陽電子消滅放射パス)は、コントローラ134に伝送され得、そのデータは、コントローラのメモリーに保存され得、かつ/または本明細書中に記載される方法のいずれかに従って処理され得る。コントローラ134は、PETデータから生物学的活性データおよび/または生理学的データを計算および/または抽出し得、それらは、必要に応じて臨床医に提示され得る。放射線処置システム126は、コントローラ134からのコマンドに従って、治療用放射線源128を移動させ得、DMLCのリーフ配置を変更し得、MV検出器からデータを取得し得る。いくつかのバリエーションにおいて、ガントリーは、約40RPMまたはそれを超えて、例えば、約60RPM、約70RPMで回転するように構成され得る。DMLC130は、ガントリーが放射線放射アセンブリをある発射位置から別の発射位置に移動させている時間間隔内にリーフ位置を変更するリーフ駆動機構を備え得る。例えば、DMLC130は、完全に閉じた位置から完全に開いた位置まで約10ms未満でリーフを移動させるように構成されるリーフ駆動機構を備え得る。いくつかのバリエーションにおいて、n個の発射位置を有する周波数fで回転する円形ガントリーは、0.7*(f/n)秒未満のDMLC移行時間を有し得る。例えば、n=100発射位置を有する約1Hzという周波数fで回転する円形ガントリーは、約7msというDMLC移行時間を有し得る。DMLCは、空気圧シリンダーおよび1またはそれを超えるバネを備えるリーフ駆動機構を備え得、それらは、各発射位置の間に上記時間間隔でリーフ位置を変更させるのに十分な推進力を提供し得る。マルチリーフコリメータのリーフ駆動機構ならびに放射線治療システムのさらなる詳細および例は、2016年6月10日出願の米国特許出願第15/179,823号および2017年11月15日出願の米国特許出願第15/814,222号(これらは、その全体が参照により本明細書に援用される)に提供されている。
FIG. 10B shows one variation of the radiotherapy system.
1またはそれを超えるPET検出器および/またはX線検出器(例えば、kVまたはMV検出器)および/またはMRIセンサー、超音波検出器などに加えて、放射線治療システムは、上記放射線治療コンポーネントのうちの1またはそれを超えるものに関連付けられた複数のセンサーを備え得る。それらのセンサーによって取得されたデータは、放射線送達の進捗をモニターするために、患者に向けられたリニアックによって放射されたフルエンス(すなわち、放射線フルエンスおよび/または放射線エネルギーフルエンス)、および/または処置セッション中に標的領域もしくは関心体積に送達された線量を計算するために使用され得る。放射されたフルエンスおよび/または送達された線量は、1またはそれを超えるグラフィックによって表され得、かつ/または他の視覚的しるし(例えば、表、チャート、メトリック値またはスコアなどを含む)が、操作者に対してモニターまたはスクリーン上に表示され得る。処置セッション中(および/または処置セッションの直後、すなわち、治療用放射線源がオフになったとき)に、放射線治療システムのコントローラは、そのシステムにおける種々のセンサーからデータを取得し得、放射線送達メトリックの値をリアルタイムで計算し得る。放射線送達メトリックの値は、処置セッション時間にわたって、例えば、所定または特定の時間間隔、時点またはコントロールポイントにおいて、計算され得、保存され得る。コントローラは、1またはそれを超える放射線検出器(例えば、治療用放射線源のビームパス内に配置された放射線検出器、リニアックの反対側または向かいに配置されたMV検出器)、MLCの位置センサーおよび/もしくは動作センサー、治療リングに配置されたPET検出器(生物学に基づく放射線治療の処置用)、治療用放射線源(例えば、リニアック)センシング検出器(例えば、パルス周波数、エネルギー、デューティサイクル、パルス計数などを検出するためのもの)、ドーズチャンバーもしくは電離箱など、ガントリーもしくはモーションシステムの位置センサー、および/または放射線治療システムにおよび/もしくは処置バンカー内に配置された任意の光学カメラからデータを取得し得る。取得されたデータは、1またはそれを超える放射線送達メトリックのリアルタイム値を計算するために使用され得、リアルタイムの放射線送達メトリックのグラフィック表示が、操作者に表示され得る。いくつかのバリエーションにおいて、リアルタイムの放射線送達メトリックは、処置セッション前に(例えば、上に記載されたように、処置計画セッション中に)計算された予想される放射線送達メトリックの値に重ね合わせられ得る。解剖学的または生物学的に妥当な放射線送達メトリックの場合、リアルタイムの放射線送達メトリックは、処置セッション前または処置セッション中に収集された解剖学的データまたは生物学的データ、例えば、CT画像および/またはMRI画像に重ね合わせられ得る。放射線送達メトリックのリアルタイム値は、処置セッションにわたる時間の関数として表示され得、それにより、操作者が、処置中のメトリックの変化をモニターすること、ならびにメトリックのリアルタイム値をメトリックの期待値と比較することが可能になり得る。これは、放射線送達が、処置セッションの終わりまでに、処置計画の指示通りに累積放射線量の送達が「順調に進んでいる」かを操作者が判定することも助け得る。 In addition to one or more PET detectors and/or X-ray detectors (e.g., kV or MV detectors) and/or MRI sensors, ultrasound detectors, etc., the radiotherapy system includes among the above radiotherapy components: may comprise a plurality of sensors associated with one or more of Data acquired by those sensors are used to monitor the progress of radiation delivery, the fluence emitted by the linac directed at the patient (i.e., radiation fluence and/or radiation energy fluence), and/or during the treatment session. can be used to calculate the dose delivered to the target area or volume of interest. The emitted fluence and/or the delivered dose may be represented by one or more graphics and/or other visual indicia (including, for example, tables, charts, metric values or scores, etc.) to indicate the operational can be displayed to the person on a monitor or screen. During a treatment session (and/or immediately after a treatment session, i.e., when the therapeutic radiation source is turned off), the controller of the radiation therapy system may acquire data from various sensors in the system to determine radiation delivery metrics. can be calculated in real time. Values of radiation delivery metrics may be calculated and stored over the course of a treatment session, eg, at predetermined or specific time intervals, time points or control points. The controller controls one or more radiation detectors (e.g., radiation detectors positioned in the beam path of the therapeutic radiation source, MV detectors positioned opposite or opposite the linac), MLC position sensors and/or or a motion sensor, a PET detector placed in a therapy ring (for biologically-based radiation therapy treatments), a therapeutic radiation source (e.g., linac) sensing detector (e.g., pulse frequency, energy, duty cycle, pulse count ), position sensors of gantry or motion systems, such as dose chambers or ionization chambers, and/or any optical cameras placed on the radiation therapy system and/or within the treatment bunker. obtain. The acquired data can be used to calculate real-time values of one or more radiation delivery metrics, and a graphical representation of the real-time radiation delivery metrics can be displayed to the operator. In some variations, the real-time radiation delivery metric may be superimposed on the calculated expected radiation delivery metric value prior to the treatment session (e.g., during the treatment planning session, as described above). . For anatomically or biologically relevant radiation delivery metrics, the real-time radiation delivery metrics are anatomical or biological data acquired prior to or during a treatment session, e.g., CT images and/or Or it can be superimposed on the MRI image. Real-time values of radiation delivery metrics may be displayed as a function of time over a treatment session, allowing the operator to monitor changes in the metric during treatment and compare real-time values of the metric to expected values of the metric. can become possible. This may also help the operator determine if the radiation delivery is "on track" by the end of the treatment session, as directed by the treatment plan, in delivering the cumulative radiation dose.
いくつかのバリエーションにおいて、放射線治療システムのコントローラは、複数のセンサーからデータを蓄積し、そのセンサーデータを使用して、患者に向けられたリニアックによって放射されたフルエンス(すなわち、放射線フルエンスおよび/または放射線エネルギーフルエンス)を計算するおよび/または患者に送達された線量を計算するように構成されるプロセッサを備え得る。例えば、放射線治療システムのイメージングシステム(回転可能ガントリーまたは回転可能ガントリーに隣接する第2のガントリーに連結され得る)は、1またはそれを超える光学カメラ、センサー/イメージャーを備え得、かつ/またはCTイメージングシステム(例えば、kV放射線源およびそのkV放射線源の向かいに配置されたkV検出器を有する)、MRIイメージングシステム(MRIセンサーを含む)および/または超音波システム(超音波振動子を含む)を備え得る。いくつかの放射線治療システムは、1またはそれを超える一連のPET検出器も備え得る。それらのPET検出器は、リニアックが搭載されている回転可能ガントリー、または回転可能であってもそうでなくてもよい別個のガントリーに配置され得る。治療用放射線源(例えば、リニアック)は、放射線治療システムのコントローラからコマンド/命令を受信するその治療用放射線源自体のコントローラ、および/または電離箱(すなわち、イオンチャンバーまたはドーズチャンバー)、および/または放射線ビームパス内に配置された任意の放射線センシング検出器を備え得る。リニアックによって放射された放射線の特徴(例えば、パルス周波数、パルス幅、パルス振幅またはエネルギー強度レベルの変動、デューティサイクル、パルス数など)は、リニアックコントローラおよび/またはリニアック線量モニターおよび/または電離箱および/またはMV検出器および/またはリニアックのビームパスに(例えば、リニアックの真向かいまたはリニアックビーム内のリニアックの正面に)配置された他の任意の放射線検出器から入手され得る。放射線治療システムは、システム全体に配置されたモーションセンサーおよび/または位置センサーを備え得、それらは、ガントリーの動きおよび/または位置(それらから、ガントリーに搭載された治療用放射線源の動きおよび/または位置が計算され得る)、MLCのリーフの動きおよび/または位置、ジョー(および/または他の任意のビーム成形コンポーネント)の動きおよび/または位置を検出するように構成され得、かつ本明細書中に記載される放射線送達メトリックおよびグラフィックを計算するためにこのデータをコントローラに伝送し得る。ガントリーの動きおよび/または位置は、モーションセンサーおよび/もしくは位置センサー、ならびに/またはデジタル傾斜計および/もしくはデジタル加速度計、ならびに/またはガントリーの回転可能リング(例えば、ドラム)における1もしくはそれを超える回転子エレメントおよびガントリーの固定フレームにおける1もしくはそれを超える固定子エレメントの相対位置を検出する1もしくはそれを超えるエンコーダーによって検出され得る。放射線治療システムは、リニアックの放射線ビームパスに配置された1セットまたはそれを超えるセットのジョーを備え得、ここで、それらのジョーの間のアパーチャのサイズおよび形状(例えば、ジョーの境界または縁の間の空間および/または距離)は、それらのジョーと関連付けられた位置センサーおよび/またはモーションセンサーに基づいて測定または計測され得る。代替的または追加的に、アパーチャのサイズおよび形状ならびに/またはジョーの位置は、所定の配置に固定され得るかまたは据えられ得、その配置は、放射線治療システムのコントローラのメモリーに保存され得る。放射線治療システムのダイナミックマルチリーフコリメータ(MLC)も、1またはそれを超える位置センサーおよび/またはモーションセンサーを備え得、それらのセンサーからのデータは、MLC開口のサイズおよび形状を決定するためにコントローラによって使用され得る。MLCの各リーフは、対応する位置センサーおよび/またはモーションセンサーを有し得る。ダイナミックバイナリーMLCを備えるシステムでは、位置センサーおよび/またはモーションセンサーからのデータは、システムコントローラに伝送され得、そのシステムコントローラは、全MLCリーフの位置データおよび/またはモーションデータを集めて、MLC開口の全体的なサイズおよび形状を決定し得る。様々なタイプの放射線治療システムの例および詳細は、2017年11月15日出願の米国特許出願第15/814,222号および2018年3月29日出願のPCT出願番号PCT/US2018/025252(これらの開示は、その全体が参照により本明細書に援用される)に記載されている。 In some variations, the radiation therapy system controller accumulates data from multiple sensors and uses the sensor data to determine the fluence emitted by the linac directed at the patient (i.e., radiation fluence and/or radiation a processor configured to calculate the energy fluence) and/or calculate the dose delivered to the patient. For example, an imaging system of a radiotherapy system (which may be coupled to a rotatable gantry or a second gantry adjacent to the rotatable gantry) may comprise one or more optical cameras, sensors/imagers, and/or CT an imaging system (e.g., having a kV radiation source and a kV detector positioned across from the kV radiation source), an MRI imaging system (including an MRI sensor) and/or an ultrasound system (including an ultrasound transducer); be prepared. Some radiotherapy systems may also include a series of one or more PET detectors. These PET detectors can be located on a rotatable gantry on which the linac is mounted, or a separate gantry that may or may not be rotatable. The therapeutic radiation source (e.g., a linac) receives commands/instructions from the controller of the radiation therapy system; Any radiation sensing detector positioned within the radiation beam path may be provided. The characteristics of the radiation emitted by the linac (e.g., pulse frequency, pulse width, pulse amplitude or energy intensity level variations, duty cycle, number of pulses, etc.) are controlled by the linac controller and/or the linac dose monitor and/or the ionization chamber and/or or from the MV detector and/or any other radiation detector placed in the linac's beam path (eg, directly opposite the linac or in front of the linac within the linac beam). Radiation therapy systems may include motion and/or position sensors located throughout the system that detect movement and/or position of the gantry (thereby motion and/or position of the therapeutic radiation source mounted on the gantry). position may be calculated), MLC leaf motion and/or position, jaw (and/or any other beam shaping component) motion and/or position, and may be configured to detect motion and/or position of the jaws (and/or any other beam shaping component), and described herein This data may be transmitted to the controller for calculating radiation delivery metrics and graphics as described in . Gantry motion and/or position may be measured by motion and/or position sensors and/or digital inclinometers and/or digital accelerometers and/or one or more rotations in a rotatable ring (e.g. drum) of the gantry. It can be detected by one or more encoders that detect the relative positions of the child elements and the one or more stator elements in the stationary frame of the gantry. The radiation therapy system may comprise one or more sets of jaws positioned in the radiation beam path of the linac, where the size and shape of the apertures between those jaws (e.g., between the borders or edges of the jaws). space and/or distance) can be measured or metered based on position and/or motion sensors associated with those jaws. Alternatively or additionally, the size and shape of the aperture and/or the position of the jaws may be fixed or set in a predetermined arrangement, which arrangement may be stored in the memory of the controller of the radiation therapy system. A dynamic multi-leaf collimator (MLC) of a radiotherapy system may also include one or more position and/or motion sensors, data from those sensors being used by the controller to determine the size and shape of the MLC aperture. can be used. Each leaf of the MLC may have a corresponding position sensor and/or motion sensor. In systems with dynamic binary MLCs, data from position and/or motion sensors can be transmitted to a system controller, which collects position and/or motion data for all MLC leaves to determine the MLC aperture. The overall size and shape can be determined. Examples and details of various types of radiotherapy systems can be found in U.S. patent application Ser. No. 15/814,222, filed Nov. 15, 2017 and PCT application no. is incorporated herein by reference in its entirety).
放射線治療システムのコントローラは、1またはそれを超える上に記載されたセンサーまたは検出器からデータを受信し、そのセンサーまたは検出器のデータを用いて、患者に放射された放射線フルエンス(すなわち、放射線エネルギーフルエンス)および/または患者に送達された線量を計算するように構成され得る。例えば、患者に放射された放射線フルエンスは、リニアックコントローラおよび/または電離箱および/またはリニアックの真向かいに配置されたMV検出器、ジョーに関連付けられた位置センサーおよび/またはモーションセンサー、MLCのリーフに関連付けられた位置センサーおよび/またはモーションセンサーからのデータを用いて計算され得る。必要に応じて、放射線フルエンスは、イメージングシステムからのイメージングデータ(例えば、PET検出器、X線検出器、MRI検出器、超音波振動子および/または光学カメラもしくは光学イメージャーのうちの1またはそれを超えるものからのイメージングデータおよび/または画像)を用いることによっても計算され得る。患者に送達された放射線量は、例えば、患者を表す密度マップまたは電子密度マップを用いて患者における入射エネルギーフルエンスを追跡することによって計算され得る、患者におけるビームエネルギー沈着カーネル(ビームコミッショニング中の治療ビームについてモデル化されたもの)および単位質量あたりに放出される総エネルギー(Total Energy Released per Unit Mass)(TERMA)を利用する畳み込み重ね合わせ(convolution superposition)線量計算アルゴリズムを用いて計算され得る。エネルギーフルエンスは、ビームエネルギーとビームフルエンスとの積として計算され得る。密度マップまたは電子密度マップは、イメージングシステムからの解剖学的なイメージングデータ(例えば、PET検出器、X線検出器、MRI検出器、超音波振動子および/または光学カメラもしくは光学イメージャーのうちの1もしくはそれを超えるものからのイメージングデータおよび/もしくは画像、ならびに/または処置計画のために使用された1もしくはそれを超える画像)、ならびに/またはガントリーと関連付けられた位置センサーおよび/もしくはモーションセンサーからのデータ、ならびに/またはリニアックコントローラおよび/もしくは電離箱からのデータ、ならびに/またはリニアックの真向かいに配置されたMV検出器からのデータ、ならびに/またはジョーに関連付けられた位置センサーおよび/またはモーションセンサーからのデータ、ならびに/またはMLCのリーフに関連付けられた位置センサーおよび/またはモーションセンサーからのデータによって計算され得る。必要に応じて、患者に送達された放射線量は、線量計算マトリックス(すなわち、患者の中の予め選択された領域セットまたはボクセルセットにおける線量値に放射線フルエンス値をマッピングするマトリックス)、イメージングシステムからのイメージングデータ、および処置計画中に生成された放射線発射マトリックス(すなわち、イメージングデータからフルエンスマップへの変換を指定するマトリックス)を用いて計算され得る。フルエンスおよび/または線量レベルの計算値は、コントローラのメモリーに保存され得、生成されたグラフィックは、本明細書中に記載されるような、フルエンスおよび/または線量の累積値、および/またはフルエンスおよび/または線量のリアルタイム値(例えば、瞬時値の近傍にある値)を反映し得る。 A controller of a radiotherapy system receives data from one or more of the sensors or detectors described above and uses the sensor or detector data to determine the radiation fluence (i.e., radiation energy fluence) and/or dose delivered to the patient. For example, the radiation fluence emitted to the patient is measured by the linac controller and/or the ionization chamber and/or the MV detector located across from the linac, the position and/or motion sensors associated with the jaws, the leaves of the MLC. may be calculated using data from position sensors and/or motion sensors that are detected. Optionally, the radiation fluence is captured by imaging data from an imaging system (e.g., one or more of a PET detector, an X-ray detector, an MRI detector, an ultrasound transducer and/or an optical camera or imager). can also be calculated by using imaging data and/or images from more than . The radiation dose delivered to the patient can be calculated, for example, by tracking the incident energy fluence at the patient using a density map or electron density map representing the patient, the beam energy deposition kernel at the patient (treatment beam ) and the Total Energy Released per Unit Mass (TERMA) using a convolution superposition dose calculation algorithm. Energy fluence can be calculated as the product of beam energy and beam fluence. Density maps or electron density maps can be obtained from anatomical imaging data from imaging systems (e.g., PET detectors, X-ray detectors, MRI detectors, ultrasound transducers and/or optical cameras or optical imagers). imaging data and/or images from one or more and/or one or more images used for treatment planning) and/or from position and/or motion sensors associated with the gantry and/or data from the linac controller and/or the ionization chamber and/or data from the MV detector located across from the linac and/or position and/or motion sensors associated with the jaws and/or data from position and/or motion sensors associated with the leaves of the MLC. Optionally, the dose of radiation delivered to the patient is calculated using a dose calculation matrix (i.e., a matrix that maps radiation fluence values to dose values in a preselected set of regions or voxels within the patient), from the imaging system. It can be calculated using the imaging data and a radiation firing matrix generated during treatment planning (ie, a matrix specifying the transformation from imaging data to fluence maps). Calculated values of fluence and/or dose levels may be stored in the memory of the controller, and generated graphics may display cumulative values of fluence and/or dose, and/or fluence and/or dose levels, as described herein. /or may reflect real-time values of dose (eg, values in the vicinity of instantaneous values).
方法
いくつかのバリエーションにおいて、許容され得る放射線送達メトリック値の範囲は、処置計画のパラメータに基づいて1またはそれを超える送達メトリックに対して計算され得る。処置計画には、標的領域および/またはリスク臓器(OAR)の位置に従って、患者に適用されるべき放射線の量(例えば、強度レベル、エネルギーレベル)を指定するフルエンスマップが含まれ得る。フルエンスマップは、処置セッション中に患者に適用されるべきビームレットパターンおよび/またはビームレット強度を含み得る。いくつかのバリエーションにおいて、フルエンスマップは、(処置計画システムおよび/または放射線治療システムによって)放射線治療システムコンポーネントの構成および/または命令にセグメント化され得る。本明細書中に記載される1またはそれを超える放射線送達メトリックは、フルエンスマップ、ならびに/またはセグメント化されたフルエンスマップが指定する放射線治療システムコンポーネントの構成および/もしくは命令に基づいて計算され得る。例えば、本明細書中に記載される任意の方法が、患者の画像(例えば、処置計画中の1またはそれを超えるCT画像および/またはMRI画像)およびセグメント化されたフルエンスマップを用いて、1またはそれを超える標的領域または関心体積に対する線量体積ヒストグラムを計算する工程を含み得る。各標的領域に対して、コントローラ(例えば、コントローラのプロセッサ)は、リニアック(または任意の治療用放射線源)による放射線ビーム出力、ビーム成形コンポーネント(例えば、MLCおよび/またはジョー)の放射線透過アパーチャのサイズおよび形状ならびにビームが放射されたときの標的領域を基準としたリニアックの位置(これらのパラメータは、セグメント化されたフルエンスマップによって指定され得る)に基づいて標的領域に放射された放射線フルエンスを計算し得る。その標的領域における線量レベルは、リニアックによって放射された放射線フルエンス、およびリニアックと標的領域との間に存在する任意の解剖学的構造(例えば、骨、高密度組織、任意のインプラントなど)による放射されたフルエンスの吸収、ならびに標的領域における組織の放射線吸収特性に基づいて計算され得る。例えば、標的領域の各体積部分に対する線量レベルは、処置計画中の画像、処置計画フルエンスマップ、および患者の1またはそれを超える予め選択された領域(例えば、標的領域内のサンプリングポイントまたはボクセル)における線量値にフルエンス値をマッピングする線量計算マトリックスを用いて計算され得る。
Methods In some variations, a range of acceptable radiation delivery metric values may be calculated for one or more delivery metrics based on parameters of the treatment plan. A treatment plan may include a fluence map that specifies the amount of radiation (eg, intensity level, energy level) to be applied to the patient according to the location of the target region and/or organ at risk (OAR). A fluence map may include beamlet patterns and/or beamlet intensities to be applied to a patient during a treatment session. In some variations, the fluence map may be segmented (by the treatment planning system and/or the radiation therapy system) into radiation therapy system component configurations and/or instructions. One or more radiation delivery metrics described herein may be calculated based on the configuration and/or instructions of the radiation treatment system components specified by the fluence map and/or the segmented fluence map. For example, any method described herein uses patient images (e.g., one or more CT and/or MRI images during treatment planning) and a segmented fluence map to or calculating a dose volume histogram for a target region or volume of interest beyond. For each target region, the controller (e.g., the controller's processor) determines the radiation beam output by the linac (or any therapeutic radiation source), the size of the radiolucent apertures of the beam shaping components (e.g., MLC and/or jaws) and calculate the radiation fluence emitted to the target area based on the shape and position of the linac relative to the target area when the beam was emitted (these parameters can be specified by a segmented fluence map). obtain. The dose level at the target area is the radiation fluence emitted by the linac and emitted by any anatomical structures (e.g., bones, dense tissue, any implants, etc.) between the linac and the target area. can be calculated based on the absorption of the measured fluence, as well as the radiation absorption properties of tissue in the target region. For example, the dose level for each volumetric portion of the target region is determined in the image during treatment planning, the treatment planning fluence map, and in one or more preselected regions of the patient (e.g., sampling points or voxels within the target region). It can be calculated using a dose calculation matrix that maps fluence values to dose values.
標的領域のうちの領域または面積(例えば、標的組織または計画標的体積)に送達された線量レベルは、標的領域の1(体積)部分あたりの線量単位をプロットしているヒストグラム(すなわち、線量体積ヒストグラム)の形で表され得る。いくつかのバリエーションでは、処置計画パラメータ(例えば、フルエンスマップ)に基づいて、および標的領域内の腫瘍組織の位置を変化させることによって、DVH曲線族が計算され得る。より上のDVH曲線(または最大線量分布)およびより下のDVH曲線(または最小線量分布)は、例えば、それぞれ最も右のDVH曲線および最も左のDVH曲線を選択することによって、DVH曲線族から抽出され得る。有界のDVH曲線の計算に関するさらなる詳細は、2018年6月22日に出願された同時係属中の米国特許出願第16/016,272号(その全体が参照により本明細書に援用される)に含まれている。それらの有界のDVH曲線は、放射線治療システムのコントローラのメモリーに保存され得、リニアックコントローラおよび/もしくは電離箱ならびに/またはリニアックの真向かいに配置されたMV検出器からのリニアック出力データ(例えば、パルス強度、継続時間、周波数、線量)、放射線パルスを発射したときのリニアック位置データ(例えば、ガントリーの位置センサーおよび/またはモーションセンサーからのデータ)、MLCリーフの配置(例えば、MLCリーフの位置センサーおよび/またはモーションセンサーからのもの)、イメージングデータ(例えば、PET検出器、X線検出器などから取得されたデータ)、ならびに/またはセッション中の患者および/もしくは腫瘍の変化に応答したフルエンスの任意の調整(例えば、モーションアーチファクトなど)を用いて計算され得るリアルタイムのDVH曲線と並んで表示され得る。 The dose level delivered to a region or area (e.g., target tissue or planned target volume) of the target region is measured in a histogram plotting dose units per (volume) portion of the target region (i.e., dose volume histogram ). In some variations, the DVH curve family can be calculated based on treatment planning parameters (eg, fluence maps) and by varying the location of tumor tissue within the target region. The upper DVH curve (or maximum dose distribution) and the lower DVH curve (or minimum dose distribution) are extracted from the DVH curve family, e.g., by selecting the rightmost DVH curve and leftmost DVH curve respectively. can be Further details regarding the calculation of bounded DVH curves are found in co-pending US patent application Ser. included in These bounded DVH curves can be stored in the memory of the controller of the radiotherapy system, and the linac output data (e.g., pulse intensity, duration, frequency, dose), linac position data when the radiation pulse was delivered (e.g., data from gantry position and/or motion sensors), MLC leaf placement (e.g., MLC leaf position sensors and and/or from motion sensors), imaging data (e.g., data acquired from PET detectors, X-ray detectors, etc.), and/or fluence in response to changes in the patient and/or tumor during the session. It can be displayed alongside a real-time DVH curve that can be calculated with adjustments (eg, motion artifacts, etc.).
いくつかのバリエーションにおいて、処置計画からのフルエンスマップは、様々な患者プラットフォーム位置に対する、ガントリー発射位置1つあたりのMLCリーフ1つあたりの放射線発射強度値にセグメント化され、離散化され得る。放射線送達を表しているグラフィックは、セグメント化されたフルエンスマップが指定する、患者の周りの各リニアックの位置(例えば、ガントリー発射角度)における各開放MLCリーフに対する放射線発射強度レベル(例えば、適用される放射線の振幅、ならびに/または放射線パルスのデューティサイクルおよび/もしくは周波数および/もしくは幅など)のプロットを含み得る。各リニアックの位置における各開放MLCリーフに対する(および必要に応じて、リニアックの位置を基準とした各患者プラットフォーム位置に対する)放射線発射強度レベルの第1のプロットは、処置計画システムによって生成されたセグメント化されたフルエンスマップに基づいて計算され得る。この第1のプロットは、理想的なまたは目標の放射線送達プロファイルを表し得る。各MLCリーフに対する放射線発射強度レベルのさらなるプロットは、処置セッション中に取得されたデータに基づいて計算され得、それらのデータとしては、MLCリーフのモーションセンサーおよび/または位置センサーのデータ、リニアック出力データ(例えば、電離箱もしくはドーズチャンバー、および/またはリニアックの真向かいに配置されたMV検出器からのデータ)、およびリニアックの位置データが挙げられるがこれらに限定されない。これらのさらなるプロットは、本明細書中に記載されるような、処置セッション中の所定の時点またはコントロールポイント(例えば、チェックポイント)において生成され得る。必要に応じて、各リニアックの位置における各MLCリーフに対する放射線発射強度レベルは、例えば、患者プラットフォームが、患者がガントリー開口部を通ると同時に、各患者プラットフォーム位置に対して計算され得る。本明細書中に記載される例およびバリエーションは、特定の時点における放射線送達の計測および評価を示し得るが、同様の計測および評価が、所望であり得るとおり、特定のコントロールポイントおよび/またはチェックポイントにおいて行われ得ることが理解されるべきである。 In some variations, the fluence map from the treatment plan can be segmented and discretized into radiation emission intensity values per MLC leaf per gantry firing position for various patient platform positions. A graphic representing radiation delivery is the radiation emission intensity level (e.g., applied a plot of radiation amplitude, and/or radiation pulse duty cycle and/or frequency and/or width, etc.). A first plot of radiation emission intensity levels for each open MLC leaf at each linac location (and optionally for each patient platform location relative to the linac location) is the segmentation generated by the treatment planning system. can be calculated based on the calculated fluence map. This first plot may represent an ideal or target radiation delivery profile. Additional plots of radiation intensity levels for each MLC leaf may be calculated based on data acquired during the treatment session, including MLC leaf motion and/or position sensor data, linac output data, (e.g., data from an ionization chamber or dose chamber and/or a MV detector located across from the linac), and linac position data. These additional plots can be generated at predetermined time points or control points (eg, checkpoints) during the treatment session, as described herein. If desired, radiation emission intensity levels for each MLC leaf at each linac location can be calculated for each patient platform location, eg, at the same time the patient platform passes through the gantry opening. Although the examples and variations described herein may show measurement and evaluation of radiation delivery at specific time points, similar measurements and evaluations may be performed at specific control points and/or checkpoints, as may be desired. It should be understood that it can be done in
いくつかのバリエーションにおいて、放射線送達を表すグラフィックは、標的領域または関心体積の各々に対する1またはそれを超える計画品質インデックス(PQI)の数値を含み得る。PQIは、処置計画フルエンスマップが、リスク臓器(OAR)への放射線曝露をのがれさせながらまたは制限しながら、十分な放射線を腫瘍領域に提供する程度を表す。患者および/または腫瘍領域の状態は、処置セッション中に変化するので、処置計画によって規定されたフルエンスマップは、腫瘍領域への放射線の放射時に、より有効になることもある(し、より有効にならないこともある)。処置セッション中にモニターされ得るPQIの例としては、放射線標的領域における平均線量レベル、ある標的領域に対する95%(V95)または100%(V100)線量レベルといった基準の体積カバー度(例えば、標的領域に対する線量目標が、2Gyである場合、V100 PQIは、少なくとも2Gyの線量を受けた標的領域の体積部分のことを示す)、および/またはOARにおける最大線量レベルが挙げられ得る。PQI値(例えば、処置計画時の患者および/もしくは腫瘍領域に基づいて計算された許容され得るPQI値の範囲、ならびに/または臨床医によって再検討および承認されたPQI値の範囲)が、処置セッション中に取得されたデータを用いて計算されたPQI値とともに表示され得、それらのデータとしては、MLCリーフのモーションセンサーおよび/または位置センサーのデータ、ジョーのモーションセンサーおよび/または位置センサーのデータ、ガントリーの位置センサーおよび/またはモーションセンサー(例えば、ガントリーの角度および/または速度のデータを収集するセンサー)、ならびに/または治療台の位置センサーおよび/もしくは速度センサー、リニアック線量率データ(例えば、電離箱もしくはドーズチャンバーおよび/またはリニアックの真向かいに配置されたMV検出器からのデータ)が挙げられるがこれらに限定されない。 In some variations, a graphic representing radiation delivery may include one or more planning quality index (PQI) numbers for each target region or volume of interest. PQI represents the extent to which a treatment plan fluence map provides sufficient radiation to the tumor area while escaping or limiting radiation exposure to organs at risk (OAR). As patient and/or tumor area conditions change during a treatment session, the fluence map defined by the treatment plan may be more effective (and more effective) when radiation is delivered to the tumor area. sometimes not). Examples of PQI that can be monitored during a treatment session include the average dose level in a radiation target area, a baseline volume coverage such as 95% (V95) or 100% (V100) dose level for a target area (e.g. If the dose target is 2 Gy, the V100 PQI refers to the volume of the target area that received a dose of at least 2 Gy), and/or the maximum dose level in the OAR. PQI values (e.g., ranges of acceptable PQI values calculated based on patient and/or tumor area at the time of treatment planning and/or ranges of PQI values reviewed and approved by a clinician) may be displayed with PQI values calculated using data acquired in the MLC leaf motion and/or position sensor data, jaw motion and/or position sensor data, Gantry position and/or motion sensors (e.g., sensors that collect gantry angle and/or velocity data) and/or couch position and/or velocity sensors, linac dose rate data (e.g., ion chamber or data from MV detectors placed directly opposite the dose chamber and/or linac).
放射線治療システムは、経時的に、複数の放射線送達メトリックを計算し得、それらの放射線送達メトリックの複数のグラフィック表示を表示し得る。いくつかの放射線送達メトリックが、放射線フルエンスデータに基づいて計算され得る一方で、他の放射線送達メトリックは、吸収された線量データに基づいて計算され得る。次いで、放出された粒子数およびエネルギー量に関するデータ(例えば、ガントリーおよびリーフセンサーのデータと必要に応じて組み合わされるリニアックパルスセンサーのデータ)を収集するセンサーが、位置情報と相互に関係づけられ得、それを用いてフルエンスが計算され、そのフルエンスを用いて、エネルギーが適用されている媒質に基づいて、吸収された線量が計算され得る。同様に、吸収線量データを収集および報告するセンサー(例えば、リニアックの反対側に配置されたMV線量測定センサー)は、放射線治療デバイスの位置センサーからのセグメント化された体積データおよび位置データのような放射線治療計画アーチファクトと相互に関係づけられるとき、放射線送達メトリックの計算値を直接提供するために使用することができる。放射線フルエンスは、例えば、リニアックなどの治療用放射線源の向かいに配置されたMV検出器を用いて計測され得、そのフルエンス計測値は、解剖学的データ(例えば、CT画像からのデータ、解剖学的な構造データ(幾何学、解剖学的構造の密度、解剖学的構造の減衰係数などを含む))と組み合わされ得る。放射線送達メトリックおよび対応するグラフィック表示の例を下記で説明する。 The radiation therapy system may calculate multiple radiation delivery metrics and display multiple graphical representations of those radiation delivery metrics over time. Some radiation delivery metrics may be calculated based on radiation fluence data, while other radiation delivery metrics may be calculated based on absorbed dose data. Sensors collecting data on emitted particle number and energy content (e.g., linac pulse sensor data optionally combined with gantry and leaf sensor data) can then be correlated with position information, With it the fluence can be calculated and with that fluence the absorbed dose can be calculated based on the medium to which the energy is being applied. Similarly, a sensor that collects and reports absorbed dose data (e.g., an MV dosimetry sensor located on the opposite side of the linac), such as segmented volumetric and positional data from the radiotherapy device's positional sensor When correlated with radiation treatment planning artifacts, it can be used directly to provide calculated values of radiation delivery metrics. Radiation fluence can be measured, for example, using an MV detector placed across from a therapeutic radiation source, such as a linac, and the fluence measurements can be combined with anatomical data (e.g., data from CT images, anatomical anatomical structure data (including geometry, anatomical density, anatomical attenuation coefficient, etc.). Examples of radiation delivery metrics and corresponding graphical displays are described below.
本明細書中に記載される放射線送達メトリックおよびグラフィック表示は、放射ガイド下の放射線治療システム(患者に注入されたPETトレーサーからの陽電子消滅光子放射に従って治療用放射線が適用される放射線治療システム)の文脈において説明されてきたが、これらの送達メトリックおよびグラフィック表示は、放射線送達セッション(例えば、処置セッションおよび/またはQAセッション)の進捗をモニターおよび追跡するために任意の放射線治療システムおよび/または放射線送達方法とともに使用されてもよいことが理解されるべきである。例えば、本明細書中に記載される放射線送達メトリックおよびグラフィック表示は、治療用放射線源が活性化されている(すなわち、ビームがオンである)間に、処置セッション中に取得されたイメージングデータに従って治療用放射線を適用する放射線治療システムとともに使用され得る。そのようなシステムには、リアルタイムで取得されたMRIセンサーデータ(例えば、k空間におけるサブサンプル)および/またはリアルタイムで取得されたX線検出器データ(例えば、kVおよび/またはMV X線検出器からの2D投影X線データ)に従って治療用放射線を適用する放射線治療システムが含まれ得る。それらの送達メトリックおよびグラフィック表示はまた、任意の処置送達モダリティ、例えば、IMRT(ヘリカル強度変調、VMAT、ダイナミックアーク、ステップアンドシュートによるIMRT、または2D変調を用いるスライディングウィンドウによるIMRT)、または単一もしくは複数の固定ガントリー、治療台、ジョーおよびMLCの設定を用いる3Dコンフォーマル送達、または3Dコンフォーマルアーク送達、および任意の放射線源搭載配置、例えば、患者の標的領域の周りに配置された、Cアーム、ヘリカル、ロボットまたは固定の複数の放射線源の配置を利用して、任意の画像ガイド下の放射線治療システムとともに使用され得る。 The radiation delivery metrics and graphical displays described herein are for radiation-guided radiation therapy systems (radiation therapy systems in which therapeutic radiation is applied according to positron annihilation photon emissions from PET tracers injected into the patient). As has been described in context, these delivery metrics and graphical displays can be used by any radiation therapy system and/or radiation delivery system to monitor and track the progress of radiation delivery sessions (e.g., treatment sessions and/or QA sessions). It should be understood that it may be used with the method. For example, the radiation delivery metrics and graphical displays described herein are based on imaging data acquired during a treatment session while the therapeutic radiation source is activated (i.e., the beam is on). It can be used with radiation therapy systems that apply therapeutic radiation. Such systems include real-time acquired MRI sensor data (e.g., sub-samples in k-space) and/or real-time acquired x-ray detector data (e.g., from kV and/or MV x-ray detectors). 2D projection x-ray data) may be included to apply therapeutic radiation. Their delivery metrics and graphical displays can also be used for any treatment delivery modality, such as IMRT (IMRT with helical intensity modulation, VMAT, dynamic arc, step-and-shoot, or sliding window with 2D modulation), or single or 3D conformal delivery, or 3D conformal arc delivery, with multiple fixed gantry, couch, jaw and MLC settings, and optional radiation source mounting arrangements, e.g., C-arm, positioned around the target region of the patient It can be used with any image-guided radiation therapy system utilizing , helical, robotic or fixed multiple radiation source arrangements.
リアルタイムの線量-体積比較
1つのタイプの放射線送達メトリックは、体積量に対する放射線量データを含み得る。線量-体積データを表すグラフィックは、患者またはファントムの体積を横断する線量データおよび/または患者の構造もしくはファントムの領域と重ね合わせた線量データのプロットを含み得る。例えば、線量-体積の比較を表すグラフィックは、等線量輪郭、線量体積ヒストグラム(DVH)および線量勾配画像を含み得る。これらの放射線送達メトリックは、通常、処置セッションの終わりに計算され、グラフィックによって表されるが、本明細書中に記載される方法は、放射線送達と同時に、これらのメトリックを計算する工程および対応するグラフィックをリアルタイムで生成する工程を含む。さらに、生成されたグラフィックは、線量-体積メトリックのリアルタイム値、ならびに処置計画および計画パラメータに基づいて計算された同じ線量-体積メトリックの処置前の値を含み得る。例えば、線量-体積送達メトリックの値は、処置セッションの前に、処置セッションの所定の各時点における各標的領域または各関心体積に対して計算され得る。特定の時点において送達された線量は、解剖学的イメージデータ(例えば、イメージングシステムからのデータ)、リニアック位置データ(例えば、ガントリーの位置センサーおよび/またはモーションセンサーからのデータ)、リニアック放射線放射データ(例えば、リニアックコントローラおよび/または電離箱および/またはリニアックの真向かいに配置されたMV検出器からのデータ)、ジョーアパーチャデータ(例えば、ジョーの位置センサーおよび/またはモーションセンサーからのデータ)および/またはMLCアパーチャデータ(例えば、MLCリーフの位置センサーおよび/またはモーションセンサーからのデータ)を用いて計算され得る。そのようなセンサーおよび/または検出器のデータは、線量計算の直前に取得され得る。必要に応じて、特定の時点において送達された線量は、線量計算マトリックスとその時点において放射されたフルエンスとを乗算することによって計算され得る。線量-体積の演算は、少なくとも要求された線量レベルDを受けたROIまたは標的領域の体積の割合(少なくとも線量レベルDを受けたボクセル数をカウントし、このボクセル数を、ROIまたは標的領域の全体積を含むボクセルの総数で除算することによって決定され得る)を計算する工程をさらに含み得る。様々な線量-体積メトリックが、組織の体積に対する線量レベルから得られる可能性がある。例えば、いくつかの方法は、送達された蓄積線量(例えば、処置セッション全体にわたって送達された蓄積線量、および/または処置セッションの開始から現時点までに送達された合計線量)を表すグラフィックを生成する工程および/または特定の時点もしくは特定の時点付近においてある時間間隔にわたって送達された線量を表すグラフィックを生成する工程を含み得る。リアルタイムの線量-体積送達メトリックは、実際の放射線送達の進捗と計画された放射線送達の進捗との相違を特定するために処置計画中の患者およびシステムのパラメータに基づいて計算された線量-体積送達メトリック値とオーバーレイされ得る(またはその他の方法で比較され得る)。1つの例において、コンフォーマル性指数(V100/PTVの比のことであり得、ここで、V100は、100%処方線量に対応する等線量表面が覆っている体積(単位はcc)であり、PTVは、計画標的体積(単位はcc)である)を計算するために、放射線治療システムは、100%等線量表面のすべてを含む標的近傍の線量を計算し、少なくとも100%の処方線量と等しい線量を有するボクセル数を計算し、次いで、このボクセル数を、PTVを含むボクセル数で除算するように構成され得る。別の例では、線量勾配インデックス(dose gradient index)を計算するために、放射線治療システムは、V50/V100またはV50/PTVの比(ここで、V50およびV100は、それぞれ少なくとも50%および100%の処方線量を有するボクセル数として計算される)を計算するように構成され得る。
Real-Time Dose-Volume Comparison One type of radiation delivery metric may include radiation dose data versus volumetric dose. Graphics representing dose-volume data may include plots of dose data across the patient or phantom volume and/or overlaid with patient structures or regions of the phantom. For example, graphics representing dose-volume comparisons may include isodose contours, dose volume histograms (DVH) and dose gradient images. Although these radiation delivery metrics are typically calculated and graphically represented at the end of the treatment session, the methods described herein provide steps and corresponding steps to calculate these metrics concurrently with radiation delivery. Including generating graphics in real time. Additionally, the generated graphics may include real-time values of the dose-volume metric as well as pre-treatment values of the same dose-volume metric calculated based on the treatment plan and plan parameters. For example, dose-volume delivery metric values may be calculated prior to a treatment session for each target region or volume of interest at each predetermined time point of the treatment session. The dose delivered at a particular point in time can be anatomical image data (e.g., data from an imaging system), linac position data (e.g., data from gantry position and/or motion sensors), linac radiation emission data ( data from a linac controller and/or ionization chamber and/or an MV detector placed directly across the linac), jaw aperture data (e.g. data from a jaw position sensor and/or motion sensor) and/or MLC It may be calculated using aperture data (eg, data from MLC leaf position and/or motion sensors). Such sensor and/or detector data may be acquired immediately prior to dose calculation. Optionally, the dose delivered at a particular time can be calculated by multiplying the dose calculation matrix by the fluence emitted at that time. The dose-volume calculation counts the percentage of the volume of the ROI or target area that has received at least the required dose level D (the number of voxels that have received at least the dose level D, and divides this number of voxels into the entire ROI or target area). ), which may be determined by dividing by the total number of voxels containing the product. Various dose-volume metrics may be derived from dose level versus tissue volume. For example, some methods generate a graphic representing cumulative dose delivered (e.g., cumulative dose delivered over a treatment session and/or total dose delivered from the start of the treatment session to the present time). and/or generating a graphic representing dose delivered over an interval of time at or near a particular point in time. Real-time dose-volume delivery metrics calculate dose-volume delivery based on patient and system parameters during treatment planning to identify discrepancies between actual and planned radiation delivery progress may be overlaid (or otherwise compared) with metric values. In one example, it can refer to the conformality index (ratio of V100/PTV, where V100 is the volume (in cc) covered by the isodose surface corresponding to 100% prescribed dose; PTV is the planned target volume (units are in cc), the radiation therapy system calculates the dose near the target, including all of the 100% isodose surfaces, and equals at least 100% of the prescribed dose It can be configured to calculate the number of voxels with dose and then divide this number of voxels by the number of voxels containing the PTV. In another example, to calculate the dose gradient index, the radiotherapy system uses a ratio of V50/V100 or V50/PTV (where V50 and V100 are at least 50% and 100%, respectively). (calculated as the number of voxels with the prescribed dose).
いくつかのバリエーションにおいて、処置セッション中の特定の時点における計画された線量-体積送達メトリック値は、経過した時間の比率によって、セッション全体の線量-体積送達メトリック値をスケール変更することによって計算され得る。各時点または各コントロールポイントにおける線量-体積送達メトリックの事前に計算した値(すなわち、予想されるメトリックの値)は、その時点において送達された線量の量(例えば、累積線量、および/またはその時点において送達された線量であり得る)、およびその時点におけるビーム成形コンポーネントの配置(すなわち、MLCリーフの配置および/またはジョーの配置)を含み得る。さらなるセンサーデータも、線量再構築にさらなる入力(例えば、MV線量測定センサーデータ、例えば、上に記載された放射線治療システムセンサーのいずれかからの位置データおよび/またはモーションデータと相互に関係づけられた、各ピクセルにおける透過放射線の強度)を提供するために、同様に組み込まれ得る。例えば、処置セッション中に取得されたイメージングデータを用いて、標的領域に送達された線量を計算することは、処置計画中のイメージングデータを用いて線量を計算することよりも正確であり得る。この事前に計算されたまたは予想される線量-体積送達メトリックは、現在のコントロールポイントの関連する関心体積データ(例えば、CTスライス、放射線療法構造セットおよび/または概念体積の定義)に適用され得るか、またはそのデータを用いて計算され得る。これにより、例えば、送達の開始から現時点までの、体積と相互に関連付けられたリアルタイムの累積放射線量の計算が提供され得る。予想される線量-体積放射線送達メトリックと比べたときの、リアルタイムの線量-体積放射線送達メトリックを表す種々のグラフィックの例を下記で説明する。 In some variations, the planned dose-volume delivery metric value at a particular point in time during a treatment session can be calculated by scaling the dose-volume delivery metric value for the entire session by the ratio of elapsed time. . The pre-calculated value of the dose-volume delivery metric (i.e., the expected value of the metric) at each time point or control point is the amount of dose delivered at that time (e.g., cumulative dose, and/or ), and placement of the beam shaping components (ie, MLC leaf placement and/or jaw placement) at that time. Additional sensor data was also correlated with additional inputs to dose reconstruction (e.g., MV dosimetry sensor data, e.g., position and/or motion data from any of the radiotherapy system sensors described above). , the intensity of the transmitted radiation at each pixel). For example, calculating dose delivered to a target area using imaging data acquired during a treatment session may be more accurate than calculating dose using imaging data during treatment planning. Can this pre-computed or expected dose-volume delivery metric be applied to the current control point's associated volume of interest data (e.g., CT slice, radiotherapy structure set and/or conceptual volume definition)? , or can be calculated using that data. This may provide, for example, calculation of real-time cumulative radiation dose correlated with volume from the start of delivery to the present time. Examples of various graphics representing real-time dose-volume radiation delivery metrics as compared to expected dose-volume radiation delivery metrics are described below.
等線量輪郭の比較
等線量輪郭は、どれだけの線量が、放射線処置セッション中に所与の体積領域に送達されると予想されるかを表示するために使用され得る。図1Aは、予想される等線量輪郭 対 処置セッション中に取得されたデータに基づいて計算されたリアルタイムの等線量輪郭を含むグラフィックの一例を示している。これらの等線量輪郭は、患者の解剖学的画像と重ね合わせられている(対比を示すために処理される)。そのグラフィックは、処置セッション中、連続的におよび/または所定の時点において更新されることにより、等線量輪郭のビルドアップが経時的に反映され得る。リアルタイムの等線量輪郭は、標的領域内の各サンプリングポイント(例えば、ボクセルまたはピクセル)における送達線量を計算することにより、標的領域全体にわたる3Dまたは2Dの線量分布または線量プロファイルを計算することによって、生成され得る。標的領域への送達線量は、上に記載されたように計算され得、例えば、リニアックコントローラおよび/または電離箱、および/またはリニアックの真向かいに配置されたMV検出器、ビーム成形コンポーネント(例えば、ジョー、MLCリーフ)と関連付けられた位置センサーおよび/またはモーションセンサー、ガントリーおよび/またはリニアックと関連付けられた位置センサーおよび/またはモーションセンサーからのデータ、標的領域のイメージングシステムからのイメージングデータ(例えば、PETデータ、CTデータなど)を用いて計算され得る。放射線治療システムのコントローラのプロセッサは、標的領域または関心体積に対する送達線量を投影するように構成され得る。必要に応じて、いくつかの方法は、線量計算マトリックスとその時点において放射されたフルエンスとを乗算することによって送達線量プロファイルを計算する工程を含み得る。いくつかのバリエーションにおいて、フルエンスは、放射線発射マトリックスと取得されたイメージングデータ(例えば、PET放射データ)とを乗算することによって計算され得る。2Dまたは3Dの線量分布または線量プロファイルが生成された後に、ユーザーが規定した線量基準を満たす(例えば、同じ線量レベルを有するかまたは選択された線量レベルを超えるかもしくはそれ未満の線量レベルを有する)標的領域の部分をたどるおよび/またはつなぐことによって、等線量輪郭線が生成され得る。いくつかのバリエーションにおいて、等線量輪郭または等線量輪郭線は、別々の線量レベルに対して生成され得る。等線量輪郭または等線量輪郭線は、CTまたはMRI(または任意の解剖学的な)画像と、必要に応じてPET画像と組み合わせて、オーバーレイされ得る。図1Aは、等線量輪郭または等線量輪郭線を含むグラフィックの一例を示している。破線の等線量輪郭線(102)は、各時点における計画された95%等線量(D95%計画)を表しており、点線の等線量輪郭線(104)は、各時点におけるセンサー由来の95%等線量(D95%リアルタイム)を表している。実線の輪郭線(106)は、任意の標的体積または関心領域(例えば、計画標的体積またはPTV(すなわち、任意の周囲組織が病気であり得る肉眼的腫瘍体積、ならびに任意の設定、イメージングおよび動きの不確実性))を表し得る。腫瘍をカバーする95%等線量領域が、放射線送達中に、時点t0(線量が送達されていない時点)から時点t1(線量が部分的に送達された時点)を経て時点t2(線量が完全に送達された時点)までに変化する速度は、D95%リアルタイム輪郭によって囲まれた領域によって表され得る。これは、放射線送達中にリアルタイムで更新され得、送達が進むにつれて、サイズが大きくなり得、PTV輪郭106に近づき得る(例えば、D95%計画によって説明された領域に接近し得る)。いくつかのバリエーションにおいて、そのグラフィックは、処置セッションの継続時間にわたる、等線量輪郭によって表された放射線量の蓄積を示すために動画化され得、得られた1つの状況から次の状況へのモーションツイーン(すなわち、動画ベクトル)が提供される。これにより、操作者が放射線送達の現在の進捗および正確さを評価し得る体積ベクトルが提供され得る。操作者は、等線量値を表示したい1またはそれを超えるレベルを選択し得る。例えば、操作者は、最大ポイント線量レベルの少なくとも50%を受けた領域の体積を表す、50%線量等線量を選択し得る。操作者は、さらに、送達検証チェックポイントを作るために、特定の時点において所与の等線量レベルに対する範囲を選択し得、その範囲は、図1Bに示されているように、放射線送達中の所与の時点における許容され得る範囲を代表する斜線の領域(108)として表され得る。代替的または追加的に、リアルタイムの等線量輪郭が、時間tにおける時間依存的計画等線量とともに、生成および表示され得る。リアルタイムの等線量輪郭が、時間tにおいて、予想される計画等線量輪郭とどれだけ近いかを可視化することによって、操作者は、送達の正確さを追跡し得る(すなわち、リアルタイムの等線量は、放射線送達中の予想される(計画された)等線量を近似し得る)。
Comparing Isodose Contours An isodose contour can be used to display how much dose is expected to be delivered to a given volumetric area during a radiation treatment session. FIG. 1A shows an example of a graphic including expected isodose contours versus real-time isodose contours calculated based on data acquired during a treatment session. These isodose contours are overlaid (processed for contrast) with an anatomical image of the patient. The graphic may be updated continuously and/or at predetermined time points during the treatment session to reflect the build-up of the isodose contour over time. Real-time isodose contours are generated by calculating a 3D or 2D dose distribution or dose profile over the target area by calculating the delivered dose at each sampling point (e.g., voxel or pixel) within the target area. can be The delivered dose to the target region may be calculated as described above, e.g., using a linac controller and/or ionization chamber, and/or an MV detector placed directly opposite the linac, beam shaping components (e.g., jaw , MLC leaf), data from position and/or motion sensors associated with the gantry and/or linac, imaging data from the imaging system of the target area (e.g., PET data , CT data, etc.). A processor of a controller of the radiotherapy system may be configured to project the delivered dose onto a target region or volume of interest. Optionally, some methods may include calculating the delivered dose profile by multiplying the dose calculation matrix by the fluence emitted at that point in time. In some variations, the fluence may be calculated by multiplying the radiation emission matrix and the acquired imaging data (eg, PET emission data). After a 2D or 3D dose distribution or dose profile is generated, user-defined dose criteria are met (e.g., having the same dose level or having a dose level above or below a selected dose level) By tracing and/or connecting portions of the target area, an isodose contour can be generated. In some variations, isodose contours or isodose contours may be generated for separate dose levels. Isodose contours or contour lines can be overlaid on CT or MRI (or any anatomical) images, optionally in combination with PET images. FIG. 1A shows an example of a graphic containing isodose contours or lines. The dashed isodose contours (102) represent the planned 95% isodose (D95% plan ) at each time point, and the dotted isodose contours (104) are the sensor-derived 95% isodose at each time point. Represents isodose (D95% real time ). The solid outline (106) indicates any target volume or region of interest (e.g., planned target volume or PTV (i.e. gross tumor volume in which any surrounding tissue may be diseased) and any setting, imaging and motion uncertainty)). The 95% isodose area covering the tumor was measured during radiation delivery from time t 0 (no dose delivered) through time t 1 (dose partially delivered) to time t 2 (dose is completely delivered) can be represented by the area bounded by the D95% real -time contour. This may be updated in real-time during radiation delivery, and as delivery progresses, it may grow in size and approach the PTV contour 106 (eg, approach the area described by the D95% plan ). In some variations, the graphic may be animated to show the accumulation of radiation dose represented by isodose contours over the duration of the treatment session, resulting in motion from one situation to the next. A tween (ie, motion vector) is provided. This can provide a volume vector from which the operator can assess the current progress and accuracy of radiation delivery. The operator may select one or more levels at which he wants to display isodose values. For example, the operator may select the 50% dose isodose, which represents the volume of the area that received at least 50% of the maximum point dose level. The operator may also select a range for a given isodose level at a particular time to create a delivery verification checkpoint, which range is the number of doses during radiation delivery, as shown in FIG. 1B. It can be represented as a hatched area (108) representing the acceptable range at a given point in time. Alternatively or additionally, real-time isodose contours can be generated and displayed along with the time-dependent planned isodose at time t. By visualizing how close the real-time isodose contour is to the expected planned isodose contour at time t, the operator can track delivery accuracy (i.e., the real-time isodose is can approximate the expected (planned) isodose during radiation delivery).
線量勾配ビルドアップ
代替的または追加的に、送達された放射線量、フルエンスおよび/または累積放射線量のビルドアップを表すグラフィックは、解剖学的画像にオーバーレイされた線量勾配を含み得る。解剖学的画像は、処置セッションの前(例えば、処置計画セッション中および/または処置計画品質保証セッション中もしくは処置計画検証セッション中)または処置セッションの開始時(例えば、治療用放射線源が活性化される前および/または最初の放射線パルスを適用する前)に取得されたCT画像および/またはMRI画像であり得る。リアルタイムで取得されたデータに基づいて計算された線量勾配を用いることにより、線量分布または線量プロファイルの累積ビルドアップを経時的に表すグラフィックが生成され得る。図1Cは、患者の解剖学的画像に重ね合わせて線量勾配を示しているグラフィックの一例を示している。リアルタイムの線量勾配は、標的領域内の各サンプリングポイント(例えば、ボクセルまたはピクセル)における送達線量を計算することにより、標的領域全体にわたる2Dまたは3Dの線量分布または線量プロファイルを計算することによって、処置セッション中に生成され得る。標的領域に送達された線量は、上に記載されたように計算され得、例えば、リニアックコントローラおよび/または電離箱および/またはリニアックの真向かいに配置されたMV検出器、ビーム成形コンポーネント(例えば、ジョー、MLCリーフ)と関連付けられた位置センサーおよび/またはモーションセンサー、ガントリーおよび/またはリニアックと関連付けられた位置センサーおよび/またはモーションセンサーからのデータ、イメージングシステムからの標的領域のイメージングデータ(例えば、PETデータ、CTデータなど)を用いて計算され得る。放射線治療システムのコントローラのプロセッサは、標的領域全体または関心体積全体に送達された線量を投影するように構成され得る。必要に応じて、いくつかの方法は、線量計算マトリックスとその時点において放射されたフルエンスとを乗算することによって、送達線量プロファイルを計算する工程を含み得る。いくつかのバリエーションにおいて、フルエンスは、放射線発射マトリックスと取得されたイメージングデータ(例えば、PET放射データ)とを乗算することによって計算され得る。2Dまたは3Dの線量分布または線量プロファイルが生成された後、1ボクセルまたは1ピクセルあたりの線量値をプロットすることによって線量勾配プロットが生成され得、ここで、1つのボクセルまたはピクセルの強度は、そのボクセルまたはピクセルに送達された線量レベルを表す。例えば、より強いピクセル強度は、より高い送達線量レベルと相関し得る。線量勾配プロットは、必要に応じてPET画像および/または標的領域(例えば、計画標的体積、腫瘍領域、OARなど)の外形と組み合わせて、CTまたはMRI(または任意の解剖学的)画像とオーバーレイされ得る。輪郭線は、例えば、送達線量が閾値を満たすかまたは超える領域の境界または縁を目立たせるために、線量が送達された領域の周りに引かれ得る。放射線送達が処置計画の通りに進んでいる場合、より高い線量レベルの区域は、累積的に拡大する(例えば、図1Cにおける時点t0、t1、t2の線量を受けた領域の拡大を参照のこと)。代替的または追加的に、放射線治療システムのコントローラは、患者の中の線量を計算し、標的領域または標的領域付近のすべてのポイントにおける線量勾配を計算することによって、線量勾配を生成するように構成され得る。リアルタイムでの線量計算方法の1つのバリエーションは、全ガントリー発射位置および全ビームスライス(または患者プラットフォーム位置)において患者に入射したエネルギーフルエンスから算出される、標的領域および標的領域付近における単位質量あたりに放出される総エネルギー(TERMA)を使用する高速線量計算アルゴリズムを使用し得る。全発射位置に対するエネルギーフルエンスは、特定のガントリー発射位置における開放MLCリーフおよびこのガントリー発射位置において放射された放射線の量(例えば、MUの数字)に基づいて計算され得るビームエネルギースペクトル加重フルエンスを計算することによって、計算され得る。必要に応じて、そのグラフィックは、計画された線量勾配または線量分布も含んでもよく、図1Dに示されるように、それらに対して、リアルタイムの線量勾配が、送達検証チェックポイントにおいて自由選択の許容され得る範囲と比較され得る。1つのバリエーションにおいて、計画された線量勾配または線量プロファイル(および/または許容され得る線量勾配または線量プロファイルの範囲)は、腫瘍(例えば、腫瘍組織)を標的領域(例えば、計画標的体積)内の複数の位置にシフトし、シフトされた腫瘍位置の各々に対する線量勾配または線量プロファイルを計算して、線量勾配または線量プロファイルのファミリーを生成することによって、処置計画セッション中に生成され得る。そのファミリーにおいて最も大きな区域または体積を有する線量勾配または線量プロファイルは、許容され得る線量勾配の範囲の上方境界であり得、そのファミリーにおいて最も小さな区域または体積を有する線量勾配または線量プロファイルは、許容され得る線量勾配の範囲の下方境界であり得る。処置セッション全体にわたる計画された線量勾配または線量プロファイル(および/または許容され得る線量勾配もしくは線量プロファイルの範囲)は、各時点または各チェックポイントに対して比例的にスケール変更され得、グラフィックに反映され得る。例えば、計画された線量勾配によって包含される区域または体積(および/または許容され得る線量勾配の範囲)は、処置セッション全体の継続時間の10%であるチェックポイントに対しては、10%にスケール変更されたもの(すなわち、全区域または全体積の1/10)、処置セッション全体の継続時間の25%であるチェックポイントに対しては、25%にスケール変更されたもの(すなわち、全区域または全体積の1/4)などと対応し得る。代替的または追加的に、処置セッション全体にわたる計画された線量勾配または線量プロファイル(および/または許容され得る線量勾配または線量プロファイルの範囲)は、各時点または各チェックポイントに対して非線形にスケール変更され得、グラフィックに反映され得る。例えば、第1の時点またはチェックポイント(例えば、第1のコントロールポイント、第1のビームステーション)における予想される線量プロファイルは、標的領域(例えば、PTV)の10%が、その標的領域に送達される全フルエンスの10%を受けたことを明示し得る。第2の時点またはチェックポイント(例えば、第2のコントロールポイント、第2のビームステーション)における予想される線量プロファイルは、標的領域(例えば、PTV)の体積の合計25%が、標的領域に送達される全フルエンスの15%を受けたことを明示し得る(例えば、さらなる体積が現れる可能性があるが、送達されるべきフルエンスは、より低い可能性がある)。第3の時点またはチェックポイント(例えば、第3のコントロールポイント、第3のビームステーション)における予想される線量プロファイルは、標的領域(例えば、PTV)の体積の合計30%が、その標的領域に送達される全フルエンスの50%を受けたことを明示し得る(例えば、少量の体積が現れる可能性があるが、それは腫瘍の最も活動性の部分であり得るので、送達されるべきフルエンスは大量であり得る)。代替的または追加的に、いくつかのバリエーション(例えば、強度変調放射線療法)において、各時点または各チェックポイントに対する計画された線量勾配または線量プロファイルは、セグメント化された計画されたフルエンスマップに従って放射線治療システムが設定されているときに送達される線量と対応し得る。各チェックポイントにおいて、送達線量の任意の一部が、選択された閾値によって許容され得る線量範囲の境界の外に広がった場合、放射線治療システムのコントローラは、モニターもしくはスクリーンに表示されるグラフィックおよび/または操作者に対する通知(例えば、視覚的および/または聴覚的な通知)を生成し得る。代替的または追加的に、処置セッション全体にわたる計画された線量勾配または線量プロファイル(および/または許容され得る線量勾配または線量プロファイルの範囲)は、いかなる中間の線量勾配または線量プロファイルも伴わずに、生成されたグラフィックに表示され得る。
Dose Gradient Buildup Alternatively or additionally, a graphic representing the delivered radiation dose, fluence and/or cumulative radiation dose buildup may include a dose gradient overlaid on the anatomical image. Anatomical images may be acquired prior to a treatment session (e.g., during a treatment planning session and/or during a treatment plan quality assurance session or during a treatment plan verification session) or at the beginning of a treatment session (e.g., when the therapeutic radiation source is activated). and/or before applying the first pulse of radiation). By using dose gradients calculated based on real-time acquired data, graphics can be generated that represent the cumulative build-up of a dose distribution or dose profile over time. FIG. 1C shows an example of a graphic showing dose gradients superimposed on an anatomical image of a patient. Real-time dose gradients are calculated during a treatment session by calculating the delivered dose at each sampling point (e.g., voxel or pixel) within the target area, thereby calculating a 2D or 3D dose distribution or dose profile across the target area. can be generated in The dose delivered to the target region may be calculated as described above, e.g., linac controller and/or ionization chamber and/or MV detectors placed across from the linac, beam shaping components (e.g., jaw , MLC leaf), data from position and/or motion sensors associated with the gantry and/or linac, imaging data of the target area from the imaging system (e.g., PET data , CT data, etc.). A processor of a controller of a radiotherapy system may be configured to project the delivered dose over an entire target region or volume of interest. Optionally, some methods may include calculating the delivered dose profile by multiplying the dose calculation matrix by the fluence emitted at that point in time. In some variations, the fluence may be calculated by multiplying the radiation emission matrix and the acquired imaging data (eg, PET emission data). After a 2D or 3D dose distribution or dose profile is generated, a dose gradient plot can be generated by plotting dose values per voxel or pixel, where the intensity of one voxel or pixel corresponds to its Represents the dose level delivered to a voxel or pixel. For example, stronger pixel intensities may correlate with higher delivered dose levels. Dose gradient plots are overlaid with CT or MRI (or any anatomical) images, optionally in combination with PET images and/or outlines of the target area (e.g., planned target volume, tumor area, OAR, etc.). obtain. A contour line may be drawn around the area where the dose was delivered, for example, to highlight the boundaries or edges of areas where the delivered dose meets or exceeds a threshold. If radiation delivery is proceeding according to the treatment plan, areas of higher dose levels will cumulatively expand (e.g., expansion of the dosed areas at times t 0 , t 1 , t 2 in FIG. 1C). see). Alternatively or additionally, the radiotherapy system controller is configured to generate a dose gradient by calculating the dose in the patient and calculating the dose gradient at all points at or near the target region. can be One variation of the real-time dose calculation method is the emitted per unit mass at and near the target area calculated from the energy fluences incident on the patient at all gantry firing positions and all beam slices (or patient platform positions). A fast dose calculation algorithm using the total energy delivered (TERMA) can be used. Energy fluence for all launch positions calculates the beam energy spectral weighted fluence which can be calculated based on the open MLC leaf at a particular gantry launch position and the amount of radiation emitted at this gantry launch position (e.g., MU number) can be calculated by If desired, the graphic may also include a planned dose gradient or dose distribution, for which real-time dose gradients are applied to optional tolerances at delivery verification checkpoints, as shown in FIG. 1D. can be compared with the range that can be In one variation, the planned dose gradient or dose profile (and/or the range of acceptable dose gradients or dose profiles) directs the tumor (eg, tumor tissue) to multiple doses within the target region (eg, the planned target volume). and calculating a dose gradient or dose profile for each of the shifted tumor positions to generate a family of dose gradients or dose profiles. The dose gradient or dose profile with the largest area or volume in the family may be the upper boundary of the range of acceptable dose gradients, and the dose gradient or dose profile with the smallest area or volume in the family may be the acceptable dose gradient or dose profile. It can be the lower boundary of the range of dose gradients obtained. The planned dose gradient or dose profile (and/or the range of acceptable dose gradients or dose profiles) throughout the treatment session can be scaled proportionally for each time point or checkpoint and reflected graphically. obtain. For example, the area or volume covered by the planned dose gradient (and/or the range of acceptable dose gradients) is scaled to 10% for checkpoints that are 10% of the duration of the entire treatment session. modified (i.e., total area or 1/10 of total volume), scaled to 25% (i.e., total area or 1/4 of the total volume) and so on. Alternatively or additionally, the planned dose gradient or dose profile (and/or the range of acceptable dose gradients or dose profiles) over the treatment session is non-linearly scaled for each time point or checkpoint. and can be reflected in the graphics. For example, the expected dose profile at a first time point or checkpoint (e.g., first control point, first beam station) indicates that 10% of the target area (e.g., PTV) is delivered to the target area. 10% of the total fluence received. The expected dose profile at a second time point or checkpoint (e.g., second control point, second beam station) indicates that a total of 25% of the volume of the target area (e.g., PTV) is delivered to the target area. (eg, more volume may appear, but the fluence to be delivered may be lower). The expected dose profile at the third time point or checkpoint (e.g., third control point, third beam station) indicates that a total of 30% of the volume of the target area (e.g., PTV) is delivered to the target area. 50% of the total fluence delivered (e.g., a small volume may appear, but it may be the most active part of the tumor, so the fluence to be delivered is large). could be). Alternatively or additionally, in some variations (e.g., intensity-modulated radiation therapy), the planned dose gradient or dose profile for each time point or each checkpoint is adjusted according to the segmented planned fluence map for radiation therapy. It may correspond to the dose delivered when the system is set. At each checkpoint, if any portion of the delivered dose falls outside the bounds of the dose range that is acceptable according to the selected threshold, the radiotherapy system controller displays a graphic and/or Or it may generate a notification (eg, visual and/or audible notification) to the operator. Alternatively or additionally, a planned dose gradient or dose profile (and/or a range of acceptable dose gradients or dose profiles) throughout the treatment session is generated without any intermediate dose gradients or dose profiles. can be displayed in the displayed graphic.
リアルタイム線量体積ヒストグラム
代替的または追加的に、送達された放射線量および/または累積放射線量のビルドアップを2次元プロットで表すグラフィックは、1またはそれを超える線量体積ヒストグラム(DVH)を含み得る。先に記載されたように、計画されたまたは予想されるDVH値またはDVH曲線は、処置の前に計算され得る。いくつかのバリエーションにおいて、より上のDVH曲線およびより下のDVH曲線を含む有界のDVH曲線は、処置計画中および/または処置計画評価セッション中に生成され得、放射線治療システムのコントローラのメモリーに保存され得る。有界のDVH曲線は、上に記載されたように(すなわち、腫瘍組織の位置を標的領域内でシフトするかまたは変更し、シフトされた腫瘍組織の各位置に対する標的領域の部分に送達された線量単位/レベルを計算することによって)生成され得る。DVH曲線は、処置セッション中に取得されたデータを用いてリアルタイムで生成され得る。いくつかのバリエーションにおいて、特定の時点において送達された線量は、解剖学的なイメージデータ(例えば、イメージングシステムからのデータ)、リニアック位置データ(例えば、ガントリーの位置センサーおよび/またはモーションセンサーからのデータ)、リニアック放射線放射データ(例えば、リニアックコントローラおよび/または電離箱および/またはリニアックの真向かいに配置されたMV検出器からのデータ)、ジョーアパーチャデータ(例えば、ジョーの位置センサーおよび/またはモーションセンサーからのデータ)および/またはMLCアパーチャデータ(例えば、MLCリーフの位置センサーおよび/またはモーションセンサーからのデータ)を用いて計算され得る。そのようなセンサーおよび/または検出器のデータは、線量計算の直前に取得され得る。必要に応じて、特定の時点において送達された線量は、線量計算マトリックスとその時点において放射されたフルエンスとを乗算することによって計算され得る。標的領域の1体積部分あたりの線量単位/レベルは、DVHまたはDVH曲線としてプロットされ得る。いくつかの方法は、所定の時点またはコントロールポイントにおいて、計画されたまたは予想されるDVHを計算する工程を含み得る。必要に応じて、いくつかの方法は、所定の時点において、許容され得るDVH変動の範囲を計算する工程を含み得る。放射線送達中に、リアルタイムで取得されたデータに基づいて計算されたDVH値は、予想されるまたは計画されたDVH値またはDVH曲線(例えば、有界のDVH曲線)と同じグリッドにプロットされ得る。図2Aは、標的領域に対する計画されたDVH曲線、処置セッション中に(例えば、時点t1において)計算された中間DVH曲線、および処置セッション中の所与の時点における計画されたDVH曲線を示しているDVHグラフィックの一例を示している。破線の計画されたDVH曲線は、処置セッションの終わりに望ましい最終的な線量体積ヒストグラムを表す。実線のDVH曲線(PTVリアルタイム)は、計画された放射線送達の一部を送達した後の線量-体積蓄積を表し、点線のDVH曲線(PTV計画)は、所与の時点において予想される線量-体積蓄積を表す。図2Bは、各時点における送達検証チェックポイントを示すDVHビルドアップのバリエーションを表している。各時点に対して、計画されたDVH曲線は、DVH変動の許容され得る範囲、すなわち、上に記載されたような、処置計画に基づいて計算された有界のDVHを規定する上界および下界とともに表示される。操作者は、例えば、放射線送達が、計画された累積DVHに向かって進んでいることならびにDVH値の許容され得る範囲内に留まっていることを処置中に確認し得る。
Real-Time Dose-Volume Histograms Alternatively or additionally, the graphic representing the build-up of radiation dose delivered and/or cumulative radiation dose in a two-dimensional plot may include one or more dose-volume histograms (DVH). As previously described, planned or projected DVH values or DVH curves can be calculated prior to treatment. In some variations, a bounded DVH curve, including an upper DVH curve and a lower DVH curve, may be generated during treatment planning and/or during a treatment plan evaluation session and stored in the memory of the controller of the radiation therapy system. can be saved. Bounded DVH curves were delivered as described above (i.e., shifting or altering the location of the tumor tissue within the target region and the portion of the target region for each location of the shifted tumor tissue). by calculating dose units/levels). DVH curves can be generated in real-time using data acquired during a treatment session. In some variations, the dose delivered at a particular point in time is determined using anatomical image data (e.g., data from an imaging system), linac position data (e.g., data from a gantry position sensor and/or motion sensor). ), linac radiation emission data (e.g., data from a linac controller and/or ionization chamber and/or MV detectors located across from the linac), jaw aperture data (e.g., from jaw position sensors and/or motion sensors). data) and/or MLC aperture data (eg, data from MLC leaf position and/or motion sensors). Such sensor and/or detector data may be acquired immediately prior to dose calculation. Optionally, the dose delivered at a particular time can be calculated by multiplying the dose calculation matrix by the fluence emitted at that time. Dose units/levels per volume of target area can be plotted as a DVH or DVH curve. Some methods may include calculating planned or projected DVH at predetermined time points or control points. Optionally, some methods may include calculating the range of DVH variation that is acceptable at a given point in time. DVH values calculated based on data acquired in real-time during radiation delivery can be plotted on the same grid as expected or planned DVH values or DVH curves (e.g., bounded DVH curves). FIG. 2A shows the planned DVH curve for the target region, the intermediate DVH curve calculated during the treatment session (e.g., at time t1), and the planned DVH curve at a given time point during the treatment session. 1 shows an example of a DVH graphic. The dashed planned DVH curve represents the desired final dose-volume histogram at the end of the treatment session. The solid DVH curve (PTV real -time) represents dose-volume accumulation after delivering a portion of the planned radiation delivery, and the dashed DVH curve (PTV planning ) represents the expected dose-volume at a given time point. represents volumetric accumulation. FIG. 2B represents a variation of the DVH buildup showing the delivery verification checkpoints at each point in time. For each time point, the planned DVH curve is an upper and lower bound that defines an acceptable range of DVH variation, i.e., a bounded DVH calculated based on the treatment regimen, as described above. displayed with The operator may, for example, verify during treatment that radiation delivery is progressing toward the planned cumulative DVH and that it remains within an acceptable range of DVH values.
リアルタイムビーム発射パターン
ヘリカルまたはアーク送達の発射パターンを表示するために、ガントリー位置およびリーフ位置のシノグラムを使用して、各リーフ-ガントリー位置から送達された放射線の特定の強度が表示され得る。シノグラムの1つのバリエーションは、各発射位置(例えば、ガントリー発射角度)に対する個々のMLCリーフの配置を指定するマップを含み得る。シノグラムは、本明細書中に記載される他のグラフィックおよび/または送達メトリックのいずれかとともにモニターに表示され得る。いくつかのバリエーションにおいて、シノグラムは、MLCリーフの位置センサーデータ、リニアックの位置センサーデータ(例えば、特定のMLC配置に対応するリニアック発射位置)および/またはリニアックの電離箱もしくはドーズチャンバーのデータおよび/またはMV検出器データを用いて計算され得る。このシノグラムは、MLCリーフが放射線送達中に開閉しているという指摘および/または確認であり得、1またはそれを超えるMLCリーフが全く動かない場合は(例えば、開放配置もしくは閉鎖配置もしくは任意の中間配置にはまり込んでいるか、または予想の範囲外である場合は)必要に応じて視覚的または聴覚的表示物を提供し得る。例えば、放射線治療システムのコントローラは、特定のコントロールポイントにおいてMLCリーフが妥当でない位置を有するかを検出するように構成され得、MLCリーフが妥当でない位置にある場合、そのコントローラは、視覚的および/または聴覚的な通知または警告を操作者に生成し得る。いくつかのバリエーションにおいて、妥当でないMLCリーフ位置は、特定のガントリー発射位置および/または患者プラットフォーム位置におけるMLCリーフ位置を、セグメント化された計画されたフルエンスマップ(すなわち、処置計画中に生成されたフルエンスマップ)が指定するMLCリーフ位置と比較することによって検出され得る。セグメント化された計画されたフルエンスマップが指定するMLCリーフ位置からのずれは、妥当でないMLCリーフ位置として検出され得るかまたは目印がつけられ得る。代替的または追加的に、いくつかの放射線治療システムは、処置セッション中のフルエンスマップ(すなわち、リアルタイムで計算されたフルエンスマップ)を計算するように構成され得、また、計算されたフルエンスマップをリアルタイムでセグメント化するように構成されることもあり(例えば、生物学的にガイドされる放射線治療すなわちBGRT、放射ガイド下の放射線療法すなわちEGRTおよび/または画像ガイド下の放射線療法すなわちIGRT)、妥当でないMLCリーフ位置は、そのリーフを通って放射されたフルエンス(例えば、放射線強度)を比較し、放射されたフルエンス(または送達された線量)を、リアルタイムで計算されたフルエンスマップと比較することによって、検出され得る。MLCリーフを通って放射されたフルエンスが、リアルタイムで計算されたフルエンスマップによって指定されるフルエンスレベルを超え(例えば、フルエンスマップによって指定される最高フルエンスレベルより高く)、かつ/または所定のフルエンス閾値を超える場合、その放射線治療システムは、MLCリーフが妥当でない位置にあるという通知または表示物を生成し得る。
Real-Time Beam Firing Pattern To display the firing pattern of helical or arc delivery, sinograms of gantry and leaf positions can be used to display the specific intensity of radiation delivered from each leaf-gantry position. One variation of the sinogram may include a map specifying placement of individual MLC leaves for each launch position (eg, gantry launch angle). The sinogram can be displayed on a monitor along with any of the other graphics and/or delivery metrics described herein. In some variations, the sinogram includes MLC leaf position sensor data, linac position sensor data (e.g., linac launch positions corresponding to a particular MLC configuration) and/or linac ion chamber or dose chamber data and/or It can be calculated using MV detector data. This sinogram can be an indication and/or confirmation that the MLC leaves are opening and closing during radiation delivery, and if one or more MLC leaves do not move at all (e.g. open or closed configuration or any intermediate Visual or audible indications may be provided as needed (if the arrangement is stuck or out of range of expectations). For example, a controller of a radiation therapy system can be configured to detect if an MLC leaf has an invalid position at a particular control point, and if the MLC leaf is in an invalid position, the controller can visually and/or Or it may generate an audible notification or warning to the operator. In some variations, invalid MLC leaf positions are identified by comparing the MLC leaf positions at a particular gantry firing position and/or patient platform position to the segmented planned fluence map (i.e., the fluence map generated during treatment planning). can be detected by comparing with the MLC leaf positions specified by the map). Deviations from the MLC leaf positions specified by the segmented planned fluence map can be detected or flagged as invalid MLC leaf positions. Alternatively or additionally, some radiotherapy systems may be configured to calculate fluence maps during a treatment session (i.e., fluence maps calculated in real time), and may also transfer the calculated fluence maps in real time. (e.g., biologically-guided radiation therapy or BGRT, radiation-guided radiation therapy or EGRT and/or image-guided radiation therapy or IGRT), which is not reasonable MLC leaf position is determined by comparing the emitted fluence (e.g., radiation intensity) through that leaf and comparing the emitted fluence (or delivered dose) to a real-time calculated fluence map. can be detected. The fluence radiated through the MLC leaf exceeds the fluence level specified by the fluence map computed in real time (e.g., above the maximum fluence level specified by the fluence map) and/or exceeds a predetermined fluence threshold. If so, the radiotherapy system may generate a notification or indication that the MLC leaf is in an incorrect position.
センサー由来のリアルタイムの2Dシノグラム描写
いくつかのバリエーションにおいて、ビーム発射パターンのグラフィックのリアルタイム再構築は、放射線送達時のセンサーデータを元のパターンまたは計画された予想パターンと合わせることによって生成され得る。いくつかのグラフィックは、センサー由来のリアルタイムのシノグラムデータを表す1またはそれを超える視覚的表示物を含み得る。シノグラムデータを表すグラフィックの1つのバリエーションは、臨床許容度(または計画された許容度)内の発射パターンの許容され得る範囲を表示する第1のビットマスクおよびセンサー由来のリアルタイムの発射パターンを表示する第2のビットマスクを含み得る。図3Aは、計画されたシノグラムビットマスク(上の列)およびMLCリーフセンサー由来のリアルタイムのシノグラムビットマスク(下の列)を別個のプロットに、互いに平行に示しているグラフィックの例を示している。必要に応じて、発射パターンまたはシノグラム値の許容され得る範囲が提供され得る。計画されたシノグラムビットマスク(図3Aの上の列)は、セグメント化されたフルエンスマップのMLC、リニアックおよび/またはガントリーのコマンドまたは命令に基づいて生成され得る。フルエンスマップは、処置計画フルエンスマップ(すなわち、処置計画セッション中および/または処置計画評価セッション中に生成されたフルエンスマップ)であり得、かつ/またはイメージングデータ(例えば、PET放射データ)と放射線発射マトリックスとを乗算することによって得られるフルエンスマップであり得る。バイナリーMLCおよびリニアックが回転可能ガントリーに搭載された放射線治療システムに対する計画されたシノグラムビットマスクの生成は、セグメント化された計画されたフルエンスマップの通りに、各ガントリー発射位置に対する各MLCリーフに対するリーフの配置(すなわち、MLCリーフが開いているか、それとも閉じているか)が開くように指定されている場合、そのマップ上のセル(または「ビット」)を「開」と記録することによってそのMLCリーフの配置を示す工程、および開いた配置の各MLCリーフに対しては、セグメント化された計画されたフルエンスマップが指定する、リニアックによって放射される放射線の強度またはエネルギーと相関する強度(および/またはある空間周波数を有するパターン)でそのセル(または「ビット」)に陰影をつけることによって、そのリーフを通ってリニアックによって放射された放射線の強度(またはエネルギーレベル)を示す工程を含み得る。これは、処置セッション中の指定された時点またはチェックポイントのすべてに対して繰り返され得る。本明細書中に示される例は、様々な強度、不透明度または透明度およびグレースケールまたは白黒のパターンで陰影がつけられた(または埋められた)セル、ピクセルおよび/またはボクセルを示し得るが、他の例では、セル、ピクセルおよび/またはボクセルが、様々な強度、不透明度または透明度および1またはそれを超える色のパターンで陰影がつけられ得る(または埋められ得る)(例えば、カラー化され得る)ことが理解されるべきである。
Sensor-Derived Real-Time 2D Sinogram Depiction In some variations, a graphical real-time reconstruction of the beam firing pattern can be generated by combining sensor data at the time of radiation delivery with the original pattern or a planned expected pattern. Some graphics may include one or more visual representations representing real-time sinogram data from sensors. One variation of a graphic representing sinogram data displays real-time firing patterns derived from a sensor and a first bitmask representing an acceptable range of firing patterns within clinical tolerances (or planned tolerances). may include a second bitmask that FIG. 3A shows a graphical example showing planned sinogram bitmasks (top row) and real-time sinogram bitmasks from MLC leaf sensors (bottom row) in separate plots, parallel to each other. ing. Optionally, an acceptable range of firing patterns or sinogram values can be provided. A planned sinogram bitmask (FIG. 3A, top row) may be generated based on MLC, linac and/or gantry commands or instructions of the segmented fluence map. The fluence map can be a treatment plan fluence map (i.e., fluence map generated during a treatment planning session and/or during a treatment plan evaluation session) and/or imaging data (e.g., PET radiation data) and a radiation firing matrix can be the fluence map obtained by multiplying Generating a planned sinogram bitmask for a radiation therapy system with a binary MLC and linac mounted on a rotatable gantry consists of a leaf for each MLC leaf for each gantry firing position as per the segmented planned fluence map. If the placement of (i.e., whether the MLC leaf is open or closed) is specified as open, mark the cell (or "bit") on that map as "open". and for each MLC leaf in the open configuration the intensity correlated with the intensity or energy of the radiation emitted by the linac specified by the segmented planned fluence map (and/or indicating the intensity (or energy level) of the radiation emitted by the linac through its leaves by shading its cells (or "bits") with a pattern having a certain spatial frequency. This may be repeated for all designated time points or checkpoints during the treatment session. Examples shown herein may show cells, pixels and/or voxels shaded (or filled) with varying intensities, opacity or transparency and grayscale or black and white patterns, but other In the example, cells, pixels and/or voxels can be shaded (or filled) (e.g., colored) with patterns of varying intensities, opacity or transparency and one or more colors. should be understood.
リアルタイムの実際のシノグラムビットマスク(図3Aの下の列)は、MLCリーフおよび/またはガントリーと関連付けられた位置センサーおよび/またはモーションセンサーからのセンサーデータおよび/または検出器データ、ならびに処置セッション中に取得された、リニアックコントローラおよび/またはリニアック電離箱および/またはMV検出器からのデータに基づいて生成され得る。MLC、ガントリーおよび/またはリニアックの実際の配置を反映するリアルタイムのシノグラムビットマスクの生成は、各MLCリーフのセンサーデータに従ってマップ上のセル(または「ビット」)を「開」と記録することによって、ガントリーの位置センサーおよび/またはモーションセンサーが指定する各ガントリー発射位置に対する各リーフに対するMLCリーフ配置を示す工程、および開いている配置の各MLCリーフに対しては、リニアックコントローラおよび/または電離箱および/またはMV検出器によって示された、リニアックによって放射された放射線の強度またはエネルギーと相関する強度(および/またはある空間周波数を有するパターン)でそのセル(または「ビット」)に陰影をつけることによって、そのリーフを通ってリニアックによって放射された放射線の強度(またはエネルギーレベル)を示す工程を含み得る。これは、処置セッション中の指定された時点またはチェックポイントのすべてに対して繰り返され得る。本明細書中に示される例は、様々な強度、不透明度または透明度およびグレースケールまたは白黒のパターンで陰影がつけられた(または埋められた)セル、ピクセルおよび/またはボクセルを示し得るが、他の例では、セル、ピクセルおよび/またはボクセルが、様々な強度、不透明度または透明度および1またはそれを超える色のパターンで陰影がつけられ得る(または埋められ得る)(例えば、カラー化され得る)ことが理解されるべきである。 Real-time actual sinogram bitmasks (bottom row in FIG. 3A) show sensor and/or detector data from position and/or motion sensors associated with the MLC leaf and/or gantry, and during the treatment session. may be generated based on data from the linac controller and/or the linac ionization chamber and/or the MV detector acquired at . Generation of real-time sinogram bitmasks that reflect the actual placement of the MLC, gantry and/or linac by marking cells (or "bits") on the map as "open" according to sensor data for each MLC leaf. , indicating the MLC leaf placement for each leaf for each gantry firing position specified by the gantry's position and/or motion sensors, and for each MLC leaf in the open configuration, the linac controller and/or ionization chamber and /or by shading its cells (or "bits") with an intensity (and/or pattern with a certain spatial frequency) that correlates with the intensity or energy of the radiation emitted by the linac, as indicated by the MV detector , indicating the intensity (or energy level) of the radiation emitted by the linac through its leaves. This may be repeated for all designated time points or checkpoints during the treatment session. Examples shown herein may show cells, pixels and/or voxels shaded (or filled) with varying intensities, opacity or transparency and grayscale or black and white patterns, but other In the example, cells, pixels and/or voxels can be shaded (or filled) (e.g., colored) with patterns of varying intensities, opacity or transparency and one or more colors. should be understood.
図3Bは、図3Aの処置計画例に対する発射パターンまたはシノグラム値の許容され得る範囲を示すビットマスクを示している。そのビットマスク上のセル(または「ビット」)は、特定のMLCリーフが特定のガントリー発射位置において開いているかまたは閉じていることになっているかを示すために様々な視覚的に識別可能なしるしで記録され得る。例えば、あるビットマスクは、開くように意図されているおよび/または開くことが許されている(例えば、セグメント化されたフルエンスマップに従うと、開くようには意図されていないが、許容され得る誤差範囲内または許容度内である)MLCリーフを表すセルに対して第1の陰影、ならびに閉じるように意図されているおよび/または開くことが許されていない(例えば、そのようなリーフの開放は、許容され得る誤差範囲または許容度を超え得る)MLCリーフを表す、第1の陰影と異なる第2の陰影を有し得る。最初の2つとは異なる第3の陰影は、処置セッション中の各ガントリー発射位置に対する開いた(または開きつつある)MLCリーフを表し得る。セルが第3の陰影で記録されるかの判定は、ガントリーおよびMLCリーフの位置センサーおよび/またはモーションセンサーからのセンサーデータに左右される。一例として、図3Bにおいて、放射線の放射前の時点t0では、第1のパターン、例えば、濃い陰影がつけられたセルは、セグメント化されたフルエンスマップによると、対応するガントリー発射位置において開いていることになっている(および/または開くことが許されている)MLCリーフを示す。MLCリーフの位置センサーおよび/またはモーションセンサーのデータならびにガントリーの位置データおよび/またはセンサーデータに基づいて少なくとも20個のガントリー発射位置に対して放射線が適用された後の時点t1では、ビットマスクにおけるセルは、第1のパターンで陰影がつけられたMLCリーフのうちどのリーフが放射線送達中の各ガントリー発射位置において開いたかを示す第2のパターンで陰影がつけられ得る。第1のパターンで陰影がつけられたが、それらの対応するMLCリーフが放射線送達中に開いていなかったセルは、第1のパターンで陰影がつけられたままであり得る。時点t0において第1のパターンで陰影がつけられなかったセル(すなわち、開くべきでないMLCリーフに対応するセル)は、第3のパターン、例えば、薄い陰影または陰影なしで陰影がつけられ得る。放射線治療システムのコントローラ(例えば、コントローラのプロセッサ)は、セグメント化されたフルエンスマップに従って開かなかったまたは閉じたMLCリーフを特定するように構成され、ならびにMLCリーフおよび/またはガントリーの位置および/または動きが、セグメント化されたフルエンスマップにおいて指定されたものから逸脱したという通知または視覚的警告を生成する(例えば、異なるタイプの陰影または点滅または揺れによって)ように構成され得る。例えば、時点t1およびt2までに、誤って開いたMLCリーフ(すなわち、セグメント化されたフルエンスマップによって指定されたもの以外)は、第4のパターン、例えば、ハッシュマークパターンで陰影がつけられ得、開かなかったMLCリーフ(すなわち、セグメント化されたフルエンスマップがそれらは開くべきだと示していたとしても閉じたままのMLCリーフ)は、第1のパターンで陰影がつけられたままであり得る。図3Cは、不透明度の混合を用いて組み合わされた、計画されたシノグラムとリアルタイムのシノグラムとを示しているグラフィックの例を示しており、ここで、リアルタイムのシノグラムは、計画されたシノグラムの上に重ねられており、視覚的比較を行うことができる。代替的または追加的に、センサー由来のリアルタイムのシノグラムと計画されたシノグラムとの差は、独自のシノグラムとして表示され得る。図3Dは、センサー由来のリアルタイムのシノグラムと計画されたシノグラムとの差を独自のシノグラムとして示しているグラフィックの例を示している。これらの図のすべてが、処置経過全体にわたって併合されたシノグラムを示しているが、これらのグラフィック表示は、図3Eに示されているように、単一スライスの比較のためにも同様に使用され得る。本明細書中に示される例は、様々な強度、不透明度または透明度およびグレースケールまたは白黒のパターンで陰影がつけられた(または埋められた)セル、ピクセルおよび/またはボクセルを示し得るが、他の例では、セル、ピクセルおよび/またはボクセルが、様々な強度、不透明度または透明度および1またはそれを超える色のパターンで陰影がつけられ得る(または埋められ得る)(例えば、カラー化され得る)ことが理解されるべきである。 FIG. 3B shows a bitmask indicating the allowable range of firing pattern or sinogram values for the example treatment plan of FIG. 3A. The cells (or "bits") on that bitmask are various visually identifiable indicia to indicate whether a particular MLC leaf is to be open or closed at a particular gantry firing position. can be recorded with For example, some bitmasks are intended to be opened and/or allowed to be opened (e.g., according to the segmented fluence map, are not intended to be opened, but allowable error A first shading for cells representing MLC leaves that are within range or tolerance) and are intended to be closed and/or not allowed to open (e.g., opening such leaves is , may have a second shade different from the first shade representing the MLC leaf (which may exceed an acceptable margin of error or tolerance). A third shade, different from the first two, may represent the open (or opening) MLC leaf for each gantry firing position during the treatment session. Determining whether a cell is recorded in the third shade depends on sensor data from the gantry and MLC leaf position and/or motion sensors. As an example, in FIG. 3B, at time t 0 before the emission of radiation, the first pattern, e.g., the dark-shaded cells, are open at the corresponding gantry firing position according to the segmented fluence map. Indicates the MLC leaf that is supposed to be (and/or is allowed to open). At time t 1 after radiation has been applied to at least 20 gantry firing positions based on MLC leaf position and/or motion sensor data and gantry position and/or sensor data, The cells may be shaded with a second pattern indicating which of the MLC leaves shaded with the first pattern are open at each gantry firing position during radiation delivery. Cells that were shaded with the first pattern but whose corresponding MLC leaves were not open during radiation delivery may remain shaded with the first pattern. Cells that were not shaded with the first pattern at time t0 (i.e., cells corresponding to MLC leaves that should not be opened) may be shaded with a third pattern, e.g., light or no shading. A controller (e.g., a processor of the controller) of the radiation therapy system is configured to identify unopened or closed MLC leaves according to the segmented fluence map and position and/or movement of the MLC leaves and/or the gantry. can be configured to generate notifications or visual warnings (eg, by different types of shading or blinking or shaking) that the segmented fluence map deviates from what is specified. For example, by time points t1 and t2, falsely opened MLC leaves (i.e., other than those specified by the segmented fluence map) are shaded with a fourth pattern, e.g., a hash mark pattern. MLC leaves that did not open (i.e., MLC leaves that remained closed even though the segmented fluence map indicated they should open) may remain shaded with the first pattern. . FIG. 3C shows an example graphic showing a planned sinogram and a real-time sinogram combined using opacity blending, where the real-time sinogram is above the planned sinogram. are superimposed on each other, allowing a visual comparison to be made. Alternatively or additionally, the difference between the sensor-derived real-time sinogram and the planned sinogram can be displayed as a unique sinogram. FIG. 3D shows an example graphic showing the difference between the sensor-derived real-time sinogram and the planned sinogram as a unique sinogram. Although all of these figures show merged sinograms over the course of treatment, these graphical representations are similarly used for single slice comparisons, as shown in FIG. 3E. obtain. Examples shown herein may show cells, pixels and/or voxels shaded (or filled) with varying intensities, opacity or transparency and grayscale or black and white patterns, but other In the example, cells, pixels and/or voxels can be shaded (or filled) (e.g., colored) with patterns of varying intensities, opacity or transparency and one or more colors. should be understood.
図3A~3Eに示されるシノグラムビットマスクの例は、3つのリニアック強度レベルにおける10個のバイナリーMLCリーフおよび20個のガントリー発射位置に対するリーフ配置および放射線強度を示しているが、異なる数のリーフ、ガントリー発射位置およびリニアック強度レベルを有するバイナリーMLC(例えば、64-リーフバイナリーMLC、100個のガントリー発射位置、1つの強度レベルまたは2つの強度レベルでのリニアック発射)を備えるシステムに対しても、同様のシノグラムビットマスクが生成され得ることが理解されるべきである。そのようなシノグラムも、患者が治療用放射線ビーム面を通ると同時に各患者プラットフォーム位置に対して生成、表示され得る。 The example sinogram bitmasks shown in FIGS. 3A-3E show leaf placement and radiation intensity for 10 binary MLC leaves and 20 gantry firing positions at three linac intensity levels, but with different numbers of leaves. , binary MLC with gantry firing positions and linac intensity levels (e.g., 64-leaf binary MLC, 100 gantry firing positions, linac firing at 1 intensity level or 2 intensity levels). It should be appreciated that similar sinogram bitmasks can be generated. Such sinograms may also be generated and displayed for each patient platform position as the patient passes through the plane of the therapeutic radiation beam.
3Dシノグラム
放射線送達をモニターするためおよび放射線送達のグラフィック表示を生成するための方法のいくつかのバリエーションは、図3A~3Eに示されるビットマスクの拡張である3Dビットマスクまたは3Dシノグラムを生成する工程を含み得る。3Dビットマスクまたは3Dシノグラムでは、治療用放射線ビーム面を基準とした患者プラットフォーム位置を表すさらなる軸(スライスまたはビームステーションまたは治療台位置またはアキシャルスライドインデックス(axial slide index)と称され得る)が、ガントリー発射位置を表す第1の軸およびMLCリーフインデックスを表す第2の軸とともに提供され得る。患者プラットフォーム位置および/またはアキシャルスライスインデックスおよび/または送達処置時間という第3次元を追加することによって、放射線治療システムのコントローラは、2Dビットマスクまたは2Dシノグラムと同じように比較され得る(がピクセルの代わりにボクセルを比較する)、MLCリーフ、回転可能ガントリーおよび患者プラットフォームの作動の3D表示を生成するように構成され得る。3Dシノグラムは、複数のボクセルまたは3D単位を含み得、ここで、各ボクセルは、特定のMLCリーフが、治療用放射線ビーム面を基準とした特定の患者プラットフォーム位置において特定のガントリー発射位置において開いているかまたは閉じていることになっていることを示唆する様々な視覚的に識別可能なしるしで記録され得る(例えば、陰影がつけられ得るかまたは埋められ得る)。いくつかのバリエーションにおいて、3Dビットマスクは、各患者プラットフォーム位置に対して、上に記載されたように個々の2Dビットマスクを生成し、隣接する患者プラットフォームの2Dビットマスクをタイリングして(またはその他の方法で綴じて)、3Dビットマスクを形成することによって生成され得る。いくつかのバリエーションにおいて、各ボクセルの陰影は、図3A~3Eで説明されている陰影と同様であり得る。これは、処置をより高い次元でスライスごとに比較することを助ける可能性があり、送達検証チェックポイントに対して許容され得る範囲を表すチューブ様の半透明のヘリックスであり得、不透明なボクセルは、計測されたリアルタイムデータを表す。図4Aは、3Dビットマスクまたは3Dシノグラム(4つのMLCリーフ、5つのガントリー発射位置および11個の患者プラットフォーム位置の場合)を示しており、ここで、1スライスあたりの送達検証チェックポイントは、妥当な(例えば、処置計画および/またはセグメント化されたフルエンス計画と一致する)および妥当でない(例えば、処置計画および/またはセグメント化されたフルエンス計画と一致しない)発射パターンの組み合わせをリアルタイムで表示する。例えば、時点t0における3Dビットマスクまたは3Dシノグラムは、複数の患者プラットフォーム位置にわたる複数のガントリー発射位置に対して開いてよい(すなわち、セグメント化されたフルエンスマップに従って指定されたように開くことが許容され得る)MLCリーフを示す。図4Bは、患者プラットフォーム位置1~3に、第2のパターン、例えば、薄い斑点で陰影がつけられたボクセルとして、放射線送達のために開かれたMLCリーフを示す時点t1における3Dビットマスクまたは3Dシノグラムを示している。図4Cは、患者プラットフォーム位置1~6に、第2のパターン、例えば、薄い斑点で陰影がつけられたボクセルとして、放射線送達のために開かれたMLCリーフを示す時点t1における3Dビットマスクまたは3Dシノグラムを示している。放射線送達のために開かなかったMLCリーフは、時点t0からの陰影を維持するボクセルによって表されている。セグメント化されたフルエンスマスクによって指定されたもの以外で開いたMLCリーフ(すなわち、セグメント化されたフルエンスマスクによって指定されておらず、かつ時点t0におけるビットマスクにおいて示されたボクセルの1つではない、開いているMLCリーフ)は、第3の異なる陰影パターン、例えば、ハッシュマークを有し得る。本明細書中に示される例は、様々な強度、不透明度または透明度およびグレースケールまたは白黒のパターンで陰影がつけられた(または埋められた)セル、ピクセルおよび/またはボクセルを示し得るが、他の例では、セル、ピクセルおよび/またはボクセルが、様々な強度、不透明度または透明度および1またはそれを超える色のパターンで陰影がつけられ得る(または埋められ得る)(例えば、カラー化され得る)ことが理解されるべきである。
3D sinogram Some variations of methods for monitoring radiation delivery and for generating graphical representations of radiation delivery involve generating a 3D bitmask or 3D sinogram, which is an extension of the bitmask shown in FIGS. 3A-3E. can include In a 3D bitmask or 3D sinogram, an additional axis (which may be referred to as slice or beam station or couch position or axial slide index) representing the patient platform position relative to the plane of the therapeutic radiation beam is the gantry. It may be provided with a first axis representing launch position and a second axis representing MLC leaf index. By adding a third dimension of patient platform position and/or axial slice index and/or delivery treatment time, the radiotherapy system controller can be compared in the same way as a 2D bitmask or 2D sinogram (but instead of pixels (comparing voxels to ), to generate a 3D representation of the operation of the MLC leaf, rotatable gantry and patient platform. A 3D sinogram may include a plurality of voxels or 3D units, where each voxel represents a specific MLC leaf opening at a specific gantry firing position at a specific patient platform position relative to the plane of the therapeutic radiation beam. It may be marked with various visually identifiable indicia (eg, may be shaded or filled in) to suggest that it is open or closed. In some variations, the 3D bitmask is generated by generating individual 2D bitmasks as described above for each patient platform position, tiling the 2D bitmasks of adjacent patient platforms (or otherwise bound) and by forming a 3D bit mask. In some variations, the shading of each voxel can be similar to the shading described in FIGS. 3A-3E. This may aid in slice-by-slice comparisons of treatments in higher dimensions, and may be tube-like translucent helices that represent acceptable ranges for delivery verification checkpoints, and opaque voxels are , represents the measured real-time data. FIG. 4A shows a 3D bitmask or 3D sinogram (for 4 MLC leaves, 5 gantry firing positions and 11 patient platform positions), where the delivery verification checkpoints per slice are valid. Display combinations of firing patterns that are invalid (e.g., consistent with the treatment plan and/or segmented fluence plan) and invalid (e.g., inconsistent with the treatment plan and/or segmented fluence plan) in real-time. For example, a 3D bitmask or 3D sinogram at time t 0 may open for multiple gantry firing positions across multiple patient platform positions (i.e., allow opening as specified according to the segmented fluence map). ) shows MLC leaves. FIG. 4B is a 3D bitmask at time t 1 showing the MLC leaves open for radiation delivery as voxels shaded with a second pattern, e.g., light spots, at patient platform positions 1-3 or 3D sinogram is shown. FIG. 4C is a 3D bitmask at time t 1 showing the MLC leaves open for radiation delivery as voxels shaded with a second pattern, e.g., light spots, at patient platform positions 1-6 or 3D sinogram is shown. MLC leaves that did not open for radiation delivery are represented by voxels that remain shaded from time t0 . Open MLC leaves other than those specified by the segmented fluence mask (i.e., not specified by the segmented fluence mask and not one of the voxels indicated in the bitmask at time t0 , open MLC leaves) may have a third different shading pattern, eg hash marks. Examples shown herein may show cells, pixels and/or voxels shaded (or filled) with varying intensities, opacity or transparency and grayscale or black and white patterns, but other In the example, cells, pixels and/or voxels can be shaded (or filled) (e.g., colored) with patterns of varying intensities, opacity or transparency and one or more colors. should be understood.
図4A~4Cに示されるシノグラムビットマスクの例は、11個の患者プラットフォーム位置/スライスに対する4つのバイナリーMLCリーフおよび5つのガントリー発射位置に対するリーフ配置および放射線強度を示しているが、異なる数のリーフ、ガントリー発射位置および患者プラットフォーム位置/スライスを有するバイナリーMLC(例えば、64-リーフバイナリーMLC、100個のガントリー発射位置、20~50個の患者プラットフォーム位置、ここで、各患者プラットフォーム位置の間の距離は、約2mmであり得る)を備えるシステムに対しても、同様のシノグラムビットマスクが生成され得ることが理解されるべきである。 The example sinogram bitmask shown in FIGS. 4A-4C shows leaf placement and radiation intensity for 4 binary MLC leaves for 11 patient platform positions/slices and 5 gantry firing positions, but with a different number of Binary MLC with leaves, gantry firing positions and patient platform positions/slices (eg, 64-leaf binary MLC, 100 gantry firing positions, 20-50 patient platform positions, where between each patient platform position It should be understood that a similar sinogram bitmask can be generated for a system with a distance of about 2 mm).
疑似カラー発射マップ
任意の所与の放射線送達に対して、処置計画フルエンスマップをセグメント化することによって、ガントリー角度1つあたりの予想発射量が生成され得る。処置計画フルエンスマップが、処置セッションの前、例えば、処置計画中および/または処置計画評価中にセグメント化され得る。代替的または追加的に、いくつかの方法は、MLCリーフの位置センサーおよび/またはモーションセンサーのデータ、ガントリーの位置センサーおよび/またはモーションセンサー(および/またはエンコーダー)のデータ、ならびに放射線強度データ(例えば、リニアックの電離箱もしくはドーズチャンバーおよび/またはMV検出器から取得されたデータ)を用いて疑似カラー発射マップを、放射線を送達するために最もよく使用されたリーフ/ガントリー位置の組み合わせの単一の2次元「ヒートマップ」に経時的に生成する工程を含み得る。これは、どれだけの放射線が送達されたか、または逆に、どれだけの放射線が所与の処置セッション中にまだ送達される必要があるかを推定するために使用され得る。図5Aは、経時的な発射蓄積の疑似カラーアレイまたは疑似カラー表示の1つのバリエーションを示しており、ここで、各横列がガントリー発射位置に対応し、各縦列がMLCリーフに対応する。各セルまたはピクセルにおける陰影または視覚的なしるしは、特定のガントリー発射位置において特定のMLCリーフを通って放射された放射線の強度レベルを表し得る。代替的または追加的に、陰影または視覚的なしるしは、ある1つのガントリー発射位置において特定のMLCリーフを通って適用された放射線パルスの数を反映し得る。放射線が放射される前の時点t0では、すべてのガントリー位置に対するすべてのMLCリーフに対する強度レベルが、「低」強度(または強度なし)と記録され得る。5つのガントリー発射位置の各々から放射線が放射された後の時点t1では、各セルは、そのリーフを通って適用された強度レベルに従って陰影がつけられ得る(例えば、低強度、中強度、高強度、ここで、各範囲は、所定の範囲または望ましいと指定される範囲であり得る)。5つのガントリー発射位置の各々からさらに放射線が放射された後(例えば、ガントリーが複数回回転した場合)の時点t2では、ある特定のMLCリーフに対する強度レベルは、上昇し得る。あるいは、発射パターンの組み合わせおよび強度のヒストグラム(例えば、様々な程度の飽和度または強度を有するグレースケールのヒストグラム)は、時間をかけて各MLCリーフを通って適用された累積放射線強度を合計することによって生成され得る。
Pseudocolor Discharge Map For any given radiation delivery, by segmenting the treatment plan fluence map, an expected discharge per gantry angle can be generated. A treatment plan fluence map may be segmented prior to a treatment session, eg, during treatment planning and/or treatment plan evaluation. Alternatively or additionally, some methods use MLC leaf position and/or motion sensor data, gantry position and/or motion sensor (and/or encoder) data, and radiation intensity data (e.g. , data acquired from the linac's ionization chamber or dose chamber and/or the MV detector) were used to generate pseudo-color launch maps of the most commonly used leaf/gantry position combinations to deliver radiation to a single It may include generating a two-dimensional "heat map" over time. This can be used to estimate how much radiation has been delivered or, conversely, how much radiation still needs to be delivered during a given treatment session. FIG. 5A shows one variation of a pseudo-color array or display of firing accumulation over time, where each row corresponds to a gantry firing position and each column corresponds to an MLC leaf. The shading or visual indicia at each cell or pixel may represent the intensity level of radiation emitted through a particular MLC leaf at a particular gantry firing position. Alternatively or additionally, the shading or visual indicia may reflect the number of radiation pulses applied through a particular MLC leaf at one gantry firing position. At time t 0 before radiation is emitted, intensity levels for all MLC leaves for all gantry positions can be recorded as "low" intensity (or no intensity). At time t 1 after radiation has been emitted from each of the five gantry firing positions, each cell may be shaded according to the intensity level applied through that leaf (e.g., low intensity, medium intensity, high intensity). intensity, where each range may be a predetermined range or a range specified as desirable). At time t2, after more radiation has been emitted from each of the five gantry firing positions (eg, if the gantry has rotated multiple times), the intensity level for a particular MLC leaf may rise. Alternatively, a combination of firing patterns and intensity histograms (e.g., grayscale histograms with varying degrees of saturation or intensity) can be obtained by summing the cumulative radiation intensity applied through each MLC leaf over time. can be generated by
図5Aに示されている疑似カラー発射マップの例は、3つの強度レベルにおける4つのバイナリーMLCリーフおよび5つのガントリー発射位置に対するリーフ配置および放射線強度を示しているが、異なる数のリーフ、ガントリー発射位置および強度レベル(例えば、64-リーフバイナリーMLC、100個のガントリー発射位置、1つの強度レベルまたは2つの強度レベルにおけるリニアック発射)を有するバイナリーMLCを備えるシステムに対しても同様の疑似カラー発射マップが生成され得ることが理解されるべきである。そのような疑似カラー発射マップも、患者が治療用放射線ビーム面を通ると同時に各患者プラットフォーム位置に対して生成、表示され得る。
ガントリーと相互に関連付けられたシノグラムおよび開口部のシミュレートビュー
The example pseudocolor firing map shown in FIG. 5A shows leaf placement and radiation intensity for four binary MLC leaves and five gantry firing positions at three intensity levels, but with different numbers of leaves, gantry firing Similar pseudo-color firing maps for systems with binary MLCs with positions and intensity levels (e.g., 64-leaf binary MLC, 100 gantry firing positions, linac firing at 1 or 2 intensity levels) can be generated. Such a pseudocolor projection map may also be generated and displayed for each patient platform position as the patient passes through the plane of the therapeutic radiation beam.
Simulated view of sinogram and opening correlated with gantry
処置セッションにおける任意の所与のポイントにおいて、単一の2Dシノグラムに経時的に併合され、マスクアウトされた発射活性が、表示され得る。例えば、いくつかのグラフィックは、ガントリー開口部の長手方向軸を通り抜ける(例えば、ガントリーの回転軸に沿って、治療用放射線ビーム面に対して垂直の)有効な視野の描写および回転可能な各ガントリー発射位置に対するMLCリーフの配置(例えば、バイナリーMLCの例における、開または閉)を示す発射シノグラムを含み得る。処置の経過中に、発射シノグラムは、複数のガントリー発射位置にわたるMLCリーフ動作の累積量を表し得、ガントリー開口部の長手方向軸を通り抜ける有効な視野は、患者に放射された放射線の累積形状を表し得る。発射シノグラムは、ガントリーの位置センサーおよび/またはモーションセンサーならびにMLCリーフの位置センサーおよび/またはモーションセンサーからのデータを用いて生成され得る。図6Aは、ガントリー開口部の長手方向軸を通り抜けた(例えば、仮想開口部の内側の)線量蓄積、および複数のガントリー発射位置にわたる(所与の患者プラットフォーム位置もしくはスライスに対するおよび/または特定の時点における)累積MLCリーフ動作を表すシノグラムを含む複合のグラフィック表示を示している。同様に、線量蓄積を表示する代わりに、放射線治療システムのコントローラは、ビーム発射界面(左のカラム)が、処置全体のシノグラム(右のカラム)と並んで表示されている図6Bに示されているように、シミュレートされた開口部に対するビーム発射を示し得るグラフィックを生成するように構成され得る。 At any given point in the treatment session, the merged and masked out firing activity over time into a single 2D sinogram can be displayed. For example, some graphics depict the effective field of view through the longitudinal axis of the gantry opening (e.g., along the gantry's axis of rotation, perpendicular to the plane of the therapeutic radiation beam) and each rotatable gantry. A launch sinogram may be included that shows the placement of the MLC leaves relative to the launch position (eg, open or closed in the binary MLC example). During the course of treatment, the firing sinogram may represent the cumulative amount of MLC leaf motion across multiple gantry firing positions, and the effective field of view through the longitudinal axis of the gantry opening represents the cumulative shape of the radiation emitted to the patient. can be expressed A launch sinogram may be generated using data from the gantry position and/or motion sensors and the MLC leaf position and/or motion sensors. FIG. 6A shows dose deposition through the longitudinal axis of the gantry opening (e.g., inside the virtual opening) and across multiple gantry firing positions (for a given patient platform position or slice and/or at specific time points). 3 shows a composite graphical display containing a sinogram representing cumulative MLC leaf motion at ). Similarly, instead of displaying the dose accumulation, the radiotherapy system controller would display the beam firing interface (left column) alongside the entire treatment sinogram (right column) as shown in FIG. 6B. It can be configured to generate a graphic that can show the beam firing against the simulated aperture, as is.
リアルタイムの4D線量像
いくつかの放射線治療システムは、4DのPETおよび/またはCTデータを得るように構成され得、そのような放射線治療システムは、4DのPETおよび/またはCTデータを取得した位相によってグループ化された予想送達線量を再構築するように構成され得る。セッション中の種々の時点(t=t1、t2、t3など)における8つの呼吸相にわたる線量沈着を表示している図7Aに示されているように、放射線治療システムのコントローラは、異なる呼吸相にわたる送達線量をリアルタイムで表すグラフィックまたは患者の解剖学的構造のシネマグラフィック表示を生成するように構成され得る。
Real-Time 4D Dose Imaging Some radiotherapy systems can be configured to acquire 4D PET and/or CT data, such radiotherapy systems phase acquired 4D PET and/or CT data. It may be configured to reconstruct grouped expected delivered doses. As shown in FIG. 7A, which displays dose deposition over eight respiratory phases at various times during the session (t=t 1 , t 2 , t 3 , etc.), the controller of the radiotherapy system has different It may be configured to generate a graphic or cinemagraphic display of the patient's anatomy that represents the delivered dose over the respiratory phase in real time.
線量目標および計画品質のリアルタイム比較
放射線送達における任意の所与の時点において、放射線治療システムは、放射線送達が、順調に進んで、計画システムまたは操作者によって指定された線量目標および計画品質インデックスを満たすか否かを計算するように構成され得る。これらの線量目標およびPQIの各々は、図8Aに示されているような、処置計画の目標が適切に達成されている(すなわち、送達メトリックが、所定の基準を満たしているか、または所定の基準範囲内である)、許容され得る範囲および許容度を有する独自の送達検証チェックポイントを有し得る。図8Bは、処置計画の目標が、適切に達成されていない(すなわち、送達メトリックが、所定の基準範囲を満たしていないか、または所定の基準範囲内でない)一例を示している。様々なPQIおよび/または線量目標の値が、処置セッション中に取得されたデータ、例えば、イメージングシステムからのデータ(例えば、PET検出器、X線検出器、MRI検出器、超音波振動子および/または光学カメラもしくは光学イメージャーのうちの1またはそれを超えるものからのイメージングデータおよび/または画像)、ならびに/またはガントリーと関連付けられた位置センサーおよび/もしくはモーションセンサーからのデータ、ならびに/またはリニアックコントローラおよび/もしくは電離箱および/もしくはリニアックの真向かいに配置されたMV検出器からのデータ、ならびに/またはジョーに関連付けられた位置センサーおよび/もしくはモーションセンサーからのデータ、ならびに/またはMLCのリーフに関連付けられた位置センサーおよび/もしくはモーションセンサーからのデータを用いて計算され得る。必要に応じて、患者に送達された放射線量は、線量計算マトリックス(すなわち、患者の中の予め選択された領域セットまたはボクセルセットにおける線量値に放射線フルエンス値をマッピングするマトリックス)、イメージングシステムからのイメージングデータ、および処置計画中に生成された放射線発射マトリックス(すなわち、イメージングデータからフルエンスマップへの変換を指定するマトリックス)を用いて計算され得る。許容度の値は、臨床医によって決定され得る。放射線治療システムのコントローラは、PQIおよび/または線量目標のうちの1またはそれを超えるものが範囲外である場合、通知および/または警告(視覚的および/または聴覚的であり得る)を生成するように構成され得る。いくつかのバリエーションにおいて、PQIおよび/または線量目標が、高い閾値または低い閾値を超える場合、放射線治療システムは、放射線送達を中止する(例えば、終了させるまたは一時停止する)ように構成され得る。
Real Time Comparison of Dose Targets and Plan Quality At any given point in radiation delivery, the radiotherapy system will ensure that radiation delivery is on track to meet the dose target and plan quality index specified by the planning system or operator. It may be configured to calculate whether or not Each of these dose targets and PQIs are adequately met (i.e., delivery metrics meet predetermined criteria or within range) and have their own delivery verification checkpoints with acceptable ranges and tolerances. FIG. 8B illustrates an example where the goals of the treatment plan are not being adequately met (ie, the delivery metric does not meet or fall within the predetermined reference range). Various PQI and/or dose target values may be applied to data acquired during a treatment session, e.g., data from imaging systems (e.g., PET detectors, X-ray detectors, MRI detectors, ultrasound transducers and/or or imaging data and/or images from one or more of an optical camera or optical imager), and/or data from position and/or motion sensors associated with the gantry, and/or a linac controller and/or data from the ionization chamber and/or the MV detector located directly opposite the linac, and/or data from the position and/or motion sensors associated with the jaws and/or the leaves of the MLC. may be calculated using data from position sensors and/or motion sensors. Optionally, the dose of radiation delivered to the patient is calculated using a dose calculation matrix (i.e., a matrix that maps radiation fluence values to dose values in a preselected set of regions or voxels within the patient), from the imaging system. It can be calculated using the imaging data and a radiation firing matrix generated during treatment planning (ie, a matrix specifying the transformation from imaging data to fluence maps). Tolerance values can be determined by the clinician. A controller of a radiation therapy system to generate a notification and/or warning (which may be visual and/or audible) if one or more of the PQI and/or dose targets are out of range. can be configured to In some variations, the radiation therapy system may be configured to discontinue (e.g., terminate or suspend) radiation delivery if the PQI and/or dose target exceed a high threshold or a low threshold.
送達検証チェックポイントインターロック
放射線送達中のグラフィック表示に表示される送達検証チェックポイントのすべてに対して、放射線治療システムのコントローラは、放射線送達処置セッション全体にわたる各チェックポイントにおいて、PQI値および/または線量目標を計算して適合性を確認するように構成され得る。上に記載されたように、PQI値および/または線量目標は、処置セッション中に取得されたデータ、例えば、イメージングシステムからのデータ(例えば、PET検出器、X線検出器、MRI検出器、超音波振動子および/または光学カメラもしくは光学イメージャーのうちの1またはそれを超えるものからのイメージングデータおよび/または画像)、ならびに/またはガントリーと関連付けられた位置センサーおよび/もしくはモーションセンサーからのデータ、ならびに/またはリニアックコントローラおよび/もしくは電離箱および/もしくはリニアックの真向かいに配置されたMV検出器からのデータ、ならびに/またはジョーに関連付けられた位置センサーおよび/もしくはモーションセンサーからのデータ、ならびに/またはMLCのリーフに関連付けられた位置センサーおよび/もしくはモーションセンサーからのデータを用いて計算され得る。必要に応じて、患者に送達された放射線量は、線量計算マトリックス(すなわち、患者の中の予め選択された領域セットまたはボクセルセットにおける線量値に放射線フルエンス値をマッピングするマトリックス)、イメージングシステムからのイメージングデータ、および処置計画中に生成された放射線発射マトリックス(すなわち、イメージングデータからフルエンスマップへの変換を指定するマトリックス)を用いて計算され得る。チェックポイントは、処置セッション中の所定の時点、例えば、放射線ビームがオンになった後の絶対時点(例えば、ビームがオンになった5秒後、10秒後、15秒後など)、放射線ビームがオンになった後の規定間隔(例えば、10秒ごと、20秒ごと、30秒ごと、1分ごと、5分ごとなど)、処置セッション時間全体に対する割合である相対的な時点(例えば、予想される全処置時間の5%、10%、15%など)、および/または放射されたリニアックパルス数(例えば、100リニアックパルスごと、200リニアックパルスごと、500リニアックパルスごとなど)であり得る。いくつかのバリエーションにおいて、放射線治療システムのコントローラは、1もしくはそれを超えるPQI値および/もしくは線量目標が、許容され得る範囲内でないとき、インターロック(すなわち、放射線送達を停止するためのコマンド)の引き金を引くかもしくはインターロックを生成するように構成されまたは他の状況を表示するように構成され得る。図9Aは、様々なチェックポイントにおいて、PQI値および/または線量目標が満たされているか否かのインターロックまたは通知の例を示している。「合格」というチェックポイントステータスまたはチェックポイント値は、1またはそれを超えるPQI値および/または線量目標が、処置計画によって指定された範囲または許容度に入っている可能性があることを示唆し得る。「不合格」というチェックポイントステータスは、1またはそれを超えるPQI値および/または線量目標が、処置計画によって指定された範囲または許容度から外れている可能性があることを示唆し得る。あるチェックポイントが、「不合格」というステータスを有する場合、放射線治療システムのコントローラは、放射線送達を停止する(例えば、治療用放射線源を切る、および/またはMLCリーフを閉じる、および/またはガントリーの動きをやめる)ためのコマンドシグナルを生成し得る。いくつかのバリエーションにおいて、「警告」というチェックポイントステータスまたはチェックポイント値は、1またはそれを超えるまたはそれを超えるPQI値および/または線量目標が、処置計画によって指定された範囲内もしくは許容度内であるが、その範囲もしくは許容度の上界または下界の近傍にあること、および/あるいは範囲内のPQI値および/もしくは線量目標の数が、範囲内ではないPQI値および/もしくは線量目標の数より多いことを示唆し得る。「警告」というチェックポイントステータスまたはチェックポイント値は、操作者に放射線送達を一時停止して、ある特定の放射線治療システムコンポーネントの機能を確認することを促し得る。いくつかのバリエーションにおいて、「進行中」というチェックポイントステータスまたはチェックポイント値は、放射線治療システムのコントローラが、そのシステムのチェックポイントの合否判定中であることを示唆し得る。これらの視覚的なしるしは、必要に応じて、可聴信号を伴い得る。
Delivery Verification Checkpoint Interlock For all of the delivery verification checkpoints that appear on the graphical display during radiation delivery, the radiation therapy system controller will interlock the PQI value and/or dose at each checkpoint throughout the radiation delivery treatment session. It can be configured to calculate goals and check suitability. As described above, PQI values and/or dose targets are derived from data acquired during a treatment session, e.g., data from an imaging system (e.g., PET detector, X-ray detector, MRI detector, ultra imaging data and/or images from one or more of an acoustic transducer and/or an optical camera or optical imager), and/or data from position and/or motion sensors associated with the gantry; and/or data from the linac controller and/or the ionization chamber and/or the MV detector located across from the linac, and/or data from the position and/or motion sensors associated with the jaws, and/or the MLC can be calculated using data from position and/or motion sensors associated with the leaves of the Optionally, the dose of radiation delivered to the patient is calculated using a dose calculation matrix (i.e., a matrix that maps radiation fluence values to dose values in a preselected set of regions or voxels within the patient), from the imaging system. It can be calculated using the imaging data and a radiation firing matrix generated during treatment planning (ie, a matrix specifying the transformation from imaging data to fluence maps). A checkpoint is a predetermined time point during a treatment session, e.g., an absolute time point after the radiation beam is turned on (e.g., 5 seconds, 10 seconds, 15 seconds, etc. defined intervals after the is turned on (e.g., every 10 seconds, 20 seconds, 30 seconds, 1 minute, 5 minutes, etc.), relative time points that are a percentage of the total treatment session time (e.g., expected 5%, 10%, 15%, etc. of the total treatment time delivered), and/or the number of linac pulses emitted (eg, every 100 linac pulses, every 200 linac pulses, every 500 linac pulses, etc.). In some variations, the controller of the radiation therapy system issues an interlock (i.e., command to stop radiation delivery) when one or more PQI values and/or dose targets are not within acceptable ranges. It may be configured to trigger or generate an interlock or to indicate other conditions. FIG. 9A shows examples of interlocking or notification of whether PQI values and/or dose targets are met at various checkpoints. A checkpoint status or checkpoint value of "Pass" may indicate that one or more PQI values and/or dose targets may fall within the range or tolerance specified by the treatment plan. . A checkpoint status of "failed" may indicate that one or more PQI values and/or dose targets may be outside the range or tolerance specified by the treatment plan. If a checkpoint has a "failed" status, the radiation therapy system controller stops radiation delivery (e.g., turns off the therapeutic radiation source and/or closes the MLC leaf and/or gantry command signal to stop movement). In some variations, a checkpoint status or checkpoint value of "warning" indicates that a PQI value of 1 or greater or greater and/or a dose target is within the range or tolerance specified by the treatment plan. but near the upper or lower bounds of the range or tolerance, and/or the number of PQI values and/or dose targets within range is greater than the number of PQI values and/or dose targets that are not within range. It can suggest many things. A checkpoint status or checkpoint value of "warning" may prompt the operator to pause radiation delivery and verify the functionality of certain radiation therapy system components. In some variations, a checkpoint status or checkpoint value of "in progress" may indicate that the radiation therapy system controller is in the process of passing or failing a checkpoint for that system. These visual indicia may optionally be accompanied by an audible signal.
コントローラ
処置セッション中に放射線送達をモニターするように構成されおよび処置セッション中に取得されたセンサーデータを用いて放射線送達のグラフィック表示を生成するように構成され得る放射線治療システムは、放射線治療(radiaotherapy)システムのイメージングシステムおよび/または治療用放射線源および/またはマルチリーフコリメータおよび/またはガントリーと通信しているコントローラを備え得る。そのコントローラは、1またはそれを超えるプロセッサ、およびその1またはそれを超えるプロセッサと通信している1またはそれを超える機械可読のメモリーを備え得る。そのコントローラは、有線通信路または無線通信路によって放射線処置システムおよび/または他のシステムと接続されて得る。いくつかのバリエーションにおいて、放射線治療システムのコントローラは、患者と同じ部屋または異なる部屋に配置され得る。例えば、コントローラは、患者プラットフォームと連結され得るか、または患者および/もしくは操作者の近くにある移動用ベッドまたは医療用カートに配置され得る。
Controller A radiation therapy system configured to monitor radiation delivery during a treatment session and configured to generate a graphical representation of radiation delivery using sensor data acquired during the treatment session is a radiotherapy A controller in communication with the system's imaging system and/or therapeutic radiation source and/or multi-leaf collimator and/or gantry may be included. The controller may comprise one or more processors and one or more machine-readable memories in communication with the one or more processors. The controller may be connected with the radiation treatment system and/or other systems by wired or wireless communication paths. In some variations, the radiotherapy system controller may be located in the same room as the patient or in a different room. For example, the controller may be coupled with a patient platform or located on a transfer bed or medical cart near the patient and/or operator.
数多くの汎用または専用のコンピュータシステムまたは機器構成と適合するコントローラが与えられ得る。本明細書中に開示されるシステムおよびデバイスとの使用に適し得る様々な例示的なコンピュータシステム、コンピュータ環境および/またはコンピュータ機器構成としては、パーソナルコンピュータデバイス内のまたはパーソナルコンピュータデバイスに組み入れられたソフトウェアまたは他のコンポーネント、ネットワークアプライアンス、サーバーまたはサーバーコンピューティングデバイス(例えば、ルーティングコンポーネント/接続コンポーネント)、ポータブル(例えば、携帯型)デバイスまたはラップトップデバイス、マルチプロセッサシステム、マイクロプロセッサーベースシステム、および分散コンピューティングネットワークが挙げられ得るが、これらに限定されない。 Controllers compatible with numerous general purpose or special purpose computer systems or configurations may be provided. Various exemplary computer systems, computer environments and/or computer configurations that may be suitable for use with the systems and devices disclosed herein include software in or incorporated into a personal computer device or other components, network appliances, servers or server computing devices (e.g., routing components/connectivity components), portable (e.g., handheld) or laptop devices, multiprocessor systems, microprocessor-based systems, and distributed computing Networks may include, but are not limited to.
ポータブルコンピュータデバイスの例としては、スマートフォン、携帯情報端末(PDA)、携帯電話、タブレットPC、ファブレット(スマートフォンより大きいがタブレットより小さいパーソナルコンピュータデバイス)などが挙げられ得る。 Examples of portable computing devices may include smart phones, personal digital assistants (PDAs), mobile phones, tablet PCs, phablets (personal computing devices that are larger than smart phones but smaller than tablets), and the like.
プロセッサ
いくつかのバリエーションにおいて、プロセッサは、命令一式またはコード一式を走らせるおよび/または実行するように構成される任意の好適なプロセッシングデバイスであり得、それらには、1またはそれを超えるデータ処理装置、画像処理装置、グラフィックプロセッシングユニット、デジタルシグナルプロセッサおよび/または中央処理装置が含まれ得る。プロセッサとしては、例えば、汎用プロセッサ、フィールドプログラマブルゲートアレイ(FPGA)、アプリケーション向け集積回路(ASIC)などが挙げられ得る。プロセッサは、システムおよび/またはそれに関連付けられているネットワークに関連付けられている、アプリケーションプロセスならびに/または他のモジュール、プロセスおよび/もしくは機能を走らせるおよび/または実行するように構成され得る。基となるデバイス技術は、種々のコンポーネントタイプ、例えば、相補型金属酸化物半導体(CMOS)のような酸化金属半導体電界効果トランジスター(MOSFET)技術、エミッター結合論理(ECL)のようなバイポーラ技術、ポリマー技術(例えば、ケイ素結合体化ポリマーおよび金属結合体化ポリマー-金属構造)、アナログとデジタルとの組み合わせなどとして提供され得る。
メモリー
Processor In some variations, a processor may be any suitable processing device configured to run and/or execute a set of instructions or code, including one or more data processing devices. , an image processor, a graphics processing unit, a digital signal processor and/or a central processing unit. Processors may include, for example, general purpose processors, field programmable gate arrays (FPGAs), application specific integrated circuits (ASICs), and the like. The processor may be configured to run and/or execute application processes and/or other modules, processes and/or functions associated with the system and/or networks associated therewith. The underlying device technology is based on a variety of component types, e.g. metal oxide semiconductor field effect transistor (MOSFET) technology such as complementary metal oxide semiconductor (CMOS), bipolar technology such as emitter coupled logic (ECL), polymer It can be provided as technologies (eg, silicon-conjugated polymer and metal-conjugated polymer-metal structures), analog and digital combinations, and the like.
memory
いくつかのバリエーションにおいて、コントローラと関連付けられた1またはそれを超える記憶素子には、データベースが含まれ得、そのような記憶素子は、例えば、ランダムアクセスメモリー(RAM)、メモリーバッファー、ハードドライブ、消去可能なプログラマブル読み出し専用メモリー(EPROM)、電気的消去可能な読み出し専用メモリー(EEPROM)、読み出し専用メモリー(ROM)、フラッシュメモリーなどであり得る。メモリーは、システムと関連付けられたモジュール、プロセスおよび/または機能をプロセッサに実行させるための命令を保存し得る。メモリーに保存され得る情報のタイプの例としては、1またはそれを超える処置計画、イメージングデータ、位置センサーおよび/またはモーションセンサーのデータ、処置計画および/または臨床上の目標に基づくフルエンスマップ、フルエンスマップ、放射線療法システムの命令(例えば、ガントリー、治療用放射線源、マルチリーフコリメータ、ならびに/あるいは放射線療法システムおよび/または診断システムもしくは処置計画システムの他の任意のコンポーネントの操作を指示し得るもの)を含むセグメント化されたフルエンスマップの計算結果と関連付けられた任意のデータ、ならびに処置計画および/または送達と関連付けられた画像処理命令および/またはデータ処理命令が挙げられ得るが、これらに限定されない。 In some variations, one or more storage elements associated with the controller can include a database, such storage elements such as random access memory (RAM), memory buffers, hard drives, erase programmable read-only memory (EPROM), electrically erasable read-only memory (EEPROM), read-only memory (ROM), flash memory, and the like. The memory may store instructions for causing the processor to execute modules, processes and/or functions associated with the system. Examples of types of information that may be stored in memory include one or more of treatment plans, imaging data, position and/or motion sensor data, treatment plans and/or clinical goal-based fluence maps, fluence maps , radiotherapy system instructions (e.g., which may direct the operation of the gantry, therapeutic radiation source, multi-leaf collimator, and/or any other component of the radiotherapy system and/or diagnostic or treatment planning system). Any data associated with segmented fluence map computations, including, but not limited to, image processing instructions and/or data processing instructions associated with treatment planning and/or delivery.
本明細書中に記載されるいくつかのバリエーションは、コンピュータによって実行される様々な演算を行うための命令またはその計算機コードを有する非一時的コンピュータ可読媒体(非一時的プロセッサ可読媒体とも称され得る)を備えるコンピュータストレージ製品に関する。そのコンピュータ可読媒体(またはプロセッサ可読媒体)は、それが、一時的な伝搬信号それ自体(例えば、スペースまたはケーブルなどの伝送媒体上に情報を保持している伝搬電磁波)を含まないという意味において非一時的である。その媒体および計算機コード(コードまたはアルゴリズムとも称され得る)は、具体的な目的のために設計され、構築されたものであり得る。非一時的コンピュータ可読媒体の例としては、磁気記憶媒体(例えば、ハードディスク、フロッピー(登録商標)ディスクおよび磁気テープ);光学式記憶媒体(例えば、コンパクトディスク/デジタルビデオディスク(CD/DVD));コンパクトディスク読出し専用メモリー(CD-ROM)およびホログラフィックデバイス;光磁気記憶媒体(例えば、光ディスク);ソリッドステートストレージデバイス(例えば、ソリッドステートドライブ(SSD)およびソリッドステートハイブリッドドライブ(SSHD));搬送波信号プロセッシングモジュール;ならびにプログラムコードを保存および実行するような特別な設定になっているハードウェアデバイス(例えば、特定用途向け集積回路(ASIC)、プログラム可能論理回路(PLD)、読み出し専用メモリー(ROM)およびランダムアクセスメモリー(RAM)デバイス)が挙げられるが、これらに限定されない。本明細書中に記載される他のバリエーションは、例えば、本明細書中に開示される命令および/または計算機コードを含み得る、コンピュータプログラム製品に関する。 Some variations described herein include non-transitory computer-readable media (also referred to as non-transitory processor-readable media) having instructions or computer code thereof for performing various computer-implemented operations. ) for computer storage products. The computer-readable medium (or processor-readable medium) is non-transitory in the sense that it does not include transitory propagating signals per se (e.g., propagating electromagnetic waves carrying information on a transmission medium such as space or cables). Temporary. The medium and computer code (which may also be referred to as code or algorithms) may be designed and constructed for a specific purpose. Examples of non-transitory computer-readable media include magnetic storage media (e.g. hard disks, floppy disks and magnetic tapes); optical storage media (e.g. compact discs/digital video discs (CD/DVD)); compact disc read-only memory (CD-ROM) and holographic devices; magneto-optical storage media (e.g., optical discs); solid-state storage devices (e.g., solid-state drives (SSD) and solid-state hybrid drives (SSHD)); carrier wave signals processing modules; and hardware devices specially configured to store and execute program code (e.g., application specific integrated circuits (ASICs), programmable logic circuits (PLDs), read-only memories (ROMs) and Random Access Memory (RAM) devices), but not limited to. Other variations described herein relate to computer program products, which may include, for example, instructions and/or computer code disclosed herein.
ユーザーインターフェースは、操作者または臨床医と放射線治療システムとの間の通信用インターフェースとしての機能を果たし得る。ユーザーインターフェースは、入力デバイスおよび出力デバイス(例えば、タッチスクリーンおよびディスプレイ)を備え得、サポートアーム、外部磁石、センサー、送達デバイス、入力デバイス、出力デバイス、ネットワーク、データベースおよびサーバーのうちの1またはそれを超えるものからの入力データおよび出力データを受信するように構成され得る。1またはそれを超えるセンサーからのセンサーデータは、ユーザーインターフェースによって受信され得、1もしくはそれを超える出力デバイスによって、視覚的に、聴覚的に、および/または触覚フィードバックを通じて、出力され得る。別の例として、操作者による入力デバイス(例えば、ジョイスティック、キーボード、タッチスクリーン)の制御が、ユーザーインターフェースによって受信され得、次いで、そのユーザーインターフェース用のプロセッサおよびメモリーによって処理されて、制御信号が、1またはそれを超えるサポートアーム、ガントリー、外部磁石、腔内デバイスおよび送達デバイスに出力され得る。 A user interface may serve as an interface for communication between an operator or clinician and the radiation therapy system. The user interface may comprise input and output devices (e.g., touch screens and displays) and may include one or more of support arms, external magnets, sensors, delivery devices, input devices, output devices, networks, databases and servers. It may be configured to receive input data and output data from more than one. Sensor data from one or more sensors may be received by the user interface and output by one or more output devices visually, audibly, and/or through tactile feedback. As another example, an operator's control of an input device (e.g., joystick, keyboard, touch screen) can be received by a user interface and then processed by the processor and memory for that user interface to produce a control signal that: It can be output to one or more of support arms, gantry, external magnets, intraluminal devices and delivery devices.
放射線治療システムのいくつかのバリエーションは、操作者がフルエンスマップのグラフィック表示および/もしくはテキスト表示、ならびに/または線量分布もしくは線量プロファイル、ならびに/または関心領域、ならびに/または関心体積、ならびに/または患者の解剖学的画像、ならびに/または患者のデータ(例えば、生理学的および/または生物学的なデータ)、ならびに/または放射線送達のグラフィック表示(本明細書中に記載されるようなグラフィック表示)などを見ることができるようにし得るディスプレイデバイスを備え得る。いくつかのバリエーションにおいて、出力デバイスは、発光ダイオード(LED)、液晶ディスプレイ(LCD)、エレクトロルミネッセンスディスプレイ(ELD)、プラズマディスプレイパネル(PDP)、薄膜トランジスター(TFT)、有機発光ダイオード(OLED)、電子ペーパー/e-inkディスプレイ、レーザーディスプレイおよび/またはホログラフィックディスプレイのうちの少なくとも1つを含むディスプレイデバイスを備え得る。 Some variations of radiation therapy systems allow the operator to view graphical and/or textual displays of fluence maps, and/or dose distributions or profiles, and/or regions of interest, and/or volumes of interest, and/or patient Anatomical images, and/or patient data (e.g., physiological and/or biological data), and/or graphical representations of radiation delivery (graphic representations as described herein), etc. A display device may be provided to enable viewing. In some variations, the output device is a light emitting diode (LED), liquid crystal display (LCD), electroluminescent display (ELD), plasma display panel (PDP), thin film transistor (TFT), organic light emitting diode (OLED), electronic A display device may be provided that includes at least one of a paper/e-ink display, a laser display and/or a holographic display.
通信
いくつかの実施形態において、放射線治療システムは、例えば、1またはそれを超えるネットワークを介して、他のコンピュータデバイスと通信していることがあり、そのネットワークの各々は、任意のタイプのネットワーク(例えば、有線ネットワーク、無線ネットワーク)であってよい。無線ネットワークとは、いかなる種類のケーブルによっても接続されていない任意のタイプのデジタルネットワークのことを指し得る。無線ネットワークにおける無線通信の例としては、セルラー通信、無線(radio)通信、衛星通信およびマイクロ波通信が挙げられるが、これらに限定されない。しかしながら、無線ネットワークは、インターネット、他のキャリアーの音声ネットワークおよびデータネットワーク、ビジネスネットワークならびにパーソナルネットワークと接続するために有線ネットワークに接続してもよい。有線ネットワークは、通常、銅ツイストペア同軸ケーブルおよび/または光ファイバーケーブルに乗って運ばれる。多くの異なるタイプの有線ネットワークがあり、それらとしては、広域ネットワーク(WAN)、メトロポリタンエリアネットワーク(MAN)、ローカルエリアネットワーク(LAN)、インターネットエリアネットワーク(IAN)、キャンパスエリアネットワーク(CAN)、インターネットのようなグローバルエリアネットワーク(GAN)および仮想プライベートネットワーク(VPN)が挙げられる。本明細書中以後、ネットワークとは、統合ネットワーキング情報アクセスシステムを提供するために、通常インターネットを通じて相互接続される、無線ネットワーク、有線ネットワーク、公衆データ網およびプライベートデータネットワークの任意の組み合わせのことを指す。
Communication In some embodiments, the radiation therapy system may be in communication with other computing devices, for example, via one or more networks, each of which may be any type of network ( For example, it may be a wired network, a wireless network). A wireless network may refer to any type of digital network that is not connected by cables of any kind. Examples of wireless communications in wireless networks include, but are not limited to, cellular communications, radio communications, satellite communications, and microwave communications. However, wireless networks may connect to wired networks for connection to the Internet, other carriers' voice and data networks, business networks and personal networks. Wireline networks are typically carried over copper twisted-pair coaxial cables and/or fiber optic cables. There are many different types of wired networks, including Wide Area Networks (WAN), Metropolitan Area Networks (MAN), Local Area Networks (LAN), Internet Area Networks (IAN), Campus Area Networks (CAN), Internet global area networks (GANs) and virtual private networks (VPNs). Network hereinafter refers to any combination of wireless, wireline, public and private data networks interconnected, typically through the Internet, to provide an integrated networking information access system. .
セルラー通信は、GSM(登録商標)、PCS、CDMAまたはGPRS、W-CDMA、EDGEまたはCDMA2000、LTE、WiMAXおよび5Gネットワーキング規格などの技術を含み得る。いくつかの無線ネットワーク配備は、複数のセルラーネットワークからネットワークを組み合わせるか、またはセルラー通信、Wi-Fi通信および衛星通信の組み合わせを使用する。いくつかの実施形態において、本明細書中に記載されるシステム、装置および方法は、1またはそれを超えるデバイスおよび/またはネットワークと通信するために高周波受信機、高周波送信機ならびに/または光学(例えば、赤外)受信機および送信機を含み得る。 Cellular communications may include technologies such as GSM, PCS, CDMA or GPRS, W-CDMA, EDGE or CDMA2000, LTE, WiMAX and 5G networking standards. Some wireless network deployments combine networks from multiple cellular networks or use a combination of cellular, Wi-Fi and satellite communications. In some embodiments, the systems, apparatus and methods described herein use radio frequency receivers, radio frequency transmitters and/or optics (e.g. , infrared) receiver and transmitter.
様々な発明のバリエーションを本明細書中で説明し、例証してきたが、当業者は、その機能を実行するため、ならびに/または結果および/もしくは本明細書中に記載される1もしくはそれを超える利点を得るための他の種々の手段および/または構造を容易に構想するだろうし、そのようなバリエーションおよび/または改変の各々が、本明細書中に記載される本発明の実施形態の範囲内であるとみなされる。より一般的なこととして、当業者は、本明細書中に記載されるすべてのパラメータ、寸法、材料および配置が、例示であると意図されていること、ならびに実際のパラメータ、寸法、材料および/または配置は、本発明の教示が用いられる具体的な用途に依存することを容易に認識するだろう。当業者は、本明細書中に記載される具体的な本発明のバリエーションの多くの均等物を認識するか、または単なる日常的な実験法を用いて確かめることができる。ゆえに、前述のバリエーションは、単なる例として提示されていること、および本発明のバリエーションが、具体的に説明および特許請求されるものとは違う方法で、添付の請求項およびその均等物の範囲内で実施され得ることが理解されるべきである。本開示の発明のバリエーションは、本明細書中に記載された個々の特徴、システム、物品、材料、キットおよび/または方法の各々を対象にしている。さらに、2またはそれを超えるそのような特徴、システム、物品、材料、キットおよび/または方法の任意の組み合わせは、そのような特徴、システム、物品、材料、キットおよび/または方法が相互に矛盾しない場合、本開示の発明の範囲内に含まれる。 While various variations of the invention have been described and exemplified herein, those skilled in the art will appreciate the ability to perform its functions and/or the results and/or one or more of the methods described herein. Various other means and/or structures to obtain advantages may be readily envisioned, and each such variation and/or modification is within the scope of the embodiments of the invention described herein. is considered to be More generally, those skilled in the art will appreciate that all parameters, dimensions, materials and arrangements described herein are intended to be exemplary and that actual parameters, dimensions, materials and/or Alternatively, one will readily recognize that the placement will depend on the specific application in which the teachings of the present invention are used. Those skilled in the art will recognize, or be able to ascertain using no more than routine experimentation, many equivalents to the variations of the specific inventions described herein. It is therefore intended that the foregoing variations are presented by way of example only and that variations of the invention may fall within the scope of the appended claims and their equivalents in ways other than as specifically described and claimed. It should be understood that it can be implemented in Inventive variations of the present disclosure are directed to each individual feature, system, article, material, kit, and/or method described herein. Moreover, any combination of two or more of such features, systems, articles, materials, kits and/or methods is not mutually exclusive of such features, systems, articles, materials, kits and/or methods. are included within the scope of the present disclosure.
Claims (51)
回転可能ガントリーと、
前記回転可能ガントリーに連結されたガントリー位置センサーと、
前記回転可能ガントリーに搭載されており、前記回転可能ガントリーを回転させることによって複数のガントリー発射位置に移動可能である、治療用放射線源と、
前記治療用放射線源の放射線ビームパスに配置された放射線検出器と、
前記治療用放射線源の前記放射線ビームパスに配置されたビーム成形コンポーネントであって、前記ビーム成形コンポーネントは、サイズおよび形状を有する放射線透過アパーチャを有するように構成される、ビーム成形コンポーネントと、
前記放射線透過アパーチャの前記サイズおよび形状を検出するように構成される、ビーム成形コンポーネントセンサーと、
コントローラと通信しているディスプレイと
を備え、
前記コントローラは、放射線送達メトリックの計画された値を経時的に記憶する機械可読の記憶媒体、およびプロセッサを備え、前記プロセッサは、
放射線送達セッション中に前記ガントリー位置センサーおよび/または放射線検出器および/またはビーム成形コンポーネントセンサーから取得されたデータに基づいて、前記放射線送達セッション中の複数の時点において前記放射線送達メトリックのリアルタイム値を計算することと、
前記複数の時点にわたる、前記放射線送達メトリックの前記計画された値および前記放射線送達メトリックのリアルタイム値を示すグラフィック表示を生成することと、
前記グラフィック表示を前記ディスプレイに出力することと
を行うように構成され、
前記ビーム成形コンポーネントが、複数のリーフを有するダイナミックマルチリーフコリメータ(MLC)を備え、前記ビーム成形コンポーネントセンサーが、前記複数のリーフに連結された複数のリーフ位置センサーおよび/またはモーションセンサーを備え、
前記放射線送達メトリックのリアルタイム値が、前記放射線送達セッション中に取得された、前記ガントリー位置センサー、放射線検出器、リーフ位置センサー、およびモーションセンサーのうちの1つ以上からのデータを用いて生成された放射線量分布であり、前記グラフィック表示が、前記回転可能ガントリーの回転軸に沿ったガントリー開口部内の前記放射線量分布のシミュレートビューをさらに含む、システム。 A system for radiation therapy, said system comprising:
rotatable gantryWhen,
A gantry position sensor coupled to the rotatable gantryWhen,
mounted on said rotatable gantry, saidrotatableA therapeutic radiation source movable to multiple gantry firing positions by rotating the gantryWhen,
a radiation detector positioned in the radiation beam path of said therapeutic radiation sourceWhen,
A beam shaping component disposed in the radiation beam path of the therapeutic radiation source, the beam shaping component comprising:,A beam shaping component configured to have a radiolucent aperture having a size and shape.When,
A beam shaping component sensor configured to detect the size and shape of the radiolucent aperture.When,
A display communicating with the controllerWhen
equipped with,
Said controller is, releaseof radiation delivery metricsPlanneda machine-readable storage medium that stores values over time;and a processor, said processor comprising:
calculating real-time values of the radiation delivery metrics at multiple time points during the radiation delivery session based on data acquired from the gantry position sensors and/or radiation detectors and/or beam shaping component sensors during the radiation delivery session; doand
before, across said plurality of time pointsreleaseRadiation delivery metricSaid planned ofvalue and beforereleaseRadiation delivery metricreal time ofGenerate a graphical display showing the valuesand
outputting the graphical representation to the displaythings and
I doconfigured as,
said beam shaping component comprising a dynamic multi-leaf collimator (MLC) having a plurality of leaves, said beam shaping component sensor comprising a plurality of leaf position and/or motion sensors coupled to said plurality of leaves;
Real-time values of the radiation delivery metrics were generated using data from one or more of the gantry position sensors, radiation detectors, leaf position sensors, and motion sensors acquired during the radiation delivery session. a radiation dose distribution, the graphical representation further comprising a simulated view of the radiation dose distribution within a gantry opening along an axis of rotation of the rotatable gantry;system.
前記グラフィック表示が、前記第1のシノグラム、ならびに前記放射線送達セッション中に前記ビーム成形コンポーネントセンサーおよび前記ガントリー位置センサーから取得されたデータを用いて、各ガントリー発射位置に対する前記放射線透過アパーチャのサイズおよび形状を表す第2のシノグラムを含む、
上記の請求項のいずれか1項に記載のシステム。 wherein the planned radiation delivery metric over time includes a first sinogram specifying the size and shape of the radiolucent aperture of the beam shaping component for each gantry firing position as per a treatment plan;
the graphical representation uses the first sinogram and data acquired from the beam shaping component sensors and the gantry position sensors during the radiation delivery session to determine the size and shape of the radiolucent aperture for each gantry firing position; including a second sinogram representing
A system according to any one of the preceding claims.
放射線送達セッション中の複数の時点において放射線治療システムセンサーからリアルタイム放射線送達データを取得することと、
前記リアルタイム放射線送達データに基づいて放射線送達メトリックの値を計算することと、
前記複数の時点にわたる、前記放射線送達メトリックの値および前記放射線送達メトリックの計画された値を示すグラフィック表示を生成することと、
前記グラフィック表示をディスプレイに出力することと
を含み、
前記放射線治療システムは、回転可能ガントリーと、前記回転可能ガントリー上に搭載され、かつ複数のガントリー発射位置に移動可能である、治療用放射線源と、前記治療用放射線源の放射線ビームパスに配置されるビーム成形コンポーネントとを備え、前記放射線治療システムセンサーは、ガントリー位置センサーと、放射線検出器と、ビーム成形コンポーネントセンサーとのうちの1つ以上を備え、
前記ビーム成形コンポーネントは、複数のリーフを有するダイナミックマルチリーフコリメータ(MLC)を備え、前記ビーム成形コンポーネントセンサーが、前記複数のリーフに連結された複数のリーフ位置センサーおよび/またはモーションセンサーを備え、
前記放射線送達メトリックのリアルタイム値が、前記放射線送達セッション中に取得された、前記ガントリー位置センサー、放射線検出器、リーフ位置センサー、およびモーションセンサーのうちの1つ以上からのデータを用いて生成された放射線量分布であり、前記グラフィック表示が、前記回転可能ガントリーの回転軸に沿ったガントリー開口部内の前記放射線量分布のシミュレートビューをさらに含む、方法。 A method for monitoring radiation delivery in a radiation therapy system , said method comprising:
obtaining real-time radiation delivery data from radiation therapy system sensors at multiple time points during a radiation delivery session;
calculating a radiation delivery metric value based on the real-time radiation delivery data;
generating a graphical display showing values of the radiation delivery metric and planned values of the radiation delivery metric over the plurality of time points;
outputting the graphical representation to a display ;
The radiation therapy system includes a rotatable gantry, a therapeutic radiation source mounted on the rotatable gantry and movable to a plurality of gantry firing positions, and positioned in a radiation beam path of the therapeutic radiation source. a beam shaping component, the radiation therapy system sensor comprising one or more of a gantry position sensor, a radiation detector, and a beam shaping component sensor;
said beam shaping component comprising a dynamic multi-leaf collimator (MLC) having a plurality of leaves, said beam shaping component sensor comprising a plurality of leaf position and/or motion sensors coupled to said plurality of leaves;
Real-time values of the radiation delivery metrics were generated using data from one or more of the gantry position sensors, radiation detectors, leaf position sensors, and motion sensors acquired during the radiation delivery session. radiation dose distribution, wherein the graphical representation further includes a simulated view of the radiation dose distribution within a gantry opening along an axis of rotation of the rotatable gantry .
前記複数の時点にわたる前記放射線送達メトリックの前記計画された値は、処置計画に従って、各ガントリー発射位置に対する前記ビーム成形コンポーネントの放射線透過アパーチャのサイズおよび形状を指定する第1のシノグラムを含み、
前記グラフィック表示は、前記第1のシノグラムと、前記リアルタイム放射線送達データを用いて、各ガントリー発射位置に対する前記放射線透過アパーチャの前記サイズおよび形状を表す第2のシノグラムとを含む、請求項26に記載の方法。 the real-time radiation delivery data includes data from the beam shaping component sensors and the gantry position sensors;
the planned values of the radiation delivery metric over the plurality of time points include a first sinogram specifying a size and shape of a radiolucent aperture of the beam shaping component for each gantry firing position according to a treatment plan;
27. The method of claim 26 , wherein the graphical display includes the first sinogram and a second sinogram representing the size and shape of the radiolucent aperture for each gantry firing position using the real-time radiation delivery data. the method of.
前記グラフィック表示は、疑似カラー発射マップを含み、前記疑似カラー発射マップ内の各セルの強度は、前記リアルタイム放射線送達データを用いて計算された、各ガントリー発射位置における各MLCリーフに対する放射線送達の頻度または強度を表す、請求項48に記載の方法。 the real-time radiation delivery data includes data from the gantry position sensors, radiation detectors of the radiation therapy system, and the leaf position and/or motion sensors;
The graphical display includes a pseudo-color firing map, wherein the intensity of each cell in the pseudo-color firing map is the frequency of radiation delivery for each MLC leaf at each gantry firing position calculated using the real-time radiation delivery data. 49. The method of claim 48 representing intensity.
Priority Applications (1)
| Application Number | Priority Date | Filing Date | Title |
|---|---|---|---|
| JP2022160174A JP2022176290A (en) | 2017-07-26 | 2022-10-04 | Graphic display of radiotherapy |
Applications Claiming Priority (3)
| Application Number | Priority Date | Filing Date | Title |
|---|---|---|---|
| US201762537422P | 2017-07-26 | 2017-07-26 | |
| US62/537,422 | 2017-07-26 | ||
| PCT/US2018/043954 WO2019023496A1 (en) | 2017-07-26 | 2018-07-26 | Graphical representation of radiation therapy |
Related Child Applications (1)
| Application Number | Title | Priority Date | Filing Date |
|---|---|---|---|
| JP2022160174A Division JP2022176290A (en) | 2017-07-26 | 2022-10-04 | Graphic display of radiotherapy |
Publications (3)
| Publication Number | Publication Date |
|---|---|
| JP2020528780A JP2020528780A (en) | 2020-10-01 |
| JP2020528780A5 JP2020528780A5 (en) | 2021-09-02 |
| JP7195646B2 true JP7195646B2 (en) | 2022-12-26 |
Family
ID=65040987
Family Applications (2)
| Application Number | Title | Priority Date | Filing Date |
|---|---|---|---|
| JP2020503690A Active JP7195646B2 (en) | 2017-07-26 | 2018-07-26 | Graphical representation of radiotherapy |
| JP2022160174A Pending JP2022176290A (en) | 2017-07-26 | 2022-10-04 | Graphic display of radiotherapy |
Family Applications After (1)
| Application Number | Title | Priority Date | Filing Date |
|---|---|---|---|
| JP2022160174A Pending JP2022176290A (en) | 2017-07-26 | 2022-10-04 | Graphic display of radiotherapy |
Country Status (5)
| Country | Link |
|---|---|
| US (3) | US10456600B2 (en) |
| EP (1) | EP3658958A4 (en) |
| JP (2) | JP7195646B2 (en) |
| CN (2) | CN117761751A (en) |
| WO (1) | WO2019023496A1 (en) |
Families Citing this family (28)
| Publication number | Priority date | Publication date | Assignee | Title |
|---|---|---|---|---|
| US10441813B2 (en) * | 2014-07-16 | 2019-10-15 | Dalhousie University | Method and system for cancer treatment with radiation |
| CN116943051A (en) | 2016-11-15 | 2023-10-27 | 反射医疗公司 | Radiotherapy patient platform |
| US10391335B2 (en) * | 2017-03-02 | 2019-08-27 | Ingham Institute for Applied Medical Research | Radio-frequency coil for simultaneous imaging and dosimetry on an MRI-linac |
| WO2018213431A1 (en) * | 2017-05-16 | 2018-11-22 | Health Research, Inc. | Method and system for transferring radiation therapy treatment plans from a high definition mlc to a lower definition mlc |
| WO2018222751A1 (en) | 2017-05-30 | 2018-12-06 | Reflexion Medical, Inc. | Methods for real-time image guided radiation therapy |
| JP2020525093A (en) | 2017-06-22 | 2020-08-27 | リフレクション メディカル, インコーポレイテッド | Systems and methods for biocompatible radiation therapy |
| EP3530319A1 (en) * | 2018-02-21 | 2019-08-28 | Elekta Limited | Methods for inverse planning |
| WO2020150505A1 (en) | 2019-01-16 | 2020-07-23 | Reflexion Medical, Inc. | Methods for setup corrections in radiation therapy |
| US11633623B2 (en) * | 2019-04-19 | 2023-04-25 | University Of Maryland, Baltimore | System and method for radiation therapy using spatial-functional mapping and dose sensitivity of branching structures and functional sub-volumes |
| GB2583515B (en) * | 2019-05-02 | 2021-09-08 | Elekta ltd | Gating of radiotherapy |
| EP3996595A4 (en) * | 2019-07-12 | 2023-07-26 | RefleXion Medical, Inc. | Multi-target treatment planning and delivery and virtual localization for radiation therapy |
| AU2021212659A1 (en) * | 2020-01-28 | 2022-08-04 | Reflexion Medical, Inc. | Joint optimization of radionuclide and external beam radiotherapy |
| US11712587B2 (en) | 2020-12-30 | 2023-08-01 | Varian Medical Systems, Inc. | Radiotherapy methods, systems, and workflow-oriented graphical user interfaces |
| US11577095B2 (en) | 2020-12-30 | 2023-02-14 | Varian Medical Systems, Inc. | Radiotherapy methods, systems, and workflow-oriented graphical user interfaces |
| US11817210B2 (en) | 2020-12-30 | 2023-11-14 | Varian Medical Systems, Inc. | Radiotherapy methods, systems, and workflow-oriented graphical user interfaces |
| US11844962B2 (en) * | 2020-12-30 | 2023-12-19 | Varian Medical Systems, Inc. | Radiotherapy methods, systems, and workflow-oriented graphical user interfaces |
| US11759656B2 (en) | 2020-12-30 | 2023-09-19 | Varian Medical Systems, Inc. | Radiotherapy methods, systems, and workflow-oriented graphical user interfaces |
| US11654303B2 (en) | 2020-12-30 | 2023-05-23 | Varian Medical Systems, Inc. | Radiotherapy methods, systems, and workflow-oriented graphical user interfaces |
| US11607563B2 (en) | 2020-12-30 | 2023-03-21 | Varian Medical Systems, Inc. | Radiotherapy methods, systems, and workflow-oriented graphical user interfaces |
| US11660473B2 (en) | 2020-12-30 | 2023-05-30 | Varian Medical Systems, Inc. | Radiotherapy methods, systems, and workflow-oriented graphical user interfaces |
| US11604564B2 (en) * | 2020-12-30 | 2023-03-14 | Varian Medical Systems, Inc. | Radiotherapy methods, systems, and workflow-oriented graphical user interfaces |
| US11638840B2 (en) | 2020-12-30 | 2023-05-02 | Varian Medical Systems, Inc. | Radiotherapy methods, systems, and workflow-oriented graphical user interfaces |
| US11786756B2 (en) | 2020-12-30 | 2023-10-17 | Varian Medical Systems, Inc. | Radiotherapy methods, systems, and workflow-oriented graphical user interfaces |
| US11786757B2 (en) | 2020-12-30 | 2023-10-17 | Varian Medical Systems, Inc. | Radiotherapy methods, systems, and workflow-oriented graphical user interfaces |
| US11590363B2 (en) * | 2021-06-29 | 2023-02-28 | Varian Medical Systems International Ag | Assessing treatment parameters for radiation treatment planning |
| WO2023009332A1 (en) * | 2021-07-30 | 2023-02-02 | Reflexion Medical, Inc. | Dose coverage margin metric for evaluating radiotherapy treatment plans |
| WO2023129900A1 (en) * | 2021-12-27 | 2023-07-06 | Reflexion Medical, Inc. | Methods for radiation delivery quality assurance |
| EP4215242A1 (en) * | 2022-01-19 | 2023-07-26 | RaySearch Laboratories AB | A method and a computer program product and a computer system for use with a radiation therapy delivery system |
Citations (6)
| Publication number | Priority date | Publication date | Assignee | Title |
|---|---|---|---|---|
| JP2009160308A (en) | 2008-01-09 | 2009-07-23 | Toshiba Corp | Radiotherapy system, radiotherapy support apparatus and radiotherapy support program |
| JP2009538195A (en) | 2006-05-25 | 2009-11-05 | ウィリアム・ボーモント・ホスピタル | Real-time on-line and off-line treatment dose tracking and feedback process for 3D image-guided adaptive radiotherapy |
| JP2013059576A (en) | 2011-09-15 | 2013-04-04 | Toshiba Corp | Radiation therapy information generating device |
| JP2014503315A (en) | 2011-01-18 | 2014-02-13 | ジーエスアイ ヘルムホルツツェントゥルム フュア シュヴェリオーネンフォルシュング ゲーエムベーハー | Method and apparatus for creating an irradiation plan |
| JP2016055161A (en) | 2014-09-09 | 2016-04-21 | メビオン・メディカル・システムズ・インコーポレーテッド | Patient positioning method |
| WO2017081768A1 (en) | 2015-11-11 | 2017-05-18 | 三菱電機株式会社 | Particle beam therapy apparatus and treatment plan correction method |
Family Cites Families (68)
| Publication number | Priority date | Publication date | Assignee | Title |
|---|---|---|---|---|
| US3794840A (en) | 1972-03-27 | 1974-02-26 | Charlotte Memorial Hospital | Method and apparatus for directing a radiation beam toward a tumor or the like |
| NZ509667A (en) * | 1998-08-06 | 2003-08-29 | Wisconsin Alumni Res Found | Delivery modification system for radiation therapy |
| WO2000007667A1 (en) | 1998-08-06 | 2000-02-17 | Wisconsin Alumni Research Foundation | Radiotherapy verification system |
| WO2000059576A1 (en) | 1999-04-02 | 2000-10-12 | Wisconsin Alumni Research Foundation | Megavoltage computed tomography during radiotherapy |
| WO2001076021A2 (en) * | 2000-03-31 | 2001-10-11 | University Of Maryland, Baltimore | Helical electron beam generating device and method of use |
| US6810108B2 (en) | 2001-11-02 | 2004-10-26 | Siemens Medical Solutions Usa, Inc. | System and method for positioning an electronic portal imaging device |
| US8406844B2 (en) | 2002-03-06 | 2013-03-26 | Tomotherapy Incorporated | Method for modification of radiotherapy treatment delivery |
| SE522162C2 (en) | 2002-05-06 | 2004-01-20 | Goergen Nilsson | Dose delivery quantification enabling method for radiotherapy treatment, involves analyzing measurements to obtain information about relation between measurements in phantom and information between phantom and treatment source |
| US7412029B2 (en) | 2003-06-25 | 2008-08-12 | Varian Medical Systems Technologies, Inc. | Treatment planning, simulation, and verification system |
| EP1646316B1 (en) | 2003-07-15 | 2009-12-16 | Koninklijke Philips Electronics N.V. | Computed tomography scanner with large gantry bore |
| KR101249815B1 (en) | 2003-08-12 | 2013-04-03 | 로마 린다 유니버시티 메디칼 센터 | Patient positioning system for radiation therapy system |
| CA2967536C (en) | 2003-08-12 | 2020-08-25 | Vision Rt Limited | Patient positioning system for radiation therapy system |
| CA2540602A1 (en) | 2003-10-07 | 2005-04-21 | Nomos Corporation | Planning system, method and apparatus for conformal radiation therapy |
| US7265356B2 (en) | 2004-11-29 | 2007-09-04 | The University Of Chicago | Image-guided medical intervention apparatus and method |
| US7349730B2 (en) | 2005-01-11 | 2008-03-25 | Moshe Ein-Gal | Radiation modulator positioner |
| US7983380B2 (en) | 2005-04-29 | 2011-07-19 | Varian Medical Systems, Inc. | Radiation systems |
| US7379531B2 (en) | 2005-06-13 | 2008-05-27 | Siemens Medical Solutions Health Services Corporation | Beam therapy treatment user interface monitoring and recording system |
| US8442287B2 (en) | 2005-07-22 | 2013-05-14 | Tomotherapy Incorporated | Method and system for evaluating quality assurance criteria in delivery of a treatment plan |
| KR20080044249A (en) | 2005-07-22 | 2008-05-20 | 토모테라피 인코포레이티드 | Method of and system for predicting dose delivery |
| JP2009502251A (en) * | 2005-07-22 | 2009-01-29 | トモセラピー・インコーポレーテッド | System and method for evaluating dose delivered by a radiation therapy system |
| JP2009502253A (en) | 2005-07-22 | 2009-01-29 | トモセラピー・インコーポレーテッド | System and method for applying radiation therapy to a moving region of interest |
| JP5390855B2 (en) * | 2005-07-23 | 2014-01-15 | トモセラピー・インコーポレーテッド | Imaging and delivery of radiation therapy using coordinated movement of gantry and treatment table |
| CN101454801B (en) | 2006-02-28 | 2012-12-05 | 皇家飞利浦电子股份有限公司 | Local motion compensation based on list mode data |
| DE102006042572A1 (en) | 2006-09-11 | 2008-03-27 | Siemens Ag | Imaging medical unit |
| US8588367B2 (en) | 2007-02-07 | 2013-11-19 | Koninklijke Philips N.V. | Motion compensation in quantitative data analysis and therapy |
| KR20100016039A (en) | 2007-03-30 | 2010-02-12 | 코닌클리케 필립스 일렉트로닉스 엔.브이. | Improved treatment plan evaluation in radiotherapy by stochastic analysis of delineation uncertainty |
| US8554573B2 (en) | 2007-07-27 | 2013-10-08 | Koninklijke Philips N.V. | Interactive atlas to image registration |
| WO2009055801A2 (en) | 2007-10-25 | 2009-04-30 | Tomo Therapy Incorporated | System and method for motion adaptive optimization for radiation therapy delivery |
| US8467497B2 (en) | 2007-10-25 | 2013-06-18 | Tomotherapy Incorporated | System and method for motion adaptive optimization for radiation therapy delivery |
| US8107589B2 (en) | 2007-12-21 | 2012-01-31 | Kabushiki Kaisha Toshiba | Radiotherapeutic system and radiotherapeutic dose distribution measuring method |
| US8017915B2 (en) | 2008-03-14 | 2011-09-13 | Reflexion Medical, Inc. | Method and apparatus for emission guided radiation therapy |
| US8019042B2 (en) | 2008-04-22 | 2011-09-13 | Siemens Medical Solutions Usa, Inc. | Medical imaging processing and care planning system |
| US8063376B2 (en) | 2008-08-15 | 2011-11-22 | Koninklijke Philips Electronics N.V. | Large bore PET and hybrid PET/CT scanners and radiation therapy planning using same |
| US8483803B2 (en) | 2008-09-15 | 2013-07-09 | Varian Medical Systems, Inc. | Systems and methods for tracking and targeting object in a patient using imaging techniques |
| US8278633B2 (en) | 2009-01-20 | 2012-10-02 | Varian Medical Systems International Ag | Gated radiation procedure using packages |
| US9268042B2 (en) * | 2009-08-26 | 2016-02-23 | Varian Medical Systems International Ag | Characterizing radiotherapy beams based on image detection array data |
| US8090074B2 (en) | 2009-10-02 | 2012-01-03 | Varian Medical Systems International Ag | Systems and methods for obtaining reconstructed images during a treatment session |
| WO2011053802A2 (en) | 2009-10-30 | 2011-05-05 | Tomotherapy Incorporated | Non-voxel-based broad-beam (nvbb) algorithm for intensity modulated radiation therapy dose calculation and plan optimization |
| US9019307B1 (en) | 2010-01-06 | 2015-04-28 | Jimm Grimm | Automated warning system and method for use when evaluating acceptable dosage ranges for radiation treatments of body tissue |
| US8331532B2 (en) * | 2010-02-18 | 2012-12-11 | Varian Medical Systems International Ag | Method and system for treating moving target |
| US8816307B2 (en) | 2010-07-15 | 2014-08-26 | Varian Medical Systems International Ag | Method and apparatus pertaining to use of jaws during radiation treatment |
| US8605857B1 (en) | 2010-12-23 | 2013-12-10 | Math Resolutions, LLC | Method and system to reconstruct treatment dose to a patient from integrated exit-transit images of radiation fields taken during treatment |
| US8565377B2 (en) * | 2011-03-07 | 2013-10-22 | Dalhousie University | Methods and apparatus for imaging in conjunction with radiotherapy |
| US8873710B2 (en) | 2011-03-07 | 2014-10-28 | Sloan-Kettering Institute For Cancer Research | Multi-source radiation system and method for interwoven radiotherapy and imaging |
| US9956429B2 (en) | 2011-03-28 | 2018-05-01 | Varian Medical Systems International Ag | Method and system for automated evaluation of multiple portal dose images in radiation therapy |
| US20120292534A1 (en) | 2011-05-20 | 2012-11-22 | Sarah Geneser | Multi-phase Gating for Radiation Treatment Delivery and Imaging |
| US9259155B2 (en) * | 2011-08-16 | 2016-02-16 | Koninklijke Philips N.V. | Method to estimate interfractional and intrafractional organ motion for adaptive external beam radiotherapy |
| US8836697B2 (en) | 2011-09-30 | 2014-09-16 | Varian Medical Systems International Ag | Real-time 3D dose visualization system |
| IN2014CN03894A (en) * | 2011-11-30 | 2015-10-16 | Koninkl Philips Nv | |
| US9314160B2 (en) * | 2011-12-01 | 2016-04-19 | Varian Medical Systems, Inc. | Systems and methods for real-time target validation for image-guided radiation therapy |
| WO2013093852A1 (en) | 2011-12-23 | 2013-06-27 | Fraunhofer-Gesellschaft Zur Foerderung Der Angewandten Forschung E.V. | Navigable presentation of a variety of solutions for therapy plans |
| EP2687259A1 (en) | 2012-07-19 | 2014-01-22 | Deutsches Krebsforschungszentrum | Leaf module for a multi-leaf collimator and multi-leaf collimator |
| EP3021940B1 (en) * | 2013-07-17 | 2021-06-16 | Koninklijke Philips N.V. | Portal imaging for brachytherapy |
| US9539441B2 (en) | 2013-09-13 | 2017-01-10 | Elekta Ab (Publ) | Radiotherapy system with advanced graphical user interface |
| US9265971B2 (en) * | 2014-02-07 | 2016-02-23 | Varian Medical Systems, Inc. | Systems, methods, and devices for real-time treatment verification using an electronic portal imaging device |
| US9604077B2 (en) * | 2014-06-16 | 2017-03-28 | The Board Of Trustees Of The Leland Stanford Junior University | Visualizing radiation therapy beam in real-time in the context of patient's anatomy |
| US9782607B2 (en) | 2014-08-05 | 2017-10-10 | The University Of Chicago | Systems and methods for radiation treatment planning using combined imaging and treatment dose |
| EP3180084A1 (en) | 2014-08-15 | 2017-06-21 | Koninklijke Philips N.V. | Supervised 4-d dose map deformation for adaptive radiotherapy planning |
| EP2990078B1 (en) * | 2014-08-27 | 2018-07-04 | Scandidos AB | A position detector |
| US9987504B2 (en) * | 2015-04-02 | 2018-06-05 | Varian Medical Systems International Ag | Portal dosimetry systems, devices, and methods |
| CN113782246A (en) | 2015-06-10 | 2021-12-10 | 反射医疗公司 | High bandwidth binary multileaf collimator design |
| US9943705B2 (en) * | 2015-06-12 | 2018-04-17 | Accuray Incorporated | Verification of leaf positions for multi-leaf collimator using multiple verification systems |
| US9884206B2 (en) | 2015-07-23 | 2018-02-06 | Loma Linda University Medical Center | Systems and methods for intensity modulated radiation therapy |
| US10729920B2 (en) | 2015-10-02 | 2020-08-04 | Varian Medical Systems International Ag | Systems and methods for quantifying radiation beam conformity |
| US10695586B2 (en) | 2016-11-15 | 2020-06-30 | Reflexion Medical, Inc. | System for emission-guided high-energy photon delivery |
| WO2018183748A1 (en) | 2017-03-30 | 2018-10-04 | Reflexion Medical, Inc. | Radiation therapy systems and methods with tumor tracking |
| WO2018222751A1 (en) | 2017-05-30 | 2018-12-06 | Reflexion Medical, Inc. | Methods for real-time image guided radiation therapy |
| JP2020525093A (en) | 2017-06-22 | 2020-08-27 | リフレクション メディカル, インコーポレイテッド | Systems and methods for biocompatible radiation therapy |
-
2018
- 2018-07-26 US US16/046,746 patent/US10456600B2/en active Active
- 2018-07-26 EP EP18837615.6A patent/EP3658958A4/en active Pending
- 2018-07-26 CN CN202311757711.9A patent/CN117761751A/en active Pending
- 2018-07-26 WO PCT/US2018/043954 patent/WO2019023496A1/en unknown
- 2018-07-26 CN CN201880059223.1A patent/CN111095026B/en active Active
- 2018-07-26 JP JP2020503690A patent/JP7195646B2/en active Active
-
2019
- 2019-09-25 US US16/582,308 patent/US20200197729A1/en not_active Abandoned
-
2021
- 2021-09-20 US US17/479,873 patent/US20220001209A1/en active Pending
-
2022
- 2022-10-04 JP JP2022160174A patent/JP2022176290A/en active Pending
Patent Citations (6)
| Publication number | Priority date | Publication date | Assignee | Title |
|---|---|---|---|---|
| JP2009538195A (en) | 2006-05-25 | 2009-11-05 | ウィリアム・ボーモント・ホスピタル | Real-time on-line and off-line treatment dose tracking and feedback process for 3D image-guided adaptive radiotherapy |
| JP2009160308A (en) | 2008-01-09 | 2009-07-23 | Toshiba Corp | Radiotherapy system, radiotherapy support apparatus and radiotherapy support program |
| JP2014503315A (en) | 2011-01-18 | 2014-02-13 | ジーエスアイ ヘルムホルツツェントゥルム フュア シュヴェリオーネンフォルシュング ゲーエムベーハー | Method and apparatus for creating an irradiation plan |
| JP2013059576A (en) | 2011-09-15 | 2013-04-04 | Toshiba Corp | Radiation therapy information generating device |
| JP2016055161A (en) | 2014-09-09 | 2016-04-21 | メビオン・メディカル・システムズ・インコーポレーテッド | Patient positioning method |
| WO2017081768A1 (en) | 2015-11-11 | 2017-05-18 | 三菱電機株式会社 | Particle beam therapy apparatus and treatment plan correction method |
Also Published As
| Publication number | Publication date |
|---|---|
| CN111095026B (en) | 2023-11-17 |
| WO2019023496A1 (en) | 2019-01-31 |
| US20190054320A1 (en) | 2019-02-21 |
| US10456600B2 (en) | 2019-10-29 |
| JP2022176290A (en) | 2022-11-25 |
| CN117761751A (en) | 2024-03-26 |
| US20200197729A1 (en) | 2020-06-25 |
| EP3658958A4 (en) | 2021-04-14 |
| JP2020528780A (en) | 2020-10-01 |
| EP3658958A1 (en) | 2020-06-03 |
| US20220001209A1 (en) | 2022-01-06 |
| CN111095026A (en) | 2020-05-01 |
Similar Documents
| Publication | Publication Date | Title |
|---|---|---|
| JP7195646B2 (en) | Graphical representation of radiotherapy | |
| CN110997063B (en) | Radiation therapy system for a method of calculating a radiation fluence | |
| US11185715B2 (en) | Image-guided radiation treatment with imaging data using imaging radiation at different energy levels | |
| JP7274773B2 (en) | Systems and methods for use in radiation-guided radiotherapy | |
| Fan et al. | Emission guided radiation therapy for lung and prostate cancers: a feasibility study on a digital patient | |
| US10716955B2 (en) | Methods and systems for image-guided radiation therapy | |
| CN110869086A (en) | System and method for bio-adaptive radiation therapy | |
| US8861672B2 (en) | Patient positioning system | |
| US20030174808A1 (en) | In vivo planning and treatment of cancer therapy | |
| CN113289274B (en) | System and method for radiation therapy dose measurement | |
| Lawless et al. | SU-A-FS2-00 |
Legal Events
| Date | Code | Title | Description |
|---|---|---|---|
| A521 | Request for written amendment filed |
Free format text: JAPANESE INTERMEDIATE CODE: A523 Effective date: 20210721 |
|
| A621 | Written request for application examination |
Free format text: JAPANESE INTERMEDIATE CODE: A621 Effective date: 20210721 |
|
| A977 | Report on retrieval |
Free format text: JAPANESE INTERMEDIATE CODE: A971007 Effective date: 20220318 |
|
| A131 | Notification of reasons for refusal |
Free format text: JAPANESE INTERMEDIATE CODE: A131 Effective date: 20220413 |
|
| A601 | Written request for extension of time |
Free format text: JAPANESE INTERMEDIATE CODE: A601 Effective date: 20220712 |
|
| A601 | Written request for extension of time |
Free format text: JAPANESE INTERMEDIATE CODE: A601 Effective date: 20220908 |
|
| A521 | Request for written amendment filed |
Free format text: JAPANESE INTERMEDIATE CODE: A523 Effective date: 20221004 |
|
| TRDD | Decision of grant or rejection written | ||
| A01 | Written decision to grant a patent or to grant a registration (utility model) |
Free format text: JAPANESE INTERMEDIATE CODE: A01 Effective date: 20221202 |
|
| A61 | First payment of annual fees (during grant procedure) |
Free format text: JAPANESE INTERMEDIATE CODE: A61 Effective date: 20221207 |
|
| R150 | Certificate of patent or registration of utility model |
Ref document number: 7195646 Country of ref document: JP Free format text: JAPANESE INTERMEDIATE CODE: R150 |