JP7155277B2 - Structure evaluation system, structure evaluation device, and structure evaluation method - Google Patents
Structure evaluation system, structure evaluation device, and structure evaluation method Download PDFInfo
- Publication number
- JP7155277B2 JP7155277B2 JP2020546513A JP2020546513A JP7155277B2 JP 7155277 B2 JP7155277 B2 JP 7155277B2 JP 2020546513 A JP2020546513 A JP 2020546513A JP 2020546513 A JP2020546513 A JP 2020546513A JP 7155277 B2 JP7155277 B2 JP 7155277B2
- Authority
- JP
- Japan
- Prior art keywords
- elastic wave
- arrival time
- unit
- sensor
- reliability
- Prior art date
- Legal status (The legal status is an assumption and is not a legal conclusion. Google has not performed a legal analysis and makes no representation as to the accuracy of the status listed.)
- Active
Links
Images


Classifications
-
- G—PHYSICS
- G01—MEASURING; TESTING
- G01N—INVESTIGATING OR ANALYSING MATERIALS BY DETERMINING THEIR CHEMICAL OR PHYSICAL PROPERTIES
- G01N29/00—Investigating or analysing materials by the use of ultrasonic, sonic or infrasonic waves; Visualisation of the interior of objects by transmitting ultrasonic or sonic waves through the object
- G01N29/44—Processing the detected response signal, e.g. electronic circuits specially adapted therefor
- G01N29/4463—Signal correction, e.g. distance amplitude correction [DAC], distance gain size [DGS], noise filtering
-
- G—PHYSICS
- G01—MEASURING; TESTING
- G01N—INVESTIGATING OR ANALYSING MATERIALS BY DETERMINING THEIR CHEMICAL OR PHYSICAL PROPERTIES
- G01N29/00—Investigating or analysing materials by the use of ultrasonic, sonic or infrasonic waves; Visualisation of the interior of objects by transmitting ultrasonic or sonic waves through the object
- G01N29/04—Analysing solids
- G01N29/06—Visualisation of the interior, e.g. acoustic microscopy
- G01N29/0654—Imaging
- G01N29/069—Defect imaging, localisation and sizing using, e.g. time of flight diffraction [TOFD], synthetic aperture focusing technique [SAFT], Amplituden-Laufzeit-Ortskurven [ALOK] technique
-
- G—PHYSICS
- G01—MEASURING; TESTING
- G01M—TESTING STATIC OR DYNAMIC BALANCE OF MACHINES OR STRUCTURES; TESTING OF STRUCTURES OR APPARATUS, NOT OTHERWISE PROVIDED FOR
- G01M5/00—Investigating the elasticity of structures, e.g. deflection of bridges or air-craft wings
- G01M5/0008—Investigating the elasticity of structures, e.g. deflection of bridges or air-craft wings of bridges
-
- G—PHYSICS
- G01—MEASURING; TESTING
- G01M—TESTING STATIC OR DYNAMIC BALANCE OF MACHINES OR STRUCTURES; TESTING OF STRUCTURES OR APPARATUS, NOT OTHERWISE PROVIDED FOR
- G01M5/00—Investigating the elasticity of structures, e.g. deflection of bridges or air-craft wings
- G01M5/0033—Investigating the elasticity of structures, e.g. deflection of bridges or air-craft wings by determining damage, crack or wear
-
- G—PHYSICS
- G01—MEASURING; TESTING
- G01M—TESTING STATIC OR DYNAMIC BALANCE OF MACHINES OR STRUCTURES; TESTING OF STRUCTURES OR APPARATUS, NOT OTHERWISE PROVIDED FOR
- G01M5/00—Investigating the elasticity of structures, e.g. deflection of bridges or air-craft wings
- G01M5/0066—Investigating the elasticity of structures, e.g. deflection of bridges or air-craft wings by exciting or detecting vibration or acceleration
-
- G—PHYSICS
- G01—MEASURING; TESTING
- G01M—TESTING STATIC OR DYNAMIC BALANCE OF MACHINES OR STRUCTURES; TESTING OF STRUCTURES OR APPARATUS, NOT OTHERWISE PROVIDED FOR
- G01M5/00—Investigating the elasticity of structures, e.g. deflection of bridges or air-craft wings
- G01M5/0083—Investigating the elasticity of structures, e.g. deflection of bridges or air-craft wings by measuring variation of impedance, e.g. resistance, capacitance, induction
-
- G—PHYSICS
- G01—MEASURING; TESTING
- G01M—TESTING STATIC OR DYNAMIC BALANCE OF MACHINES OR STRUCTURES; TESTING OF STRUCTURES OR APPARATUS, NOT OTHERWISE PROVIDED FOR
- G01M7/00—Vibration-testing of structures; Shock-testing of structures
- G01M7/02—Vibration-testing by means of a shake table
- G01M7/025—Measuring arrangements
-
- G—PHYSICS
- G01—MEASURING; TESTING
- G01N—INVESTIGATING OR ANALYSING MATERIALS BY DETERMINING THEIR CHEMICAL OR PHYSICAL PROPERTIES
- G01N29/00—Investigating or analysing materials by the use of ultrasonic, sonic or infrasonic waves; Visualisation of the interior of objects by transmitting ultrasonic or sonic waves through the object
- G01N29/04—Analysing solids
- G01N29/07—Analysing solids by measuring propagation velocity or propagation time of acoustic waves
-
- G—PHYSICS
- G01—MEASURING; TESTING
- G01N—INVESTIGATING OR ANALYSING MATERIALS BY DETERMINING THEIR CHEMICAL OR PHYSICAL PROPERTIES
- G01N29/00—Investigating or analysing materials by the use of ultrasonic, sonic or infrasonic waves; Visualisation of the interior of objects by transmitting ultrasonic or sonic waves through the object
- G01N29/14—Investigating or analysing materials by the use of ultrasonic, sonic or infrasonic waves; Visualisation of the interior of objects by transmitting ultrasonic or sonic waves through the object using acoustic emission techniques
-
- G—PHYSICS
- G01—MEASURING; TESTING
- G01N—INVESTIGATING OR ANALYSING MATERIALS BY DETERMINING THEIR CHEMICAL OR PHYSICAL PROPERTIES
- G01N29/00—Investigating or analysing materials by the use of ultrasonic, sonic or infrasonic waves; Visualisation of the interior of objects by transmitting ultrasonic or sonic waves through the object
- G01N29/44—Processing the detected response signal, e.g. electronic circuits specially adapted therefor
- G01N29/4454—Signal recognition, e.g. specific values or portions, signal events, signatures
-
- G—PHYSICS
- G01—MEASURING; TESTING
- G01N—INVESTIGATING OR ANALYSING MATERIALS BY DETERMINING THEIR CHEMICAL OR PHYSICAL PROPERTIES
- G01N29/00—Investigating or analysing materials by the use of ultrasonic, sonic or infrasonic waves; Visualisation of the interior of objects by transmitting ultrasonic or sonic waves through the object
- G01N29/44—Processing the detected response signal, e.g. electronic circuits specially adapted therefor
- G01N29/4472—Mathematical theories or simulation
-
- G—PHYSICS
- G01—MEASURING; TESTING
- G01N—INVESTIGATING OR ANALYSING MATERIALS BY DETERMINING THEIR CHEMICAL OR PHYSICAL PROPERTIES
- G01N2291/00—Indexing codes associated with group G01N29/00
- G01N2291/01—Indexing codes associated with the measuring variable
- G01N2291/011—Velocity or travel time
-
- G—PHYSICS
- G01—MEASURING; TESTING
- G01N—INVESTIGATING OR ANALYSING MATERIALS BY DETERMINING THEIR CHEMICAL OR PHYSICAL PROPERTIES
- G01N2291/00—Indexing codes associated with group G01N29/00
- G01N2291/02—Indexing codes associated with the analysed material
- G01N2291/023—Solids
- G01N2291/0232—Glass, ceramics, concrete or stone
-
- G—PHYSICS
- G01—MEASURING; TESTING
- G01N—INVESTIGATING OR ANALYSING MATERIALS BY DETERMINING THEIR CHEMICAL OR PHYSICAL PROPERTIES
- G01N2291/00—Indexing codes associated with group G01N29/00
- G01N2291/02—Indexing codes associated with the analysed material
- G01N2291/028—Material parameters
- G01N2291/0289—Internal structure, e.g. defects, grain size, texture
Description
本発明の実施形態は、構造物評価システム、構造物評価装置及び構造物評価方法に関する。 TECHNICAL FIELD Embodiments of the present invention relate to a structure evaluation system, a structure evaluation device, and a structure evaluation method.
近年、高度経済成長期に建設された橋梁等の構造物の老朽化に伴う問題が顕在化してきている。万が一にも構造物に事故が生じた場合の損害は計り知れないため、従来から構造物の状態を監視するための技術が提案されている。例えば、内部亀裂の発生、又は、内部亀裂の進展に伴い発生する弾性波を、高感度センサにより検出するAE(Acoustic Emission:アコースティック・エミッション)方式により、構造物の損傷を検出する技術が提案されている。AEは、材料の疲労亀裂の進展に伴い発生する弾性波である。AE方式では、圧電素子を利用したAEセンサにより弾性波をAE信号(電圧信号)として検出する。AE信号は、材料の破断が生じる前の兆候として検出される。したがって、AE信号の発生頻度及び信号強度は、材料の健全性を表す指標として有用である。そのため、AE方式によって構造物の劣化の予兆を検出する技術の研究が行われている。 In recent years, problems associated with the deterioration of structures such as bridges constructed during the high economic growth period have become apparent. If an accident should occur in a structure, the damage would be immeasurable, so techniques for monitoring the state of the structure have been conventionally proposed. For example, a technology has been proposed to detect damage to structures by means of an AE (Acoustic Emission) method, which uses a highly sensitive sensor to detect the occurrence of internal cracks or elastic waves generated as internal cracks develop. ing. AE is an elastic wave generated with the progress of fatigue cracks in materials. In the AE method, an AE sensor using a piezoelectric element detects an elastic wave as an AE signal (voltage signal). The AE signal is detected as an indication before material fracture occurs. Therefore, the occurrence frequency and signal intensity of AE signals are useful as indices representing the soundness of materials. Therefore, research is being conducted on techniques for detecting signs of structural deterioration using the AE method.
ところで、AE信号を利用した構造物の評価方法の一つとして、トモグラフィ法が知られている。トモグラフィとは、複数のセンサ間で検出された信号の到達時間差を利用して、計測領域における内部速度場構造を推定する逆解析手法の一つである。トモグラフィは、速度場の変化として、構造物内部の損傷部分を検出する非破壊検査法として利用することができる。特に、その信号源として材料内部から発生するAE信号を用いる方式はAEトモグラフィとして知られている。しかしながら、実環境におけるAEトモグラフィで得られる結果には、測定誤差に基づく推定誤差が含まれるため必ずしも正確ではない。そのため、AEトモグラフィで得られる結果に基づく構造物の劣化状態の評価精度が低い場合があった。 By the way, the tomography method is known as one of the evaluation methods of structures using AE signals. Tomography is one of the inverse analysis techniques for estimating the internal velocity field structure in the measurement region by using the arrival time difference of the signals detected by multiple sensors. Tomography can be used as a non-destructive inspection method to detect damaged parts inside structures as changes in the velocity field. In particular, a method using an AE signal generated from inside the material as its signal source is known as AE tomography. However, the results obtained by AE tomography in a real environment contain estimation errors based on measurement errors, so they are not necessarily accurate. Therefore, the evaluation accuracy of the deterioration state of structures based on the results obtained by AE tomography may be low.
本発明が解決しようとする課題は、構造物の劣化状態の評価精度を向上させることができる構造物評価システム、構造物評価装置及び構造物評価方法を提供することである。 A problem to be solved by the present invention is to provide a structure evaluation system, a structure evaluation device, and a structure evaluation method capable of improving the evaluation accuracy of the deterioration state of a structure.
実施形態の構造物評価システムは、複数のセンサと、到達時刻決定部と、信頼度算出部と、マップ生成部とを持つ。複数のセンサは、弾性波を検出する。到達時刻決定部は、前記複数のセンサそれぞれによって検出された弾性波毎に、前記弾性波の第1の到達時刻と第2の到達時刻とを決定する。信頼度算出部は、前記弾性波の第1の到達時刻と第2の到達時刻とに基づいて、前記弾性波の測定波形に関する信頼度を算出する。マップ生成部は、算出された前記信頼度に基づいて第1のマップを生成する。
A structure evaluation system according to an embodiment has a plurality of sensors, an arrival time determination section, a reliability calculation section, and a map generation section. A plurality of sensors detect acoustic waves. The arrival time determination unit determines a first arrival time and a second arrival time of the elastic waves for each of the elastic waves detected by each of the plurality of sensors. The reliability calculation unit calculates the reliability of the measured waveform of the elastic wave based on the first arrival time and the second arrival time of the elastic wave. The map generator generates a first map based on the calculated reliability .
以下、実施形態の構造物評価システム、構造物評価装置及び構造物評価方法を、図面を参照して説明する。
(第1の実施形態)
図1は、第1の実施形態における構造物評価システム100の構成を示す図である。
構造物評価システム100は、構造物の健全性の評価に用いられる。以下の説明において、評価とは、ある基準に基づいて構造物の健全性の度合い、すなわち構造物の劣化状態を決定することを意味する。なお、以下の説明では、構造物の一例としてコンクリートで構成された橋梁を例に説明するが、構造物は橋梁に限定される必要はない。構造物は、亀裂の発生または進展、あるいは外的衝撃(例えば雨、人工雨など)に伴い弾性波が発生する構造物であればどのようなものであってもよい。例えば、構造物は、岩盤であってもよい。なお、橋梁は、河川や渓谷等の上に架設される構造物に限らず、地面よりも上方に設けられる種々の構造物(例えば高速道路の高架橋)なども含む。Hereinafter, a structure evaluation system, a structure evaluation device, and a structure evaluation method according to embodiments will be described with reference to the drawings.
(First embodiment)
FIG. 1 is a diagram showing the configuration of a
The
また、構造物の劣化状態の評価に影響を及ぼす損傷としては、例えば亀裂、空洞、土砂化等の弾性波の伝搬を妨害する構造物内部の損傷がある。ここで、亀裂には、縦方向の亀裂、横方向の亀裂及び斜め方向の亀裂等が含まれる。縦方向の亀裂とは、センサが設置されている構造物の面に垂直な方向に生じている亀裂である。横方向の亀裂とは、センサが設置されている構造物の面に水平な方向に生じている亀裂である。斜め方向の亀裂とは、センサが設置されている構造物の面に水平及び垂直以外の方向に生じている亀裂である。土砂化とは、主にアスファルトとコンクリート床版の境界部でコンクリートが土砂状に変化する劣化である。
以下、構造物評価システム100の具体的な構成について説明する。Damages that affect the evaluation of the state of deterioration of a structure include damage inside the structure that interferes with the propagation of elastic waves, such as cracks, cavities, and landslides. Here, the cracks include vertical cracks, horizontal cracks, oblique cracks, and the like. A longitudinal crack is a crack that runs perpendicular to the plane of the structure on which the sensor is installed. A lateral crack is a crack that occurs horizontally in the surface of the structure on which the sensor is installed. A diagonal crack is a crack occurring in a direction other than horizontal and vertical in the surface of the structure where the sensor is installed. Sedimentation is deterioration in which concrete changes into earth and sand mainly at the boundary between asphalt and concrete floor slabs.
A specific configuration of the
構造物評価システム100は、複数のセンサ10-1~10-n(nは3以上の整数)、複数の増幅器11-1~11-n、複数のA/D変換器12-1~12-n、信号処理部20及び構造物評価装置30を備える。信号処理部20と構造物評価装置30とは、有線により通信可能に接続される。なお、以下の説明では、センサ10-1~10-nを区別しない場合にはセンサ10と記載する。以下の説明では、増幅器11-1~11-を区別しない場合には増幅器11と記載と記載する。以下の説明では、A/D変換器12-1~12-nを区別しない場合にはA/D変換器12と記載する。
The
センサ10は、構造物に設置される。例えば、センサ10は、橋梁のコンクリート床版に設置される。センサ10は、圧電素子を有し、構造物内部から発生する弾性波を検出する。センサ10は、弾性波を検出することが可能な位置に設置される。例えば、センサ10は、構造物の表面、側面及び底面のいずれかの面上に設置される。センサ10は、検出した弾性波を電圧信号であるAE源信号に変換する。センサ10は、AE源信号を増幅器11に出力する。
A
センサ10には、例えば10kHz~1MHzの範囲に感度を有する圧電素子が用いられる。センサ10は、周波数範囲内に共振ピークをもつ共振型、共振を抑えた広帯域型等の種類があるが、センサ10の種類はいずれでもよい。また、センサ10が弾性波を検出する方法は、電圧出力型、抵抗変化型及び静電容量型等があるが、いずれの検出方法でもよい。なお、センサ10に代えて加速度センサが用いられてもよい。この場合、加速度センサは、構造物内部から発生する弾性波を検出する。そして、加速度センサは、センサ10と同様の処理を行うことによって、検出した弾性波を電圧信号であるAE源信号に変換する。その後、加速度センサは、変換後のAE源信号を増幅器11に出力する。構造物の厚さは、例えば15cm以上である。
A piezoelectric element having sensitivity in the range of 10 kHz to 1 MHz, for example, is used for the
増幅器11は、センサ10から出力されたAE源信号を増幅し、増幅後のAE源信号をA/D変換器12に出力する。
A/D変換器12は、増幅されたAE源信号を受けとると、AE源信号を量子化してデジタル信号に変換する。A/D変換器12は、AE源信号をデジタルの時系列データとして信号処理部20に出力する。
信号処理部20は、A/D変換器12から出力された時系列データを入力とする。信号処理部20は、入力した時系列データのデジタル信号に対して、信号処理を行う。信号処理部20が行う信号処理は、例えば、ノイズ除去、パラメータ抽出等である。信号処理部20は、信号処理後のデジタル信号を含む送信データを生成し、生成した送信データを構造物評価装置30に出力する。The
Upon receiving the amplified AE source signal, the A/
The
構造物評価装置30は、バスで接続されたCPU(Central Processing Unit)やメモリや補助記憶装置などを備え、評価プログラムを実行する。評価プログラムの実行によって、構造物評価装置30は、評価部31、表示部32を備える装置として機能する。なお、構造物評価装置30の各機能の全て又は一部は、ASIC(Application Specific Integrated Circuit)やPLD(Programmable Logic Device)やFPGA(Field Programmable Gate Array)等のハードウェアを用いて実現されてもよい。また、評価プログラムは、コンピュータ読み取り可能な記録媒体に記録されてもよい。コンピュータ読み取り可能な記録媒体とは、例えばフレキシブルディスク、光磁気ディスク、ROM、CD-ROM等の可搬媒体、コンピュータシステムに内蔵されるハードディスク等の記憶装置である。また、評価プログラムは、電気通信回線を介して送受信されてもよい。
The
評価部31は、信号処理部20から出力された送信データを入力とする。評価部31は、入力した送信データに基づいて構造物の健全性を評価する。
表示部32は、液晶ディスプレイ、有機EL(Electro Luminescence)ディスプレイ等の画像表示装置である。表示部32は、評価部31の制御に従って評価結果を表示する。表示部32は、画像表示装置を構造物評価装置30に接続するためのインタフェースであってもよい。この場合、表示部32は、評価結果を表示するための映像信号を生成し、自身に接続されている画像表示装置に映像信号を出力する。The
The
図2は、第1の実施形態における信号処理部20の機能を表す概略ブロック図である。信号処理部20は、波形整形フィルタ201、ゲート生成回路202、到達時刻決定部203、信頼度算出部204、特徴量抽出部205、送信データ生成部206、メモリ207及び出力部208を備える。
波形整形フィルタ201は、入力された時系列データのデジタル信号から所定の信号帯域外のノイズ成分を除去する。波形整形フィルタ201は、例えばデジタルバンドパスフィルタ(BPF)である。波形整形フィルタ201は、ノイズ成分除去後の信号(以下「ノイズ除去弾性波信号」という。)をゲート生成回路202、到達時刻決定部203、信頼度算出部204及び特徴量抽出部205に出力する。FIG. 2 is a schematic block diagram showing functions of the
The
ゲート生成回路202は、波形整形フィルタ201から出力されたノイズ除去弾性波信号を入力とする。ゲート生成回路202は、入力したノイズ除去弾性波信号の波形が持続しているか否かを示すゲート信号を生成する。ゲート生成回路202は、例えばエンベロープ検出器及びコンパレータにより実現される。エンベロープ検出器は、ノイズ除去弾性波信号のエンベロープを検出する。エンベロープは、例えば、ノイズ除去弾性波信号を二乗し、二乗した出力値に対して所定の処理(例えばローパスフィルタを用いた処理やヒルベルト変換)を行うことで抽出される。コンパレータは、ノイズ除去弾性波信号のエンベロープが所定の閾値以上であるか否かを判定する。
The
ゲート生成回路202は、ノイズ除去弾性波信号のエンベロープが所定の閾値以上となった場合、ノイズ除去弾性波信号の波形が持続していることを示す第1のゲート信号を到達時刻決定部203、信頼度算出部204及び特徴量抽出部205に出力する。一方、ゲート生成回路202は、ノイズ除去弾性波信号のエンベロープが所定の閾値未満になった場合、ノイズ除去弾性波信号の波形が持続していないことを示す第2のゲート信号を到達時刻決定部203、信頼度算出部204及び特徴量抽出部205に出力する。
When the envelope of the noise-removed elastic wave signal reaches or exceeds a predetermined threshold, the
到達時刻決定部203は、波形整形フィルタ201から出力されたノイズ除去弾性波信号と、ゲート生成回路202から出力されたゲート信号とを入力とする。到達時刻決定部203は、第1のゲート信号が入力されている間に入力されたノイズ除去弾性波信号を用いて、第1の弾性波到達時刻tM及び第2の弾性波到達時刻tTHを決定する。第1の弾性波到達時刻tM及び第2の弾性波到達時刻tTHは、機械学習により求められる弾性波の到達時刻、ノイズ除去弾性波信号の振幅が所定の閾値を超えた時刻、あるいは、これらの情報を組み合わせた所定の基準を満たした時刻のいずれかの時刻である。The arrival
機械学習により求められる弾性波の到達時刻は、機械学習によりセンサ10に弾性波が受信されたと判定された時刻である。機械学習により第1の弾性波到達時刻tMを求める方法としては、例えばAIC(Akaike‘s Information Criterion)、ChangeFinder、深層学習による変化点検出アルゴリズム等の手法を用いることができる。以下の説明では、第1の弾性波到達時刻tMを求める手法として、ChangeFinderを用い、第2の弾性波到達時刻tTHを求める手法として、ノイズ除去弾性波信号の振幅が所定の閾値を超えた時刻を用いた場合について説明する。到達時刻決定部203は、決定した第1の弾性波到達時刻tM及び第2の弾性波到達時刻tTHを時刻情報として信頼度算出部204及び送信データ生成部206に出力する。The arrival time of the elastic wave obtained by machine learning is the time when the
信頼度算出部204は、ノイズ除去弾性波信号と、ゲート信号と、時刻情報とを入力とする。信頼度算出部204は、第1のゲート信号が入力されている間に得られた時刻情報に基づいて、弾性波の測定波形に関する信頼度を算出する。信頼度は、第1の弾性波到達時刻tMと第2の弾性波到達時刻tTHとの差Δt=|tM-tTH|の逆数に関する値である。信頼度算出部204は、算出した信頼度の情報を送信データ生成部206に出力する。The
特徴量抽出部205は、波形整形フィルタ201から出力されたノイズ除去弾性波信号と、ゲート生成回路202から出力されたゲート信号とを入力とする。特徴量抽出部205は、第1のゲート信号が入力されている間に入力されたノイズ除去弾性波信号を用いて、ノイズ除去弾性波信号の特徴量を抽出する。特徴量は、ノイズ除去弾性波信号の特徴を示す情報である。
The feature
特徴量は、例えばノイズ除去弾性波信号の波形の振幅[mV]、ゲート信号の立ち上がり時間[usec]、ゲート信号の持続時間[usec]、ノイズ除去弾性波信号のゼロクロスカウント数[times]、ノイズ除去弾性波信号の波形のエネルギー[arb.]及びノイズ除去弾性波信号の周波数[Hz]等である。特徴量抽出部205は、抽出した特徴量に関するパラメータを送信データ生成部206に出力する。特徴量抽出部205は、特徴量に関するパラメータを出力する際に、特徴量に関するパラメータにセンサIDを対応付ける。センサIDは、構造物の健全性の評価対象となる領域(以下「評価領域」という。)に設置されているセンサ10を識別するための識別情報を表す。
The feature quantity is, for example, the amplitude [mV] of the waveform of the noise-removed elastic wave signal, the rise time of the gate signal [usec], the duration of the gate signal [usec], the zero-cross count number of the noise-removed elastic wave signal [times], the noise The energy of the waveform of the removed acoustic wave signal [arb. ] and the frequency [Hz] of the noise-removed elastic wave signal. The feature
ノイズ除去弾性波信号の振幅は、例えばノイズ除去弾性波信号の中で最大振幅の値である。ゲート信号の立ち上がり時間は、例えばゲート信号がゼロ値から予め設定される所定値を超えて立ち上がるまでの時間T1である。ゲート信号の持続時間は、例えばゲート信号の立ち上がり開始から振幅が予め設定される値よりも小さくなるまでの時間である。ノイズ除去弾性波信号のゼロクロスカウント数は、例えばゼロ値を通る基準線をノイズ除去弾性波信号が横切る回数である。ノイズ除去弾性波信号の波形のエネルギーは、例えば各時点において振幅を二乗したものを時間積分した値である。なお、エネルギーの定義は、上記例に限定されず、例えば波形の包絡線を用いて近似されたものでもよい。ノイズ除去弾性波信号の周波数は、ノイズ除去弾性波信号の周波数である。 The amplitude of the noise-removed elastic wave signal is, for example, the maximum amplitude value among the noise-removed elastic wave signals. The rise time of the gate signal is, for example, the time T1 until the gate signal rises from a zero value to exceed a preset value. The duration of the gate signal is, for example, the time from when the gate signal starts to rise until the amplitude becomes smaller than a preset value. The zero cross count number of the noise-removed acoustic wave signal is the number of times the noise-removed acoustic wave signal crosses a reference line passing through, for example, a zero value. The waveform energy of the noise-removed elastic wave signal is, for example, a value obtained by time-integrating the square of the amplitude at each time point. The definition of energy is not limited to the above example, and may be approximated using, for example, a waveform envelope. The frequency of the noise-removed acoustic wave signal is the frequency of the noise-removed acoustic wave signal.
送信データ生成部206は、時刻情報と、信頼度の情報と、特徴量に関するパラメータとを入力とする。送信データ生成部206は、入力した時刻情報と、信頼度の情報と、特徴量に関するパラメータとを対応付けることによって送信データを生成する。
メモリ207は、送信データを記憶する。メモリ207は、例えばデュアルポートRAM(Random Access Memory)である。
出力部208は、メモリ207に記憶されている送信データを構造物評価装置30に逐次出力する。The transmission
The
図3は、第1の実施形態における評価部31の機能を表す概略ブロック図である。図3に示すように、評価部31は、取得部311、メモリ312、イベント抽出部313、位置速度標定部314及び誤差マップ生成部315を備える。
取得部311は、信号処理部20から出力された送信データを取得する。取得部311は、取得した送信データをメモリ312に記憶する。
メモリ312は、取得部311によって取得された送信データを記憶する。メモリ312は、磁気ハードディスク装置や半導体記憶装置などの記憶装置を用いて構成される。FIG. 3 is a schematic block diagram showing functions of the
The
The
イベント抽出部313は、メモリ312に記憶されている送信データの中から1イベントにおける送信データを抽出する。イベントとは、構造物で起こったある弾性波発生事象を表す。構造物におけるクラックの発生などに伴い、1回のイベントが発生した場合、複数のセンサ10で略同時刻に弾性波が検出されることになる。すなわち、メモリ312には、略同時刻に検出された弾性波に関する送信データが記憶されている。そこで、イベント抽出部313は、所定の時間窓を設け、到達時刻がその時間窓の範囲内に存在する全ての送信データを1イベントにおける送信データとして抽出する。イベント抽出部313は、抽出した1イベントにおける送信データを位置速度標定部314及び誤差マップ生成部315に出力する。
The
時間窓の範囲Twは、対象とする構造物の弾性波伝播速度vと、最大のセンサ間隔dmaxを用いて、Tw≧dmax/vの範囲になるように決定してもよい。誤検出を避けるためには、Twをできるだけ小さい値に設定することが望ましいため、実質的にはTw=dmax/vとすることができる。
位置速度標定部314は、イベント抽出部313によって抽出された複数の送信データに基づいて、弾性波の発生源(以下「弾性波源」という。)の位置及び構造物の弾性波伝搬速度を標定する。The range Tw of the time window may be determined using the elastic wave propagation velocity v of the target structure and the maximum sensor interval dmax so as to satisfy the range of Tw≧dmax/v. In order to avoid erroneous detection, it is desirable to set Tw to a value as small as possible, so in practice Tw=dmax/v.
The position/
なお、位置速度標定部314は、構造物に対して設置されたセンサ10の設置位置に関する情報(以下「センサ位置情報」という。)をセンサIDに対応付けて予め保持する。センサ位置情報は、例えば緯度および経度、あるいは構造物の基準となる位置からの水平方向および垂直方向の距離などである。弾性波源の位置及び構造物の弾性波伝搬速度の標定には、カルマンフィルタ、最小二乗法などが用いられてもよい。位置速度標定部314は、標定した弾性波源の位置情報を誤差マップ生成部315に出力する。
Note that the position/
誤差マップ生成部315は、イベント抽出部313から出力された複数のイベントにおける送信データに含まれる信頼度の情報及び時刻情報と、評定された弾性波源の位置とに基づいて誤差マップ(第1のマップ)を生成する。誤差マップは、評価領域が複数の区画に分割され、各区画に対して弾性波の到達時刻の時刻差の逆数に関する値の積算値が割り当てられた分布図を表す。すなわち、誤差マップは、評価領域において弾性波の到達時刻の時刻差(誤差)の大きさの度合いが示された分布図である。なお、誤差マップにおいて、各区画の弾性波の通過頻度に差がある場合、通過頻度が高い区画は信頼度の積算値が大きく、通過頻度の低い区画は信頼度の積算値が小さくなる。誤差マップの生成には、カルマンフィルタや最小二乗法等の各種正則化最小二乗法を用いることができる。誤差マップにより、評価領域のどの領域において弾性波の到達時刻の時刻差の度合いが大きいのか、また各区画における弾性波の通過頻度の多さを把握することが可能になる。弾性波の到達時刻の時刻差の度合いが大きいほど、センサ10の接着不良等の障害が生じている可能性が高い。
The error
次に、図4から図6を用いて、本実施形態における構造物評価システム100の処理について説明する。図4は、シミュレーション用に用意したコンクリート床板の構造物モデルを示す図である。図4に示すコンクリート床板は、一辺が800mmの正方形である。コンクリート床板の四隅にはセンサ10-1~10-4が設置され、コンクリート床板の中央にはセンサ10-5が設置されている。また、図4において領域41は損傷が生じている領域(以下「損傷領域」という。)を表す。また、シミュレーションの例として、25点の衝撃をコンクリート床板に加え弾性波を発生させた。
Next, the processing of the
図4における点42で示す位置でコンクリート床板に衝撃を加えた場合に、各センサ10-1~10-5で検出された弾性波の波形を図5A~図5Eに示す。図5Aはセンサ10-1で検出した弾性波の波形を表し、図5Bはセンサ10-2で検出した弾性波の波形を表し、図5Cはセンサ10-3で検出した弾性波の波形を表し、図5Dはセンサ10-4で検出した弾性波の波形を表し、図5Eはセンサ10-5で検出した弾性波の波形を表す。図5A~図5Eの上図において、縦軸は弾性波の振幅を表し、横軸は時間を表す。また、図5A~図5Eの下図において、縦軸はCF(Change finder)のスコアを表し、横軸は時間を表す。図5A~図5EにおけるtCF1の時刻は、到達時刻決定部203がChangeFinderの手法により求めた第1の弾性波到達時刻tMである。すなわち、時刻tCF1は、CFのスコアがある閾値を超えた時刻である。図5A~図5EにおけるtTHの時刻は、第2の弾性波到達時刻tTHである。5A to 5E show the waveforms of the elastic waves detected by the sensors 10-1 to 10-5 when the concrete floor board is impacted at the position indicated by
図5A及び図5Bにおいて、第1の弾性波到達時刻tMと第2の弾性波到達時刻tTHとの誤差が大きいことがわかる。これは、測定波形の振幅が小さく(SN(Signal-to-Noise)が悪く)、弾性波の振幅が閾値を超える時刻が遅く検出されたことが原因と考えられる。センサ10-1及びセンサ10-2を後で調べると、接着不良の問題があったことがわかった。5A and 5B, it can be seen that the error between the first elastic wave arrival time tM and the second elastic wave arrival time tTH is large. This is probably because the amplitude of the measured waveform is small (signal-to-noise (SN) is poor) and the time at which the amplitude of the elastic wave exceeds the threshold is detected late. A later examination of sensor 10-1 and sensor 10-2 revealed that there was a problem with poor adhesion.
図6は、本実施形態における誤差マップの具体例を示す図である。
図6では、上記のシミュレーションにおいて25点の衝撃をコンクリート床板に加えて弾性波を発生させた際の誤差マップ50をコンター図で示している。図6に示すように、誤差マップ50の左側の領域では、誤差が大きくなっている。これは、センサ10-1及びセンサ10-2に接着不良があったことが原因であると考えられる。FIG. 6 is a diagram showing a specific example of the error map in this embodiment.
FIG. 6 is a contour diagram showing an
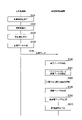
図7は、第1の実施形態における構造物評価システム100による劣化状態の評価処理の流れを示すシーケンス図である。図7に示す例では、ゲート生成回路202から第1のゲート信号が出力された後の処理を示している。
到達時刻決定部204は、ノイズ除去弾性波信号に基づいて第1の弾性波到達時刻tM及び第2の弾性波到達時刻tTHを決定する(ステップS101)。到達時刻決定部203は、決定した時刻情報を信頼度算出部204及び送信データ生成部206に出力する。FIG. 7 is a sequence diagram showing the flow of deterioration state evaluation processing by the
The arrival
信頼度算出部204は、第1のゲート信号が入力されている間に得られた時刻情報に基づいて、ノイズ除去弾性波信号の信頼度を算出する(ステップS102)。例えば、信頼度算出部204は、第1の弾性波到達時刻tMと第2の弾性波到達時刻tTHとの時刻差の逆数に関する値を信頼度として算出する。信頼度算出部204は、算出した信頼度の情報を送信データ生成部206に出力する。
特徴量抽出部205は、第1のゲート信号が入力されている間に得られたノイズ除去弾性波信号の特徴量を抽出する(ステップS103)。送信データ生成部206は、ステップS101からステップS103までの処理で取得された情報を対応付けることによって送信データを生成する(ステップS104)。出力部208は、生成された送信データを構造物評価装置30に出力する(ステップS105)。なお、ステップS101からステップS105までの処理は、センサ10において弾性波が検出されて第1のゲート信号が出力される度に実行される。すなわち、第1のゲート信号が出力される度に、第1の弾性波到達時刻tM、第2の弾性波到達時刻tTH、信頼度及び特徴量が取得される。The
The feature
取得部311は、信号処理部20から出力された送信データを取得し、取得した送信データをメモリ312に記憶する(ステップS106)。イベント抽出部313は、メモリ312に記憶されている送信データの中から1イベントにおける送信データを抽出する(ステップS107)。なお、イベント抽出部313は位置及び速度標定するために必要となる数(例えば、3つ)より多い1イベントにおける送信データを抽出する。イベント抽出部313は、抽出した送信データを位置速度標定部314に出力する。
The
位置速度標定部314は、1イベントにおける送信データに基づいて、1イベントで発生した弾性波源の位置又は位置と弾性波の速度を標定する(ステップS108)。なお、位置速度標定部314が、弾性波源の位置のみを標定する場合、構造物評価装置30には弾性波の速度を標定する他の機能部が設けられてもよい。以下、弾性波源の位置又は位置と弾性波の速度の導出方法について具体的に説明する。複数のセンサ10のうち、1つのセンサ10を原点とする3次元座標系を考える。センサ10の数をn個とした場合、原点のセンサS0と、他のセンサSi(i=1、2、・・・、n-1)との間の到達時間差Δtiは、弾性波源の座標(xs,ys,zs)、センサSiの座標(ai,bi,ci)、弾性波伝播速度vとすると以下の式1のように表される。The position/

観測される値はtiであり、n個のセンサに対してn-1個の(xs,ys,zs,v)を未知数とする非線形連立方程式が得られる。種々の近似的解法を用いることにより未知数(xs,ys,zs,v)を求めることが可能になる。位置速度標定部314は、評定した弾性波源の位置情報を誤差マップ生成部315に出力する。The observed value is t i , and a nonlinear system of equations is obtained with n−1 (x s , y s , z s , v) unknowns for n sensors. It is possible to find the unknowns (x s , y s , z s , v) by using various approximate solution methods. The position/
誤差マップ生成部315は、イベント抽出部313から出力された複数のイベントにおける送信データに含まれる信頼度の情報及び時刻情報と、弾性波源の位置情報とに基づいて誤差マップを生成する(ステップS109)。
The error
まず、誤差マップ生成部315は、構造物の評価領域を複数の区画に分割する。次に、誤差マップ生成部315は、各区画の弾性波の速度の逆数であるスローネスSを測定値に最も合うように調整して、対象領域の速度場分布を推定する。これを定式化すると観測方程式は式(2)のように表される。
First, the

式(2)において、Yは測定値(到達時刻)ベクトル、Hは観測行列、Xは未知パラメータ(スローネス)ベクトル、Vは測定誤差ベクトルを表す。観測行列Hの要素lij(i,jは1以上の整数)は、センサ10-iで測定された弾性波が区画jを通過する線分の長さを指す。この連立方程式になるべくよく合う解を得るため、何らかの目的関数を最小化するXを求める。以下、カルマンフィルタを用いたときの目的関数について説明する。目的関数は、以下の式(3)のように表される。In Equation (2), Y is a measured value (arrival time) vector, H is an observation matrix, X is an unknown parameter (slowness) vector, and V is a measurement error vector. An element l ij (where i and j are integers equal to or greater than 1) of the observation matrix H indicates the length of the line segment through which the elastic wave measured by the sensor 10-i passes through the section j. In order to obtain a solution that fits this system of equations as well as possible, we find X that minimizes some objective function. The objective function when using the Kalman filter will be described below. The objective function is expressed as in Equation (3) below.

式(3)において、X-(-はXの上、以下同様)はXの推定値を表し、PはXの推定誤差共分散行列を表し、RはΔtを対角成分に持つ測定誤差共分散行列を表す。なお、Rの逆数が、時刻差の逆数に関する値に対応する。この式(3)を最小化するX^(^はXの上、以下同様)は以下の式(4)のように与えられる。 In equation (3), X- (- is above X, and so on) represents the estimated value of X, P represents the estimated error covariance matrix of X, and R is the measurement error covariance matrix having Δt as the diagonal component. represents the covariance matrix. Note that the reciprocal of R corresponds to the reciprocal of the time difference. X̂ (̂ is above X, and so on) that minimizes this formula (3) is given by the following formula (4).

Pの対角項はパラメータXの推定誤差分散を表し、その平方根は推定誤差に相当する。つまり、誤差マップ生成部315は、各区画のPの対角項を対応する区画にマッピングすることで、評価領域の推定誤差マップ(誤差マップ)を得る。ここでPの更新式をみると、Pが大きな値をもつ(更新されない)のは、観測行列Hの各要素が値を持たないとき、又は測定誤差共分散行列Rの対角成分Δtが大きな値をもつときと分かる。誤差マップ生成部315は、生成した誤差マップを表示部32に出力する。表示部32は、評価結果として、生成された誤差マップを誤差の高低に応じたコンター図で表示する(ステップS110)。
The diagonal term of P represents the estimated error variance of the parameter X, and its square root corresponds to the estimated error. That is, the error
以上のように構成された構造物評価システム100では、センサ10によって検出された弾性波毎に、第1の弾性波到達時刻tMと、第2の弾性波到達時刻tTHとの時刻差の逆数に関する値の積算値を信頼度として取得し、取得した信頼度を用いて誤差マップを生成する。センサ10の接着不良が生じている場合、弾性波源から接着不良のセンサ10への経路上の領域に対応する誤差マップ内の領域の誤差が大きくなる。このように、構造物評価システム100では、システムの利用者が構造物の劣化状態の評価精度を低下させる要因を発見しやすくなる。推定誤差が大きい範囲が広がっている場合、システムの利用者はセンサ10の接着不良等の問題を踏まえて調査することができる。このように、構造物の劣化状態の評価精度を向上させることができる。In the
また、システムの利用者は、誤差マップを見ることによって推定誤差が大きい領域は何かしらの要因により評価結果が信頼できないと推定することができる。したがって、推定誤差が大きい領域については、弾性波等を人為的に発生させて再度測定するように促すことができる。そのため、構造物の評価精度を低下させる要因を発見しやすくなる。これにより、要因に応じた対応が可能になる。 In addition, the user of the system can estimate that the evaluation result is unreliable for some reason in the area where the estimation error is large by looking at the error map. Therefore, it is possible to artificially generate an elastic wave or the like in a region where the estimation error is large, and prompt the user to perform the measurement again. Therefore, it becomes easier to discover factors that reduce the evaluation accuracy of structures. This makes it possible to take measures according to the factors.
(第2の実施形態)
第2の実施形態は、評価部が、誤差マップに加えて速度場マップをさらに生成する点で第1の実施形態と構成が異なる。以下、相違点についてのみ説明する。
図8は、第2の実施形態における評価部31aの機能を表す概略ブロック図である。評価部31aは、取得部311、メモリ312、イベント抽出部313、位置速度標定部314、誤差マップ生成部315及び速度場マップ生成部316を備える。(Second embodiment)
The second embodiment differs from the first embodiment in that the evaluation unit further generates a velocity field map in addition to the error map. Only differences will be described below.
FIG. 8 is a schematic block diagram showing functions of the
速度場マップ生成部316は、イベント抽出部313から出力された1イベントにおける送信データに含まれる信頼度の情報及び時刻情報と、位置速度標定部314により標定された弾性波源の位置又は位置及び弾性波の速度とに基づいて速度場マップ(第2のマップ)を生成する。速度場マップは、評価領域が複数の区画に分割され、各区画に対して構造物で発生した弾性波の伝搬速度を示す値が割り当てられた分布図を表す。すなわち、速度場マップは、評価領域において弾性波の伝搬速度が示された分布図である。また、速度場マップ生成部316は、位置速度標定部314が弾性波源の位置のみを標定する場合、構造物評価装置30には弾性波の速度を標定する。すなわち、速度場マップ生成部316は、位置速度標定部314から弾性波の速度に関する情報が得られなかった場合には、弾性波の速度を標定してもよい。速度場マップの生成には、式(3)のようにカルマンフィルタを用いる方法や、最小二乗法等の各種正則化最小二乗法を用いることができる。
The velocity field
図9は、本実施形態における速度場マップの具体例を示す図である。
図9に示す速度場マップ60は、図6に示す誤差マップ50と同じ環境下で得られた情報を用いて生成されている。図9では、25点の衝撃をコンクリート床板に加え弾性波を発生させた際の速度場マップ60をコンター図で示している。
センサ10の設置不良の問題がある場合、設置不良が生じているセンサ10周辺の速度が遅くなる。これは、センサ10-1とセンサ10-2に接着不良の問題があったためである。速度場マップ60において、速度が遅い領域が、図4に示す損傷領域41からやや上にずれているのは、センサ10-1の接着不良により弾性波の到達時刻が遅く推定され、速度が遅い領域がそれに引きずられ上にずれたと考えられる。FIG. 9 is a diagram showing a specific example of the velocity field map in this embodiment.
A
If there is a problem of misplacement of the
一方、誤差マップ50は、センサ10-1及びセンサ10-2周辺にまたがり誤差が大きくなっている。これは、センサ10-1及びセンサ10-2の接着不良によるSN低下があったことを意味している。
On the other hand, the
図10は、第2の実施形態における構造物評価システム100による劣化状態の評価処理の流れを示すシーケンス図である。なお、図10において、図7と同様の処理は図7と同様の符号を付して説明を省略する。
イベント抽出部313は、メモリ312に記憶されている送信データの中から1イベントにおける送信データを抽出する(ステップS201)。イベント抽出部313は、抽出した送信データを位置速度標定部314及び誤差マップ生成部315に出力する。FIG. 10 is a sequence diagram showing the flow of deterioration state evaluation processing by the
The
位置速度標定部314は、抽出された1イベントにおける送信データに基づいて、1イベントで発生した弾性波源の位置又は位置と弾性波の速度を標定する(ステップS202)。位置速度標定部314は、評定した弾性波源の位置情報を誤差マップ生成部315に出力する。また、位置速度標定部314は、位置情報と弾性波の速度情報を速度場マップ生成部316に出力する。速度場マップ生成部316は、イベント抽出部313から出力された1イベントにおける送信データに含まれる信頼度の情報及び時刻情報と、弾性波源の位置情報又は位置情報と弾性波の速度情報とに基づいて速度場マップを生成する(ステップS203)。これにより、構造物評価装置30は、構造物の劣化状態を評価する。
The position/
以上のように構成された第2の実施形態における構造物評価システム100によれば、構造物評価装置30は、誤差マップ50のみならず、速度場マップ60も生成する。したがって、システムの利用者は、誤差マップ50と速度場マップ60とを比較することよって、推定結果がどの程度正確であるのかを判断するだけでなく、センサ10の接着不良等の異常検知をより精度よく発見することができる。
According to the
(第3の実施形態)
第3の実施形態は、信号処理部が、到達時刻を補正する点で第1の実施形態及び第2の実施形態と構成が異なる。以下、相違点についてのみ説明する。
図11は、第3の実施形態における信号処理部20bの機能を表す概略ブロック図である。信号処理部20bは、波形整形フィルタ201、ゲート生成回路202、到達時刻決定部203、信頼度算出部204b、特徴量抽出部205、送信データ生成部206、メモリ207、出力部208及び補正部209を備える。(Third embodiment)
The third embodiment differs from the first and second embodiments in that the signal processing unit corrects the arrival time. Only differences will be described below.
FIG. 11 is a schematic block diagram showing functions of the
補正部209は、各センサ10により検出された弾性波に基づいて、異常が生じている可能性のあるセンサ10の到達時刻を補正する。具体的には、まず補正部209は、1つのセンサ10で検出された弾性波に基づくノイズ除去弾性波信号を所定の期間取得する。これにより、補正部209は、1つのセンサ10で検出された弾性波に基づくノイズ除去弾性波信号を複数取得する。次に、補正部209は、取得した複数のノイズ除去弾性波信号それぞれの第1の弾性波到達時刻tM及び第2の弾性波到達時刻tTHを到達時刻決定部203から取得する。補正部209は、取得した第1の弾性波到達時刻tM及び第2の弾性波到達時刻tTHに基づいて時刻差を算出する。補正部209は、算出した複数の時刻差の平均及び分散を算出する。補正部209は、上記の処理をセンサ10毎に実行する。Based on the elastic waves detected by each
補正部209は、平均又は分散の値が閾値以上のセンサ10を異常が生じている可能性のあるセンサ10と判定する。なお、センサ10の異常とは、接着不良や故障などである。補正部209は、異常が生じている可能性のあるセンサ10については、第1の弾性波到達時刻tMを決定する閾値を下げることによって異常が生じている可能性のあるセンサ10の到達時刻を補正する。例えば、補正部209は、センサ10-1及びセンサ10-2を、異常が生じている可能性のあるセンサ10と判定した場合、センサ10-1及びセンサ10-2における第1の弾性波到達時刻tMを決定する閾値を下げる。The
図12Aはセンサ10-1で検出した弾性波の波形を表し、図12Bはセンサ10-2で検出した弾性波の波形を表す。図12A及び図12Bの上図において、縦軸は弾性波の振幅を表し、横軸は時間を表す。また、図12A及び図12Bの下図において、縦軸はCFのスコアを表し、横軸は時間を表す。図12A及び図12BにおけるtCF1の時刻は、到達時刻決定部203がChangeFinderの手法により求めた第1の弾性波到達時刻tMである。図12A及び図12BにおけるtTHの時刻は、第2の弾性波到達時刻tTHである。図12A及び図12BにおけるtCF0の時刻は、補正後の第1の弾性波到達時刻tMである。図12A及び図12Bに示すように、異常が生じている可能性のあるセンサ10で検出された第1の弾性波到達時刻tMが、補正前に比べて早い時刻で検出されていることがわかる。FIG. 12A shows the waveform of the elastic wave detected by the sensor 10-1, and FIG. 12B shows the waveform of the elastic wave detected by the sensor 10-2. In the upper diagrams of FIGS. 12A and 12B, the vertical axis represents the amplitude of elastic waves, and the horizontal axis represents time. In the lower diagrams of FIGS. 12A and 12B, the vertical axis represents the CF score, and the horizontal axis represents time. The time t CF1 in FIGS. 12A and 12B is the first elastic wave arrival time t M obtained by the arrival
また、補正部209は、センサ10全体の時刻差の平均及び分散を算出する。その後、補正部209は、各センサ10の平均及び分散を、センサ10全体の時刻差の平均及び分散に基づいて規格化する。ここで、規格化とは、各センサ10の平均及び分散を、センサ10全体の時刻差の平均及び分散に近づけることを意味する。これにより、センサ10毎の検出感度のずれを調整する。補正部209は、規格化後のセンサ10毎の時刻差の平均及び分散値を信頼度算出部204bに出力する。
信頼度算出部204bは、得られた分散値をセンサ10毎の信頼度として送信データ生成部206に出力する。Further, the
The
図13Aは誤差マップ50の具体例を示す図であり、図13Bは速度場マップ60の具体例を示す図であり、図13Cは補正後の到達時刻に基づいて生成された速度場マップ60aの具体例を示す図である。
図13Cに示すように、到達時刻が補正されたことによって、図13Bに示す速度場マップ60と比較して結果が変化していることがわかる。例えば、図13Cのほうが図13Bに比べて構造物内部に劣化が生じている領域(損傷領域41)がより明確に示されていることがわかる。13A is a diagram showing a specific example of the
As shown in FIG. 13C, it can be seen that the corrected arrival times have changed the results compared to the
以上のように構成された第3の実施形態における構造物評価システム100によれば、補正部209が、異常が生じている可能性のあるセンサ10で検出された弾性波の第1の弾性波到達時刻tMを補正する。例えば、補正部209は、異常が生じている可能性のあるセンサ10で検出された弾性波の第1の弾性波到達時刻tMが、到達時刻決定部203により決定された第1の弾性波到達時刻tMよりも手前になるように補正する。これにより、接着不良等の異常により本来弾性波が検出されているべき時刻で検出されていない場合にも、本来の検出時刻に近づけることができる。そのため、構造物の劣化状態の評価精度の低下を抑制することができる。According to the
(第4の実施形態)
第4の実施形態は、評価部が、測定結果を評価する点で第1の実施形態から第3の実施形態と構成が異なる。以下、相違点についてのみ説明する。
図14は、第4の実施形態における評価部31cの機能を表す概略ブロック図である。評価部31cは、取得部311、メモリ312、イベント抽出部313、位置速度標定部314、誤差マップ生成部315及び測定結果評価部317を備える。(Fourth embodiment)
The fourth embodiment differs from the first to third embodiments in that the evaluation unit evaluates the measurement result. Only differences will be described below.
FIG. 14 is a schematic block diagram showing functions of the
測定結果評価部317は、信頼度に基づいて、評価領域内において損傷領域、又は、センサ10に異常が生じている可能性がある旨の評価を行う。具体的には、測定結果評価部317は、誤差マップ生成部315によって生成された誤差マップを参照し、信頼度で示される値が閾値以下の領域を、損傷領域、又は、センサ10の異常により評価結果が低下している領域と判定する。なお、センサ10の異常とは、接着不良や故障などである。
Based on the reliability, the measurement
測定結果評価部317は、判定結果を表示部32に表示させる。具体的には、測定結果評価部317は、信頼度で示される値が閾値以下の領域が、損傷領域、又は、センサ10の異常により評価結果が低下している領域であることを示す表示を表示部32に表示させる。例えば、測定結果評価部317は、ポップアップや吹き出しなどの表示により判定結果を表示部32に表示させる。
The measurement
以上のように構成された第4の実施形態における構造物評価システム100によれば、評価部31cは、信頼度に基づいて損傷領域、又は、センサ10の異常により評価結果が低下している領域を判定する。そして、評価部31cは、判定結果を表示部32に表示させる。これにより、システムの利用者に対して、評価結果を提供することができる。システムの利用者は、提供された評価結果を参考にして、センサ10の接着不良を直したり、損傷領域を把握することができる。
According to the
以下、第4の実施形態における構造物評価システム100の変形例について説明する。
評価部31cが、第2の実施形態に示した速度場マップ生成部316を備えるように構成されてもよい。このように構成される場合、測定結果評価部317は、誤差マップと速度場マップとに基づいて、損傷領域、又は、センサ10に異常が生じている可能性がある旨の評価を行うように構成される。具体的には、測定結果評価部317は、誤差マップにおいて信頼度で示される値が閾値以下の領域、かつ、速度場マップにおいて速度の値が閾値以下の領域を、損傷領域、又は、センサ10の異常により評価結果が低下している領域と判定する。信頼度で示される値が閾値以下の領域、かつ、速度場マップにおいて速度の値が閾値以下の領域は、構造物内部の劣化又はセンサ10の異常により弾性波が遅く検出されてしまったことなどが原因となる。したがって、評価部31cは、誤差マップと速度場マップとの2つのマップを用いた評価を行うことによって、損傷領域、又は、センサ10の異常により評価結果が低下している領域をより精度よく判定することができる。A modification of the
The
(第5の実施形態)
図15は、第5の実施形態における構造物評価システム100dのシステム構成を示す図である。構造物評価システム100dは、複数のセンサ10-1~10-n、複数の増幅器11-1~11-n、複数のA/D変換器12-1~12-n、信号処理部20、無線送信部21及び構造物評価装置30dを備える。構造物評価装置30dは、評価部31、表示部32及び無線受信部33を備える。第5の実施形態では、信号処理部20と、構造物評価装置30dとの間を無線通信によって接続する。この場合、無線送信部21は、信号処理部20から出力された送信データを構造物評価装置30dに送信する。無線受信部33は、無線送信部21から送信された送信データを受信し、受信した送信データを評価部31に出力する。無線送信部21と無線受信部33との間の無線の周波数帯は、例えば2.4GHz、920MHz帯(日本国内においては915MHz~928MHz)等のいわゆるISMバンド(Industry Science Medical Band)を用いることができる。(Fifth embodiment)
FIG. 15 is a diagram showing the system configuration of a
このように構成されることによって、センサ10、増幅器11、A/D変換器12、信号処理部20及び無線送信部21をセンサノードとして、評価対象となる橋梁等の構造物に設置し、構造物評価装置30dを監視室に設置することが可能になり、遠隔地から構造物の劣化状態をモニタリングすることも可能になる。
With this configuration, the
構造物評価システム100dは、信号処理部20に代えて信号処理部20bを備えるように構成されてもよい。
構造物評価システム100dは、評価部31に代えて評価部31a又は評価部31cのいずれかを備えるように構成されてもよい。
構造物評価システム100dは、第4の実施形態と同様に変形されてもよい。The
The
The
(第6の実施形態)
図16は、第6の実施形態における構造物評価システム100eのシステム構成を示す図である。構造物評価システム100eは、複数のセンサ10-1~10-n、複数の増幅器11-1~11-n、複数のA/D変換器12-1~12-n、信号処理部20、無線送信部21、選択部22及び構造物評価装置30dを備える。選択部22は、特徴量の情報に応じて、評価に利用する送信データを選択する。具体的には、選択部22は、信号の特徴量における振幅が所定の閾値以上の送信データのみ無線送信部21に出力する。(Sixth embodiment)
FIG. 16 is a diagram showing the system configuration of a
このように構成されることによって、無用なノイズ情報を送信データとして送信することが抑制され、送信側の消費電力を削減することが可能になる。また、無用なノイズ情報を送信データとして送信することによる構造物の評価の劣化を抑制することも可能になる。
選択部22と、構造物評価装置30dとの間は有線接続であってもよい。このように構成される場合、選択部22は、選択した送信データを有線通信により構造物評価装置30dに出力する。なお、このように構成される場合、構造物評価システム100eは、無線送信部21及び無線受信部33を備えなくてもよい。With this configuration, transmission of useless noise information as transmission data is suppressed, and power consumption on the transmission side can be reduced. In addition, it is possible to suppress deterioration of the evaluation of the structure due to transmission of useless noise information as transmission data.
A wired connection may be used between the
構造物評価システム100eは、信号処理部20に代えて信号処理部20bを備えてもよい。
構造物評価システム100eは、評価部31に代えて評価部31a又は評価部31cのいずれかを備えるように構成されてもよい。
構造物評価システム100eは、第4の実施形態と同様に変形されてもよい。The
The
The
以下、各実施形態に共通の変形例について説明する。
センサ10は、増幅器11を内蔵していてもよい。このように構成される場合、構造物評価システム100は増幅器11を備えなくてよい。
誤差マップ生成部315及び速度場マップ生成部316は、1つのマップ生成部で実現されてもよい。Modifications common to each embodiment will be described below.
The
構造物評価装置30が備える各機能部は、一部又は全てが別の筺体に備えられていてもよい。例えば、構造物評価装置30が評価部31のみを備えて、位置標定部401および表示部32が別の筺体に備えられてもよい。このように構成される場合、評価部31は、弾性波源分布を別の筺体から取得し、取得した弾性波源分布を用いて構造物の健全性を評価する。そして、評価部31は、評価結果を別の筺体が備える表示部32に出力する。
このように構成されることによって、弾性波源分布の導出に既存の装置を用いることによって、構造物評価装置30の製造コストを抑えることができる。A part or all of the functional units provided in the
With such a configuration, the manufacturing cost of the
信号処理部20は、入力したAE源信号のうち、ノイズレベルより高く定められた第1の閾値より高い振幅値を有するAE源信号に対して信号処理を行うように構成されてもよい。具体的には、まず信号処理部20は、第1の閾値と比較して大きい振動が検出された場合、第1の閾値を超えた時刻から所定の時間分の信号を弾性波波形と判断し、第1の閾値より高い振幅値を有するAE源信号を保存する。そして、信号処理部20は、保存したAE源信号が示す弾性波波形のデータに基づいて、弾性波に関する情報を含むAE特徴量を抽出する。なお、第1の閾値は、予め設定される。
The
信号処理部20,20bは、構造物評価装置30,30dに備えられてもよい。このように構成される場合、信号処理部20,20bは、センサ10による処理が施されたAE源信号を、センサ10から直接、又は、不図示の中継装置を介して取得する。
図1、図15及び図16では、複数のセンサ10-1~10-nに1台の信号処理部20が接続されているが、構造物評価システム100,100d,100eは複数台の信号処理部20を備え、各センサ10にそれぞれ信号処理部20が接続されて複数台のセンサユニットを備えるように構成されてもよい。The
1, 15 and 16, one
誤差マップ生成部315は、誤差マップを新たに生成した場合、前回までに生成された同じ評価領域の誤差マップと、新たに生成した誤差マップとを用いて誤差マップを更新するように構成されてもよい。また、速度場マップ生成部316は、速度場マップにおいても誤差マップと同様に、新たに生成した速度場マップと、前回までの速度場マップとを用いて速度場マップを更新する。このように構成される場合、速度場マップ生成部316は、例えば、新たに生成した速度場マップを含めたこれまでの速度場マップの分割領域における弾性波伝播速度vの平均値を分割区間毎に算出し、算出した値を更新値として各分割区間に割り当てることによって速度場マップを更新する。
The
以上説明した少なくともひとつの実施形態によれば、弾性波を検出する複数のセンサ10と、複数のセンサ10それぞれによって検出された弾性波を用いて、弾性波の到達時刻を決定する到達時刻決定部203と、到達時刻に基づいて、弾性波の測定波形に関する信頼度を算出する信頼度算出部204と、算出された信頼度に基づいて、弾性波の到着時刻に関する誤差マップを生成する誤差マップ生成部315とを持つことにより、構造物の劣化状態の評価精度を向上させることができる。
According to at least one embodiment described above, the plurality of
本発明のいくつかの実施形態を説明したが、これらの実施形態は、例として提示したものであり、発明の範囲を限定することは意図していない。これら実施形態は、その他の様々な形態で実施されることが可能であり、発明の要旨を逸脱しない範囲で、種々の省略、置き換え、変更を行うことができる。これら実施形態やその変形は、発明の範囲や要旨に含まれると同様に、特許請求の範囲に記載された発明とその均等の範囲に含まれるものである。 While several embodiments of the invention have been described, these embodiments have been presented by way of example and are not intended to limit the scope of the invention. These embodiments can be implemented in various other forms, and various omissions, replacements, and modifications can be made without departing from the scope of the invention. These embodiments and their modifications are included in the scope and spirit of the invention, as well as the scope of the invention described in the claims and equivalents thereof.
Claims (10)
前記複数のセンサそれぞれによって検出された弾性波毎に、前記弾性波の第1の到達時刻と第2の到達時刻とを決定する到達時刻決定部と、
前記弾性波の第1の到達時刻と第2の到達時刻とに基づいて、前記弾性波の測定波形に関する信頼度を算出する信頼度算出部と、
算出された前記信頼度に基づいて第1のマップを生成するマップ生成部と、
を備える構造物評価システム。 a plurality of sensors for detecting elastic waves;
an arrival time determination unit that determines a first arrival time and a second arrival time of the elastic wave for each elastic wave detected by each of the plurality of sensors;
a reliability calculation unit that calculates the reliability of the measured waveform of the elastic wave based on the first arrival time and the second arrival time of the elastic wave;
a map generator that generates a first map based on the calculated reliability ;
A structure evaluation system with
前記マップ生成部は、前記弾性波の発生源の位置及び前記弾性波の速度に基づいて、前記弾性波の速度に関する第2のマップをさらに生成する、請求項1から3のいずれ一項に記載の構造物評価システム。 a position/velocity locating unit that locates the position of the source of the elastic wave or the position of the source of the elastic wave and the velocity of the elastic wave based on the arrival times of the plurality of elastic waves detected by the plurality of sensors; prepared,
4. The map generator according to any one of claims 1 to 3, wherein the map generator further generates a second map regarding the velocity of the elastic wave based on the position of the source of the elastic wave and the velocity of the elastic wave. structure evaluation system.
前記到達時刻決定部は、選択された前記弾性波を用いて前記第1の到達時刻と第2の到達時刻を決定する、請求項1から7のいずれか一項に記載の構造物評価システム。 Further comprising a selection unit that selects an elastic wave to be used for evaluation according to the amplitude of the elastic wave,
The structure evaluation system according to any one of claims 1 to 7, wherein the arrival time determination unit determines the first arrival time and the second arrival time using the selected elastic waves.
を備える構造物評価装置。 The reliability of the measured waveform of the elastic wave calculated based on the first arrival time and the second arrival time of the elastic wave determined for each elastic wave detected by each of a plurality of sensors that detect the elastic wave. a map generator that generates a first map based on
A structure evaluation device comprising
前記弾性波の第1の到達時刻と第2の到達時刻とに基づいて、前記弾性波の測定波形に関する信頼度を算出する信頼度算出ステップと、
算出された前記信頼度に基づいて第1のマップを生成するマップ生成ステップと、
を有する構造物評価方法。 an arrival time determination step of determining a first arrival time and a second arrival time of the elastic wave for each of the elastic waves detected by each of a plurality of sensors that detect the elastic waves;
a reliability calculation step of calculating the reliability of the measured waveform of the elastic wave based on the first arrival time and the second arrival time of the elastic wave;
a map generating step of generating a first map based on the calculated reliability ;
Structure evaluation method having.
Applications Claiming Priority (1)
| Application Number | Priority Date | Filing Date | Title |
|---|---|---|---|
| PCT/JP2019/010887 WO2020188640A1 (en) | 2019-03-15 | 2019-03-15 | Structure evaluation system, structure evaluation device, and structure evaluation method |
Publications (2)
| Publication Number | Publication Date |
|---|---|
| JPWO2020188640A1 JPWO2020188640A1 (en) | 2021-04-30 |
| JP7155277B2 true JP7155277B2 (en) | 2022-10-18 |
Family
ID=72519703
Family Applications (1)
| Application Number | Title | Priority Date | Filing Date |
|---|---|---|---|
| JP2020546513A Active JP7155277B2 (en) | 2019-03-15 | 2019-03-15 | Structure evaluation system, structure evaluation device, and structure evaluation method |
Country Status (3)
| Country | Link |
|---|---|
| US (1) | US11519883B2 (en) |
| JP (1) | JP7155277B2 (en) |
| WO (1) | WO2020188640A1 (en) |
Families Citing this family (1)
| Publication number | Priority date | Publication date | Assignee | Title |
|---|---|---|---|---|
| JP7362580B2 (en) * | 2020-09-16 | 2023-10-17 | 株式会社東芝 | Structure evaluation method and structure evaluation system |
Citations (3)
| Publication number | Priority date | Publication date | Assignee | Title |
|---|---|---|---|---|
| JP2004219075A (en) | 2003-01-09 | 2004-08-05 | Civil Engineering Research Institute Of Hokkaido | Ae measurement body, function testing method for ae measurement body, ae measuring method, and active natural ground stabilization evaluating method |
| CN108459082A (en) | 2018-03-27 | 2018-08-28 | 润电能源科学技术有限公司 | A kind of material tests method and material testing apparatus |
| JP2018165732A (en) | 2016-09-15 | 2018-10-25 | 株式会社東芝 | Structure evaluation system, structure evaluation device, and structure evaluation method |
Family Cites Families (11)
| Publication number | Priority date | Publication date | Assignee | Title |
|---|---|---|---|---|
| US5642328A (en) * | 1995-05-08 | 1997-06-24 | Mobil Oil Corporation | Method for determining validity of seismic reflections below lateral velocity variations |
| US6099471A (en) * | 1997-10-07 | 2000-08-08 | General Electric Company | Method and apparatus for real-time calculation and display of strain in ultrasound imaging |
| FR2943276B1 (en) * | 2009-03-19 | 2013-05-17 | Michelin Soc Tech | METHOD FOR MONITORING THE CONDITION OF A TIRE |
| JP6171214B2 (en) | 2012-11-07 | 2017-08-02 | 飛島建設株式会社 | Nondestructive inspection system for structures using tomographic analysis |
| CN104080408B (en) * | 2012-11-21 | 2016-06-01 | 株式会社东芝 | Diagnostic ultrasound equipment, image processing apparatus and image processing method |
| JP6608232B2 (en) * | 2015-09-30 | 2019-11-20 | キヤノンメディカルシステムズ株式会社 | Medical image diagnostic apparatus, medical image processing apparatus, and medical information display control method |
| US10458954B2 (en) | 2016-09-15 | 2019-10-29 | Kabushiki Kaisha Toshiba | Structure evaluation system, structure evaluation apparatus, and structure evaluation method |
| US10352912B2 (en) | 2016-09-15 | 2019-07-16 | Kabushiki Kaisha Toshiba | Structure evaluation system, structure evaluation apparatus, and structure evaluation method |
| CN111225619B (en) * | 2017-10-17 | 2023-04-04 | 富士胶片株式会社 | Acoustic wave diagnostic apparatus and method for controlling acoustic wave diagnostic apparatus |
| CN108459083B (en) * | 2018-03-22 | 2019-03-08 | 中国水利水电科学研究院 | A kind of detection system and its detection method for concrete dam |
| JP6643416B2 (en) | 2018-08-01 | 2020-02-12 | キヤノン株式会社 | Image processing apparatus, image processing method, and program |
-
2019
- 2019-03-15 JP JP2020546513A patent/JP7155277B2/en active Active
- 2019-03-15 WO PCT/JP2019/010887 patent/WO2020188640A1/en active Application Filing
-
2020
- 2020-09-04 US US17/012,604 patent/US11519883B2/en active Active
Patent Citations (3)
| Publication number | Priority date | Publication date | Assignee | Title |
|---|---|---|---|---|
| JP2004219075A (en) | 2003-01-09 | 2004-08-05 | Civil Engineering Research Institute Of Hokkaido | Ae measurement body, function testing method for ae measurement body, ae measuring method, and active natural ground stabilization evaluating method |
| JP2018165732A (en) | 2016-09-15 | 2018-10-25 | 株式会社東芝 | Structure evaluation system, structure evaluation device, and structure evaluation method |
| CN108459082A (en) | 2018-03-27 | 2018-08-28 | 润电能源科学技术有限公司 | A kind of material tests method and material testing apparatus |
Also Published As
| Publication number | Publication date |
|---|---|
| US20210096110A1 (en) | 2021-04-01 |
| JPWO2020188640A1 (en) | 2021-04-30 |
| WO2020188640A1 (en) | 2020-09-24 |
| US11519883B2 (en) | 2022-12-06 |
Similar Documents
| Publication | Publication Date | Title |
|---|---|---|
| US10648949B2 (en) | Structure evaluation system, structure evaluation apparatus, and structure evaluation method | |
| US10352912B2 (en) | Structure evaluation system, structure evaluation apparatus, and structure evaluation method | |
| JP6379475B2 (en) | Vibration analyzer | |
| EP2937689A1 (en) | Adaptive baseline damage detection system and method | |
| JPWO2019167137A1 (en) | Structure evaluation system and structure evaluation method | |
| JP7155277B2 (en) | Structure evaluation system, structure evaluation device, and structure evaluation method | |
| US10458954B2 (en) | Structure evaluation system, structure evaluation apparatus, and structure evaluation method | |
| JP6833770B2 (en) | Structure evaluation system, structure evaluation device and structure evaluation method | |
| US20220130240A1 (en) | Vehicle information estimation system, vehicle information estimation apparatus, vehicle information estimation method, and non-transitory computer readable recording medium | |
| EP4339578A1 (en) | Structure evaluation system, structure evaluation apparatus, structure evaluation method, and computer program | |
| JP7480019B2 (en) | VEHICLE INFORMATION ESTIMATION SYSTEM, VEHICLE INFORMATION ESTIMATION DEVICE, VEHICLE INFORMATION ESTIMATION METHOD, AND COMPUTER PROGRAM |
Legal Events
| Date | Code | Title | Description |
|---|---|---|---|
| A621 | Written request for application examination |
Free format text: JAPANESE INTERMEDIATE CODE: A621 Effective date: 20200904 |
|
| A131 | Notification of reasons for refusal |
Free format text: JAPANESE INTERMEDIATE CODE: A131 Effective date: 20211012 |
|
| A521 | Request for written amendment filed |
Free format text: JAPANESE INTERMEDIATE CODE: A523 Effective date: 20211208 |
|
| A131 | Notification of reasons for refusal |
Free format text: JAPANESE INTERMEDIATE CODE: A131 Effective date: 20220426 |
|
| A521 | Request for written amendment filed |
Free format text: JAPANESE INTERMEDIATE CODE: A523 Effective date: 20220620 |
|
| TRDD | Decision of grant or rejection written | ||
| A01 | Written decision to grant a patent or to grant a registration (utility model) |
Free format text: JAPANESE INTERMEDIATE CODE: A01 Effective date: 20220906 |
|
| A61 | First payment of annual fees (during grant procedure) |
Free format text: JAPANESE INTERMEDIATE CODE: A61 Effective date: 20221005 |
|
| R151 | Written notification of patent or utility model registration |
Ref document number: 7155277 Country of ref document: JP Free format text: JAPANESE INTERMEDIATE CODE: R151 |