JP7148530B2 - Cell classification based on nuclear mechanical signatures - Google Patents
Cell classification based on nuclear mechanical signatures Download PDFInfo
- Publication number
- JP7148530B2 JP7148530B2 JP2019547270A JP2019547270A JP7148530B2 JP 7148530 B2 JP7148530 B2 JP 7148530B2 JP 2019547270 A JP2019547270 A JP 2019547270A JP 2019547270 A JP2019547270 A JP 2019547270A JP 7148530 B2 JP7148530 B2 JP 7148530B2
- Authority
- JP
- Japan
- Prior art keywords
- brillouin
- cell
- cells
- sample
- spectral
- Prior art date
- Legal status (The legal status is an assumption and is not a legal conclusion. Google has not performed a legal analysis and makes no representation as to the accuracy of the status listed.)
- Active
Links
- 210000004027 cell Anatomy 0.000 claims description 399
- 239000000523 sample Substances 0.000 claims description 112
- 230000003595 spectral effect Effects 0.000 claims description 87
- 238000000034 method Methods 0.000 claims description 72
- 238000001514 detection method Methods 0.000 claims description 68
- 238000005286 illumination Methods 0.000 claims description 60
- 210000004940 nucleus Anatomy 0.000 claims description 47
- 238000004611 spectroscopical analysis Methods 0.000 claims description 42
- 230000003287 optical effect Effects 0.000 claims description 40
- 210000003855 cell nucleus Anatomy 0.000 claims description 38
- 238000001228 spectrum Methods 0.000 claims description 33
- 239000006185 dispersion Substances 0.000 claims description 26
- 206010028980 Neoplasm Diseases 0.000 claims description 19
- 201000011510 cancer Diseases 0.000 claims description 16
- 238000004163 cytometry Methods 0.000 claims description 16
- 230000014509 gene expression Effects 0.000 claims description 14
- 101001003584 Homo sapiens Prelamin-A/C Proteins 0.000 claims description 12
- 102100026531 Prelamin-A/C Human genes 0.000 claims description 12
- 239000012472 biological sample Substances 0.000 claims description 9
- 230000004044 response Effects 0.000 claims description 9
- 210000001519 tissue Anatomy 0.000 claims description 9
- BJQHLKABXJIVAM-UHFFFAOYSA-N bis(2-ethylhexyl) phthalate Chemical compound CCCCC(CC)COC(=O)C1=CC=CC=C1C(=O)OCC(CC)CCCC BJQHLKABXJIVAM-UHFFFAOYSA-N 0.000 claims description 8
- 210000002744 extracellular matrix Anatomy 0.000 claims description 7
- 102000010834 Extracellular Matrix Proteins Human genes 0.000 claims description 6
- 108010037362 Extracellular Matrix Proteins Proteins 0.000 claims description 6
- 239000000758 substrate Substances 0.000 claims description 6
- 239000000725 suspension Substances 0.000 claims description 5
- 210000003527 eukaryotic cell Anatomy 0.000 claims description 3
- 230000001629 suppression Effects 0.000 claims 1
- 210000000695 crystalline len Anatomy 0.000 description 116
- 238000005259 measurement Methods 0.000 description 41
- SDZRWUKZFQQKKV-JHADDHBZSA-N cytochalasin D Chemical compound C([C@H]1[C@@H]2[C@@H](C([C@@H](O)[C@H]\3[C@]2([C@@H](/C=C/[C@@](C)(O)C(=O)[C@@H](C)C/C=C/3)OC(C)=O)C(=O)N1)=C)C)C1=CC=CC=C1 SDZRWUKZFQQKKV-JHADDHBZSA-N 0.000 description 34
- LOKCTEFSRHRXRJ-UHFFFAOYSA-I dipotassium trisodium dihydrogen phosphate hydrogen phosphate dichloride Chemical compound P(=O)(O)(O)[O-].[K+].P(=O)(O)([O-])[O-].[Na+].[Na+].[Cl-].[K+].[Cl-].[Na+] LOKCTEFSRHRXRJ-UHFFFAOYSA-I 0.000 description 26
- 238000002474 experimental method Methods 0.000 description 26
- 239000002953 phosphate buffered saline Substances 0.000 description 26
- 238000009826 distribution Methods 0.000 description 25
- 229920003229 poly(methyl methacrylate) Polymers 0.000 description 25
- 239000004926 polymethyl methacrylate Substances 0.000 description 25
- 230000003834 intracellular effect Effects 0.000 description 24
- 238000003384 imaging method Methods 0.000 description 21
- 230000000704 physical effect Effects 0.000 description 20
- 239000007789 gas Substances 0.000 description 18
- 239000007788 liquid Substances 0.000 description 15
- 210000000805 cytoplasm Anatomy 0.000 description 14
- 230000000694 effects Effects 0.000 description 14
- 230000000875 corresponding effect Effects 0.000 description 13
- 102000007469 Actins Human genes 0.000 description 11
- 108010085238 Actins Proteins 0.000 description 11
- 210000003483 chromatin Anatomy 0.000 description 11
- 210000004292 cytoskeleton Anatomy 0.000 description 11
- 108010077544 Chromatin Proteins 0.000 description 10
- OKKJLVBELUTLKV-UHFFFAOYSA-N Methanol Chemical compound OC OKKJLVBELUTLKV-UHFFFAOYSA-N 0.000 description 9
- 230000001413 cellular effect Effects 0.000 description 9
- 238000002073 fluorescence micrograph Methods 0.000 description 9
- 239000000243 solution Substances 0.000 description 9
- RTKIYFITIVXBLE-QEQCGCAPSA-N trichostatin A Chemical compound ONC(=O)/C=C/C(/C)=C/[C@@H](C)C(=O)C1=CC=C(N(C)C)C=C1 RTKIYFITIVXBLE-QEQCGCAPSA-N 0.000 description 9
- 102000006835 Lamins Human genes 0.000 description 8
- 108010047294 Lamins Proteins 0.000 description 8
- 102000029749 Microtubule Human genes 0.000 description 8
- 108091022875 Microtubule Proteins 0.000 description 8
- RTKIYFITIVXBLE-UHFFFAOYSA-N Trichostatin A Natural products ONC(=O)C=CC(C)=CC(C)C(=O)C1=CC=C(N(C)C)C=C1 RTKIYFITIVXBLE-UHFFFAOYSA-N 0.000 description 8
- 239000000872 buffer Substances 0.000 description 8
- 210000005053 lamin Anatomy 0.000 description 8
- 210000004688 microtubule Anatomy 0.000 description 8
- 238000013519 translation Methods 0.000 description 8
- 238000012512 characterization method Methods 0.000 description 7
- 230000001086 cytosolic effect Effects 0.000 description 7
- 239000000463 material Substances 0.000 description 7
- 239000002609 medium Substances 0.000 description 7
- 239000007787 solid Substances 0.000 description 7
- 238000004458 analytical method Methods 0.000 description 6
- 238000013459 approach Methods 0.000 description 6
- 108020004459 Small interfering RNA Proteins 0.000 description 5
- 238000010521 absorption reaction Methods 0.000 description 5
- 238000000862 absorption spectrum Methods 0.000 description 5
- 238000000149 argon plasma sintering Methods 0.000 description 5
- 238000004630 atomic force microscopy Methods 0.000 description 5
- 230000008901 benefit Effects 0.000 description 5
- 238000000684 flow cytometry Methods 0.000 description 5
- 230000005764 inhibitory process Effects 0.000 description 5
- 210000003632 microfilament Anatomy 0.000 description 5
- 108090000623 proteins and genes Proteins 0.000 description 5
- 230000008859 change Effects 0.000 description 4
- 230000003436 cytoskeletal effect Effects 0.000 description 4
- 238000010586 diagram Methods 0.000 description 4
- 229940079593 drug Drugs 0.000 description 4
- 239000003814 drug Substances 0.000 description 4
- 239000007850 fluorescent dye Substances 0.000 description 4
- 230000001939 inductive effect Effects 0.000 description 4
- 230000001394 metastastic effect Effects 0.000 description 4
- 206010061289 metastatic neoplasm Diseases 0.000 description 4
- 238000000386 microscopy Methods 0.000 description 4
- 229920003023 plastic Polymers 0.000 description 4
- 239000004033 plastic Substances 0.000 description 4
- 238000010183 spectrum analysis Methods 0.000 description 4
- 238000001890 transfection Methods 0.000 description 4
- 208000025500 Hutchinson-Gilford progeria syndrome Diseases 0.000 description 3
- 208000007932 Progeria Diseases 0.000 description 3
- 230000001464 adherent effect Effects 0.000 description 3
- 239000000090 biomarker Substances 0.000 description 3
- 239000006285 cell suspension Substances 0.000 description 3
- 230000002596 correlated effect Effects 0.000 description 3
- 230000008878 coupling Effects 0.000 description 3
- 238000010168 coupling process Methods 0.000 description 3
- 238000005859 coupling reaction Methods 0.000 description 3
- 230000003247 decreasing effect Effects 0.000 description 3
- 238000006073 displacement reaction Methods 0.000 description 3
- 239000000975 dye Substances 0.000 description 3
- 238000001914 filtration Methods 0.000 description 3
- 230000006870 function Effects 0.000 description 3
- 230000001965 increasing effect Effects 0.000 description 3
- 238000011534 incubation Methods 0.000 description 3
- 230000003993 interaction Effects 0.000 description 3
- 230000003211 malignant effect Effects 0.000 description 3
- 230000005012 migration Effects 0.000 description 3
- 238000013508 migration Methods 0.000 description 3
- 230000008520 organization Effects 0.000 description 3
- 102000004169 proteins and genes Human genes 0.000 description 3
- 230000035945 sensitivity Effects 0.000 description 3
- 206010006187 Breast cancer Diseases 0.000 description 2
- 208000026310 Breast neoplasm Diseases 0.000 description 2
- WSFSSNUMVMOOMR-UHFFFAOYSA-N Formaldehyde Chemical compound O=C WSFSSNUMVMOOMR-UHFFFAOYSA-N 0.000 description 2
- 108010021099 Lamin Type A Proteins 0.000 description 2
- 102000008201 Lamin Type A Human genes 0.000 description 2
- 206010027476 Metastases Diseases 0.000 description 2
- 241000699670 Mus sp. Species 0.000 description 2
- 102000004142 Trypsin Human genes 0.000 description 2
- 108090000631 Trypsin Proteins 0.000 description 2
- 230000005535 acoustic phonon Effects 0.000 description 2
- 230000006399 behavior Effects 0.000 description 2
- 230000008033 biological extinction Effects 0.000 description 2
- 238000004364 calculation method Methods 0.000 description 2
- 210000005056 cell body Anatomy 0.000 description 2
- 230000003915 cell function Effects 0.000 description 2
- 230000001276 controlling effect Effects 0.000 description 2
- 201000010099 disease Diseases 0.000 description 2
- 208000037265 diseases, disorders, signs and symptoms Diseases 0.000 description 2
- 238000005516 engineering process Methods 0.000 description 2
- 238000011049 filling Methods 0.000 description 2
- 230000004907 flux Effects 0.000 description 2
- 239000011521 glass Substances 0.000 description 2
- 230000010354 integration Effects 0.000 description 2
- 210000003963 intermediate filament Anatomy 0.000 description 2
- 230000033001 locomotion Effects 0.000 description 2
- 238000013507 mapping Methods 0.000 description 2
- 230000007246 mechanism Effects 0.000 description 2
- 230000009401 metastasis Effects 0.000 description 2
- 238000012986 modification Methods 0.000 description 2
- 230000004048 modification Effects 0.000 description 2
- 231100001221 nontumorigenic Toxicity 0.000 description 2
- 210000003463 organelle Anatomy 0.000 description 2
- 230000037361 pathway Effects 0.000 description 2
- 238000006116 polymerization reaction Methods 0.000 description 2
- 230000035755 proliferation Effects 0.000 description 2
- 238000011160 research Methods 0.000 description 2
- 229910052701 rubidium Inorganic materials 0.000 description 2
- IGLNJRXAVVLDKE-UHFFFAOYSA-N rubidium atom Chemical compound [Rb] IGLNJRXAVVLDKE-UHFFFAOYSA-N 0.000 description 2
- 238000010186 staining Methods 0.000 description 2
- 230000001360 synchronised effect Effects 0.000 description 2
- 208000011580 syndromic disease Diseases 0.000 description 2
- 230000008685 targeting Effects 0.000 description 2
- 239000012588 trypsin Substances 0.000 description 2
- ZCYVEMRRCGMTRW-UHFFFAOYSA-N 7553-56-2 Chemical compound [I] ZCYVEMRRCGMTRW-UHFFFAOYSA-N 0.000 description 1
- 108091003079 Bovine Serum Albumin Proteins 0.000 description 1
- 206010055113 Breast cancer metastatic Diseases 0.000 description 1
- 230000004543 DNA replication Effects 0.000 description 1
- 241000196324 Embryophyta Species 0.000 description 1
- 206010064912 Malignant transformation Diseases 0.000 description 1
- KYRVNWMVYQXFEU-UHFFFAOYSA-N Nocodazole Chemical compound C1=C2NC(NC(=O)OC)=NC2=CC=C1C(=O)C1=CC=CS1 KYRVNWMVYQXFEU-UHFFFAOYSA-N 0.000 description 1
- XOJVVFBFDXDTEG-UHFFFAOYSA-N Norphytane Natural products CC(C)CCCC(C)CCCC(C)CCCC(C)C XOJVVFBFDXDTEG-UHFFFAOYSA-N 0.000 description 1
- 102000007999 Nuclear Proteins Human genes 0.000 description 1
- 108010089610 Nuclear Proteins Proteins 0.000 description 1
- 240000007594 Oryza sativa Species 0.000 description 1
- 235000007164 Oryza sativa Nutrition 0.000 description 1
- 238000001069 Raman spectroscopy Methods 0.000 description 1
- 244000061458 Solanum melongena Species 0.000 description 1
- 235000002597 Solanum melongena Nutrition 0.000 description 1
- 229920004890 Triton X-100 Polymers 0.000 description 1
- 230000000735 allogeneic effect Effects 0.000 description 1
- 230000004075 alteration Effects 0.000 description 1
- 230000033115 angiogenesis Effects 0.000 description 1
- 210000004102 animal cell Anatomy 0.000 description 1
- 238000003491 array Methods 0.000 description 1
- 230000004888 barrier function Effects 0.000 description 1
- 238000005452 bending Methods 0.000 description 1
- 230000004071 biological effect Effects 0.000 description 1
- 230000008827 biological function Effects 0.000 description 1
- 230000033228 biological regulation Effects 0.000 description 1
- 230000005540 biological transmission Effects 0.000 description 1
- 238000005298 biophysical measurement Methods 0.000 description 1
- 229940098773 bovine serum albumin Drugs 0.000 description 1
- 230000005773 cancer-related death Effects 0.000 description 1
- 230000022131 cell cycle Effects 0.000 description 1
- 230000012292 cell migration Effects 0.000 description 1
- 230000036755 cellular response Effects 0.000 description 1
- 230000010428 chromatin condensation Effects 0.000 description 1
- 210000000349 chromosome Anatomy 0.000 description 1
- 239000003086 colorant Substances 0.000 description 1
- 238000004891 communication Methods 0.000 description 1
- 238000005056 compaction Methods 0.000 description 1
- 230000000295 complement effect Effects 0.000 description 1
- 230000006835 compression Effects 0.000 description 1
- 238000007906 compression Methods 0.000 description 1
- 230000005493 condensed matter Effects 0.000 description 1
- 238000010226 confocal imaging Methods 0.000 description 1
- 238000004624 confocal microscopy Methods 0.000 description 1
- 238000012937 correction Methods 0.000 description 1
- 230000007423 decrease Effects 0.000 description 1
- 230000001419 dependent effect Effects 0.000 description 1
- 230000004069 differentiation Effects 0.000 description 1
- 235000021186 dishes Nutrition 0.000 description 1
- 231100000673 dose–response relationship Toxicity 0.000 description 1
- 230000003828 downregulation Effects 0.000 description 1
- 210000001671 embryonic stem cell Anatomy 0.000 description 1
- 210000002889 endothelial cell Anatomy 0.000 description 1
- 210000003038 endothelium Anatomy 0.000 description 1
- 230000007613 environmental effect Effects 0.000 description 1
- 230000005284 excitation Effects 0.000 description 1
- 239000000284 extract Substances 0.000 description 1
- 238000000605 extraction Methods 0.000 description 1
- 239000000835 fiber Substances 0.000 description 1
- 210000002950 fibroblast Anatomy 0.000 description 1
- 238000007667 floating Methods 0.000 description 1
- 239000012530 fluid Substances 0.000 description 1
- 238000001506 fluorescence spectroscopy Methods 0.000 description 1
- 239000005350 fused silica glass Substances 0.000 description 1
- 230000004927 fusion Effects 0.000 description 1
- 239000000499 gel Substances 0.000 description 1
- 230000002068 genetic effect Effects 0.000 description 1
- 239000003292 glue Substances 0.000 description 1
- 230000036433 growing body Effects 0.000 description 1
- 239000001963 growth medium Substances 0.000 description 1
- 229940121372 histone deacetylase inhibitor Drugs 0.000 description 1
- 239000003276 histone deacetylase inhibitor Substances 0.000 description 1
- 210000005260 human cell Anatomy 0.000 description 1
- 238000009652 hydrodynamic focusing Methods 0.000 description 1
- 238000003365 immunocytochemistry Methods 0.000 description 1
- 238000000338 in vitro Methods 0.000 description 1
- 238000012623 in vivo measurement Methods 0.000 description 1
- 238000003780 insertion Methods 0.000 description 1
- 230000037431 insertion Effects 0.000 description 1
- 229940028435 intralipid Drugs 0.000 description 1
- 229910052740 iodine Inorganic materials 0.000 description 1
- 239000011630 iodine Substances 0.000 description 1
- NSHPHXHGRHSMIK-IWQSFCKSSA-N latrunculin B Natural products C[C@H]1CC[C@@H]2C[C@@H](C[C@@](O)(O2)[C@@H]3CSC(=O)N3)OC(=O)C=C(C)/CCC=C/1 NSHPHXHGRHSMIK-IWQSFCKSSA-N 0.000 description 1
- NSHPHXHGRHSMIK-JRIKCGFMSA-N latrunculin B Chemical compound C([C@H]1[C@@]2(O)C[C@H]3C[C@H](O2)CC[C@@H](\C=C/CC\C(C)=C/C(=O)O3)C)SC(=O)N1 NSHPHXHGRHSMIK-JRIKCGFMSA-N 0.000 description 1
- 230000003902 lesion Effects 0.000 description 1
- 150000002632 lipids Chemical class 0.000 description 1
- 210000004072 lung Anatomy 0.000 description 1
- 230000036212 malign transformation Effects 0.000 description 1
- 239000003550 marker Substances 0.000 description 1
- 239000011159 matrix material Substances 0.000 description 1
- 230000001404 mediated effect Effects 0.000 description 1
- 208000037819 metastatic cancer Diseases 0.000 description 1
- 208000011575 metastatic malignant neoplasm Diseases 0.000 description 1
- 239000000203 mixture Substances 0.000 description 1
- 230000035772 mutation Effects 0.000 description 1
- 230000007935 neutral effect Effects 0.000 description 1
- 229950006344 nocodazole Drugs 0.000 description 1
- 230000000683 nonmetastatic effect Effects 0.000 description 1
- 210000002353 nuclear lamina Anatomy 0.000 description 1
- 238000000399 optical microscopy Methods 0.000 description 1
- 238000012576 optical tweezer Methods 0.000 description 1
- 230000002018 overexpression Effects 0.000 description 1
- 230000001575 pathological effect Effects 0.000 description 1
- 230000002085 persistent effect Effects 0.000 description 1
- 238000007747 plating Methods 0.000 description 1
- 229920000642 polymer Polymers 0.000 description 1
- 238000012805 post-processing Methods 0.000 description 1
- 238000002360 preparation method Methods 0.000 description 1
- 238000012545 processing Methods 0.000 description 1
- 238000005086 pumping Methods 0.000 description 1
- 230000008707 rearrangement Effects 0.000 description 1
- 230000009467 reduction Effects 0.000 description 1
- 239000012925 reference material Substances 0.000 description 1
- 230000001105 regulatory effect Effects 0.000 description 1
- 230000008439 repair process Effects 0.000 description 1
- 235000009566 rice Nutrition 0.000 description 1
- 239000010979 ruby Substances 0.000 description 1
- 229910001750 ruby Inorganic materials 0.000 description 1
- 238000005070 sampling Methods 0.000 description 1
- 238000000638 solvent extraction Methods 0.000 description 1
- 230000002269 spontaneous effect Effects 0.000 description 1
- 210000003518 stress fiber Anatomy 0.000 description 1
- 238000012360 testing method Methods 0.000 description 1
- 230000025934 tissue morphogenesis Effects 0.000 description 1
- 239000012096 transfection reagent Substances 0.000 description 1
- 210000004881 tumor cell Anatomy 0.000 description 1
- 231100000588 tumorigenic Toxicity 0.000 description 1
- 230000000381 tumorigenic effect Effects 0.000 description 1
- 238000010200 validation analysis Methods 0.000 description 1
- 210000003462 vein Anatomy 0.000 description 1
- 238000005406 washing Methods 0.000 description 1
- XLYOFNOQVPJJNP-UHFFFAOYSA-N water Substances O XLYOFNOQVPJJNP-UHFFFAOYSA-N 0.000 description 1
Images


Classifications
-
- G—PHYSICS
- G01—MEASURING; TESTING
- G01J—MEASUREMENT OF INTENSITY, VELOCITY, SPECTRAL CONTENT, POLARISATION, PHASE OR PULSE CHARACTERISTICS OF INFRARED, VISIBLE OR ULTRAVIOLET LIGHT; COLORIMETRY; RADIATION PYROMETRY
- G01J3/00—Spectrometry; Spectrophotometry; Monochromators; Measuring colours
- G01J3/28—Investigating the spectrum
- G01J3/44—Raman spectrometry; Scattering spectrometry ; Fluorescence spectrometry
-
- G—PHYSICS
- G01—MEASURING; TESTING
- G01J—MEASUREMENT OF INTENSITY, VELOCITY, SPECTRAL CONTENT, POLARISATION, PHASE OR PULSE CHARACTERISTICS OF INFRARED, VISIBLE OR ULTRAVIOLET LIGHT; COLORIMETRY; RADIATION PYROMETRY
- G01J3/00—Spectrometry; Spectrophotometry; Monochromators; Measuring colours
- G01J3/12—Generating the spectrum; Monochromators
- G01J3/18—Generating the spectrum; Monochromators using diffraction elements, e.g. grating
-
- G—PHYSICS
- G01—MEASURING; TESTING
- G01N—INVESTIGATING OR ANALYSING MATERIALS BY DETERMINING THEIR CHEMICAL OR PHYSICAL PROPERTIES
- G01N15/00—Investigating characteristics of particles; Investigating permeability, pore-volume, or surface-area of porous materials
- G01N15/10—Investigating individual particles
- G01N15/14—Electro-optical investigation, e.g. flow cytometers
- G01N15/1434—Electro-optical investigation, e.g. flow cytometers using an analyser being characterised by its optical arrangement
-
- G—PHYSICS
- G01—MEASURING; TESTING
- G01N—INVESTIGATING OR ANALYSING MATERIALS BY DETERMINING THEIR CHEMICAL OR PHYSICAL PROPERTIES
- G01N15/00—Investigating characteristics of particles; Investigating permeability, pore-volume, or surface-area of porous materials
- G01N15/10—Investigating individual particles
- G01N15/14—Electro-optical investigation, e.g. flow cytometers
- G01N15/1456—Electro-optical investigation, e.g. flow cytometers without spatial resolution of the texture or inner structure of the particle, e.g. processing of pulse signals
- G01N15/1459—Electro-optical investigation, e.g. flow cytometers without spatial resolution of the texture or inner structure of the particle, e.g. processing of pulse signals the analysis being performed on a sample stream
-
- G—PHYSICS
- G01—MEASURING; TESTING
- G01N—INVESTIGATING OR ANALYSING MATERIALS BY DETERMINING THEIR CHEMICAL OR PHYSICAL PROPERTIES
- G01N15/00—Investigating characteristics of particles; Investigating permeability, pore-volume, or surface-area of porous materials
- G01N15/10—Investigating individual particles
- G01N2015/1006—Investigating individual particles for cytology
-
- G—PHYSICS
- G01—MEASURING; TESTING
- G01N—INVESTIGATING OR ANALYSING MATERIALS BY DETERMINING THEIR CHEMICAL OR PHYSICAL PROPERTIES
- G01N15/00—Investigating characteristics of particles; Investigating permeability, pore-volume, or surface-area of porous materials
- G01N15/10—Investigating individual particles
- G01N15/14—Electro-optical investigation, e.g. flow cytometers
- G01N2015/1488—Methods for deciding
-
- G—PHYSICS
- G01—MEASURING; TESTING
- G01N—INVESTIGATING OR ANALYSING MATERIALS BY DETERMINING THEIR CHEMICAL OR PHYSICAL PROPERTIES
- G01N15/00—Investigating characteristics of particles; Investigating permeability, pore-volume, or surface-area of porous materials
- G01N15/10—Investigating individual particles
- G01N15/14—Electro-optical investigation, e.g. flow cytometers
- G01N2015/1493—Particle size
- G01N2015/1495—Deformation of particles
-
- G—PHYSICS
- G01—MEASURING; TESTING
- G01N—INVESTIGATING OR ANALYSING MATERIALS BY DETERMINING THEIR CHEMICAL OR PHYSICAL PROPERTIES
- G01N21/00—Investigating or analysing materials by the use of optical means, i.e. using sub-millimetre waves, infrared, visible or ultraviolet light
- G01N21/62—Systems in which the material investigated is excited whereby it emits light or causes a change in wavelength of the incident light
- G01N21/63—Systems in which the material investigated is excited whereby it emits light or causes a change in wavelength of the incident light optically excited
- G01N21/636—Systems in which the material investigated is excited whereby it emits light or causes a change in wavelength of the incident light optically excited using an arrangement of pump beam and probe beam; using the measurement of optical non-linear properties
- G01N2021/638—Brillouin effect, e.g. stimulated Brillouin effect
-
- G—PHYSICS
- G01—MEASURING; TESTING
- G01N—INVESTIGATING OR ANALYSING MATERIALS BY DETERMINING THEIR CHEMICAL OR PHYSICAL PROPERTIES
- G01N2800/00—Detection or diagnosis of diseases
- G01N2800/70—Mechanisms involved in disease identification
- G01N2800/7023—(Hyper)proliferation
- G01N2800/7028—Cancer
Description
[関連出願の相互参照]
本出願は、2017年3月1日に出願された米国仮特許出願第62/465,230号の恩典を主張し、この特許出願は、引用することによりその全体が本明細書の一部をなす。
[Cross reference to related applications]
This application claims the benefit of U.S. Provisional Patent Application No. 62/465,230, filed March 1, 2017, which is incorporated herein by reference in its entirety. Eggplant.
本発明は、核の機械的シグネチャに基づいて細胞を分類する方法及びシステムに関する。具体的には、本発明による方法及びシステムは、ブリルアン技術により可能となったラベルフリーサイトメトリーを使用して取得される細胞核の機械的シグネチャに基づく。その分類は、細胞集団又は単一細胞のいずれかに基づいて達成され得る。本発明はさらに、細胞核の機械的シグネチャに基づいてサンプル内の癌性細胞を特定する方法及びシステムに関する。さらに、本出願は、細胞核の機械的シグネチャに基づいて癌の進行を測定する方法及びシステムを提供する。 The present invention relates to methods and systems for classifying cells based on nuclear mechanical signatures. Specifically, the methods and systems according to the present invention are based on mechanical signatures of cell nuclei obtained using label-free cytometry enabled by Brillouin technology. The classification can be accomplished on the basis of either cell populations or single cells. The invention further relates to methods and systems for identifying cancerous cells in a sample based on mechanical signatures of cell nuclei. Further, the present application provides methods and systems for measuring cancer progression based on the mechanical signature of cell nuclei.
細胞分類は、異なる細胞型又は同じ細胞型の異なる時期を細胞特性に従って区別する必要性に起因する。細胞形態及び表現型の明確な特徴は通常、細胞の分類に使用されるが、それは類似の形態又は表現型を有する細胞の場合にはうまくいかない。したがって、細胞分類のための補足的アプローチとして様々なバイオマーカーが発見されてきた。それらの中でも、細胞力学は、多種多様な用途のための有望なバイオマーカーである。 Cell classification stems from the need to distinguish between different cell types or different stages of the same cell type according to cell characteristics. Distinct characteristics of cell morphology and phenotype are commonly used to classify cells, but it does not work well for cells with similar morphology or phenotype. Therefore, various biomarkers have been discovered as complementary approaches for cell sorting. Among them, cell dynamics are promising biomarkers for a wide variety of applications.
細胞力学は、増殖、遊走、及び遺伝子発現等のその生物学的機能及び活性と密接に関連することが知られている(非特許文献1、非特許文献2)。例えば、細胞が前進する必要がある場合に、細胞体内に収縮力が発生する(非特許文献3)。血管内のせん断流への応答として、ヒト内皮細胞は、せん断応力調節性遺伝子の発現を大きく変えることとなる(非特許文献4)。臨床的には、癌関連死の90%より多くが、非常に悪性で転移性の癌細胞を原因とすることが示されている(非特許文献5)。遺伝的要因及び外環境的要因に加えて、癌細胞の生体力学は、その活性の主要な決定要因である。様々な生物物理的測定から、癌細胞が正常細胞及び良性細胞よりも軟質であること、そしてこの細胞伸展性が転移能の増加と相関することが一貫して見られる(非特許文献6、非特許文献7)。この相関は、3Dマトリックスを通じて効率的に遊走し、及び/又は転移の間に内皮を貫通するために必要とされる癌細胞の最適な機械的特性によるものと考えられる。したがって、細胞の剛性は、癌の進行をグレード分けする固有のバイオマーカーとなり得ることを強く指摘している。近年には、細胞メカノバイオロジーの重要な関心事項として核が浮上している(非特許文献8、非特許文献9、非特許文献10、非特許文献11、非特許文献12、非特許文献13、非特許文献14、非特許文献15)。力に誘発される核形状の変化は、核内の遺伝物質の大規模な再編をもたらし得る(非特許文献8)。核の剛性の変化は、ハッチンソン・ギルフォード・プロジェリア症候群等の疾患と関連している(非特許文献9)。細胞内の最大の最も剛性が高い細胞小器官として、核は細胞遊走のための主たる物理的障壁を授ける(非特許文献10)。組織を通じて遊走する細胞の場合には、核は、細胞骨格動態と協調して位置、形状及び剛性において複雑な変化を遂げるはずである(非特許文献11、非特許文献12、非特許文献13、非特許文献14、非特許文献15)。したがって、核の機械的特性は、それらが細胞機能と密接に関連し、細胞の分類に有用な生物物理学的シグネチャを提供し得るため、非常に関心が持たれている。 Cell dynamics is known to be closely related to its biological functions and activities such as proliferation, migration, and gene expression (Non-Patent Document 1, Non-Patent Document 2). For example, when a cell needs to move forward, a contractile force is generated within the cell body (Non-Patent Document 3). In response to intravascular shear flow, human endothelial cells greatly alter the expression of shear stress-regulated genes (Non-Patent Document 4). Clinically, more than 90% of cancer-related deaths have been shown to be caused by highly malignant and metastatic cancer cells (Non-Patent Document 5). In addition to genetic and environmental factors, the biomechanics of cancer cells are major determinants of their activity. A variety of biophysical measurements consistently show that cancer cells are softer than normal and benign cells, and that this cell extensibility correlates with increased metastatic potential (Non-Patent Document 6; Patent document 7). This correlation is thought to be due to optimal mechanical properties of cancer cells required to efficiently migrate through the 3D matrix and/or penetrate the endothelium during metastasis. Therefore, it is strongly suggested that cell stiffness may be a unique biomarker for grading cancer progression. In recent years, the nucleus has emerged as an important topic of interest in cell mechanobiology , Non-Patent Document 14, Non-Patent Document 15). Force-induced changes in nuclear shape can lead to large-scale rearrangement of genetic material within the nucleus (8). Alterations in nuclear stiffness are associated with diseases such as Hutchinson-Guilford-Progeria syndrome (Non-Patent Document 9). As the largest and most rigid organelle within the cell, the nucleus presents the major physical barrier for cell migration (10). For cells migrating through tissues, the nucleus should undergo complex changes in position, shape and stiffness in concert with cytoskeletal dynamics (11, 12, 13, Non-Patent Document 14, Non-Patent Document 15). Therefore, the mechanical properties of the nucleus are of great interest as they are closely related to cellular function and can provide useful biophysical signatures for cell classification.
これまでの20年間で、細胞の機械的特性(例えば、弾性及び粘性)を調査するための方法、例えばマイクロピペット吸引(非特許文献16)、光ピンセット(非特許文献17)、光ストレッチャー(非特許文献7、非特許文献18)、変形能サイトメトリー(deformability cytometry)(非特許文献19)、原子間力顕微鏡法(AFM)(非特許文献20)、磁気ツイスティングサイトメトリー(非特許文献21)、及びマイクロレオロジー(非特許文献22)を開発するために多くの努力がなされてきた。しかしながら、既存の方法の殆どは、全細胞の機械的特性の平均的な測定をもたらすにすぎず、直接的に核を評価することはできない。目下、核の機械的特性を導き出すには、細胞内に力がどのように伝わるかについての追加の情報及び仮定に加えて染色が必要とされた。初期状態の機械的情報のために、AFM又はマイクロピペット測定(非特許文献23)を可能にするために核を単離する必要があり、それは、核を自然の環境から単離するため、侵襲的であるだけでなく、測定値を偏らせる場合もある。 In the last two decades, methods for investigating the mechanical properties of cells (e.g., elasticity and viscosity), such as micropipette aspiration (16), optical tweezers (17), optical stretchers ( Non-Patent Document 7, Non-Patent Document 18), deformability cytometry (Non-Patent Document 19), atomic force microscopy (AFM) (Non-Patent Document 20), magnetic twisting cytometry (Non-Patent Document 21), and many efforts have been made to develop microrheology (22). However, most existing methods only provide average measurements of mechanical properties of whole cells and cannot directly assess nuclei. At present, deriving the mechanical properties of the nucleus required staining in addition to additional information and assumptions about how forces are transmitted within the cell. For pristine mechanical information, it is necessary to isolate the nucleus to enable AFM or micropipette measurements (23), which isolates the nucleus from its natural environment and therefore requires an invasive procedure. Not only is it predictive, but it can also bias measurements.
ブリルアン散乱は、物質の音響フォノンによって誘発される非弾性光散乱現象である。弾性的に散乱した光から小さな(通常、GHzオーダーの)ブリルアン周波数シフトを分離するために、従来のブリルアン分光法では一般に、マルチパス走査型ファブリ-ペロー干渉計のような高分解能分光計が使用される(非特許文献24)。音響フォノンの動態は物質の粘弾性特性に直接結び付けられるので、散乱光のブリルアン周波数シフトを測定することによって、機械的情報を取得することができる(非特許文献25)。しかしながら、この方法は、スペクトルを逐点走査することに起因して、かなりの時間を要する。さらに、スループット効率はエタロンのフィネスに制限される。このボトルネックは、大きな角分散を生成することができ(非特許文献26)、高いスループットを有するCCDカメラによって全てのスペクトル成分を同時に測定できるようにする仮想画像化フェーズドアレイ(VIPA:virtually imaged phased array)を使用することによって克服された。このタイプの分光計を使用して、生物組織内のレーザー走査共焦点ブリルアン顕微鏡法が低い照明電力及び短い積分時間において実行され、その方法では、サンプル内の各点が順次に照明される。ブリルアンに基づく弾性マップを作成するために、ブリルアンスペクトルが分析された(非特許文献27及び非特許文献28)。 Brillouin scattering is an inelastic light scattering phenomenon induced by acoustic phonons in matter. To separate small Brillouin frequency shifts (typically on the order of GHz) from elastically scattered light, conventional Brillouin spectroscopy typically employs high-resolution spectrometers, such as multi-pass scanning Fabry-Perot interferometers. (Non-Patent Document 24). Mechanical information can be obtained by measuring the Brillouin frequency shift of the scattered light, since the dynamics of acoustic phonons are directly linked to the viscoelastic properties of materials (25). However, this method is rather time consuming due to the point-by-point scanning of the spectrum. Furthermore, the throughput efficiency is limited to the finesse of the etalon. This bottleneck is the virtual imaged phased array (VIPA), which can generate large angular dispersion [26] and allows all spectral components to be measured simultaneously by a CCD camera with high throughput. array) was overcome. Using this type of spectrometer, laser scanning confocal Brillouin microscopy in biological tissue is performed at low illumination power and short integration times, in which each point in the sample is illuminated sequentially. Brillouin spectra were analyzed to generate Brillouin-based elasticity maps [27 and 28].
ブリルアン分光法は、サンプル内の音響的に誘発された光散乱の周波数スペクトルを測定することによって、機械的特性を非侵襲的に測定することが可能なものである。サブミクロン分解能におけるブリルアン顕微鏡法は、細胞の物理化学的特性の測定を可能にした(非特許文献29)。実際に、細胞の機械的特性は、数多くの細胞機能、例えば、増殖、遊走、遺伝子発現だけでなく、組織レベルの挙動、例えば、組織形態形成、転移及び血管形成も決定的に制御する。結果として、「機械的フェノタイピング(mechanical phenotyping)」、すなわち、その機械的特性に基づいて細胞を分類する能力が、細胞状態及び生理学的/病理学的条件を特徴付ける強力な手法として現れた。例えば、細胞剛性(cell stiffness)の減少が、転移能の向上と相関することがわかっており、それゆえ、腫瘍の検出及び病期分類のための新規のラベルフリーマーカーとして提案されてきた(非特許文献30及び非特許文献6。) Brillouin spectroscopy allows the non-invasive measurement of mechanical properties by measuring the frequency spectrum of acoustically induced light scattering within a sample. Brillouin microscopy at submicron resolution has enabled the measurement of physicochemical properties of cells (29). Indeed, the mechanical properties of cells critically control not only numerous cellular functions such as proliferation, migration, gene expression, but also tissue-level behaviors such as tissue morphogenesis, metastasis and angiogenesis. As a result, "mechanical phenotyping", the ability to classify cells based on their mechanical properties, has emerged as a powerful tool for characterizing cell states and physiological/pathological conditions. For example, decreased cell stiffness has been found to correlate with improved metastatic potential and has therefore been proposed as a novel label-free marker for tumor detection and staging (non Patent Document 30 and Non-Patent Document 6.)
関連出願において、ブリルアン光散乱に基づくラベルフリーサイトメトリーのシステム及び方法が提供されており、それにより核の機械的特性をサブミクロン分解能で直接的に調査可能であることを実証するのに成功した(非特許文献31)。この方法は、光ビームを使用して、散乱光のブリルアン周波数シフトを測定することによってサンプルの機械的情報を検知するため、本質的に非接触、非侵襲的、かつラベルフリーである(非特許文献25、非特許文献27、非特許文献29)。 In a related application, a system and method for label-free cytometry based on Brillouin light scattering was provided, which successfully demonstrated that the mechanical properties of the nucleus can be directly investigated with submicron resolution. (Non-Patent Document 31). This method uses a light beam to detect mechanical information in the sample by measuring the Brillouin frequency shift of the scattered light, and is therefore essentially non-contact, non-invasive, and label-free (Non-Patent Document 25, Non-Patent Document 27, Non-Patent Document 29).
本発明は、ブリルアン光散乱技術に基づくラベルフリー細胞分析によって細胞核の機械的特性を特定する方法及びシステムに関する。本出願はさらに、細胞核の機械的特性に基づいて癌性細胞を特定する方法及びシステムを提供する。 The present invention relates to a method and system for characterizing the mechanical properties of cell nuclei by label-free cell analysis based on Brillouin light scattering technology. The present application further provides methods and systems for identifying cancerous cells based on the mechanical properties of cell nuclei.
本発明の一態様において、サンプル内の複数の点においてブリルアン散乱スペクトルに関連付けられる1つ以上のブリルアン指標を同時に取得する方法であって、少なくとも1つの点は細胞の核内にある、方法が提供される。具体的には、サンプルは、第1の方向に沿って光ビームによって照明される。照明光ビームに応答してサンプルから放射されるブリルアン散乱光が収集され、スペクトル分散を誘発する光学配置に送られ、その後、検出ユニットに送られる。光学配置及び検出ユニットは、第1の方向とは異なる第2の方向に沿って位置決めされる。照明光ビームに沿ったサンプルの複数の点が同時に測定されるように、ブリルアン散乱光の空間スペクトルパターンが検出ユニット上で検出される。次に、検出ユニットにおいて各空間点における空間スペクトルパターンが較正される。最終ステップにおいて、検出された空間スペクトルパターンに基づいて、各測定サンプル点において1つ以上のブリルアン指標が計算される。一実施の形態において、ブリルアン指標は、核の少なくとも1つの機械的特性に関する情報を提供する。 In one aspect of the invention, a method is provided for simultaneously acquiring one or more Brillouin indices associated with a Brillouin scattering spectrum at multiple points within a sample, wherein at least one point is within the nucleus of the cell. be done. Specifically, the sample is illuminated by a light beam along a first direction. Brillouin scattered light emitted from the sample in response to the illumination light beam is collected and directed to an optical arrangement that induces spectral dispersion and then to a detection unit. The optical arrangement and detection unit are positioned along a second direction different from the first direction. The spatial spectral pattern of the Brillouin scattered light is detected on the detection unit so that multiple points of the sample along the illumination light beam are measured simultaneously. The spatial spectral pattern at each spatial point is then calibrated in the detection unit. In a final step, one or more Brillouin indices are calculated at each measured sample point based on the detected spatio-spectral pattern. In one embodiment, the Brillouin Index provides information about at least one mechanical property of the nucleus.
本発明の更に別の態様において、サンプル内の複数の点においてブリルアン散乱スペクトルに関連付けられる1つ以上のブリルアン指標を同時に取得するシステムが提供され、少なくとも1つの点は、細胞の核内にある。具体的には、サンプルは、光源によって与えられる光ビームによって第1の方向に沿って照明される。1つ以上のレンズが、照明光ビームに応答してサンプルから放射されるブリルアン散乱光を収集し、ブリルアン散乱光を、スペクトル分散を誘発する光学配置に導光し、その後、検出ユニットに導光する。光学配置、1つ以上のレンズ及び検出ユニットは、第1の方向とは異なる第2の方向に沿って位置決めされる。照明光ビームに沿ったサンプルの複数の点が同時に測定されるように、ブリルアン散乱光の空間スペクトルパターンが検出ユニット上で検出される。検出ユニットと通信するプロセッサが、VIPAにおける角分散を考慮に入れるように、各空間点における空間スペクトルパターンを較正する。さらに、プロセッサは、検出された空間スペクトルパターンに基づいて、各測定サンプル点において1つ以上のブリルアン指標を計算する。一実施の形態において、ブリルアン指標は、ブリルアン周波数シフト、ブリルアンスペクトル線幅、ブリルアン利得又は損失スペクトル、及びその組み合わせからなる群から選択される。更に別の実施の形態において、サンプルの物理的特性は、粘弾性率、密度、屈折率、電歪、及びその組み合わせからなる群から選択される。 In yet another aspect of the invention, a system is provided for simultaneously acquiring one or more Brillouin indices associated with a Brillouin scattering spectrum at multiple points within a sample, at least one point being within the nucleus of the cell. Specifically, the sample is illuminated along a first direction by a light beam provided by a light source. One or more lenses collect Brillouin scattered light emitted from the sample in response to the illumination light beam, direct the Brillouin scattered light to an optical arrangement that induces spectral dispersion, and then to a detection unit. do. An optical arrangement, one or more lenses and a detection unit are positioned along a second direction different from the first direction. The spatial spectral pattern of the Brillouin scattered light is detected on the detection unit so that multiple points of the sample along the illumination light beam are measured simultaneously. A processor in communication with the detection unit calibrates the spatio-spectral pattern at each spatial point to take into account the angular dispersion at the VIPA. Additionally, the processor calculates one or more Brillouin indices at each measured sample point based on the detected spatio-spectral pattern. In one embodiment, the Brillouin index is selected from the group consisting of Brillouin frequency shift, Brillouin spectral linewidth, Brillouin gain or loss spectrum, and combinations thereof. In yet another embodiment, the physical property of the sample is selected from the group consisting of viscoelastic modulus, density, refractive index, electrostriction, and combinations thereof.
本発明の更に別の態様において、生体細胞を分類する方法及びシステムが提供される。そのシステムは、媒質内に生体細胞を含む生体サンプルを有する容器を含む。次に、生体サンプルが光源によって照明され、生体細胞及び媒質内からブリルアン散乱光が生成される。プロセッサが、各生体細胞内の複数の点においてブリルアン散乱スペクトルを計算する。測定されたブリルアン散乱スペクトルに基づいて、プロセッサによって、生体細胞内の異なる空間点における細胞内物理的特性に関連する1つ以上のブリルアン指標が計算される。さらに、プロセッサは、生体細胞内の異なる空間点における物理的特性に基づいて、生体細胞を分類する。一実施の形態において、細胞内物理的特性に関連する指標はブリルアン周波数シフトである。プロセッサは、生体細胞内の各測定点を含むブリルアン周波数シフトに関するヒストグラムを生成するように更に構成される。ヒストグラムを当てはめるために、プロセッサによって、ガウス分布の線形重ね合わせが適用される。次に、プロセッサはヒストグラム内の各ピークを特定し、ピークは、細胞内の異なる領域からの機械的シグネチャを表す。生体細胞内の異なる空間点における物理的特性は、特定された機械的シグネチャと相関がある。 In yet another aspect of the invention, methods and systems for sorting biological cells are provided. The system includes a container having a biological sample including biological cells within a medium. The biological sample is then illuminated by a light source to produce Brillouin scattered light from within the biological cells and medium. A processor computes the Brillouin scattering spectrum at multiple points within each biological cell. Based on the measured Brillouin scattering spectra, a processor calculates one or more Brillouin indices related to intracellular physical properties at different spatial points within the living cell. Further, the processor classifies the biological cell based on physical properties at different spatial points within the biological cell. In one embodiment, the index related to intracellular physical properties is Brillouin frequency shift. The processor is further configured to generate a histogram of Brillouin frequency shifts containing each measurement point within the living cell. A linear superposition of Gaussian distributions is applied by the processor to fit the histogram. The processor then identifies each peak in the histogram, the peak representing a mechanical signature from different regions within the cell. Physical properties at different spatial points within living cells are correlated with the specified mechanical signatures.
本発明の更に別の態様において、核の機械的特性は、癌性である細胞をサンプル内で特定するために使用され得る。 In yet another aspect of the invention, nuclear mechanical properties can be used to identify cells within a sample that are cancerous.
本明細書に組み込まれ、明細書の一部を形成する添付の図面は、本開示の主題に関する種々の実施形態を示す。図面において、同じ参照符号は、同一の、又は機能的に類似の要素を示す。 The accompanying drawings, which are incorporated in and form a part of this specification, illustrate various embodiments of the disclosed subject matter. In the drawings, same reference numbers indicate identical or functionally similar elements.
本発明は幾つかの実施形態を有し、当該技術分野において既知の細部に関しては種々の特許、特許出願及び他の参考文献に頼る。それゆえ、本明細書において或る特許、特許出願又は他の参考文献が引用されるか、又は繰り返されるとき、その特許、特許出願又は他の参考文献は、あらゆる目的のために、そして説明される提案のために、引用することによりその全体が本明細書の一部をなすことは理解されたい。 The present invention has several embodiments and relies on various patents, patent applications and other references for details known in the art. Therefore, when a patent, patent application, or other reference is cited or repeated herein, that patent, patent application, or other reference is for all purposes and It is to be understood that the entirety of this specification is incorporated by reference for the purposes of this proposal.
本発明は、ブリルアン分光法に基づくラベルフリー細胞分析の方法及びシステムに関する。細胞サンプルから放射されるブリルアン散乱光によって、サンプルを特徴付ける物理的情報を取得できるようになる。本発明の一態様では、これを果たすために、サンプルが第1の方向に沿って光ビームによって照明され、サンプルによって放射されたブリルアン散乱光が第2の方向に沿って収集され、検出される。第1の方向に沿ったサンプルの複数の位置を同時に測定することができ、それにより、測定スループットを実効的に改善することができる。さらに、ブリルアンスペクトルから取得された細胞内情報に基づいて、サンプル内の生体細胞を分類することができる。 The present invention relates to methods and systems for label-free cell analysis based on Brillouin spectroscopy. Brillouin scattered light emitted from a cell sample allows the acquisition of physical information characterizing the sample. In one aspect of the invention, to accomplish this, the sample is illuminated by a beam of light along a first direction and the Brillouin scattered light emitted by the sample is collected and detected along a second direction. . Multiple positions of the sample along the first direction can be measured simultaneously, thereby effectively improving measurement throughput. Furthermore, based on the intracellular information obtained from the Brillouin spectrum, the biological cells within the sample can be classified.
等方性物質のブリルアン周波数シフトfbは以下のように表すことができる。


サンプル内の複数の点におけるブリルアン散乱スペクトルに関連付けられる1つ以上の指標を測定することによって、測定サンプルの機械的及び/又は物理的特性を直接読み出すことができる。一実施形態において、指標としてブリルアン周波数シフトが使用される。サンプルの機械的及び/又は物理的特性は、粘弾性率、密度、屈折率及び電歪を含むことができる。測定サンプルの機械的及び/又は物理的特性を特定するために、ブリルアンスペクトル線幅、ブリルアン利得又は損失スペクトル及びその組み合わせ等の他の指標を使用することができる。 By measuring one or more indices associated with the Brillouin scattering spectrum at multiple points within the sample, the mechanical and/or physical properties of the measured sample can be read out directly. In one embodiment, the Brillouin frequency shift is used as the metric. Mechanical and/or physical properties of the sample can include viscoelastic modulus, density, refractive index and electrostriction. Other indicators such as Brillouin spectral linewidths, Brillouin gain or loss spectra and combinations thereof can be used to characterize the mechanical and/or physical properties of the measured sample.
図1は、マイクロ流体チャネル111とともにエピ検出を用いる逐点走査モードのためのブリルアン分光法構成を例示する。具体的には、到来するレーザービーム110が、最初に、ビームスプリッター113によって導光され、その後、対物レンズ112によってマイクロ流体チャネル111上に合焦する。励起されたブリルアン散乱光が、同じ対物レンズ112によって収集され、ビームスプリッター113及びミラー114によってコリメーター115に導光される。コリメーター115に後続するコリメートされたビームは、最初に、円柱レンズ116によって合焦し、その後、VIPA117に送り込まれる。到来する散乱光の異なるスペクトル成分がVIPA117によって空間分離され、球面レンズ118によって合焦し、スペクトルパターンが生成される。スペクトルパターンは、その後、球面レンズ119によって検出ユニット120上に結像される。一例として、検出ユニット120はカメラとすることができる。幾つかの実施形態において、球面レンズ119は不要な場合があり、その場合、カメラ120は、球面レンズ118の前方焦点面に直接配置することができる。マイクロ流体チャネル111の中にサンプルが流されるとき、そのブリルアンシグネチャを識別し、その固有の物理的特性に相関させることができる。したがって、各時点において、対物レンズ112の焦点面において1つの点しか測定することができないので、結像のために逐点走査が必要とされる。
FIG. 1 illustrates a Brillouin spectroscopy setup for point-by-point scanning mode using epi-detection with microfluidic channel 111 . Specifically, an
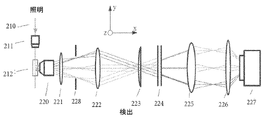
図2は、マイクロ流体チップとともに多重化ブリルアン分光法を用いる本発明の一実施形態に関連する。具体的には、到来する照明光ビーム210が対物レンズ211によって再整形され、サンプルを有するマイクロ流体チップ212内にペンシルビームが生成される。検出ユニット227に通じる検出経路(x方向に沿っている)は、照明経路(y方向に沿っている)に直交する。一例として、検出ユニット227はカメラとすることができる。チップ212内に生成される散乱光は、最初に、第2の対物レンズ220によって収集され、チューブレンズ221の焦点面において中間像が生成される。一実施形態において、中間像面内に空間フィルター又はアパーチャ228が位置決めされ、サンプルから到来する焦点外の光が除去される。中間像がその後方焦点面上にあるように球面レンズ222が配置され、それゆれ、光が球面レンズ222によってコリメートされる。コリメートされた光は、その後、円柱レンズ223によって、z方向においてVIPA224上に合焦する。到来する散乱光の異なるスペクトル成分がVIPA224によって空間分離され、球面レンズ225によって合焦し、スペクトルパターンが生成される。スペクトルパターンは、その後、球面レンズ226によってカメラ227上に結像される。検出経路において、ビームラインの3つのグループが、サンプルの異なる位置を示す。対物レンズ220の視野内で、サンプルの複数の位置を同時に測定できることが、図2から明らかである。幾つかの実施形態において、カメラ227が球面レンズ225の前方焦点面に直接配置されるように、球面レンズ226を除くことができる。
FIG. 2 relates to an embodiment of the invention using multiplexed Brillouin spectroscopy with a microfluidic chip. Specifically, an incoming
照明ビームに沿った全ての測定位置から収集された散乱光が同じ球面レンズ222によってコリメートされるので、異なる位置からのコリメートされたビームは、VIPA224に関するxy平面において異なる角度を有する。この結果として、軸上の点に対して、軸外の点に関するスペクトルに更なる空間的なシフトが生じることになり、それゆえ、空間次元(すなわち、y方向)に沿ったスペクトルは、カメラ227において一直線ではなく、湾曲する。したがって、照明ラインを横切る異なる点からの散乱光の入射角は異なる。これは、サンプル内の異なる点からの散乱がVIPAエタロン内でわずかに異なる経路長及び分散を有することを意味する。角分散を、それゆえ、スペクトル線の曲がりを除去するために、レンズ221の中間結像面において生じる結像倍率が最小化された。VIPA224においてスペクトル分散が生じた後に、カメラ227上のスペクトル線の湾曲に影響を及ぼすことなく、結像倍率を復元することができる。
Since scattered light collected from all measurement positions along the illumination beam is collimated by the same
さらに、角分散を補償するために、スペクトル較正が必要とされる場合がある。カメラ227上で検出されたスペクトル内に照明ビームラインが存在するとき、VIPAエタロンの種々の異なる回折次数におけるシフトされない照明ビームラインの場所を用いて、空間ラインの各ピクセル(サンプルの1つの点に対応する)においてスペクトル較正を実行することができる。照明ビームラインが利用できないとき、各空間点における較正のために必要とされる2つの未知のパラメーター、すなわち、自由スペクトル領域(FSR)及びスペクトル分散係数がある。それゆえ、未知のパラメーターを求めるのに、2つ以上の既知のサンプルの結果を組み合わせれば十分である。
Additionally, spectral calibration may be required to compensate for angular dispersion. When the illumination beamline is within the spectrum detected on
代替的には、図3において例示されるような多重化ブリルアン分光法に基づく本発明の別の実施形態を使用することによって、空間較正を回避することができる。 Alternatively, spatial calibration can be avoided by using another embodiment of the invention based on multiplexed Brillouin spectroscopy as illustrated in FIG.
図3は、本発明の別の実施形態による、レンズアレイを使用する多重化ブリルアン分光法構成を示す。照明経路は図2に示される照明経路と同じである。対物レンズ311を用いて再整形された光310のビームによって、マイクロ流体チップ312が照明される。検出経路(x方向に沿っている)は、照明経路(y方向に沿っている)の法線方向にある。チップ312内に生成される散乱光は、最初に、第2の対物レンズ320によって収集される。チューブレンズ321の焦点面において中間像が生成される。一実施形態において、中間像面内に空間フィルター又はアパーチャ330が位置決めされ、サンプルから到来する焦点外の光が除去される。図2の球面レンズ222が、コリメーションのためのレンズアレイ322に置き換えられる。像全体が数多くの部分に分割され、それぞれがレンズレットによって独立してコリメートされるように、レンズアレイ322の各レンズレットが、中間像の小さな部分からの光のみを受光する。各小部分がレンズレットに対して軸上にあると近似され、全てのレンズレットが十分に位置合わせされるので、コリメートされたビーム全体が平行であり、対応するスペクトルは一直線になるであろう。コリメートされた光は、その後、VIPA224の中に送り込まれる。第2のレンズアレイ327のレンズレットの口径を適合させるために、一対の円柱レンズ325及び326を用いて、VIPA224の出力光を圧縮する。レンズアレイ327の前方焦点面においてスペクトルパターンが生成され、球面レンズ328によって検出ユニット329上に結像される。一例として、検出ユニット329はカメラとすることができる。幾つかの実施形態において、レンズアレイ327の前方焦点面にカメラ329を直接配置できるように、球面レンズ328を除くことができる。
FIG. 3 shows a multiplexed Brillouin spectroscopy setup using a lens array, according to another embodiment of the invention. The illumination path is the same as the illumination path shown in FIG. A
例1
本発明の検証の一例として、図2の構成を用いて多重化ブリルアン分光法の空間分解能を実証するために実験が実施された。この実験において、光源として、単一モード532nm連続波レーザーが使用され、サンプルとして、メタノールを含むプラスチックキュベットが使用された。照明経路(y軸に沿っている)内の対物レンズ211は、0.0175の開口数(NA)を有し、検出経路(x軸に沿っている)内の対物レンズ220は0.1のNAを有する。VIPA224は、17GHzの自由スペクトル領域(FSR)と、20mmの入射窓とを有する。カメラ227は、電子増倍電荷結合素子(EMCCD:electron multiplying coupled charge device)である。サンプル(プラスチックキュベット)と対物レンズ220との間にナイフエッジが配置された。ナイフエッジは、並進ステージを用いて、y方向に沿って動かすことができる。ナイフエッジをy方向に向かって動かすとき、キュベットからの散乱信号が部分的に遮断される。ナイフエッジの変位と、カメラの記録された信号とを比較することによって、分光法の空間分解能を取得することができる。図4a~図4eは、ナイフエッジが異なる位置にあったときにカメラによって取り込まれた原画像を示す。これらの画像において、スペクトル領域内の複数のスペクトル次数が示された。各次数は3つの縞のグループを含み、両側に2つのブリルアン周波数(ストークス及び反ストークスシフト)と、その間にレーザー周波数とを有する。図4fは、ナイフエッジの動きと測定された変位との間の線形関係を示す。カメラの1ピクセルはサンプルの2.45μmのサイズに対応することが示された。また、図2に示されるような現在の構成は、800μm程度の大きいサンプルを測定することができ、結果として、300点より多くの点を同時に測定できることを示す。
Example 1
As an example of validation of the present invention, experiments were performed to demonstrate the spatial resolution of multiplexed Brillouin spectroscopy using the configuration of FIG. In this experiment, a single-mode 532 nm continuous wave laser was used as the light source and a plastic cuvette containing methanol was used as the sample.
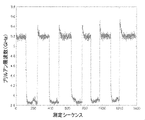
図2に示されるような本発明の実施形態を使用するマイクロ流体チャネル内の流動液体の測定が図5において例示された。溶融石英ガラスから形成されるマイクロ流体チャネルは、100μmの幅と、250μmの深さとを有する。チャネル層は、500μmの幅を有する2つのガラス窓によって挟持される。チャネルは、光ビームが通過できるようにするためのその両側が研磨された1インチ×2インチのチップの中央に位置した。測定中に、液体がz方向に沿ってチャネル内で流動できるように、チップは直立するように配置された。レーザービーム210が、チップの側方からチャネルを照明する。水(5.2GHzのブリルアン周波数シフトを有する)及びメタノール(3.9GHzのブリルアン周波数シフトを有する)が、ハンドヘルドシリンジによって管を通して交互にチャネルの中に注入された。カメラの積分時間は、測定シーケンスの時間でもある0.2秒であった。図5は、多重化ブリルアン分光法によって、マイクロ流体チャネル内の流動液体を明確に識別できることを示す。この実験は、フローサイトメトリーの適用例における本発明の能力を実証する。
Measurement of flowing liquid in a microfluidic channel using an embodiment of the invention as shown in FIG. 2 was illustrated in FIG. The microfluidic channels formed from fused silica glass have a width of 100 μm and a depth of 250 μm. The channel layer is sandwiched by two glass windows with a width of 500 μm. The channel was centered on a 1 inch by 2 inch chip that was polished on both sides to allow the light beam to pass through. The chip was placed upright so that the liquid could flow in the channel along the z-direction during the measurement. A
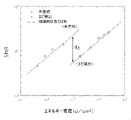
図2において例示される実施形態による、本発明の利点の別の証拠として、本発明(図2)と従来のエピ検出構成(図1)との間の信号対雑音比(SNR)が比較された。各構成のSNRは、光の異なる入力電力密度及びカメラの異なる露光時間において測定された。図6は、本発明がショット雑音限界であり(理論的な当てはめ)、同じ入力エネルギー密度において従来のエピ検出よりはるかに高いSNRを有することを示す。言い換えると、本発明によれば、同じSNRレベルにおいて、従来のエピ検出より速く測定できるようになる。 As further evidence of the advantages of the invention according to the embodiment illustrated in FIG. 2, the signal-to-noise ratio (SNR) between the invention (FIG. 2) and the conventional epi detection configuration (FIG. 1) is compared. rice field. The SNR of each configuration was measured at different input power densities of light and different exposure times of the camera. FIG. 6 shows that the present invention is shot-noise limited (theoretical fit) and has a much higher SNR than conventional epi detection at the same input energy density. In other words, at the same SNR level, the present invention enables faster measurements than conventional epi detection.
上記の方法以外に、測定スループットを更に改善する他の方法がある。一実施形態において、マイクロ流体チャネルの真下に励起源としてトランスデューサーを配置し、サンプルによって生成される音響信号を高めることができる。さらに、刺激されたブリルアン散乱は、一般に、自然発生のブリルアン散乱よりはるかに強い。単波長光源を使用する代わりに、可変の波長を有する2つのレーザーを用いて、マイクロ流体チャネル内に刺激されたブリルアン散乱を生成し、信号を更に高めることができる。さらに、1つの超短パルスレーザーを用いて、インパルス性の刺激されたブリルアン散乱を生成することもできる。 Besides the above methods, there are other ways to further improve the measurement throughput. In one embodiment, a transducer can be placed as an excitation source underneath the microfluidic channel to enhance the acoustic signal produced by the sample. Furthermore, stimulated Brillouin scattering is generally much stronger than spontaneous Brillouin scattering. Instead of using a single wavelength light source, two lasers with variable wavelengths can be used to create stimulated Brillouin scattering within the microfluidic channel to further enhance the signal. In addition, a single ultrashort pulse laser can also be used to generate impulsive stimulated Brillouin scattering.
例2
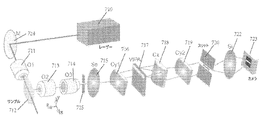
例2は、図7に示されるような本発明の実施形態による、多重化(ライン走査)ブリルアン分光法の特性評価に関連する。図7は、ミラー724と、対物レンズ711、713及び714と、ビームコリメーション用の球面レンズ715と、円柱レンズ716、718及び719と、結像用の球面レンズ722とを含む、ライン走査ブリルアン分光法構成を例示する。一実施形態において、中間像面内に空間フィルター又はアパーチャ725が位置決めされ、サンプルから到来する焦点外の光が除去される。
Example 2
Example 2 relates to the characterization of multiplexed (line scan) Brillouin spectroscopy according to an embodiment of the invention as shown in FIG. FIG. 7 shows a line-scanning Brillouin spectroscopy system including mirror 724,
図7による分光計のスペクトル分解能が、この例において特性評価された。1つの非限定的な実施形態において、光源710は、単一モードの532nm cw(連続波)レーザー(Torus、LaserQuantum社)であった。レーザーヘッドからの光は対物レンズ711(NA=0.0175)によって合焦し、サンプル712を照明するためのラインビームが生成された。90度において、ビームラインに沿った散乱光が最初に、一対の対物レンズ713及び714(いずれも4X/0.1NAであった)によって結像され、その後、球面レンズ715(f=400mm)によってコリメートされた。コリメートされた光は、その後、円柱レンズ716(f=200mm)によって、VIPA717(FSR=17GHz、フィネス=35)の入口において合焦した。VIPA717に後続する分散光は、一対の円柱レンズ718(f=1000mm)及び719(f=400mm)によってスリット720の平面上に結像された。この平面は、球面レンズ722(f=60mm)によってカメラ723(iXon、Andor社)上に再び結像された。スリット720の隙間を調整することによって、望ましくない周波数を遮断することができ、ブリルアン周波数成分のみを通過させることができた。 The spectral resolution of the spectrometer according to FIG. 7 was characterized in this example. In one non-limiting embodiment, light source 710 was a single mode 532 nm cw (continuous wave) laser (Torus, LaserQuantum). Light from the laser head was focused by objective lens 711 (NA=0.0175) to produce a line beam for illuminating sample 712 . At 90 degrees, the scattered light along the beamline is first imaged by a pair of objective lenses 713 and 714 (both of which were 4X/0.1 NA) and then by spherical lens 715 (f = 400 mm). collimated. The collimated light was then focused at the entrance of a VIPA 717 (FSR=17 GHz, finesse=35) by a cylindrical lens 716 (f=200 mm). The dispersed light following VIPA 717 was imaged onto the plane of slit 720 by a pair of cylindrical lenses 718 (f=1000 mm) and 719 (f=400 mm). This plane was re-imaged onto camera 723 (iXon, Andor) by spherical lens 722 (f=60 mm). By adjusting the gap of slit 720, unwanted frequencies could be blocked and only Brillouin frequency components could pass.
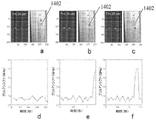
サンプルとして、純メタノールを含むプラスチックキュベット712が使用される。カメラ723によって取得された元の分散パターンが図8aに示される。上側及び下側の2つのグレーラインは弾性散乱周波数(レーザーの周波数と同じ)であり、その間にある2つの明るいラインはブリルアン周波数(ストークス及び反ストークス成分)である。横軸及び縦軸はそれぞれ、空間領域及びスペクトル領域に対応する。 A plastic cuvette 712 containing pure methanol is used as a sample. The original dispersion pattern captured by camera 723 is shown in FIG. 8a. The upper and lower two gray lines are the elastic scattering frequencies (same as the laser frequency), and the two bright lines in between are the Brillouin frequencies (Stokes and anti-Stokes components). The horizontal and vertical axes correspond to the spatial and spectral domains, respectively.
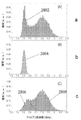
図8bは、図8aにおいて点線によって示される場所におけるブリルアンスペクトルを示す。VIPAの自由スペクトル領域は17GHzであったので、スペクトル分解能がピクセルあたり0.177GHzであったと計算することができた。レーザー周波数の連続するピークと半値全幅との空間比を計算することによって、約35のフィネスも確認された。推定ブリルアン周波数シフトの精度は、空間領域においてピクセルごとの信号対雑音比(SNR)を計算することによって特性評価された。図8cは、SNR対照明エネルギーの対数プロットを示す。図8cのSNRは、異なる照明エネルギーで計算された。測定データは、概ね平方根依存性を示し、ショット雑音限界挙動を示した。図8dは、単一の点において100回測定した場合の推定ブリルアン周波数の典型的な分布を示しており、その分布はガウス形状を有する。この分布の標準偏差を用いて、推定ブリルアン周波数の精度を推定した。この場合、それは8.5MHzであり、0.22%の相対的不確実性に相当する。 Figure 8b shows the Brillouin spectrum at the location indicated by the dashed line in Figure 8a. Since the free spectral range of VIPA was 17 GHz, it could be calculated that the spectral resolution was 0.177 GHz per pixel. A finesse of about 35 was also confirmed by calculating the spatial ratio of the continuous peak of the laser frequency to the full width at half maximum. The accuracy of the estimated Brillouin frequency shift was characterized by calculating the signal-to-noise ratio (SNR) for each pixel in the spatial domain. FIG. 8c shows a logarithmic plot of SNR versus illumination energy. The SNR in Fig. 8c was calculated at different illumination energies. The measured data showed a roughly square-root dependence, indicating shot-noise-limited behavior. Fig. 8d shows a typical distribution of estimated Brillouin frequencies for 100 measurements at a single point, which distribution has a Gaussian shape. The standard deviation of this distribution was used to estimate the accuracy of the estimated Brillouin frequency. In this case it is 8.5 MHz, corresponding to a relative uncertainty of 0.22%.
空間分解能を特性評価するために、キュベット712に後続してすぐに、ただし検出対物レンズ713に先行して、ナイフエッジが配置される。一実施形態において、ナイフエッジを搬送する並進ステージが25.4μmのステップサイズでx方向に動かされ、ナイフエッジの対応する像が分光計のカメラ723によって監視された。その結果が図9に示される。測定データが直線に当てはめられ、それにより、空間分解能はピクセルあたり3.29μmと計算された。カメラ723は全部で512×512ピクセルを有し、それはサンプル面内の概ね1.68mmに対応する。図8aに示されるように、スペクトル線は空間次元にわたって完全に一直線ではなく、VIPA717における軸外の点の入射角の偏差に起因してわずかな湾曲を有する。この湾曲の結果として、カメラにわたってスペクトル分解能が変動する場合があるが、その変動はピクセルあたり0.2MHz未満まで、すなわち、1mmの空間的視野を超える範囲内で10MHz以下まで最小化された。幾つかの実施形態において、この誤差は、必要な場合に各点においてスペクトル分解能を較正することによって回避することができる。 A knife edge is placed immediately following the cuvette 712 but preceding the detection objective 713 to characterize the spatial resolution. In one embodiment, the translation stage carrying the knife edge was moved in the x-direction with a step size of 25.4 μm and the corresponding image of the knife edge was monitored by spectrometer camera 723 . The results are shown in FIG. The measured data were fitted to a straight line, from which the spatial resolution was calculated to be 3.29 μm per pixel. Camera 723 has a total of 512×512 pixels, which corresponds approximately to 1.68 mm in the sample plane. As shown in FIG. 8a, the spectral lines are not perfectly straight across the spatial dimension, but have a slight curvature due to the deviation of the angle of incidence of the off-axis point on the VIPA 717. FIG. This curvature may result in spectral resolution variations across the camera, but the variations were minimized to less than 0.2 MHz per pixel, ie, less than 10 MHz within a spatial field of view of more than 1 mm. In some embodiments, this error can be avoided by calibrating the spectral resolution at each point when necessary.
例3
2次元及び3次元結像
例3は、図7による多重化ブリルアン分光法に基づく2次元及び3次元結像の特性評価に関連する。
Example 3
2D and 3D Imaging Example 3 relates to the characterization of 2D and 3D imaging based on multiplexed Brillouin spectroscopy according to FIG.
非球面PMMAレンズのブリルアンシフトが、図10aに示される構成において測定された。図10aは、屈折率整合液でキュベットを満たす前に撮影されたPMMAレンズの写真を示す。下はPMMAレンズを拡大撮影した写真であり、スケールバーは500μmの長さを有する。PMMAレンズはプラスチックキュベットの中に配置され、サンプルの表面における散乱を低減するために、キュベットは屈折率整合液であらかじめ満たされた。キュベットは、垂直に配置された電動並進ステージによって搬送され、その並進ステージによって、サンプルをy方向に走査できるようにした。一実施形態において、キュベット(図7のサンプル712)は、10mm×10mmのサイズを有する。非球面ポリメチルメタクリレート(PMMA)レンズをキュベット712の中央領域に浮かせておくために、PMMAレンズの縁が光学接着剤を用いて注射器の針の先端に取り付けられ、その後、針の端部がキュベットの壁に固定された。一例として、限定はしないが、電動並進ステージ(T-LSM025A、Zaber社)は、25mm移動範囲とRS-232制御とを有した。並進ステージの最大速度は7mm/s程度に速くすることができる。 The Brillouin shift of an aspheric PMMA lens was measured in the configuration shown in Figure 10a. FIG. 10a shows a photograph of the PMMA lens taken before filling the cuvette with index-matching liquid. The bottom is a magnified photograph of the PMMA lens, and the scale bar has a length of 500 μm. The PMMA lens was placed in a plastic cuvette and the cuvette was pre-filled with index matching liquid to reduce scattering at the surface of the sample. The cuvette was transported by a vertically oriented motorized translation stage that allowed the sample to be scanned in the y-direction. In one embodiment, the cuvette (sample 712 in FIG. 7) has a size of 10 mm×10 mm. To keep the aspherical polymethylmethacrylate (PMMA) lens floating in the central region of the cuvette 712, the rim of the PMMA lens is attached to the tip of a syringe needle using optical glue, and then the end of the needle is attached to the cuvette. fixed to the wall of By way of example and not limitation, a motorized translation stage (T-LSM025A, Zaber) had a 25 mm travel range and RS-232 control. The maximum speed of the translation stage can be as high as 7 mm/s.
一実施形態において、走査を自動的に実行できるように、Lab Viewプログラムを用いて、ステージの移動とカメラによる取得とを同期させる。レーザー電力は70mWであり、カメラの露光時間は0.1秒であった。ステージの速度は、30秒以内に300フレームが取り込まれるように50μm/secと設定され、それは全部で1.5mmの変位に対応した。サンプル(PMMAレンズ)が液体の中に浸漬されたとき、屈折率整合のために、裸眼ではほとんど見ることができなかった。しかしながら、サンプル及び整合液の剛性が異なったので、それらはブリルアンスペクトルによって容易に識別することができた。図10bは、カメラ723によって取得された典型的な信号のスナップショットであり、スリット720によって弾性周波数が遮断されたために、ブリルアン周波数成分のみが示された。PMMAレンズが整合液によって包囲されたことが図10bにおいて明確に示される。図10c及び図10dはそれぞれ、単一の点における屈折率整合液及びPMMAのブリルアンスペクトルを示す。点及び実線はそれぞれ、測定データ及び当てはめられたデータに対応する。スペクトル分解能の特性評価データを使用するとき、PMMA及び整合液のブリルアン周波数シフトはそれぞれ、11.32GHz及び9.11GHzと特定された。 In one embodiment, the Lab View program is used to synchronize stage movement and camera acquisition so that scanning can be performed automatically. The laser power was 70 mW and the camera exposure time was 0.1 sec. The stage speed was set at 50 μm/sec such that 300 frames were acquired within 30 seconds, which corresponded to a total displacement of 1.5 mm. When the sample (PMMA lens) was immersed in liquid, it was barely visible to the naked eye because of the refractive index matching. However, since the stiffness of the sample and matching fluids were different, they could be easily distinguished by Brillouin spectra. FIG. 10b is a snapshot of a typical signal acquired by camera 723, showing only the Brillouin frequency components due to the elastic frequencies being blocked by slit 720. FIG. It is clearly shown in FIG. 10b that the PMMA lens was surrounded by matching liquid. Figures 10c and 10d show the Brillouin spectra of the index-matching liquid and PMMA at a single point, respectively. Dots and solid lines correspond to measured and fitted data, respectively. Using spectral resolution characterization data, the Brillouin frequency shifts of PMMA and matching liquid were determined to be 11.32 GHz and 9.11 GHz, respectively.
図11a~図11dは、PMMAレンズの2Dブリルアン画像及び3Dブリルアン画像を示す。図11aは、図10a内の点線に沿って走査された断面を示す。矢印は、照明ビームを示す。図11bは、測定されたブリルアン周波数シフトに基づく、整合液内に浸漬されたPMMAレンズの2D結像を示す。一実施形態において、画像の全体サイズは約1.1mm×1.5mmであった。PMMAレンズと整合液との界面は、画像から明確に確認することができ、PMMAレンズの内側領域は極めて均一である。異なる物質の界面において、各物質に対応する2つのブリルアンシグネチャ間にクロストークがある。2つの物質が類似のブリルアンシフトを有する場合には、このクロストーク効果が界面において不明瞭な領域を導入することになる。この実験において、PMMAレンズ及び屈折率整合液は異なるブリルアンシフトを有し、それにより、不明瞭な領域を、2ピクセル、すなわち、6.58μm以内にあると定量化できるようになる。図11cに示される走査方法を使用することによって、この分光法が迅速な3D結像を実施できることが実証された。図11dは、別の並進ステージを用いてPMMAレンズがz軸に沿って動かされるときに取得された断面画像の5つのスライスを示す。 11a-11d show 2D and 3D Brillouin images of the PMMA lens. FIG. 11a shows a cross-section scanned along the dashed line in FIG. 10a. Arrows indicate illumination beams. FIG. 11b shows 2D imaging of a PMMA lens immersed in matching liquid based on the measured Brillouin frequency shift. In one embodiment, the overall size of the image was approximately 1.1 mm x 1.5 mm. The interface between the PMMA lens and the matching liquid can be clearly seen from the image, and the inner area of the PMMA lens is quite uniform. At the interface of different materials, there is crosstalk between the two Brillouin signatures corresponding to each material. If the two materials have similar Brillouin shifts, this crosstalk effect will introduce an ambiguous region at the interface. In this experiment, the PMMA lens and the index-matching liquid have different Brillouin shifts, which allows the ambiguity region to be quantified to be within 2 pixels, ie 6.58 μm. It was demonstrated that this spectroscopy can perform rapid 3D imaging by using the scanning method shown in FIG. 11c. FIG. 11d shows five slices of cross-sectional images acquired when the PMMA lens is moved along the z-axis using another translation stage.
要するに、図1~図11dを参照すると、本発明の一実施形態において、照明ビームはレーザービームとすることができ、検出ユニット120、227、329及び723は、CCD、CMOSカメラ、又は検出器のアレイとすることができる。更に別の実施形態において、照明光は、その中心値に固定されるか、又はその中心値付近において調整可能である、UV、可視光又はIR方式における単一波長を有する照明源によって与えられる。各測定サンプル点において計算された1つ以上のブリルアン指標に基づいてサンプルの画像を生成するために、サンプルは、結像又は取得中に照明光ビームに対して移動する可動プラットフォーム上に配置することができる。更に別の実施形態において、照明光ビームは、結像中に静止したサンプルに対して移動している場合がある。一例として、限定はしないが、サンプルは、生物有機体、組織又は生体細胞を含む、生体サンプルとすることができる。一実施形態において、生体細胞は生細胞である。生体細胞は、ブリルアン指標を測定している間に、懸濁される場合があるか、2D基体に付着している場合があるか、又は3D細胞外マトリックス内で培養される場合がある。
Briefly, referring to FIGS. 1-11d, in one embodiment of the invention, the illumination beam can be a laser beam and the
一実施形態において、カメラ120、227、329及び723上で検出されたスペクトルは、ブリルアン散乱光の空間スペクトルパターンである。検出された空間スペクトルパターンに基づいて、各測定サンプル点において1つ以上のブリルアン指標を計算することができる。一例として、限定はしないが、ブリルアン指標はブリルアン周波数シフト、ブリルアンスペクトル線幅、ブリルアン利得又は損失スペクトル、及びその組み合わせとすることができる。サンプル点において測定されたブリルアン指標はそれぞれ、この時点におけるサンプルの物理的特性を示す。一例として、限定はしないが、サンプルの物理的特性は、粘弾性率、密度、屈折率、電歪及びその組み合わせとすることができる。一実施形態において、ブリルアン散乱光に関連付けられる指標は、ブリルアン周波数シフトである。
In one embodiment, the spectra detected on
各測定サンプル点における1つ以上のブリルアン指標に基づいて、サンプルの画像を生成することができる。図2、図3及び図7は90度の角度をなすように配置される照明経路及び検出経路を示すが、いずれの構成も、互いに対して0度より大きい任意の角度に配置される照明経路及び検出経路を用いて実現することができる。 An image of the sample can be generated based on one or more Brillouin indices at each measured sample point. 2, 3 and 7 show the illumination and detection paths positioned at a 90 degree angle, any configuration will allow the illumination paths to be positioned at any angle greater than 0 degrees with respect to each other. and detection paths.
図2、図3及び図7を参照すると、スペクトル分散を誘発する光学配置は、球面レンズ、円柱レンズ、VIPAを備えることができる。具体的には、その光学配置は、図2の要素222、223、224、225及び226、図3の要素322、323、324、325、326、327及び328、並びに図7の要素715、716、717、719、720及び722を備える。一実施形態において、スペクトル分散を誘発する光学配置は、仮想画像化フェーズドアレイ(VIPA)、ファブリ-ペローエタロン又はエシェル格子を備える。更に別の実施形態において、光学配置は、サンプルから検出ユニットまでの光路内の空間スペクトルパターンのサイズ、形状及び/又は角度の広がりを変更する光学要素を更に備える。具体的には、照明光ビームは、サンプルを含む容器内にペンシルビームを生成するために、第1のレンズ211、311及び711によって再整形される。空間光変調器又は変形可能ミラー(図7、ミラー724)を用いて、第1のレンズ(図7、レンズ711)に入射する照明光ビームを再整形することができる。更に別の実施形態において、サンプル容器内で生成されるブリルアン散乱光は、第2のレンズ220、320、713を備え、第3のレンズ221、321、715の焦点面において中間像を生成する第1の結像系によって収集される。中間像の倍率は、VIPA224、324及び717における測定サンプル点の角分散を最小化するように最適化される。サンプルから到来する焦点外の光を除去するために、中間像面において空間フィルター又はアパーチャ228、330及び725を使用することができる。
2, 3 and 7, optical arrangements that induce spectral dispersion can comprise spherical lenses, cylindrical lenses, VIPAs. 2,
図2の要素222、225、226、図3の要素322、326、327及び328、図7の要素715、718及び722の組み合わせである第2の結像系が中間像を検出ユニット227、329、723上に投影し、VIPAを含む光学配置は、第2の結像系の無限遠空間(infinity space)内にある。本発明の更なる態様において、ブリルアン散乱光は、球面レンズ(図2、レンズ222;図7、レンズ715)によってコリメートされ、円柱レンズ(図2、レンズ223;図7、レンズ716)によってz方向においてVIPA上に合焦し、異なる位置からのコリメートされたビームは、VIPAに関するxy平面において異なる角度を有する。ブリルアン空間スペクトルパターンの焦点を検出ユニット227、329、723上に厳密に合わせるために、VIPAの出力光は幾つかの円柱レンズ及び球面レンズ225、226、718、719、722によって変更される。さらに、本発明の別の態様において、ブリルアン散乱光は第1のレンズアレイ322によってコリメートされ、第1のレンズアレイの各レンズレットが中間像の一部からの光のみを受光し、像全体は複数の部分に分割され、各部分はレンズレットによって独立してコリメートされる。VIPAの出力光は、第2のレンズアレイ327のレンズレットの口径を適合させるために、一対の円柱レンズ325及び326によって補償される。ブリルアン空間スペクトルパターンは、第2のレンズアレイ327の前方焦点面において生成され、検出ユニット329上に結像される。
A second imaging system, which is a combination of
更に別の実施形態において、空間スペクトルパターン内のレーザーラインを吸収する狭帯域フィルターであり、狭帯域フィルターは吸収ガスセル及びファブリ-ペローエタロンデバイスからなる群から選択される。照明源の波長及び狭帯域フィルターによって吸収される波長は互いにロック(lock)される。 In yet another embodiment, a narrowband filter that absorbs laser lines within the spatial spectral pattern, the narrowband filter being selected from the group consisting of an absorbing gas cell and a Fabry-Perot etalon device. The wavelength of the illumination source and the wavelength absorbed by the narrowband filter are locked together.
一実施形態において、ブリルアン空間スペクトルパターンは、光学配置の異なる回折次数によって生成される異なるレーザーライン又は弾性散乱ライン間の距離を検出ユニット227、329、723上で測定することによって較正される。更に別の実施形態において、レーザーラインが狭帯域フィルターによって吸収され、較正のために利用できないとき、既知のブリルアン特性の基準物質を用いて、光学配置のスペクトル分散特性を計算する。
In one embodiment, the Brillouin spatial spectral pattern is calibrated by measuring, on the
図7において例示されるような構成の利点及び制約を理解するために、角度のある幾何学的配置のスペクトル効率が、図1において例示されるような共焦点エピ検出構成を使用する従来の構成と比較された。照明ビームが垂直偏光され、それゆえ、散乱面に対して垂直である場合には、微分断面積は散乱角から独立しており(非特許文献28)、それゆえ、直交する照明経路-検出経路を備える構成は、エピ検出と同じ微分断面積を有する。しかしながら、角度のある幾何学的配置は結果として、単一の点あたりの幾何学的効率が減少することになる(すなわち、測定の実質的な並列化に起因する利点を排除する)。収集された散乱電力はP=Iill・V・Ω・Rと書くことができる。ただし、Iillは照明光の強度であり、Vは散乱の相互作用体積であり、Ωは収集立体角であり、Rは散乱係数であり、それはm-1の単位を有し、ここでは定数と見なすことができる。直交構成において、相互作用体積は、半径r=0.61λ/NAcol及び長さl=0.61λ/NAillを有する円柱形によって近似することができる。ただし、NAcol及びNAillはそれぞれ、照明対物レンズ及び収集対物レンズのNAである。収集立体角は、収集開口数Ω=πNAcol 2によって決まる。それゆえ、収集散乱電力は、P90=Iill・R・π2・0.613・λ3/NAillである。エピ構成の場合、代わりに、相互作用体積は約0.612・λ3/NAepi 4である。ただし、NAepiは対物レンズのNAであり、収集立体角はΩ=πNAepi 2である。したがって、収集散乱電力は、Pepi=Iill・R・π2・0.612・λ3/NAepi 2である。同じ照明強度の場合、2つの構成間の収集電力の比は、結局、η=P90/Pepi=0.61・NAepi 2/NAillになる。直交構成では、視野にわたって均一な長い照明ビームラインを生成するために、一般に低いNAillが好ましい。例えば、1.737mmの使用可能なレイリー範囲に対応するNAill=0.0175が使用された。本発明による特定の実験構成をNAepi=0.1を有するエピ構成(x方向において同じ分解能を与える)と比較すると、その比は34.8%である。この計算は、対物レンズの異なる組み合わせが使用された他の研究(Scarcelli, G.、Kim, P.及びYun, S.H.「In vivo measurement of age-related stiffening in the crystalline lens by Brillouin optical microscopy」Biophysical Journal 101, 1539-1545 (2011))による予測と一致する。重要なことに、この計算は、図2の実験結果、そして他のエピ検出結果(Guilluy, C.ら「Isolated nuclei adapt to force and reveal a mechanotransduction pathway in the nucleus」Nature Cell Biology 16, 376 (2014))と一致する。直交及びエピ検出における散乱効率は、照明体積と検出体積との間の重なりによって決定され、それゆえ、並列化の利点を最大化するために、角度のある幾何学的配置を、単一点測定あたりエピ検出と同じ効率になるように設計することができる。ライン並列検出を含むとき、多重ブリルアン分光法は、エピ検出における1時間超の長さと比べて、数十秒内に数ミクロンの分解能でmmサイズのサンプルの走査を成し遂げることができる。ビームラインに沿って測定可能なサイズは、照明NAと、カメラのピクセル数との両方によって決定される。空間分解能は、検出NA(x方向、ビームラインに沿っている)及び照明NA(y方向及びz方向)によって決定される。 To understand the advantages and limitations of the configuration as illustrated in FIG. 7, the spectral efficiency of the angled geometry compares favorably with the conventional configuration using a confocal epi-detection configuration as illustrated in FIG. compared to If the illumination beam is vertically polarized and therefore perpendicular to the scattering plane, the differential cross-section is independent of the scattering angle [28] and therefore the orthogonal illumination-detection path has the same differential cross section as epi detection. However, the angled geometry results in reduced geometric efficiency per single point (i.e., eliminates benefits due to substantial parallelization of measurements). The collected scattered power can be written as P= Iill.V.Ω.R . where Iill is the intensity of the illuminating light, V is the interaction volume of scattering, Ω is the solid angle of collection, and R is the scattering coefficient, which has units of m −1 and is here the constant can be regarded as In the orthogonal configuration, the interaction volume can be approximated by a cylinder with radius r=0.61λ/NA col and length l=0.61λ/NA ill . where NA col and NA ill are the NAs of the illumination and collection objectives, respectively. The collection solid angle is determined by the collection numerical aperture Ω=πNA col 2 . Therefore, the collected scattered power is P 90 =I ill ·R · π 2 · 0.61 3 · λ 3 /NA ill . For the epi configuration, the interaction volume is instead about 0.61 2 ·λ 3 /NA epi 4 . where NA epi is the NA of the objective lens and the collection solid angle is Ω=πNA epi 2 . Therefore, the collected scattered power is P epi = Iill *R* π2 *0.612 * λ3/NAepi2 . For the same illumination intensity, the ratio of collected power between the two configurations amounts to η=P 90 /P epi =0.61·NA epi 2 /NA ill . In the orthogonal configuration, a low NA ill is generally preferred to produce a long illumination beamline that is uniform across the field of view. For example, NA ill =0.0175 was used, corresponding to a usable Rayleigh range of 1.737 mm. Comparing a particular experimental configuration according to the invention with an epiconfiguration with NA epi =0.1 (which gives the same resolution in the x-direction), the ratio is 34.8%. This calculation is similar to other studies in which different combinations of objective lenses were used (Scarcelli, G., Kim, P. and Yun, SH "In vivo measurement of age-related stiffening in the crystalline lens by Brillouin optical microscopy" Biophysical Journal 101, 1539-1545 (2011)). Importantly, this calculation is consistent with the experimental results in Figure 2, and other epi-detection results (Guilluy, C. et al., "Isolated nuclei adapt to force and reveal a mechanotransduction pathway in the nucleus," Nature Cell Biology 16, 376 (2014). )). Scattering efficiency in orthogonal and epi-detection is determined by the overlap between the illumination and detection volumes, therefore, to maximize the advantage of parallelization, angular geometries are used per single-point measurement. It can be designed to be as efficient as epi detection. When including line-parallel detection, multiplexed Brillouin spectroscopy can accomplish the scanning of mm-sized samples with a resolution of a few microns in tens of seconds, compared to more than an hour for epi-detection. The measurable size along the beamline is determined by both the illumination NA and the number of pixels in the camera. Spatial resolution is determined by the detection NA (x-direction, along the beamline) and the illumination NA (y- and z-directions).
背景除去に関して、角度のある構成は、エピ検出より本質的に低い背景雑音を有する。一般の共焦点構成では、照明光の後方反射が分光計の中に容易に結合され、背景雑音の一因になる。ライン走査構成では、照明経路及び検出経路が直交して配置されるので、後方反射を完全に回避することができる。さらに、ラインビームによって照明される領域のみが励起されるので、ライン走査構成は、光学的分割(optical sectioning)に関して、共焦点構成と類似の機能を有する。一方、1ステージVIPAのみが使用されるので、分光計の消光比は制限される。これは、界面、又はイントラリピッド媒質若しくは組織等の光学的に不透明なサンプルを測定するのを難しくする。機器の全体的な消光比を改善するために、ライン走査構成を、アポディゼーション、狭帯域バンドパスフィルタリング、及びガスチャンバー狭帯域吸収フィルタリング等の、背景雑音を抑圧することができる既存の方法と組み合わせることができる。 With respect to background subtraction, the angled configuration has inherently lower background noise than epi detection. In common confocal configurations, back reflections of the illumination light are easily coupled into the spectrometer and contribute to background noise. In a line-scan configuration, the illumination and detection paths are arranged orthogonally, so that back reflections can be completely avoided. Furthermore, since only the area illuminated by the line beam is excited, the line-scan configuration has similar functionality to the confocal configuration with respect to optical sectioning. On the other hand, since only one-stage VIPAs are used, the extinction ratio of the spectrometer is limited. This makes it difficult to measure optically opaque samples such as interfaces or intralipid media or tissues. To improve the overall extinction ratio of the instrument, the line scan configuration is combined with existing methods that can suppress background noise, such as apodization, narrowband bandpass filtering, and gas chamber narrowband absorptive filtering. Can be combined.
本発明の別の態様は、細胞内物理的(機械的)特性に基づいて、生細胞を分類するシステム及び方法に関する。一例として、限定はしないが、分類されることになる細胞は、ヒト細胞、動物細胞又は植物細胞とすることができる。細胞内物理的情報は、細胞内部の音響特性に関連するブリルアン光散乱のスペクトル分析から取得される。分類は、細胞集団又は個々の細胞のいずれかに基づくことができる。一実施形態において、細胞は、懸濁された状態で、及び/又は2D基体に付着している状態で、及び/又は3D合成/天然細胞外マトリックス内で培養された状態で分析することができる。更に別の実施形態において、細胞は、静止状態において、又は細胞流動を介して分析することができる。 Another aspect of the invention relates to systems and methods for classifying living cells based on intracellular physical (mechanical) properties. By way of example, but not limitation, the cells to be sorted can be human cells, animal cells or plant cells. Intracellular physical information is obtained from spectral analysis of Brillouin light scattering, which relates to acoustic properties inside the cell. Classification can be based on either cell populations or individual cells. In one embodiment, cells can be analyzed in suspension and/or attached to a 2D substrate and/or cultured within a 3D synthetic/natural extracellular matrix. . In yet another embodiment, cells can be analyzed in a quiescent state or via cell flow.
一実施形態において、細胞はin vitroで培養及び調製することができ、マイクロ流体デバイスを用いてプローブビームに送達することができる。細胞の異なる領域における細胞内情報を、標準又はカスタムマイクロ流体デバイスを利用する幾つかの構成において取得することができる。細胞は、フローサイトメトリー又は他の細胞分析技法に関連付けられる概ね全ての構成において分析することができる。一例として、限定はしないが、細胞は、マイクロ流体チャネルの中を流れている間に、及び/又は細胞が懸濁液内に静止したままであるときにマップされた状態で、及び/又は既知の方法に従って3Dゲル又は他の細胞外マトリックスの小滴内に封入された状態で、及び/又は細胞凝集体を形成している間に測定することができる。代替的には、マイクロ流体デバイスを用いて、又は用いることなく、細胞は、基体上に付着している間に、又は3Dゲル内にある間に、又は凝集体を形成している間に、明視野若しくは共焦点結像手法で細胞内情報のブリルアン取得を誘導することによって、他の構成(皿、又はフラスコ、又はプレートアレイ内等)において分析することができる。取得された物理的フェノタイピングに基づいて、細胞周期の異なる段階における異なるタイプの細胞又は同じタイプの細胞を区別することができる。一実施形態において、薬物への細胞応答を分析することができる。分析は、細胞の集団、又は個々の細胞のいずれかにおいて実行することができる。 In one embodiment, cells can be cultured and prepared in vitro and delivered to the probe beam using a microfluidic device. Intracellular information in different regions of the cell can be obtained in several configurations utilizing standard or custom microfluidic devices. Cells can be analyzed in virtually any configuration associated with flow cytometry or other cell analysis techniques. By way of example, and not limitation, cells may be mapped while flowing through the microfluidic channel and/or when the cells remain stationary in suspension and/or in a known manner. entrapped within droplets of 3D gels or other extracellular matrices and/or while forming cell aggregates according to the method of et al. Alternatively, with or without a microfluidic device, the cells are allowed to It can be analyzed in other configurations (such as in dishes or flasks or plate arrays) by directing the Brillouin acquisition of intracellular information with brightfield or confocal imaging techniques. Different types of cells at different stages of the cell cycle or the same type of cells can be distinguished based on the physical phenotyping obtained. In one embodiment, cellular responses to drugs can be analyzed. Analysis can be performed either on populations of cells or on individual cells.
図12は、ブリルアン信号を励起/収集するエピ検出経路、監視結像手法、マイクロ流体デバイス(又は他の細胞播種(cell plating)デバイス)、ブリルアン分光計、及びこれら全てのサブ構成要素をリンクする、ソフトウェアを備えるコンピューターの新規の組み合わせから生じる本発明の例示的な実施形態を示す。第1の到来する照明ビーム1210が、ビームスプリッター1211及び対物レンズ1212を使用することによって、マイクロ流体デバイス1230内部の1つにスポット上に合焦する。照明レーザービーム1210はレーザービームとすることができる。一実施形態において、第1の到来するレーザービーム1210は1μm~10μmのスポットの中に合焦する。後方ブリルアン散乱光が同じ対物レンズ1212によって収集され、ビームスプリッター1211、反射ミラー1213及びカップリングレンズ1214を介して、ブリルアン分光計1215に導光される。ブリルアン分光計1215は、ブリルアン周波数シフトを正確に測定することができるデバイスである。ブリルアン分光計1215の一例が非特許文献29において開示されている。マイクロ流体デバイス1230の上方に、第2の光源1220(一般にレーザービーム1210とは異なる波長を有する)、ビームスプリッター1221、チューブレンズ1222、対物レンズ1224及び2D画像記録デバイス1225からなる明視野顕微鏡が存在する。この顕微鏡構成の目的は、マイクロ流体デバイス1230内部の細胞の流動状況を監視することである。一実施形態において、その顕微鏡構成はスペクトルフィルター1223を更に含み、スペクトルフィルターは、レーザービーム1210からの光を遮断するが、光源1220からの光が通過できるようにする。対物レンズ1212からの合焦スポットが対物レンズ1224の像面上にあるのを確実にするように、対物レンズ1212及び1224が調整される。
FIG. 12 links epi-detection pathways that excite/collect Brillouin signals, supervisory imaging techniques, microfluidic devices (or other cell plating devices), Brillouin spectrometers, and all these subcomponents. , shows an exemplary embodiment of the invention resulting from a novel combination of computers with software. A first
一実施形態において、ソフトウェアインターフェースを用いて、2D画像記録デバイス1225によって取得された明視野像と、ブリルアン分光計1215のブリルアン信号とを同期させることができる。これにより、ブリルアン信号を測定サンプルの正確な場所に割り当てることができる。
In one embodiment, a software interface can be used to synchronize the bright field image acquired by the 2D
図13は、図12のブリルアン分光法構成とともに使用されるインターフェースのスナップショットを示す。インターフェースの主な機能は、その中に細胞を有するマイクロ流体デバイスの未処理のブリルアン信号1310(空間スペクトルパターン)及び明視野像1320を同時に記録することである。2つの白色の点1310はブリルアン信号(空間スペクトルパターン)であり、点間の距離はブリルアンピークを表す。レーザーラインからブリルアンピークまでの距離は、所望の周波数シフトである。この表現において、ここで適切な較正が行われた場合、2つのブリルアンピーク間の距離を計算することによって、ブリルアンシフトを測定することができる。この場合に、2つのピーク間の距離が短いほど、大きな周波数シフト、それゆえ、高い剛性に対応する。
FIG. 13 shows a snapshot of the interface used with the Brillouin spectroscopy configuration of FIG. The main function of the interface is to simultaneously record the raw Brillouin signal 1310 (spatial spectral pattern) and the bright field image 1320 of the microfluidic device with cells therein. The two
図14a~図14fにおいて、ブリルアン信号検出を実際にいかに実施できるかについての非限定的な例が示される。具体的には、図14a~図14cはそれぞれ、0.85sec、1.35sec及び1.65secにおいて同時に取得された未処理のブリルアン信号(空間スペクトルパターン)及び明視野像の両方のスナップショットである。そのスナップショットは、上から下にチャネル内部を流れる細胞を示す。丸1402は、細胞が横切っている照明(プローブ)ビームスポットの場所を示す。図14d~図14fは、図14a~図14cの未処理のブリルアン信号から計算されたブリルアン周波数シフトの時間トレースを示す。図14a~図14cの同期した画像から、ブリルアン信号の元の場所を、曖昧にすることなく特定することができる。ブリルアン周波数シフトを特定の細胞内の場所に割り当てること以外に、画像処理技法を組み込むことと、細胞容器を並進させること、又はブリルアンプローブビームの位置を制御することのいずれかとによって、この能力を用いてブリルアンプローブビームを特定の場所に導光することもできる。
Non-limiting examples of how Brillouin signal detection can be implemented in practice are shown in FIGS. 14a-14f. Specifically, Figures 14a-14c are snapshots of both the raw Brillouin signal (spatial spectral pattern) and the bright field image simultaneously acquired at 0.85 sec, 1.35 sec and 1.65 sec, respectively. . The snapshot shows cells flowing inside the channel from top to bottom.
1つの非限定的な実施形態において、細胞を合焦したプローブビームスポットに位置合わせするために、図12に示されるようなマイクロ流体デバイス1230を2D並進ステージ上に配置することができる。一例として、限定はしないが、マイクロ流体デバイス1230は、長方形の断面を有するか、又はフローサイトメータの大部分と同様に円形の断面を有する一直線のチャネルとすることができる。チャネルのサイズ(一例として、100μm×100μm)が、細胞のサイズ(一例として、直径が10μm~20μm)よりはるかに大きい場合には、細胞は、マイクロ流体デバイス1230を通ってランダムな場所に流れる場合があるので、測定精度、そして潜在的には測定スループットが減少する。一実施形態において、全ての細胞を照明ビーム1210によって探査できるように、細胞をチャネル内部の同じトレースに沿って位置合わせするために、シースフローと呼ばれる流体力学的合焦技法を実施することができる。これは、各細胞の中心がプローブビーム1210の合焦スポットに絶えず位置合されるのを確実にする実効的な方法である。
In one non-limiting embodiment, a
図15a及び図15bは、シースフロー技法を使用することによって取得された実験データ(図15b)と、シースフロー技法を使用することなく取得された実験データ(図15a)との比較を示す。流量及び分光計1215の取得時間を調整することによって、細胞が光ビーム1210を横切って進むときに、1つの細胞の幾つかの場所を探査することができる。図15a及び図15bのプロットに関して、単一の細胞の平均剛性を記述するために、細胞内で取得された全てのブリルアン周波数シフトの平均が計算された。それゆえ、図15a及び図15bにおいて、ヒストグラムの各データ点は1つの細胞を表す。それらの結果は、非シースフローによって引き起こされる人工的な広がりが取り除かれるので、測定データの広がり(分布の線幅)が、シースフロー技法を使用することによって約40%狭くされる。1つの非限定的な実施形態において、NIH 3T3細胞系統が実験において使用された。
Figures 15a and 15b show a comparison of experimental data obtained by using the sheath flow technique (Figure 15b) with experimental data obtained without using the sheath flow technique (Figure 15a). By adjusting the flow rate and the acquisition time of the
更に別の実施形態において、画像誘導位置合わせ(image-guided alignment)と呼ばれる第2の手法を用いて、流動する細胞をレーザービーム1210の合焦スポットに位置合わせすることができる。その概念の概要が図16に示される。この手法も図12に示される構成内で実施することができるが、以下の変更が加えられる。図12において、レーザービーム1210の合焦スポットは、顕微鏡1212の視野の中心に位置する。しかしながら、図16において、合焦スポット1620は、マイクロ流体チャネル1610の底部に動かされ、x方向に沿った中間点に、すなわち、x0に設定された。細胞1630がy方向に(上から下に)流れていると仮定して、細胞が視野内に現れると、その場所(x1)及び合焦スポット1620に対する水平シフト(x0-x1)を特定することができる。その後、マイクロ流体チャネル1610を搬送する並進ステージを自動的に、又は手動で動かして、細胞1630を合焦スポット1620に完全に位置合わせすることができる。代替的には、更に別の実施形態において、ブリルアンプローブビームは、レーザー走査補助部品(例えば、検流計スキャナー、ポリゴン)又は他の既知のビーム位置決め技法を用いて調整することができる。この手法の成功は、2つの条件に基づく。第一は、流動実験の全てが層流であることであり、それは、細胞がチャネルに入ると、横方向にドリフトするのではなく、そのトレースを維持するのを確実にする。第二は、細胞及びプローブの場所を調整するフィードフォワードアルゴリズムが、チャネルの位置調整を行うだけの十分な時間があるように流速より速いことである。図12のブリルアン分光法構成を使用することによって取得された典型的な実験結果が、図17aに示される。細胞が培養され、実験直前に緩衝液の中に懸濁された。一実施形態において、緩衝液として、リン酸緩衝生理食塩水(PBS)が使用された。流量を調整することによって、細胞が光ビームを横切って進むときに、各細胞内の5~10の位置が探査される。この場合に、測定データ点の全てを用いて、図17a内のヒストグラムグラフをプロットした。図17aのヒストグラムは3つの部分からなり、それらの部分の輪郭が3つの実曲線1702、1704及び1706によって描かれる。第1のピーク1704はPBSのシグネチャであり、それは図17bに示されるように、容易に認識し、位置を特定し、除去することができる。光ビーム1210は、2つの隣接する細胞間の時間間隔内でのみ緩衝液を探査することになるので、測定データ内のPBSのシグネチャの出現が予想される。1つの非限定的な実施形態において、上記のように、細胞流動実験のために、NIH 3T3細胞系統が使用される場合がある。
In yet another embodiment, a second technique, called image-guided alignment, can be used to align flowing cells to the focused spot of
細胞内情報を抽出するために、曲線当てはめ法を用いて、図17aから細胞のシグネチャを抽出することができる。3つのガウス分布1702、1704及び1706の線形重ね合わせを用いて、元のヒストグラムを当てはめた。PBS溶液のシグネチャ1704は、図17bのデータをあらかじめ当てはめることによって十分に特定することができるので、この情報は、当てはめの既知のパラメーターとして使用することができる。図17aの元のヒストグラムに最も適合するように破曲線を当てはめた後に、図17cに示されるように、PBS溶液1704のシグネチャを差し引くことによって、細胞の情報が取得された。図17cのヒストグラムは2つのピークからなり、それらのピークは、2つのガウス分布1708及び1710の重ね合わせである。実際には、ガウス分布1708及び1710は、細胞内の異なる領域(すなわち、細胞質及び細胞核)からの機械的シグネチャを表す。
To extract intracellular information, curve fitting methods can be used to extract cellular signatures from FIG. 17a. A linear superposition of three
図17a内のフローデータが、細胞集団の機構を正しく表すことを検証するために、細胞集団のフローデータと、細胞の組の2D画像とが直接比較された。最初に、細胞が図12のマイクロ流体デバイス1230の中に送達され、その後、2~3分間、チャネル内部で細胞が懸濁されるのを確実にするために停止された。比較として、同じ細胞内の複数の場所において、同一の方法で調製された同じ細胞系統を用いてブリルアン周波数を取得することに基づく流動実験が、図12のブリルアン分光法構成を使用することによって行われた。図18aは、チャネルを通って流れている細胞がレーザーを横切るラインに沿った一群の点に対して測定されたブリルアン周波数シフトの分布を示すヒストグラムである。一実施形態において、577個の細胞(3546個の細胞内の点)が測定された。図18aのヒストグラムは、2つのガウス分布1802及び1804の重ね合わせによって当てはめられる。図18bは、2つのガウス分布1806及び1808の重ね合わせによって当てはめられた流動細胞の2Dブリルアン画像から生じるヒストグラムである。一実施形態において、全部で4378個の細胞内の点を含む、29個の細胞が測定された。図18a及び図18bのヒストグラムは、2ピークプロファイル及び各ピークの周波数シフトを含む、同じ特徴を共有することがわかる。上記で規定されたような細胞及び測定値の数は、限定するものではなく、任意の数の細胞及び測定値を用いて、図18a及び図18bのヒストグラムを取得できることに留意されたい。
To verify that the flow data in FIG. 17a correctly represent the organization of the cell population, the flow data of the cell population and the 2D images of the cell sets were directly compared. Cells were first delivered into the
さらに、図17cの2つのピークが、細胞質/細胞骨格及び細胞核の機械的シグネチャに対応することが検証された。細胞の細胞核のみを染色するために蛍光染料が使用され、その後、同じ細胞の明視野/蛍光画像(図19a及び図19b)並びに2Dブリルアン画像(図19d)の両方が取得された。図19a及び図19bの画像を融合することによって取得された図19cの画像を図19dのブリルアン2D画像と比較することによって、細胞質から細胞核を分離することができる。細胞核及び細胞質の両方のヒストグラムが図19eに合わせてプロットされており、ピーク1904は細胞核に由来し(図19bの蛍光領域に対応する)、ピーク1902は細胞質に由来する(図19bの非蛍光領域に対応する)。図19eと図17cとの間の比較に基づいて、細胞がプローブビームを横切るときに、図12のブリルアン分光法構成を用いて細胞内の複数の点においてブリルアン周波数を取得する流動実験によって、細胞集団内で細胞核及び細胞質の機械的シグネチャを区別できると結論付けられる。蛍光/ブリルアンを組み合わせた構成を用いて、蛍光で標識される特定の細胞内成分のブリルアン取得を正確に割り当てることができるか、又は画像誘導することができる。 Furthermore, it was verified that the two peaks in Fig. 17c correspond to mechanical signatures of the cytoplasm/cytoskeleton and the nucleus. A fluorescent dye was used to stain only the nucleus of the cells, after which both brightfield/fluorescence images (FIGS. 19a and 19b) and 2D Brillouin images (FIG. 19d) of the same cells were acquired. By comparing the image of FIG. 19c, obtained by fusing the images of FIGS. 19a and 19b, with the Brillouin 2D image of FIG. 19d, the cell nucleus can be separated from the cytoplasm. Both nuclear and cytoplasmic histograms are plotted in line with Figure 19e, with peak 1904 coming from the cell nucleus (corresponding to the fluorescent area in Figure 19b) and peak 1902 coming from the cytoplasm (non-fluorescent area in Figure 19b). ). Based on a comparison between FIG. 19e and FIG. 17c, a flow experiment using the Brillouin spectroscopy configuration of FIG. It is concluded that nuclear and cytoplasmic mechanical signatures can be distinguished within the population. A combined fluorescence/Brillouin configuration can be used to precisely assign Brillouin acquisition of specific fluorescently labeled subcellular components, or image-guided.
本発明の別の態様において、細胞内物理的(機械的)フェノタイピングに基づいて細胞を分類する能力が例示される。例えば、細胞に及ぼすサイトカラシンD(CytoD)の影響が分析された。細胞の全体剛性(変形能)は、細胞骨格及び細胞核の両方によって決まることが広く受け入れられている(Fletcher DA、Mullins RD「Cell mechanics and the cytoskeleton」Nature 463, 485-492 (2010))。細胞骨格は3つの主な重合体、すなわち、アクチン、微小管及び中間径フィラメントからなる。F-アクチンはアクチンの重合した状態であり、細胞形状及び機械的特性を制御する際に主要な役割を有する。それゆえ、F-アクチンの重合及び解重合が、細胞形状及び剛性の変化を推進する有向力を生成する。CytoDは、F-アクチンの重合を抑制する薬物である。F-アクチンはCytoDで処置された付着細胞において著しく低減されることになり、結果として、細胞全体がその剛性を低下させることが報告された(Wakatsuki T、Schwab B、Thompson NC、Elson EL.「Effects of cytochalasin D and latrunculin B on mechanical properties of cells.」J Cell Sci. 114, 1025-1036 (2001))。細胞内レベルにおいて、細胞核及び細胞骨格はいずれも、その両方内にアクチンが存在するときに、剛性を低下させることになる。さらに、細胞核及び細胞骨格は機械的に接続されるので、細胞核は細胞骨格からのプレストレスを受ける(Wang N、Tytell JD、Ingber DE.「Mechanotransduction at a distance: mechanically coupling the extracellular matrix with the nucleus」Nat Rev Mol Cell Biol. 10, 75- 82 (2009))。したがって、F-アクチンの崩壊は、最終的に細胞核を軟化させるようなプレストレスも低減するはずである(Chalut KJ、Hoepfler M、Lautenschlaeger F、Boyde L、Chan CJ、Ekpenyong A、Martinez-Arias A、Guck J.「Chromatin decondensation and nuclear softening accompany Nanog downregulation in embryonic stem cells」Biophys J. 103, 2060-2070 (2012))。 In another aspect of the invention, the ability to classify cells based on intracellular physical (mechanical) phenotyping is exemplified. For example, the effect of cytochalasin D (CytoD) on cells was analyzed. It is widely accepted that the global stiffness (deformability) of a cell is determined by both the cytoskeleton and the cell nucleus (Fletcher DA, Mullins RD "Cell mechanics and the cytoskeleton" Nature 463, 485-492 (2010)). The cytoskeleton consists of three major polymers: actin, microtubules and intermediate filaments. F-actin is the polymerized form of actin and has a major role in controlling cell shape and mechanical properties. Therefore, F-actin polymerization and depolymerization generates directed forces that drive changes in cell shape and stiffness. CytoD is a drug that inhibits the polymerization of F-actin. It was reported that F-actin became significantly reduced in adherent cells treated with CytoD, resulting in the whole cell decreasing its stiffness (Wakatsuki T, Schwab B, Thompson NC, Elson EL. Effects of cytochalasin D and latrunculin B on mechanical properties of cells." J Cell Sci. 114, 1025-1036 (2001)). At the subcellular level, both the nucleus and cytoskeleton become less rigid when actin is present within both. Furthermore, since the nucleus and cytoskeleton are mechanically connected, the nucleus receives prestress from the cytoskeleton (Wang N, Tytell JD, Ingber DE. "Mechanotransduction at a distance: mechanically coupling the extracellular matrix with the nucleus"). Nat Rev Mol Cell Biol. 10, 75-82 (2009)). Disruption of F-actin should therefore also reduce the prestress that ultimately softens the cell nucleus (Chalut KJ, Hoepfler M, Lautenschlaeger F, Boyde L, Chan CJ, Ekpenyong A, Martinez-Arias A, Guck J. "Chromatin decondensation and nuclear softening accompany Nanog downregulation in embryonic stem cells" Biophys J. 103, 2060-2070 (2012)).
一実施形態において、CytoDは細胞上に塗布され、その後、トリプシンを用いて剥離される。その後、処置された細胞はPBSに再懸濁され、図12の構成において測定される。投与量依存性を観測するために、CytoDの3つの投与量が使用された。一例として、限定はしないが、CytoD投与量は、0.5ug/ml、2ug/ml及び5ug/mlであった。処置された細胞(279、232及び577)は投与量ごとに探査され、対照のために、処置されない細胞(268)が探査された。細胞全体にわたる平均値を用いて、細胞の機械的フェノタイピングを表した。図20aの結果は、細胞の剛性へのCytoDの投与量依存効果を示す。したがって、細胞全体にわたる平均ブリルアン周波数シフト値を用いて、高スループットの機械的フェノタイピングを取得することができる。1つの非限定的な実施形態において、NIH 3T3細胞系統を用いて、実験を実行した。 In one embodiment, CytoD is coated onto cells and then detached using trypsin. The treated cells are then resuspended in PBS and measured in the setup of FIG. Three doses of CytoD were used to observe dose dependence. By way of example and not limitation, the CytoD doses were 0.5ug/ml, 2ug/ml and 5ug/ml. Treated cells (279, 232 and 577) were probed for each dose and untreated cells (268) for controls. Mechanophenotyping of cells was represented using mean values across cells. The results in Figure 20a show a dose-dependent effect of CytoD on cell stiffness. Therefore, average Brillouin frequency shift values across cells can be used to obtain high-throughput mechanical phenotyping. In one non-limiting embodiment, experiments were performed using the NIH 3T3 cell line.
平均された細胞値の他に、図17a~図17cを参照しながら説明された方法は、細胞内情報を取得することができる。CytoDの異なる投与量に対応する図20b~図20eに示されるように、ピーク2004、2008、2012及び2016のブリルアン周波数シフトは小さくなり、それゆえ、図20bから図20eに左に移動した。これは、高い投与量のCytoDによる処置ほど細胞核が軟化していることを示している。一方、細胞質を表すピーク2002、2006、2010、2014は、この実験において概ね変化しないことに留意されたい。これは、フラスコ基体から細胞を剥離するために使用されるトリプシン処理ステップが全てのF-アクチンストレス線維を崩壊させるので、結果として、懸濁された細胞に関する細胞骨格に測定可能な影響をほとんど及ぼさないためである。付着細胞において、細胞骨格剛性が著しく低減されることが検証された。
Besides averaged cell values, the method described with reference to FIGS. 17a-17c can obtain intracellular information. As shown in Figures 20b-20e corresponding to different doses of CytoD, the Brillouin frequency shifts of
図21は、本発明の別の実施形態による、ブリルアン分光法構成を示す。この実施形態において、細胞がブリルアンビームによって探査されると同時に、一緒に記録される細胞の共焦点蛍光画像を取得するために、第2の光学手法が追加される。第2の光学手法は、ダイクロイックミラー2127と、チューブレンズ2122と、ピンホールマスク2126と、光検出器2125とを備えることができる。ダイクロイックミラー2127は、レーザービーム2110及びブリルアン信号を通過させるが、蛍光を反射する。図12の明視野顕微鏡と比べて、共焦点構成は、焦点外れの面からの蛍光を除去することによって、より良好な横断及び横方向光学分解能を有する。実際には、蛍光標識された細胞を用いて、細胞のサブ領域(例えば、細胞核)を識別することができ、レーザービーム2110の合焦スポットを用いて、蛍光放射を直接励起することができる。その後、共焦点構成を用いて、カメラ2125によって蛍光放射光を検出する。蛍光放射光の強度に基づいて、ブリルアン信号を目標点に割り当てることができるように、細胞内部の合焦スポット(それゆえ、ブリルアン信号)の場所を正確に特定することができる。この手法を用いて、測定中にブリルアンビームを細胞の特定の領域に導光することもできる。更に別の実施形態において、反転構成に加えて、共焦点顕微鏡の直立構成を使用することもできる。この場合、共焦点構成は、マイクロ流体デバイス2130の上に存在することになる。また、蛍光情報を用いて、細胞の縁部における測定値を較正するために、3次元結像ボクセル内に存在する非細胞媒質(例えば、PBS)の量を推定することができる。
FIG. 21 shows a Brillouin spectroscopy setup according to another embodiment of the invention. In this embodiment, a second optical approach is added to acquire co-recorded confocal fluorescence images of the cells as they are probed by the Brillouin beam. A second optical approach may comprise a
図22の画像は図21の実施形態によるブリルアン分光法構成を使用することによって取得されたが、共焦点顕微鏡法ではなく、明視野蛍光が使用された。蛍光染料を用いて、マイクロ流体デバイス2130の中に後に送達される細胞の細胞核を染色した。細胞が懸濁液内に静止したままになると、マイクロ流体デバイスを動かすことによって、単一細胞の2Dマッピングが実行された。ブリルアンビームスポット及び蛍光が空間内で互いに重ね合わせられるので、ブリルアン信号を測定点ごとに蛍光強度に結び付けることができる。その結果を表現する1つの取り得る方法が図22に示される。各点が細胞内の或る特定の領域において取り込まれた1つの測定値を表し、異なる色は、データ点の相対密度を符号化する。散乱スポットから、横軸上にプロットされた蛍光強度に従って、各ブリルアン信号の場所を明確に見定めることができる。例えば、破線の丸はそれぞれ、細胞核(蛍光領域)及び細胞質(非蛍光領域)からの測定点を示す。
The image of Figure 22 was acquired by using the Brillouin spectroscopy setup according to the embodiment of Figure 21, but bright field fluorescence was used rather than confocal microscopy. A fluorescent dye was used to stain the cell nuclei of cells later delivered into the
図21の実施形態を使用して細胞を分類する一例として、細胞に及ぼすCytoDの影響が分析された。処置する場合、及び処置しない場合の細胞のブリルアン及び蛍光両方の2D結像が行われ、図22の方法を用いて、データを分析した。その結果が図23a及び図23bに示されており、(a)及び(b)はそれぞれ、対照群及びCytoD処置群の結果である。細胞がCytoDで処置された後に、細胞核ははるかに軟化することが観測された。 As an example of sorting cells using the embodiment of Figure 21, the effect of CytoD on cells was analyzed. Both Brillouin and fluorescence 2D imaging of treated and untreated cells was performed and the data analyzed using the method of FIG. The results are shown in Figures 23a and 23b, (a) and (b) for the control and CytoD-treated groups, respectively. It was observed that the cell nuclei softened much after the cells were treated with CytoD.
図12及び図21の実施形態において、ブリルアン信号が逐点走査モードにおいて取得され、そのモードは全体的なスループットの制限である。その場合に、個々の細胞を分析するのに十分な、細胞あたりの細胞内点を取得するのは難しい場合がある。したがって、図12及び図21の実施形態は、細胞集団分析に関して有用であるが、単一細胞の機械的フェノタイピングに関して強力というほどでない場合があり、それゆえ、細胞選別の適用例には適していない。この問題への1つの解決策は、単一の細胞を分析するのに十分な細胞内点を有するように流速を下げることである。別の解決策は、2つ以上の分光計を利用して、一度に2つ以上の場所を測定することである。代替的には、図7によるブリルアン分光法構成が、細胞の複数の点を同時に測定することができる。図7の光学配置は、図12及び図21の配置に比べて決定的に重要な変更を有する。この場合の主な変更は、CCDカメラによって記録された湾曲したブリルアンスペクトルパターンを一直線にするために、一対の対物レンズ713及び714が高分解能において利用されることである。これは、取得されたブリルアン信号が照明ラインビームに沿った対応する場所に正確に割り当てられるのを確実にするので決定的に重要である。具体的には、レーザー源710からのビームは最初にミラー724によって導光され、その後、x方向において照明ラインビームになるように対物レンズ711によって合焦する。ラインビームは、マイクロ流体デバイス712の縁部から、そのチャネルの中に差し込む。細胞は、y方向に沿って流動することによって、ラインビームを通り抜けることができる。ラインビームによって励起されたブリルアン散乱信号は、ブリルアン分光計の並列構成によって検出され、その構成は、一対の対物レンズ713及び714と、コリメートレンズ715と、円柱レンズ716と、分散デバイス(すなわち、VIPA)717と、円柱レンズ718及び719と、マスク720と、球面レンズ722と、高感度CCDカメラ723とからなる。
In the embodiments of FIGS. 12 and 21, the Brillouin signal is acquired in point-by-point scanning mode, which is the overall throughput limitation. In that case, it can be difficult to obtain enough intracellular points per cell to analyze individual cells. Thus, while useful for cell population analysis, the embodiments of Figures 12 and 21 may not be as powerful for mechanical phenotyping of single cells and are therefore not suitable for cell sorting applications. do not have. One solution to this problem is to reduce the flow rate so as to have enough intracellular points to analyze single cells. Another solution is to use more than one spectrometer to measure more than one location at a time. Alternatively, the Brillouin spectroscopy setup according to FIG. 7 can measure multiple points of the cell simultaneously. The optical arrangement of FIG. 7 has a crucial change compared to the arrangements of FIGS. The main change in this case is that a pair of objective lenses 713 and 714 are utilized at high resolution to align the curved Brillouin spectral pattern recorded by the CCD camera. This is critical as it ensures that the acquired Brillouin signals are correctly assigned to corresponding locations along the illumination line beam. Specifically, the beam from laser source 710 is first directed by mirror 724 and then focused by
図12及び図21の分光計とは異なり、図7の多重化ブリルアン分光計は、照明ラインビームに沿って数多くの点からのブリルアン信号を同時に取得することができる。例えば、適切な対物レンズを選択し、分光計内の光学系を調整することによって、x方向において1μm未満の分解能を達成することができる。細胞の通常のサイズは約10μm~15μmであるので、細胞が流動しているときに、1ショットの場合に約10個の点を、単一の細胞の場合に最大で100個を超える点を取り込むことができる。このデータセットは、単一の細胞の細胞内機構を取得するのに十分な情報を確実に与えることになる。それゆえ、図7の実施形態は、その細胞内機械的フェノタイピングに基づいて、単一の細胞を分類する、より実効的な方法を提供する。幾つかの実施形態において、照明経路及び検出経路が直角に配置されることに加えて、図7の構成は、45度及び60度の配置角度を含む、0度より大きい任意の角度において機能することもできる。 Unlike the spectrometers of FIGS. 12 and 21, the multiplexed Brillouin spectrometer of FIG. 7 can simultaneously acquire Brillouin signals from many points along the illumination line beam. For example, by choosing an appropriate objective lens and adjusting the optics within the spectrometer, a resolution of less than 1 μm in the x-direction can be achieved. Since the normal size of cells is about 10 μm to 15 μm, about 10 points for one shot and up to more than 100 points for a single cell can be obtained when the cells are flowing. can be taken in. This dataset will certainly give sufficient information to obtain the intracellular machinery of a single cell. Therefore, the embodiment of Figure 7 provides a more efficient method of classifying single cells based on their intracellular mechanophenotyping. In some embodiments, in addition to the illumination and detection paths being arranged at right angles, the configuration of FIG. 7 works at any angle greater than 0 degrees, including 45 and 60 degree placement angles. can also
図24は、図7の実施形態の概念図を示す。照明レーザーライン2410は左縁部(x方向)からマイクロ流体チャネル2430を照明し、細胞2420は、チャネルの内部をy方向に沿って流れる。細胞2420がレーザーライン2410に当たると、細胞2420の照明された領域からのブリルアン信号が同時に取得されることになる。細胞が通り抜けるとき、そのラインビームによって細胞体全体を走査することができる。最終的に、図24に示されるように、細胞2420の2D画像2440を再構成することができる。
FIG. 24 shows a conceptual diagram of the embodiment of FIG. An
図7の実施形態は、細胞又はチャネルから反射されるか、又は散乱するレーザーからのスプリアス光を除去するために、フィルタリング要素を追加することによって更に改善することができる。このために、ファブリ-ペローフィルターを使用することができる。ファブリ-ペローフィルターは、実際には、選択された周波数を有する光が通過できるようにし、他の光を遮断できるようにするエタロンである。フィルターを適切に設計することによって、フィルターの透過ピークを、ブリルアン信号と重なり合うように調整することができる。スプリアス光は、ブリルアン信号とは異なる周波数を有し、抑圧されることになる。しかしながら、図7の方法は、位置合わせの問題及び潜在的なアーティファクトを導入する場合があり、正確に較正することによって解決されるべきである。 The embodiment of Figure 7 can be further improved by adding filtering elements to remove spurious light from the laser that is reflected or scattered from cells or channels. A Fabry-Perot filter can be used for this purpose. A Fabry-Perot filter is actually an etalon that allows light with selected frequencies to pass and other light to be blocked. By properly designing the filter, the transmission peak of the filter can be adjusted to overlap with the Brillouin signal. Spurious light has a different frequency than the Brillouin signal and will be suppressed. However, the method of FIG. 7 may introduce alignment problems and potential artifacts, which should be resolved by accurate calibration.
代替的には、吸収ガスチャンバーを使用することができる(Piironen P、Eloranta EW.「Demonstration of a high-spectral-resolution lidar based on an iodine absorption filter」Opt. Lett. 19, 234-236 (1994))。ガスチャンバーは、ビームの方向変更(redirection)によるスペクトル分散を導入せず、それゆえ、並列分光計に極めて適している。ガスチャンバーは一般にガラスから製造され、明確に規定された吸収スペクトルを有する特定の原子元素からの蒸気を含む。光は入口を介してガスチャンバーを通り抜け、いかなる光学歪みも導入することなく、窓から出る。吸収ガスは、特定の光学波長において非常に狭い(1GHz未満の)分子吸収スペクトルを有する。吸収ガスを適切に選択することによって、その吸収ラインが光源710の波長と完全に重なり合うガスチャンバーを設計することができる。例えば、ガスチャンバーは、レンズ712と713との間に配置することができ、ブリルアン信号が通り抜ける間に、スプリアス光(レーザー光源710と同じ波長を有する)が吸収されることになる。吸収スペクトルの線幅は非常に狭いので、レーザーの周波数の任意の小さなドリフトがあると、ガスチャンバーの実効性がなくなる。ガスチャンバーを図7の実施形態とともに十分に機能させるために、レーザー源の波長をガスチャンバーの吸収ラインにロックする必要がある。一例として、図25は、ルビジウムガスを含む、ガスチャンバーの測定吸収スペクトルを示す。このガスチャンバーは780.24nmの波長において機能し、その結果は、チャンバーが94.5℃まで加熱されたときに、ピーク吸収は約34dBであり、挿入損失が2dBであることを示す。得られたスペクトル減衰によって、強い背景雑音を有する生体サンプルを測定できるようになる。 Alternatively, an absorption gas chamber can be used (Piironen P, Eloranta EW. "Demonstration of a high-spectral-resolution lidar based on an iodine absorption filter" Opt. Lett. 19, 234-236 (1994). ). Gas chambers do not introduce spectral dispersion due to beam redirection and are therefore well suited for parallel spectrometers. Gas chambers are generally made of glass and contain vapors from specific atomic elements with well-defined absorption spectra. Light passes through the gas chamber via the inlet and exits through the window without introducing any optical distortion. Absorbing gases have very narrow (less than 1 GHz) molecular absorption spectra at specific optical wavelengths. By properly choosing the absorbing gas, a gas chamber can be designed whose absorption line completely overlaps with the wavelength of the light source 710 . For example, a gas chamber can be placed between lenses 712 and 713, and spurious light (having the same wavelength as laser source 710) will be absorbed while the Brillouin signal passes through. Since the linewidth of the absorption spectrum is so narrow, any small drift in the frequency of the laser renders the gas chamber ineffective. In order for the gas chamber to work well with the embodiment of FIG. 7, the wavelength of the laser source must be locked to the absorption line of the gas chamber. As an example, FIG. 25 shows the measured absorption spectrum of a gas chamber containing rubidium gas. This gas chamber operates at a wavelength of 780.24 nm and the results show a peak absorption of about 34 dB and an insertion loss of 2 dB when the chamber is heated to 94.5°C. The spectral attenuation obtained allows the measurement of biological samples with strong background noise.
例4
本発明の例示的な構成が図26に示される。垂直偏光レーザービーム2628が最初に偏光ビームスプリッター(PBS)2634によって反射され、対物レンズ2632によって底部側からマイクロ流体チャネル2624の中央に合焦する。一実施形態において、ブリルアン散乱を励起するための光源として、11mW単一モード直線偏光532nm cwレーザー(Torus、Laser Quantum社)が使用された。4分の1波長板(QWP)2626に起因して、合焦したビームは円偏光される。後方散乱光が同じ対物レンズ2632によって収集され、QWP2626に再び通される。円偏光した光は最終的に、PBS2634によって完全に透過する水平偏光した光に変換される。散乱光は、その後、ミラー2630によって導光され、ファイバーカップリングレンズ(FC)2636によってブリルアン分光計2638に結合される。ブリルアン分光計2638は、交差軸構成において、標準的な2ステージ仮想画像化フェーズドアレイ(VIPA)によって構成される。マイクロ流体チャネル2624の上側に、チャネル2624内部の細胞の流動状況を監視するために、明視野顕微鏡が構築された。破線矢印は、チャネル2624内部の細胞の流動方向を示す。照明のために赤色LED2616が使用され、ブリルアンビームを遮断するためにロングパスフィルターが使用された。一例として、限定はしないが、LED2616の波長は660nmとすることができ、ロングパスフィルターはFEL0600、Thorlabs社とすることができる。合焦したブリルアンビームの場所は、ロングパスフィルター(LP)2612を取り外すことによってあらかじめ決定された。ブリルアン信号に及ぼすLED光2616の影響を排除するために、ブリルアン分光計2638の前方に狭帯域フィルターが配置された。一実施形態において、分光計のデータを測定サンプルの対応する場所に割り当てることができるように、CCDカメラ2610及びブリルアン分光計2638をLab VIEWプログラムによって同期させた。一実施形態において、実験中に、分光計のサンプリング時間が50msと設定された。図27a~図27dは、細胞内の複数の点においてブリルアン周波数を取得することに基づく、細胞流動実験の測定手順を示す。実験が行われているとき、ブリルアン分光計2638は絶えず信号を記録する。細胞がビームの場所を通り抜けるとき(矢印によって示される白色の点)、そのブリルアンシフトが測定される。
Example 4
An exemplary configuration of the invention is shown in FIG. A vertically polarized
マイクロ流体デバイス
図26の構成において使用されるチップは、入口においてシースフロー構成を備える単一の一直線のチャネル2624を有する。一実施形態において、チャネルの断面は150μm(幅)×50μm(深さ)のサイズを有し、長さは約50mmである。チップは顕微鏡の2Dステージ上に組み付けられ、細胞懸濁液をチャネルの中に送り込むためのシリンジポンプに接続される。シースフロー技法を用いて、細胞をチャネルの中央に位置合わせすることができる。一実施形態において、流速は約20μm/s~40μm/sである。全体的なスループットは一時間あたり細胞約160個から300個まで変化し、平均では一時間あたり細胞230個である。
Microfluidic Devices The chip used in the configuration of Figure 26 has a single,
サンプル調製
細胞が培養され、Mg2+及びCa2+不含のリン酸緩衝生理食塩水(PBS)の溶液内に再懸濁される。一実施形態において、最終的な細胞濃度は、100万細胞/ml~1000万細胞/mlである。クロマチン脱凝縮実験の場合、古い培地が吸引され、完全な成長培地内の100ng/mLトリコスタチンA(TSA)溶液と置き換えられる。その後、細胞は2時間、インキュベートされる。インキュベーション後に、細胞が、0.25%トリプシンEDTAを用いて採取され、250×gにおいて5分間、遠心分離され、約250万細胞/mLにおいて、Mg2+及びCa2+不含のPBSに再懸濁された。細胞核を蛍光染色する場合、Vybrant DyeCycle Ruby染料(ThermoFisher社)が使用され、推奨プロトコルに従った。要するに、50万細胞/mLの濃度を有する細胞懸濁液に1μL染料が添加され、十分に混合される。最終的な染料濃度は5μMである。その後、その混合物は37℃で15分~30分間、インキュベートされ、光から保護される。その際、細胞は、洗浄することなく、蛍光実験の準備ができている。一実施形態において、実験のために、NIH 3T3細胞系統が使用される。
Sample Preparation Cells are cultured and resuspended in a solution of Mg 2+ and Ca 2+ free phosphate buffered saline (PBS). In one embodiment, the final cell concentration is between 1 million cells/ml and 10 million cells/ml. For chromatin decondensation experiments, old medium is aspirated and replaced with a 100 ng/mL trichostatin A (TSA) solution in complete growth medium. Cells are then incubated for 2 hours. After incubation, cells were harvested with 0.25% trypsin-EDTA, centrifuged at 250×g for 5 minutes, and resuspended in PBS without Mg 2+ and Ca 2+ at approximately 2.5 million cells/mL. was done. For fluorescent staining of cell nuclei, Vybrant DyeCycle Ruby dye (ThermoFisher) was used and the recommended protocol was followed. Briefly, 1 μL dye is added to a cell suspension with a concentration of 500,000 cells/mL and mixed well. Final dye concentration is 5 μM. The mixture is then incubated at 37° C. for 15-30 minutes and protected from light. The cells are then ready for fluorescence experiments without washing. In one embodiment, the NIH 3T3 cell line is used for the experiments.
細胞の2次元画像
本発明の一実施形態において、細胞懸濁液が、シリンジポンプを用いて、マイクロ流体チャネルの中に徐々に送り込まれる。チャネル内に細胞が満たされると、ポンプが停止される。数分後に、細胞はチャネルの底部に沈殿するが、依然として、丸みを帯びた形状を保持する。その後、レーザービームスポットの高さが細胞の中心に調整され、顕微鏡のステージを走査することによって、水平面において2D走査が実行される。走査のステップサイズは、両方の次元において0.5μmと設定される。一実施形態において、実験のために、NIH 3T3細胞系統が使用される。
Two-Dimensional Images of Cells In one embodiment of the invention, a cell suspension is pumped slowly into a microfluidic channel using a syringe pump. When the channels fill with cells, the pump is stopped. After a few minutes the cells settle to the bottom of the channel but still retain their rounded shape. The height of the laser beam spot is then adjusted to the center of the cell and a 2D scan is performed in the horizontal plane by scanning the stage of the microscope. The scan step size is set to 0.5 μm in both dimensions. In one embodiment, the NIH 3T3 cell line is used for the experiments.
元のフローデータからの細胞のシグネチャの抽出
緩衝液内に懸濁された細胞は一般に丸い形状を有する。一実施形態において、細胞の直径は10μmから20μmに及ぶ。合焦したブリルアンビームは約0.5μmのスポットサイズを有するので、細胞がビームスポットを横切って流れるときに複数の位置を測定することができる。一実施形態において、流動実験中に、ブリルアン分光計は、20Hzの速度において絶えずデータを取得する。図27a~図27dは、測定手順を例示する。具体的には、図27a~図27cは、異なる時点(t1、t2及びt3)において細胞がマイクロ流体チャネルを通って流れる場合を示す。スケールバーは30μmである。矢印によって示される白色の点は、レーザービームスポットの場所である。図27dにおいて、ブリルアン信号の時間トレースが提示される。点は測定データであり、実線は見やすくするために引いた線である。
Extraction of Cell Signatures from Original Flow Data Cells suspended in buffer generally have a rounded shape. In one embodiment, the cells range in diameter from 10 μm to 20 μm. A focused Brillouin beam has a spot size of about 0.5 μm, so multiple positions can be measured as cells flow across the beam spot. In one embodiment, the Brillouin spectrometer continuously acquires data at a rate of 20 Hz during the flow experiment. Figures 27a-27d illustrate the measurement procedure. Specifically, Figures 27a-27c show when cells flow through a microfluidic channel at different time points (t1, t2 and t3). Scale bar is 30 μm. The white dots indicated by arrows are the locations of the laser beam spots. In Fig. 27d a time trace of the Brillouin signal is presented. Points are measured data, and solid lines are lines drawn for easy viewing.
データの後処理において、明視野画像の助けを借りて、時間窓を用いて元のデータストリームから細胞事象を選出することができる。図28a~図28cは、577個の細胞について測定されたブリルアン周波数シフトの分布を表す。各データ点は、ブリルアン周波数シフトを測定するブリルアン分光計の1つの測定事象に対応する。細胞の機械的情報を保持するために、時間窓は一般に、各細胞事象の継続時間より広い。それゆえ、細胞及びPBS緩衝液両方の機械的シグネチャが記録され、図28aに示される。ヒストグラムの第1のピーク2802はPBS緩衝液のシグネチャであり、それは、そのブリルアン周波数シフトに基づいて容易に識別することができる。その際、このシグネチャは、PBS緩衝液のみを流すことによって特徴付けられ、その結果が図28bに示される。そのフローデータは正規分布に十分に当てはめることができ、それは、ブリルアンシフトが7.51GHzであり、0.047GHzの幅を有することを示す。図28aからPBS緩衝液のシグネチャ2804を除去することにより、直接、細胞の機械的シグネチャを抽出することができ、その結果が図28cに示される。細胞のシグネチャは2つのピークを明らかにする。測定データを当てはめるために、2つの正規分布2806及び2808の線形重ね合わせが使用された。それらの結果が図28cにおいて実曲線2806及び2808によって示され、それぞれ7.57GHz及び7.80GHzの中心周波数を有する。細胞核は細胞の最も剛性が高い細胞小器官であることが当該技術分野において既知である(非特許文献10);非特許文献28)。それゆえ、実曲線はそれぞれ、細胞質及び細胞核のシグネチャである。これは、細胞核を染色し、蛍光画像をそのブリルアンデータと比較することによって確認することができる。さらに、3T3細胞の場合の細胞核の体積比は、30%より大きいことが報告されており、それは、細胞質と細胞核との直径比が約3:7であることを意味する。それゆえ、細胞内の複数の点においてブリルアン周波数を取得することに基づく流動実験中に、細胞核のシグネチャは、細胞質より、ブリルアン分光計によって測定される機会が2倍より大きく、それも図28cの2つのピーク2806及び2808の振幅によって確認される。
In post-processing of the data, time windows can be used to pick out cellular events from the original data stream with the help of brightfield images. Figures 28a-c represent the measured Brillouin frequency shift distribution for 577 cells. Each data point corresponds to one measurement event in a Brillouin spectrometer that measures Brillouin frequency shift. To preserve cellular mechanical information, the time window is generally wider than the duration of each cellular event. Therefore, the mechanical signature of both cells and PBS buffer was recorded and is shown in Figure 28a. The
フローデータが細胞集団機構を表す
懸濁された細胞は丸みを帯びた形状を有し、それは簡単にするために球として近似することができる。シースフローの助けを借りて、細胞がマイクロ流体チャネルを通って流れるときに、細胞の中心を幅方向においてレーザービームスポットの場所に位置合わせすることができる。チャネルの深さが細胞サイズより大きいので、細胞の中心は、深さ方向において細胞ごとに異なることになる。このような場合には、細胞がレーザービームスポットを横切って進むときに、各単一細胞の直径を含む断面内の1つのラインがサンプリングされることになる。細胞流動中のブリルアン周波数シフトの測定値が、細胞集団の機構を表すのを確実にするために、それらの測定値が、細胞の中心を通る断面の画像と比較される。具体的には、細胞の2D画像が、図29aに示されるように取得された。図29bは、2つの曲線2902及び2904の重ね合わせによって当てはめられる細胞集団の全体的な機構を表す、図29aの画像データの全ての分布を示す。細胞がレーザーを横切るラインに沿った一群の点に対応するブリルアンフローデータの分布が図29cにプロットされ、曲線2908及び2906の重ね合わせによって当てはめられる。図29bの2Dブリルアン画像データを図27cのブリルアンフローデータと比較することによって、両方の分布が2ピークシグネチャを有することが観測される。より重要なことに、両方の分布に関するこれら2つのピークのブリルアンシフトは同じであり、すなわち、7.57GHz及び7.80GHzである。したがって、フローデータが、細胞集団の機械的特性を正確に明らかにすると結論付けられる。
Flow Data Represent Cell Population Mechanisms Suspended cells have rounded shapes, which can be approximated as spheres for simplicity. With the help of sheath flow, the center of the cell can be aligned widthwise with the location of the laser beam spot as the cell flows through the microfluidic channel. Since the depth of the channel is greater than the cell size, the center of the cell will differ from cell to cell in the depth direction. In such a case, one line in the cross-section containing the diameter of each single cell will be sampled as the cell is advanced across the laser beam spot. To ensure that measurements of Brillouin frequency shifts during cell flow represent the mechanics of cell populations, they are compared to images of cross-sections through the center of the cell. Specifically, 2D images of cells were acquired as shown in Figure 29a. FIG. 29b shows the distribution of all of the image data of FIG. 29a, representing the overall organization of the cell population fitted by the superposition of the two
ブリルアンシグネチャが細胞核を細胞質から区別する
懸濁された細胞を球であると見なすと、固定されたビームスポットによって1つの直径が検知されるように、細胞がシースフローを介して位置合わせされる。しかしながら、実際の実験において、垂直方向における細胞の場所はわずかに上下変動するので、ビームスポットは実際には、その直径を通る断面をマッピングしている。図28cの2ピークシグネチャを更に検証するために、蛍光染料を用いて、細胞の細胞核のみを染色した。図30に示されるように、明視野(I)、蛍光(II)及びブリルアン2D(IV)の画像が取得された。明視野画像及び蛍光画像を含む融合画像(III)をブリルアン画像と比較することによって、ヒストグラム3002及び3004によってそれぞれ示されるように、細胞核のブリルアンシグネチャを細胞骨格のブリルアンシグネチャから容易に分離することができる。集団内の細胞間の小さな差を考えるとき、細胞内の複数の点においてブリルアン周波数を取得することに基づいて流動実験から取得されたデータの分布は、細胞結像からの分布に類似しているはずであり、それが、図30と図28cとの間の高い類似度によって確認される。したがって、図28cの流動データの2つのピークがそれぞれ細胞核及び細胞骨格のシグネチャに対応することが検証される。
Brillouin Signature Distinguishes Cell Nucleus from Cytoplasm Considering suspended cells as spheres, the cells are aligned through the sheath flow such that one diameter is sensed by a fixed beam spot. However, in actual experiments, the cell location in the vertical direction fluctuates slightly up and down, so the beam spot actually maps a cross-section through its diameter. To further validate the two-peak signature in Figure 28c, we stained only the nucleus of the cells with a fluorescent dye. Brightfield (I), fluorescence (II) and Brillouin 2D (IV) images were acquired as shown in FIG. By comparing the fused image (III), which includes the bright-field and fluorescence images, with the Brillouin image, it is easy to separate the nuclear Brillouin signature from the cytoskeletal Brillouin signature, as shown by
クロマチン脱凝縮が細胞核を軟化させる
クロマチンはDNA及びタンパク質の複合物であり、細胞核内に染色体を形成する。その機能は、細胞の細胞核に収まるように、かつDNA構造及び配列を保護するように、DNAを小さな体積の中に効率的に詰め込むことである。研究の積み重ねが、クロマチンの凝縮レベルが細胞核の剛性に密接に関連することを示唆する。例えば、クロマチン脱凝縮の結果として、細胞核の剛性が低下する。逆に、クロマチン凝縮の増加が、細胞核の硬化につながる。一実施形態において、機械的サイトメトリーを用いて、TSA、ヒストンデアセチラーゼ阻害剤によって引き起こされるクロマチン脱凝縮の影響を特徴付けた。
Chromatin Decondensation Softens the Cell Nucleus Chromatin is a complex of DNA and proteins that form chromosomes within the cell nucleus. Its function is to efficiently pack DNA into a small volume so that it fits in the cell's nucleus and preserves the DNA structure and sequence. A growing body of research suggests that the level of chromatin compaction is closely related to the stiffness of the cell nucleus. For example, chromatin decondensation results in decreased stiffness of the cell nucleus. Conversely, increased chromatin condensation leads to stiffening of the cell nucleus. In one embodiment, mechanical cytometry was used to characterize the effects of chromatin decondensation caused by TSA, a histone deacetylase inhibitor.
図31a~図31cは、クロマチン脱凝縮による細胞核の軟化の実験的な観測結果を与える。1つの非限定的な実施形態において、356個及び353個の細胞が、TSA処置群及び対照(非TSA処置)群からそれぞれ収集される。図31a及び図31bに示されるように、細胞がTSAで処置された後に、細胞核のブリルアンシフトが7.80GHz(曲線3108)から7.71GHz(曲線3104)に動かされ、それは細胞核の明確な軟化を示す。一方、細胞質のブリルアンシフトは概ね同じままであり(7.56GHz(曲線3102及び3106))、それは細胞質がTSAによって影響を及ぼされなかったことを意味する。図31cに示されるように、TSA処置細胞及び対照細胞の細胞質に関する平均ブリルアンシフトにそれぞれ関連付けられる棒グラフ3110及び3112は、同じ高さを有し、ブリルアン周波数に変化がないことを示す。対照的に、TSA処置細胞及び対照細胞の細胞核に関する平均ブリルアンシフトにそれぞれ関連付けられる棒グラフ3114及び3116は、異なる高さを有し、ブリルアン周波数に変化があることを示す。
Figures 31a-31c provide experimental observations of cell nucleus softening due to chromatin decondensation. In one non-limiting embodiment, 356 and 353 cells are collected from the TSA-treated and control (non-TSA-treated) groups, respectively. As shown in Figures 31a and 31b, the Brillouin shift of the cell nucleus was moved from 7.80 GHz (curve 3108) to 7.71 GHz (curve 3104) after the cells were treated with TSA, indicating a distinct softening of the cell nucleus. indicates On the other hand, the cytoplasmic Brillouin shift remained roughly the same (7.56 GHz (
したがって、本発明による機械的サイトメトリーは、オンチップブリルアン技法を用いて、細胞の細胞核シグネチャを識別することができる。それは、細胞集団の細胞核の機械的特性を測定するラベルフリーの非接触、非侵襲的方法を提供する。一実施形態において、総合スループットは一時間あたり約230細胞であり、それは、原子間力顕微鏡法(AFM)及びマイクロピペット吸引等の既存の技法よりはるかに効率的である。さらに、本発明による機械的サイトメトリーを用いて、細胞核の剛性に及ぼすクロマチン脱凝縮の影響を評価することができる。TSA処置後に明確に軟化することがわかっている。細胞核剛性の変化は、遊走、分化及び悪性転換等の細胞の数多くの重要な活動に関与するので、本発明による機械的サイトメトリーは、細胞集団の細胞核機構の効率的で、ラベルフリーの特性評価が必要とされる場合に適用される可能性がある。 Therefore, mechanical cytometry according to the present invention can distinguish nuclear signatures of cells using on-chip Brillouin techniques. It provides a label-free, non-contact, non-invasive method of measuring nuclear mechanical properties of cell populations. In one embodiment, the total throughput is approximately 230 cells per hour, which is much more efficient than existing techniques such as atomic force microscopy (AFM) and micropipette aspiration. In addition, mechanical cytometry according to the present invention can be used to assess the effect of chromatin decondensation on nuclear stiffness. It has been found that there is a distinct softening after TSA treatment. Since changes in nuclear stiffness are involved in many important cellular activities such as migration, differentiation and malignant transformation, mechanical cytometry according to the present invention provides an efficient, label-free characterization of the nuclear machinery of a cell population. may be applied where required.
要するに、図12~図31cを参照すると、本発明による生体細胞を分類する方法は、各生体細胞内の複数の点においてブリルアン散乱スペクトルを測定することに基づく。測定されたブリルアン散乱スペクトルに基づいて、生体細胞内の異なる空間点において細胞内物理的特性に関連する1つ以上の指標が特定される。生体細胞は、生体細胞内の異なる空間点における細胞内物理的特性に基づいて分類される。 In summary, referring to FIGS. 12-31c, the method of classifying biological cells according to the present invention is based on measuring Brillouin scattering spectra at multiple points within each biological cell. Based on the measured Brillouin scattering spectra, one or more indices related to intracellular physical properties are identified at different spatial points within the living cell. Living cells are classified based on intracellular physical properties at different spatial points within the living cell.
一実施形態において、生体細胞内の各測定点を含む、ブリルアン周波数シフトに関するヒストグラムが生成される。そのヒストグラムを当てはめるために、ガウス分布の線形重ね合わせが適用される。次に、ヒストグラム内の各ピークが特定され、各ピークは、細胞内の異なる領域からの機械的シグネチャを表す。生体細胞内の異なる空間点における物理的特性は、特定された機械的シグネチャと相関がある。 In one embodiment, a histogram is generated for the Brillouin frequency shift that includes each measurement point within the living cell. A linear superposition of Gaussian distributions is applied to fit the histogram. Each peak in the histogram is then identified, each peak representing a mechanical signature from a different region within the cell. Physical properties at different spatial points within living cells are correlated with the specified mechanical signatures.
生体サンプルは、生物有機体、組織又は生体細胞を含むことができる。一実施形態において、生体細胞は生細胞である。更に別の実施形態において、指標としてブリルアン周波数シフトが選択される。さらに、一実施形態において、生体細胞内の異なる空間点において細胞内物理的特性を特定するステップは、画像を形成することと、特定された物理的シグネチャの空間による違いに基づいて、パラメーターを分割することとを含む。サンプルの物理的特性は、粘弾性率、密度、屈折率、電歪及びその組み合わせからなる群から選択される。 Biological samples can include biological organisms, tissues, or biological cells. In one embodiment, the biological cell is a living cell. In yet another embodiment, the Brillouin frequency shift is chosen as the index. Further, in one embodiment, the step of identifying intracellular physical properties at different spatial points within the living cell includes forming images and partitioning the parameters based on spatial differences in the identified physical signatures. including doing. Physical properties of the sample are selected from the group consisting of viscoelastic modulus, density, refractive index, electrostriction and combinations thereof.
一実施形態において、生体サンプルを有する容器は、マイクロ流体デバイスのマイクロ流体チャネルである。生体細胞は、スペクトルが測定される間に、マイクロ流体チャネルを通って流れる。 In one embodiment, the container with the biological sample is a microfluidic channel of a microfluidic device. Living cells flow through the microfluidic channel while spectra are measured.
一実施形態において、ブリルアン散乱の元の場所を識別するために、そして照明光ビームをマイクロ流体チャネル内の特定の場所に導光するために、ブリルアン光スペクトルパターンと同時に明視野2D画像が取得される。更に別の実施形態において、多次元ヒストグラムを作成して生体細胞を分類するために、蛍光散乱、ラマン散乱、前方散乱及び側方散乱とともに1つ以上のブリルアン指標が使用される。一実施形態において、細胞核を細胞質から分離するために、2D明視野細胞画像及び2D蛍光細胞画像を含む融合画像が、ブリルアン周波数シフトに基づく細胞画像と比較される。 In one embodiment, bright-field 2D images are acquired simultaneously with the Brillouin light spectral pattern to identify the original location of the Brillouin scattering and to direct the illumination light beam to specific locations within the microfluidic channel. be. In yet another embodiment, one or more Brillouin indices are used along with fluorescence scatter, Raman scatter, forward scatter and side scatter to create a multi-dimensional histogram to classify biological cells. In one embodiment, a fused image comprising a 2D brightfield and a 2D fluorescence cell image is compared to a Brillouin frequency shift based cell image to separate the cell nucleus from the cytoplasm.
ブリルアン周波数シフトは、点走査モードにおいて、又は多重化走査モードにおいて測定することができる。細胞内から取得された抽出された物理的特性は、単一の生体細胞又は生体細胞の集団の分析結果を指す場合がある。 The Brillouin frequency shift can be measured in point scan mode or in multiplexed scan mode. An extracted physical property obtained from within a cell may refer to the analysis of a single living cell or a population of living cells.
一実施形態において、ブリルアンスペクトルを表すヒストグラムは、細胞質及び細胞核にそれぞれ対応する2つのピークを有する。更に別の実施形態において、ブリルアンスペクトルによって規定された細胞の細胞内機械的特性に基づいて、改変された生体細胞が無傷の生体細胞から区別され、細胞は、細胞骨格又は細胞核等の細胞内成分を標的にする薬物によって改変される。細胞内物理的特性を用いて、細胞を選別する。 In one embodiment, the histogram representing the Brillouin spectrum has two peaks corresponding to the cytoplasm and nucleus, respectively. In yet another embodiment, the modified biological cells are distinguished from intact biological cells based on the intracellular mechanical properties of the cells as defined by the Brillouin spectrum, wherein the cells contain intracellular components such as the cytoskeleton or the cell nucleus. modified by drugs that target Cells are sorted using intracellular physical properties.
図32は、本発明の一実施形態によるシステムを示すブロック図である。ブリルアン分光計3202が、ブリルアン散乱光の空間スペクトルパターン3404と、ブリルアン光スペクトルとをユーザーインターフェース3208に与える。プロセッサ3206が、ブリルアン分光計3202、ユーザーインターフェース3208、及びメモリ3210と通信する。プロセッサ3206は、メモリ3210内の命令を実行するように構成される。一実施形態において、メモリ3210は、検出された空間スペクトルパターンに基づいて、各測定サンプル点における1つ以上のブリルアン指標を計算するための命令を含む。更に別の実施形態において、メモリ3210は、測定されたブリルアン散乱スペクトルに基づいて、生体細胞内の異なる空間点において細胞内物理的特性に関連する1つ以上の指標を抽出する命令と、生体細胞内の異なる空間点における物理的特性に基づいて、生体細胞を分類するための命令とを含む。さらに、メモリ3210は、ブリルアン周波数シフトに関するヒストグラムをプロットし、ヒストグラムをユーザーインターフェース3208に通信するための命令、ヒストグラムを当てはめるためにガウス分布の線形重ね合わせを適用するための命令、ヒストグラム内の各ピークを特定するための命令であって、ピークは細胞内の異なる領域からの機械的シグネチャを表す、命令、及び媒質に関連付けられるデータをヒストグラムから除去するための命令を含むことができる。
FIG. 32 is a block diagram illustrating a system according to one embodiment of the invention.
核の機械的特性
アクチンフィラメント、微小管及び中間径フィラメントから構成される細胞骨格は、核と機械的にしっかりと相互接続されている(Ingber DE, Wang N, Stamenovic D, "Tensegrity, cellular biophysics, and the mechanics of living systems", Rep Prog Phys. 77, 046603 (2014))。アクチンフィラメントは、核に引張プレストレスを加えることで、核を硬くする。微小管フィラメントは、このプレストレスの釣り合いを保つために圧縮ストラットとして働く。したがって、核の剛性は、これらの2つの細胞骨格フィラメントの釣り合いによって取り持たれることとなる(Wakatsuki et al., J Cell Sci. 114, 1025-1036 (2001)、Chalut et al., Biophys J. 103, 2060-2070 (2012))。
Mechanical properties of the nucleus The cytoskeleton, composed of actin filaments, microtubules and intermediate filaments, is tightly interconnected mechanically with the nucleus (Ingber DE, Wang N, Stamenovic D, "Tensegrity, cellular biophysics, and the mechanics of living systems", Rep Prog Phys. 77, 046603 (2014)). Actin filaments stiffen the nucleus by applying a tensile prestress to the nucleus. Microtubule filaments act as compression struts to balance this prestress. Therefore, nuclear rigidity is mediated by the balance of these two cytoskeletal filaments (Wakatsuki et al., J Cell Sci. 114, 1025-1036 (2001), Chalut et al., Biophys J. 103, 2060-2070 (2012)).
アクチン及び微小管の阻害を伴う細胞の特定
2つの薬物のサイトカラシンD(cytoD)及びノコダゾール(Noco)を3T3細胞に適用することで、アクチンフィラメント及び微小管フィラメントをそれぞれ阻害した。アメリカ培養細胞系統保存機関(ATCC)から購入したNIH 3T3線維芽細胞を、全ての実験のために使用した。細胞を以下の標準的なプロトコルに従って培養した。微小管フィラメントの阻害のために、細胞をまず1ug/mLのNocoにより30分間処置し、次いでトリプシン処理により回収し、測定前にMg2+及びCa2+を有しないリン酸緩衝生理食塩水(PBS)の溶液内に1mL当たり約10万個の細胞の濃度で再懸濁させた。濃度が低いため、流動により細胞は殆ど取り込まれなかった。その代わりに、懸濁液中の単一細胞は、それがマイクロ流体デバイス中に送達された後に結像された。図33Aに示されるように、棒グラフ3311及び3312は、それぞれ対照細胞及び処置細胞の核の平均ブリルアンシフトを表す。処置細胞のブリルアンシフト3312の方が0.29GHz高いことから、その核の明確な硬化が示される。機器の感度が約0.01GHzであることを考慮して、微小管フィラメントが阻害された細胞は、核の機械的硬化に基づいて正常細胞から容易に特定された。
Identification of Cells with Actin and Microtubule Inhibition Two drugs, cytochalasin D (cytoD) and nocodazole (Noco), were applied to 3T3 cells to inhibit actin and microtubule filaments, respectively. NIH 3T3 fibroblasts purchased from the American Type Culture Collection (ATCC) were used for all experiments. Cells were cultured following standard protocols. For inhibition of microtubule filaments, cells were first treated with 1 ug/mL Noco for 30 min, then harvested by trypsinization and treated with phosphate-buffered saline (PBS) without Mg 2+ and Ca 2+ prior to measurement. at a concentration of approximately 100,000 cells per mL. Due to the low concentration, few cells were taken up by flow. Instead, single cells in suspension were imaged after they were delivered into the microfluidic device. As shown in FIG. 33A,
アクチンフィラメントの阻害のために、細胞をまず2ug/mLのcytoDにより10分間処置し、次いでトリプシン処理により回収し、測定前にMg2+及びCa2+を有しないリン酸緩衝生理食塩水(PBS)の溶液内に1mL当たり約100万個の細胞の濃度で再懸濁させた。ブリルアンに基づくラベルフリーフローサイトメトリーを使用して、それぞれ368個の細胞が対照群から取得され、232個の細胞が処置群から取得された。図33Bは測定された結果を示し、棒グラフ3321及び3322は、それぞれ対照群及び処置群の核の平均ブリルアンシフトを表す。処置群3322は、対照群3321と比較して0.12GHzの明確な減少を特徴とし、こうしてアクチンフィラメントの破壊による核の軟化が示される。
For actin filament inhibition, cells were first treated with 2 ug/mL cytoD for 10 min, then harvested by trypsinization and treated with phosphate-buffered saline (PBS) without Mg 2+ and Ca 2+ prior to measurement. The solution was resuspended at a concentration of approximately 1 million cells per mL. Using Brillouin-based label-free flow cytometry, 368 cells each were obtained from the control group and 232 cells from the treatment group. FIG. 33B shows the measured results, with
悪性細胞の特定
図34は、第2の例示的な実施形態を示す。ブリルアンに基づくラベルフリーフローサイトメトリーを使用して、5種の癌関連細胞系統を試験した。その内の4種(バーバラアンカルマノス研究所から取得したM1、M2、M3、及びM4)は、MCF10A細胞系統に由来する同種同系の腫瘍形成性が増している細胞系統であり、それはヒト乳癌の進行をモデル化するための標準的なアプローチである(Santner et al., Breast Cancer Res Treat. 65, 101-110 (2001))。5つ目は、高転移性の乳癌細胞系統MDA-MB-231(ATCCから得られた)である。MCF10A(M1)は、ヒト上皮の非腫瘍形成性の細胞系統である。MCF10AT1k.cl2(M2)は、マウスに注射された場合に持続性の限局性良性病変を引き起こす前悪性細胞である。MCF10CA1h(M3)細胞及びMCF10CA1a.cl1(M4)細胞は、それらがマウスの尾静脈内に注射された場合に遠隔の肺に転移する能力を有する。実験により、M4細胞がM3細胞系統よりも素早く転移することも指摘される。それというのも、M4細胞はより素早く成長する腫瘍を形成し得るからである(Santner et al. (2001))。
Identification of Malignant Cells FIG. 34 shows a second exemplary embodiment. Five cancer-associated cell lines were tested using Brillouin-based label-free flow cytometry. Four of them (M1, M2, M3, and M4 obtained from the Barbara Ancarmanos Institute) are allogeneic, increasing tumorigenic cell lines derived from the MCF10A cell line, which are associated with human breast cancer. It is a standard approach for modeling progression (Santner et al., Breast Cancer Res Treat. 65, 101-110 (2001)). Fifth, the highly metastatic breast cancer cell line MDA-MB-231 (obtained from ATCC). MCF10A (M1) is a human epithelial non-tumorigenic cell line. MCF10AT1k. cl2 (M2) is a premalignant cell that causes persistent focal benign lesions when injected into mice. MCF10CA1h (M3) cells and MCF10CA1a. cl1(M4) cells have the ability to metastasize to distant lungs when they are injected into the tail vein of mice. Experiments also indicate that M4 cells metastasize more quickly than the M3 cell line. This is because M4 cells can form faster growing tumors (Santner et al. (2001)).
全ての細胞系統は、標準的なプロトコルに従って培養した。それらを、同じ培地(MCF10A細胞系統(M1~M4)のための標準的な完全培地)内で増殖させた。細胞を、低濃度のトリプシンで培養物から回収し、それらを実験前にMg2+及びCa2+を有しないPBS内に1mL当たり約200万個の細胞の濃度で再懸濁した。細胞系統M1~M4及びMDA-MB-231から、223個、343個、233個、538個及び430個の細胞が収集され、核の剛性の平均は、それぞれ棒グラフ3421、3422、3423、3424及び3425として示されている。棒グラフ3421、3422は、限局性腫瘍M2細胞系統が、ブリルアン周波数シフトの差(0.16GHz)に基づいて非腫瘍形成性の細胞系統M1と明らかに区別され得ることを示している。さらに、棒グラフ3423、3424及び3425は、転移性細胞系統M3、M4及びMDA-MB-231も、非転移性のM1及び限局性のM2の両方と統計学的有意差(p値<0.01)をもって区別され得ることを示している。M3とM4との間に統計学的有意差は見出されなかった。それというのも、それらのブリルアンシフト測定値は互いに類似していたからである。しかしながら、M3(M4)とMDA-MB-231との間には統計学的有意差(p値<0.01)が見出された。核の機械的シグネチャの測定に基づいて、正常細胞及び良性病変細胞は悪性癌細胞と区別されたため、癌の進行をグレード分けすることができる。
All cell lines were cultured according to standard protocols. They were grown in the same medium, the standard complete medium for the MCF10A cell line (M1-M4). Cells were harvested from cultures with low concentrations of trypsin and they were resuspended in PBS without Mg 2+ and Ca 2+ at a concentration of approximately 2 million cells per mL prior to experiments. 223, 343, 233, 538 and 430 cells were collected from cell lines M1-M4 and MDA-MB-231 and the mean nuclear stiffness is shown in
細胞内でのラミン発現の特定
図35は、本発明の第3の例示的な実施形態を示す。核の主要な構造成分の1つは、ラミンとして知られるタンパク質群である。核ラミナの主要成分として、ラミンA/Cは、多数の機能、例えば核の構造的支持を与え、クロマチン構成、遺伝子調節並びにDNA複製及び修復を促進する(Ho and Lammerding, J Cell Sci. 125, 2087-2093 (2012))。ラミンはまた、広範なヒト疾患につながることも分かっている。例えば、10種を超える癌型からのエビデンスにより、ラミンは癌の進行の役割を担うか、又はそれに応答して変化することが示唆されている(Irianto et al., Cell Mol Bioeng. 9, 258-267 (2016))。また、A型ラミンにおける突然変異は、ハッチンソン・ギルフォード・プロジェリア症候群(HGPS)(Mounkes and Stewart, Current Opinion In Cell Biology. 16, 322-327(2004) (Butin-Israeli, Trends Genet. 28(9):464-71 (2012))等の老化症の原因であることも分かっている。さらに、実験によって、ラミンA/Cの過剰発現が核の剛性を高める一方で、ノックダウンが剛性をより低くすることが示された(Pajerowski et al., Proc Natl Acad Sci USA 104, 15619-15624 (2007)、Lammerding et al., J Biol. Chem. 281, 25768-25780 (2006)、Davidson (2014)、Schaepe et al., Biophys. J 96, 4319-4325 (2009)、Swift et al., Science 341, 1240104 (2013))。
Determining Lamin Expression in Cells FIG. 35 shows a third exemplary embodiment of the invention. One of the major structural components of the nucleus is a group of proteins known as lamins. As major components of the nuclear lamina, lamins A/C provide multiple functions, including structural support for the nucleus, and promote chromatin organization, gene regulation, and DNA replication and repair (Ho and Lammerding, J Cell Sci. 125, 2087-2093 (2012)). Lamins have also been found to lead to a wide range of human diseases. For example, evidence from more than ten cancer types suggests that lamins play a role in, or change in response to, cancer progression (Irianto et al., Cell Mol Bioeng. 9, 258). -267 (2016)). In addition, mutations in type A lamins are described in Hutchinson-Guilford Progeria Syndrome (HGPS) (Mounkes and Stewart, Current Opinion In Cell Biology. 16, 322-327 (2004) (Butin-Israeli, Trends Genet. 28 (9 ):464-71 (2012)), etc. Furthermore, experiments have shown that overexpression of lamins A/C increases nuclear rigidity, whereas knockdown increases rigidity. (Pajerowski et al., Proc Natl Acad Sci USA 104, 15619-15624 (2007), Lammerding et al., J Biol. Chem. 281, 25768-25780 (2006), Davidson (2014) , Schaepe et al., Biophys. J 96, 4319-4325 (2009), Swift et al., Science 341, 1240104 (2013)).
ラミン発現の調整により生ずる核における機械的変化を測定するために必要とされる感度がこの方法を使用して可能であるため、それを細胞分類のために使用することができることを確認するために試験を行った。それを行うために、NIH/3T3細胞を培養し、市販の脂質を基礎とするトランスフェクション試薬(Dharmafect)を使用して、ラミンA/C発現を選択的にノックダウンさせた。Dharmafectの溶液及びsiRNAを事前に複合体化し、次いでトランスフェクション複合体を含む培地内で細胞をインキュベートした。1つはラミンA/Cをターゲティングするために知られており、1つは既知の細胞標的を有しないスクランブル配列である2種の市販のsiRNAを使用した。ラミンA/CをターゲティングするsiRNAに関しては、低効率のノックダウン及び高効率のノックダウンのそれぞれを達成するために2種の異なる用量(25nM及び50nM)を使用した。トランスフェクションを経なかった対照も含まれていた。72時間のインキュベート後に、細胞をトリプシン処理により回収し、直ちにラベルフリーのブリルアンに基づくフローサイトメトリー構成を使用して分析した。図35の3512、3522、3532、3542の棒グラフにそれぞれ示されるように、対照、スクランブル対照、低効率ノックダウン及び高効率ノックダウンのために、122個、195個、208個、114個の細胞を収集した。核の機械的特性は、スクランブル対照群3522において、非トランスフェクション対照群3512と比較してほぼ不変(0.01GHz未満)であったが、図35の棒グラフ3532及び3542に示されるようにラミンA/CをターゲティングするsiRNAでトランスフェクションされたサンプルにおいては、剛性に顕著な減少(0.04GHz及び0.07GHz)が観察された。他方で、3511、3521、3531及び3541の棒グラフに示されるように、細胞質の剛性には依然として影響はない。
To confirm that the sensitivity required to measure mechanical changes in the nucleus caused by modulation of lamin expression is possible using this method, and thus it can be used for cell sorting. did the test. To do so, NIH/3T3 cells were cultured and lamin A/C expression was selectively knocked down using a commercially available lipid-based transfection reagent (Dharmafect). A solution of Dharmafect and siRNA were pre-complexed and then cells were incubated in medium containing the transfection complexes. Two commercially available siRNAs were used, one known to target lamins A/C and one scrambled sequence with no known cellular target. For siRNA targeting Lamin A/C, two different doses (25 nM and 50 nM) were used to achieve low and high efficiency knockdown, respectively. A control that did not undergo transfection was also included. After 72 hours of incubation, cells were harvested by trypsinization and immediately analyzed using a label-free Brillouin-based flow cytometry setup. 122, 195, 208, 114 cells for control, scrambled control, low-efficiency knockdown and high-efficiency knockdown, as shown in bar graphs at 3512, 3522, 3532, 3542 in Figure 35, respectively. collected. Nuclear mechanical properties were nearly unchanged (below 0.01 GHz) in the scrambled
並行してラミンA/C発現を可視化するために、標準的なプロトコルに従って免疫細胞化学を実施した。上記の72時間のトランスフェクション後に、接着細胞を中性緩衝ホルマリンで固定化し、Triton-X100で透過処理を行い、ウシ血清アルブミンの溶液でブロッキングし、一次抗ラミン抗体と一緒に一晩インキュベートし、最後に蛍光体結合二次抗体と一緒に簡単にインキュベートした。各ステップ間にサンプルをPBSで3回すすいだ。一定の結像条件(光強度、露光時間)で各サンプルの蛍光画像を撮影した。図36に示されるように、図36Bにおけるノックダウン群の蛍光強度は、図36Aにおけるスクランブル群の蛍光強度よりも大幅に弱いことから、ラミンA/C発現は、ラミンA/CをターゲティングするsiRNAで処置されたサンプルにおいてスクランブルsiRNAサンプルと比較してノックダウンされていることが指摘される。ラミンA/Cノックダウンを大まかに定量化するために、核タンパク質抽出物を、トランスフェクション後に全てのサンプルから採取した。 To visualize Lamin A/C expression in parallel, immunocytochemistry was performed according to standard protocols. After 72 hours of transfection as described above, adherent cells were fixed with neutral buffered formalin, permeabilized with Triton-X100, blocked with a solution of bovine serum albumin, incubated overnight with a primary anti-lamin antibody, A final brief incubation with a fluorophore-conjugated secondary antibody was performed. Samples were rinsed three times with PBS between each step. A fluorescence image of each sample was taken under constant imaging conditions (light intensity, exposure time). As shown in FIG. 36, the fluorescence intensity of the knockdown group in FIG. 36B is significantly weaker than the fluorescence intensity of the scramble group in FIG. It is noted that there is knockdown in the samples treated with compared to the scrambled siRNA samples. To roughly quantify Lamin A/C knockdown, nuclear protein extracts were taken from all samples after transfection.
一実施形態において、サンプル内の少なくとも1つの細胞の核の機械的特性を測定する方法であって、ブリルアン分光法により可能となったラベルフリーサイトメトリーを使用して少なくとも1つの細胞の機械的シグネチャを取得することと、上記細胞の少なくとも1つの核の機械的シグネチャに基づいて細胞を分類することとを含む、方法が提供される。幾つかの実施形態において、ラベルフリーサイトメトリーは、ブリルアン走査を使用する本明細書において与えられる一連のステップのいずれかを含む。或る特定の実施形態において、上記ラベルフリーサイトメトリーは、第1の方向に沿って光ビームによって上記サンプルを照明するステップと、上記照明光ビームに応答して上記サンプルから放射されるブリルアン散乱光を収集するステップと、上記ブリルアン散乱光を、スペクトル分散を誘発する光学配置に送り、上記ブリルアン散乱光の空間スペクトルパターンを生成する検出ユニットに送るステップと、なお、上記光学配置及び上記検出ユニットは第2の方向に沿って位置決めされる;上記検出ユニット上で上記ブリルアン散乱光の上記空間スペクトルパターンを検出するステップと、なお、上記照明光ビームに沿った上記サンプルの複数の点が同時に測定され、上記サンプルの複数の点の少なくとも1つが細胞核である;上記検出ユニットにおいて、各空間点における上記スペクトルパターンを較正するステップと、上記検出された空間スペクトルパターンに基づいて、各測定サンプル点において上記1つ以上のブリルアン指標を計算するステップとを含む。幾つかの実施形態において、第1の方向と第2の方向との間の角度は0度より大きい任意の角度である。別の実施形態において、スペクトル分散を誘発する光学配置は、仮想画像化フェーズドアレイ(VIPA)、ファブリ-ペローエタロン又はエシェル格子を含む。他の実施形態において、スペクトル分散を誘発する光学配置は、サンプルから検出ユニットへの光路内の空間スペクトルパターンのサイズ、形状及び/又は角度の広がりを変更する光学要素を更に備える。 In one embodiment, a method of measuring a nuclear mechanical property of at least one cell in a sample, wherein the mechanical signature of the at least one cell using label-free cytometry enabled by Brillouin spectroscopy and classifying a cell based on at least one nuclear mechanical signature of said cell. In some embodiments, label-free cytometry includes any of the series of steps given herein using Brillouin scanning. In certain embodiments, the label-free cytometry comprises the steps of: illuminating the sample with a light beam along a first direction; and Brillouin scattered light emitted from the sample in response to the illuminating light beam. and directing the Brillouin scattered light to an optical arrangement that induces spectral dispersion and to a detection unit that produces a spatial spectral pattern of the Brillouin scattered light, wherein the optical arrangement and the detection unit are positioned along a second direction; detecting the spatial spectral pattern of the Brillouin scattered light on the detection unit, wherein a plurality of points of the sample along the illumination light beam are simultaneously measured; , at least one of the plurality of points of the sample is a cell nucleus; in the detection unit, calibrating the spectral pattern at each spatial point; and based on the detected spatial spectral pattern, at each measured sample point. and calculating one or more Brillouin indices. In some embodiments, the angle between the first direction and the second direction is any angle greater than 0 degrees. In another embodiment, the spectral dispersion-inducing optical arrangement comprises a Virtual Imaging Phased Array (VIPA), a Fabry-Perot etalon, or an Echelle grating. In other embodiments, the spectral dispersion-inducing optical arrangement further comprises an optical element that alters the size, shape and/or angular spread of the spatial spectral pattern in the optical path from the sample to the detection unit.
更なる実施形態において、上記サンプルは、生物有機体、組織又は生細胞を含む生体細胞を含む生体サンプルである。別の実施形態において、上記生体細胞は、懸濁されるか、2D基体に付着しているか、3D細胞外マトリックス内で培養されるか、又はマイクロ流体チップの1つ以上のチャネルを通って流れる。幾つかの実施形態において、上記少なくとも1つの細胞は、生きている真核細胞である。別の実施形態において、上記分類は、細胞集団又は単一細胞のいずれかに基づく。 In a further embodiment, the sample is a biological sample comprising biological organisms, tissue or biological cells comprising living cells. In another embodiment, the biological cells are suspended, attached to a 2D substrate, cultured within a 3D extracellular matrix, or flowed through one or more channels of a microfluidic chip. In some embodiments, the at least one cell is a living eukaryotic cell. In another embodiment, the classification is based on either cell populations or single cells.
幾つかの実施形態において、ブリルアン指標は、ブリルアン周波数シフト、ブリルアンスペクトル線幅、ブリルアン利得又は損失スペクトル、及びその組み合わせからなる群から選択される。更なる実施形態において、ブリルアン指標は、細胞核の機械的特性に関する情報を提供する。他の実施形態において、核の機械的特性は、弾性、粘性及び核の剛性である。幾つかの実施形態において、走査された細胞は、核の測定された機械的特性に基づいて分類される。別の実施形態において、走査された細胞は癌細胞として分類される。 In some embodiments, the Brillouin index is selected from the group consisting of Brillouin frequency shift, Brillouin spectral linewidth, Brillouin gain or loss spectrum, and combinations thereof. In a further embodiment, the Brillouin Index provides information on the mechanical properties of the cell nucleus. In other embodiments, the mechanical properties of the core are elasticity, viscosity and stiffness of the core. In some embodiments, scanned cells are classified based on the measured mechanical properties of the nucleus. In another embodiment, the scanned cells are classified as cancer cells.
別の実施形態において、サンプル内の少なくとも1つの細胞の核の機械的特性を測定する方法において使用するためのシステムが提供される。一実施形態において、該システムは、ブリルアン分光法により可能となったラベルフリーサイトメトリーを提供する。更なる実施形態において、該システムは、少なくとも1つの点がサンプル内の少なくとも1つの細胞の核内にある複数の点においてブリルアン散乱スペクトルに関連付けられる1つ以上のブリルアン指標を取得する。更なる実施形態において、該システムは、第1の方向に沿って光ビームによって上記サンプルを照明する照明源と、上記照明光ビームに応答して、上記サンプルから放射されるブリルアン散乱光を収集する1つ以上のレンズと、上記1つ以上のレンズから上記ブリルアン散乱光を受光する光学配置であって、該光学配置はスペクトル分散を誘発する、光学配置と、上記ブリルアン散乱光の空間スペクトルパターンを検出する検出ユニットであって、上記1つ以上のレンズ、上記光学配置及び上記検出ユニットは、第2の方向に沿って位置決めされ、上記照明光ビームに沿った上記サンプルの複数の点が同時に測定される、検出ユニットと、プロセッサであって、上記検出ユニットにおいて、(1)各空間点における上記スペクトルパターンを較正するための命令と、(2)上記検出された空間スペクトルパターンに基づいて、各測定サンプル点において上記1つ以上のブリルアン指標を計算するための命令とを実行する、プロセッサとを備える。 In another embodiment, a system is provided for use in a method of measuring nuclear mechanical properties of at least one cell within a sample. In one embodiment, the system provides label-free cytometry enabled by Brillouin spectroscopy. In a further embodiment, the system acquires one or more Brillouin indices associated with the Brillouin scattering spectrum at a plurality of points, at least one of which is within the nucleus of at least one cell in the sample. In a further embodiment, the system includes an illumination source that illuminates the sample with a light beam along a first direction and collects Brillouin scattered light emitted from the sample in response to the illumination light beam. one or more lenses and an optical arrangement for receiving said Brillouin scattered light from said one or more lenses, said optical arrangement inducing spectral dispersion; and a spatial spectral pattern of said Brillouin scattered light. A detection unit for detecting, wherein the one or more lenses, the optical arrangement and the detection unit are positioned along a second direction to simultaneously measure a plurality of points of the sample along the illumination light beam. a detection unit and a processor, wherein in the detection unit: (1) instructions for calibrating the spectral pattern at each spatial point; and (2) based on the detected spatial spectral pattern, each a processor executing instructions for calculating the one or more Brillouin indices at the measurement sample points.
別の実施形態において、上記システムは、ブリルアン周波数シフト、ブリルアンスペクトル線幅、ブリルアン利得又は損失スペクトル、及びその組み合わせを含む1つ以上のブリルアン指標を取得する。更なる実施形態において、上記1つ以上のブリルアン指標は、少なくとも1つの細胞核の機械的特性を決定し、上記機械的特性は、弾性、粘性及び核の剛性を含む群から選択される。別の実施形態において、走査された細胞は、上記核の測定された機械的特性に基づいて分類される。更なる実施形態において、走査された細胞は、癌細胞として分類される。 In another embodiment, the system obtains one or more Brillouin metrics including Brillouin frequency shift, Brillouin spectral linewidth, Brillouin gain or loss spectrum, and combinations thereof. In a further embodiment, said one or more Brillouin indices determine a mechanical property of at least one cell nucleus, said mechanical property being selected from the group comprising elasticity, viscosity and nuclear stiffness. In another embodiment, scanned cells are sorted based on the measured mechanical properties of the nucleus. In a further embodiment, the scanned cells are classified as cancer cells.
更なる実施形態において、サンプル内の癌性細胞を特定する方法が提供される。一実施形態において、該方法は、本明細書に与えられるラベルフリーサイトメトリーを使用して細胞核の特性を測定することを含む。幾つかの実施形態において、該方法は、第1の方向に沿って光ビームによって上記サンプルを照明することと、上記照明光ビームに応答して上記サンプルから放射されるブリルアン散乱光を収集することと、上記ブリルアン散乱光を、スペクトル分散を誘発する光学配置に送り、上記ブリルアン散乱光の空間スペクトルパターンを生成する検出ユニットに送ることと、なお、上記光学配置及び上記検出ユニットは第2の方向に沿って位置決めされる;上記検出ユニット上で上記ブリルアン散乱光の上記空間スペクトルパターンを検出することと、なお、上記照明光ビームに沿った上記サンプルの複数の点が同時に測定され、上記サンプルの複数の点の少なくとも1つが細胞核である;上記検出ユニットにおいて、各空間点における上記スペクトルパターンを較正することと、上記検出された空間スペクトルパターンに基づいて、各測定サンプル点において上記1つ以上のブリルアン指標を計算することと、上記計算されたブリルアン指標と正常細胞のブリルアン指標とを比較することによって、上記サンプル内に存在する癌性細胞を特定することとを含む。 In a further embodiment, a method of identifying cancerous cells within a sample is provided. In one embodiment, the method comprises measuring properties of cell nuclei using label-free cytometry provided herein. In some embodiments, the method comprises illuminating the sample with a light beam along a first direction and collecting Brillouin scattered light emitted from the sample in response to the illumination light beam. and directing the Brillouin scattered light to an optical arrangement that induces spectral dispersion and to a detection unit that produces a spatial spectral pattern of the Brillouin scattered light, wherein the optical arrangement and the detection unit are in a second direction. detecting the spatial spectral pattern of the Brillouin scattered light on the detection unit, wherein a plurality of points of the sample along the illumination light beam are simultaneously measured, the at least one of the plurality of points is a cell nucleus; in the detection unit, calibrating the spectral pattern at each spatial point; and based on the detected spatial spectral pattern, at each measurement sample point, the one or more calculating a Brillouin index; and identifying cancerous cells present in the sample by comparing the calculated Brillouin index with the Brillouin index of normal cells.
幾つかの実施形態において、1つ以上のブリルアン指標は、核の機械的特性に関する情報を提供する。別の実施形態において、該機械的特性は、弾性、粘性及び核の剛性を含む群から選択される。幾つかの実施形態において、癌性細胞は、その核の剛性を非癌性細胞の核の剛性と比較することにより特定される。 In some embodiments, one or more Brillouin indices provide information about the mechanical properties of the nucleus. In another embodiment, the mechanical properties are selected from the group comprising elasticity, viscosity and core stiffness. In some embodiments, cancerous cells are identified by comparing their nuclear stiffness to that of non-cancerous cells.
更なる実施形態において、サンプルは、生物有機体、組織又は生細胞を含む生体細胞を含む生体サンプルである。別の実施形態において、生体細胞は、懸濁されるか、2D基体に付着しているか、又は3D細胞外マトリックス内で培養されるか、又はマイクロ流体チップの1つ以上のチャネルを通って流れる。幾つかの実施形態において、少なくとも1つの細胞は、生きている真核細胞である。別の実施形態において、上記分類は、細胞集団又は単一細胞のいずれかに基づく。 In further embodiments, the sample is a biological sample comprising a living organism, tissue or living cells comprising living cells. In another embodiment, biological cells are suspended, attached to a 2D substrate, or cultured within a 3D extracellular matrix, or flow through one or more channels of a microfluidic chip. In some embodiments, at least one cell is a living eukaryotic cell. In another embodiment, the classification is based on either cell populations or single cells.
別の実施形態においては、細胞がラミンA/C発現の抑制を伴うかどうかを判定する方法が提供される。更なる実施形態において、該方法は、ブリルアン分光法により可能となったラベルフリーサイトメトリーを使用して少なくとも1つの細胞の核の機械的シグネチャを取得することを含む。更なる実施形態において、細胞は、細胞の核の機械的シグネチャに基づいて、正常なラミンA/C発現を有する又はラミンA/C発現の抑制を伴うと分類される。別の実施形態において、ラベルフリーサイトメトリーは、本明細書に記載されるように実施される。 In another embodiment, a method is provided for determining whether a cell has suppressed Lamin A/C expression. In a further embodiment, the method comprises obtaining a nuclear mechanical signature of at least one cell using label-free cytometry enabled by Brillouin spectroscopy. In a further embodiment, cells are classified as having normal Lamin A/C expression or with suppressed Lamin A/C expression based on the nuclear mechanical signature of the cell. In another embodiment, label-free cytometry is performed as described herein.
本発明を説明する文脈において(特に添付の特許請求の範囲の文脈において)「1つの(a、an)」及び「その(the)」という用語並びに類似の指示物を使用することは、本明細書において他に指示されない限り、又は文脈によって明確に否定されない限り、単数形及び複数形の両方を含むと解釈されるべきである。「備える」、「有する」「含む」及び「含有する」という用語は、他に言及されない限り、オープンエンドの用語(すなわち、「含むが、それに限定されない」を意味する)と解釈されるべきである。本明細書において値の範囲を列挙することは、本明細書において他に指示されない限り、その範囲内に入る別々の各値を個々に参照する簡潔な方法としての役割を果たすことを意図するにすぎず、本明細書において個々に列挙されたかのように、別々の各値が本明細書に組み込まれる。例えば、範囲10~15が開示される場合には、11、12、13及び14も開示される。本明細書において説明される全ての方法は、本明細書において他に指示されない限り、又は文脈によって明確に否定されない限り、任意の適切な順序において実行することができる。本明細書において与えられるありとあらゆる例、又は例示する用語(例えば、「~等の(such as)」)の使用は、本発明の理解をより容易にすることを意図するにすぎず、別に特許請求されない限り、本発明の範囲に制限を課すものではない。本明細書における文言は、任意の特許請求されない要素を、本発明を実施する上で不可欠であると示すものと解釈されるべきでない。 The use of the terms "a, an" and "the" and similar denotations in the context of describing the invention (especially in the context of the appended claims) refers to It should be construed to include both singular and plural forms unless otherwise indicated herein or clearly contradicted by context. The terms "comprising," "having," "including," and "containing" are to be construed as open-ended terms (i.e., meaning "including, but not limited to") unless otherwise stated. be. Recitation of ranges of values herein is intended to serve as a shorthand method of referring individually to each separate value falling within the range, unless otherwise indicated herein. only, each separate value is incorporated herein as if it were individually recited herein. For example, if the range 10-15 is disclosed, then 11, 12, 13 and 14 are also disclosed. All methods described herein can be performed in any suitable order unless otherwise indicated herein or otherwise clearly contradicted by context. Any and all examples given herein, or the use of exemplary terminology (eg, "such as"), are merely intended to facilitate an easier understanding of the invention and are not otherwise claimed. Unless otherwise specified, no limitation is imposed on the scope of the invention. No language in the specification should be construed as indicating any non-claimed element as essential to the practice of the invention.
本発明の方法及び構成は、様々な実施形態の形で組み込むことができ、その幾つかのみが本明細書において開示されることは理解されよう。上記の説明を読むと、それらの実施形態の変形が当業者に明らかになる場合がある。本発明者らは、当業者が必要に応じてそのような変形を利用することを期待しており、本発明者らは、本発明が本明細書において具体的に説明されたのとは別のやり方で実施されることを意図している。 It is understood that the methods and configurations of the present invention can be embodied in various embodiments, only some of which are disclosed herein. Variations on those embodiments may become apparent to those of ordinary skill in the art upon reading the above description. The inventors expect those skilled in the art to employ such variations as appropriate, and the inventors do not intend the invention to be otherwise specifically described herein. intended to be implemented in the manner of
したがって、本発明は、適用法令によって許されるような添付の特許請求の範囲において列挙される主題の全ての変更及び均等物を含む。さらに、本明細書において他に指示されない限り、又はそうでなくても文脈によって明確に否定されない限り、本発明の全ての取り得る変形における上記の要素の任意の組み合わせが本発明によって包含される。 Accordingly, this invention includes all modifications and equivalents of the subject matter recited in the claims appended hereto as permitted by applicable law. Moreover, any combination of the above-described elements in all possible variations thereof is encompassed by the invention unless otherwise indicated herein or otherwise clearly contradicted by context.
Claims (15)
第1の方向に沿って光ビームによって前記サンプルを照明することと、 illuminating the sample with a beam of light along a first direction;
前記照明光ビームに応答して前記サンプルから放射されるブリルアン散乱光を収集することと、 collecting Brillouin scattered light emitted from the sample in response to the illumination light beam;
前記ブリルアン散乱光を、スペクトル分散を誘発する光学配置に送り、前記ブリルアン散乱光の空間スペクトルパターンを生成する検出ユニットに送ることと、 directing the Brillouin scattered light through an optical arrangement that induces spectral dispersion and to a detection unit that produces a spatial spectral pattern of the Brillouin scattered light;
なお、前記光学配置及び前記検出ユニットは第2の方向に沿って位置決めされる; wherein the optical arrangement and the detection unit are positioned along a second direction;
前記検出ユニット上で前記ブリルアン散乱光の前記空間スペクトルパターンを検出することと、 detecting the spatial spectral pattern of the Brillouin scattered light on the detection unit;
なお、前記照明光ビームに沿った前記サンプルの複数の点が同時に測定され、前記サンプルの複数の点の少なくとも1つが細胞核である; wherein multiple points of the sample along the illumination light beam are measured simultaneously, at least one of the multiple points of the sample being a cell nucleus;
前記検出ユニットにおいて、各空間点における前記スペクトルパターンを較正することと、 calibrating the spectral pattern at each spatial point in the detection unit;
前記検出された空間スペクトルパターンに基づいて、各測定サンプル点において前記1つ以上のブリルアン指標を計算することと、 calculating the one or more Brillouin indices at each measured sample point based on the detected spatio-spectral pattern;
前記計算されたブリルアン指標と正常細胞のブリルアン指標とを比較することによって、前記サンプル内に存在する癌性細胞を特定することと、 identifying cancerous cells present in the sample by comparing the calculated Brillouin index with the Brillouin index of normal cells;
を含む、方法。A method, including
ブリルアン分光法により可能となったラベルフリーサイトメトリーを使用して細胞の機械的シグネチャを取得することと、 Obtaining mechanical signatures of cells using label-free cytometry enabled by Brillouin spectroscopy;
なお、該取得することは、 It should be noted that obtaining the
第1の方向に沿って光ビームによって前記サンプルを照明することと、 illuminating the sample with a beam of light along a first direction;
前記照明光ビームに応答して前記サンプルから放射されるブリルアン散乱光を収集することと、 collecting Brillouin scattered light emitted from the sample in response to the illumination light beam;
前記ブリルアン散乱光を、スペクトル分散を誘発する光学配置に送り、前記ブリルアン散乱光の空間スペクトルパターンを生成する検出ユニットに送ることと、 directing the Brillouin scattered light through an optical arrangement that induces spectral dispersion and to a detection unit that produces a spatial spectral pattern of the Brillouin scattered light;
なお、前記光学配置及び前記検出ユニットは第2の方向に沿って位置決めされる; wherein the optical arrangement and the detection unit are positioned along a second direction;
前記検出ユニット上で前記ブリルアン散乱光の前記空間スペクトルパターンを検出することと、 detecting the spatial spectral pattern of the Brillouin scattered light on the detection unit;
なお、前記照明光ビームに沿った前記サンプルの複数の点が同時に測定され、前記サンプルの複数の点の少なくとも1つが細胞核である; wherein multiple points of the sample along the illumination light beam are measured simultaneously, at least one of the multiple points of the sample being a cell nucleus;
前記検出ユニットにおいて、各空間点における前記スペクトルパターンを較正することと、 calibrating the spectral pattern at each spatial point in the detection unit;
前記検出された空間スペクトルパターンに基づいて、各測定サンプル点において前記1つ以上のブリルアン指標を計算することと、を含む; calculating the one or more Brillouin indices at each measured sample point based on the detected spatio-spectral pattern;
前記細胞の核の機械的シグネチャに基づいて、細胞を、正常なラミンA/C発現を有する又はラミンA/C発現の抑制を伴うと分類することと、 classifying a cell as having normal Lamin A/C expression or with suppressed Lamin A/C expression based on the nuclear mechanical signature of said cell;
を含む、方法。A method, including
(i)マイクロ流体チャネルの内を流れており、
(ii)懸濁液内で不動であり、又は、
(iii)3Dゲルの小滴内に封入されている、
請求項1に記載の方法。 The at least one cell is
(i) flowing within the microfluidic channel;
(ii) immobile in suspension, or
(iii) encapsulated within droplets of the 3D gel;
The method of claim 1 .
Priority Applications (1)
| Application Number | Priority Date | Filing Date | Title |
|---|---|---|---|
| JP2022151236A JP2023002530A (en) | 2017-03-01 | 2022-09-22 | Cell classification based on mechanical signature of nucleus |
Applications Claiming Priority (3)
| Application Number | Priority Date | Filing Date | Title |
|---|---|---|---|
| US201762465230P | 2017-03-01 | 2017-03-01 | |
| US62/465,230 | 2017-03-01 | ||
| PCT/US2018/020509 WO2018160874A1 (en) | 2017-03-01 | 2018-03-01 | Cell classification based on mechanical signature of nucleus |
Related Child Applications (1)
| Application Number | Title | Priority Date | Filing Date |
|---|---|---|---|
| JP2022151236A Division JP2023002530A (en) | 2017-03-01 | 2022-09-22 | Cell classification based on mechanical signature of nucleus |
Publications (2)
| Publication Number | Publication Date |
|---|---|
| JP2020511636A JP2020511636A (en) | 2020-04-16 |
| JP7148530B2 true JP7148530B2 (en) | 2022-10-05 |
Family
ID=63370235
Family Applications (2)
| Application Number | Title | Priority Date | Filing Date |
|---|---|---|---|
| JP2019547270A Active JP7148530B2 (en) | 2017-03-01 | 2018-03-01 | Cell classification based on nuclear mechanical signatures |
| JP2022151236A Pending JP2023002530A (en) | 2017-03-01 | 2022-09-22 | Cell classification based on mechanical signature of nucleus |
Family Applications After (1)
| Application Number | Title | Priority Date | Filing Date |
|---|---|---|---|
| JP2022151236A Pending JP2023002530A (en) | 2017-03-01 | 2022-09-22 | Cell classification based on mechanical signature of nucleus |
Country Status (3)
| Country | Link |
|---|---|
| EP (1) | EP3589196A4 (en) |
| JP (2) | JP7148530B2 (en) |
| WO (1) | WO2018160874A1 (en) |
Families Citing this family (2)
| Publication number | Priority date | Publication date | Assignee | Title |
|---|---|---|---|---|
| CN117651761A (en) * | 2021-09-29 | 2024-03-05 | 日东纺绩株式会社 | Method for enriching cells or nuclei |
| CN114088588B (en) * | 2021-10-27 | 2024-04-09 | 西安理工大学 | Three-dimensional red blood cell size measuring method based on lens-free imaging |
Citations (3)
| Publication number | Priority date | Publication date | Assignee | Title |
|---|---|---|---|---|
| WO2007034802A1 (en) | 2005-09-20 | 2007-03-29 | Sumitomo Electric Industries, Ltd. | Elasticity/viscosity measuring device |
| JP2008039635A (en) | 2006-08-08 | 2008-02-21 | Sumitomo Electric Ind Ltd | Viscoelasticity measuring instrument |
| US20120129189A1 (en) | 2009-07-17 | 2012-05-24 | Chulan Kwon | Methods of Controlling Cell Proliferation |
Family Cites Families (5)
| Publication number | Priority date | Publication date | Assignee | Title |
|---|---|---|---|---|
| US4662742A (en) * | 1985-05-10 | 1987-05-05 | Becton, Dickinson And Company | Scatter/fluorescene beam splitter in a flow cytometry apparatus |
| US6002480A (en) * | 1997-06-02 | 1999-12-14 | Izatt; Joseph A. | Depth-resolved spectroscopic optical coherence tomography |
| WO2008137637A2 (en) * | 2007-05-04 | 2008-11-13 | The General Hospital Corporation | Methods, arrangements and systems for obtaining information associated with a sample using brillouin microscopy |
| EP2712299A4 (en) * | 2011-04-29 | 2014-12-10 | Gen Hospital Corp | Methods and arrangements for obtaining information and providing analysis for biological tissues |
| US9664297B2 (en) * | 2015-02-06 | 2017-05-30 | Mueller International, Llc | Main valve with grooved rigid internal structure |
-
2018
- 2018-03-01 WO PCT/US2018/020509 patent/WO2018160874A1/en unknown
- 2018-03-01 EP EP18761410.2A patent/EP3589196A4/en active Pending
- 2018-03-01 JP JP2019547270A patent/JP7148530B2/en active Active
-
2022
- 2022-09-22 JP JP2022151236A patent/JP2023002530A/en active Pending
Patent Citations (3)
| Publication number | Priority date | Publication date | Assignee | Title |
|---|---|---|---|---|
| WO2007034802A1 (en) | 2005-09-20 | 2007-03-29 | Sumitomo Electric Industries, Ltd. | Elasticity/viscosity measuring device |
| JP2008039635A (en) | 2006-08-08 | 2008-02-21 | Sumitomo Electric Ind Ltd | Viscoelasticity measuring instrument |
| US20120129189A1 (en) | 2009-07-17 | 2012-05-24 | Chulan Kwon | Methods of Controlling Cell Proliferation |
Non-Patent Citations (3)
| Title |
|---|
| ANTONACCI et al.,Biomechanics of subcellular structures by non-invasive Brillouin microscopy,SCIENTIFIC REPORTS,2016年11月15日,Vol.6/No.37217,PP.1-6 |
| ZHANG et al.,Brillouin flow cytometry for label-free mechanical phenotyping of the nucleus,Lab Chip,2017年02月14日,Vol.17/Iss.4,PP.663-670 |
| ZHANG et al.,Line-scanning Brillouin microscopy for rapid non-invasive mechanical imaging,SCIENTIFIC REPORTS,2016年10月14日,Vol.6/No.35398,PP.1-7 |
Also Published As
| Publication number | Publication date |
|---|---|
| JP2023002530A (en) | 2023-01-10 |
| EP3589196A4 (en) | 2020-12-23 |
| EP3589196A1 (en) | 2020-01-08 |
| JP2020511636A (en) | 2020-04-16 |
| WO2018160874A1 (en) | 2018-09-07 |
| WO2018160874A8 (en) | 2019-04-11 |
Similar Documents
| Publication | Publication Date | Title |
|---|---|---|
| JP7138050B2 (en) | Systems and methods for label-free cytometry based on Brillouin light scattering | |
| US10598594B2 (en) | Cell classification based on mechanical signature of nucleus | |
| US10732092B2 (en) | Analysis of single cell mechanical phenotyping for metastatic detection | |
| CA2715623C (en) | 3d imaging of live cells with ultraviolet radiation | |
| Zhang et al. | Brillouin flow cytometry for label-free mechanical phenotyping of the nucleus | |
| JP2023002530A (en) | Cell classification based on mechanical signature of nucleus | |
| US10365465B2 (en) | Apparatus and method for quantitative phase-gradient chirped-wavelength-encoded optical imaging | |
| CN103842769B (en) | Measured by quick, a large amount of parallel unicellular medicine responses of living cells interferometry | |
| Poon et al. | Brillouin imaging for studies of micromechanics in biology and biomedicine: From current state-of-the-art to future clinical translation | |
| CN103930768A (en) | Spectroscopy device, spectroscopy method, and computer program for spectroscopy, employing individual light-emitting particle detection | |
| JP7396902B2 (en) | Analysis of single cell mechanical phenotyping for metastasis detection | |
| Zhao et al. | Fourier transform infrared (FTIR) spectromicroscopic characterization of stem-like cell populations in human esophageal normal and adenocarcinoma cell lines | |
| Singh et al. | Identification of morphological and biochemical changes in keratin‐8/18 knock‐down cells using Raman spectroscopy | |
| Rimoli et al. | Demixing fluorescence time traces transmitted by multimode fibers | |
| Ragan et al. | Two-photon tissue cytometry | |
| AU2015210340B2 (en) | A System for 3D Imaging of Live Cells in an Optical Tomography System | |
| Fiore | Brillouin confocal microscopy in off-axis configuration | |
| Baria | Multimodal imaging for tissue diagnostics by combined two-photon and Raman microscopy | |
| Restall et al. | Metabolic light absorption, scattering and emission (MetaLASE) microscopy |
Legal Events
| Date | Code | Title | Description |
|---|---|---|---|
| A621 | Written request for application examination |
Free format text: JAPANESE INTERMEDIATE CODE: A621 Effective date: 20210301 |
|
| A977 | Report on retrieval |
Free format text: JAPANESE INTERMEDIATE CODE: A971007 Effective date: 20211130 |
|
| A131 | Notification of reasons for refusal |
Free format text: JAPANESE INTERMEDIATE CODE: A131 Effective date: 20211207 |
|
| A601 | Written request for extension of time |
Free format text: JAPANESE INTERMEDIATE CODE: A601 Effective date: 20220307 |
|
| A521 | Request for written amendment filed |
Free format text: JAPANESE INTERMEDIATE CODE: A523 Effective date: 20220607 |
|
| TRDD | Decision of grant or rejection written | ||
| A01 | Written decision to grant a patent or to grant a registration (utility model) |
Free format text: JAPANESE INTERMEDIATE CODE: A01 Effective date: 20220823 |
|
| A61 | First payment of annual fees (during grant procedure) |
Free format text: JAPANESE INTERMEDIATE CODE: A61 Effective date: 20220922 |
|
| R150 | Certificate of patent or registration of utility model |
Ref document number: 7148530 Country of ref document: JP Free format text: JAPANESE INTERMEDIATE CODE: R150 |