JP7074753B2 - Risk factor monitoring - Google Patents
Risk factor monitoring Download PDFInfo
- Publication number
- JP7074753B2 JP7074753B2 JP2019530087A JP2019530087A JP7074753B2 JP 7074753 B2 JP7074753 B2 JP 7074753B2 JP 2019530087 A JP2019530087 A JP 2019530087A JP 2019530087 A JP2019530087 A JP 2019530087A JP 7074753 B2 JP7074753 B2 JP 7074753B2
- Authority
- JP
- Japan
- Prior art keywords
- sample
- input signal
- pulse
- output signal
- risk factor
- Prior art date
- Legal status (The legal status is an assumption and is not a legal conclusion. Google has not performed a legal analysis and makes no representation as to the accuracy of the status listed.)
- Active
Links
Images


Classifications
-
- G—PHYSICS
- G01—MEASURING; TESTING
- G01N—INVESTIGATING OR ANALYSING MATERIALS BY DETERMINING THEIR CHEMICAL OR PHYSICAL PROPERTIES
- G01N27/00—Investigating or analysing materials by the use of electric, electrochemical, or magnetic means
- G01N27/26—Investigating or analysing materials by the use of electric, electrochemical, or magnetic means by investigating electrochemical variables; by using electrolysis or electrophoresis
- G01N27/28—Electrolytic cell components
- G01N27/30—Electrodes, e.g. test electrodes; Half-cells
- G01N27/327—Biochemical electrodes, e.g. electrical or mechanical details for in vitro measurements
- G01N27/3271—Amperometric enzyme electrodes for analytes in body fluids, e.g. glucose in blood
- G01N27/3274—Corrective measures, e.g. error detection, compensation for temperature or hematocrit, calibration
-
- A—HUMAN NECESSITIES
- A61—MEDICAL OR VETERINARY SCIENCE; HYGIENE
- A61B—DIAGNOSIS; SURGERY; IDENTIFICATION
- A61B5/00—Measuring for diagnostic purposes; Identification of persons
- A61B5/145—Measuring characteristics of blood in vivo, e.g. gas concentration, pH value; Measuring characteristics of body fluids or tissues, e.g. interstitial fluid, cerebral tissue
- A61B5/14532—Measuring characteristics of blood in vivo, e.g. gas concentration, pH value; Measuring characteristics of body fluids or tissues, e.g. interstitial fluid, cerebral tissue for measuring glucose, e.g. by tissue impedance measurement
-
- A—HUMAN NECESSITIES
- A61—MEDICAL OR VETERINARY SCIENCE; HYGIENE
- A61B—DIAGNOSIS; SURGERY; IDENTIFICATION
- A61B5/00—Measuring for diagnostic purposes; Identification of persons
- A61B5/145—Measuring characteristics of blood in vivo, e.g. gas concentration, pH value; Measuring characteristics of body fluids or tissues, e.g. interstitial fluid, cerebral tissue
- A61B5/14546—Measuring characteristics of blood in vivo, e.g. gas concentration, pH value; Measuring characteristics of body fluids or tissues, e.g. interstitial fluid, cerebral tissue for measuring analytes not otherwise provided for, e.g. ions, cytochromes
-
- A—HUMAN NECESSITIES
- A61—MEDICAL OR VETERINARY SCIENCE; HYGIENE
- A61B—DIAGNOSIS; SURGERY; IDENTIFICATION
- A61B5/00—Measuring for diagnostic purposes; Identification of persons
- A61B5/145—Measuring characteristics of blood in vivo, e.g. gas concentration, pH value; Measuring characteristics of body fluids or tissues, e.g. interstitial fluid, cerebral tissue
- A61B5/1468—Measuring characteristics of blood in vivo, e.g. gas concentration, pH value; Measuring characteristics of body fluids or tissues, e.g. interstitial fluid, cerebral tissue using chemical or electrochemical methods, e.g. by polarographic means
- A61B5/1473—Measuring characteristics of blood in vivo, e.g. gas concentration, pH value; Measuring characteristics of body fluids or tissues, e.g. interstitial fluid, cerebral tissue using chemical or electrochemical methods, e.g. by polarographic means invasive, e.g. introduced into the body by a catheter
-
- A—HUMAN NECESSITIES
- A61—MEDICAL OR VETERINARY SCIENCE; HYGIENE
- A61B—DIAGNOSIS; SURGERY; IDENTIFICATION
- A61B5/00—Measuring for diagnostic purposes; Identification of persons
- A61B5/72—Signal processing specially adapted for physiological signals or for diagnostic purposes
- A61B5/7271—Specific aspects of physiological measurement analysis
- A61B5/7275—Determining trends in physiological measurement data; Predicting development of a medical condition based on physiological measurements, e.g. determining a risk factor
-
- G—PHYSICS
- G01—MEASURING; TESTING
- G01N—INVESTIGATING OR ANALYSING MATERIALS BY DETERMINING THEIR CHEMICAL OR PHYSICAL PROPERTIES
- G01N33/00—Investigating or analysing materials by specific methods not covered by groups G01N1/00 - G01N31/00
- G01N33/48—Biological material, e.g. blood, urine; Haemocytometers
- G01N33/483—Physical analysis of biological material
- G01N33/487—Physical analysis of biological material of liquid biological material
- G01N33/49—Blood
Description
関連出願への相互参照
本出願は、「INTERTWINED ELECTRICAL INPUT SIGNALS」と題する、2016年12月5日に出願された米国仮出願第62/430,232号の恩典及び優先権を主張し、参照によりその全体が本明細書に組み込まれる。
Cross-reference to related applications This application claims the benefits and priorities of US Provisional Application No. 62 / 430,232 filed December 5, 2016, entitled "INTERTWINED ELECTRICAL INPUT SIGNALS", by reference. The whole is incorporated herein.
本開示の分野
本開示は、一般的に、全血試料のような血液試料中の内在種の存在を決定するための方法、システム、及び装置に関する。
Fields of the present disclosure The present disclosure generally relates to methods, systems, and devices for determining the presence of an endogenous species in a blood sample, such as a whole blood sample.
血糖モニタ(BGM)システムを用いる糖尿病治療にとって、全血試料のような血液試料中のグルコース濃度を報告することは、それだけでは通常の慣行である。グルコース濃度の決定を改善すること以外、血液中の他の種、例えば干渉内在種や非干渉内在種に対しては注意が払われない。したがって、血液試料から抽出され得る付加的な情報が失われている。 For the treatment of diabetes using a blood glucose monitor (BGM) system, reporting glucose levels in a blood sample, such as a whole blood sample, is by itself a normal practice. No attention is paid to other species in the blood, such as interfering and non-interfering endogenous species, other than improving the determination of glucose concentration. Therefore, additional information that can be extracted from the blood sample is lost.
最近の糖尿病研究は、いくつかの内在種と、糖尿病症状に対するそれらの関係性を示している。例えば、最近の研究は、高い尿酸値が糖尿病の発症に繋がること、そして高い尿酸値は糖尿病を患う可能性を引き上げさえし得ることを示している。研究は、尿酸値とメタボリック症候群の間の強い繋がりも示しているが、これは、インスリン抵抗性(即ち、身体がインスリンに反応できず、身体が生成するインスリンを使用できない)に関連付けられた医学的症状の組み合わせであり、人が心臓病及び糖尿病を患う可能性を高める。他の研究は、糖尿病の人々の、高コレステロール及びトリグリセリドと、糖尿病症状の悪化との間の繋がりを示している。 Recent diabetes studies have shown some endogenous species and their relationship to diabetic symptoms. For example, recent studies have shown that high uric acid levels can lead to the development of diabetes, and that high uric acid levels can even increase the likelihood of developing diabetes. Studies also show a strong link between uric acid levels and metabolic syndrome, a medicine associated with insulin resistance (ie, the body cannot respond to insulin and cannot use the insulin it produces). It is a combination of symptoms that increases the likelihood that a person will suffer from insulin and diabetes. Other studies have shown a link between high cholesterol and triglycerides in people with diabetes and exacerbation of diabetic symptoms.
したがって、グルコース濃度の決定において使用される試料から内在種についての情報を提供する方法、システム、及び装置が必要とされる。 Therefore, methods, systems, and devices are needed to provide information about endogenous species from the samples used in determining glucose concentrations.
概要
本開示の態様は、グルコース濃度のような検体濃度を決定するとともに、試料中の内在種についての1つ以上のパラメータ又はその濃度を報告することに関連付けられた装置、システム、及び方法を含む。内在種(即ち、人体において自然に存在する化学物質)は、例えば、尿酸、ドーパミン、トリグリセリド等を含み、血液試料中に存在する。装置、システム、及び方法は、検体濃度及び1つ以上のパラメータを経時的にログすることも含む。ログすることは患者プロファイリングを提供し、これは1より多い次元でデータを提供するので、試料が回収されたユーザについての長期的な健康を扱う付加的な治療行為を導くことができる。
Overview Aspects of the present disclosure include devices, systems, and methods associated with determining a sample concentration, such as glucose concentration, and reporting one or more parameters or concentrations thereof for an endogenous species in the sample. .. Endogenous species (ie, naturally occurring chemicals in the human body) include, for example, uric acid, dopamine, triglycerides, etc. and are present in blood samples. Devices, systems, and methods also include logging sample concentrations and one or more parameters over time. Logging provides patient profiling, which provides data in more than one dimension, so that additional therapeutic actions dealing with long-term health for the user from whom the sample was collected can be guided.
本開示の態様は、試料中の検体濃度の測定に関連して、試料に関係付けられたリスク因子パラメータを決定及びログするための装置、システム、及び方法をさらに含む。 Aspects of the present disclosure further include devices, systems, and methods for determining and logging risk factor parameters associated with a sample in connection with the measurement of sample concentration in the sample.
本開示のさらなる態様は、試料を電気化学的に分析する方法を含む。方法は、電極を介して入力信号を試料に印加することを含み、そこで入力信号は少なくとも1つの電位励起を有する。方法は、入力信号に対応する出力信号を測定することをさらに含む。方法は、出力信号に基づいて試料中の検体濃度を決定することも含む。方法は、検体以外の試料中の少なくとも1つの種に関係付けられた少なくとも1つのリスク因子パラメータを決定することをさらに含む。 A further aspect of the present disclosure comprises a method of electrochemically analyzing a sample. The method comprises applying an input signal to the sample via an electrode, where the input signal has at least one potential excitation . The method further comprises measuring the output signal corresponding to the input signal. The method also includes determining the sample concentration in the sample based on the output signal. The method further comprises determining at least one risk factor parameter associated with at least one species in a sample other than the sample.
本開示のさらなる態様は、患者プロファイルを生成する方法を含む。方法は、試薬を有する第1電極を介した第1入力信号を、試薬を欠く又は異なる標的種のための特定の試薬を有する第2電極を介した第2入力信号と組み合わせることを含む。組み合わせることは、第1電極を介して、少なくとも1つの電位励起と電位緩和を有する第1入力信号を試料に印加すること、及び、第2電極を介して、少なくとも1つの電位励起と電位緩和を有する第2入力信号を試料に印加することを含む。さらに、このような印加は、第1入力信号の少なくとも1つの電位励起が、第2入力信号の少なくとも1つの電位励起と同時ではないように起きる。方法は、第1入力信号に対応する第1出力信号と、第2入力信号に対応する第2出力信号を測定することをさらに含む。方法は、少なくとも第1出力信号と第2出力信号に基づいて、検体濃度を決定することをさらに含む。方法は、少なくとも第2出力信号に基づいて、試料中の少なくとも1つの内在種に関係付けられた少なくとも1つのリスク因子パラメータを決定することも含む。 A further aspect of the disclosure comprises a method of generating a patient profile. The method comprises combining a first input signal via a first electrode with a reagent with a second input signal via a second electrode that lacks a reagent or has a specific reagent for a different target species. The combination is to apply a first input signal with at least one potential excitation and potential relaxation to the sample via the first electrode, and at least one potential excitation and potential relaxation via the second electrode. It includes applying the second input signal having to the sample. Further, such an application occurs so that at least one potential excitation of the first input signal is not simultaneous with at least one potential excitation of the second input signal. The method further comprises measuring the first output signal corresponding to the first input signal and the second output signal corresponding to the second input signal. The method further comprises determining the sample concentration based on at least the first and second output signals. The method also includes determining at least one risk factor parameter associated with at least one endogenous species in the sample based on at least the second output signal.
本開示のさらなる態様は、血糖モニタ装置で試料を分析する方法を含む。方法は、血糖モニタ装置の素地電極を介して入力信号を試料に印加することを含み、そこで入力信号は定電圧パルスを含む。方法は、定電圧パルスに対応して、グルコース以外の試料中の少なくとも1つの内在種に関係付けられた少なくとも1つのリスク因子パラメータを決定することをさらに含む。方法は、血糖モニタ装置において記憶された患者プロファイル中で少なくとも1つのリスク因子パラメータをログすることも含む。 A further aspect of the present disclosure comprises a method of analyzing a sample with a blood glucose monitor. The method comprises applying an input signal to the sample via a substrate electrode of a blood glucose monitor, wherein the input signal comprises a constant voltage pulse. The method further comprises determining at least one risk factor parameter associated with at least one endogenous species in a sample other than glucose in response to a constant voltage pulse. The method also includes logging at least one risk factor parameter in the patient profile stored in the blood glucose monitor device.
本開示の態様は、上述された方法を実施又は実行するように構成された1つ以上の装置及びシステムをさらに含む。いくつかの態様において、1つ以上の装置と1つ以上のシステムの構成要素は、装置及び1つ以上の構成要素に、上述された方法の動作を実行させるコンピュータ読み取り可能な命令を含む。 Aspects of the present disclosure further include one or more devices and systems configured to perform or perform the methods described above. In some embodiments, the components of one or more devices and one or more systems include computer-readable instructions that cause the device and one or more components to perform the operations of the methods described above.
本開示のさらなる態様は、図面を参照してなされる様々な実施形様の詳細な説明の観点から当業者にとって明らかであり、図面の簡単な説明が以下で提供される。 Further embodiments of the present disclosure will be apparent to those of skill in the art in view of the detailed description of the various embodiments made with reference to the drawings, a brief description of the drawings provided below.
本開示は、様々な変更及び代替の形式が可能であり、いくつかの代表的な実施形態が図面で例として示されてきたが、本明細書において詳細に記載されるであろう。しかし本開示は、図示され記述された特定の形式に限定されるのを意図するものではないことを理解されたい。むしろ本出願は、添付の請求項によってさらに規定されるように、本開示の精神及び範囲内に入るすべての変更、均等物、及び代替物を包含する。 Various modifications and alternative forms are possible in this disclosure, and some representative embodiments have been illustrated by way of drawing, but will be described in detail herein. However, it should be understood that this disclosure is not intended to be limited to the particular form illustrated and described. Rather, the application includes all modifications, equivalents, and alternatives that fall within the spirit and scope of the present disclosure, as further defined by the appended claims.
詳細な説明
本開示は、多くの異なる形式での実施形態が可能であり、図面で示され、本発明及び概念の詳細な実施例において本明細書中で説明されるが、本開示は、本発明及び概念の原理の例示と考えられるべきであり、開示された実施例の広範な態様を図示された例に限定する意図はないことを理解されたい。本詳細な説明の目的のために、単数形は複数形を含み、(特に断らない限り)逆もまた同様である。用語「及び」と「又は」は、論理積及び論理和である。「すべての」という用語は「任意の及びすべての」を意味する。「任意の」という用語は「任意の及びすべての」を意味する。用語「含む」は、「限界なしに含む」を意味する。本詳細な説明及び添付の図面の目的について、コンマで区切られた数字又はハイフンで区切られた数字、但しそれ以外は同一、を含む以下に定義され且つ全体を通して使用される用語は、同一の用語を指し、そのような表記は交換可能である。例えば、iG1,1とiG1-1は同一である。
Detailed Description The present disclosure can be made in many different forms, is shown in the drawings, and is described herein in a detailed embodiment of the invention and concepts, but the present disclosure is herein. It should be considered as an illustration of the principles of the invention and concept, and it should be understood that there is no intention to limit the broad aspects of the disclosed examples to the illustrated examples. For the purposes of this detailed description, the singular includes the plural and vice versa (unless otherwise noted). The terms "and" and "or" are AND and OR. The term "all" means "any and all". The term "arbitrary" means "arbitrary and all". The term "include" means "include without limit". For the purposes of this detailed description and the accompanying drawings, the terms defined below and used throughout, including comma-separated or hyphen-separated numbers, but otherwise identical, are the same term. Such a notation is interchangeable. For example, iG1,1 and iG1-1 are the same.
本開示は、生物学的試料プロファイリングを提供する方法、システム、及び装置を含む。プロファイリングは、従来のグルコース濃度測定を含む。プロファイリングは、グルコースの他、血液試料中の1つ以上の内在種に関係付けられたパラメータ又はその濃度の決定も含む。(リスク因子パラメータとして以下で言及される)パラメータのプロファイリングは、単にグルコース濃度を提供することを超えて、試料が回収されたユーザの総計的な健康についてのより高い洞察を提供する。リスク因子パラメータは、以前は血液試料のグルコース濃度測定の間に不可能であったモニタリング、診断、及び/又は、医学的症状の検出を可能にする。 The disclosure includes methods, systems, and devices that provide biological sample profiling. Profiling includes conventional glucose concentration measurements. Profiling includes determining glucose as well as parameters or concentrations thereof associated with one or more endogenous species in a blood sample. Parameter profiling (referred to below as a risk factor parameter) goes beyond simply providing glucose concentration to provide greater insight into the overall health of the user from whom the sample was collected. Risk factor parameters enable monitoring, diagnosis, and / or detection of medical symptoms that were not previously possible during glucose concentration measurements in blood samples.
内在種は、人体において自然に存在する化学物質である。このような内在種は、全血試料のような試料で見られる任意の内在種であり得る。例えば、このような内在種は、中でも、尿酸(UA)、コレステロール(CH)、トリグリセリド(TG)、アスコルビン酸(ASA)、ビリルビン(BRB)、ドーパミン(Dop)、ヘモグロビン(Hb)、乳酸(LA)、及び、3-ヒドロキシ酪酸又はベータヒドロキシ酪酸(3-HBA)(又は一般的にはケトン)であり得る。ここで使用されるとき、内在種は、アセトアミノフェン(AA)の場合のように、結果として体内に存在する種になる物質の摂取に基づいて人体に存在する種を指すこともある。ここで言及される内在種は、リスク因子とも呼ばれ得る。なぜなら内在種の存在だけで、又はある一定の値で、ある一定の医学的症状のリスク又は存在を示すからである。内在種の濃度の存在に関係付けられた1つ以上のパラメータは、リスク因子パラメータと呼ばれ得る。 Endogenous species are chemical substances that naturally occur in the human body. Such an endogenous species can be any endogenous species found in samples such as whole blood samples. For example, such endogenous species include, among others, uric acid (UA), cholesterol (CH), triglyceride (TG), ascorbic acid (ASA), bilirubin (BRB), dopamine (Dop), hemoglobin (Hb), lactic acid (LA). ), And 3-hydroxybutyric acid or beta-hydroxybutyric acid (3-HBA) (or generally ketone). As used herein, an endogenous species may also refer to a species present in the human body based on the ingestion of a substance that results in the species present in the body, as in the case of acetaminophen (AA). The endogenous species referred to here can also be referred to as risk factors. This is because the presence of an endogenous species alone, or at a certain value, indicates the risk or presence of a certain medical condition. One or more parameters associated with the presence of concentrations of endogenous species may be referred to as risk factor parameters.
上記で簡単に議論されたように、内在種尿酸、トリグリセリド、及びコレステロールは普通に生じる内在種であり、尿酸は糖尿病への繋がりを示し、トリグリセリド及びコレステロールは、インスリン抵抗性及び糖尿病合併症への関連を示す。内在種3-HBAと乳酸は、それぞれ、過度な絶食と適度な運動によって誘発され得る。リスク因子パラメータ及び/又はこれらの内在種の濃度の決定は、血液試料のより全体的な像を提供し、グルコース濃度及び/又はパーセントヘマトクリット値だけでは提供できない情報を提供する。情報は、従来グルコース濃度だけでは容易に決定されなかった糖尿病管理が改善している又は悪化しているサインを含み得る。さらに、リスク因子パラメータを経時的にプロファイリングすることは、グルコース濃度のプロファイリング単独では容易に提供し得ないインスリン抵抗性などのような糖尿病に関連付けられた他の症状の洞察も提供できる。 As briefly discussed above, endogenous uric acid, triglycerides, and cholesterol are commonly occurring endogenous species, uric acid shows a link to diabetes, and triglycerides and cholesterol are associated with insulin resistance and diabetic complications. Show the relationship. Endogenous species 3-HBA and lactic acid can be induced by excessive fasting and moderate exercise, respectively. Determining risk factor parameters and / or concentrations of these endogenous species provides a more overall picture of blood samples and provides information that glucose concentrations and / or percent hematocrit values alone cannot provide. The information may include signs that diabetes management is improving or worsening, which was previously not easily determined by glucose concentration alone. In addition, profiling risk factor parameters over time can also provide insights into other symptoms associated with diabetes, such as insulin resistance, which glucose concentration profiling alone cannot easily provide.
決定されたグルコース濃度とともに、内在種の決定された濃度又は1つ以上のリスク因子パラメータを報告することは、ユーザに全血試料のプロファイルを提供する。このプロファイリングは、ユーザに長期的な患者プロファイル解決策を提供し、これは他の患者情報とともに全血プロファイルを提供することを含み、糖尿病治療/管理に有益である進行性の変化又はその欠如を経時的に反映する。このような長期期間に渡って血糖モニタ装置又は遠隔装置(例えばクラウドベースのサービス、医療サービス、患者データベース等)のメモリ中でグルコース濃度とともに複数のリスク因子パラメータをログすることによって、様々な糖尿病又は糖尿病前症状を有する個々が、グルコース濃度値だけでは示せなかった異なるパターンを示し得る。 Reporting the determined concentration of the endogenous species or one or more risk factor parameters, along with the determined glucose concentration, provides the user with a profile of the whole blood sample. This profiling provides the user with a long-term patient profile solution, which includes providing a whole blood profile along with other patient information, with progressive changes or lack thereof that are beneficial for diabetes treatment / management. Reflect over time. Various diabetes or by logging multiple risk factor parameters along with glucose concentration in the memory of a blood glucose monitor or remote device (eg, cloud-based services, medical services, patient databases, etc.) over such a long period of time. Individuals with pre-diabetic symptoms may exhibit different patterns not shown by glucose levels alone.
本開示の焦点は、全血のような血液のサンプリングにあるが、生物学上の試料は、唾液、汗、尿、母乳などのような任意の生物学上の試料であり得る。さらに本開示は、主に生物学上の試料中の検体としてグルコース濃度の決定に関するが、生物学上の試料中の濃度が決定される検体は、グルコース以外の他の様々な検体であり得る。 The focus of the present disclosure is on sampling blood such as whole blood, but the biological sample can be any biological sample such as saliva, sweat, urine, breast milk and the like. Further, the present disclosure relates mainly to the determination of glucose concentration as a sample in a biological sample, but the sample in which the concentration in a biological sample is determined can be various samples other than glucose.
図1は、本開示の態様による、全血試料のような試料中の1つ以上の内在種の1つ以上のリスク因子パラメータを決定して、経時的にログされた複数のリスク因子パラメータを含むプロファイルを作成できるバイオセンサシステム100の概略図を示す。バイオセンサシステム100は、測定装置102と試験センサ104を含み、これらは携帯型装置や手持ち式装置などのような機器に実装され得る。測定装置102と試験センサ104は、電気化学的センサシステムなどを実装するように適応され得る。バイオセンサシステム100は、試料中の内在種の1つ以上のリスク因子パラメータとともに、グルコースのような試料中の1つ以上の検体濃度を決定するために利用され得る。バイオセンサシステム100はまた、バイオセンサシステム100のユーザのプロファイルを作成するために、グルコース濃度とリスク因子パラメータを経時的にログして追跡するように利用され得る。プロファイルは例えば、糖尿病治療管理についての情報を提供する。情報は、糖尿病治療管理を調節して、患者の健康についてより完全な見解を提供するのに使用され得るリスク因子パラメータに基づくリスク因子についての情報を含み得る。特定の構成が示される一方、バイオセンサシステム100は、本開示の精神及び範囲から逸脱することなく、付加的な構成要素を有する又は有しないものを含む他の構成を有し得る。例えばいくつかの実施形態において、バイオセンサシステム100は、以下でさらに議論されるように、作用電極又は素地電極が欠けていることがある。
FIG. 1 determines multiple risk factor parameters for one or more endemic species in a sample, such as a whole blood sample, according to aspects of the present disclosure, with multiple risk factor parameters logged over time. FIG. 3 shows a schematic diagram of a
試験センサ104は、容器108を形成する基部106と、開口部112を有するチャネル110を有する。容器108は、部分的に閉じた容積を画定する。容器108は、水膨潤性ポリマー又は多孔性ポリマーマトリックスのような液体試料の保持を助ける組成物を含み得る。試験センサ104は、本開示の精神及び範囲から逸脱することなく、他の構成を有し得る。試験センサ104は、例えば、1~15マイクロリットル(μL)の体積のような、全血の単一の液滴を分析するように構成され得る。使用の際、液体を開口部112に導入することによって、分析のための液体試料が容器108に移される。液体試料は、チャネル110を通って流れ、それまで含まれていた空気を追い出して容器108を充填する。
The
試験センサ104は、3つの電極、即ち作用電極114、対向電極116、及び素地電極118を含み得る。しかし、いくつかの態様において、試験センサ104は、作用電極114と対向電極116のみ又は素地電極118と対向電極116のみのような2つの電極、1つより多い作用電極114、1つより多い対向電極116、及び/又は1つより多い素地電極118を含む3つより多い電極のように異なる数の電極を含み得る。例として、限定的にではなく、試験センサ104は2つの対向電極116を含むことができ、この2つの対向電極116は、別々に、作用電極114及び素地電極118と対になっている。
The
作用電極114は、1つ以上の酵素、結合剤、メディエータ、及び種等のような1つ以上の試薬を含み得る。1つ以上の試薬は、分析中に検体と反応して検体から電子を移動させ、したがって試料中の検体の酸化還元反応を促進する。測定装置102はその後、試験センサ104を通過する電流及び/又は電圧として電子を測定及び記録し、電流及び/又は電圧を試料の検体濃度の測定値に変換することができる。
The working
試薬に含まれる酵素又は類似する種は、酸化還元反応の間、第1の種から第2の種への電子移動を増強する。酵素又は類似する種は検体と反応して、発生した出力信号の一部分に特異性を提供し得る。メディエータが、酵素の酸化状態を維持するのに使用され得る。よって、酵素及びメディエータを有する作用電極114の場合において、作用電極114は、検体が電気化学的反応を受ける場所である。対向電極116は、反対の電気化学反応が起こる場所であり、これは作用電極114と対向電極116の間に電流が流れるのを可能にする。したがって、作用電極114で酸化が起こる場合、対向電極116で還元が起こる。
Enzymes or similar species contained in the reagents enhance electron transfer from the first species to the second species during the redox reaction. The enzyme or similar species may react with the sample to provide specificity for a portion of the generated output signal. Mediators can be used to maintain the oxidized state of the enzyme. Thus, in the case of a working
試薬に含まれる結合剤は、カルボキシルメチルセルロース(CMC)、HEC(ヒドロキシルエチルセルロース)及び/又はポリエチレンオキシド(PEO)のような、様々なタイプ及び分子量のポリマーを含み得る。試薬を一緒に結合することに加えて、結合剤は、赤血球を濾過すること、それらを血糖モニタ装置の場合におけるような作用電極114の表面を被覆するのを防ぐ又は抑止することを支援できる。
Binders included in the reagents may include polymers of various types and molecular weights, such as carboxylmethylcellulose (CMC), HEC (hydroxylethylcellulose) and / or polyethylene oxide (PEO). In addition to binding the reagents together, the binder can help filter the red blood cells and prevent or prevent them from covering the surface of the working
対照的に、素地電極118は、バイオセンサシステムの焦点である検体の酸化還元反応を促進する1つ以上の試薬は含まない。したがって、素地電極又は第2電極は、ここで記述され使用されるように、何も化学試薬が付加されていない電極、又は1つ以上の付加された不活性物質を有する電極であり得る。素地電極は、標的検体のための試薬を有するとして全体を通して記述された作用電極又は第1電極とは対照的に、標的検体用ではない付加された化学試薬も含み得る。したがって、「素地」と記述されるが、素地電極118は、作用電極114に含まれる検体の酸化還元反応を促進する、同じ又は同一の1つ以上の試薬を含まないだけである。素地電極118は、関心のある検体以外に、試料中の他種の酸化還元反応を促進する他の試薬を含み得る。代替的に、素地電極118は、その上又はその中に何の試薬も有しない単なる素地導体であり得る。
In contrast, the
素地電極118は、作用電極114上の1つ以上の試薬の効果が、素地電極118の電気的応答に影響を与えない又は影響を最小限にするように、作用電極114から上流に配置され得る。代替的に、いくつかの態様において、作用電極114と素地電極118は、実質的に化学的分離を有する別の容器108に配置され得る。したがって、バイオセンサシステム100の濃度決定の焦点である検体は、1つ以上の試薬を有する作用電極114に基づいて作用電極114に印加された電流又は電圧に反応する。検体は、1つ以上の試薬を有しない素地電極118に基づいて素地電極118に印加された電流又は電圧に対して反応しないか、又は最小限にしか反応しない。
The
1つの実施形態において、電極114~118は、実質的に同一平面内又は複数平面内にあり得る。1つの実施形態で、電極114~118は、容器108を形成する基部106の表面上に配置され得る。1つの実施形態では、電極114~118は、容器108内に延在又は突出し得る。
In one embodiment, the electrodes 114-118 can be substantially in the same plane or in a plurality of planes. In one embodiment, the electrodes 114-118 may be placed on the surface of the base 106 forming the
試験センサ104は、作用電極114、対向電極116、及び素地電極118に接続された導体を有する試料インターフェース120をさらに含む。第1出力信号又は作用出力信号のような出力信号は、作用電極114及び対向電極116に接続された導体のうちの1つ又は両方から測定され得る。第2出力信号又は素地出力信号のような別の出力信号は、対向電極116と素地電極118のうちの1つ又は両方から測定され得る。
The
測定装置102は、センサインターフェース124とディスプレイ126とに接続された電気回路122を含む。電気回路122は、信号発生器130に接続されたプロセッサ128、オプションの温度センサ132、及び記憶媒体134を含む。ディスプレイ126は、アナログ又はデジタルであり得る。ディスプレイ126は、LCD(液晶ディスプレイ)、LED(発光デバイス)、OLED(有機発光デバイス)、真空蛍光、電気泳動ディスプレイ(ED)、又は数値を示すように適合された他のディスプレイを含み得る。別の電子ディスプレイが使用され得る。ディスプレイ126は、プロセッサ128と電気的に通信する。ディスプレイ126は、例えばプロセッサ128と無線通信しているとき、測定装置102から分離され得る。代替的に、ディスプレイ126は、例えば測定装置102が、遠隔計算装置、薬剤投与ポンプなどと電気通信するとき、測定装置102から取り外され得る。
The measuring
信号発生器130は、プロセッサ128に対応して、センサインターフェース124に1つ以上の電気入力信号を提供する。電気入力信号は、生体液の試料に電気入力信号を印加するために、センサインターフェース124によって試料インターフェース120に送信され得る。電気入力信号は、以下でさらに説明されるように、電位又は電流であり、一定であるか、可変であるか、又はその組み合わせであり得る。電気入力信号は、単一パルスとして、又は複数のパルス、系列、又はサイクルにおいて印加され得る。よって、電気入力信号は、第1及び第2入力信号を含み得る。信号発生器130はまた、発生器レコーダとして、センサインターフェース124からの1つ以上の出力信号を記録し得る。したがって、1つ以上の出力信号は、第1及び第2出力信号を含み得る。2つ以上の電極から組み合わされた入力信号として全体を通して概して開示されているが、信号発生器130は、複数の組み合わされた入力信号よりむしろ1つの入力信号を発生し得る。
The
オプションの温度センサ132は、試験センサ104の容器108中の装置及び試料を含むバイオセンサシステムの温度を決定する。試料の温度は、出力信号から測定され計算されるか、又は周囲温度若しくはバイオセンサシステム100を実装する装置の温度の測定値と同一又は類似していると仮定され得る。温度は、サーミスタ、温度計、又は他の温度感知デバイスを使用して測定され得る。別の技術が試料温度を決定するのに使用され得る。
The
記憶媒体134は、磁気メモリ、光学メモリ、又は半導体メモリ、別の電子記憶装置、などに類するものであり得る。記憶媒体134は、固定記憶装置、メモリカードのようなリムーバブル記憶装置、遠隔アクセスされるものなどであってもよい。記憶媒体は、検体濃度と1つ以上のリスク因子パラメータをログするのに使用され得る。
The
電子プロセッサ128は、コンピュータ読み取り可能なソフトウェアコード及び記憶媒体134中に記憶されたデータを使用して、検体分析及びデータ処理を実行する。プロセッサ128は、センサインターフェース124における試験センサ104の存在に対応して検体分析及びデータ処理を開始し、ユーザ入力などに対応して試験センサ104への試料の印加を開始し得る。プロセッサ128は、電気入力信号をセンサインターフェース124に提供するように信号発生器130に指示する。プロセッサ128は、センサインターフェース124からの出力信号を受信する。出力信号のうちの少なくともいくつかは、試料に印加された入力信号に対応して発生される。他の出力信号が、試料の温度のような別の特徴に基づいて発生され得る。出力信号に対応して、プロセッサ128は、検体濃度と1つ以上のリスク因子パラメータを決定する。よって、検体濃度を決定するのに使用される同一の出力信号を含む出力信号に対応して、プロセッサ128は、試料中の1つ以上の内在種に関係付けられた1つ以上のリスク因子パラメータを決定できる。検体濃度及びリスク因子パラメータの決定は、出力信号の少なくとも一部分の関数である、バイオセンサシステム100において記憶された1つ以上の検体濃度相関と1つ以上のリスク因子相関とに基づく。
The
バイオセンサシステム100を通して試験片に入力信号を印加することは、標的検体濃度とリスク因子パラメータについての情報を提供する。情報は、バイオセンサシステム100がプロファイルを生成させるために試料を分析するたびにログされ得、例えば記憶媒体134又は遠隔記憶媒体においてログされ得る。プロファイルは、検体濃度とリスク因子パラメータが経時的に追跡されるのを可能にする。したがって、プロファイルは、患者に改善されたヘルスケア管理を提供し、検体濃度単独で、又は検体濃度のログでさえ単独で提供できない洞察を提供できる。
Applying an input signal to the specimen through the
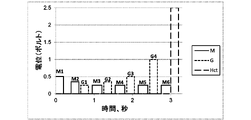
図2は、本開示の態様による、図1のシステム100のような電気化学的なバイオセンサシステムに対する例示的な組み合わされた入力信号を示すグラフである。組み合わされた入力信号は、ラベルM、G、及びHctによって表される3つの入力信号を含む。図1のバイオセンサシステム100に関して説明されるように、第1入力信号Mは、作用電極114と対向電極116に渡って印加される一定の電位(電圧)の電気パルス(又は単にパルス)を含む。しかしながら、第1入力信号は、ここで記述されるような作用電極と対向電極を有する任意のバイオセンサシステムへ印加され得る。いくつかの態様において、第1入力信号は、作用電極114を介して試料へ印加される信号に基づいて、作用入力信号として記述され得る。
FIG. 2 is a graph showing exemplary combined input signals for an electrochemical biosensor system such as the
示されるように、第1入力信号Mは6つのパルスを含み、これらは、ここでM1、M2、M3、M4、M5、及びM6のように、グラフ上で左から右に現れる順序で呼ばれる。パルスM1は電位0.5ボルト(V)を有し、パルスM2は電位0、35Vを有し、そして残りのパルスM3からM6は電位0.25Vを有する。第1入力信号Mのパルスは、作用電極114を介して1つ以上の試薬へ印加されるので、第1入力信号Mのパルスは一般的に、メディエータ又は別の測定可能な種を通して直接又は間接のいずれかで試料中の検体を探り出す。しかしながら、いくつかの実施形態において、第1入力信号のパルスは、試料中の内在種も探り出すことができる。
As shown, the first input signal M contains six pulses, which are here left-to-right on the graph, such as M 1 , M 2 , M 3 , M 4 , M 5 , and M 6 . They are called in the order in which they appear in. Pulse M 1 has a potential of 0.5 volt (V), pulse M 2 has a potential of 0, 35 V, and the remaining pulses M 3 to M 6 have a potential of 0.25 V. Since the pulse of the first input signal M is applied to one or more reagents via the working
第2入力信号Gは、定電位のパルスも含む。しかし、図1のバイオセンサシステム100に関して記述されたように、第2入力信号Gのパルスは、素地電極118と対向電極116を渡って印加される。しかし、第2入力信号は、ここで記述される素地電極と対向電極を有する任意のバイオセンサシステムに印加され得る。いくつかの態様において、第2入力信号は素地電極118を介して印加されるので、第2入力信号は素地の入力信号として記述され得る。
The second input signal G also includes a constant potential pulse. However, as described for the
示されるように、第2入力信号Gは、4つのパルスを含み、これらは、ここでグラフ上で左から右へ現れる順番で、G1、G2、G3、及びG4と呼ばれる。パルスG1は電位0.25Vを有し、パルスG2は電位0.35Vを有し、パルスG3は電位0.5Vを有し、パルスG4は電位1.0Vを有する。素地電極118は、試料中の標的検体に対応する1つ以上の試薬を含まないので、素地電極118を介して印加された第2入力信号Gのパルスは、一般的に、試料中の作用電極114によって標的とされる標的検体を探り出さない。代わりに、素地電極118を介して印加された第2入力信号Gのパルスは、電気化学的検出窓に渡って、内在種のような試料中の別の種を探り出す。よって、素地電極118に基づく測定は、様々な電位で他の酸化可能な種に対して大抵敏感であるが、第1入力信号Mと作用電極114によって分析される標的検体については敏感ではない。しかしながら、作用電極114に基づく測定は、意図される検体のみでなく、電気化学的検出窓に渡って試料中の他の種を探り出すのに使用され得る。さらに、作用電極114と素地電極118に基づく測定は、電気化学的検出窓に渡って試料中の他の種を探り出すために、組み合わせて使用することができる。
As shown, the second input signal G contains four pulses, which are now referred to as G 1 , G 2 , G 3 and G 4 in the order they appear from left to right on the graph. Pulse G 1 has a potential of 0.25 V, pulse G 2 has a potential of 0.35 V, pulse G 3 has a potential of 0.5 V, and pulse G 4 has a potential of 1.0 V. Since the
第3入力信号Hctは、全血試料の場合において試料のヘマトクリット値を決定するための単一のパルスである。図1のバイオセンサシステム100に関して記述されたように、第3入力信号Hctの単一パルスは、素地電極118と対向電極116と作用電極114との組み合わせに渡って印加された定電圧2.5Vである。代替的に、第3入力信号Hctの単一パルスは代わりに、作用電極114が開状態で、素地電極118と対向電極116とを渡って印加され得る。
The third input signal Hct is a single pulse for determining the hematocrit value of the sample in the case of a whole blood sample. As described for the
示されるように、第1及び第2入力信号のパルスは同時ではない(即ち、第1及び第2信号が同時に最大に電位励起されない、又は第1入力信号の最大電圧が第2入力信号のいかなる最大電圧とも重ならない)。さらに、第1入力信号の各パルスは、第1入力信号の次のパルスによって、第2入力信号の1パルス分だけ分離される。同時ではない第1及び第2入力信号のパルスと、第1入力信号のパルスを分離する第2入力信号のパルスとに基づいて、第1及び第2入力信号のパルスは組み合わされるとして記述される。 As shown, the pulses of the first and second input signals are not simultaneous (ie, the first and second signals are not maximally excited at the same time, or the maximum voltage of the first input signal is any of the second input signals. It does not overlap with the maximum voltage). Further, each pulse of the first input signal is separated by one pulse of the second input signal by the pulse following the first input signal. The pulses of the first and second input signals are described as being combined based on the pulses of the first and second input signals that are not simultaneous and the pulses of the second input signal that separate the pulses of the first input signal. ..
電圧パルスを印加しないとき、作用電極114と素地電極118は、開回路状態にあり得る。よって、第1入力信号のパルスの間、素地電極118は開回路状態にあってもよく、第2入力信号のパルスの間、作用電極114は開回路状態であってもよい。
When no voltage pulse is applied, the working
示されるように、第1及び第2入力信号の各パルスに、電気的電位緩和又は単に電位緩和が続く。具体的には、第1入力信号の各パルスには、第1入力信号に対する入力電位なし(又は開回路)のような電位緩和がすぐに続き、第2入力信号の各パルスには、第2入力信号に対してゼロ電位(又は開回路)のような電位緩和が直ちに続く。同一入力信号のパルス間の間隔は、その特定の信号の電位緩和とみなされ得る。すべての入力信号のパルス間の間隔、即ちパルスがないところは、システム100の電位緩和とみなされ得る。よって、第1入力信号のパルスの後、第1入力信号の次のパルスまで、第1入力信号の電位緩和がある。図2に示されるように、第1入力信号のパルスの後、第2入力信号の次のパルスまで、システムの電位緩和がある。第1又は第2入力信号内の電位緩和が続くパルスの組み合わせは、デューティサイクルであり得る。第1及び第2入力信号は、したがって、電位緩和が続くパルスの複数のデューティサイクルを含み得る。
As shown, each pulse of the first and second input signals is followed by electrical potential relaxation or simply potential relaxation . Specifically, each pulse of the first input signal is immediately followed by potential relaxation such as no input potential (or open circuit) for the first input signal, and each pulse of the second input signal is second. Potential relaxation such as zero potential (or open circuit) immediately follows the input signal. The spacing between pulses of the same input signal can be considered as potential relaxation of that particular signal. The spacing between the pulses of all input signals, i.e., where there are no pulses, can be considered potential relaxation in the
電位緩和の間に作用電極114若しくは素地電極118が開状態にあるか、又は、作用電極114及び/若しくは素地電極118に渡ってゼロ電位が印加されるとして記述されているが、作用電極114及び素地電極118の電位緩和は、電極114及び118が開状態にあることを要求しない。いくつかの態様において、作用電極114と素地電極118を通過する電流は、閉状態における電流の少なくとも半分であり、依然として電位緩和期間にあると考えられ得る。代替的に、作用電極又は素地電極は、電極に印加される電位が場合によっては標的検体又は種の酸化還元電位よりも低いときに、電位緩和の期間又は状態にあると見なされ得る。代替的に、作用電極又は素地電極は、電流が電位励起最大値での電流の少なくとも半分に、又は電位励起最大値での電流の流れに対して少なくとも1桁に減少したときに、電位緩和の期間又は状態にあると見なされ得る。
Although it is described that the working
さらに、ここで記述され使用される電位緩和は、例えば開回路の場合では、関心ある電極が電位励起に対する入力信号を有しないことを意味し得る。電位緩和は、全体として、バイオセンサシステムがすべての電極に対する入力信号を有しないことも意味し得る。組み合わせの間、1つの電極は電位緩和にあり得るが、他の電極は電位励起にあり、逆もまた同様である。しかしながら、バイオセンサシステムは、両方の電極(又は、2より多い電極の場合にはすべての電極)が電位緩和になるまで、電位緩和になることができない。標的検体に対して加えられた化学試薬を有する作用電極について、その特定の電極に対する電位緩和は、測定可能な種が、外部作用、例えば電気化学的反応なしに、酵素活性化化学反応から発生されるインキュベーション時間である。標的検体に対して付加された化学試薬を有しない作用電極について、以下で詳細に議論するように、電極の電位緩和時間は、電極への信号の入力の間、すべての電気化学的活性種(酸化可能及び還元可能)が空乏層への拡散によって補充されたときである。 Moreover, the potential relaxation described and used herein can mean that, for example, in the case of an open circuit, the electrode of interest has no input signal for potential excitation . Potential relaxation can also mean that the biosensor system as a whole does not have an input signal for all electrodes. During the combination, one electrode may be in potential relaxation , the other electrode in potential excitation , and vice versa. However, the biosensor system cannot be potential relaxed until both electrodes (or all electrodes in the case of more than two electrodes) are potential relaxed . For working electrodes with chemical reagents added to the target specimen, potential relaxation for that particular electrode is such that the measurable species is generated from an enzyme-activated chemical reaction without external action, eg, an electrochemical reaction. Incubation time. As discussed in detail below for working electrodes that do not have a chemical reagent added to the target sample, the electrode's potential relaxation time is all electrochemically active species (during the input of the signal to the electrode). Oxidable and reducible) are replenished by diffusion into the depleted layer.
各パルスならびに各電位緩和は幅を有し、それぞれパルス幅と電位緩和振幅とも呼ばれる。パルスと電位緩和の対は、デューティサイクルを定義する。各デューティサイクルについて、組み合わされたパルス幅と電位緩和振幅は、デューティサイクル幅又はデューティサイクル周期である。第1入力信号のパルスに対するパルス幅は、すべて同じ幅を有するか、すべて異なる幅を有するか、又は同じ幅と異なる幅の組み合わせを有し得る。同様に、第1入力信号の電位緩和に対する電位緩和振幅は、すべて同じ幅を有するか、すべて異なる幅を有するか、又は同じ幅と異なる幅の組み合わせを有し得る。第1入力信号のデューティサイクルのパルス幅と電位緩和振幅は、同じ幅であるか、又は異なる幅であり得る。加えて、第1入力信号のデューティサイクル幅又は周期は、同じ幅であるか、又は異なる幅であり得る。 Each pulse and each potential relaxation has a width, also called pulse width and potential relaxation amplitude , respectively. The pair of pulse and potential relaxation defines the duty cycle. For each duty cycle, the combined pulse width and potential relaxation amplitude is the duty cycle width or duty cycle period. The pulse widths for the pulses of the first input signal can all have the same width, all have different widths, or have a combination of the same width and different widths. Similarly, the potential relaxation amplitudes for the potential relaxation of the first input signal can all have the same width, all have different widths, or have a combination of the same width and different widths. The pulse width and potential relaxation amplitude of the duty cycle of the first input signal can be the same width or different widths. In addition, the duty cycle width or period of the first input signal can be the same width or different widths.
同様に、第2入力信号のパルスに対するパルス幅は、同じ幅を有するか、すべて異なる幅を有するか、又は同じ幅と異なる幅の組み合わせを有し得る。同様に、第2入力信号の電位緩和に対する電位緩和振幅は、すべて同じ幅を有するか、すべて異なる幅を有するか、又は同じ幅と異なる幅の組み合わせを有し得る。第2入力信号のデューティサイクルのパルス幅及び電位緩和振幅は、同じ幅であってもよく、又は異なる幅であってもよい。さらに、第2入力信号のデューティサイクルの幅又は周期は、同じ幅であるか、又は異なる幅であってもよい。再び、いくつかの態様にしたがうと、第1及び第2入力信号への最大電気エネルギーの印加は、同時ではないように起きる。強調されることは、本開示にしたがって電極に印加される電気エネルギーが、必ずしも任意の特定の形、振幅、又は持続時間に限定されないことである。 Similarly, the pulse widths for the pulses of the second input signal can have the same width, all have different widths, or have a combination of the same width and different widths. Similarly, the potential relaxation amplitudes for the potential relaxation of the second input signal can all have the same width, all have different widths, or have a combination of the same width and different widths. The pulse width and potential relaxation amplitude of the duty cycle of the second input signal may be the same width or different widths. Further, the width or period of the duty cycle of the second input signal may be the same width or different widths. Again, according to some embodiments, the application of maximum electrical energy to the first and second input signals occurs not at the same time. It is emphasized that the electrical energy applied to the electrodes according to the present disclosure is not necessarily limited to any particular shape, amplitude, or duration.
図2で示される第1信号について、パルスM1及びM2のパルス幅は0.2秒であり、パルスM3、M4、M5、M6のパルス幅は0.25秒である。第2入力信号について、パルスG1、G2、G3、及びG4に対するパルス幅は0.2秒である。第1入力信号の電位緩和振幅は、それぞれパルスM1~M5の後、0.2秒、0.35秒、0.35秒、0.35秒、及び0.35秒である。第2入力信号の電位緩和振幅は、それぞれパルスG1~G4の後、0.4秒、0.4秒、0.4秒、及び0.35秒である。ヘマトクリットパルスのパルス幅は0.2秒である。 For the first signal shown in FIG. 2, the pulse widths of the pulses M 1 and M 2 are 0.2 seconds, and the pulse widths of the pulses M 3 , M 4 , M 5 and M 6 are 0.25 seconds. For the second input signal, the pulse width for the pulses G1 , G2, G3 , and G4 is 0.2 seconds. The potential relaxation amplitudes of the first input signal are 0.2 seconds, 0.35 seconds, 0.35 seconds, 0.35 seconds, and 0.35 seconds after the pulses M 1 to M 5 , respectively. The potential relaxation amplitudes of the second input signal are 0.4 seconds, 0.4 seconds, 0.4 seconds, and 0.35 seconds after the pulses G1 to G4, respectively . The pulse width of the hematocrit pulse is 0.2 seconds.
図3は、本開示の態様による、図1のシステム100のような電気化学的バイオセンサシステムに対する例示的な組み合わされた入力信号を示す別のグラフである。上記の図2のように、図3は、ラベルM、G、及びHctによって表される3つの入力信号を示す。図1のバイオセンサシステム100に関して記述されるように、第1入力信号Mは、作用電極114と対向電極116に渡って印加される定電位のパルスを含む。しかしながら、第1入力信号は、ここで記述される作用電極と対向電極で任意のバイオセンサシステムに印加され得る。いくつかの態様において、第1入力信号は、作用電極114を介して試料に印加されている信号に基づいた作用入力信号として記述され得る。
FIG. 3 is another graph showing an exemplary combined input signal for an electrochemical biosensor system such as the
示されるように、第1入力信号Mは6つのパルスを含み、これらのパルスは、M1、M2、M3、M4、M5、及びM6として、グラフの左から右に現れる順序で呼ばれる。パルスM1は電位0.5ボルト(V)を有し、パルスM2は電位0、35Vを有し、残りのパルスM3からM6は電位0.25Vを有する。第1入力信号Mのパルスは、1つ以上の試薬を有する作用電極114を介して印加されるので、第1入力信号Mのパルスは、一般的に、メディエータ又は別の測定可能な種を通して直接又は間接のいずれかで、試料中の検体を探り出す。
As shown, the first input signal M contains six pulses, in which these pulses appear as M 1 , M 2 , M 3 , M 4 , M 5 , and M 6 from left to right in the graph. Called by. Pulse M 1 has a potential of 0.5 volt (V), pulse M 2 has a potential of 0, 35 V, and the remaining pulses M 3 to M 6 have a potential of 0.25 V. Since the pulse of the first input signal M is applied via the working
第2入力信号Gは、定電位のパルスも含む。図1のバイオセンサシステム100に関して記述されるように、第2入力信号Gのパルスは、素地電極118と対向電極116に渡って印加される。しかしながら、第2入力信号は、ここで記述された素地電極及び対向電極で任意のバイオセンサシステムに印加され得る。いくつかの態様において、第2入力信号は素地電極118を介して印加されるので、第2入力信号は素地入力信号として記述され得る。
The second input signal G also includes a constant potential pulse. As described for the
示されるように、第2入力信号Gは6つのパルスを含み、これらのパルスは、G1、G2、G3、G4、G5、及びG6のように、グラフの左から右に現れる順序で呼ばれる。パルスG1は電位0.25Vを有し、パルスG2は電位0.35Vを有し、パルスG3は電位0.5Vを有し、パルスG4は電位1.0Vを有し、パルスG5は電位1.3Vを有し、パルスG6は電位1.5Vを有する。素地電極118は、試料中の標的検体に対応する1つ以上の試薬を含まないので、素地電極118を介して印加される第2入力信号Gのパルスは、一般的に、試料中で作用電極114によって標的にされる標的検体を探り出さない。代わりに、素地電極118を介して印加される第2入力信号Gのパルスは、電気化学的検出窓に渡って、内在種のような試料中の他の種を探り出す。よって、素地電極118に基づく測定は、様々な電位で他の酸化可能な種について大抵敏感であるが、グルコースのような、第1入力信号Mと作用電極114によって分析される標的検体には敏感ではない。しかしながら、上記で議論されるように、作用電極114に基づく測定は、電気化学的検出窓を渡って、意図される検体のみでなく試料中の他の種を探り出すのにも使用され得る。さらに、作用電極114と素地電極118に基づく測定は、電気化学的検出窓を渡って、試料中の他の種を探り出すのに組み合わせて使用され得る。
As shown, the second input signal G contains six pulses, which are from left to right in the graph, such as G 1 , G 2 , G 3 , G 4 , G 5 , and G 6 . Called in the order in which they appear. Pulse G 1 has a potential of 0.25 V, pulse G 2 has a potential of 0.35 V, pulse G 3 has a potential of 0.5 V, pulse G 4 has a potential of 1.0 V, and pulse G has a potential of 1.0 V. 5 has a potential of 1.3 V and pulse G 6 has a potential of 1.5 V. Since the
図2及び図3は、試料から1つ以上のリスク因子パラメータを決定するとともに、試料中の検体、例えば血液試料中のグルコースを測定するのに使用され得る入力信号のほんの2つの例を示すに過ぎない。より一般的な場合において、第1及び第2入力信号は、より少ないパルスを有し得る一方、組み合わされた第1及び第2入力信号を依然として含んでいる。また、他の入力信号が本開示の精神及び範囲から逸脱することなく使用することができ、他の入力信号は、異なるバイオセンサシステムを使用して印加され得る。例えば、作用入力信号と素地入力信号は、組み合わされていない配置で印加され得る。代替的に、作用及び素地入力信号のうちの1つのみが印加され得る。例えば、バイオセンサシステムは、作用電極又は素地電極が無くてもよく、入力信号が素地電極又は作用電極のうちの残る1つのみを介して印加される。よって、本開示は、組み合わされた作用及び素地入力信号のみに限定されるものではなく、バイオセンサシステム100を使用して印加されることのみに限定されるものではない。よって、様々な内在種の検出は、作用及び/又は素地電極からの入力及び出力に依拠し得る。様々な内在種の検出はまた、1つ以上の特定の電圧で入力パルスに依拠してもよく、1つ以上のパルス電流減衰挙動、及び/又は、様々なパルスからの中間電流に依拠してもよい。そうするために、1つ以上の出力信号が、入力信号に対応して測定される。
2 and 3 show only two examples of input signals that can be used to determine one or more risk factor parameters from a sample and to measure glucose in a sample, eg, a blood sample. Not too much. In the more general case, the first and second input signals may have fewer pulses, while still containing the combined first and second input signals. Also, other input signals can be used without departing from the spirit and scope of the present disclosure, and other input signals can be applied using different biosensor systems. For example, the action input signal and the substrate input signal can be applied in an uncombined arrangement. Alternatively, only one of the action and substrate input signals may be applied. For example, a biosensor system may be free of a working electrode or a working electrode and the input signal is applied through only the remaining one of the working electrode or the working electrode. Therefore, the present disclosure is not limited to the combined action and substrate input signal, but is not limited to the application using the
図4は、本開示の態様による、図2の第1及び第2入力信号に対応して測定された第1及び第2出力信号を示すグラフである。プロットされた値は、mVの未処理信号ユニットにおいて記録された電流であり、これは既知の電気的ゲインを有するμAの電流ユニットに比例する。それぞれの電極対を渡って印加される、定電圧である第1及び第2入力信号に基づいて、第1及び第2出力信号は、第1及び第2入力信号に応答して試料の結果として生じる出力電流の電流測定の測定値(amperometric measurements)を表す。しかしながら、入力信号は印加され、結果として対応する出力信号の電圧測定の測定値(voltammetric measurements)になり得る。任意の数の電流測定値又は値は、第1及び第2入力信号のパルスのそれぞれの1つに対応して測定され得る。説明の利便性のため、図4に示されるように、以下で説明される特定数の電流は、第1及び第2入力信号のパルスに対応して測定されたものである。 FIG. 4 is a graph showing the first and second output signals measured corresponding to the first and second input signals of FIG. 2 according to the aspect of the present disclosure. The plotted values are the currents recorded in the mV unprocessed signal unit, which is proportional to the μA current unit with known electrical gain. Based on the constant voltage first and second input signals applied across each pair of electrodes, the first and second output signals are the result of the sample in response to the first and second input signals. Represents an amperometric measurements of the resulting output current. However, the input signal is applied and can result in voltage measurements of the corresponding output signal. Any number of current measurements or values can be measured corresponding to each one of the pulses of the first and second input signals. For convenience of description, as shown in FIG. 4, the specific number of currents described below are measured corresponding to the pulses of the first and second input signals.
第1出力信号に関して、4つの出力電流が、最初の2つのMパルス、Μ1とM2に対応して測定され、5つの出力電流が、最後の4つのMパルスM3~M6に対応して測定された。これらの出力電流は、スキームiMN,Lにしたがって指定され、ここで、iは電流を表し、Mは電流が第1入力信号に対応することを表し、Nは入力信号のパルス数を表し、そしてLは電流又はその特定のパルス数に対する測定数を表す。よって、例えば、iM1,1は、第1入力信号の第1パルスに対する第1電流を表し、iM6,5は、第1入力信号の第6パルスに対する第5電流を表す。 For the first output signal, four output currents are measured corresponding to the first two M pulses, Μ 1 and M 2 , and five output currents correspond to the last four M pulses M 3 to M 6 . Was measured. These output currents are specified according to schemes i MN, L , where i represents the current, M represents the current corresponding to the first input signal, and N represents the number of pulses in the input signal. And L represents the number of measurements for the current or its specific number of pulses. Therefore, for example, i M1 and 1 represent the first current with respect to the first pulse of the first input signal, and i M6 and 5 represent the fifth current with respect to the sixth pulse of the first input signal.
第2出力信号に関して、4つの電流が、最初の4つのGパルス、G1~G4に対応して測定された。これらの電流は、スキームiGN,Lにしたがって指定され、ここで、iは電流を表し、Gは、電流が第2入力信号に対応することを表し、Nは入力信号のパルス数を表し、Lは電流又はその特定のパルス数に対する測定数を表す。よって、例えば、iG2,2は、第2入力信号の第2パルスの第2電流を表し、iG3,4は、第2入力信号の第3のパルスの第4の電流を表す。 For the second output signal, four currents were measured corresponding to the first four G pulses, G1 to G4. These currents are specified according to schemes iGN, L , where i represents the current, G represents the current corresponding to the second input signal, and N represents the number of pulses in the input signal. L represents the number of measurements for the current or its specific number of pulses. Thus, for example, i G2 , 2 represents the second current of the second pulse of the second input signal, and i G3 , 4 represents the fourth current of the third pulse of the second input signal.
第3入力信号のヘマトクリット決定に関して、4つの電流値が単一のパルスHctに対応して測定された。これらの電流は、スキームiHct,Lにしたがって指定され、ここで、iは電流を表し、Hctは電流がヘマトクリット値に関連付けられていることを表し、Lはヘマトクリットパルスに対する電流又は測定番号を表す。 For the hematocrit determination of the third input signal, four current values were measured corresponding to a single pulse Hct. These currents are specified according to the scheme i Hct, L , where i represents the current, Hct represents the current associated with the hematocrit value, and L represents the current or measurement number for the hematocrit pulse. ..
素地電極118は、濃度を測定しようとする標的検体の酸化又は還元を促進する試薬を有しないので、電流の測定値は、図4に示されるように、第2入力信号に対応して比較的一定であった。代わりに、電流の測定値は、内在種のような、検体の酸化に無関係な試料中の種の大部分を示した。さらに、第2入力信号に対して変化する電位で電圧パルスを試料に印加することにより、内在種のような、様々な電位で酸化可能な種をサンプリングした。したがって、第2入力信号の間、素地電極118の電圧パルスは、第1入力信号の間に作用電極114によって感知された検体とは異なる全血試料中の試料の種を感知し、変化する電位パルスを通して、内在種を探り出すことを含む、全血環境プロファイルをプローブする。しかしながら、作用電極114の電圧パルスも全血試料中の内在種を探り出すことができる。
Since the
前述の測定にしたがうと、第1及び第2入力信号は、単独又は組み合わせての使用のいずれでも、リスク因子パラメータを発生するのに使用され得る。リスク因子パラメータは、試料中の内在種の存在を決定し、場合によっては内在種の濃度との関連を示すか、又は決定さえする。リスク因子パラメータは、探り出される特定の内在種に依存する様々なタイプのパラメータであり得る。例えば、場合によっては、第1出力信号と第2出力信号の1つ以上の電流は、リスク因子パラメータであり得る。さらに又は代替として、第1出力信号の、第2出力信号の、及び/又は第2出力信号に対する第1出力信号の電流の比は、リスク因子パラメータであり得る。第1又は第2出力信号に基づくリスク因子パラメータは、パルス内比又はパルス間比に基づくことができる。 According to the above measurements, the first and second input signals can be used to generate risk factor parameters, either alone or in combination. Risk factor parameters determine the presence of an endogenous species in a sample and, in some cases, show or even determine an association with the concentration of the endogenous species. Risk factor parameters can be various types of parameters that depend on the particular endogenous species being sought. For example, in some cases, one or more currents of the first output signal and the second output signal can be risk factor parameters. Further or as an alternative, the ratio of the current of the first output signal to the second output signal and / or the second output signal of the first output signal can be a risk factor parameter. The risk factor parameters based on the first or second output signal can be based on the intra-pulse ratio or the inter-pulse ratio.
パルス内比は、同じパルスに対応する電流の測定値に基づく比である。例えば、第1出力信号の電流の測定値に基づくパルス内比は、スキームRN=iMN,nth/iMN,1stにしたがって指定される。ここで、RNは、第1出力信号のパルスNに対するパルス内比を表し、nthはパルスNに対する最後の電流を表し、1stはパルスNに対する最初の電流を表す。再び図4を参照すると、一例として、第1出力信号は、第1入力信号の6つのパルスに対して、R1=iM1,4/iM1,1、R2=iM2,4/iM2,1、R3=iM3,5/iM3,1、R4=iM4,5/iM4,1、R5=iM5,5/iM5,1、及びR6=iM6,5/iM6,1の6つのパルス内比を含む。 The intra-pulse ratio is a ratio based on the measured value of the current corresponding to the same pulse. For example, the intra-pulse ratio based on the measured value of the current of the first output signal is specified according to the scheme RN = i MN , nth / i MN, 1st . Here, RN represents the ratio of the first output signal to the pulse N in the pulse, nth represents the last current with respect to the pulse N, and 1st represents the first current with respect to the pulse N. Referring again to FIG. 4, as an example, the first output signal has R 1 = i M1,4 / i M1,1 and R2 = i M2,4 / i for the six pulses of the first input signal. M2,1 , R3 = i M3,5 / i M3,1 , R4 = i M4,5 / i M4,1 , R5 = i M5,5 / i M5,1 , and R6 = i M6 , Includes 6 intra-pulse ratios of 5 / i M6,1 .
第2出力信号の電流の測定値に基づくパルス内比は、スキームRGN=iGN,nth/iGN,1stにしたがって指定される。ここで、RGNは、第2出力信号のパルスNに対するパルス内比を表し、残りの変数は、第1出力信号のパルス内比について上記で挙げられたものと同様の値を表す。再び図4を参照すると、第2出力信号は、第2出力信号の4つのパルスに対して、RG1=iG1,4/iG1,1、RG2=iG2,4/iG2,1、RG3=iG3,4/iG3,1、及びRG4=iG4,4/iG4,1の4つのパルス内比を含む。 The in-pulse ratio based on the measured value of the current of the second output signal is specified according to the scheme RG N = i GN, nth / i GN, 1st . Here, RG N represents the in-pulse ratio of the second output signal to the pulse N, and the remaining variables represent the same values as those mentioned above for the in-pulse ratio of the first output signal. Referring to FIG. 4 again, the second output signal has RG 1 = i G1,4 / i G1,1 and RG2 = i G2,4 / i G2,1 for the four pulses of the second output signal. , RG 3 = i G3,4 / i G3,1 and RG 4 = i G4,4 / i G4,1 .
パルス間比は、同じ信号であるが信号内の異なるパルスに対応する電流の測定値に基づく比である。例えば、第1出力信号の電流の測定値に基づくパルス間比は、スキームRNO=iMN,nth/iMO,nthにしたがって指定される。ここで、RNOは、第1出力信号のパルスOに対するパルスNのパルス間比を表し、nthは、パルスNとパルスOの両方に対する最後の電流である。図4を参照すると、第1出力信号は、R21=iM2,4/iM1,4、R31=iM3,5/iM1,4、R32=iM3,5/iM2,4、R41=iM4,5/iM1,4、R42=iM4,5/iM2,4、R43=iM4,5/iM3,5、R51=iM5,5/iM1,4、R52=iM5,5/iM2,4、R53=iM5,5/iM3,5、R54=iM5,5/iM4,5、R61=iM6,5/iM1,4、R62=iM6,5/iM2,4、R63=iM6,5/iM3,5、R64=iM6,5/iM4,5、及びR65=iM6,5/iM5,5のパルス間比を含む。他のパルス間比のタイプは、パルスの最初の電流と別のパルスの最後の電流との比、及びパルスの最後の電流と別のパルスの最初の電流との比などを含み得る。これらのパルス間比のタイプの例は、R’21=iM2,1/iM1,4、及びR”21=iM2,4/iM1,1である。 The pulse-to-pulse ratio is a ratio based on the measured value of the current corresponding to different pulses in the signal but in the same signal. For example, the pulse-to-pulse ratio based on the measured value of the current of the first output signal is specified according to the scheme R NO = i MN, nth / i MO, nth . Here, R NO represents the pulse-to-pulse ratio of the pulse N to the pulse O of the first output signal, and nth is the final current for both the pulse N and the pulse O. Referring to FIG. 4, the first output signal is R 21 = i M2,4 / i M1,4 , R 31 = i M3,5 / i M1,4 , R 32 = i M3,5 / i M2,4 . , R 41 = i M4,5 / i M1,4 , R 42 = i M4,5 / i M2 , 4, R 43 = i M4,5 / i M3 , 5, R 51 = i M5 , 5 / i M1 , 4 , R 52 = i M5,5 / i M2 , 4, R 53 = i M5,5 / i M3 , 5, R 54 = i M5, 5 / i M4,5 , R 61 = i M6 , 5 / i M1,4 , R 62 = i M6 , 5 / i M2 , 4, R 63 = i M6, 5 / i M3 , 5, R 64 = i M6, 5 / i M4,5 , and R 65 = i M6 , 5 / i M5 , 5 inter-pulse ratio. Other types of inter-pulse ratios may include the ratio of the first current of a pulse to the last current of another pulse, and the ratio of the last current of a pulse to the first current of another pulse. Examples of these pulse-to-pulse ratio types are R'21 = i M2,1 / i M1,4 , and R " 21 = i M2,4 / i M1,1 .
第2出力信号の電流の測定値に基づくパルス間比は、スキームRGNO=iGN,nth/iGO,nthにしたがって指定され、ここで、RGNOは、第2出力信号のパルスOに対するパルスNのパルス間比を表し、残りの変数は、第1出力信号のパルス内比について上に挙げた値を表す。図4を参照して、第2出力信号は、RG21=iG2,4/iG1,4、RG31=iG3,5/iG1,4、RG32=iG3,5/iG2,4、RG41=iG4,5/iG1,4、RG42=iG4,5/iG2,4、RG43=iG4,5/iG3,5、RG51=iG5,5/iG1,4、RG52=iG5,5/iG2,4、RG53=iG5,5/iG3,5、RG54=iG5,5/iG4,5、RG61=iG6,5/iG1,4、RG62=iG6,5/iG2,4、RG63=iG6,5/iG3,5、RG64=iG6,5/iG4,5、及びRG65=iG6,5/iG5,5のパルス間比を含む。 The pulse-to-pulse ratio based on the measured value of the current of the second output signal is specified according to the scheme RG NO = i GN, nth / i GO, nt , where RG NO is the pulse to pulse O of the second output signal. Represents the inter-pulse ratio of N, and the remaining variables represent the values listed above for the intra-pulse ratio of the first output signal. With reference to FIG. 4, the second output signal is RG 21 = i G2,4 / i G1,4 , RG 31 = i G3 , 5 / i G1,4 , RG 32 = i G3 , 5 / i G2. 4 , RG 41 = i G4,5 / i G1,4 , RG 42 = i G4,5 / i G2 , 4, RG 43 = i G4 , 5 / i G3 , 5, RG 51 = i G5 , 5 / i G1,4 , RG 52 = i G5,5 / i G2,4 , RG 53 = i G5,5 / i G3,5 , RG 54 = i G5,5 / i G4,5 , RG 61 = i G6,5 / I G1,4 , RG 62 = i G6 , 5 / i G2 , 4, RG 63 = i G6, 5 / i G3 , 5, RG 64 = i G6 , 5 / i G4,5 , and RG 65 = i Includes pulse-to-pulse ratios of G6,5 / i G5,5 .
第1及び第2出力信号に基づく比は、組み合わされたパルス比と見なされる。第1出力信号と第2出力信号の電流の測定値に基づく組み合わされたパルス比は、スキームMNGO=iMN,nth/iGN,nthにしたがって指定され、ここで、MNは、第1出力信号のパルスN、GNは、第2出力信号のパルスOであり、nthは、パルスN又はOに対する最後の電流の測定値を表す。よって、例えば、組み合わされたパルスは、M1G1=iM1,4/iG1,4、M1G2=iM1,4/iG2,4、M1G3=iM1,4/iG3,4、M1G4=iM1,4/iG4,4、M2G1=iM2,4/iG1,4、M2G2=iM2,4/iG2,4、M2G3=iM2,4/iG3,4、M2G4=iM2,4/iG4,4、M3G1=iM3,5/iG1,4、M3G2=iM3,5/iG2,4、M3G3=iM3,5/iG3,4、M3G4=iM3,5/iG4,4、M4G1=iM4,5/iG2,4、M4G2=iM4,5/iG2,4、M4G3=iM4,5/iG3,4、M4G4=iM4,5/iG4,4、M5G1=iM5,5/iG1,4、M5G2=iM5,5/iG2,4、M5G3=iM5,5/iG3,4、M5G4=iM5,5/iG4,4、M6G1=iM6,5/iG1,4、M6G2=iM6,5/iG2,4、M6G3=iM6,5/iG3,4、及びM6G4=iM6,5/iG4,4を含むことになる。 Ratios based on the first and second output signals are considered as combined pulse ratios. The combined pulse ratio based on the measured values of the currents of the first output signal and the second output signal is specified according to the scheme MNGO = i MN , nth / i GN, nt , where MN is. The pulses N and GN of the first output signal are the pulses O of the second output signal, and nth represents the measured value of the last current with respect to the pulse N or O. So, for example, the combined pulses are M 1 G 1 = i M1,4 / i G1,4 , M 1 G 2 = i M1,4 / i G2 , 4, M 1 G 3 = i M1,4 / i G3,4 , M1 G4 = i M1,4 / i G4,4 , M2 G1 = i M2,4 / i G1,4 , M2 G2 = i M2,4 / i G2,4 , M 2 G 3 = i M2,4 / i G3 , 4, M 2 G 4 = i M2 , 4 / i G4 , 4, M 3 G 1 = i M3 , 5 / i G1 , 4, M 3 G 2 = i M3 , 5 / i G2 , 4, M 3 G 3 = i M 3,5 / i G 3, 4, M 3 G 4 = i M 3, 5 / i G 4, 4, M 4 G 1 = i M 4, 5 / i G2, 4, M 4 G 2 = i M4,5 / i G2 , 4, M 4 G 3 = i M 4, 5 / i G 3, 4 , M 4 G 4 = i M 4, 5 / i G 4, 4 , M 5 G 1 = i M5 , 5 / i G1 , 4, M 5 G 2 = i M5 , 5 / i G2 , 4, M 5 G 3 = i M5 , 5 / i G3 , 4, M 5 G 4 = i M5 , 5 / i G4 , 4, M 6 G 1 = i M6 , 5 / i G1 , 4, M 6 G 2 = i M6 , 5 / i G2 , 4, M 6 G 3 = i M6 , 5 / It will include i G3 , 4 and M 6 G 4 = i M 6, 5 / i G 4, 4.
よって、第1及び第2出力信号に対するパルス内比及びパルス間比、並びに第1及び第2出力信号間の組み合わされたパルス比のうちの1つ以上は、内在種の存在の決定で使用されるリスク因子パラメータであり得る。これらのリスク因子パラメータは、以下でさらに議論されるように、内在種の濃度に相互に関連することができ、検体濃度に関連する医学的症状、例えば糖尿病治療管理、又は他の症状、例えば痛風を追跡してモニタリングするようにログされ得る。 Thus, one or more of the intra-pulse and inter-pulse ratios to the first and second output signals and the combined pulse ratios between the first and second output signals are used in determining the presence of endogenous species. Can be a risk factor parameter. These risk factor parameters can be correlated with the concentration of the endogenous species, as further discussed below, and medical symptoms related to sample concentration, such as diabetes treatment management, or other symptoms, such as gout. Can be logged for tracking and monitoring.
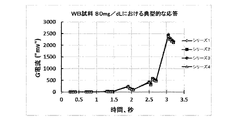
図4と同様に、図5Aは、本開示の態様による、グルコース80mg/dLを有する全血試料(例えば、全血試料シリーズ1~4)に印加される図3のMパルスに対する例示的な応答を示す。プロットされた値は、mVの未処理信号ユニットにおいて記録された電流であり、これは既知の電気的ゲインを有するμAの電流ユニットに比例する。6つのMパルスM1~M6に対応して、4つの電流測定がパルスM1とM2に対してとられ、5つの電流測定がパルスM3~M6に対してとられる。Mパルス6の終了電流、又は他のパルスの電流が、グルコース濃度の決定のための代表的な信号として使用され得る。変換関数と補償方法、例えば米国特許出願第12/329,698号及び米国特許出願第13/117,872号で開示された傾きベースの補償は、このそれぞれが参照によってその全体が本明細書に組み込まれ、米国特許出願第13/153,793号で開示された複雑なインデックス補償は、参照によってその全体が本明細書に組み込まれ、及び/又は米国特許出願第13/053,722号で開示された残余誤差補償は、参照によってその全体が本明細書に組み込まれるとともに、Gパルスからの組み合わされた又は分離された電流測定を使用して、グルコースを表す信号と中間信号から正確なグルコース値が決定され得る。図5Bは、同じベースライングルコースを有する全血試料に印加される図3のGパルスに対する例示的な電流応答を示す。6つのGパルスG1~G6に対応して、4つの電流測定がパルスG1~G4に対してとられ、2つ及び3つの電流測定がパルスG5及びG6に対してそれぞれとられる。同じパルス間比及びパルス内比は、図4に関して上記で議論されたように、図5で示される電流測定値から決定され得る。
Similar to FIG. 4, FIG. 5A is an exemplary response to the M pulse of FIG. 3 applied to a whole blood sample having 80 mg / dL glucose (eg, whole blood sample series 1-4) according to aspects of the present disclosure. Is shown. The plotted values are the currents recorded in the mV unprocessed signal unit, which is proportional to the μA current unit with known electrical gain. Corresponding to the six M pulses M 1 to M 6 , four current measurements are taken for the pulses M 1 and M 2 and five current measurements are taken for the pulses M 3 to M 6 . The end current of the
図2~5は、第1及び第2入力信号と、対応する第1及び第2出力信号との多くの可能性あるプロットのうちの2つのみを示す。第1及び第2入力信号と、結果となる第1及び第2出力信号の特徴は、上述された変動のいずれかにしたがって変化され得る。さらに、図2~図5で示された入力及び出力信号は説明の目的であり、限定することを意味するのではない。ここで記述されたリスク因子パラメータは、開示された入力及び出力信号全体を印加及び/若しくは測定することなしに決定され得るか、又は、異なる入力及び/若しくは出力信号を印加することによって決定され得る。 FIGS. 2-5 show only two of the many possible plots of the first and second input signals and the corresponding first and second output signals. The characteristics of the first and second input signals and the resulting first and second output signals can be varied according to any of the variations described above. Furthermore, the input and output signals shown in FIGS. 2-5 are for illustration purposes only and are not meant to be limiting. The risk factor parameters described herein can be determined without applying and / or measuring the entire disclosed input and output signals, or by applying different input and / or output signals. ..
内在種に対する出力信号からリスク因子パラメータを決定することに適用されるとき、一般的に、Gパルスからの結果となる3つの基本的な電流プロファイルがあり得る。(1)内在種の直接酸化の結果として低電圧及び高電圧での正電流を有するもの、(2)低電圧から中電圧での直接酸化電流を有しない又は乏しく、有限量の高い電圧での正酸化電流のみを有するもの、並びに(3)直接酸化ではないがパルス内の電流減衰プロセスに影響する電流を有するもの、及び/又はより高い電圧での相当量の種を有しない電流と比較して電流のわずかな低下を有するもの。尿酸は、第1のタイプの内在種に関係付けられた第1の電流プロファイルを代表する。ベータヒドロキシ酪酸は、第3のタイプの内在種に関係付けられた第2の電流プロファイルを代表する。トリグリセリドは、第3のタイプの内在種に関係付けられた第2の電流プロファイルの代表である。それぞれのタイプのものが、以下でさらに詳細に議論される。 When applied to determining risk factor parameters from the output signal for an endogenous species, there are generally three basic current profiles that result from the G pulse. (1) those having a positive current at low and high voltages as a result of the direct oxidation of the endogenous species, (2) having no or poor direct oxidation current at low to medium voltage and at a finite amount of high voltage. Compared to those with only positive oxidation currents, and (3) currents that are not direct oxidation but affect the current decay process in the pulse, and / or currents that do not have a significant amount of seeds at higher voltages. With a slight decrease in current. Uric acid represents a first current profile associated with a first type of endogenous species. Beta-hydroxybutyric acid represents a second current profile associated with a third type of endogenous species. Triglycerides are representative of the second current profile associated with the third type of endogenous species. Each type is discussed in more detail below.
2つの研究が行われ、内在種、具体的には尿酸の濃度に関連付けられたリスク因子パラメータを決定する能力を示した。異なる研究において、固定されたベースライングルコース濃度、例えば60、80、300、400、及び550mg/dLを有する全血試料の中に、濃縮された尿酸溶液を加えた。Gパルスからの応答電流はその後、ベースライン電流と比較された。研究1は、ベースライングルコース濃度80及び300mg/dLを含み、尿酸濃度0、5、10、20、及び30mg/dL、ヘマトクリット値42%、及び温度22±2℃(RT)を付加した。研究2は、ベースライングルコース濃度60及び400mg/dLを含み、尿酸濃度0、5、及び15mg/dL、ヘマトクリット値25、42及び55%、並びに、標的研究温度22±2℃(RT)を付加した。
Two studies have shown the ability to determine risk factor parameters associated with endogenous species, specifically uric acid levels. In different studies, concentrated uric acid solutions were added to whole blood samples with fixed baseline glucose concentrations such as 60, 80, 300, 400, and 550 mg / dL. The response current from the G pulse was then compared to the baseline current.
図6を参照すると、図3の入力信号に対応する付加された尿酸濃度0、5、10、20、及び30mg/dLを含有する試料に対して、平均Gパルスの直流プロファイルが示されている。印加される電圧がGパルス1、2、3、4、5、及び6にそれぞれ対応して、0.25Vから0.35V、0.5V、1.0V、1.3V、及び1.5Vに漸進的に高まるにとともに、応答電流は増大する。(尿酸が付加されていない)ベースライングルコースからの電流プロファイルの一番上で、電流の増大は、Gパルス3及び4について可視であるが、Gパルス5及び6では、明らかな増加は少ないか、又は見られない。この理由は、一つには、尿酸は0.5Vのより低い電圧で酸化し始めるが、多くの他の酸化可能な種も酸化されるとき、より高い電圧(例えば、1.3V及び1.5V)では、差が見えづらいからである。
Referring to FIG. 6, a DC profile of the average G pulse is shown for a sample containing the added
図7は、付加された異なる尿酸値の結果である個々の電流からブランク電流が差し引かれたときの結果を示す。したがって、図7に示されているのは、現在の尿酸からの結果のみであり、図6におけるものよりも結果が見やすい。最初のパルスに関わらず、0.5Vでの、及び0.5V後のGパルスに対する終了電流は、実質的には同じである。これは、0.5Vで開始する尿酸に対する拡散律速酸化プラトーの反映である。尿酸に対する拡散律速電流は基本的に、0.5Vで及び0.5V後、変化されない。図面において実証されるように、尿酸は0.35Vで部分的に酸化される。したがって、0.5VでのGパルスに基づく電流とパルス内及びパルス間比は、他のパルスに加えて、試料中の尿酸の濃度に対応するパルスに基づく尿酸に関係付けられたリスク因子パラメータを発生させるために使用され得る。リスク因子パラメータは、直流(図6)又はベースライン補正された電流(図7)に基づいて、電流とパルス内又はパルス間比とから発生され得る。 FIG. 7 shows the results when the blank current is subtracted from the individual currents that are the result of the different uric acid levels added. Therefore, only the results from current uric acid are shown in FIG. 7, and the results are easier to see than those in FIG. Regardless of the first pulse, the end currents for the G pulse at 0.5V and after 0.5V are substantially the same. This is a reflection of the diffusion rate-determining plateau for uric acid starting at 0.5 V. The diffusion rate-determining current for uric acid is basically unchanged at 0.5V and after 0.5V. As demonstrated in the drawings, uric acid is partially oxidized at 0.35 V. Therefore, the current based on the G pulse at 0.5 V and the intra-pulse and inter-pulse ratios, in addition to the other pulses, are the risk factor parameters associated with the pulse-based uric acid corresponding to the concentration of uric acid in the sample. Can be used to generate. Risk factor parameters can be generated from the current and the in-pulse or inter-pulse ratio based on direct current (FIG. 6) or baseline corrected current (FIG. 7).
具体的に、図8は、研究1からのデータによる3つの電流比iG2-4、iG3-4、及びiG4-4についての相関プロットを示す。図9は、3つのヘマトクリット値での研究2からの電流iG3-4に対する相関プロットを示す。図10は、尿酸-Hct研究に対する、血漿尿酸濃度と、付加された全血尿酸濃度の相関を示す。直流iG2-4、iG3-4、及びiG4-4が測定されて示され、付加された尿酸濃度と相関された。具体的に、図8に示されるように、電流iG3-4及びiG4-4は非常に類似した感度(相関傾き)で、付加された尿酸濃度との高い相関を与えた。電流iG2-4は、他の2つと比較してより感度が低く、相関係数のR2値は、0.35Vでの部分的な酸化のみによるもので強くなかった。さらに、可能性ある他の種の酸化のせいで、1.0Vでの電流iG4-4は、はるかに高い妨害を与えた。他方で、電流iG3-4は、はるかに低い妨害と同じ感度を有したので、したがって尿酸に対する代表的な信号として、より好ましいものであった。3つのすべての電流が尿酸に対するリスク因子パラメータとして使用され得る。
Specifically, FIG. 8 shows correlation plots for the three current ratios i G2-4 , i G3-4 , and i G4-4 based on the data from
パルス間比電流から計算されるリスク因子パラメータ、例えばRG24(即ち、iG2-4/iG4-4)、及びRG34(即ち、iG3-4/iG4-4)も使用され得る。図11は、本開示の態様による、上記の研究1から付加された尿酸濃度との、パラメータRG24及びRG34の相関プロットを示す。図12は、本開示の態様による、試験室Hct研究及びドナー研究の試料から決定された血漿尿酸濃度との、パラメータRG34の相関プロットを示す。iG4-4によって正規化されたiG2-4及びiG3-4のそれらの対応物に対して、RG34は、RG24よりも感度が高くあり続けるが、図9における直流相関と比較して、RG34は、ヘマトクリットよりも感度が低いことが示される。Gパルス電流を含むパラメータのなかでも、RG34は、尿酸濃度との最も強い相関を示す最も高いR2値を有した。図12は、内的ドナー研究の全血試料からのRG34パラメータが、3つのヘマトクリット値(25、42、及び55%)での、及びベースライングルコース(60及び400mg/dL)に対する、尿酸の試験室Hct研究から得られた傾向線と一致することを示す。
Risk factor parameters calculated from the inter-pulse specific current, such as RG 24 (ie i G2-4 / i G4-4 ), and RG 34 (ie i G3-4 / i G4-4 ) can also be used. FIG. 11 shows a correlation plot of parameters RG 24 and RG 34 with the uric acid concentration added from
2つの研究が行われ、トリグリセリドの濃度に関連付けられたリスク因子パラメータを決定する能力を示した。研究1は、ベースライングルコース濃度80及び240mg/dLを含み、尿酸濃度0及び5mg/dLを付加し、各グルコース/尿酸値に対してトリグリセリド濃度0、250、500、750、及び1000mg/dL、ヘマトクリット値42%、及び温度22±2℃(RT)を付加した。研究2は、ベースライングルコース濃度80及び300mg/dLを含み、各ベースライングルコース濃度に対して、トリグリセリド濃度0、100、200、400、及び750mg/dL、ヘマトクリット値42%、及び、研究温度22±2℃(RT)を付加した。
Two studies have shown the ability to determine risk factor parameters associated with triglyceride levels.
図13を参照すると、図3の入力信号に対応して、トリグリセリド濃度0、250、500、750、及び1000mg/dLを含有する試料に対して、平均Gパルスの直流プロファイルが示されている。図14は、図13におけるベースライン補正電流プロファイルを示す。図13で示されるように、応答電流は、印加される電圧が増大するとともに漸進的に増大する。しかしながら、図14で示されるように、電流差のプロファイルは、付加されたトリグリセリド量に対応する増加を示さない。代わりに、わずかな変化が、後のGパルス(例えば、1.0V、1.3V、及び1.5V)で起きる。例えば、Gパルス4での減衰挙動は、(トリグリセリドが付加されない)ベースライン電流に関して付加されたトリグリセリド量に対応して変化する。さらに、Gパルス5及び6はそれぞれ、ベースライン電流に関するいくつかの負の変化を有する。これらの挙動は、大きな分子、例えばトリグリセリドやコレステロールについて典型的であり、ここで直接酸化部位は容易に得られない。パルス減衰を記述するパラメータが使用され、トリグリセリドの存在を示した。
Referring to FIG. 13, a DC profile of an average G pulse is shown for a sample containing
したがって、後のGパルス(例えば、1.0V、1.3V、及び1.5V)に基づくパルス内及びパルス間比は、トリグリセリドに関係付けられたリスク因子パラメータを発生するために使用され得る。リスク因子パラメータは、直流(図13)又はベースライン補正された電流(図14)に基づくパルス内又はパルス間比から発生され得る。さらに、リスク因子パラメータは、内在種間で変化し得る。例えば、このような直接パラメータの1つは、RG4(即ち、iG4-4/iG4-1)であった。図15は、血漿トリグリセリド濃度に対するRG4とRG34(即ち、iG3-4/iG4-4)のプロットを示す。このプロットから、強い尿酸を示すパラメータRG34がトリグリセリドに応答しなかったことが見られ得る。 Therefore, intra-pulse and inter-pulse ratios based on subsequent G pulses (eg, 1.0V, 1.3V, and 1.5V) can be used to generate risk factor parameters associated with triglycerides. Risk factor parameters can be generated from in-pulse or inter-pulse ratios based on direct current (FIG. 13) or baseline corrected current (FIG. 14). In addition, risk factor parameters can vary between endogenous species. For example, one such direct parameter was RG4 (ie i G4-4 / i G4-1 ). FIG. 15 shows plots of RG 4 and RG 34 (ie, i G3-4 / i G4-4 ) for plasma triglyceride concentration. From this plot it can be seen that the parameter RG 34 , which indicates strong uric acid, did not respond to triglycerides.
1つの研究が行われ、3-ヒドロキシ酪酸の濃度に関連付けられたリスク因子パラメータを決定する能力を示した。経時的に、遅い時間変化で変化する量で血中に常に存在する尿酸及びトリグリセリドと比較して、3-HBAだけは、ケトアシドーシスの兆候において急上昇するが、これは糖尿病の多くの人々にとって稀であるか、又はあり得ない。したがって、3-HBAに関連付けられたリスク因子パラメータをモニタリングする値は、異常に高い3-HBA値(>3mmol)による、生命を脅かす恐れのある事象について時宜を得た警告を提供することになるだろう。研究は、ベースライングルコース濃度80及び300mg/dLを使用して行われ、各ベースライングルコース濃度に対して、3-ヒドロキシ酪酸濃度0、0.5、0.98、2.94、及び5.58mmol、ヘマトクリット値42%、温度22±2℃(RT)を付加した。
One study has shown the ability to determine risk factor parameters associated with 3-hydroxybutyric acid concentrations. Only 3-HBA spikes in the signs of ketoacidosis, which is rare for many people with diabetes, compared to uric acid and triglycerides, which are always present in the blood in slow, time-varying amounts over time. Or not possible. Therefore, values that monitor the risk factor parameters associated with 3-HBA will provide timely warnings of potentially life-threatening events due to abnormally high 3-HBA values (> 3 mmol). right. Studies were performed using baseline glucose concentrations of 80 and 300 mg / dL, and for each baseline glucose concentration, 3-hydroxybutyric acid concentrations of 0, 0.5, 0.98, 2.94, and 5. 58 mmol,
図16を参照すると、図3の入力信号に対応して、3-ヒドロキシ酪酸0、0.5、0.98、2.94、及び5.88mmolの濃度を含有する試料に対する平均Gパルスの直流プロファイルが示されている。示されるように、平均Gパルスの直流プロファイルは、ほとんど変化を示さない。図17は、付加された3-ヒドロキシ酪酸での電流からベースライン電流を差し引く際、より高い電圧パルス(例えば、1.3V及び1.5V)で正の酸化電流が可視であることを示す。
Referring to FIG. 16, corresponding to the input signal of FIG. 3, direct current of an average G pulse to a sample containing concentrations of 3-
結果は、全血試料への3-HBAの付加に対応する正電流iG6-3であった。一方、正電流は3-HBAの存在の表示を提供し得、iG6-3/iG4-4の比をとって、RG64の低減されたロット間及びセンサ間変動を作る。したがって、1.3V及び1.5VでのGパルスに基づくパルス内比又はパルス間比は、試料中の3-ヒドロキシ酪酸の濃度に応答して、1.3V及び1.5VでのGパルスに基づいた3-ヒドロキシ酪酸に関係付けられたリスク因子パラメータを発生するために使用され得る。さらなるリスク因子パラメータが、直流(図16)又はベースライン補正された電流(図17)に基づいたパルス内比又はパルス間比から発生され得る。 The result was a positive current i G6-3 corresponding to the addition of 3-HBA to the whole blood sample. On the other hand, the positive current can provide an indication of the presence of 3-HBA and take the ratio of i G6-3 / i G4-4 to create reduced lot-to-sensor variation of RG 64 . Therefore, the intra-pulse ratio or inter-pulse ratio based on the G pulse at 1.3 V and 1.5 V becomes the G pulse at 1.3 V and 1.5 V in response to the concentration of 3-hydroxybutyric acid in the sample. It can be used to generate risk factor parameters associated with 3-hydroxybutyric acid based. Additional risk factor parameters can arise from intra-pulse or inter-pulse ratios based on direct current (FIG. 16) or baseline corrected current (FIG. 17).
図18は、本開示の態様による、2つのベースライングルコース濃度での応答曲線/線を示し、これらの両方が、パラメータRG64と付加された3-ヒドロキシ酪酸濃度との間の良い相関を与えた。図19は、本開示の態様による、直接RG64パラメータと比較した、正規化されたRG64値(NRG64)対、付加された3-ヒドロキシ酪酸を示す。NRG64パラメータは、RG64パラメータに対するグルコース依存を実質的に取り除いた。リアルタイムの検出におけるRG64のグルコース依存の正規化に対するグルコース濃度は、BGMグルコース読み取りと置き換えられ得る。図20は、3-HBAに対するRG64応答曲線/線のグルコース依存に対する正規化関数を示す。このような正規化は米国特許出願第14/774,617号において開示され、参照によりその全体が本明細書に組み込まれ得る。 FIG. 18 shows the response curves / lines at two baseline glucose concentrations according to aspects of the present disclosure, both of which provide a good correlation between the parameter RG 64 and the added 3-hydroxybutyric acid concentration. rice field. FIG. 19 shows a normalized RG 64 value (NRG 64 ) pair, added 3-hydroxybutyric acid, compared directly to the RG 64 parameter according to aspects of the present disclosure. The NRG 64 parameter substantially eliminated the glucose dependence on the RG 64 parameter. Glucose concentration for glucose-dependent normalization of RG64 in real-time detection can be replaced with BGM glucose reading. FIG. 20 shows a normalization function for glucose dependence of the RG64 response curve / line for 3-HBA. Such normalization is disclosed in US Patent Application No. 14 / 774,617, which may be incorporated herein by reference in its entirety.
したがって、試料中の関係付けられた内在種の様々なリスク因子パラメータを使用して、そうでなければ従来のバイオセンサシステムを使用して失われる情報が試料から抽出され得る。情報は、経時的に1つ以上のリスク因子パラメータに加えて、経時的な検体濃度、例えばグルコース濃度を示す患者プロファイルを生成するのに使用され得る。リスク因子パラメータは、試料が回収されたユーザに関係付けられたリスク因子についての付加的な情報を提供する。付加的な情報は、他の用途の中でもとりわけ、ユーザの健康をモニタリングし、ある医学的症状を診断し、ある医学的症状を発展させるリスクを決定するために、ユーザ又は医療従事者によって使用され得る。 Therefore, information that would otherwise be lost using a conventional biosensor system can be extracted from the sample using various risk factor parameters of the associated endogenous species in the sample. The information can be used to generate a patient profile showing sample concentration over time, eg glucose concentration, in addition to one or more risk factor parameters over time. The risk factor parameters provide additional information about the risk factors associated with the user from whom the sample was collected. Additional information is used by users or healthcare professionals to monitor a user's health, diagnose certain medical symptoms, and determine the risk of developing certain medical symptoms, among other uses. obtain.
図21は、本開示の態様による、試料を電気化学的に分析して、特に分析の間にリスク因子パラメータを決定するためのプロセス2100のフローチャートである。プロセス2100は、上記で議論されたバイオセンサシステム100のようなバイオセンサシステムによって実行され得る。特定の態様において、プロセス2100を実行するバイオセンサシステムは、血液試料中のグルコース濃度を決定するためのデバイス、例えば血糖モニタ装置、連続グルコースモニタなどであり得る。
FIG. 21 is a flow chart of
ステップ2102で、上記の概念にしたがって、入力信号が電極を介して試料に印加される。入力信号は少なくとも1つの電位励起を有する。上記で議論されたように、試料は全血であり得る。しかしながら、試料は他の任意の生物学上の試料であり得る。
At
少なくとも1つの電位励起は、電流測定の電位励起又は電圧測定の電位励起であり得る。いくつかの実施形態において、入力信号は、試薬を有する電極を介して試料に印加され得る。例えば電極は、試料中の検体の、試料中の少なくとも1つの他の種の、又はこれらの組み合わせの酸化を促進する試薬を含み得る。いくつかの実施形態では、入力信号は、試薬を欠く電極を介して試料に印加され得る。例えば電極は、試料中の任意の種の酸化を促進する任意の試薬を除き得る。 The at least one potential excitation can be a potential excitation for current measurement or a potential excitation for voltage measurement. In some embodiments, the input signal can be applied to the sample via an electrode with reagents. For example, the electrode may include a reagent that promotes oxidation of the sample in the sample, at least one other species in the sample, or a combination thereof. In some embodiments, the input signal can be applied to the sample via an electrode lacking reagents. For example, the electrode may exclude any reagent that promotes oxidation of any species in the sample.
いくつかの実施形態において、入力信号は、試薬を有する電極と試薬を欠く電極の両方を介して試料に印加され得、例えば入力信号が、試薬を有する電極を介して印加される入力信号部分と試薬を欠く電極を介して印加される入力信号部分とを有する場合、又は入力信号が複数の信号から成る場合である。例えば、いくつかの実施形態で、入力信号は、試薬を有する第1電極を介して印加され、第2入力信号と組み合わされ、試薬を欠く第2電極を介して印加される第1入力信号であり得る。組み合わせることは、第1入力信号の少なくとも1つの電位励起が第2入力信号の少なくとも1つの電位励起と同時ではないように、第1電極を介して少なくとも1つの電位励起と電位緩和を有する第1入力信号を試料に印加することと、第2電極を介して少なくとも1つの電位励起と電位緩和を有する第2入力信号を試料に印加することを含み得る。 In some embodiments, the input signal can be applied to the sample via both the electrode with the reagent and the electrode lacking the reagent, eg, with the input signal portion where the input signal is applied through the electrode with the reagent. It has an input signal portion applied through an electrode lacking a reagent, or the input signal consists of a plurality of signals. For example, in some embodiments, the input signal is a first input signal applied through a first electrode having a reagent, combined with a second input signal, and applied through a second electrode lacking a reagent. could be. The combination has at least one potential excitation and potential relaxation through the first electrode such that at least one potential excitation of the first input signal is not simultaneous with at least one potential excitation of the second input signal. It may include applying an input signal to the sample and applying a second input signal having at least one potential excitation and potential relaxation through the second electrode to the sample.
いくつかの実施形態において、少なくとも1つの電位励起の電位は、試料中の少なくとも1つの種の量に対応するように選択され得る。いくつかの実施形態で、少なくとも1つの電位励起の電位は、少なくとも1つの種の酸化電位、少なくとも1つの電位励起に対応する電流測定値の減衰率、又はこれらの組み合わせに基づいて選択され得る。 In some embodiments, the potential of at least one potential excitation can be selected to correspond to the amount of at least one species in the sample. In some embodiments, the potential of at least one potential excitation can be selected based on the oxidation potential of at least one species, the decay rate of the current measurement corresponding to at least one potential excitation , or a combination thereof.
ステップ2104で、入力信号に対応する出力信号が測定される。いくつかの実施形態において、例えば入力信号の少なくとも一部分が、検体に特有の試薬を有する電極を介して印加されるとき、出力信号は試料中の検体濃度に応答し得る。いくつかの実施形態で、例えば入力信号のどの部分も検体に特有の試薬を有する電極を介して印加されないとき、出力信号は試料中の検体濃度に対応しない。さらに、入力信号の少なくとも1つの電位励起について、出力信号を発生する際に1つ以上の電流が測定され得る。例えば、1つ、2つ、3つ、4つ、5つ、6つ、7つ、8つ、9つ、10又はそれ以上の出力電流が、入力信号の少なくとも1つの電位励起に対応して測定され得る。
In
ステップ2106で、試料中の検体濃度が出力信号に基づいて決定される。濃度は、当技術において周知の様々な技術にしたがって決定され得る。例えば、出力信号に基づいて検体濃度を決定するために、出力信号は、1つ以上の基準相関に、1つ以上のエラー補償に、及び/又は1つ以上のエラー検出にしたがって分析され得る。
In
ステップ2108で、検体以外の試料中の少なくとも1つの種に関係付けられた少なくとも1つのリスク因子パラメータが、上記で開示された態様によって決定される。その少なくとも1つの種は、試料中で見つけられた内在種であり、検体以外の種である。例えば内在種は、尿酸、コレステロール、トリグリセリド、アセトアミノフェン、アスコルビン酸、ビリルビン、ドーパミン、ヘモグロビン、キシロース、及び/又は3-ヒドロキシ酪酸、又は血液試料のような試料において見つけられ得る他の種である。
In
上記で議論された少なくとも1つの電位励起の電位が内在種にしたがって選択される場合、少なくとも1つの電位励起は、少なくとも1つの種が尿酸であるとき、一定の電位約0.35Vから約0.5Vを有し得る。代替的に少なくとも1つの電位励起は、少なくとも1つの種がトリグリセリドである場合、一定の電位約1Vから約1.5Vを有し得る。代替的に少なくとも1つの電位励起は、少なくとも1つの種が3-ヒドロキシ酪酸であるとき、一定の電位約1.3Vから約1.5Vを有し得る。 When the potential of at least one potential excitation discussed above is selected according to the endogenous species, the at least one potential excitation has a constant potential of about 0.35V to about 0. Can have 5V. Alternatively, at least one potential excitation can have a constant potential of about 1V to about 1.5V if at least one species is a triglyceride. Alternatively, at least one potential excitation can have a constant potential of about 1.3V to about 1.5V when at least one species is 3-hydroxybutyric acid.
出力信号が、少なくとも1つの電位励起に対応する複数の電流測定値を含む実施形態において、少なくとも1つのリスク因子パラメータの決定は、複数の電流測定値のうちの少なくとも1つの電流測定値、複数の電流測定値のうちの2つの電流測定値の比、又はそれらの組み合わせに基づいてもよい。いくつかの特定の実施形態で、2つの電流測定値は、複数の電流測定値の最後の電流測定値と、複数の電流測定値の最初の電流測定値であり得る。例えば、2つの電流測定値は、少なくとも1つの電位励起の同じ電位励起に対応し得る。代替的に、2つの電流測定値は、少なくとも1つの電位励起の2つの異なる電位励起に対応し得る。 In an embodiment in which the output signal comprises a plurality of current measurements corresponding to at least one potential excitation , the determination of at least one risk factor parameter is determined by at least one of the plurality of current measurements, the plurality of current measurements. It may be based on the ratio of two current measurements out of the current measurements, or a combination thereof. In some particular embodiments, the two current measurements can be the last current measurement of the plurality of current measurements and the first current measurement of the plurality of current measurements. For example, two current measurements may correspond to the same potential excitation of at least one potential excitation . Alternatively, the two current measurements may correspond to two different potential excitations of at least one potential excitation .
いくつかの実施形態で、プロセス2100は、複数の分離試料に対して経時的にステップ2102から2108を繰り返すことをさらに含んでもよく、患者プロファイル中で複数の試料に対する検体濃度及び少なくとも1つのリスク因子パラメータをログすることをさらに含み得る。患者プロファイルから少なくとも1つのリスク因子パラメータのログにおいて、1つ以上の傾向が決定されてもよく、傾向は少なくとも1つの種に関係付けられた医学的症状の進行を示し得る。いくつかの実施形態では、バイオセンサシステムは、少なくとも1つのリスク因子パラメータがしきい値を満たすことを示すことを提供し得る。しきい値は、医学的症状の進行と関係付けられ得る。例えば、しきい値は、医学的症状の関係付けられた進行、表示、又はこれらの組み合わせであり得るので、しきい値を満たすこと又は満たさないことが、医学的症状の進行、表示、又はこれらの組み合わせを示す。例えば、バイオセンサシステムは、リスク因子パラメータが設定限度外となった場合、ユーザに警告を提供し得る。3-HBAに適用されるとき、このような限度は、全血中の3-HBAの値が1mmol/Lよりも大きい場合に注意を要求し、注意は、医師に同じことを報告し得、又は、このような限度が3-HBAの値が3mmol/Lよりも高い場合、注意は、緊急の医療処置を仰ぐこと(例えば救急処置室に行くこと)となり得る。
In some embodiments,
前述に基づいて、例として糖尿病に適用されるとき、グルコース濃度と1つ以上のリスク因子パラメータの決定を含む全血プロファイリングの機能を有するグルコースをモニタリングするためのバイオセンサシステムが、糖尿病治療管理を向上させるだろう。具体的に、バイオセンサシステムは、全血中グルコース読み取りとともにリスク因子パラメータに関して、全血プロファイルを記憶し得る。したがって、例えば%-Hct、尿酸、及びコレステロール、又はそれらのリスク因子パラメータのうちの1つ以上のような内在種の決定された濃度を、決定されたグルコース濃度とともに報告することは、ユーザの長期的な全血プロファイルを提供して、進行性の変化又はこれらの欠乏を経時的に反映し、したがって糖尿病治療/管理に有益である。例として、記録された/ログされた決定されたパラメータは、グルコース、%-Hct(iH-4電流によって簡潔に)、iG2-4、iG3-4、iG4-4、iG5-2、iG6-3、RG34、RG4、NRG64であり得る。別の例において、記録された/ログされたパラメータは、グルコース、%-Hct(iH-4電流によって簡潔に)、iG3-4、iG4-4、iG5-2、iG6-3、RG34、RG4、NRG64、RG56(i5-2/iG6-3)、RHG4(iH-4/iG4-4)であり得る。 Based on the above, when applied to diabetes as an example, a biosensor system for monitoring glucose with the function of whole blood profiling, including determination of glucose concentration and one or more risk factor parameters, provides diabetes treatment management. Will improve. Specifically, the biosensor system may store whole blood profiles with respect to risk factor parameters as well as whole blood glucose readings. Therefore, reporting the determined concentration of an endogenous species, such as% -Hct, uric acid, and cholesterol, or one or more of their risk factor parameters, along with the determined glucose concentration, is a long-term for the user. Provides a complete whole blood profile that reflects progressive changes or deficiencies over time and is therefore beneficial for diabetes treatment / management. As an example, the determined parameters recorded / logged are glucose,% -Hct (briefly by i H-4 current), i G2-4 , i G3-4 , i G4-4 , i G5- 2 , i G6-3 , RG 34 , RG 4 , NRG 64 . In another example, the recorded / logged parameters are glucose,% -Hct (briefly by i H-4 current), i G3-4 , i G4-4 , i G5-2 , i G6-3. , RG 34 , RG 4 , NRG 64 , RG 56 (i 5-2 / i G6-3 ), RHG 4 (i H-4 / i G4-4 ).
本発明の様々な実施形態について説明してきたが、本発明の範囲内で別の実施形態及び実施が可能であることは、当業者にとって明らかであろう。 Having described various embodiments of the invention, it will be apparent to those skilled in the art that other embodiments and embodiments are possible within the scope of the invention.
これらの実施形態の各々及びその明らかな変形は、特許請求された発明の精神及び範囲内に含まれるものと考えられ、これは以下の特許請求の範囲において明記されている。さらに、本発明の概念は、先行する要素と態様の任意及びすべての組合せ、並びに部分的な組み合わせを明白に含むものである。 Each of these embodiments and its apparent variations are believed to be within the spirit and scope of the claimed invention, which is specified in the claims below. Moreover, the concepts of the invention explicitly include any and all combinations of preceding elements and embodiments, as well as partial combinations.
Claims (15)
前記試料に、電極を介して、少なくとも1つの電位励起を有する入力信号を印加すること、
前記入力信号に対応する出力信号を測定すること、
前記出力信号に基づいて、前記試料中の検体の濃度を決定すること、
前記出力信号中の電流測定値の1つ以上のパルス内比、1つ以上のパルス間比、又は、それらの組み合わせに基づいて、前記検体以外の、前記試料中の少なくとも1つの種に関係付けられた少なくとも1つのリスク因子パラメータを決定すること、
を含む、方法。 A method of electrochemically analyzing a sample.
Applying an input signal having at least one potential excitation to the sample via an electrode,
Measuring the output signal corresponding to the input signal,
Determining the concentration of a sample in the sample based on the output signal,
Relative to at least one species in the sample other than the sample, based on one or more intra-pulse ratios of current measurements in the output signal, one or more pulse-to-pulse ratios, or a combination thereof. Determining at least one risk factor parameter,
Including, how.
患者プロファイル中で前記複数の試料に対する前記検体濃度と前記少なくとも1つのリスク因子パラメータとをログすること
をさらに含む、請求項1に記載の方法。 Over time for a plurality of separate samples, the step of applying, the step of measuring, the step of determining the concentration, and the step of determining the at least one risk factor parameter are repeated, and in the patient profile. The method of claim 1, further comprising logging the sample concentration for the plurality of samples and the at least one risk factor parameter.
をさらに含む、請求項4に記載の方法。 In the log of the at least one risk factor parameter, determining at least one tendency, wherein the at least one tendency indicates the progression of medical symptoms associated with the at least one species.
4. The method of claim 4.
試薬を有する第1電極を介した第1入力信号を、試薬を欠く第2電極を介した第2入力信号と組み合わせることであって、
前記組み合わせることは、前記第1電極を介して、試料に印加することを含み、
前記第1入力信号は、少なくとも1つの電位励起と電位緩和を有して、前記第2電極を介して、前記試料に印加され、
前記第2入力信号は、前記第2入力信号の少なくとも1つの電位励起が、前記第1入力信号の少なくとも1つの電位励起と同時に発生されないように、少なくとも1つの電位励起と電位緩和を有し、
前記第1入力信号に対応する第1出力信号と、前記第2入力信号に対応する第2出力信号とを測定すること、
少なくとも前記第1出力信号と前記第2出力信号に基づいて、検体濃度を決定すること、そして
(1)前記第1出力信号、前記第2出力信号、又は、それらの組み合わせ中の電流測定値の1つ以上のパルス内比、又は、(2)前記第1出力信号及び前記第2出力信号中の電流測定値の1つ以上のパルス間比に基づいて、前記試料中の少なくとも1つの内在種に関係付けられた少なくとも1つのリスク因子パラメータを決定すること
を含む、方法。 How to generate a patient profile
Combining the first input signal via the first electrode with the reagent with the second input signal via the second electrode lacking the reagent.
The combination comprises applying to the sample via the first electrode.
The first input signal has at least one potential excitation and potential relaxation and is applied to the sample via the second electrode.
The second input signal has at least one potential excitation and potential relaxation so that at least one potential excitation of the second input signal does not occur at the same time as at least one potential excitation of the first input signal.
Measuring the first output signal corresponding to the first input signal and the second output signal corresponding to the second input signal.
The sample concentration is determined based on at least the first output signal and the second output signal, and (1) the current measurement value in the first output signal, the second output signal, or a combination thereof. At least one endogenous species in the sample based on one or more intra-pulse ratios, or (2) one or more inter-pulse ratios of current measurements in the first output signal and the second output signal. A method comprising determining at least one risk factor parameter associated with.
前記血糖モニタ装置の素地電極を介して、入力信号を前記試料に印加することであって、
前記入力信号は定電圧パルスを含み、
前記定電圧パルスに対応する電流測定値中の1つ以上のパルス内比に基づいて、前記試料中の少なくとも1つの内在種に関係付けられた少なくとも1つのリスク因子パラメータを決定すること、そして
前記血糖モニタ装置に記憶された患者プロファイル中で前記少なくとも1つのリスク因子パラメータをログすること、
を含む、方法。 It is a method of analyzing a sample with a blood glucose monitor.
Applying an input signal to the sample via the substrate electrode of the blood glucose monitor device.
The input signal includes a constant voltage pulse.
Determining at least one risk factor parameter associated with at least one endogenous species in the sample, based on the ratio within one or more of the current measurements corresponding to the constant voltage pulse, and said. Logging the at least one risk factor parameter in the patient profile stored in the blood glucose monitor,
Including, how.
前記少なくとも1つのリスク因子パラメータの前記ログにおける少なくとも1つの傾向を決定し、そして
前記少なくとも1つのリスク因子パラメータに対する少なくとも1つのログされた値が、医学的症状の進行、指示、又はこれらの組み合わせに関係付けられたしきい値を満たす表示を提供すること、
をさらに含む、請求項14に記載の方法。 The step of applying, the step of determining, and the step of logging are repeated over time for a plurality of separate samples.
At least one trend in the log of the at least one risk factor parameter is determined, and at least one logged value for the at least one risk factor parameter is the progression, indication, or combination thereof of medical symptoms. To provide a display that meets the thresholds associated with,
14. The method of claim 14.
Applications Claiming Priority (3)
| Application Number | Priority Date | Filing Date | Title |
|---|---|---|---|
| US201662430232P | 2016-12-05 | 2016-12-05 | |
| US62/430,232 | 2016-12-05 | ||
| PCT/IB2017/057584 WO2018104835A1 (en) | 2016-12-05 | 2017-12-01 | Risk factor monitoring |
Publications (3)
| Publication Number | Publication Date |
|---|---|
| JP2019537026A JP2019537026A (en) | 2019-12-19 |
| JP2019537026A5 JP2019537026A5 (en) | 2021-01-21 |
| JP7074753B2 true JP7074753B2 (en) | 2022-05-24 |
Family
ID=60788637
Family Applications (1)
| Application Number | Title | Priority Date | Filing Date |
|---|---|---|---|
| JP2019530087A Active JP7074753B2 (en) | 2016-12-05 | 2017-12-01 | Risk factor monitoring |
Country Status (6)
| Country | Link |
|---|---|
| US (1) | US11353417B2 (en) |
| EP (1) | EP3548881A1 (en) |
| JP (1) | JP7074753B2 (en) |
| CN (1) | CN110249219B (en) |
| CA (1) | CA3045090A1 (en) |
| WO (1) | WO2018104835A1 (en) |
Families Citing this family (3)
| Publication number | Priority date | Publication date | Assignee | Title |
|---|---|---|---|---|
| US11744561B2 (en) * | 2019-11-07 | 2023-09-05 | Smylio Inc. | Saliva collection and testing system |
| KR20230044201A (en) | 2020-08-04 | 2023-04-03 | 어센시아 다이어비티즈 케어 홀딩스 아게 | Biosensors with Membrane Structures for Steady-State and Transient Conditions to Determine Analyte Concentration |
| CN114242253B (en) * | 2022-02-21 | 2022-05-17 | 深圳大学 | Health management method and system for early warning of diabetic ketoacidosis |
Citations (5)
| Publication number | Priority date | Publication date | Assignee | Title |
|---|---|---|---|---|
| JP2004028887A (en) | 2002-06-27 | 2004-01-29 | Yamaguchi Technology Licensing Organization Ltd | Development of cholesterol sensor utilizing molecule mold membrane and non-invasion cholesterol measuring method and equipment using the cholesterol sensor |
| JP2010540934A (en) | 2007-09-24 | 2010-12-24 | バイエル・ヘルスケア・エルエルシー | Multi-region / multi-potential test sensor, method and system |
| JP2012247338A (en) | 2011-05-30 | 2012-12-13 | Gunze Ltd | Measurement display device |
| JP2013242171A (en) | 2012-05-18 | 2013-12-05 | Tanita Corp | Concentration measuring apparatus |
| JP2016065880A (en) | 2008-06-05 | 2016-04-28 | バイエル・ヘルスケア・エルエルシーBayer HealthCare LLC | User interface for testing system |
Family Cites Families (23)
| Publication number | Priority date | Publication date | Assignee | Title |
|---|---|---|---|---|
| CN100342230C (en) * | 2003-05-07 | 2007-10-10 | 黄椿木 | Structure of electrochemical sensing sheet and its producing method |
| US9372190B2 (en) * | 2004-05-26 | 2016-06-21 | Region Nordjylland | Method of evaluation of the relative risk of developing atherosclerosis in patients |
| CA2603542C (en) | 2005-04-08 | 2014-01-14 | Bayer Healthcare Llc | Oxidizable species as an internal reference in control solutions for biosensors |
| AR054851A1 (en) | 2005-07-20 | 2007-07-18 | Bayer Healthcare Llc | REGULATED AMPEROMETRY |
| US8404100B2 (en) | 2005-09-30 | 2013-03-26 | Bayer Healthcare Llc | Gated voltammetry |
| CN101437443B (en) * | 2006-05-08 | 2011-11-30 | 拜尔健康护理有限责任公司 | abnormal output detection system for a biosensor |
| EP2083674B1 (en) | 2006-10-24 | 2018-03-07 | Ascensia Diabetes Care Holdings AG | Transient decay amperometry |
| CN107091870B (en) * | 2007-12-10 | 2019-10-08 | 安晟信医疗科技控股公司 | Determine measuring device, bio-sensor system and the method for analyte concentration |
| CN103760356B (en) | 2007-12-10 | 2019-06-28 | 安晟信医疗科技控股公司 | Slope-based compensation |
| WO2010006253A1 (en) * | 2008-07-10 | 2010-01-14 | Bayer Healthcare Llc | Systems and methods including amperometric and voltammetric duty cycles |
| CN102854232B (en) * | 2008-12-08 | 2015-12-02 | 拜尔健康护理有限责任公司 | There is the bio-sensor system of signal conditioning functions |
| EP2550530A1 (en) | 2010-03-22 | 2013-01-30 | Bayer HealthCare LLC | Residual compensation for a biosensor |
| BR112012031375A2 (en) | 2010-06-07 | 2016-10-25 | Bayer Healthcare Llc | filler management system below what is required for a biosensor |
| EP3431986A1 (en) | 2010-06-07 | 2019-01-23 | Ascensia Diabetes Care Holdings AG | Slope-based compensation including secondary output signals |
| US8615366B2 (en) * | 2010-10-15 | 2013-12-24 | Roche Diagnostics Operations, Inc. | Handheld diabetes management device with bolus calculator |
| WO2013043839A1 (en) * | 2011-09-21 | 2013-03-28 | Bayer Healthcare Llc | Biosensor with error compensation |
| US20130116526A1 (en) * | 2011-11-09 | 2013-05-09 | Telcare, Inc. | Handheld Blood Glucose Monitoring Device with Messaging Capability |
| KR20150036605A (en) * | 2012-07-27 | 2015-04-07 | 바이엘 헬쓰케어, 엘엘씨 | System and method for detecting used and dried sensors |
| US9244036B2 (en) * | 2012-11-16 | 2016-01-26 | Cilag Gmbh International | System and method for determination of a concentration of at least one interfering substance and correction of glucose concentration based on the concentration of the interfering substance |
| CA2902512A1 (en) | 2013-03-14 | 2014-10-02 | Bayer Healthcare Llc | Normalized calibration of analyte concentration determinations |
| JP6334531B2 (en) | 2013-07-08 | 2018-05-30 | Phcホールディングス株式会社 | Blood component measuring device and blood component measuring method |
| AU2015253309B2 (en) * | 2014-04-28 | 2021-02-25 | The Regents Of The University Of California | Unobtrusive wireless electronic systems for monitoring and facilitating patient compliance |
| EP3485265A1 (en) | 2016-07-12 | 2019-05-22 | Ascensia Diabetes Care Holdings AG | Method for electrochemical analysis by use of alternating output signals from two electrodes |
-
2017
- 2017-12-01 CA CA3045090A patent/CA3045090A1/en not_active Abandoned
- 2017-12-01 WO PCT/IB2017/057584 patent/WO2018104835A1/en active Application Filing
- 2017-12-01 JP JP2019530087A patent/JP7074753B2/en active Active
- 2017-12-01 EP EP17818627.6A patent/EP3548881A1/en active Pending
- 2017-12-01 US US16/466,938 patent/US11353417B2/en active Active
- 2017-12-01 CN CN201780085383.9A patent/CN110249219B/en active Active
Patent Citations (5)
| Publication number | Priority date | Publication date | Assignee | Title |
|---|---|---|---|---|
| JP2004028887A (en) | 2002-06-27 | 2004-01-29 | Yamaguchi Technology Licensing Organization Ltd | Development of cholesterol sensor utilizing molecule mold membrane and non-invasion cholesterol measuring method and equipment using the cholesterol sensor |
| JP2010540934A (en) | 2007-09-24 | 2010-12-24 | バイエル・ヘルスケア・エルエルシー | Multi-region / multi-potential test sensor, method and system |
| JP2016065880A (en) | 2008-06-05 | 2016-04-28 | バイエル・ヘルスケア・エルエルシーBayer HealthCare LLC | User interface for testing system |
| JP2012247338A (en) | 2011-05-30 | 2012-12-13 | Gunze Ltd | Measurement display device |
| JP2013242171A (en) | 2012-05-18 | 2013-12-05 | Tanita Corp | Concentration measuring apparatus |
Also Published As
| Publication number | Publication date |
|---|---|
| EP3548881A1 (en) | 2019-10-09 |
| WO2018104835A9 (en) | 2019-05-09 |
| CN110249219B (en) | 2022-08-23 |
| WO2018104835A1 (en) | 2018-06-14 |
| US11353417B2 (en) | 2022-06-07 |
| CA3045090A1 (en) | 2018-06-14 |
| CN110249219A (en) | 2019-09-17 |
| US20190346399A1 (en) | 2019-11-14 |
| JP2019537026A (en) | 2019-12-19 |
Similar Documents
| Publication | Publication Date | Title |
|---|---|---|
| Bariya et al. | Wearable sweat sensors | |
| JP5856154B2 (en) | Slope-based correction including secondary output signal | |
| JP6345173B2 (en) | Improved analyte measurement technique and system | |
| JP6382820B2 (en) | System and method for determining hematocrit insensitive glucose concentration | |
| JP5782044B2 (en) | Underfill amount recognition system for biosensors | |
| JP2013528289A5 (en) | ||
| JP2020527059A (en) | Methods and electronic units for detecting in vivo characteristics of biosensors | |
| JP2013504053A (en) | Glucose measurement method and system | |
| JP7074753B2 (en) | Risk factor monitoring | |
| JP6596169B2 (en) | Method for detecting contributions from interfering substances in biosensors | |
| WO2012134890A1 (en) | System and method for measuring an analyte in a sample and correcting for interferents | |
| JP2020517928A (en) | Analyte measurement system and method | |
| JP6309011B2 (en) | System and method for determining hematocrit insensitive glucose concentration | |
| US11268925B2 (en) | Intertwined electrical input signals | |
| KR20190112731A (en) | Determination of Analyte Concentrations in Physiological Fluids with Interferences | |
| EP2956765A1 (en) | System and method for measuring an analyte in a sample and calculating hematocrit-insensitive glucose concentrations | |
| JP2022542576A (en) | Method for Determining Analyte Concentration of Sample | |
| JP2017502282A (en) | Handheld test instrument constant current driver with integrated test strip sample detection | |
| KR20220006978A (en) | High sensitive sensor for measuring glucose and method of the same |
Legal Events
| Date | Code | Title | Description |
|---|---|---|---|
| A521 | Request for written amendment filed |
Free format text: JAPANESE INTERMEDIATE CODE: A523 Effective date: 20201130 |
|
| A621 | Written request for application examination |
Free format text: JAPANESE INTERMEDIATE CODE: A621 Effective date: 20201130 |
|
| A977 | Report on retrieval |
Free format text: JAPANESE INTERMEDIATE CODE: A971007 Effective date: 20211022 |
|
| A131 | Notification of reasons for refusal |
Free format text: JAPANESE INTERMEDIATE CODE: A131 Effective date: 20211130 |
|
| A521 | Request for written amendment filed |
Free format text: JAPANESE INTERMEDIATE CODE: A523 Effective date: 20220228 |
|
| A131 | Notification of reasons for refusal |
Free format text: JAPANESE INTERMEDIATE CODE: A131 Effective date: 20220405 |
|
| A521 | Request for written amendment filed |
Free format text: JAPANESE INTERMEDIATE CODE: A523 Effective date: 20220411 |
|
| TRDD | Decision of grant or rejection written | ||
| A01 | Written decision to grant a patent or to grant a registration (utility model) |
Free format text: JAPANESE INTERMEDIATE CODE: A01 Effective date: 20220426 |
|
| A61 | First payment of annual fees (during grant procedure) |
Free format text: JAPANESE INTERMEDIATE CODE: A61 Effective date: 20220512 |
|
| R150 | Certificate of patent or registration of utility model |
Ref document number: 7074753 Country of ref document: JP Free format text: JAPANESE INTERMEDIATE CODE: R150 |