JP6992003B2 - Determining Absolute Tissue Oxygen Saturation and Relative Tissue Oxygen Saturation - Google Patents
Determining Absolute Tissue Oxygen Saturation and Relative Tissue Oxygen Saturation Download PDFInfo
- Publication number
- JP6992003B2 JP6992003B2 JP2018555235A JP2018555235A JP6992003B2 JP 6992003 B2 JP6992003 B2 JP 6992003B2 JP 2018555235 A JP2018555235 A JP 2018555235A JP 2018555235 A JP2018555235 A JP 2018555235A JP 6992003 B2 JP6992003 B2 JP 6992003B2
- Authority
- JP
- Japan
- Prior art keywords
- tissue
- value
- oxygen saturation
- detector
- oximeter
- Prior art date
- Legal status (The legal status is an assumption and is not a legal conclusion. Google has not performed a legal analysis and makes no representation as to the accuracy of the status listed.)
- Active
Links
Images


Classifications
-
- A—HUMAN NECESSITIES
- A61—MEDICAL OR VETERINARY SCIENCE; HYGIENE
- A61B—DIAGNOSIS; SURGERY; IDENTIFICATION
- A61B5/00—Measuring for diagnostic purposes; Identification of persons
- A61B5/145—Measuring characteristics of blood in vivo, e.g. gas concentration or pH-value ; Measuring characteristics of body fluids or tissues, e.g. interstitial fluid or cerebral tissue
- A61B5/1455—Measuring characteristics of blood in vivo, e.g. gas concentration or pH-value ; Measuring characteristics of body fluids or tissues, e.g. interstitial fluid or cerebral tissue using optical sensors, e.g. spectral photometrical oximeters
- A61B5/14551—Measuring characteristics of blood in vivo, e.g. gas concentration or pH-value ; Measuring characteristics of body fluids or tissues, e.g. interstitial fluid or cerebral tissue using optical sensors, e.g. spectral photometrical oximeters for measuring blood gases
- A61B5/14552—Details of sensors specially adapted therefor
-
- A—HUMAN NECESSITIES
- A61—MEDICAL OR VETERINARY SCIENCE; HYGIENE
- A61B—DIAGNOSIS; SURGERY; IDENTIFICATION
- A61B5/00—Measuring for diagnostic purposes; Identification of persons
- A61B5/48—Other medical applications
- A61B5/4848—Monitoring or testing the effects of treatment, e.g. of medication
-
- A—HUMAN NECESSITIES
- A61—MEDICAL OR VETERINARY SCIENCE; HYGIENE
- A61B—DIAGNOSIS; SURGERY; IDENTIFICATION
- A61B5/00—Measuring for diagnostic purposes; Identification of persons
- A61B5/72—Signal processing specially adapted for physiological signals or for diagnostic purposes
- A61B5/7221—Determining signal validity, reliability or quality
-
- A—HUMAN NECESSITIES
- A61—MEDICAL OR VETERINARY SCIENCE; HYGIENE
- A61B—DIAGNOSIS; SURGERY; IDENTIFICATION
- A61B5/00—Measuring for diagnostic purposes; Identification of persons
- A61B5/72—Signal processing specially adapted for physiological signals or for diagnostic purposes
- A61B5/7271—Specific aspects of physiological measurement analysis
- A61B5/7275—Determining trends in physiological measurement data; Predicting development of a medical condition based on physiological measurements, e.g. determining a risk factor
-
- A—HUMAN NECESSITIES
- A61—MEDICAL OR VETERINARY SCIENCE; HYGIENE
- A61B—DIAGNOSIS; SURGERY; IDENTIFICATION
- A61B5/00—Measuring for diagnostic purposes; Identification of persons
- A61B5/74—Details of notification to user or communication with user or patient; User input means
- A61B5/742—Details of notification to user or communication with user or patient; User input means using visual displays
- A61B5/743—Displaying an image simultaneously with additional graphical information, e.g. symbols, charts, function plots
-
- A—HUMAN NECESSITIES
- A61—MEDICAL OR VETERINARY SCIENCE; HYGIENE
- A61B—DIAGNOSIS; SURGERY; IDENTIFICATION
- A61B5/00—Measuring for diagnostic purposes; Identification of persons
- A61B5/74—Details of notification to user or communication with user or patient; User input means
- A61B5/7475—User input or interface means, e.g. keyboard, pointing device, joystick
-
- A—HUMAN NECESSITIES
- A61—MEDICAL OR VETERINARY SCIENCE; HYGIENE
- A61B—DIAGNOSIS; SURGERY; IDENTIFICATION
- A61B2560/00—Constructional details of operational features of apparatus; Accessories for medical measuring apparatus
- A61B2560/02—Operational features
- A61B2560/0204—Operational features of power management
- A61B2560/0214—Operational features of power management of power generation or supply
-
- A—HUMAN NECESSITIES
- A61—MEDICAL OR VETERINARY SCIENCE; HYGIENE
- A61B—DIAGNOSIS; SURGERY; IDENTIFICATION
- A61B2560/00—Constructional details of operational features of apparatus; Accessories for medical measuring apparatus
- A61B2560/04—Constructional details of apparatus
- A61B2560/0406—Constructional details of apparatus specially shaped apparatus housings
- A61B2560/0425—Ergonomically shaped housings
-
- A—HUMAN NECESSITIES
- A61—MEDICAL OR VETERINARY SCIENCE; HYGIENE
- A61B—DIAGNOSIS; SURGERY; IDENTIFICATION
- A61B2560/00—Constructional details of operational features of apparatus; Accessories for medical measuring apparatus
- A61B2560/04—Constructional details of apparatus
- A61B2560/0475—Special features of memory means, e.g. removable memory cards
-
- A—HUMAN NECESSITIES
- A61—MEDICAL OR VETERINARY SCIENCE; HYGIENE
- A61B—DIAGNOSIS; SURGERY; IDENTIFICATION
- A61B2562/00—Details of sensors; Constructional details of sensor housings or probes; Accessories for sensors
- A61B2562/02—Details of sensors specially adapted for in-vivo measurements
- A61B2562/0233—Special features of optical sensors or probes classified in A61B5/00
- A61B2562/0238—Optical sensor arrangements for performing transmission measurements on body tissue
-
- A—HUMAN NECESSITIES
- A61—MEDICAL OR VETERINARY SCIENCE; HYGIENE
- A61B—DIAGNOSIS; SURGERY; IDENTIFICATION
- A61B2562/00—Details of sensors; Constructional details of sensor housings or probes; Accessories for sensors
- A61B2562/02—Details of sensors specially adapted for in-vivo measurements
- A61B2562/0233—Special features of optical sensors or probes classified in A61B5/00
- A61B2562/0242—Special features of optical sensors or probes classified in A61B5/00 for varying or adjusting the optical path length in the tissue
-
- A—HUMAN NECESSITIES
- A61—MEDICAL OR VETERINARY SCIENCE; HYGIENE
- A61B—DIAGNOSIS; SURGERY; IDENTIFICATION
- A61B2562/00—Details of sensors; Constructional details of sensor housings or probes; Accessories for sensors
- A61B2562/04—Arrangements of multiple sensors of the same type
- A61B2562/046—Arrangements of multiple sensors of the same type in a matrix array
Landscapes
- Health & Medical Sciences (AREA)
- Life Sciences & Earth Sciences (AREA)
- Physics & Mathematics (AREA)
- Engineering & Computer Science (AREA)
- General Health & Medical Sciences (AREA)
- Pathology (AREA)
- Biomedical Technology (AREA)
- Heart & Thoracic Surgery (AREA)
- Medical Informatics (AREA)
- Molecular Biology (AREA)
- Surgery (AREA)
- Animal Behavior & Ethology (AREA)
- Biophysics (AREA)
- Public Health (AREA)
- Veterinary Medicine (AREA)
- Computer Vision & Pattern Recognition (AREA)
- Artificial Intelligence (AREA)
- Physiology (AREA)
- Psychiatry (AREA)
- Signal Processing (AREA)
- Spectroscopy & Molecular Physics (AREA)
- Optics & Photonics (AREA)
- Radiology & Medical Imaging (AREA)
- Nuclear Medicine, Radiotherapy & Molecular Imaging (AREA)
- Measurement Of The Respiration, Hearing Ability, Form, And Blood Characteristics Of Living Organisms (AREA)
- Investigating Or Analysing Materials By Optical Means (AREA)
Description
記載
関連出願への相互参照
この出願は、2016年4月22日に出願された米国特許出願第62/326,630号、第62/326,644号、第62/326,673号の利益を主張する。これらの出願は、これらの出願に引用されている他のすべての参考文献とともに、ここに引用により援用される。
Description Cross-reference to related applications This application benefits from US Patent Applications 62 / 326,630, 62/326,644, 62/326,673 filed April 22, 2016. Insist. These applications are hereby incorporated by reference, along with all other references cited in these applications.
発明の背景
本発明は一般に組織における酸素レベルを監視する光学システムに関する。より具体的には、本発明は、光学プローブのセンサヘッド上に源および検出器を含み、組織の酸素飽和度を判断するためにローカルに記憶されるシミュレート反射率曲線を使用するオキシメータなどの光学プローブに関する。
Background of the Invention The present invention generally relates to an optical system for monitoring oxygen levels in a tissue. More specifically, the present invention includes an oximeter that includes a source and a detector on the sensor head of an optical probe and uses a locally stored simulated reflectance curve to determine the oxygen saturation of the tissue. Regarding the optical probe of.
オキシメータは、様々な目的のために、ヒトおよび生体における組織の酸素飽和度を測定するために使用される医療装置である。例えば、オキシメータは、病院および他の医療施設での医療および診断目的(例えば、手術、患者モニタリング、または低酸素症などの、救急車または他の移動モニタリング);スポーツ競技場でのスポーツおよび運動目的(例えば、プロスポーツ選手のモニタリング);個人によるまたは自宅での個人のモニタリング(例えば、一般的な健康状態のモニタリング、またはマラソンのための人の訓練);および獣医療目的(例えば、動物モニタリング)で使用される。 An oximeter is a medical device used to measure the oxygen saturation of tissues in humans and living organisms for a variety of purposes. For example, the oximeter is for medical and diagnostic purposes in hospitals and other medical facilities (eg, ambulance or other mobility monitoring such as surgery, patient monitoring, or hypoxia); sports and exercise purposes in sports arenas. (Eg, monitoring of professional athletes); Individual monitoring by individuals or at home (eg, monitoring of general health, or training of people for marathons); and veterinary medical purposes (eg, animal monitoring). Used in.
パルスオキシメータおよび組織オキシメータは、異なる原理で作動する2つのタイプのオキシメータである。パルスオキシメータは機能するためにパルスを必要とする。パルスオキシメータは、典型的には、脈動する動脈血による光の吸光度を測定する。対照的に、組織オキシメータは、機能するためにパルスを必要とせず、血液供給源から切り離された組織弁の酸素飽和度測定を行うために使用することができる。 Pulse oximeters and tissue oximeters are two types of oximeters that operate on different principles. A pulse oximeter requires a pulse to function. A pulse oximeter typically measures the absorbance of light from pulsating arterial blood. In contrast, a tissue oximeter does not require a pulse to function and can be used to make an oxygen saturation measurement of a tissue valve disconnected from the blood source.
一例として、ヒトの組織は、様々な光吸収分子を含む。そのような発色団には、酸素化ヘモグロビン、脱酸素化ヘモグロビン、メラニン、水、脂質、およびシトクロムが含まれる。酸素化ヘモグロビン、脱酸素化ヘモグロビンおよびメラニンは、可視および近赤外スペクトル範囲の大部分について、組織における最も支配的な発色団である。光の吸収は、酸素化ヘモグロビンおよび脱酸素化ヘモグロビンの場合、特定の波長の光で、著しく異なる。組織オキシメータは、これらの光吸収差を利用することにより、ヒト組織内の酸素レベルを測定することができる。 As an example, human tissue contains various light absorbing molecules. Such chromophores include oxygenated hemoglobin, deoxygenated hemoglobin, melanin, water, lipids, and cytochromes. Oxygenated hemoglobin, deoxygenated hemoglobin and melanin are the most dominant chromophores in tissues for most of the visible and near-infrared spectral range. The absorption of light is significantly different for oxygenated hemoglobin and deoxygenated hemoglobin for light of a particular wavelength. The tissue oximeter can measure the oxygen level in human tissue by utilizing these light absorption differences.
既存のオキシメータの成功にもかかわらず、例えば、測定精度を向上させること、測定時間を短縮すること、コストを下げること、サイズ、重量、または形状因子を低減させること、消費電力を削減すること、およびその他の理由で、ならびにこれらの測定値の任意の組合せによって、オキシメータを改善することが継続的に望まれている。 Despite the success of existing oximeteres, for example, improving measurement accuracy, reducing measurement time, lowering costs, reducing size, weight, or shape factors, reducing power consumption. , And for other reasons, and by any combination of these measurements, it is continuously desired to improve the oximeter.
特に、領域および局所レベルの両方で患者の酸素化状態を評価することは、それが患者の局所的な組織健康状態の指標であるので、重要である。したがって、オキシメータは、患者の組織の酸素化状態が不安定であると疑われる場合がある手術および回復の間のような臨床設定においてしばしば使用される。例えば、手術中、オキシメータは様々な理想的でない状況下で正確な酸素飽和度測定を迅速に果たすことが可能でなければならない。既存のオキシメータは、絶対精度が重要ではなく、動向データだけが十分である術後組織モニタリングには十分であったが、組織が生存可能かまたは除去される必要があるかを判断するためにスポット検査を使用できる手術中には正確さが必要である。 In particular, assessing a patient's oxygenation status at both regional and local levels is important as it is an indicator of the patient's local tissue health. Therefore, oximeters are often used in clinical settings such as during surgery and recovery where the oxygenation of the patient's tissue may be suspected to be unstable. For example, during surgery, the oximeter must be able to quickly perform accurate oxygen saturation measurements under a variety of non-ideal conditions. Existing oximeters were sufficient for postoperative tissue monitoring where absolute accuracy was not important and only trend data was sufficient, but to determine if the tissue was viable or needed to be removed. Accuracy is required during surgery where spot testing can be used.
したがって、改善された組織オキシメータプローブおよびこれらのプローブを使用して測定を行う方法が必要とされている。 Therefore, there is a need for improved tissue oximeter probes and methods for making measurements using these probes.
この発明の概要
オキシメータプローブは、比較的多数のシミュレート反射率曲線を利用して、検査中の組織の光学特性を迅速に判断する。組織の光学特性により、組織の酸素化ヘモグロビン濃度および脱酸素化ヘモグロビン濃度を組織の酸素飽和度とならんでさらに判断することが可能になる。
Overview of the Invention The oximeter probe utilizes a relatively large number of simulated reflectance curves to quickly determine the optical properties of the tissue under examination. The optical properties of the tissue make it possible to further determine the oxygenated and deoxidized hemoglobin concentration of the tissue along with the oxygen saturation of the tissue.
一実施形態では、オキシメータプローブは、脈拍または心拍を必要とせずに酸素飽和度を測定することができる。本発明のオキシメータプローブは、成形術を含む多くの医療分野および外科領域に適用可能である。オキシメータプローブは、脈動がない組織の酸素飽和度測定を行うことができる。そのような組織は、身体から分離されているかもしれず(例えば組織片)、身体の別の場所に移植されることになる。本発明の態様は、パルスオキシメータにも適用可能である。オキシメータプローブとは対照的に、パルスオキシメータは機能するために脈動を必要とする。パルスオキシメータは、典型的には、脈動する動脈血による光の吸収を測定する。 In one embodiment, the oximeter probe can measure oxygen saturation without the need for a pulse or heart rate. The oximeter probe of the present invention is applicable to many medical fields including molding and surgical fields. The oximeter probe can measure oxygen saturation in pulsating tissue. Such tissue may be isolated from the body (eg, a piece of tissue) and will be transplanted elsewhere in the body. Aspects of the present invention are also applicable to pulse oximeters. In contrast to oximeter probes, pulse oximeters require pulsation to function. A pulse oximeter typically measures the absorption of light by pulsating arterial blood.
一実施態様では、酸素飽和度測定値のような酸素化測定値の相対値が判断され表示され、オキシメータプローブの使用により、エピネフリンまたは他の薬物のような、経時的な酸素飽和度に影響を与える投与薬物の有効性を判断することができる。 In one embodiment, relative values of oxygenation measurements, such as oxygen saturation measurements, are determined and displayed, and the use of an oximeter probe affects oxygen saturation over time, such as epinephrine or other drugs. The efficacy of the administered drug can be determined.
一実施態様では、ある方法は、患者の標的組織にプローブ先端を接触させることと、第1の時間にオキシメータプローブの源構造から標的組織に第1の光を透過することと、標的組織から反射された第1の反射光をオキシメータプローブの複数の検出器構造によって検出することと、検出器構造によって検出された第1の反射光の第1の反射率データを検出器構造によって生成することと、反射率データを複数のシミュレート反射率曲線に適合させることと、第1の反射率データの、複数のシミュレート反射率曲線への適合から、シミュレート反射率曲線のうちの1つ以上の最良適合曲線を判断することとを備え、各シミュレート反射率曲線は、吸収係数の値に関連付けられ、前記方法はさらに、シミュレート反射率曲線のうち、第1の反射率データに対して最良に適合する1つ以上の曲線について、少なくとも第1の吸収係数を判断することと、第1の吸収係数に基づいて第1の酸素飽和度の第1の値を判断することと、第1の酸素飽和度の第1の値をメモリに格納することとを備える。 In one embodiment, one method is to bring the probe tip into contact with the patient's target tissue, to transmit the first light from the source structure of the oximeter probe to the target tissue at the first time, and from the target tissue. The reflected first reflected light is detected by a plurality of detector structures of the oximeter probe, and the first reflectance data of the first reflected light detected by the detector structure is generated by the detector structure. One of the simulated reflectance curves from the fact that the reflectance data is adapted to multiple simulated reflectance curves and that the first reflectance data is adapted to multiple simulated reflectance curves. Each simulated reflectance curve is associated with the value of the absorption coefficient, and the method further comprises the above-mentioned method for determining the best fit curve for the first reflectance data of the simulated reflectance curve. To determine at least the first absorption coefficient for one or more curves that best fit, and to determine the first value of the first oxygen saturation based on the first absorption coefficient. It comprises storing the first value of the oxygen saturation of 1 in the memory.
本方法は、第2の時間にオキシメータプローブの源構造から標的組織に第2の光を透過することと、標的組織から反射された第2の反射光をオキシメータプローブの複数の検出器構造によって検出することと、検出器構造によって検出された第2の反射光について第2の反射率データを検出器構造によって生成することと、第2の反射率データを複数のシミュレート反射率曲線に適合させることと、第2の反射率データの、複数のシミュレート反射率曲線への適合から、シミュレート反射率曲線のうちの1つ以上の最良適合曲線を判断することと、シミュレート反射率曲線のうち、第2の反射率データに対して最良に適合する1つ以上の曲線について、少なくとも第2の吸収係数を判断することと、第2の吸収係数に基づいて第2の酸素飽和度の第2の値を判断することとを備える。 In this method, the second light is transmitted from the source structure of the oximeter probe to the target tissue at the second time, and the second reflected light reflected from the target tissue is transmitted to a plurality of detector structures of the oximeter probe. The second reflectance data is generated by the detector structure for the second reflected light detected by the detector structure, and the second reflectance data is converted into a plurality of simulated reflectance curves. Determining one or more of the simulated reflectance curves from the matching and fitting of the second reflectance data to multiple simulated reflectance curves, and the simulated reflectance. Determining at least the second absorption coefficient for one or more of the curves that best fits the second reflectance data, and the second oxygen saturation based on the second absorption coefficient. It is provided with determining the second value of.
本方法は、メモリから第1の値を検索することと、第1の値と第2の値との間の百分率差を判断することと、オキシメータプローブのディスプレイ上に百分率差を表示することとを備える。 The method is to retrieve the first value from memory, determine the percentage difference between the first and second values, and display the percentage difference on the display of the oximeter probe. And.
ある実施形態では、あるシステムは、オキシメータ装置を含み、オキシメータ装置は、オキシメータ装置の遠位端上に源構造および検出器構造を含むプローブ先端と、プローブ先端に近接するディスプレイとを含み、オキシメータ装置は、第1の酸素飽和度値、第2の酸素飽和度値、および第1の酸素飽和度値と第2の酸素飽和度値との間の相対酸素飽和度値を計算し、第1の酸素飽和度値と第2の酸素飽和度値との間の相対酸素飽和度値を表示し、オキシメータ装置は特に、第1の期間において、オキシメータプローブの光源から、測定されるべき第1の組織に、光を透過し、第1の期間において透過光に応答して第1の組織によって反射された光をオキシメータプローブの検出器で受光し、第2の期間において、オキシメータプローブの光源から測定すべき第2の組織に光を透過するよう構成され、第2の期間は第1の期間の後であり、オキシメータ装置はさらに、第2の期間における透過光に応答して第2の組織によって反射される光をオキシメータプローブの検出器で受光し、第1の組織について第1の酸素飽和度値を判断し、第2の組織について第2の酸素飽和度値を判断し、第1の酸素飽和度値と第2の酸素飽和度値との間の相対酸素飽和度値を計算し、相対酸素飽和度値をディスプレイに表示するよう構成される。 In certain embodiments, the system comprises an oximeter device, the oximeter device comprising a probe tip comprising a source structure and a detector structure on the distal end of the oximeter device, and a display in close proximity to the probe tip. , The oximeter device calculates a first oxygen saturation value, a second oxygen saturation value, and a relative oxygen saturation value between the first oxygen saturation value and the second oxygen saturation value. , Displaying the relative oxygen saturation value between the first oxygen saturation value and the second oxygen saturation value, the oximeter device is measured from the light source of the oximeter probe, especially during the first period. Light is transmitted to the first tissue to be to be, and the light reflected by the first tissue in response to the transmitted light in the first period is received by the detector of the oximeter probe, and in the second period, the light is received. The light source of the oximeter probe is configured to transmit light to the second tissue to be measured, the second period is after the first period, and the oximeter device is further to the transmitted light in the second period. In response, the light reflected by the second tissue is received by the detector of the oximeter probe, the first oxygen saturation value is determined for the first tissue, and the second oxygen saturation is determined for the second tissue. It is configured to determine the value, calculate the relative oxygen saturation value between the first oxygen saturation value and the second oxygen saturation value, and display the relative oxygen saturation value on the display.
オキシメータプローブを備えるシステムであって、オキシメータプローブは、ハンドヘルドのハウジングと、ハンドヘルドのハウジングに収容されるプロセッサと、ハンドヘルドのハウジング内に収容され、プロセッサに電子的に結合され、プロセッサを制御するための第1のコードを記憶するメモリと、ハンドヘルドのハウジングの外部からアクセス可能であり、プロセッサに電子的に結合されるディスプレイと、ハンドヘルドのハウジング内に収容され、プロセッサ、メモリ、およびディスプレイに結合され、プロセッサ、メモリ、およびディスプレイに電力を供給するバッテリとを含む。 A system comprising an oximeter probe, the oximeter probe is housed in a handheld housing, a processor housed in the handheld housing, and housed in the handheld housing, electronically coupled to the processor to control the processor. A memory that stores a first code for storage, a display that is accessible from outside the handheld housing and is electronically coupled to the processor, and a display that is housed within the handheld housing and coupled to the processor, memory, and display. Includes a processor, memory, and a battery that powers the display.
このコードは、プロセッサによって実行可能な命令を含み、その命令は、第1の時間にオキシメータプローブの源構造を制御して第1の光を患者の標的組織に照射することと、標的組織から反射された第1の反射光の、オキシメータプローブの複数の検出器構造による検出を制御することと、検出器構造によって検出された第1の反射光について検出器構造によって生成される第1の反射率データを検出器構造から受信することと、反射率データを複数のシミュレート反射率曲線に適合させることと、第1の反射率データの、複数のシミュレート反射率曲線への適合から、シミュレート反射率曲線のうちの1つ以上の最良適合曲線を判断することとのためのものであり、各シミュレート反射率曲線は、吸収係数の値に関連付けられ、命令はさらに、シミュレート反射率曲線のうち、第1の反射率データに対して最良に適合する1つ以上の曲線について、少なくとも第1の吸収係数を判断することと、第1の吸収係数に基づいて第1の酸素飽和度の第1の値を判断することと、第1の酸素飽和度の第1の値をメモリに格納することとのためのものである。 This code includes instructions that can be executed by the processor, which control the source structure of the oximeter probe during the first time to illuminate the patient's target tissue with a first light and from the target tissue. Controlling the detection of the reflected first reflected light by the plurality of detector structures of the oximeter probe, and the first reflected light detected by the detector structure is produced by the detector structure. From receiving reflectance data from the detector structure, adapting the reflectance data to multiple simulated reflectance curves, and adapting the first reflectance data to multiple simulated reflectance curves. For determining the best fit curve of one or more of the simulated reflectance curves, each simulated reflectance curve is associated with an absorption coefficient value, and the instructions are further simulated reflections. Determining at least the first absorption coefficient for one or more of the rate curves that best fits the first reflectance data and the first oxygen saturation based on the first absorption coefficient. It is for determining the first value of the degree and storing the first value of the first oxygen saturation in the memory.
このコードは、プロセッサによって実行可能な命令を含み、その命令は、第2の時間にオキシメータプローブの源構造を制御して標的組織に第2の光を照射することと、標的組織から反射された第2の反射光をオキシメータプローブの複数の検出器構造によって検出することと、検出器構造によって検出された第2の反射光について第2の反射率データを検出器構造によって生成することと、第2の反射率データを複数のシミュレート反射率曲線に適合させることと、第2の反射率データの、複数のシミュレート反射率曲線への適合から、シミュレート反射率曲線のうちの1つ以上の最良適合曲線を判断することと、シミュレート反射率曲線のうち、第2の反射率データに対して最良に適合する1つ以上の曲線について、少なくとも第2の吸収係数を判断することと、第2の吸収係数に基づいて第2の酸素飽和度の第2の値を判断することとのためのものである。 This code contains instructions that can be executed by the processor, which are reflected from the target tissue to control the source structure of the oximeter probe to illuminate the target tissue with a second light during the second time. The second reflected light is detected by a plurality of detector structures of the oximeter probe, and the second reflectance data is generated by the detector structure for the second reflected light detected by the detector structure. , One of the simulated reflectance curves from the adaptation of the second reflectance data to multiple simulated reflectance curves and the adaptation of the second reflectance data to multiple simulated reflectance curves. Determining one or more best fit curves and determining at least the second absorption coefficient for one or more of the simulated reflectance curves that best fits the second reflectance data. And for determining the second value of the second oxygen saturation based on the second absorption coefficient.
このコードは、プロセッサによって実行可能な命令を含み、その命令は、メモリから第1の値を検索することと、第1の値と第2の値との間の百分率差を判断することと、オキシメータプローブのディスプレイ上に百分率差を表示することを制御することとのためのものである。 This code contains an instruction that can be executed by the processor, which retrieves the first value from memory and determines the percentage difference between the first and second values. It is for controlling the display of percentage differences on the display of the oximeter probe.
一実施態様では、ある方法は、患者の標的組織にプローブ先端を接触させることと、第1の時間にオキシメータプローブの源構造から標的組織に第1の光を透過することと、標的組織から反射された第1の反射光をオキシメータプローブの複数の検出器構造によって検出することと、検出器構造によって検出された第1の反射光の第1の反射率データを検出器構造によって生成することと、反射率データを複数のシミュレート反射率曲線に適合させることと、第1の反射率データの、複数のシミュレート反射率曲線への適合から、シミュレート反射率曲線のうちの1つ以上の最良適合曲線を判断することとを備え、各シミュレート反射率曲線は、吸収係数の値に関連付けられ、方法はさらに、シミュレート反射率曲線のうち、第1の反射率データに対して最良に適合する1つ以上の曲線について、少なくとも第1の吸収係数を判断することと、第1の吸収係数に基づいて第1の組織測定値の第1の値を判断することと、組織測定値の第1の値をメモリに格納することとを備える。 In one embodiment, one method is to bring the probe tip into contact with the patient's target tissue, to transmit the first light from the source structure of the oximeter probe to the target tissue at the first time, and from the target tissue. The reflected first reflected light is detected by a plurality of detector structures of the oximeter probe, and the first reflectance data of the first reflected light detected by the detector structure is generated by the detector structure. One of the simulated reflectance curves from the fact that the reflectance data is adapted to multiple simulated reflectance curves and that the first reflectance data is adapted to multiple simulated reflectance curves. Each simulated reflectance curve is associated with a value of the absorption coefficient, and the method further comprises determining the first reflectance data of the simulated reflectance curves. Determining at least the first absorption coefficient for one or more curves that best fit, determining the first value of the first micrometric value based on the first absorption coefficient, and microstructural measurement. It comprises storing the first value of the value in memory.
本方法は、第2の時間にオキシメータプローブの源構造から標的組織に第2の光を透過することと、標的組織から反射された第2の反射光をオキシメータプローブの複数の検出器構造によって検出することと、検出器構造によって検出された第2の反射光について第2の反射率データを検出器構造によって生成することと、第2の反射率データを複数のシミュレート反射率曲線に適合させることと、第2の反射率データの、複数のシミュレート反射率曲線への適合から、シミュレート反射率曲線のうちの1つ以上の最良適合曲線を判断することと、シミュレート反射率曲線のうち、第2の反射率データに対して最良に適合する1つ以上の曲線について、少なくとも第2の吸収係数を判断することと、第2の吸収係数に基づいて第2の組織測定値の第2の値を判断することとを備える。 In this method, the second light is transmitted from the source structure of the oximeter probe to the target tissue at the second time, and the second reflected light reflected from the target tissue is transmitted to a plurality of detector structures of the oximeter probe. The second reflectance data is generated by the detector structure for the second reflected light detected by the detector structure, and the second reflectance data is converted into a plurality of simulated reflectance curves. Determining one or more of the simulated reflectance curves from the matching and fitting of the second reflectance data to multiple simulated reflectance curves, and the simulated reflectance. For one or more of the curves that best fits the second reflectance data, determine at least the second absorption coefficient and the second tissue measurement based on the second absorption coefficient. It is provided with determining the second value of.
本方法は、メモリから第1の値を検索することと、第1の組織測定値と第2の組織測定値との間の百分率差を判断することと、オキシメータプローブのディスプレイ上に第1の組織測定値と第2の組織測定値との間の百分率差を表示することとを備える。 The method retrieves the first value from memory, determines the percentage difference between the first and second tissue measurements, and the first on the display of the oximeter probe. It comprises displaying the percentage difference between the tissue measured value of the first and the second tissue measured value.
本発明の他の目的、特徴および利点は、以下の詳細な説明および添付の図面を考慮することにより明らかになるであろう。図面において、同様の参照記号は図面全体にわたって同様の特徴を表す。 Other objects, features and advantages of the invention will become apparent by taking into account the following detailed description and accompanying drawings. In drawings, similar reference symbols represent similar features throughout the drawing.
発明の詳細な記載
図1は、実施形態におけるオキシメータプローブ101を示す。オキシメータプローブ101は、術中および術後などの組織オキシメトリ測定を行うように構成される。オキシメータプローブ101は、プローブユニット105、および感知アーム111の端部に配置されてもよいプローブ先端110(センサヘッドとも呼ばれる)を含むハンドヘルドデバイスであってもよい。オキシメータプローブ101は、近赤外光などの光をプローブ先端110から組織に照射し、プローブ先端で組織から反射した光を収集することによって、組織の酸素飽和度を測定するように構成される。
Detailed Description of the Invention FIG. 1 shows an
オキシメータプローブ101は、オキシメータプローブによって行われた酸素飽和度測定をユーザに通知するディスプレイ115または他の通知装置を含む。プローブ先端110は、ハンドヘルドデバイスであるオキシメータプローブ101と共に使用するように構成されていると説明されているが、プローブ先端110は、ベースユニットに結合するケーブル装置の端部にプローブ先端があるモジュール式オキシメータプローブなどの他のオキシメータプローブとともに用いることもできる。ケーブル装置は、1人の患者に使用するように構成された使い捨て装置であってもよく、ベースユニットは、繰り返し使用するように構成された装置であってもよい。そのようなモジュール式オキシメータプローブは、当業者には十分に理解されており、これ以上説明しない。
The
図2は、実現例におけるプローブ先端110の端面図を示す。プローブ先端110は、組織酸素濃度測定が行われるべき組織(例えば、患者の皮膚)に接触するように構成される。プローブ先端110は、第1および第2の源構造120aおよび120b(概して源構造120)と、第1、第2、第3、第4、第5、第6、第7および第8の検出器構造125a~125h(概して検出器構造125)とを含む。代替的実現例では、オキシメータプローブは、より多くのもしくはより少ない源構造を含むか、より多くのもしくはより少ない検出器構造を含むか、またはその両方を含む。
FIG. 2 shows an end view of the
各源構造120は、光(例えば、赤外光)を照射するように適合され、照射される光を生成する4つの光源のような、1つ以上の光源を含む。各光源は、1つ以上の波長の光を照射することができる。各光源は、発光ダイオード(LED)、レーザダイオード、有機発光ダイオード(OLED)、量子ドットLED(QMLED)、または他のタイプの光源を含むことができる。 Each source structure 120 includes one or more light sources, such as four light sources adapted to emit light (eg, infrared light) and producing the emitted light. Each light source can irradiate light of one or more wavelengths. Each light source can include a light emitting diode (LED), a laser diode, an organic light emitting diode (OLED), a quantum dot LED (QMLED), or another type of light source.
各源構造は、光源をプローブ先端の面127に光学的に結合する1つ以上の光ファイバを含むことができる。一実現例では、各源構造は4つのLEDを含み、4つのLEDをプローブ先端の面に光学的に結合する単一の光ファイバを含む。代替的実現例では、各源構造は、LEDをプローブ先端の面に光学的に結合する2つ以上の光ファイバ(例えば、4つの光ファイバ)を含む。
Each source structure can include one or more optical fibers that optically couple the light source to the
各検出器構造は、1つ以上の検出器を含む。一実現例では、各検出器構造は、源構造から照射され、組織から反射された光を検出するように適合された単一の検出器を含む。検出器は、光検出器、光抵抗器、または他のタイプの検出器とすることができる。検出器構造は、2つ以上の(例えば、8つの)固有の源-検出器距離が形成されるように、源構造に対して配置される。 Each detector structure comprises one or more detectors. In one embodiment, each detector structure comprises a single detector adapted to detect the light emitted from the source structure and reflected from the tissue. The detector can be a photodetector, a photoresistor, or another type of detector. The detector structure is arranged relative to the source structure so that two or more (eg, eight) unique source-detector distances are formed.
一実現例では、最短の源-検出器距離はほぼ等しい。例えば、源構造120aと検出器構造125dとの間の最短の源-検出器距離(S1-D4)と、源構造120bと検出器構造125aとの間の最短の源-検出器距離(S2-D8)とは、ほぼ等しい。源構造120aと検出器構造125eとの間の次に長い源-検出器距離(例えばS1-D4およびS2-D8の各々より長い)(S1-D5)と、源構造120bと検出器構造125aとの間の次に長い源-検出器距離(S2-D1)とは、ほぼ等しい。源構造120aと検出器構造125cとの間の次に長い源-検出器距離(例えばS1-D5およびS2-D1の各々より長い)(S1-D3)と、源構造120bと検出器構造125gとの間の次に長い源-検出器距離(S2-D7)とは、ほぼ等しい。源構造120aと検出器構造125fとの間の次に長い源-検出器距離(例えばS1-D3およびS2-D7の各々より長い)(S1-D6)と、源構造120bと検出器構造125bとの間の次に長い源-検出器距離(S2-D2)とは、ほぼ等しい。源構造120aと検出器構造125cとの間の次に長い源-検出器距離(例えばS1-D6およびS2-D2の各々より長い)(S1-D2)と、源構造120bと検出器構造125fとの間の次に長い源-検出器距離(S2-D6)とは、ほぼ等しい。源構造120aと検出器構造125gとの間の次に長い源-検出器距離(例えばS1-D2およびS2-D6の各々より長い)(S1-D7)と、源構造120bと検出器構造125cとの間の次に長い源-検出器距離(S2-D3)とは、ほぼ等しい。源構造120aと検出器構造125aとの間の次に長い源-検出器距離(例えばS1-D7およびS2-D3の各々より長い)(S1-D1)と、源構造120bと検出器構造125eとの間の次に長い源-検出器距離(S2-D5)とは、ほぼ等しい。源構造120aと検出器構造125hcとの間の次に長い源-検出器距離(例えば最長の源-検出器距離、S1-D1およびS2-D5の各々より長い)(S1-D8)と、源構造120bと検出器構造125dとの間の次に長い源-検出器距離(S2-D4)とは、ほぼ等しい。他の実現例では、源-検出器距離は、すべて固有であるか、またはほぼ等しい8つ未満の距離を有することができる。
In one implementation, the shortest source-detector distances are approximately equal. For example, the shortest source-detector distance (S1-D4) between the
以下の表1は、ある実現例による8つの固有の源-検出器距離を示す。最も近い源-検出器距離間の増加は約0.4ミリメートルである。 Table 1 below shows eight unique source-detector distances according to an embodiment. The increase between the nearest source-detector distance is about 0.4 mm.

実施形態では、オキシメータプローブが照射するように構成された光の各波長(例えば、可視スペクトルにおける赤色光、赤外光、または可視光および赤外光の両方などの、2つ、3つ、4つまたはそれ以上の波長の光)ごとに、オキシメータプローブは、少なくとも、約1.5ミリメートル未満、約1.6ミリメートル未満、約1.7ミリメートル未満、約1.8ミリメートル未満、約1.9ミリメートル未満、または約2.0ミリメートル未満である2つの源-検出器距離、および約2.5ミリメートルより大きく、約4ミリメートル未満、約4.1ミリメートル未満、約4.2ミリメートル未満、約4.3ミリメートル未満、約4.4ミリメートル未満、約4.5ミリメートル未満、約4.6ミリメートル未満、約4.7ミリメートル未満、約4.8ミリメートル未満、約4.95ミリメートル未満、または約5ミリメートル未満である2つの源-検出器距離を含む。 In embodiments, two, three, each wavelength of light configured to be emitted by the oximeter probe, such as red light, infrared light, or both visible and infrared light in the visible spectrum. For every 4 or more wavelengths of light), the oximeter probe is at least less than about 1.5 mm, less than about 1.6 mm, less than about 1.7 mm, less than about 1.8 mm, about 1. Two sources less than 9.9 mm, or less than about 2.0 mm-detector distance, and greater than about 2.5 mm, less than about 4 mm, less than about 4.1 mm, less than about 4.2 mm, Less than about 4.3 mm, less than about 4.4 mm, less than about 4.5 mm, less than about 4.6 mm, less than about 4.7 mm, less than about 4.8 mm, less than about 4.95 mm, or Includes two source-detector distances that are less than about 5 millimeters.
一実現例では、検出器構造125aおよび125eは、源120aと120bとを接続する直線上にある点の周りに対称的に配置される。検出器構造125bおよび125fは、その点の周りに対称的に配置される。検出器構造125cおよび125gは、その点の周りに対称的に配置される。検出器構造125dおよび125hは、その点の周りに対称的に配置される。この点は、源構造120aと120bとの間においてその接続線上の中心に置くことができる。
In one embodiment, the
源-検出器距離対検出器構造125によって検出された反射率のプロットにより、データ点がx軸に沿って十分に離間している反射率曲線を提供することができる。源構造120aと120bと検出器構造125との間の距離のこれらの間隔は、データの冗長性を低減し、相対的に正確な反射率曲線の生成に至り得る。
The reflectance plot detected by the source-detector distance vs. detector structure 125 can provide a reflectance curve with the data points sufficiently spaced along the x-axis. These spacings in the distance between the
一実現例では、源構造および検出器構造をプローブ表面上の様々な位置に配置して、(上に示したような)所望の距離を与えることができる。例えば、2つの源が線を形成し、この線の上下に等しい数の検出器が存在する。検出器の位置(線の上)は、2つの源の線上の選択された点について、別の検出器(線の下)と点対称になる。一例として、選択された点は、2つの源間の中間であってもよいが、必ずしもそうである必要はない。他の実現例では、この位置決めは、円形、楕円形、卵形、無作為、三角形、矩形、四角形、または他の形状などの形状に基づいて配置することができる。 In one embodiment, the source and detector structures can be placed at various locations on the probe surface to provide the desired distance (as shown above). For example, two sources form a line, and there are an equal number of detectors above and below this line. The position of the detector (above the line) is point symmetric with another detector (below the line) for the selected point on the line of the two sources. As an example, the selected point may, but does not necessarily have, be between the two sources. In other implementations, this positioning can be based on shapes such as circles, ellipses, oval, random, triangles, rectangles, rectangles, or other shapes.
以下の特許出願は、様々なオキシメータ装置および酸素測定動作を記載しており、以下の特許出願における議論は、本願に記載された本発明の局面と任意の組み合わせで組み合わせることができる。以下の特許出願、すなわち2015年11月17日に出願された特許出願第14/944,139号、2013年5月3日に出願された第13/887,130号、2016年5月24日に出願された第15/163,565号、2013年5月3日に出願された13/887,220号、2016年7月19日に出願された第15/214,355号、2013年5月3日に出願された第13/887,213号、2015年12月21日に出願された第14/977,578号、2013年6月7日に出願された第13/887,178号、2016年7月26日に出願された第15/220,354号、2013年8月12日に出願された第13/965,156号、2016年11月22日に出願された第15/359,570号、2013年5月3日に出願された第13/887,152号、2016年4月16日に出願された第29/561,749号、2012年5月3日に出願された第61/642,389号,第61/642,393号,第61/642,395号,第61/642,399号、2012年8月10日に出願された第61/682,146号、2017年4月20日に出願された第15/493,132号,第15/493,111号,第15/493,121号、2017年4月21日に出願された第15/494,444号、2017年4月24日に出願された第15/495,194号,第15/495,205号、および第15/495,212号は、これらの出願において引用されるすべての参照文献とともにここに引用により援用される。 The following patent applications describe various oximeter devices and oxygen measurement operations, and the discussions in the following patent applications can be combined with aspects of the invention described herein in any combination. The following patent applications, namely Patent Application Nos. 14 / 944,139 filed on November 17, 2015, Nos. 13 / 887,130 filed on May 3, 2013, May 24, 2016. 15 / 163,565 filed in, 13 / 887,220 filed May 3, 2013, 15 / 214,355 filed July 19, 2016, 2013 5 Nos. 13 / 887,213 filed on March 3, 2015, Nos. 14 / 977,578 filed on December 21, 2015, and Nos. 13 / 887,178 filed on June 7, 2013. , 15 / 220,354 filed on July 26, 2016, 13 / 965, 156 filed on August 12, 2013, 15 / filed on November 22, 2016. 359,570, 13 / 887,152 filed May 3, 2013, 29 / 561,749 filed April 16, 2016, filed May 3, 2012 No. 61 / 642,389, No. 61 / 642,393, No. 61 / 642,395, No. 61 / 642,399, No. 61 / 682,146 filed on August 10, 2012. , 15 / 494,132, 15 / 494,111, 15 / 494,121, filed April 20, 2017, 15 / 494, filed April 21, 2017. No. 444, Nos. 15 / 495,194, 15 / 495,205, and 15 / 495,212, filed April 24, 2017, are all references cited in these applications. Also incorporated here by citation.
図3は、実現例におけるオキシメータプローブ101のブロック図を示す。オキシメータプローブ101は、ディスプレイ115、プロセッサ116、メモリ117、スピーカ118、1つ以上のユーザ選択デバイス119(例えば、1つ以上のボタン、スイッチ、ディスプレイ115に関連するタッチ入力デバイス)、源構造の組120、検出器構造の組125、および電源(例えば、バッテリ)127を含む。前述の挙げられた構成要素は、オキシメータプローブ101のシステムバスアーキテクチャであってもよいバス128を介して一緒に接続されてもよい。この図は、各構成要素に接続する1つのバスを示しているが、このバス接続は、これらの構成要素またはオキシメータプローブ101に含まれる他の構成要素を接続するのに役立つ任意の相互接続方式の例である。例えば、スピーカ118は、ポートを介してサブシステムに接続されてもよく、またはプロセッサ116への内部直接接続を有してもよい。さらに、記載された構成要素は、実現例ではオキシメータプローブ101の可動ハウジング(図1参照)に収容される。
FIG. 3 shows a block diagram of the
プロセッサ116は、マイクロプロセッサ、マイクロコントローラ、マルチコアプロセッサ、または他のプロセッサタイプを含むことができる。メモリ117は、揮発性メモリ117a(例えば、RAM)、不揮発性メモリ117b(例えば、ディスクまたはフラッシュ)などの様々なメモリを含むことができる。オキシメータプローブ101の異なる実現例は、任意の組み合わせまたは構成において、任意の数の列挙された構成要素を含むことができ、図示されていない他の構成要素も含むことができる。
Processor 116 can include microprocessors, microcontrollers, multi-core processors, or other processor types. The
電源127は、使い捨て電池のようなバッテリとすることができる。使い捨て電池は、蓄積された電荷が消費された後に廃棄される。いくつかの使い捨て電池化学技術は、アルカリ、亜鉛炭素、または酸化銀を含む。バッテリは、ハンドヘルドの装置の使用を数時間の間可能にするのに十分な蓄積電荷を有する。ある実現例ではオキシメータプローブは廃棄可能である。
The
他の実現例では、バッテリは再充電可能であり、バッテリは、蓄積された電荷が消費された後、複数回充電され得る。いくつかの充電式電池化学技術は、ニッケルカドミウム(NiCd)、ニッケル金属水素化物(NiMH)、リチウムイオン(Liイオン)および亜鉛空気を含む。例えば、ハンドヘルドのユニットに接続するコードを備えたACアダプタを介して、バッテリを充電することができる。ハンドヘルドのユニット内の回路系は、再充電回路(図示せず)を含むことができる。充電式電池化学のバッテリは、使い捨て電池として使用されてもよく、バッテリは再充電されずに使用後廃棄される。 In another embodiment, the battery is rechargeable and the battery can be charged multiple times after the stored charge has been consumed. Some rechargeable battery chemistry technologies include nickel cadmium (NiCd), nickel metal hydride (NiMH), lithium ion (Li ion) and zinc air. For example, the battery can be charged via an AC adapter with a cord that connects to a handheld unit. The circuit system within the handheld unit can include a recharge circuit (not shown). The rechargeable battery chemical battery may be used as a disposable battery, and the battery is discarded after use without being recharged.
図4Aおよび図4Bは、実施形態におけるオキシメータプローブ101の上面図を示す。上面図は、ディスプレイ115がオキシメータプローブの頂部のプローブユニット105に配置されるのを示す。ディスプレイは、オキシメータプローブに関する情報およびプローブによって行われる測定についての測定情報の1つ以上を表示するように適合される。
4A and 4B show a top view of the
一実施形態では、ディスプレイは、オキシメータプローブによって測定される組織の酸素飽和度200の値(「酸素飽和度値」)を表示するように適合される。ディスプレイは、百分率値としての酸素飽和度、1つ以上の色(例えば、ディスプレイがカラーディスプレイである場合)のある数の棒を有する棒グラフ、または他の表示可能な情報を表示することができる。 In one embodiment, the display is adapted to display a value of tissue oxygen saturation 200 (“oxygen saturation value”) as measured by the oximeter probe. The display can display oxygen saturation as a percentage value, a bar graph with a number of bars with one or more colors (eg, if the display is a color display), or other displayable information.
ディスプレイは、例えばリセットからオキシメータプローブが動作していた期間の値205を表示するように構成することもできる。オキシメータプローブのリセットは、プローブ内の電池が変えられたとき、先に未使用であった電池(新しい電池)の組の最初の電力上昇から、ハードパワーダウンからの電力上昇から、ソフトパワーダウン(例:冬眠モード)からの電力上昇から、または他のリセットイベントで、生じ得る。 The display can also be configured to display, for example, a value of 205 during the period the oximeter probe has been operating since the reset. The reset of the oximeter probe is from the first power increase of the previously unused battery (new battery) set to the power increase from the hard power down to the soft power down when the battery in the probe is changed. It can occur from a power rise from (eg, hibernate mode) or at another reset event.
ディスプレイは、血液量ごとの総ヘモグロビンの値225を表示する(図4A)か、または血液量の値(例えば、プローブされた組織の体積当たりの血液の百分率、図4B)を表示することができる。オキシメータプローブによる総ヘモグロビンおよび血液量の測定を以下に記載する。ある実施形態では、メラニンの表示値は、ヘモグロビン濃度を表す値(例えば、指標値)であり、組織体積におけるヘモグロビン濃度がサンプリングされ、その値は、無単位の値であってもよい。 The display can display a total hemoglobin value of 225 per blood volume (FIG. 4A) or a blood volume value (eg, percentage of blood per volume of probed tissue, FIG. 4B). .. Measurements of total hemoglobin and blood volume with an oximeter probe are described below. In certain embodiments, the melanin display value is a value representing the hemoglobin concentration (eg, an index value), the hemoglobin concentration in the tissue volume is sampled, and the value may be a unitless value.
図4Cは、ディスプレイが組織の相対酸素飽和度の値を表示するように適合された実施形態におけるオキシメータプローブ101の上面図を示す。相対酸素飽和度の値は、第1の時間に判断された酸素飽和度の第1の値および第1の時間後の第2の時間に判断された酸素飽和度の第2の値についての百分率差として表示することができる。
FIG. 4C shows a top view of the
一実施形態では、オキシメータプローブは、絶対St02および相対St02の値、総ヘモグロビンおよび相対St02の値、血液量および相対ヘモグロビンの値などの、情報の他の組み合わせを表示することができる。図4Eは、ディスプレイが絶対酸素飽和度および相対酸素飽和度の値を表示するオキシメータプローブ101の上面図を示す。
In one embodiment, the oximeter probe can display other combinations of information such as absolute St02 and relative St02 values, total hemoglobin and relative St02 values, blood volume and relative hemoglobin values. FIG. 4E shows a top view of the
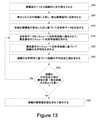
図4F~図4Gは、組織の相対酸素飽和度の値を判断し、その値をディスプレイ上に表示する方法のフロー図を示す。このフロー図は、1つの実施形態を表している。ステップは、実施形態の範囲から逸脱することなく、フロー図に対して追加、削除、または結合することができる。 4F to 4G show a flow chart of a method of determining a value of relative oxygen saturation of a tissue and displaying the value on a display. This flow chart represents one embodiment. Steps can be added, deleted, or combined with respect to the flow diagram without departing from the scope of the embodiment.
400で、入力装置(例えば、オキシメータプローブのボタン119または第2のボタンのようなボタン、オキシメータプローブのロッカースイッチ、または他の入力装置)が活性化される。入力装置は、ユーザによって起動することができる。入力装置を活性化させると、オキシメータプローブは「相対」動作モードにされ、オキシメータプローブは組織の相対酸素飽和度の値を判断することができる。ボタンを比較的速く2回押して(例えば、「ダブルクリック」)活性化させることによって、オキシメータプローブを相対モードにセットしてもよい。入力装置の第2の活性化(例えば、その後のボタンのダブルクリック)または別の入力装置(例えば、第3のボタン)の活性化は、オキシメータ装置を「絶対」モードにし、オキシメータプローブは、組織の絶対酸素飽和度の値を判断できる。
At 400, the input device (eg, a button such as a
405で、オキシメータプローブ101は、第1の期間で、源構造の1つから組織内に光(例えば、近赤外光)を照射する。照射された光が組織から反射した後、検出器構造125は光を検出し(ステップ410)、組織の反射率データを生成する(ステップ415)。ステップ405、410、および415は、複数の波長の光について、および源構造120bなどの1つ以上の他の源構造について繰り返されてもよい。
At 405, the
420において、オキシメータプローブは反射率データをシミュレート反射率曲線315に適合させ、反射率データが最良適合を有するシミュレート反射率曲線を求める。メモリに格納され、反射率データに適合されるデータベースは、以下に記載されるデータベース900、データベース1000、またはデータベース1100であり得る。その後、ステップ425において、オキシメータプローブは、反射率データに最良適合するシミュレート反射率曲線の光学特性に基づいて、組織の光学特性(例えば、データベース900またはデータベース1000の場合ではμaおよびμ's、またはデータベース1100の場合ではメラニン含有量、酸素飽和度の第1の値、血液量および散乱)を求める。例えば、オキシメータプローブがデータベース900または1000からμaおよびμ'sを判断する場合、オキシメータプローブは、その後、吸収係数(μa)を用いて酸素飽和度の第1の値を判断することができる。μaからの酸素飽和度の値の判断は以下に記載される。
At 420, the oximeter probe fits the reflectance data to the
ステップ430において、オキシメータプローブの入力装置(例えば、記載された入力装置のいずれかまたは他の入力装置)が活性化される。入力装置を活性化させると、酸素飽和度値がオキシメータプローブのメモリ(例えば、メモリ117、プロセッサのバッファメモリ、または他のメモリ)に格納される。第1の値のタイムスタンプも格納できる。
At
435で、オキシメータプローブ101は、第1の期間後の第2の期間に、源構造の1つから組織(例えば2つの乳房または1つの乳房の対側乳房組織などのような、患者の異なる位置の異なる組織であり得る)内に光(例えば、近赤外光)を照射する。照射された光が組織から反射した後、検出器構造125は光を検出し(ステップ440)、組織についての反射率データを生成する(ステップ445)。ステップ435、440、および445は、複数の波長の光について、および源構造120bなどの1つ以上の他の源構造について繰り返されてもよい。
At 435, the
450において、オキシメータプローブは反射率データをシミュレート反射率曲線315に適合させ、反射率データが最良適合を有するシミュレート反射率曲線を求める。メモリに格納され、反射率データに適合されるデータベースは、以下に記載されるデータベース900、データベース1000、またはデータベース1100であり得る。その後、ステップ455において、オキシメータプローブは、反射率データに最良適合するシミュレート反射率曲線の光学特性に基づいて、組織の光学特性(例えば、データベース900またはデータベース1000の場合ではμaおよびμ's、またはデータベース1100の場合ではメラニン含有量の第2の値、酸素飽和度の第2の値、血液量の第2の値および散乱の第2の値)を求める。例えば、オキシメータプローブがデータベース900または1000からμaおよびμ'sを判断する場合、オキシメータプローブは、その後、吸収係数(μa)を用いて酸素飽和度の第2の値を判断することができる。
At 450, the oximeter probe fits the reflectance data to the
ステップ460において、プロセッサは、酸素飽和度の第1の値と第2の値との間の差(例えば、百分率差)(例えば、相対酸素飽和度)を計算する。ステップ465で、酸素飽和度の差または百分率差がディスプレイに表示される。相対的な酸素飽和度値は、第2の期間後、および第2の酸素飽和度値の判断後まで、表示に利用することはできない。一実施形態では、相対酸素飽和度値は、記号でディスプレイに表示され、第2の酸素飽和度値が第1の酸素飽和度値より上であること(例えば、上向き矢印を表示)、第1の酸素飽和度値より下であること(例えば、下向き矢印を表示)、または第1の酸素飽和度値と等しいこと(例えば、ダッシュまたは他の記号を表示)を示す。記号インジケータが表示されているときは、酸素飽和度の数値は表示されなくてもよい。酸素飽和度の数値が表示されているときに記号インジケータが表示されてもよい。
In
酸素飽和度の後続値(第3、第4、第5およびそれ以上)を計算するために、ステップ435~465を継続的な態様で繰り返すことができる。これにより、オキシメータプローブは、第1の時間での酸素飽和度の値に対する、後の時間での酸素飽和度における継続的な変化を判断および表示する。相対モードに対する出入りは、酸素飽和度の第1の値をリセットすることができる。 Steps 435-465 can be repeated in a continuous manner to calculate subsequent values of oxygen saturation (third, fourth, fifth and higher). Thereby, the oximeter probe determines and displays a continuous change in oxygen saturation at a later time with respect to the value of oxygen saturation at the first time. Entering and exiting the relative mode can reset the first value of oxygen saturation.
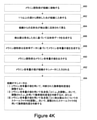
図4F~図4Gに示す方法のステップは、第1の時間における第1の組織測定、(第1の期間の後の)第2の時間における第2の組織測定、(第2の期間の後の)第3の時間における第3の組織測定、またはそれより後の時間における、より多くの組織測定など、複数の組織測定のために繰り返され得る。計算および表示された相対酸素飽和度値は、第1および第2の組織測定値(例えば、第1の相対酸素飽和度)、第2および第3の組織測定値(例えば、第2の相対酸素飽和度値)、または第1および第3の組織測定値(例えば、第3相対酸素飽和度)についてであり得る。第1、第2および第3の組織測定値は、2つの同じ組織位置、2つの異なる組織位置、または3つの異なる組織位置についてのものであり得る。第1、第2または第3の相対酸素飽和度値(例えば、第1、第2および第3の動作モード)の表示は、ユーザにより、ユーザ入力(例えば、ボタン119、タッチスクリーン、または他のもの)の操作を介して選択され得る。
The steps of the method shown in FIGS. 4F-4G are the first tissue measurement at the first time, the second tissue measurement at the second time (after the first period), and the second tissue measurement (after the second period). Can be repeated for multiple tissue measurements, such as a third tissue measurement at a third time, or more tissue measurements at a later time. The calculated and displayed relative oxygen saturation values are first and second tissue measurements (eg, first relative oxygen saturation), second and third tissue measurements (eg, second relative oxygen). It can be for saturation values), or for first and third tissue measurements (eg, third relative oxygen saturation). The first, second and third tissue measurements can be for two identical tissue positions, two different tissue positions, or three different tissue positions. The display of the first, second or third relative oxygen saturation values (eg, first, second and third operating modes) is user input (eg,
3つの動作モードのうちの2つ以上は、同時に動作され得、第1および第2の相対酸素飽和度値が同時に表示され(例えば、第3の相対酸素飽和度値は表示されない)、第2および第3の相対酸素飽和度が同時に表示され(例えば、第1の相対酸素飽和度値は表示されない)、第1および第3の相対酸素飽和度値が同時に表示される(例えば、第2の相対酸素飽和度値は表示されない)。 Two or more of the three operating modes can be operated simultaneously, with the first and second relative oxygen saturation values displayed simultaneously (eg, the third relative oxygen saturation value not displayed) and the second. And the third relative oxygen saturation are displayed simultaneously (eg, the first relative oxygen saturation value is not displayed) and the first and third relative oxygen saturation values are displayed simultaneously (eg, the second relative oxygen saturation value). Relative oxygen saturation values are not displayed).
一実施形態では、酸素飽和度値の百分率差(例えば、相対酸素飽和度値)が閾値量よりも大きいかもしくは小さい場合、または酸素飽和度の絶対値が閾値量よりも大きいかもしくは小さい場合に、通知を提供するように適合されてもよい。閾値量は、ディスプレイに表示される表示量から選択される、またはオキシメータプローブに有線もしくは無線で入力される、ユーザによってオキシメータプローブに入力される量とすることができる。この量は、図4Jのステップ470で入力される値とすることができる。百分率差が閾値を上回るかまたは下回る場合、表示される酸素飽和度値は、上向き矢印、下向き矢印、点滅表示、着色された表示値(例えば、赤色または緑色)、点灯した赤色LED、点灯した緑色LED、ディスプレイ上の点灯した赤い画素の組(例えば、赤色または緑色)、または他の表示などの1つ以上の追加の表示とともに表示されてもよい。オキシメータプローブは、酸素飽和度の百分率値が閾値を上回るかまたは下回る場合に、1つ以上の音(例えば、トーンまたはクリック)を発してもよく、または触覚フィードバック(例えば、振動)を提供してもよい。いくつかの実施形態では、百分率の差が閾値を下回る(例えば、酸素飽和度が低下する)が、閾値を超えない(例えば、酸素飽和度が増加しない)場合に、これらの追加の通知の1つ以上が表示される。
In one embodiment, the percentage difference in oxygen saturation value (eg, relative oxygen saturation value) is greater than or less than the threshold amount, or the absolute value of oxygen saturation is greater than or less than the threshold amount. , May be adapted to provide notifications. The threshold amount can be an amount selected from the display amount displayed on the display, or input to the oximeter probe by wire or wirelessly, and input to the oximeter probe by the user. This amount can be the value input in
オキシメータプローブは、酸素飽和度の百分率差(例えば、相対酸素飽和度)が閾値量よりも大きいかもしくは小さい場合、または酸素飽和度の絶対値が閾値量よりも絶対量だけ上もしくは下(例えば、閾値+オフセット値、および閾値-オフセット値)である場合に、酸素飽和度値の百分率差を表示するように適合させることができる。閾値の上下のオフセットは、閾値+閾値の2パーセントおよび閾値-閾値の2パーセント、閾値+閾値の5パーセントおよび閾値-閾値の5パーセント、閾値+閾値の1パーセントおよび閾値-閾値の5パーセント、閾値+閾値の5パーセントおよび閾値-閾値の2パーセント、または他の値のように、等しくても不等であってもよい。閾値の上下の上下絶対百分率は、ユーザによって、ディスプレイに表示された表示量から選択されて、オキシメータプローブに入力されるか、またはオキシメータプローブに有線もしくは無線で入力され得る。百分率の差が閾値+もしくは-絶対値オフセットより上または下である場合、表示される酸素飽和度値は、上向き矢印、下向き矢印、点滅表示、着色された表示値(例えば、赤色または緑色)、点灯した赤色LED、点灯した緑色LED、ディスプレイ上の点灯した赤い画素の組(例えば、赤色または緑色)、または他の表示などの1つ以上の追加の表示とともに表示されてもよい。オキシメータプローブは、酸素飽和度の百分率値が閾値を上回るかまたは下回る場合に、1つ以上の音(例えば、トーンまたはクリック)を発してもよく、または触覚フィードバック(例えば、振動)を提供してもよい。いくつかの実施形態では、百分率の差が閾値を下回る(例えば、酸素飽和度が低下する)が、閾値を超えない(例えば、酸素飽和度が増加しない)場合に、これらの追加の通知の1つ以上が表示される。いくつかの実施形態では、百分率の差が閾値を下回る(例えば、酸素飽和度が低下する)が、閾値を超えない(例えば、酸素飽和度が増加しない)場合に、これらの追加の通知の1つ以上が表示される。 Oxymeter probes are used when the percentage difference in oxygen saturation (eg, relative oxygen saturation) is greater than or less than the threshold, or the absolute value of oxygen saturation is above or below the threshold (eg, absolute). , Threshold + offset value, and threshold-offset value) can be adapted to display the percentage difference in oxygen saturation value. The offsets above and below the threshold are Threshold + 2% of Threshold and Threshold-2% of Threshold, Threshold + 5% of Threshold and Threshold-5% of Threshold, Threshold + 1% of Threshold and Threshold-5% of Threshold, Threshold. It may be equal or unequal, such as 5% of the + threshold and 2% of the threshold-threshold, or other values. Absolute percentages above and below the threshold may be selected by the user from the amount displayed on the display and input to the oximeter probe, or may be input to the oximeter probe by wire or wirelessly. If the percentage difference is above or below the threshold + or-absolute value offset, the oxygen saturation values displayed are up arrow, down arrow, blinking display, colored display value (eg red or green), It may be displayed with one or more additional displays such as a lit red LED, a lit green LED, a set of lit red pixels on the display (eg, red or green), or another display. The oximeter probe may emit one or more sounds (eg, tones or clicks) or provide tactile feedback (eg, vibration) when the oxygen saturation percentage is above or below the threshold. You may. In some embodiments, one of these additional notifications is when the percentage difference is below the threshold (eg, oxygen saturation decreases) but does not exceed the threshold (eg, oxygen saturation does not increase). One or more is displayed. In some embodiments, one of these additional notifications is when the percentage difference is below the threshold (eg, oxygen saturation decreases) but does not exceed the threshold (eg, oxygen saturation does not increase). One or more is displayed.
一実施形態では、酸素飽和度の第1の値と第2の値との間の百分率差ではなく、酸素飽和度の第1の値と第2の値との間の差を表示するように適合される。オキシメータプローブは、相対酸素飽和度が増加または減少したことを示す様々なインジケータのうちの1つ以上で百分率差または計算された差異を表示することができる。例えば、減少した相対酸素飽和度の値は、下向きの矢印(図4H)で、着色されたインジケータ(例えば、ディスプレイ上の赤い点またはプローブ105における赤色LEDのような点灯された赤色の照明要素)とともに表示することができる。例えば、増加した相対酸素飽和度の値は、上向きの矢印(図4I)で、着色されたインジケータ(例えば、ディスプレイ上の緑の点またはプローブ105における緑色LEDのような点灯された緑色の照明要素)とともに表示することができる。相対酸素飽和度の値は、値が減少する場合には第1の色(例えば赤色)で表示され、値が増加する場合には第2の色(例えば緑色)で表示され得る。オキシメータプローブは、百分率差の値または計算された差の値が減少する場合、その値を例えば点滅として表示することができる。オキシメータプローブは、例えば、これらの値が減少する場合、1つ以上のノイズを発するように適合させることができる。オキシメータプローブは、これらの値が減少する場合、触覚フィードバック(例えば、振動)を提供するように適合させることができる。相対酸素飽和度が下限閾値を下回って減少するか、上限閾値を超えて増加するか、またはそれら両方である場合、これらの追加のインジケータ(例えば、矢印、照射光、点滅表示、色、音、触覚フィードバック、または他のインジケータで表示された値)を発することができる。
In one embodiment, the difference between the first and second values of oxygen saturation is displayed instead of the percentage difference between the first and second values of oxygen saturation. Be adapted. The oximeter probe can display percentage differences or calculated differences at one or more of the various indicators that indicate an increase or decrease in relative oxygen saturation. For example, the reduced relative oxygen saturation value is a down arrow (FIG. 4H) with a colored indicator (eg, a red dot on the display or a lit red lighting element such as a red LED on the probe 105). Can be displayed with. For example, the increased relative oxygen saturation value is an upward arrow (FIG. 4I), a colored indicator (eg, a green dot on the display or a lit green lighting element such as a green LED on the
相対的な動作モードは、酸素飽和度(相対酸素飽和度)の値における相対的変化の知識が、医療処置を開始するか、進行させるか、または停止すべきかを判断するのに役立つ、多数の医療処置に有用であり得る。例えば、組織内の血流を減少させるためには、エピネフリン注入または他の薬物を患者に投与して(例えば、局所的に組織に投与して)組織内の血流を減少させ得る。エピネフリンを投与する前に、または他の薬物を患者に投与後比較的短い時間で、組織のヘモグロビン含有量または血液量の基線値を判断することができる(例えば、ステップ405~425で、ヘモグロビン含有量または血液量の第1の値を、例えば以下に説明するデータベース1100を使用して判断する)。
Relative modes of operation are numerous, with knowledge of relative changes in oxygen saturation (relative oxygen saturation) values helping to determine whether a medical procedure should be started, advanced, or stopped. May be useful for medical procedures. For example, to reduce blood flow in the tissue, epinephrine infusion or other drug may be administered to the patient (eg, locally administered to the tissue) to reduce blood flow in the tissue. Before administering epinephrine or in a relatively short time after administration of other drugs to the patient, the hemoglobin content or baseline value of blood volume in the tissue can be determined (eg, in steps 405-425, hemoglobin content. A first value of volume or blood volume is determined, for example, using the
その後、更新された相対的なヘモグロビン値または血液量値の継続中の表示に基づいて(例えば、ステップ435~425で、例えば、データベース1100を使用してヘモグロビン含有量または血液量の第2の値を判断する)、開業医は、エピネフリン投与が、血流を減少させることに成功したかどうか、組織内の血流をさらに減少させるために、より多くのエピネフリンを患者に投与する必要があるかどうか、または処置を停止すべきかどうか、判断することができる。すなわち、オキシメータプローブは更新された相対的なヘモグロビン値または血液量値を表示するので、開業医は、組織に作用する投薬を「観察」することができる。
Then, based on the ongoing display of the updated relative hemoglobin or blood flow values (eg, in steps 435-425, eg, using
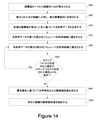
図4Jは、組織の相対酸素飽和度の値を判断し、その値をディスプレイ上に表示する方法のフロー図を示す。このフロー図は、1つの実施形態を表している。ステップは、実施形態の範囲から逸脱することなく、フロー図に対して追加、削除、または結合することができる。 FIG. 4J shows a flow chart of a method of determining a value of relative oxygen saturation of a tissue and displaying the value on a display. This flow chart represents one embodiment. Steps can be added, deleted, or combined with respect to the flow diagram without departing from the scope of the embodiment.
470において、オキシメータは、ユーザ入力または他の装置からの入力などの入力を介して酸素飽和度の第1の値を受信する。ユーザ入力は、1回以上のボタンの押下またはタッチスクリーンなどの他の入力装置を介して入力されてもよい。酸素飽和度の第1の値は、オキシメータプローブとの有線または無線接続を介してオキシメータプローブに入力されてもよい。いくつかの実施形態では、オキシメータプローブは、例えばボタン押下または他の入力によって、ユーザが選択できる酸素飽和度の第1の値の範囲を表示することができる。 At 470, the oximeter receives a first value of oxygen saturation via an input such as a user input or an input from another device. User input may be input via one or more button presses or other input devices such as a touch screen. A first value of oxygen saturation may be input to the oximeter probe via a wired or wireless connection to the oximeter probe. In some embodiments, the oximeter probe can display a range of first values of oxygen saturation that can be selected by the user, for example by pressing a button or other input.
471で、オキシメータプローブ101は、光源構造の1つから組織内に光(例えば、近赤外光)を照射する。照射された光が組織から反射した後、検出器構造125は光を検出し(ステップ472)、組織についての反射率データを生成する(ステップ473)。ステップ471、472、および473は、複数の波長の光について、および源構造120bなどの1つ以上の他の源構造について繰り返されてもよい。
At 471, the
474において、オキシメータプローブは反射率データをシミュレート反射率曲線315に適合させ、反射率データが最良適合を有するシミュレート反射率曲線を求める。メモリに格納され、反射率データに適合されるデータベースは、以下に記載されるデータベース900、データベース1000、またはデータベース1100であり得る。その後、ステップ475において、オキシメータプローブは、反射率データに最良適合するシミュレート反射率曲線の光学特性に基づいて、組織の光学特性(例えば、データベース900またはデータベース1000の場合ではμaおよびμ's、またはデータベース1100の場合ではメラニン含有量の第2の値、酸素飽和度の第2の値、血液量の第2の値および散乱の第2の値)を求める。例えば、オキシメータプローブがデータベース900または1000からμaおよびμ'sを判断する場合、オキシメータプローブは、その後、吸収係数(μa)を用いて酸素飽和度の第2の値を判断することができる。
At 474, the oximeter probe fits the reflectance data to the
ステップ460において、プロセッサは、酸素飽和度の第1の値と第2の値との間の差(例えば、百分率差)を計算する。ステップ477で、酸素飽和度値の百分率差がディスプレイに表示される。
In
酸素飽和度の後続値(第3、第4、第5およびそれ以上)を計算するために、ステップ471~477を継続的な態様で繰り返すことができる。これにより、オキシメータプローブは、第1の時間での酸素飽和度の値に対する、後の時間での酸素飽和度における継続的な変化を判断および表示する。相対モードに対する出入りは、酸素飽和度の第1の値をリセットすることができる。 Steps 471-477 can be repeated in a continuous manner to calculate subsequent values of oxygen saturation (third, fourth, fifth and higher). Thereby, the oximeter probe determines and displays a continuous change in oxygen saturation at a later time with respect to the value of oxygen saturation at the first time. Entering and exiting the relative mode can reset the first value of oxygen saturation.
組織分析図4Kは、ある実施形態においてオキシメータプローブ101によって組織(例:実際の組織)の光学特性を判断するための方法のフロー図である。オキシメータプローブは、オキシメータプローブによって測定される様々な組織パラメータを補正するために組織について判断されたメラニン含有量を使用する。このフロー図は、1つの実施形態を表している。ステップは、実施形態の範囲から逸脱することなく、フロー図に対して追加、削除、または結合することができる。
Tissue Analysis FIG. 4K is a flow diagram of a method for determining the optical properties of a tissue (eg, actual tissue) with an
480において、メラニン読取部が、組織に光学的に結合する(例えば、接触する)。メラニン読取部は、光をステップ482で組織に照射し、光が組織を透過した後、または組織から反射した後、ステップ484で光を検出するように適合されたオプトエレクトロニクス装置である。ステップ486において、メラニン読取部によって検出された光は、電気信号に変換され、ステップ488で、組織のメラニン含有量を判断するために装置によって使用される。メラニン読取部は、ステップ490で読取部のディスプレイ上または有線もしくは無線出力を介してメラニン含有量の値を出力することができる。
At 480, the melanin reader optically binds (eg, contacts) the tissue. The melanin reader is an optoelectronic device adapted to irradiate the tissue with light in
実施形態では、492において、メラニン含有量に関する情報(例えば、数値)がオキシメータプローブ101に入力される。情報は、ユーザ(例えば、人間のユーザ)を介して、またはメラニン読取部とオキシメータプローブとの間の有線もしくは無線通信を介してオキシメータプローブに入力することができる。
In an embodiment, at 492, information about the melanin content (eg, numerical value) is input to the
第1の実施形態では、494で、オキシメータプローブは、メラニン含有量に関する情報を使用して、プローブによって生成される1つ以上の測定値を調整する。一実施形態では、オキシメータプローブは、組織の酸素飽和度の値を判断する。オキシメータプローブは、その後、メラニン含有量に関する情報を用いて酸素飽和度の値を調整する。オキシメータプローブは、1つ以上の算術演算、数学的関数、またはその両方を介して酸素飽和度の値を調整することができる。例えば、メラニン含有量に関する情報は、酸素飽和度の値を調整するためのオフセット(例えば、加法オフセット)、スケールファクタ、またはその両方として使用することができる。 In a first embodiment, at 494, the oximeter probe uses information about the melanin content to adjust one or more measurements produced by the probe. In one embodiment, the oximeter probe determines the value of oxygen saturation in the tissue. The oximeter probe then adjusts the oxygen saturation value with information about the melanin content. The oximeter probe can adjust the oxygen saturation value via one or more arithmetic operations, mathematical functions, or both. For example, information about melanin content can be used as an offset (eg, additive offset), scale factor, or both for adjusting oxygen saturation values.
代替的実施形態では、494で、オキシメータプローブは、オキシメータプローブにより照射され検出される光のいくつかの波長(例えば、4つの光の波長)について、組織についての吸収係数μa、低減された散乱係数μs’またはそれらの両方を判断する。その後、オキシメータプローブは、メラニン含有量に関する情報を使用して、光の各波長について、判断された吸収(μa)値を調整する。オキシメータプローブは、1つ以上の算術演算、数学的関数、またはその両方を介して吸収係数(μa)値を調整することができる。例えば、メラニン含有量に関する情報は、吸収(μa)値を調整するためのオフセット(例えば、加法オフセット)、スケールファクタ、またはその両方として使用することができる。その後、オキシメータプローブは、吸収(μa)値を使用して、組織の酸素飽和度の値を判断する。吸収(μa)および低減された散乱(μs’)の判断については以下に記載する。 In an alternative embodiment, at 494, the oximeter probe is reduced by an absorption coefficient μ a for the tissue for some wavelengths of light emitted and detected by the oximeter probe (eg, four wavelengths of light). Determine the scattering coefficient μ s'or both. The oximeter probe then uses the information about the melanin content to adjust the determined absorption ( μa ) value for each wavelength of light. The oximeter probe can adjust the absorption coefficient ( μa ) value via one or more arithmetic operations, mathematical functions, or both. For example, information about melanin content can be used as an offset (eg, additive offset), scale factor, or both for adjusting the absorption ( μa ) value. The oximeter probe then uses the absorption ( μa ) value to determine the oxygen saturation value of the tissue. The determination of absorption (μ a ) and reduced scattering (μ s ') is described below.
別の実施形態では、494において、オキシメータプローブは、検出器構造によって生成される反射率データに1つ以上のメラニン補正関数を適用する。メラニン補正関数は、メラニン含有量に関する情報に基づく。反射率データは、検出器構造によって生成された後オキシメータプローブの1つ以上の電子構成要素によってデジタル化されるアナログ反射率データ、またはデジタル化された反射率データであり得る。メラニン補正関数は、アナログ反射率データまたはデジタル化された反射率データに適用することができる。メラニン補正関数は、反射率データに適用される1つ以上の数学的演算を含む。スケールファクタは、オキシメータプローブに入力されるメラニン含有量に関する情報に基づいて、オキシメータプローブによって判断される。反射率データは、オキシメータプローブによって照射される光の各波長ごとにメラニン含有量について調整することができる。 In another embodiment, in 494, the oximeter probe applies one or more melanin correction functions to the reflectance data generated by the detector structure. The melanin correction function is based on information about melanin content. The reflectance data can be analog reflectance data or digitized reflectance data that is then digitized by one or more electronic components of the oximeter probe generated by the detector structure. The melanin correction function can be applied to analog reflectance data or digitized reflectance data. The melanin correction function includes one or more mathematical operations applied to the reflectance data. The scale factor is determined by the oximeter probe based on the information about the melanin content input to the oximeter probe. The reflectance data can be adjusted for the melanin content for each wavelength of light emitted by the oximeter probe.
ある実施形態では、メラニン補正関数は、(例えば、スケールファクタを有する)1つ以上の較正関数と組み合わされた結合関数(例えば、スケールファクタを有する)とすることができる。較正関数は、製造の結果として生じる差異、検出器構造の温度ドリフトの結果として生じる差異、または他の考慮事項など、様々な要因に基づいて検出器応答を補正するためのスケールファクタを含むことができる。反射率データがオキシメータプローブによって調整された後、プローブは、測定される組織内の血液の酸素飽和度を判断することができる。 In certain embodiments, the melanin correction function can be a coupling function (eg, having a scale factor) combined with one or more calibration functions (eg, having a scale factor). The calibration function may include scale factors to correct the detector response based on various factors such as differences resulting from manufacturing, differences resulting from temperature drift of the detector structure, or other considerations. can. After the reflectance data is adjusted by the oximeter probe, the probe can determine the oxygen saturation of the blood in the tissue to be measured.
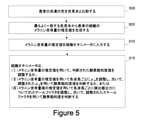
図5は、実施形態におけるオキシメータプローブ101によって組織の光学特性を判断するための方法のフロー図を示す。オキシメータプローブは、オキシメータプローブによって測定される様々な組織パラメータを補正するために組織のメラニン含有量に関する情報を使用する。このフロー図は、1つの実施形態を表している。ステップは、実施形態の範囲から逸脱することなく、フロー図に対して追加、削除、または結合することができる。
FIG. 5 shows a flow chart of a method for determining the optical properties of a tissue by the
500において、組織の色をいくつかの色サンプル(時には色見本と呼ばれる)の2つ以上の色サンプルと比較して、色サンプルの1つの色が組織の色とほぼ一致するかどうかを判定する。色の比較に使用される各色サンプルは、メラニン含有量の値と関連付けられる。色サンプルのメラニン含有量を識別する情報(例えば、数値)は、色サンプル上に位置することができる。 At 500, the tissue color is compared to two or more color samples of several color samples (sometimes called color swatches) to determine if one color of the color sample closely matches the tissue color. .. Each color sample used for color comparison is associated with a melanin content value. Information that identifies the melanin content of the color sample (eg, numerical value) can be located on the color sample.
組織の色と色サンプルの色との比較は、ミシガン州グランドラピッズのX-Rite, Incorporatedの色比較ツールの1つ以上のような色比較ツールによって行うことができる。実施形態では、比較は、患者または医療提供者のような人間によって視覚的に実行され得る。一実施態様では、オキシメータプローブは、組織のメラニン含有量の値を判断するように適合され、それは、プローブのディスプレイ上に表示することができる。オキシメータプローブの一実施形態は、組織のメラニン含有量を判断するために、可視光またはIRなどの1つ以上の波長の光を照射するように適合される。 Comparison of tissue color to color sample color can be done with color comparison tools such as one or more of the X-Rite, Incorporated color comparison tools in Grand Rapids, Michigan. In embodiments, the comparison can be performed visually by a human such as a patient or healthcare provider. In one embodiment, the oximeter probe is adapted to determine the value of tissue melanin content, which can be displayed on the probe's display. One embodiment of the oximeter probe is adapted to irradiate light of one or more wavelengths, such as visible light or IR, to determine the melanin content of the tissue.
505において、比較に続いて、比較に基づいて組織のメラニン含有量の値が判断される。 At 505, following the comparison, the value of the melanin content of the tissue is determined based on the comparison.
代替的実施形態では、メラニン含有量の値は、メラニン含有量値の有限範囲に基づく含有量の推定値から判断される。メラニン含有量の範囲内の値の数は、2つ以上の値を含むことができる。例えば、メラニン含有量の範囲内の値の数は、2つ(例えば明るい色の組織に対しては1、暗い色の組織に対しては2)、3つ(例えば、明るい色は1、中間色は2、暗い色は3)、4つ,5つ,6つ,7つ,8つ,9つ,10個またはそれ以上の値を含むことができる。メラニン含有量の値の推定は、患者または医療提供者によって提供され得る。 In an alternative embodiment, the melanin content value is determined from a content estimate based on a finite range of melanin content values. The number of values within the range of melanin content can include more than one value. For example, the number of values within the range of melanin content is two (eg, 1 for light tissue, 2 for dark tissue), 3 (eg, 1 for light color, neutral color). 2), dark colors 3), can contain 4, 5, 6, 7, 8, 9, 10 or more values. Estimates of melanin content values may be provided by the patient or healthcare provider.
510において、メラニン含有量に関する情報をオキシメータプローブに入力することができる。ステップ510は、オキシメータプローブがメラニン含有量の値を判断する方法ではスキップすることができる。ボタン119は、メラニン含有量に関する情報が入力され得るデータ入力モードにオキシメータプローブをセットするために、予め定められた回数だけ活性化させることができる。その後、メラニン含有量の情報は、ボタンのさらなる活性化により、プローブとの有線通信、プローブとの無線通信、ディスプレイがタッチインタフェースディスプレイであればディスプレイを介して、音声インタフェース(例えば、プローブ内のマイクロフォンおよび音声認識ソフトウェア)、または他の入力技術によって、プローブに入力され得る。
At 510, information about the melanin content can be input to the oximeter probe. Step 510 can be skipped by the method by which the oximeter probe determines the value of melanin content.
515で、オキシメータプローブは、メラニン含有量に関する情報を使用して、オキシメータプローブによって実行される1つ以上の測定または計算を調整するように適合される。例えば、オキシメータプローブは、この情報を使用して、組織の酸素飽和度を調整し、吸収(μa)を調整し、低減された散乱(μs’)を調整し、検出器によって生成される値を調整し、またはこれらの調整の組み合わせの1つ以上を調整し得る。これらの調整の各々は、ステップ435に関してさらに上で説明される。 At 515, the oximeter probe is adapted to use information about the melanin content to coordinate one or more measurements or calculations performed by the oximeter probe. For example, an oximeter probe uses this information to regulate oxygen saturation in a tissue, regulate absorption (μ a ), regulate reduced scattering (μ s '), and be generated by a detector. Values may be adjusted, or one or more of these adjustment combinations may be adjusted. Each of these adjustments is described further above with respect to step 435.
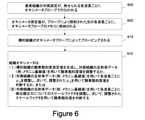
図6は、ある実施形態においてオキシメータプローブ101によって組織の光学特性を判断するための方法のフロー図である。オキシメータプローブは、プローブによって測定される様々な組織パラメータを補正するために組織について判断されたメラニン含有量を使用する。このフロー図は、1つの実施形態を表している。ステップは、実施形態の範囲から逸脱することなく、フロー図に対して追加、削除、または結合することができる。
FIG. 6 is a flow chart of a method for determining the optical properties of a tissue by an
600において、組織の1つ以上の対側測定がオキシメータプローブによって行われる。対側測定は、測定すべき標的組織(例えば、組織健康が判断されるべき乳房組織)上でオキシメータプローブを用いて測定する前に、健康な組織の一部(例えば、健康な乳房組織)上でオキシメータプローブを用いて行われる。組織の対側測定は、オキシメータプローブによって照射される光の各波長について行うことができる。 At 600, one or more contralateral measurements of tissue are made with an oximeter probe. The contralateral measurement is a portion of healthy tissue (eg, healthy breast tissue) before measuring with an oximeter probe on the target tissue to be measured (eg, breast tissue for which tissue health should be determined). This is done above using an oximeter probe. Contralateral measurements of tissue can be made for each wavelength of light emitted by the oximeter probe.
605において、検出器構造によって生成された反射率データは、オキシメータプローブの電子要素によってデジタル化され、メモリに記憶される。反射率データは、その後の組織測定のための比較の基礎を提供する。例えば、対側測定値は対側組織のメラニン含有量の基線測定値を提供し、基線測定値をプロセッサが使用してオキシメータプローブの種々の測定値を補正することができる。 At 605, the reflectance data generated by the detector structure is digitized by the electronic elements of the oximeter probe and stored in memory. Reflectance data provide the basis for comparison for subsequent tissue measurements. For example, the contralateral measurements provide baseline measurements of the melanin content of the contralateral tissue, and the baseline measurements can be used by the processor to correct various measurements of the oximeter probe.
610において、測定されるべき標的組織のオキシメトリ測定がオキシメータプローブによって行われる。 At 610, an oximetry of the target tissue to be measured is performed by an oximeter probe.
実施形態では、615において、プロセッサは、オキシメトリ測定を使用して標的組織の酸素飽和度値を生成する。その後、プロセッサは、対側組織について605で記憶された、記憶された反射率データを取り出し、取り出された値を用いて酸素飽和度値を調整する。すなわち、プロセッサは、健康な対側組織のメラニン含有量についての基線測定値を使用して、標的組織の酸素飽和度値を調整する。 In an embodiment, at 615, the processor uses an oximetry measurement to generate an oxygen saturation value for the target tissue. The processor then retrieves the stored reflectance data stored at 605 for the contralateral tissue and adjusts the oxygen saturation value using the retrieved values. That is, the processor uses baseline measurements of healthy contralateral tissue melanin content to adjust the oxygen saturation value of the target tissue.
別の実施形態では、615において、プロセッサは、標的組織のオキシメトリ測定値から吸収μa、低減された散乱係数μs’、またはその両方を判断する。その後、プロセッサは、対側組織について605で記憶された反射率データを取り出し、取り出した値を使用してμa、μs、またはその両方を調整する。次に、プロセッサは、調整されたμa値を用いて、標的組織の酸素化ヘモグロビン、脱酸素化ヘモグロビン、または他の値を計算する。すなわち、プロセッサは、健康な対側組織のメラニン含有量の基線測定値を使用して、標的組織のμaを調整する。 In another embodiment, at 615, the processor determines absorption μ a , reduced scattering factor μ s ', or both from oximetry measurements of the target tissue. The processor then retrieves the reflectance data stored at 605 for the contralateral tissue and uses the retrieved values to adjust μ a , μ s , or both. The processor then uses the adjusted μ a value to calculate oxygenated hemoglobin, deoxygenated hemoglobin, or other value for the target tissue. That is, the processor uses baseline measurements of melanin content in healthy contralateral tissue to adjust μ a in the target tissue.
615では、別の代替的な実施態様では、プロセッサは、対側組織について605で記憶された、記憶された反射率データを取り出し、取り出された値を使用して、標的組織について検出器構造によって生成される反射率データを調整する。反射率データにプロセッサによって適用される調整は、単純なオフセット(例えば、加算オフセット)、スケールファクタ(例えば、乗算オフセット)、関数による補正、他の補正、またはこれらの調整のいずれかの任意の組み合わせとすることができる。すなわち、プロセッサは、健康な組織のメラニン含有量の基線測定値を用いて、検出器構造によって生成される値を調整して、標的組織の反射率データを調整する。 In 615, in another alternative embodiment, the processor retrieves the stored reflectance data stored at 605 for the contralateral tissue and uses the retrieved values by the detector structure for the target tissue. Adjust the generated reflectance data. The adjustments applied by the processor to the reflectance data are simple offsets (eg, additive offsets), scale factors (eg, multiplying offsets), functional corrections, other corrections, or any combination of these adjustments. Can be. That is, the processor adjusts the reflectance data of the target tissue by adjusting the value produced by the detector structure using the baseline measurement of the melanin content of the healthy tissue.
記憶されたシミュレート反射率曲線。ある実施形態によれば、メモリ117は、後でメモリに記憶するためにコンピュータによって生成され得るいくつかのモンテカルロシミュレーション反射率曲線315(「シミュレート反射率曲線」)を記憶する。シミュレート反射率曲線315の各々は、1つ以上のシミュレートされた源構造からシミュレートされた組織内へと照射され、シミュレートされた組織から1つ以上のシミュレートされた検出器構造に反射される光(例えば近赤外線)のシミュレーションを表す。シミュレート反射率曲線315は、図2に関して上述したように、源-検出器距離を有するプローブ先端110の源構造120a~120bおよび検出器構造125a~125hの構成のような、シミュレートされた源構造およびシミュレートされた検出器構造の特定の構成に対するものである。
A memorized simulated reflectance curve. According to one embodiment, the
したがって、シミュレート反射率曲線315は、オキシメータプローブ101の源構造から照射され、オキシメータプローブ101の検出器構造によって収集される光をモデル化する。さらに、シミュレート反射率曲線315の各々は、組織発色団の特定の濃度および組織散乱体の特定の濃度に関する特定の組織吸収値および組織散乱値などの固有の実際の組織状態を表す。例えば、シミュレート反射率曲線は、様々なメラニン含有量、様々な酸素化ヘモグロビン濃度、様々な脱酸素化ヘモグロビン濃度、様々の水の濃度、水の濃度の静的値、脂肪の様々な濃度、脂肪の濃度の静的値、または様々な吸収(μa)値および低減された散乱(μs’)値のために使用される。
Therefore, the
メモリ117に記憶されるシミュレート反射率曲線の数は、相対的に大きくてもよく、オキシメータプローブ101によって生存能力について分析される実際の組織に存在し得る光学特性および組織特性のすべてではないにしてもほとんどすべての実際的な組み合わせを表し得る。メモリ117は、モンテカルロシミュレーション反射率曲線を格納するものとして本明細書では説明されているが、メモリ117は、拡散近似を使用するなど、モンテカルロ法以外の方法によって生成されたシミュレート反射率曲線を記憶してもよい。
The number of simulated reflectance curves stored in
図7は、プローブ先端110の源構造および検出器構造の構成のような、源構造120および検出器構造125の特定の構成に関するものであってもよい、反射率曲線の例示的なグラフを示す。グラフの水平軸は、源構造120と検出器構造125との間の距離(すなわち、源-検出器距離)を表す。源構造120と検出器構造125との間の距離が適切に選択され、シミュレート反射率曲線が源構造120および検出器構造125についてのシミュレーションである場合、シミュレート反射率曲線におけるデータ点間の横方向の間隔は相対的に均一である。このような均一な間隔は、図7のシミュレート反射率曲線に見ることができる。グラフの垂直軸は、組織から反射し、検出器構造125によって検出される光のシミュレートされた反射率を表す。シミュレート反射率曲線によって示されるように、検出器構造125に到達する反射光は、源構造と検出器構造との間の距離によって変化し、より小さな源-検出器距離で検出される反射光は、より大きな源-検出器距離で検出される反射光よりも大きい。
FIG. 7 shows an exemplary graph of a reflectance curve that may relate to a particular configuration of the source structure 120 and the detector structure 125, such as the configuration of the source structure and detector structure of the
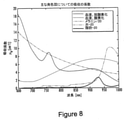
図8は、いくつかの重要な組織発色団、すなわち酸素化ヘモグロビンを含有する血液、脱酸素化ヘモグロビンを含有する血液、メラニン、および水についての、吸収係数μa対光の波長のグラフを示す。ある実施形態では、シミュレート反射率曲線を生成するために使用されるモンテカルロシミュレーションは、組織内に存在し得る1つ以上の選択発色団の関数である。発色団はメラニン、酸素化ヘモグロビン、脱酸素化ヘモグロビン、水、脂質、シトクロムまたは他の発色団を、任意の組み合わせで含むことができる。酸素化ヘモグロビン、脱酸素化ヘモグロビンおよびメラニンは、可視および近赤外スペクトル範囲の大部分について、組織における最も支配的な発色団である。 FIG. 8 shows a graph of the wavelengths of absorption coefficient μ a vs. light for some important tissue chromophores: blood containing oxygenated hemoglobin, blood containing deoxygenated hemoglobin, melanin, and water. .. In one embodiment, the Monte Carlo simulation used to generate the simulated reflectance curve is a function of one or more selective chromophores that may be present in the tissue. The chromophore can include melanin, oxygenated hemoglobin, deoxygenated hemoglobin, water, lipids, cytochromes or other chromophores in any combination. Oxygenated hemoglobin, deoxygenated hemoglobin and melanin are the most dominant chromophores in tissues for most of the visible and near-infrared spectral range.
一実施形態によれば、メモリ117は、シミュレート反射率曲線315の各々について選択された数のデータ点を記憶し、シミュレート反射率曲線の全体は記憶しないかもしれない。シミュレート反射率曲線315の各々について記憶されるデータ点の数は、源-検出器対の数と一致してもよい。例えば、プローブ先端110が2つの源構造120aおよび120bならびに8個の検出器構造125a~125hを含む場合は、オキシメータプローブ101は16個の源-検出器の対を含み、メモリ117はしたがって源構造120aまたは120bによって照射される光の各波長のシミュレート反射率曲線ごとに16個の選択データ点を記憶し得る。実施形態では、記憶されたデータ点は、表1において示されるものなどのようなプローブ先端110の特定の源-検出器距離についてのものである。
According to one embodiment, the
したがって、メモリ117に記憶されるシミュレート反射率曲線データベースのサイズは16×5850であり得、各源構造120によって生成および照射され各検出器構造125によって測定され得る曲線ごとに16個の点が記憶され得、光学特性範囲にわたって合計5850本の曲線がある。代替的に、メモリ117に記憶されるシミュレート反射率曲線データベースのサイズは16×4×5850であり得、各源構造によって生成され発せられ得る4つの異なる波長について16個の点が曲線ごとに記憶され、光学特性範囲にわたって合計5850本の曲線がある。5850本の曲線は、例えば、39個の散乱係数μs'値および150個の吸収係数μa値のマトリクスに由来する。他の実施形態では、より多くかまたはより少ない数のシミュレート反射率曲線が、メモリにおいて記憶される。例えば、メモリに記憶されるシミュレート反射率曲線の数は、約100本の曲線から、約250,000本の曲線、約400,000本の曲線、またはそれ以上の範囲に及ぶことができる。
Therefore, the size of the simulated reflectance curve database stored in
低減された散乱係数μs'値の範囲はセンチメートルにつき5:5:24からかもしれない。μa値の範囲はセンチメートルにつき0.01:0.01:1.5からかもしれない。上述の範囲は例の範囲であり、源-検出器の対の数、各源構造によって生成され照射される波長の数、およびシミュレート反射率曲線の数はより小さくても大きくてもよいことが理解されるであろう。 The range of reduced scattering factor μ 's' values may be from 5: 5: 24 per centimeter. The range of μ a values may be from 0.01: 0.01: 1.5 per centimeter. The above range is an example, and the number of source-detector pairs, the number of wavelengths produced by each source structure, and the number of simulated reflectance curves may be smaller or larger. Will be understood.
図9は、実施形態においてオキシメータプローブのメモリに記憶されるシミュレート反射率曲線315のデータベース900を示す。このデータベースは、組織の均質モデル用である。データベース内の各行は、2つのシミュレートされた源構造(例えば、源構造120a~120b)からシミュレートされた組織に照射され、シミュレートされた組織からの反射後に8つのシミュレートされた検出器構造(例えば、検出器構造125a~125h)によって検出されるシミュレートされた光についてモンテカルロシミュレーションから生成されるシミュレート反射率曲線を示す。データベースのためにシミュレート反射率曲線を生成するために使用されるモンテカルロシミュレーションは、均質な組織モデル用である。均質組織モデルのためのシミュレートされた組織は、組織表面から表皮、真皮および皮下組織を通して均質な光学特性を有する。つまり、表皮、真皮および皮下の光学特性は、モンテカルロシミュレーションでは同じである。データベースにおいて、シミュレート反射率曲線の各々は、吸収(μa)値および低減された散乱(μs’)値と関連付けられる。データベース内のシミュレート反射率曲線の各々は、他の発色団の値と関連付けることができる。
FIG. 9 shows a
シミュレート反射率曲線のデータベースは、シミュレートされた反射率の実際の値(例えば、浮動小数点値)を含むことができ、またはシミュレートされた反射率の実際の値に対する索引付けされた値(例えば、2進値)を含むことができる。図9に示すように、データベースは、シミュレートされた反射率の実際の値に対する索引付けされた値(例えば、2進値)を含む。データベースは、例えばエントリの精度に依存する様々な長さのバイナリワードを含むことができる。バイナリワードは、2ビット長、4ビット長、8ビット長、16ビット長、32ビット長、または他の長さとすることができる。 A database of simulated reflectance curves can contain actual values of simulated reflectance (eg, floating point values), or indexed values against actual values of simulated reflectance (eg, floating point values). For example, a binary value) can be included. As shown in FIG. 9, the database contains indexed values (eg, binary values) with respect to the actual value of the simulated reflectance. The database can contain binary words of various lengths, depending on the accuracy of the entry, for example. The binary word can be 2 bits long, 4 bits long, 8 bits long, 16 bits long, 32 bits long, or any other length.
一実施態様では、1つ以上の数学的変換が、シミュレート反射率曲線の値をデータベースに入力する前に、シミュレート反射率曲線に適用される。数学的変換は、検出器構造によって生成された反射率データのシミュレート反射率曲線への適合を改善することができる。例えば、シミュレート反射率曲線に対数関数を適用して、検出器構造によって生成された測定データのシミュレート反射率曲線への適合を改善することができる。 In one embodiment, one or more mathematical transformations are applied to the simulated reflectance curve before entering the values of the simulated reflectance curve into the database. Mathematical transformations can improve the fit of the reflectance data generated by the detector structure to the simulated reflectance curve. For example, a logarithmic function can be applied to the simulated reflectance curve to improve the fit of the measured data generated by the detector structure to the simulated reflectance curve.
オキシメトリ測定が行われると、照射された光の各波長に対する反射率データが検出器構造によって検出され、データベース900のシミュレート反射率曲線に個別に適合される。シミュレート反射率曲線に適合した照射光の各波長の反射率データについて、オキシメータプローブは吸収μa、低減された散乱μs’またはこれらの値の両方を判断する。例えば、第1の波長の光に対する第1の反射率データのセットをシミュレート反射率曲線に適合させて、吸収μaおよび低減された散乱μs’の1つ以上(例えば、組織パラメータの第1の組)を判断する。反射率データをシミュレート反射率曲線に適合させることについては、以下でさらに説明する。
When the oximetry measurement is made, the reflectance data for each wavelength of the emitted light is detected by the detector structure and individually fitted to the simulated reflectance curve of
その後、第2の波長の光に対する第2の反射率データのセットをデータベース900のシミュレート反射率曲線に適合させて、第2の波長について吸収μaおよび低減された散乱μs’の1つ以上(例えば、組織パラメータの第2の組)を判断する。その後、第3の波長の光に対する第3の反射率データのセットをデータベース900のシミュレート反射率曲線に適合させて、吸収μaおよび低減された散乱μs’の1つ以上(例えば、組織パラメータの第3の組)を判断する。その後、第4の波長の光に対する第4の反射率データのセットをデータベース900のシミュレート反射率曲線に適合させて、第4の波長について、吸収μaおよび低減された散乱μs’の1つ以上(例えば、組織パラメータの第4の組)を判断する。
Then, the set of second reflectance data for the light of the second wavelength is fitted to the simulated reflectance curve of the
4組の組織パラメータをオキシメータプローブによって一緒に使用して、酸素化ヘモグロビン濃度、脱酸素化ヘモグロビン濃度、メラニン含有量、または他のパラメータなど、組織の様々な値を判断することができる。 Four sets of tissue parameters can be used together by an oximeter probe to determine various values of tissue, such as oxygenated hemoglobin concentration, deoxygenated hemoglobin concentration, melanin content, or other parameters.
図10は、実施形態においてオキシメータプローブのメモリに記憶されるシミュレート反射率曲線のデータベース1000を示す。データベースは、組織の層状モデル(例えば、層状の皮膚)のためのものである。シミュレート反射率曲線を生成したモンテカルロシミュレーションは、シミュレーションのために層状組織モデルを使用する。層状組織は、2つ以上の層を含むことができる。一実施形態では、層状組織は2つの組織層を含む。2つの組織層は、異なる吸収μa、低減された散乱μs’、またはこれらの特性の両方のような、異なる光学特性を有する。
FIG. 10 shows a
一実施態様では、第1のシミュレートされた組織層は表皮用であり、第2のシミュレートされた組織層は真皮用である。モンテカルロシミュレーションで使用される表皮の厚さは、約40ミクロン~約140ミクロンの範囲であり得る。例えば、表皮の厚さは、40ミクロン、50ミクロン、60ミクロン、70ミクロン、80ミクロン、90ミクロン、100ミクロン、110ミクロン、120ミクロン、130ミクロン、140ミクロンまたは他の厚さであり得る。モンテカルロシミュレーションで使用される真皮の厚さは、1ミリメートル未満から事実上無限の厚さまでの範囲、例えば12ミリメートル以上であり得る。 In one embodiment, the first simulated panniculus is for the epidermis and the second simulated panniculus is for the dermis. The thickness of the epidermis used in the Monte Carlo simulation can range from about 40 microns to about 140 microns. For example, the thickness of the epidermis can be 40 microns, 50 microns, 60 microns, 70 microns, 80 microns, 90 microns, 100 microns, 110 microns, 120 microns, 130 microns, 140 microns or other thicknesses. The thickness of the dermis used in the Monte Carlo simulation can range from less than 1 millimeter to virtually infinite thickness, eg 12 millimeters or more.
シミュレート反射率曲線が真皮のために生成されるとき、表皮の1つ以上の光学特性は変動され得る。例えば、シミュレート反射率曲線が真皮のために生成されるとき、メラニン含有量は表皮について変動され得る。代替的に、シミュレート反射率曲線が真皮のために生成されるとき、μaは表皮について変動され得る。 When a simulated reflectance curve is generated for the dermis, one or more optical properties of the epidermis can vary. For example, when a simulated reflectance curve is generated for the dermis, the melanin content can vary for the epidermis. Alternatively, μ a can fluctuate with respect to the epidermis when a simulated reflectance curve is generated for the dermis.
一実施形態では、データベース1000は、表皮と真皮との組み合わせによって反射される光についてのシミュレート反射率曲線を含む。
In one embodiment, the
オキシメータプローブによって測定される実際の組織について、源構造によって照射され検出器構造によって検出される光の各波長についての反射率データは、プロセッサによって一度に1つずつシミュレート反射率曲線に適合される。データベース内のシミュレート反射率曲線の1つ以上への適合に基づいて、オキシメータプローブは、実組織の一方または両方の層について、吸収μaおよび低減された散乱μs’の一方または両方を判断する。一方の層について判断された吸収(μa)値から、オキシメータプローブは組織の酸素化濃度および脱酸素化ヘモグロビン濃度を判断する。 For the actual tissue measured by the oximeter probe, the reflectance data for each wavelength of light emitted by the source structure and detected by the detector structure is fitted to the simulated reflectance curve one at a time by the processor. To. Based on the fit of one or more of the simulated reflectance curves in the database, the oximeter probe absorbs μ a and one or both of the reduced scattering μ s'for one or both layers of the real tissue. to decide. From the absorption ( μa ) values determined for one layer, the oximeter probe determines the oxygenated and deoxygenated hemoglobin concentrations of the tissue.
図11A~図11Bは、実施形態においてオキシメータプローブのメモリに記憶されるシミュレート反射率曲線のデータベース1110を示す。データベースは組織の層状モデル用である。データベースの各行は、シミュレートされた源構造から照射され、シミュレートされた検出器構造によって検出される4つの波長の光の各々に対するシミュレート反射率曲線を含む。4つのシミュレート反射率曲線の各行は、各シミュレート反射率曲線について16の値を含む。より具体的には、各行は、源構造120a~120bおよび検出器構造125a~125hの16個の源-検出器距離のために16個の値を含む。合計で、各行は、2つのシミュレートされた源構造から照射され、8つのシミュレートされた検出器構造によって検出される4つの波長の光に対する4つのシミュレート反射率曲線について64個の値を含む。
11A-11B show a
より多くのまたはより少ない波長が源構造から照射される場合、データベース1110の組織の層状モデルは、1行当たりより多くのまたはより少ないシミュレート反射率曲線を含むことができる。データベース1110は、例えば、1つまたは3つ以上の源構造がプローブ先端に含まれるか、より多くのまたはより少ない検出器構造がプローブ先端に含まれるか、またはその両方である場合、シミュレート反射率曲線の各々について、16個より多くまたはより少ない値を含むことができる。
If more or less wavelengths are emitted from the source structure, the layered model of the structure of the
データベース1110の各行についての4つのシミュレート反射率曲線の各々は、メラニン含有量、血液量、散乱、および酸素飽和度(組織の総ヘモグロビンに対する酸素化ヘモグロビンの割合)を含む4つの組織パラメータに関連付けられる。より多数または少数の組織パラメータをデータベース1110に含めることができる。
Each of the four simulated reflectance curves for each row in
オキシメータプローブによって測定されるべき組織について検出器構造125a~125hによって生成される検出器値の組が、プロセッサによって行の1つ以上に適合されると、オキシメータプローブは、それによって、メラニン含有量、血液量、散乱、および酸素飽和度などの組織パラメータのうちの1つ以上を、任意の組み合わせで、判断する。一実施形態では、オキシメータプローブは、組織の酸素飽和度を判断し、ディスプレイ上に酸素飽和度の値を表示するように適合される。
When the set of detector values produced by the
上で簡単に説明したように、データベース1110は、層状組織モデルのシミュレート反射率曲線315を含む。シミュレートされた組織の層は、表皮、真皮、皮下組織、またはこれらの層の1つ以上の任意の組み合わせを含むことができる。これらの層は、細網真皮および表層神経叢のような皮膚形態のより高い分解能を含むことができる。シミュレート反射率曲線を生成するモンテカルロシミュレーションは、組織層に含まれる様々な発色団について組織をシミュレートすることができる。例えば、モンテカルロシミュレーションは、様々なメラニン含有量を有する表皮のための組織モデルを使用することができるが、血液を含む表皮のための組織モデルを使用しないかもしれない。モンテカルロシミュレーションは、様々な血液量および様々な酸素飽和度を有する真皮層のための組織モデルを使用することができる。ある実施形態では、モンテカルロシミュレーションは、メラニンを含む真皮のための組織モデルを使用しない。同様に、モンテカルロシミュレーションは、様々な血液量および様々な酸素飽和度を有する脂肪組織の組織モデルを使用することができる。ある実施形態では、モンテカルロシミュレーションは、メラニンを有する脂肪組織のための組織モデルを使用しない。組織層の組織モデルは、他の組織発色団の濃度が比較的典型的な生理学的値である水および脂肪のような、他の組織発色団についての濃度を含むことができる。
As briefly described above, the
一実施態様では、シミュレート反射率曲線を生成するためにモンテカルロシミュレーションが使用する様々な発色団濃度は、実際の組織に存在する実際の生理学的値の相対的に大きくかつ相対的に正確な範囲に亘る。実際の生理学的値の範囲に含まれる値の数は、組織オキシメータ測定の様々なパラメータのバランスをとるために変更することができる。例えば、シミュレートされた組織における発色団の濃度の範囲に使用される値の数は、相対的に高くまたは低くあり得、オキシメータプローブによって行われる測定の精度に影響を与え得る。一実施形態では、シミュレートされた表皮組織における光吸収についてメラニン含有量の範囲のためにモンテカルロシミュレーションで355の値が使用される。一実施形態では、シミュレートされた真皮組織における光吸収についてメラニン含有量の範囲のためにモンテカルロシミュレーションで86の値が使用される。シミュレートされた表皮組織およびシミュレートされた真皮組織の両方における散乱については、モンテカルロシミュレーションで65の値が使用される。他の実施態様では、これらの値の数は異なる。 In one embodiment, the various chromophore concentrations used by the Monte Carlo simulation to generate the simulated reflectance curve are relatively large and relatively accurate ranges of the actual physiological values present in the actual tissue. Over. The number of values within the range of actual physiological values can be varied to balance the various parameters of the tissue oximeter measurement. For example, the number of values used for the range of chromophore concentrations in the simulated tissue can be relatively high or low and can affect the accuracy of the measurements made by the oximeter probe. In one embodiment, a value of 355 is used in the Monte Carlo simulation for the range of melanin content for light absorption in the simulated epidermal tissue. In one embodiment, a value of 86 is used in the Monte Carlo simulation for the range of melanin content for light absorption in the simulated dermal tissue. For scattering in both simulated epidermal and simulated dermal tissue, a value of 65 is used in the Monte Carlo simulation. In other embodiments, the number of these values varies.
組織分析図12A~図12Bは、オキシメータプローブ101が光学特性を判断するために反射率データおよびシミュレート反射率曲線315を使用する、オキシメータプローブによる組織(例えば皮膚)の光学特性を判断するための方法のフロー図である。光学特性は、組織の吸収係数μaおよび低減された散乱係数μs’を含み得る。組織の吸収係数μaを組織の酸素飽和度値に変換するためのさらなる方法は、以下により詳細に説明される。このフロー図は、1つの実施形態を表している。ステップは、実施形態の範囲から逸脱することなく、フロー図に対して追加、削除、または結合することができる。
Tissue Analysis FIGS. 12A-12B determine the optical properties of tissue (eg, skin) by the oximeter probe, where the
1200において、オキシメータプローブ101は、源構造120aなどの源構造120の1つから組織内に光(例えば近赤外光)を発する。オキシメータプローブは一般に、源構造から発光されているときに組織と接触している。照射光が組織から反射した後、ステップ1205において検出器構造125がこの光の一部を検出し、ステップ1210において組織の反射率データ点を生成する。ステップ1200、1205、および1210は、光の複数の波長(例えば赤色光、近赤外光、またはその両方)について、および源構造120bなどの1つ以上の他の源構造について繰返され得る。1つの波長の反射率データ点は、例えば組織オキシメトリプローブ115が16個の源-検出器距離を有する場合、16個の反射率データ点を含むかもしれない。反射率データ点は、反射率データ点のNベクトルと称されることもある。
At 1200, the
1215において、反射率データ点(例えば生反射率データ点)が源-検出器の対のゲインに対して補正される。源-検出器の対の校正の間、源-検出器の対についてゲイン補正が生成され、メモリ117に記憶される。ゲイン補正の生成については、以下でさらに詳細に説明する。
At 1215, reflectance data points (eg, raw reflectance data points) are corrected for the gain of the source-detector pair. During the calibration of the source-detector pair, a gain correction is generated for the source-detector pair and stored in
1220において、プロセッサ116は、(例えば残差二乗和計算を介して)反射率データ点をシミュレート反射率曲線315に適合させて、反射率データ点に最良適合する(すなわち最低適合誤差を有する)特定の反射率データ曲線を求める。メモリに格納され、反射率データに適合されるデータベースは、データベース900、データベース1000、またはデータベース1100であることができる。1つの特定の実施形態では、シミュレート反射率曲線のデータベースの「粗(coarse)」グリッドであるシミュレート反射率曲線の比較的小さいセットが選択されて適合ステップ1220に利用される。例えば、39個の散乱係数μs’値および150個の吸収係数μa値を与えられるデータベース900の場合、シミュレート反射率曲線の粗グリッドは、プロセッサ116によって、粗グリッド内の合計40本のシミュレート反射率曲線について5個おきの散乱係数μs’値および8個おきの吸収係数μaを取ることによって、求められるかもしれない。上述の具体値は例の実施形態についてのものであり、他のサイズの粗グリッドもプロセッサ116によって利用されるかもしれないことが理解されるであろう。反射率データ点を粗グリッドに適合させることによる結果は、最良適合するシミュレート反射率曲線の粗グリッド内の座標(μa,μs’)coarseである。データベース1000の場合、粗グリッドは、各層の吸収、および低減された散乱をカバーする。データベース1000のための方法に関する以下の各ステップは、各層のμa、およびμs’について調整される。データベース1100の場合、粗グリッドは、メラニン含有量、酸素飽和度、血液量、および散乱をカバーする。データベース1100のための方法の以下の各ステップは、μa、およびμs’の代わりにメラニン含有量、酸素飽和度、血液量、および散乱について調整される。
At 1220, the processor 116 fits the reflectance data points to the simulated reflectance curve 315 (eg, via residual squared sum calculation) and best fits the reflectance data points (ie, has the lowest fit error). Find a specific reflectance data curve. The database stored in memory and adapted to the reflectance data can be
1225において、最低適合誤差を有する粗グリッドからの特定のシミュレート反射率曲線がプロセッサ116によって利用されてシミュレート反射率曲線の「微細(fine)」グリッドが定義され、微細グリッド内のシミュレート反射率曲線は、最低適合誤差を有する粗グリッドからのシミュレート反射率曲線の周りにある。 At 1225, a specific simulated reflectance curve from the coarse grid with the lowest fit error is utilized by the processor 116 to define a "fine" grid of simulated reflectance curves, simulated reflections within the fine grid. The rate curve is around the simulated reflectance curve from the coarse grid with the lowest fit error.
すなわち、微細グリッドは規定サイズであり、粗グリッドからの最低誤差シミュレート反射率曲線は微細グリッドの中心を規定する。微細グリッドは粗グリッドと同数のシミュレート反射率曲線を有してもよいし、またはより多いもしくはより少ないシミュレート反射率曲線を有してもよい。微細グリッドは、ステップ1230において微細グリッド内で近傍の吸収係数μa値および散乱係数μs’値のピーク表面アレイを求めるのに十分な数の点を提供する。具体的には、プロセッサ116が粗グリッドからの最低誤差値に加えて特定のオフセットを利用することによって閾値が設定され得る。閾値未満の誤差を有する微細グリッド上の散乱係数μs’および吸収係数μaの位置はすべて、反射率データについての散乱係数μs’および吸収係数μaをさらに求めるためにピーク表面アレイを求める際に用いるために識別され得る。具体的には、ピークについて誤差適合がなされ、ピークにおける吸収係数μaおよび散乱係数μs’値が求められる。ステップ1240において、ピークにおける吸収係数μaおよび散乱係数μs’値の重み付け平均(例えばセントロイド計算)がオキシメータプローブによって利用され、組織の反射率データ点についての吸収係数μaおよび散乱係数μs’値が求められ得る。
That is, the fine grid has a defined size, and the lowest error simulated reflectance curve from the coarse grid defines the center of the fine grid. The fine grid may have as many simulated reflectance curves as the coarse grid, or may have more or less simulated reflectance curves. The fine grid provides a sufficient number of points to determine a peak surface array of nearby absorption coefficient μ a and scattering coefficient μ s'values in the fine grid in step 1230. Specifically, the threshold can be set by the processor 116 utilizing a particular offset in addition to the lowest error value from the coarse grid. All locations of the scattering coefficient μ s'and the absorption coefficient μ a on the fine grid with an error below the threshold are peak surface arrays to further determine the scattering coefficient μ s'and the absorption coefficient μ a for the reflectance data. Can be identified for use in the event. Specifically, error matching is performed for the peak, and the absorption coefficient μ a and the scattering coefficient μ s'value at the peak are obtained. In
重み付け平均についての吸収係数μaおよび散乱係数μs’値の重みは、閾値から微細グリッド誤差を引いたものとしてプロセッサ116によって求められ得る。微細グリッド上の点は閾値未満の誤差で選択されるため、これによって正の重みが与えられる。重み付け平均の重み付け計算(例えばセントロイド計算)によって、組織の反射率データ点についての予想される散乱係数μs’および吸収係数μa(すなわち(μa,μs’)fine)が提供される。様々な非線形最小二乗法の1つ以上を用いて適合して吸収係数μaの真の最小誤差ピークを求めるなど、他の方法もオキシメータプローブによって利用され得る。 The weights of the absorption coefficient μ a and the scattering coefficient μ s'values for the weighted average can be determined by the processor 116 as the threshold minus the fine grid error. Points on the fine grid are selected with an error below the threshold, which gives them a positive weight. Weighted average weighting calculations (eg, centroid calculations) provide the expected scattering coefficient μ s'and absorption coefficient μ a (ie, (μ a , μ s ') fine ) for the reflectance data points of the tissue. .. Other methods can also be utilized by the oximeter probe, such as fitting using one or more of various nonlinear least squares methods to determine the true minimum error peak with an absorption coefficient μ a .
一具体化によると、プロセッサ116は反射率データ点およびシミュレート反射率曲線の対数を計算し、各対数を源-検出器距離(例えばセンチメートルで表わされる)の平方根で割る。源-検出器距離の平方根で割られた対数値は、上述のステップ(例えばステップ1215、1220、1225、および1230)において反射率データ点およびシミュレート反射率曲線についてプロセッサ116によって利用されて、シミュレート反射率曲線に対する反射率データ点の適合が改善され得る。 According to one embodiment, the processor 116 calculates the logarithms of the reflectance data points and the simulated reflectance curve, and divides each logarithm by the square root of the source-detector distance (eg, expressed in centimeters). The logarithm divided by the square root of the source-detector distance is utilized and simulated by the processor 116 for reflectance data points and simulated reflectance curves in the steps described above (eg, steps 1215, 1220, 1225, and 1230). The fit of reflectance data points to the reflectance curve can be improved.
別の具体化によると、オフセットは実質的にゼロに設定され、これによって粗グリッド最小と微細グリッド最小との差のオフセットが有効に与えられる。図12Aに関して上記に説明された方法は粗グリッドからの最小適合誤差に依拠するため、微細グリッド上の真の最小誤差は典型的にはより低い。理想的には、閾値は微細グリッド上の最低誤差から求められ、これは典型的にはプロセッサによるさらなる演算を必要とする。 According to another reification, the offset is set to virtually zero, which effectively gives the offset of the difference between the coarse grid minimum and the fine grid minimum. The true minimum error on the fine grid is typically lower, as the method described above with respect to FIG. 12A relies on the minimum fit error from the coarse grid. Ideally, the threshold is derived from the lowest error on the fine grid, which typically requires further computation by the processor.
以下は、一具体化に係る微細グリッド内の反射率データ点に最良適合する特定のシミュレート反射率曲線を見つけるためのさらなる詳細な説明である。図12Bは、1つの実施形態による、微細グリッドにおいて反射率データ点に最良適合する特定のシミュレート反射率曲線を見つける方法のフロー図である。このフロー図は、1つの実施形態を表している。ステップは、実施形態の範囲から逸脱することなく、フロー図に対して追加、削除、または結合することができる。 The following is a more detailed description for finding a particular simulated reflectance curve that best fits the reflectance data points in the fine grid for one reification. FIG. 12B is a flow diagram of a method of finding a specific simulated reflectance curve that best fits a reflectance data point in a fine grid according to one embodiment. This flow chart represents one embodiment. Steps can be added, deleted, or combined with respect to the flow diagram without departing from the scope of the embodiment.
ステップ1225において反射率データ点に最良適合する粗グリッドから特定のシミュレート反射率曲線(μa,μs’)coarseを求めた後、ステップ1250において、プロセッサ116はシミュレート反射率曲線の完全シミュレート反射率曲線データベース(すなわち16×5850の(μa,μs’)データベース)内の(μa,μs’)coarseの周りの領域内の誤差表面を演算する。誤差表面はerr(μa,μs’)と示される。その後、ステップ1255において、プロセッサ116は、errminと称される、err(μa,μs’)内の最小誤差値を探す。プロセッサ116は次に、ステップ1260において、ピーク表面がゼロよりも大きい場合はpksurf(μa,μ’s)=k+errmin-err(μa,μ’s)によって示される、またはピーク表面がゼロ以下である場合はpksurf(μa,μ’s)=k+errmin-err(μa,μ’s)=0によって示されるerr(μa,μs’)からのピーク表面アレイを生成する。当該式において、kは、約10個の要素のゼロよりも大きい幅を有するerr(μa,μ’s)の最小点におけるピークから選択される。ステップ1265において、pksurf(μa,μ’s)のピークの質量中心(すなわちセントロイド計算)は、点の高さを重みとして用いる。質量中心の位置は、組織の反射率データ点の吸収係数μaおよび散乱係数μs’の補間結果である。
After finding a specific simulated reflectance curve (μ a , μ s ') coarseness from the coarse grid that best fits the reflectance data points in
組織の反射率データ点の吸収係数μaおよび散乱係数μs’を求めるための図12Aおよび図12Bに関して上記に説明された方法は、源構造120の各々によって生成される波長(例えば3つまたは4つの波長)の各々ごとに繰返され得る。 The method described above with respect to FIGS. 12A and 12B for determining the absorption coefficient μ a and the scattering coefficient μ s'of the texture reflectance data points is the wavelength produced by each of the source structures 120 (eg, 3 or). It can be repeated for each of the four wavelengths).
酸素飽和度判定。第1の具体化によると、プロセッサ116は、各源構造120によって生成される光の3つまたは4つの波長について(上述のように)求められる吸収係数μa(例えば3つまたは4つの吸収係数μa)を利用することによって、オキシメータプローブ101によってプローブされる組織の酸素飽和度を求める。第1の具体化によると、酸素飽和度に対する吸収係数μaの最良適合を見つけるための酸素飽和度値のルックアップテーブルが生成される。ルックアップテーブルは、可能性のある総ヘモグロビン、メラニン、および酸素飽和度値の範囲を仮定し、これらのシナリオごとにμaを計算することによって生成され得る。そして、単位ベクトルのノルム(norm)で分割して、システム誤差を減少させて曲線の相対形状にのみ依存することによって、吸収係数μa点が単位ベクトルに変換される。そして、単位ベクトルがルックアップテーブルと比較されて最良適合が見つけられ、これによって酸素飽和度が与えられる。
Oxygen saturation judgment. According to the first embodiment, the processor 116 has an absorption coefficient μ a (eg, 3 or 4 absorption coefficients) determined for the 3 or 4 wavelengths of light produced by each source structure 120 (as described above). By using μ a ), the oxygen saturation of the tissue probed by the
第2の具体化によると、プロセッサ116は、脱酸素化ヘモグロビンおよび酸素化ヘモグロビンの純検体信号(net analyte signal:NAS)を計算することによって組織の酸素飽和度を求める。NASは、系内の他のスペクトル成分に直交するスペクトルの部分と定義される。例えば、酸素化ヘモグロビンおよび脱酸素化ヘモグロビンも含む系における脱酸素化ヘモグロビンのNASは、酸素化ヘモグロビンスペクトルおよびメラニンスペクトルに直交するスペクトルの部分である。そして、ベクトルがそれぞれのNASを各波長において予め決定された吸収係数で乗算することによって、脱酸素化および酸素化ヘモグロビンの濃度が計算され得る。そして、酸素飽和度が、酸素化ヘモグロビンおよび脱酸素化ヘモグロビンの合計で除算される酸素化ヘモグロビンの濃度として容易に計算される。LorberによるAnal. Chem. 58: 1167-1172 (1986)が引用により本明細書中に援用され、組織の酸素飽和度を求めるための第2の具体化のさらなる詳細な理解のための枠組みを提供する。 According to the second embodiment, the processor 116 determines the oxygen saturation of the tissue by calculating the deoxidized hemoglobin and the net excipient signal (NAS) of the oxygenated hemoglobin. NAS is defined as the portion of the spectrum that is orthogonal to the other spectral components in the system. For example, the NAS of deoxygenated hemoglobin in a system that also contains oxygenated hemoglobin and deoxygenated hemoglobin is part of the spectrum orthogonal to the oxygenated hemoglobin spectrum and the melanin spectrum. Then, the vector can calculate the concentration of deoxygenated and oxygenated hemoglobin by multiplying each NAS by a predetermined absorption coefficient at each wavelength. Oxygen saturation is then easily calculated as the concentration of oxygenated hemoglobin divided by the sum of oxygenated hemoglobin and deoxygenated hemoglobin. Lorber's Anal. Chem. 58: 1167-1172 (1986) is incorporated herein by reference to provide a framework for a more detailed understanding of the second embodiment for determining tissue oxygen saturation. do.
オキシメータプローブ101の実施形態によると、反射率データは30ヘルツで検出器構造125によって生成され、酸素飽和度値は約3へルツで計算される。求められた酸素飽和度値(例えば少なくとも3つの酸素飽和度値)の移動平均がディスプレイ115上に表示され得るが、それは1ヘルツの更新速度を有するかもしれない。
According to the embodiment of the
光学特性。上記に簡単に説明されたように、メモリ117に記憶される各シミュレート反射率曲線315は、組織の一意の光学特性を表わす。より具体的には、所与の波長についてのシミュレート反射率曲線の一意の形状は組織の光学特性の一意の値、すなわち、散乱係数(μs)、吸収係数(μa)、組織の異方性(g)、および組織の屈折率を表わし、それらから組織の特性が判断されてもよい。
optical properties. As briefly described above, each
比較的小さい源-検出器距離について検出器構造125によって検出される反射率は、低減された散乱係数μs’に主に依存する。低減された散乱係数は、散乱係数μsおよび組織の異方性gを組込んだ「集合(lumped)」特性であり、μs’=μs(1-g)であり、1/μs’のサイズの多くのステップのランダムウォークの光子の拡散を記述するために用いられ、各ステップは等方散乱を含む。そのような記述は、多くの小さいステップ1/μsを用いる光子移動の記述と同等であり、これらのステップの各々は、吸収事象の前に多くの散乱事象がある場合、すなわちμa<<μs’である場合は一部偏向角度のみを含む。
For a relatively small source-detector distance, the reflectance detected by the detector structure 125 depends primarily on the reduced scattering factor μ 's'. The reduced scattering coefficient is a “lumped” characteristic that incorporates the scattering coefficient μ s and the anisotropy g of the structure, μ s '= μ s (1-g), 1 / μ s . Used to describe the diffuse of photons in a random walk of many steps of size, each step involves isotropic scattering. Such a description is equivalent to a description of photon transfer using many
対照的に、比較的大きい源-検出器距離について検出器構造125によって検出される反射率は、有効吸収係数μeffに主に依存し、これは、 In contrast, the reflectance detected by the detector structure 125 for a relatively large source-detector distance depends primarily on the effective absorption coefficient μ eff , which is
![]()
![]()
と定義され、これはμaおよびμs’の両方の関数である。
したがって、相対的に小さい源-検出器距離(例えば図2のS1-D4およびS2-D8)ならびに相対的に大きい源-検出器距離(例えば図2のS1-D8およびS2-D4)における反射率を測定することによって、μaおよびμs’の両方を互いに独立して求めることができる。組織の光学特性は次に、酸素化ヘモグロビンおよび脱酸素化ヘモグロビン濃度の計算のための十分な情報、およびしたがって組織の酸素飽和度を提供し得る。
Defined as, which is a function of both μ a and μ s '.
Therefore, reflectance at relatively small source-detector distances (eg S1-D4 and S2-D8 in FIG. 2) and relatively large source-detector distances (eg S1-D8 and S2-D4 in FIG. 2). By measuring, both μ a and μ s'can be determined independently of each other. The optical properties of the tissue may then provide sufficient information for the calculation of oxygenated and deoxidized hemoglobin concentrations, and thus the oxygen saturation of the tissue.
データ収集最適化のための反復適合。図13は、オキシメータプローブ101による組織の光学特性を判断する別の方法のフロー図を示す。このフロー図は、1つの実施形態を表している。ステップは、実施形態の範囲から逸脱することなく、フロー図に対して追加、削除、または結合することができる。
Iterative adaptation for data acquisition optimization. FIG. 13 shows a flow chart of another method for determining the optical properties of a tissue with the
1300において、オキシメータプローブ101は、源構造120aなどの源構造120の1つから組織内に光(例えば近赤外光)を発する。照射された光が組織から反射した後、検出器構造125は光を検出し(ステップ1305)、組織についての反射率データを生成する(ステップ1310)。ステップ1300,1305、および1310は、複数の波長の光について、および源構造120bなどの1つ以上の他の源構造について繰り返されてもよい。1315において、オキシメータプローブ101は反射率データをシミュレート反射率曲線315に適合させ、反射率データが最良適合を有するシミュレート反射率曲線を求める。メモリに格納され、反射率データに適合されるデータベースは、データベース900、データベース1000、またはデータベース1100であり得る。その後、ステップ1320において、オキシメータプローブ101は、反射率データに最良適合するシミュレート反射率曲線の光学特性に基づいて、組織の光学特性(例えば、データベース900またはデータベース1000の場合ではμaおよびμs’、またはデータベース1100の場合ではメラニン含有量、酸素飽和度、血液量および散乱)を求める。
At 1300, the
1325において、オキシメータプローブ101は、ステップ1320で求めた光学特性(例えばmfp=1/(μa+μ’s))から組織内の光の平均自由工程を求める。具体的には、平均自由工程は、すべての源-検出器の対(例えば、対1:源構造120aおよび検出器構造125a、対2:源構造120aおよび検出器構造125b、対3:源構造120aおよび検出器構造125c、対4:源構造120aおよび検出器構造125d、対5:源構造120aおよび検出器構造125e、対6:源構造120aおよび検出器構造125f、対7:源構造120aおよび検出器構造125g、対8:源構造120aおよび検出器構造125h、対9:源構造120bおよび検出器構造125a、対10:源構造120bおよび検出器構造125b...など)についての反射率データを含む累積反射率曲線から得られる光学特性から求められ得る。
At 1325, the
1330において、オキシメータプローブ101は、組織の所与の領域について計算した平均自由工程が最短の源-検出器距離(例えば図2のS1-D4およびS2-D8)の2倍よりも長いか否かを判断する。平均自由工程が最短の源-検出器距離の2倍よりも長い場合は、最短の源-検出器距離を有する源-検出器の対の検出器構造から収集される反射率データを利用することなく、収集された反射率データはシミュレート反射率曲線に再適合される(すなわち再分析される)。例えば、ステップ1315~1330は、源構造120aが検出器構造125dの源として作用している状態で検出器構造125eからの反射率データを使用せずに、かつ、源構造120bが検出器構造125hの源として作用している状態で検出器構造125hからの反射率データを使用せずに、繰返される。平均自由工程を計算し、1つ以上の源-検出器の対についての反射率データを捨てる処理は、適合に対する反射率データに寄与する源-検出器の対のうち、計算された平均自由工程の半分よりも短い源-検出器距離を有する対がなくなるまで繰返され得る。その後、ステップ1335において、最良適合するシミュレート反射率曲線から酸素飽和度が求められ、オキシメータプローブ101によって例えばディスプレイ115上で報告される。
At 1330, the
源構造120の1つから組織内に発せされ、平均自由工程の半分未満だけ進む光は、非拡散反射されるか、またはほぼ非拡散反射される(例えば、拡散反射要素を有することができる)。この光の再発光距離は、組織位相関数および局所組織構成に大きく依存する。したがって、この光の反射率データを使用すると、複数の散乱事象を経験した光の反射率データと比較して、光学特性および組織特性の判定の精度が低下する傾向がある。 Light emitted from one of the source structures 120 into the tissue and traveling less than half of the average free process is non-diffuse or nearly non-diffuse (eg, it can have a diffuse element). .. The re-emission distance of this light largely depends on the tissue phase function and the local tissue composition. Therefore, the use of this light reflectance data tends to reduce the accuracy of determining optical and texture properties as compared to light reflectance data that has experienced multiple scattering events.
データ重み付け検出器構造。源構造120からの増大した距離に位置する検出器構造125は、組織から、減少する量の反射を受ける。したがって、相対的に短い源-検出器距離(例えば、図2のS1-D4およびS2-D8)を有する検出器構造125によって生成された反射率データは、相対的に長い源-検出器距離(例えば、図2のS1-D8およびS2-D4)を有する検出器構造によって生成される反射率データと比較して、本来、より高い信号を示す傾向がある。したがって、適合アルゴリズムは、シミュレート反射率曲線を、相対的に長い源-検出器距離(例えば、平均距離より大きい源-検出器距離)を有する検出器構造によって生成される反射率データよりも密に、相対的に短い源-検出器距離(例えば、源構造と検出器構造との間の平均距離以下の源-検出器距離)を有する検出器構造125によって生成される反射率データに対して、優先的に適合させてもよい。反射率データから光学特性を比較的正確に求めるためには、この距離に比例したスキューは望ましくない場合があり、すぐ下に説明されるように反射率データを重み付けすることによって補正され得る。 Data weighted detector structure. The detector structure 125, located at an increased distance from the source structure 120, receives a reduced amount of reflection from the tissue. Therefore, the reflectance data generated by the detector structure 125 having a relatively short source-detector distance (eg, S1-D4 and S2-D8 in FIG. 2) is a relatively long source-detector distance (eg, S1-D4 and S2-D8 in FIG. 2). For example, it tends to show a higher signal by nature compared to the reflectance data generated by the detector structure having S1-D8 and S2-D4) in FIG. Therefore, the matching algorithm makes the simulated reflectivity curve denser than the reflectivity data produced by the detector structure with a relatively long source-detector distance (eg, a source-detector distance greater than the average distance). For reflectivity data generated by the detector structure 125 having a relatively short source-detector distance (eg, a source-detector distance less than or equal to the average distance between the source structure and the detector structure). , May be preferentially adapted. This distance-proportional skew may not be desirable in order to obtain the optical properties from the reflectance data relatively accurately and can be corrected by weighting the reflectance data as described immediately below.
図14は、選択検出器構造125によって生成される反射率データを重み付けする方法のフロー図を示す。このフロー図は、1つの実施形態を表している。ステップは、実施形態の範囲から逸脱することなく、フロー図に対して追加、削除、または結合することができる。 FIG. 14 shows a flow diagram of a method of weighting the reflectance data generated by the selective detector structure 125. This flow chart represents one embodiment. Steps can be added, deleted, or combined with respect to the flow diagram without departing from the scope of the embodiment.
1400において、オキシメータプローブ101は、源構造120aのような源構造の1つから組織内に光を照射する。照射された光が組織から反射した後、検出器構造125は光を検出し(ステップ1405)、組織についての反射率データを生成する(ステップ1410)。ステップ1400,1405、および1410は、複数の波長の光について、および源構造120bなどの1つ以上の他の源構造について繰り返されてもよい。1415において、オキシメータプローブ101は、反射率データの第1の部分を、シミュレート反射率曲線315に適合させる。メモリに格納され、反射率データに適合されるデータベースは、データベース900、データベース1000、またはデータベース1100であり得る。反射率データの第1の部分は、源構造から閾値距離未満である検出器構造の第1の部分によって生成される。閾値距離は、源構造と検出器構造との間の平均距離(例えば、おおよそミッドレンジ距離)であってもよい。1420において、反射率データの第2の部分についての反射率データが、シミュレート反射率曲線に適合される。反射率データの第2の部分は、検出器構造の第1の部分、および閾値距離と比較して源から次に大きい源-検出器距離にある別の検出器構造によって生成される。例えば、検出器構造の第1の部分が検出器構造125c、125d、125eおよび125fを含む場合、次に大きい源-検出器距離にある検出器構造は検出器構造125gである(表1参照)。
At 1400, the
1425で、ステップ1415で生成された適合をステップ1420で生成された適合と比較して、ステップ1420で生成された適合が1415で生成された適合より良いかどうかを判断する。当業者には理解されるように、曲線へのデータの適合の「近さ」は、様々なパラメータに基づいて定量化可能であり、適合の近さは、曲線へのより近い適合を有するデータを判断するべく、直接比較可能である。さらに理解されるように、より近い適合はより良好な適合またはより緊密な適合とも称される。ステップ1420で生成された適合がステップ1415で生成された適合よりも良い場合、源から次に増加された源-検出器距離に配置されるさらなる検出器構造(考慮される例によれば、源構造125c)を含む検出器構造によって生成される反射率データを用いてステップ1420および1425が繰り返される。代替的に、ステップ1420で生成された適合がステップ1415で生成された適合よりも良くない場合には、閾値距離よりも大きい源-検出器距離に配置された検出器構造125関する反射率データは、適合には用いられない。その後、オキシメータプローブ101は、ステップ1415または(ステップ1415で判断された適合よりも良い場合には)ステップ1420において生成された適合を用いて、組織の光学特性および酸素飽和度を判断する(ステップ1430)。その後、酸素飽和度は、ステップ1435で、オキシメータプローブ101によって、ディスプレイ115などにおいて、報告される。
At 1425, the fit produced in
代替的実施形態によれば、ステップ1420で生成された適合がステップ1415で生成された適合よりも良くない場合、反射率データは、閾値距離よりも大きい源-検出器距離を有する検出器構造について、重み付け係数により重み付けされ、この重み付けされた反射率データが適合に及ぼす影響が低減されるようにする。適合に用いられない反射率データはゼロの重みを有していると考えることができ、対象の組織層の下の組織からの反射率と関連付けられ得る。対象の組織層の下の組織からの反射率は、この特定の反射率を示す反射率曲線における特徴的な歪み(kink)を示すといわれている。
According to an alternative embodiment, if the fit generated in
なお、反射率データをシミュレート反射率曲線に適合させる曲線適合アルゴリズムは、反射率データの不確実性の量および反射率データの絶対位置を考慮し得る。反射率データの不確実性は、検出器構造の1つによる反射率データの生成からのノイズ量に対応し、このノイズ量は、反射率データの大きさの平方根としてスケーリングすることができる。 It should be noted that the curve matching algorithm that fits the reflectance data to the simulated reflectance curve can take into account the amount of uncertainty in the reflectance data and the absolute position of the reflectance data. The uncertainty of the reflectance data corresponds to the amount of noise from the generation of the reflectance data by one of the detector structures, and this amount of noise can be scaled as the square root of the magnitude of the reflectance data.
さらなる実施形態によれば、オキシメータプローブ101は、反射率データの測定に関連するノイズの量に基づいて反射率データを反復的に重み付けする。具体的には、相対的に大きな源-検出器距離を有する検出器構造によって生成される反射率データは、一般に、相対的に短い源-検出器距離を有する検出器構造によって生成される反射率データと比較して、より低い信号対ノイズ比を有する。相対的に大きい源-検出器距離を有する検出器構造によって生成される反射率データを重み付けすることにより、このデータが他の反射率データと等しくまたはおおよそ等しく適合に寄与することを可能にする。
According to a further embodiment, the
反射率データを多数のモンテカルロシミュレーション反射率曲線に一致させるために記載された方法は、オキシメータプローブによってプロービングされる実際の組織の光学特性の比較的迅速かつ正確な判断を可能にする。組織の光学特性を判断する速度は、術後プローブと比較して術中プローブの設計において重要な考慮事項である。さらに、記載されたモンテカルロ法は、堅牢な較正方法を可能にし、それは、次いで、相対的な光学特性と比較して絶対的な光学特性の生成を可能にする。相対光学特性とは対照的に絶対光学特性を報告することは、術後オキシメータプローブと比較して術中オキシメータプローブにとって比較的重要である。 The method described to match the reflectance data to a large number of Monte Carlo simulated reflectance curves allows for a relatively quick and accurate determination of the optical properties of the actual tissue probed by the oximeter probe. The speed at which tissue optical properties are determined is an important consideration in the design of intraoperative probes compared to postoperative probes. In addition, the Monte Carlo method described allows for a robust calibration method, which in turn allows the generation of absolute optical properties compared to relative optical properties. Reporting absolute optical properties as opposed to relative optical properties is relatively important for intraoperative oximeter probes compared to postoperative oximeter probes.
発明の本説明は例示および説明の目的で提示された。これは、網羅的であること、または発明を説明された厳密な形態に限定することを意図しておらず、上記の教示に鑑みて多くの修正および変形が可能である。実施形態は、発明の原理およびその実際的な用途を最もよく説明するために選択および説明された。この説明によって、当業者は、発明を特定の使用に好適であるようにさまざま実施形態で、さまざま修正を加えて最良に利用および実践することができるであろう。発明の範囲は以下の請求項によって定義される。 This description of the invention has been presented for purposes of illustration and illustration. It is not intended to be exhaustive or to limit the invention to the exact form described, and many modifications and variations are possible in view of the above teachings. Embodiments have been selected and described to best illustrate the principles of the invention and its practical uses. This description will allow one of ordinary skill in the art to best utilize and practice the invention in various embodiments with various modifications to suit a particular use. The scope of the invention is defined by the following claims.
Claims (8)
第1の時間にオキシメータプローブの源構造から前記第1の標的組織に第1の光を透過することと、
前記標的組織から反射された第1の反射光を前記オキシメータプローブの複数の検出器構造によって検出することと、
前記検出器構造によって検出された前記第1の反射光の第1の反射率データを前記検出器構造によって生成することと、
前記反射率データを複数のシミュレート反射率曲線に適合させることと、
前記第1の反射率データの、前記複数のシミュレート反射率曲線への適合から、前記シミュレート反射率曲線のうちの1つ以上の最良適合曲線を判断することとを備え、各シミュレート反射率曲線は、オキシメータパラメータの値に関連付けられ、さらに、
前記シミュレート反射率曲線のうち、前記第1の反射率データに対して最良に適合する1つ以上の曲線について、少なくとも第1のオキシメータパラメータを判断することと、
前記第1のオキシメータパラメータに基づいて第1のオキシメータ測定値の第1の値を判断することと、
前記第1のオキシメータ測定値の前記第1の値をメモリに格納することと、
前記第1の値をメモリに格納した後に第2の時間に前記オキシメータプローブの前記源構造から前記第1の標的組織とは異なる第2の標的組織に第2の光を透過することと、
前記第2の標的組織から反射された第2の反射光を前記オキシメータプローブの前記複数の検出器構造によって検出することと、
前記検出器構造によって検出された前記第2の反射光について第2の反射率データを前記検出器構造によって生成することと、
前記第2の反射率データを前記複数のシミュレート反射率曲線に適合させることと、
前記第2の反射率データの、前記複数のシミュレート反射率曲線への適合から、前記シミュレート反射率曲線のうちの1つ以上の最良適合曲線を判断することと、
前記シミュレート反射率曲線のうち、前記第2の反射率データに対して最良に適合する1つ以上の曲線について、少なくとも第2のオキシメータパラメータを判断することと、
第2の吸収係数に基づいて第2のオキシメータ測定値の第2の値を判断することと、
前記第2の値を判断した後に前記メモリから前記第1の値を検索することと、
前記第1の値と前記第2の値との間の百分率差を判断することと、
前記オキシメータプローブのディスプレイ上に前記百分率差を表示することとを備える、方法。 Contacting the probe tip with the patient's first target tissue,
In the first time, the first light is transmitted from the source structure of the oximeter probe to the first target tissue, and
The first reflected light reflected from the target tissue is detected by the plurality of detector structures of the oximeter probe, and
To generate the first reflectance data of the first reflected light detected by the detector structure by the detector structure, and
Fitting the reflectance data to multiple simulated reflectance curves,
Each simulated reflection comprises determining one or more of the simulated reflectance curves from the fit of the first reflectance data to the plurality of simulated reflectance curves. The rate curve is associated with the value of the oximeter parameter, and further
Determining at least the first oximeter parameter for one or more of the simulated reflectance curves that best fits the first reflectance data.
Determining the first value of the first oximeter measurement value based on the first oximeter parameter,
Storing the first value of the first oximeter measurement value in the memory and
After storing the first value in the memory, the second light is transmitted from the source structure of the oximeter probe to the second target tissue different from the first target tissue at the second time.
The detection of the second reflected light reflected from the second target tissue by the plurality of detector structures of the oximeter probe, and
To generate the second reflectance data for the second reflected light detected by the detector structure by the detector structure, and to generate the second reflectance data by the detector structure.
Fitting the second reflectance data to the plurality of simulated reflectance curves, and
From the fit of the second reflectance data to the plurality of simulated reflectance curves, one or more of the simulated reflectance curves is determined to be the best fit curve.
Determining at least the second oximeter parameter for one or more of the simulated reflectance curves that best fits the second reflectance data.
Determining the second value of the second oximeter measurement based on the second absorption coefficient,
Searching for the first value from the memory after determining the second value ,
Determining the percentage difference between the first value and the second value,
A method comprising displaying the percentage difference on a display of the oximeter probe.
Priority Applications (1)
| Application Number | Priority Date | Filing Date | Title |
|---|---|---|---|
| JP2021129888A JP7331050B2 (en) | 2016-04-22 | 2021-08-06 | Determination of absolute and relative tissue oxygen saturation |
Applications Claiming Priority (7)
| Application Number | Priority Date | Filing Date | Title |
|---|---|---|---|
| US201662326630P | 2016-04-22 | 2016-04-22 | |
| US201662326644P | 2016-04-22 | 2016-04-22 | |
| US201662326673P | 2016-04-22 | 2016-04-22 | |
| US62/326,630 | 2016-04-22 | ||
| US62/326,644 | 2016-04-22 | ||
| US62/326,673 | 2016-04-22 | ||
| PCT/US2017/029221 WO2017185104A1 (en) | 2016-04-22 | 2017-04-24 | Determining absolute and relative tissue oxygen saturation |
Related Child Applications (1)
| Application Number | Title | Priority Date | Filing Date |
|---|---|---|---|
| JP2021129888A Division JP7331050B2 (en) | 2016-04-22 | 2021-08-06 | Determination of absolute and relative tissue oxygen saturation |
Publications (3)
| Publication Number | Publication Date |
|---|---|
| JP2019516444A JP2019516444A (en) | 2019-06-20 |
| JP2019516444A5 JP2019516444A5 (en) | 2020-01-30 |
| JP6992003B2 true JP6992003B2 (en) | 2022-02-03 |
Family
ID=60089163
Family Applications (2)
| Application Number | Title | Priority Date | Filing Date |
|---|---|---|---|
| JP2018555235A Active JP6992003B2 (en) | 2016-04-22 | 2017-04-24 | Determining Absolute Tissue Oxygen Saturation and Relative Tissue Oxygen Saturation |
| JP2021129888A Active JP7331050B2 (en) | 2016-04-22 | 2021-08-06 | Determination of absolute and relative tissue oxygen saturation |
Family Applications After (1)
| Application Number | Title | Priority Date | Filing Date |
|---|---|---|---|
| JP2021129888A Active JP7331050B2 (en) | 2016-04-22 | 2021-08-06 | Determination of absolute and relative tissue oxygen saturation |
Country Status (8)
| Country | Link |
|---|---|
| US (8) | US10786187B2 (en) |
| EP (2) | EP3445244A4 (en) |
| JP (2) | JP6992003B2 (en) |
| KR (1) | KR102427034B1 (en) |
| CN (1) | CN109310374B (en) |
| CA (1) | CA3021460A1 (en) |
| MX (1) | MX2018012831A (en) |
| WO (2) | WO2017185103A1 (en) |
Families Citing this family (14)
| Publication number | Priority date | Publication date | Assignee | Title |
|---|---|---|---|---|
| USD1029274S1 (en) | 2016-04-19 | 2024-05-28 | Vioptix, Inc. | Medical device |
| FR3050824B1 (en) * | 2016-04-27 | 2023-04-28 | Connected Physics | METHOD AND APPARATUS FOR MEASURING WATER CONCENTRATION IN A LIGHT DIFFUSING MATERIAL. |
| WO2019213054A1 (en) * | 2018-05-01 | 2019-11-07 | Dynometrics Inc. D/B/A Humon | Tissue oxygen saturation detection and related apparatus and methods |
| AU2020300352B2 (en) * | 2019-07-04 | 2024-02-29 | Dipity Pty Ltd | Apparatus, systems and methods for assessing internal organs |
| JP7381301B2 (en) * | 2019-11-14 | 2023-11-15 | 日本光電工業株式会社 | Trained model generation method, trained model generation system, inference device, and computer program |
| US11844612B2 (en) | 2020-01-10 | 2023-12-19 | Vioptix, Inc. | Measurement averaging in a medical device |
| WO2021142469A1 (en) | 2020-01-10 | 2021-07-15 | Vioptix, Inc. | Medical device with stability measurement reporting |
| US11191460B1 (en) * | 2020-07-15 | 2021-12-07 | Shani Biotechnologies LLC | Device and method for measuring blood components |
| TWI814054B (en) * | 2021-08-17 | 2023-09-01 | 筑波醫電股份有限公司 | Optical measurement system |
| US20230263437A1 (en) | 2021-10-18 | 2023-08-24 | Vioptix, Inc. | Handheld Oximeter with Display of Real-Time, Average Measurements and Average Resetting |
| KR102712865B1 (en) * | 2021-11-25 | 2024-10-07 | 한국전력공사 | Apparatus and method for predicting life of underground cable |
| JP2024068784A (en) * | 2022-11-09 | 2024-05-21 | セイコーエプソン株式会社 | Biological information measuring device and biological information measuring method |
| JP2024068785A (en) * | 2022-11-09 | 2024-05-21 | セイコーエプソン株式会社 | Biological information measuring device and biological information measuring method |
| KR20250076136A (en) * | 2023-11-22 | 2025-05-29 | 주식회사 올리브헬스케어 | Probe for breast cancer diagnosis |
Citations (5)
| Publication number | Priority date | Publication date | Assignee | Title |
|---|---|---|---|---|
| US20100099964A1 (en) | 2008-09-15 | 2010-04-22 | Masimo Corporation | Hemoglobin monitor |
| US20100331639A1 (en) | 2009-06-30 | 2010-12-30 | O'reilly Michael | Pulse Oximetry System for Adjusting Medical Ventilation |
| US20150099955A1 (en) | 2013-10-07 | 2015-04-09 | Masimo Corporation | Regional oximetry user interface |
| JP2015107229A (en) | 2013-12-04 | 2015-06-11 | 日本光電工業株式会社 | Biosignal measuring system |
| JP2015528334A (en) | 2012-08-10 | 2015-09-28 | ビオプティックス・インコーポレイテッドVioptix,Inc. | Wireless and handheld tissue oximetry devices |
Family Cites Families (52)
| Publication number | Priority date | Publication date | Assignee | Title |
|---|---|---|---|---|
| EP0102816A3 (en) * | 1982-09-02 | 1985-08-28 | Nellcor Incorporated | Pulse oximeter |
| EP0497021A1 (en) * | 1991-01-31 | 1992-08-05 | Hamamatsu Photonics K.K. | Oximeter with monitor |
| US5337743A (en) * | 1993-06-17 | 1994-08-16 | The United States Of America As Represented By The Secretary Of The Air Force | Fatigue indicator based on arterial oxygen |
| AR008395A1 (en) | 1996-07-09 | 2000-01-19 | Astra Pharma Prod | COMPOUND DERIVED FROM PIRIMIDINE, PHARMACEUTICAL COMPOSITION THAT UNDERSTANDS IT, PROCEDURE TO PREPARE IT, AND INTERMEDIATE COMPOUND USEFUL TO CARRY OUT SUCH PROCEDURE. |
| EP1104254A2 (en) | 1998-08-13 | 2001-06-06 | Whitland Research Limited | Optical device |
| US6519487B1 (en) | 1998-10-15 | 2003-02-11 | Sensidyne, Inc. | Reusable pulse oximeter probe and disposable bandage apparatus |
| EP1889569B1 (en) | 1999-01-25 | 2014-06-18 | Masimo Corporation | Universal/upgrading pulse oximeter |
| WO2001054580A1 (en) | 2000-01-27 | 2001-08-02 | National Research Council Of Canada | Visible-near infrared spectroscopy in burn injury assessment |
| US6385821B1 (en) | 2000-02-17 | 2002-05-14 | Udt Sensors, Inc. | Apparatus for securing an oximeter probe to a patient |
| US6763256B2 (en) | 2002-08-16 | 2004-07-13 | Optical Sensors, Inc. | Pulse oximeter |
| US20060021925A1 (en) * | 2004-08-02 | 2006-02-02 | Jack Stifelman | Re-usable structure which attaches to the same filter head as originally intended to receive a throw-away spin-on |
| US20060053522A1 (en) | 2004-09-14 | 2006-03-16 | Kimbell Catherine Ann A | Pulse oximetry finger sleeve |
| JP2008531215A (en) * | 2005-03-01 | 2008-08-14 | マシモ・ラボラトリーズ・インコーポレーテッド | Multi-wavelength sensor attachment |
| DE102005051030A1 (en) | 2005-08-09 | 2007-02-15 | Flore, Ingo, Dr. | Medical measuring device |
| US7657293B2 (en) * | 2005-09-08 | 2010-02-02 | Vioptix Inc. | Method for monitoring viability of tissue flaps |
| US8233955B2 (en) | 2005-11-29 | 2012-07-31 | Cercacor Laboratories, Inc. | Optical sensor including disposable and reusable elements |
| US20070244377A1 (en) | 2006-03-14 | 2007-10-18 | Cozad Jenny L | Pulse oximeter sleeve |
| EP2034893B1 (en) * | 2006-05-30 | 2014-09-17 | University of Massachusetts | Measuring tissue oxygenation |
| CN100571625C (en) * | 2006-08-07 | 2009-12-23 | 北京超思电子技术有限责任公司 | A kind of checking refers to press from both sides the method for oximeter measurement data and refer to press from both sides oximeter |
| US8457707B2 (en) * | 2006-09-20 | 2013-06-04 | Masimo Corporation | Congenital heart disease monitor |
| US8639309B2 (en) | 2007-07-31 | 2014-01-28 | J&M Shuler, Inc. | Method and system for monitoring oxygenation levels of compartments and tissue |
| US9380966B2 (en) | 2007-06-22 | 2016-07-05 | Vioptix, Inc. | Tissue retractor oximeter |
| BRPI0822028A2 (en) | 2008-01-18 | 2015-07-21 | Johnson & Johnson Ltd | Ergonomic camera cable for an endoscopic imaging device |
| IL192739A (en) | 2008-07-10 | 2015-07-30 | Scalpal Llc | Handle for surgical and dental tools |
| CA2763087C (en) | 2008-07-22 | 2017-01-24 | Research Foundation Of The City University Of New York | Handheld apparatus to determine the viability of a biological tissue |
| KR20110053993A (en) | 2008-08-07 | 2011-05-24 | 유니버시티 오브 매사추세츠 | Spectrometer sensors |
| US7997732B2 (en) | 2008-10-06 | 2011-08-16 | The Catholic University Of America | Lenslet array for retinal oximetry |
| US8938279B1 (en) | 2009-01-26 | 2015-01-20 | VioOptix, Inc. | Multidepth tissue oximeter |
| US20100298728A1 (en) * | 2009-05-20 | 2010-11-25 | Nellcor Puritan Bennett Ireland | Signal Processing Techniques For Determining Signal Quality Using A Wavelet Transform Ratio Surface |
| US7884933B1 (en) | 2010-05-05 | 2011-02-08 | Revolutionary Business Concepts, Inc. | Apparatus and method for determining analyte concentrations |
| CN102058393B (en) * | 2010-10-30 | 2012-10-31 | 华中科技大学 | Method for measuring skin physiological parameters and optical characteristic parameters based on reflection spectrum measurement |
| US9033877B2 (en) * | 2011-02-23 | 2015-05-19 | Roche Diabetes Care, Inc. | Device and method for determining blood glucose characteristics |
| JP5642619B2 (en) | 2011-05-12 | 2014-12-17 | 富士フイルム株式会社 | Medical device system and method of operating medical device system |
| US9392945B2 (en) * | 2012-01-04 | 2016-07-19 | Masimo Corporation | Automated CCHD screening and detection |
| US9192330B2 (en) * | 2012-02-27 | 2015-11-24 | Covidien Lp | System and method for storing and providing patient-related data |
| US9345439B2 (en) | 2012-05-03 | 2016-05-24 | Vioptix, Inc. | Monte carlo and iterative methods for determination of tissue oxygen saturation |
| JP5702755B2 (en) | 2012-07-24 | 2015-04-15 | 富士フイルム株式会社 | Endoscope system, processor device for endoscope system, and method for operating endoscope system |
| US20140049770A1 (en) * | 2012-08-15 | 2014-02-20 | Nellcor Puritan Bennett Llc | Determining absorption coefficients in a photoacoustic system |
| CN102894983B (en) * | 2012-10-25 | 2017-08-29 | 北京超思电子技术有限责任公司 | A kind of oximetry data monitoring method and its device |
| US9119528B2 (en) * | 2012-10-30 | 2015-09-01 | Dexcom, Inc. | Systems and methods for providing sensitive and specific alarms |
| CN103271744A (en) * | 2012-12-10 | 2013-09-04 | 中国人民解放军第一五二中心医院 | Non-contact oxyhemoglobin saturation measuring method based on imaging device |
| US20140180043A1 (en) * | 2012-12-22 | 2014-06-26 | Covidien Lp | Methods and systems for determining signal quality of a physiological signal |
| US9788779B2 (en) * | 2013-03-14 | 2017-10-17 | Flint Hills Scientific, L.L.C. | Seizure detection based on work level excursion |
| WO2014153428A1 (en) | 2013-03-19 | 2014-09-25 | Surgisense Corporation | Apparatus, systems and methods for determining tissue oxygenation |
| US20160066863A1 (en) * | 2013-04-05 | 2016-03-10 | Nitto Denko Corporation | METHOD AND APPARATUS FOR DETERMINING SpO2 OF A SUBJECT FROM AN OPTICAL MEASUREMENT |
| TW201526875A (en) * | 2013-09-20 | 2015-07-16 | Sanofi Aventis Deutschland | Medical device and method operating same |
| US9861317B2 (en) * | 2014-02-20 | 2018-01-09 | Covidien Lp | Methods and systems for determining regional blood oxygen saturation |
| US10098576B2 (en) * | 2014-03-14 | 2018-10-16 | Covidien Lp | Regional saturation shock detection method and system |
| US10448867B2 (en) * | 2014-09-05 | 2019-10-22 | Vision Service Plan | Wearable gait monitoring apparatus, systems, and related methods |
| ES2837061T3 (en) | 2014-09-09 | 2021-06-29 | Lumithera Inc | Multi-wavelength phototherapy devices for non-invasive treatment of diseased or damaged tissue |
| CN105232054A (en) * | 2015-10-20 | 2016-01-13 | 沈阳国际旅行卫生保健中心 | Human body endocrine system health risk early warning system |
| CN105361858B (en) * | 2015-12-10 | 2018-04-03 | 广东小天才科技有限公司 | Blood pressure data processing method and wearable device |
-
2017
- 2017-04-24 US US15/495,194 patent/US10786187B2/en active Active
- 2017-04-24 EP EP17786813.0A patent/EP3445244A4/en not_active Withdrawn
- 2017-04-24 JP JP2018555235A patent/JP6992003B2/en active Active
- 2017-04-24 CN CN201780038498.2A patent/CN109310374B/en active Active
- 2017-04-24 MX MX2018012831A patent/MX2018012831A/en unknown
- 2017-04-24 KR KR1020187032557A patent/KR102427034B1/en active Active
- 2017-04-24 WO PCT/US2017/029220 patent/WO2017185103A1/en not_active Ceased
- 2017-04-24 WO PCT/US2017/029221 patent/WO2017185104A1/en not_active Ceased
- 2017-04-24 EP EP22172768.8A patent/EP4162873B1/en active Active
- 2017-04-24 US US15/495,212 patent/US10849536B2/en active Active
- 2017-04-24 CA CA3021460A patent/CA3021460A1/en active Pending
-
2020
- 2020-09-29 US US17/037,545 patent/US11589784B2/en active Active
- 2020-12-01 US US17/109,069 patent/US12016689B2/en active Active
-
2021
- 2021-08-06 JP JP2021129888A patent/JP7331050B2/en active Active
-
2023
- 2023-02-24 US US18/114,185 patent/US12070311B2/en active Active
-
2024
- 2024-06-25 US US18/753,986 patent/US20240341642A1/en active Pending
- 2024-08-27 US US18/816,729 patent/US12376769B2/en active Active
-
2025
- 2025-08-05 US US19/291,405 patent/US20250352098A1/en active Pending
Patent Citations (5)
| Publication number | Priority date | Publication date | Assignee | Title |
|---|---|---|---|---|
| US20100099964A1 (en) | 2008-09-15 | 2010-04-22 | Masimo Corporation | Hemoglobin monitor |
| US20100331639A1 (en) | 2009-06-30 | 2010-12-30 | O'reilly Michael | Pulse Oximetry System for Adjusting Medical Ventilation |
| JP2015528334A (en) | 2012-08-10 | 2015-09-28 | ビオプティックス・インコーポレイテッドVioptix,Inc. | Wireless and handheld tissue oximetry devices |
| US20150099955A1 (en) | 2013-10-07 | 2015-04-09 | Masimo Corporation | Regional oximetry user interface |
| JP2015107229A (en) | 2013-12-04 | 2015-06-11 | 日本光電工業株式会社 | Biosignal measuring system |
Also Published As
| Publication number | Publication date |
|---|---|
| CN109310374B (en) | 2022-12-30 |
| US20240341642A1 (en) | 2024-10-17 |
| US20210077000A1 (en) | 2021-03-18 |
| WO2017185104A1 (en) | 2017-10-26 |
| CN109310374A (en) | 2019-02-05 |
| MX2018012831A (en) | 2019-03-28 |
| KR102427034B1 (en) | 2022-07-29 |
| JP2019516444A (en) | 2019-06-20 |
| EP3445244A1 (en) | 2019-02-27 |
| BR112018071581A2 (en) | 2019-02-12 |
| US20250352098A1 (en) | 2025-11-20 |
| US20210007649A1 (en) | 2021-01-14 |
| JP2021184812A (en) | 2021-12-09 |
| US12070311B2 (en) | 2024-08-27 |
| US20170303835A1 (en) | 2017-10-26 |
| JP7331050B2 (en) | 2023-08-22 |
| US12016689B2 (en) | 2024-06-25 |
| EP3445244A4 (en) | 2019-12-11 |
| EP4162873B1 (en) | 2025-10-01 |
| WO2017185103A1 (en) | 2017-10-26 |
| US11589784B2 (en) | 2023-02-28 |
| US10849536B2 (en) | 2020-12-01 |
| BR112018071581A8 (en) | 2023-03-14 |
| US20240415427A1 (en) | 2024-12-19 |
| US20170303837A1 (en) | 2017-10-26 |
| KR20180131614A (en) | 2018-12-10 |
| US12376769B2 (en) | 2025-08-05 |
| EP4162873A1 (en) | 2023-04-12 |
| CA3021460A1 (en) | 2017-10-26 |
| US10786187B2 (en) | 2020-09-29 |
| US20230240568A1 (en) | 2023-08-03 |
Similar Documents
| Publication | Publication Date | Title |
|---|---|---|
| JP7331050B2 (en) | Determination of absolute and relative tissue oxygen saturation | |
| TWI743108B (en) | Determining absolute and relative tissue oxygen saturation | |
| US20250366747A1 (en) | Oximeter with Selectable Tissue Depth | |
| CA3021664C (en) | Determining tissue oxygen saturation with melanin correction |
Legal Events
| Date | Code | Title | Description |
|---|---|---|---|
| A521 | Request for written amendment filed |
Free format text: JAPANESE INTERMEDIATE CODE: A523 Effective date: 20191210 |
|
| A621 | Written request for application examination |
Free format text: JAPANESE INTERMEDIATE CODE: A621 Effective date: 20191210 |
|
| A977 | Report on retrieval |
Free format text: JAPANESE INTERMEDIATE CODE: A971007 Effective date: 20201130 |
|
| A131 | Notification of reasons for refusal |
Free format text: JAPANESE INTERMEDIATE CODE: A131 Effective date: 20201208 |
|
| A521 | Request for written amendment filed |
Free format text: JAPANESE INTERMEDIATE CODE: A523 Effective date: 20210308 |
|
| A02 | Decision of refusal |
Free format text: JAPANESE INTERMEDIATE CODE: A02 Effective date: 20210406 |
|
| A521 | Request for written amendment filed |
Free format text: JAPANESE INTERMEDIATE CODE: A523 Effective date: 20210806 |
|
| C60 | Trial request (containing other claim documents, opposition documents) |
Free format text: JAPANESE INTERMEDIATE CODE: C60 Effective date: 20210806 |
|
| A521 | Request for written amendment filed |
Free format text: JAPANESE INTERMEDIATE CODE: A523 Effective date: 20210819 |
|
| A911 | Transfer to examiner for re-examination before appeal (zenchi) |
Free format text: JAPANESE INTERMEDIATE CODE: A911 Effective date: 20210929 |
|
| C21 | Notice of transfer of a case for reconsideration by examiners before appeal proceedings |
Free format text: JAPANESE INTERMEDIATE CODE: C21 Effective date: 20211005 |
|
| TRDD | Decision of grant or rejection written | ||
| A01 | Written decision to grant a patent or to grant a registration (utility model) |
Free format text: JAPANESE INTERMEDIATE CODE: A01 Effective date: 20211109 |
|
| A61 | First payment of annual fees (during grant procedure) |
Free format text: JAPANESE INTERMEDIATE CODE: A61 Effective date: 20211208 |
|
| R150 | Certificate of patent or registration of utility model |
Ref document number: 6992003 Country of ref document: JP Free format text: JAPANESE INTERMEDIATE CODE: R150 |
|
| R250 | Receipt of annual fees |
Free format text: JAPANESE INTERMEDIATE CODE: R250 |
|
| R250 | Receipt of annual fees |
Free format text: JAPANESE INTERMEDIATE CODE: R250 |