JP6987062B2 - Methods and systems for analyzing functional image data - Google Patents
Methods and systems for analyzing functional image data Download PDFInfo
- Publication number
- JP6987062B2 JP6987062B2 JP2018539982A JP2018539982A JP6987062B2 JP 6987062 B2 JP6987062 B2 JP 6987062B2 JP 2018539982 A JP2018539982 A JP 2018539982A JP 2018539982 A JP2018539982 A JP 2018539982A JP 6987062 B2 JP6987062 B2 JP 6987062B2
- Authority
- JP
- Japan
- Prior art keywords
- msn
- neuron
- stimulation
- brain
- model
- Prior art date
- Legal status (The legal status is an assumption and is not a legal conclusion. Google has not performed a legal analysis and makes no representation as to the accuracy of the status listed.)
- Active
Links
Images


Classifications
-
- A—HUMAN NECESSITIES
- A61—MEDICAL OR VETERINARY SCIENCE; HYGIENE
- A61B—DIAGNOSIS; SURGERY; IDENTIFICATION
- A61B5/00—Measuring for diagnostic purposes; Identification of persons
- A61B5/72—Signal processing specially adapted for physiological signals or for diagnostic purposes
- A61B5/7271—Specific aspects of physiological measurement analysis
- A61B5/7275—Determining trends in physiological measurement data; Predicting development of a medical condition based on physiological measurements, e.g. determining a risk factor
-
- A—HUMAN NECESSITIES
- A61—MEDICAL OR VETERINARY SCIENCE; HYGIENE
- A61B—DIAGNOSIS; SURGERY; IDENTIFICATION
- A61B5/00—Measuring for diagnostic purposes; Identification of persons
- A61B5/05—Detecting, measuring or recording for diagnosis by means of electric currents or magnetic fields; Measuring using microwaves or radio waves
- A61B5/055—Detecting, measuring or recording for diagnosis by means of electric currents or magnetic fields; Measuring using microwaves or radio waves involving electronic [EMR] or nuclear [NMR] magnetic resonance, e.g. magnetic resonance imaging
-
- A—HUMAN NECESSITIES
- A61—MEDICAL OR VETERINARY SCIENCE; HYGIENE
- A61B—DIAGNOSIS; SURGERY; IDENTIFICATION
- A61B5/00—Measuring for diagnostic purposes; Identification of persons
- A61B5/24—Detecting, measuring or recording bioelectric or biomagnetic signals of the body or parts thereof
- A61B5/242—Detecting biomagnetic fields, e.g. magnetic fields produced by bioelectric currents
- A61B5/245—Detecting biomagnetic fields, e.g. magnetic fields produced by bioelectric currents specially adapted for magnetoencephalographic [MEG] signals
- A61B5/246—Detecting biomagnetic fields, e.g. magnetic fields produced by bioelectric currents specially adapted for magnetoencephalographic [MEG] signals using evoked responses
-
- A—HUMAN NECESSITIES
- A61—MEDICAL OR VETERINARY SCIENCE; HYGIENE
- A61B—DIAGNOSIS; SURGERY; IDENTIFICATION
- A61B5/00—Measuring for diagnostic purposes; Identification of persons
- A61B5/24—Detecting, measuring or recording bioelectric or biomagnetic signals of the body or parts thereof
- A61B5/316—Modalities, i.e. specific diagnostic methods
- A61B5/369—Electroencephalography [EEG]
- A61B5/377—Electroencephalography [EEG] using evoked responses
-
- A—HUMAN NECESSITIES
- A61—MEDICAL OR VETERINARY SCIENCE; HYGIENE
- A61B—DIAGNOSIS; SURGERY; IDENTIFICATION
- A61B5/00—Measuring for diagnostic purposes; Identification of persons
- A61B5/40—Detecting, measuring or recording for evaluating the nervous system
- A61B5/4058—Detecting, measuring or recording for evaluating the nervous system for evaluating the central nervous system
- A61B5/4064—Evaluating the brain
-
- A—HUMAN NECESSITIES
- A61—MEDICAL OR VETERINARY SCIENCE; HYGIENE
- A61B—DIAGNOSIS; SURGERY; IDENTIFICATION
- A61B5/00—Measuring for diagnostic purposes; Identification of persons
- A61B5/40—Detecting, measuring or recording for evaluating the nervous system
- A61B5/4076—Diagnosing or monitoring particular conditions of the nervous system
-
- A—HUMAN NECESSITIES
- A61—MEDICAL OR VETERINARY SCIENCE; HYGIENE
- A61N—ELECTROTHERAPY; MAGNETOTHERAPY; RADIATION THERAPY; ULTRASOUND THERAPY
- A61N5/00—Radiation therapy
- A61N5/06—Radiation therapy using light
- A61N5/0613—Apparatus adapted for a specific treatment
- A61N5/0622—Optical stimulation for exciting neural tissue
-
- G—PHYSICS
- G01—MEASURING; TESTING
- G01R—MEASURING ELECTRIC VARIABLES; MEASURING MAGNETIC VARIABLES
- G01R33/00—Arrangements or instruments for measuring magnetic variables
- G01R33/20—Arrangements or instruments for measuring magnetic variables involving magnetic resonance
- G01R33/44—Arrangements or instruments for measuring magnetic variables involving magnetic resonance using nuclear magnetic resonance [NMR]
- G01R33/48—NMR imaging systems
- G01R33/4806—Functional imaging of brain activation
-
- G—PHYSICS
- G06—COMPUTING; CALCULATING OR COUNTING
- G06T—IMAGE DATA PROCESSING OR GENERATION, IN GENERAL
- G06T7/00—Image analysis
- G06T7/0002—Inspection of images, e.g. flaw detection
- G06T7/0012—Biomedical image inspection
-
- G—PHYSICS
- G16—INFORMATION AND COMMUNICATION TECHNOLOGY [ICT] SPECIALLY ADAPTED FOR SPECIFIC APPLICATION FIELDS
- G16H—HEALTHCARE INFORMATICS, i.e. INFORMATION AND COMMUNICATION TECHNOLOGY [ICT] SPECIALLY ADAPTED FOR THE HANDLING OR PROCESSING OF MEDICAL OR HEALTHCARE DATA
- G16H50/00—ICT specially adapted for medical diagnosis, medical simulation or medical data mining; ICT specially adapted for detecting, monitoring or modelling epidemics or pandemics
- G16H50/20—ICT specially adapted for medical diagnosis, medical simulation or medical data mining; ICT specially adapted for detecting, monitoring or modelling epidemics or pandemics for computer-aided diagnosis, e.g. based on medical expert systems
-
- G—PHYSICS
- G16—INFORMATION AND COMMUNICATION TECHNOLOGY [ICT] SPECIALLY ADAPTED FOR SPECIFIC APPLICATION FIELDS
- G16H—HEALTHCARE INFORMATICS, i.e. INFORMATION AND COMMUNICATION TECHNOLOGY [ICT] SPECIALLY ADAPTED FOR THE HANDLING OR PROCESSING OF MEDICAL OR HEALTHCARE DATA
- G16H50/00—ICT specially adapted for medical diagnosis, medical simulation or medical data mining; ICT specially adapted for detecting, monitoring or modelling epidemics or pandemics
- G16H50/50—ICT specially adapted for medical diagnosis, medical simulation or medical data mining; ICT specially adapted for detecting, monitoring or modelling epidemics or pandemics for simulation or modelling of medical disorders
-
- G—PHYSICS
- G16—INFORMATION AND COMMUNICATION TECHNOLOGY [ICT] SPECIALLY ADAPTED FOR SPECIFIC APPLICATION FIELDS
- G16Z—INFORMATION AND COMMUNICATION TECHNOLOGY [ICT] SPECIALLY ADAPTED FOR SPECIFIC APPLICATION FIELDS, NOT OTHERWISE PROVIDED FOR
- G16Z99/00—Subject matter not provided for in other main groups of this subclass
-
- A—HUMAN NECESSITIES
- A61—MEDICAL OR VETERINARY SCIENCE; HYGIENE
- A61B—DIAGNOSIS; SURGERY; IDENTIFICATION
- A61B2576/00—Medical imaging apparatus involving image processing or analysis
- A61B2576/02—Medical imaging apparatus involving image processing or analysis specially adapted for a particular organ or body part
- A61B2576/026—Medical imaging apparatus involving image processing or analysis specially adapted for a particular organ or body part for the brain
-
- A—HUMAN NECESSITIES
- A61—MEDICAL OR VETERINARY SCIENCE; HYGIENE
- A61B—DIAGNOSIS; SURGERY; IDENTIFICATION
- A61B5/00—Measuring for diagnostic purposes; Identification of persons
- A61B5/24—Detecting, measuring or recording bioelectric or biomagnetic signals of the body or parts thereof
- A61B5/242—Detecting biomagnetic fields, e.g. magnetic fields produced by bioelectric currents
- A61B5/245—Detecting biomagnetic fields, e.g. magnetic fields produced by bioelectric currents specially adapted for magnetoencephalographic [MEG] signals
-
- A—HUMAN NECESSITIES
- A61—MEDICAL OR VETERINARY SCIENCE; HYGIENE
- A61B—DIAGNOSIS; SURGERY; IDENTIFICATION
- A61B5/00—Measuring for diagnostic purposes; Identification of persons
- A61B5/24—Detecting, measuring or recording bioelectric or biomagnetic signals of the body or parts thereof
- A61B5/316—Modalities, i.e. specific diagnostic methods
- A61B5/369—Electroencephalography [EEG]
Landscapes
- Health & Medical Sciences (AREA)
- Life Sciences & Earth Sciences (AREA)
- Engineering & Computer Science (AREA)
- Physics & Mathematics (AREA)
- Public Health (AREA)
- Medical Informatics (AREA)
- General Health & Medical Sciences (AREA)
- Biomedical Technology (AREA)
- Pathology (AREA)
- Biophysics (AREA)
- Veterinary Medicine (AREA)
- Animal Behavior & Ethology (AREA)
- Heart & Thoracic Surgery (AREA)
- Molecular Biology (AREA)
- Surgery (AREA)
- Nuclear Medicine, Radiotherapy & Molecular Imaging (AREA)
- Neurology (AREA)
- Radiology & Medical Imaging (AREA)
- Neurosurgery (AREA)
- High Energy & Nuclear Physics (AREA)
- Psychology (AREA)
- Epidemiology (AREA)
- Data Mining & Analysis (AREA)
- Primary Health Care (AREA)
- Physiology (AREA)
- Databases & Information Systems (AREA)
- General Physics & Mathematics (AREA)
- Psychiatry (AREA)
- Condensed Matter Physics & Semiconductors (AREA)
- Computer Vision & Pattern Recognition (AREA)
- Signal Processing (AREA)
- Artificial Intelligence (AREA)
- Quality & Reliability (AREA)
- Theoretical Computer Science (AREA)
- Magnetic Resonance Imaging Apparatus (AREA)
- Measurement And Recording Of Electrical Phenomena And Electrical Characteristics Of The Living Body (AREA)
Description
神経科学研究は、脳回路網内の特異的な細胞型が行動に関する出力に固有に寄与することを示している。脳の同一の領域内の別個の細胞型は、別個の、時には反対の行動を駆り立てることが示されている。 Neuroscience studies have shown that specific cell types within brain networks contribute uniquely to behavioral output. Separate cell types within the same area of the brain have been shown to drive distinct, sometimes opposite behaviors.
神経解剖学研究は、単一のニューロンであっても脳の大部分に結合し得ることを更に示している。更に、基底核−視床皮質回路の場合のように結合された細胞の回路網全体を介して機能する多くの回路が脳に存在する。 Neuroanatomical studies have further shown that even a single neuron can connect to most of the brain. In addition, there are many circuits in the brain that function through the entire network of connected cells, as in the case of the basal ganglia-thalamic cortex circuit.
光遺伝学機能的磁気共鳴画像法(ofMRI )は、光遺伝学的刺激をfMRIリードアウトと組み合わせる技術である。光遺伝学によって、高磁場のfMRIが脳全体に亘って生きた被験体で生じる反応を測定している間、光を使用した細胞型特異的なミリ秒規模の活動調節が可能になる。 Optogenetics Functional Magnetic Resonance Imaging (ofMRI) is a technique that combines optogenetic stimulation with fMRI readouts. Optogenetics enables cell-type-specific millisecond-scale activity regulation using light while high-field fMRI measures the reactions that occur in living subjects throughout the brain.
脳の機能活動データを解析するための方法及びシステムを提供する。本開示の方法は、個体の脳の領域に関して、前記領域内のニューロンの集団的な活動を表す機能活動データを得て、i) 前記ニューロンサブタイプの各々に対応するノードを有して前記領域を表す相互に結合されたノード間の機能的結合の回路網モデルに基づき前記機能活動データから結合性モデルを生成し、ii) a)前記結合性モデルとb)相互に結合された前記ノード間のニューロンサブタイプ特異的結合性推定値との線形回帰から一組の係数を導くことにより、複数のニューロンサブタイプによって調節される神経経路の相対活動を推定し、前記線形回帰の一組の係数は、別個のニューロンサブタイプの各々によって調節される神経経路の機能活動データへの寄与を表してもよい。本方法を行う際に使用されるシステムを更に提供する。 Provided are methods and systems for analyzing functional activity data of the brain. The methods of the present disclosure obtain functional activity data representing the collective activity of neurons within said region with respect to an individual brain region, i) having nodes corresponding to each of the neuron subtypes said region. A connectivity model is generated from the functional activity data based on a network model of functional coupling between interconnected nodes representing ii) a) the coupling model and b) between the interconnected nodes. By deriving a set of coefficients from a linear regression with the neuron subtype-specific connectivity estimates of, the relative activity of the neural pathways regulated by multiple neuron subtypes is estimated, and the set of coefficients of the linear regression May represent a contribution to functional activity data of neural pathways regulated by each of the distinct neuronal subtypes. Further provided is a system used in performing this method.
本開示は、a)第1の個体の脳の領域に関して、前記領域内の複数のニューロンの集団的な活動を表す機能活動データを得て、b)前記機能活動データを計算処理することによって、複数のニューロンサブタイプの各々によって調節される神経経路の相対活動を推定し、前記機能活動データを計算処理する際に、i) 前記複数のニューロンサブタイプの各々に対応するノードを有して前記領域を表す相互に結合されたノード間の機能的結合の回路網モデルに基づき前記機能活動データから結合性モデルを生成し、ii) a)前記結合性モデルとb)相互に結合された前記ノード間のニューロンサブタイプ特異的結合性推定値との線形回帰から一組の係数を導き、前記線形回帰の一組の係数は、複数の別個のニューロンサブタイプの各々によって調節される神経経路の機能活動データへの寄与を表すことを特徴とする方法を提供する。 In the present disclosure, a) functional activity data representing the collective activity of a plurality of neurons in the region of the brain of the first individual is obtained, and b) the functional activity data is calculated and processed. In estimating the relative activity of the neural pathways regulated by each of the plurality of neuronal subtypes and computing the functional activity data, i) having a node corresponding to each of the plurality of neuronal subtypes. A connectivity model is generated from the functional activity data based on a network model of functional coupling between interconnected nodes representing regions, ii) a) the coupling model and b) the interconnected nodes. A set of coefficients is derived from a linear regression with a neuron subtype-specific connectivity estimate between them, and the set of coefficients of the linear regression is a function of the neural pathway regulated by each of a plurality of distinct neuron subtypes. Provided is a method characterized by representing a contribution to activity data.
ある場合には、前記機能活動データは静止状態の機能活動データである。ある場合には、前記ニューロンサブタイプの各々はニューロンの同一性によって分類されるニューロンを含んでいる。ある場合には、前記ニューロンの同一性は、ニューロンサブタイプ特異的なマーカの発現及び/又はニューロンサブタイプ特異的な空間位置を含んでいる。ある場合には、前記ニューロンサブタイプの各々は活動パターンによって分類されるニューロンを含んでいる。ある場合には、前記活動パターンは、活動のニューロンサブタイプ特異的な頻度、継続時間及び/又は大きさを含んでいる。ある場合には、前記結合性モデルを生成する際に、動的因果モデリング(DCM )を使用してDCM 結合性モデルを生成する。ある場合には、DCM はスペクトルDCM (spDCM )である。ある場合には、spDCM は確率論的モデリングを含んでいる。ある場合には、前記結合性モデルを生成する際に、ニューラルマスモデリング(NMM )を使用する。ある場合には、機能的磁気共鳴画像法(fMRI)、脳磁図(MEG )及び/又は脳波記録法(EEG )によって前記機能活動データを得る。ある場合には、前記機能活動データを得る際に、fMRI、MEG 及び/又はEEG を使用して前記領域の機能活動を測定する。ある場合には、前記一組の係数を導く際に、一般線形モデル、線形最小二乗回帰、ロバスト線形回帰、サポートベクトルマシン、二次計画法又はリッジ回帰を使用する。ある場合には、前記脳の領域は、視床、皮質、腹側被蓋野(VTA )、前頭前皮質(PFC )、側坐核(NAc )、扁桃体(BLA )、黒質(SN)、腹側淡蒼球、淡蒼球、背側線条体、腹側線条体、視床下核(STN )、前方尾状核被殻(CPu )、淡蒼球外節(GPe )、淡蒼球内節(GPi )、海馬、歯状回、帯状回、嗅内皮質、嗅覚皮質、運動皮質、小脳又はこれらの組合せを含む。ある場合には、前記ニューロンサブタイプは、視床、皮質、腹側被蓋野(VTA )、前頭前皮質(PFC )、側坐核(NAc )、扁桃体(BLA )、黒質(SN)、腹側淡蒼球、淡蒼球、線条体、背側線条体、腹側線条体、視床下核(STN )、前方尾状核被殻(CPu )、淡蒼球外節(GPe )、淡蒼球内節(GPi )、海馬、歯状回、帯状回、嗅内皮質、嗅覚皮質、運動皮質又は小脳のニューロンを含む。ある場合には、前記ニューロンサブタイプは中型有棘ニューロンを含む。ある場合には、前記ニューロンサブタイプは、ドーパミン作動性ニューロン、コリン作動性ニューロン、ガンマアミノ酪酸(GABA)作動性ニューロン、グルタミン酸作動性ニューロン又はペプチド作動性ニューロンを含む。ある場合には、前記ニューロンサブタイプは、ドーパミン受容体サブタイプ、代謝型グルタミン酸受容体サブタイプ、イオンチャネル型グルタミン酸受容体サブタイプ、代謝型アセチルコリン受容体サブタイプ、イオンチャネル型アセチルコリン受容体サブタイプ、GABAA 受容体サブタイプ又はGABAB 受容体サブタイプを発現するニューロンを含む。ある場合には、前記ニューロンサブタイプ特異的結合性推定値を、前記第1の個体が属する有機体の種とは異なる種の有機体から導く。ある場合には、前記第1の個体はヒトの個体である。ある場合には、前記第1の個体は健康な個体である。ある場合には、前記第1の個体は神経障害を患っている。ある場合には、前記神経障害は神経疾患、又は加齢に関連した神経障害である。ある場合には、前記神経疾患は、パーキンソン病、アルツハイマー病、認知症、てんかん、自閉症、双極性障害、統合失調症、トゥーレット症候群、強迫性障害、注意欠陥多動性障害、ハンチントン病、多発性硬化症又は片頭痛である。ある場合には、前記神経経路の相対活動を推定する際に、ii) 一組の係数を導く前に、iii) 前記ニューロンサブタイプ特異的結合性推定値を生成する。ある場合には、前記ニューロンサブタイプ特異的結合性推定値を生成する際に、ニューロンサブタイプ毎に、前記第1の個体の脳の領域に相当する一又は複数の第2の個体の脳の領域に関して、前記一又は複数の第2の個体の脳のニューロンサブタイプのニューロンの選択的な活動調節によって引き起こされる前記一又は複数の第2の個体の脳の領域内の複数のニューロンの集団的な活動を表すニューロンサブタイプ機能活動データを得て、前記複数のニューロンサブタイプ毎に、前記回路網モデルに基づき前記ニューロンサブタイプ機能活動データからニューロンサブタイプ特異的結合性モデルを生成し、前記ニューロンサブタイプ特異的結合性モデルの前記一又は複数の第2の個体全体に亘る平均に基づき、前記複数のニューロンサブタイプ毎に前記回路網モデルの相互に結合されたノード間の結合性を推定する。ある場合には、機能的磁気共鳴画像法(fMRI)、脳磁図(MEG )及び/又は脳波記録法(EEG )によって前記ニューロンサブタイプ機能活動データを得る。ある場合には、前記ニューロンサブタイプ機能活動データを得る際に、fMRI、MEG 及び/又はEEG を使用して前記領域の機能活動を測定して、前記ニューロンサブタイプ機能活動データを得る。ある場合には、前記一又は複数の第2の個体のニューロンサブタイプのニューロンは、前記ニューロンが活性化光刺激によって照射されると、前記ニューロンの活動を調節するように構成された光活性化ポリペプチドを選択的に発現する。ある場合には、前記ニューロンサブタイプ機能活動データを得る際に、前記一又は複数の第2の個体の複数のニューロンサブタイプ毎に、前記ニューロンサブタイプのニューロンを活性化光刺激で照射し、前記領域の機能活動を測定することにより、前記ニューロンサブタイプ機能活動データを生成する。ある場合には、前記ニューロンサブタイプ特異的結合性モデルを生成する際に、動的因果モデリング(DCM )を使用してニューロンサブタイプ特異的DCM 結合性モデルを生成する。ある場合には、DCM はスペクトルDCM (spDCM )である。ある場合には、spDCM は確率論的モデリングを含んでいる。 In some cases, the functional activity data is stationary functional activity data. In some cases, each of the neuron subtypes comprises neurons classified by neuronal identity. In some cases, the neuron identity comprises the expression of neuron subtype-specific markers and / or neuron subtype-specific spatial positions. In some cases, each of the neuron subtypes comprises neurons classified by activity pattern. In some cases, the activity pattern comprises a neuron subtype-specific frequency, duration and / or magnitude of activity. In some cases, dynamic causal modeling (DCM) is used to generate the DCM binding model when generating the binding model. In some cases, the DCM is the spectral DCM (spDCM). In some cases, spDCM involves probabilistic modeling. In some cases, neural mass modeling (NMM) is used in generating the connectivity model. In some cases, functional activity data is obtained by functional magnetic resonance imaging (fMRI), magnetoencephalography (MEG) and / or electroencephalography (EEG). In some cases, fMRI, MEG and / or EEG are used to measure the functional activity of the region in obtaining the functional activity data. In some cases, general linear models, linear least squares regression, robust linear regression, support vector machines, quadratic programming or ridge regression are used in deriving the set of coefficients. In some cases, the areas of the brain include the subthalamic nucleus, cortex, ventral putamen (VTA), prefrontal cortex (PFC), lateral sciatic nucleus (NAc), globus pallidus (BLA), globus pallidus (SN), and abdomen. Lateral globus pallidus, globus pallidus, dorsal striatum, ventral striatum, subthalamic nucleus (STN), anterior caudate putamen (CPu), external globus pallidum (GPe), internal globus pallidus (GPi), hippocampus, dentate gyrus, zonal gyrus, entorhinal cortex, olfactory cortex, motor cortex, cerebrum or a combination thereof. In some cases, the neurosubtypes are subthalamic, cortex, ventral cortex (VTA), prefrontal cortex (PFC), lateral sciatic nucleus (NAc), globus pallidus (BLA), globus pallidus (SN), abdomen. Lateral globus pallidus, globus pallidus, striatum, dorsal globus pallidus, ventral striatum, subthalamic nucleus (STN), anterior caudate nucleus shell (CPu), external globus pallidum (GPe), pale Includes globus pallidus (GPi), hippocampus, dentate, striatal, entorhinal cortex, olfactory cortex, motor cortex or cerebral neurons. In some cases, the neuron subtype includes medium-sized spiny neurons. In some cases, said neuron subtypes include dopaminergic neurons, cholinergic neurons, gamma-aminobutyric acid (GABA) -operated neurons, glutamatergic neurons or peptidergic neurons. In some cases, the neuron subtypes are dopamine receptor subtypes, metabolic glutamate receptor subtypes, ion channel glutamate receptor subtypes, metabolic acetylcholine receptor subtypes, ion channel acetylcholine receptor subtypes. , GABA A receptor subtype or GABA B receptor subtype expressing neurons. In some cases, the neuron subtype-specific connectivity estimates are derived from an organism of a different species than the species of the organism to which the first individual belongs. In some cases, the first individual is a human individual. In some cases, the first individual is a healthy individual. In some cases, the first individual suffers from a neuropathy. In some cases, the neuropathy is a neurological disorder, or an age-related neuropathy. In some cases, the neurological disorders include Parkinson's disease, Alzheimer's disease, dementia, epilepsy, autism, bipolar disorder, schizophrenia, Rett syndrome, compulsive disorder, attention deficit hyperactivity disorder, Huntington's disease. , Multiple sclerosis or migraine. In some cases, in estimating the relative activity of said neural pathways, ii) generate the neuron subtype-specific connectivity estimates before deriving a set of coefficients. In some cases, in generating the neuron subtype-specific connectivity estimates, for each neuron subtype, the brain of one or more second individuals corresponding to the region of the brain of the first individual. With respect to a region, a collective of neurons within the region of the brain of the one or more second individuals caused by the selective regulation of activity of neurons of the neuron subtype of the brain of the one or more second individuals. Neuron subtype functional activity data representing various activities is obtained, and a neuron subtype-specific connectivity model is generated from the neuron subtype functional activity data based on the network model for each of the plurality of neuron subtypes. Estimate the connectivity between the interconnected nodes of the network model for each of the plurality of neuron subtypes based on the mean over the whole of the one or more second individuals of the neuron subtype-specific connectivity model. do. In some cases, the neuron subtype functional activity data is obtained by functional magnetic resonance imaging (fMRI), magnetoencephalography (MEG) and / or electroencephalography (EEG). In some cases, when obtaining the neuron subtype functional activity data, fMRI, MEG and / or EEG is used to measure the functional activity of the region to obtain the neuron subtype functional activity data. In some cases, a neuron of the neuron subtype of the one or more second individuals is photoactivated so as to regulate the activity of the neuron when the neuron is irradiated by an activation photostimulus. Selectively express the polypeptide. In some cases, when obtaining the neuron subtype functional activity data, the neurons of the neuron subtype are irradiated with activated photostimulation for each of the plurality of neuron subtypes of the one or more second individuals. By measuring the functional activity of the region, the neuron subtype functional activity data is generated. In some cases, dynamic causal modeling (DCM) is used to generate the neuron subtype-specific DCM connectivity model when generating the neuron subtype-specific connectivity model. In some cases, the DCM is the spectral DCM (spDCM). In some cases, spDCM involves probabilistic modeling.
本開示は、神経障害に関連した神経回路レベルバイオマーカを識別する方法であって、i) 神経障害を患っている第1の個体の症例グループ及び第1の個体の対照グループを有する第1の個体の複数のグループの各第1の個体に上記又は本明細書の他の箇所に記載されているような方法を行うことにより、複数のニューロンサブタイプの各々によって調節される神経経路の相対活動を推定し、前記相対活動を推定することにより、前記症例グループの複数の別個のニューロンサブタイプの各々によって調節される神経経路の症例機能活動データへの寄与を表す症例組の回帰係数、及び前記対照グループの複数の別個のニューロンサブタイプの各々によって調節される神経経路の対照機能活動データへの寄与を表す対照組の回帰係数を有する複数組の回帰係数を生成し、ii) 前記症例組の回帰係数と前記対照組の回帰係数との差測定を計算し、iii) 一又は複数の回帰係数に関する差測定が閾値基準を満たすとき、前記症例組の回帰係数が前記神経障害に関連した神経回路レベルバイオマーカであると判断する、或いは一又は複数の回帰係数に関する差測定が前記閾値基準を満たさないとき、前記症例組の回帰係数が前記神経障害に関連した神経回路レベルバイオマーカではないと判断することを特徴とする方法を提供する。 The present disclosure is a method of identifying neural circuit level biomarkers associated with neuropathy, i) a first having a case group of a first individual suffering from a neuropathy and a control group of the first individual. Relative activity of neural pathways regulated by each of the multiple neuronal subtypes by performing a method as described above or elsewhere herein for each first individual in multiple groups of individuals. And the regression coefficient of the case set representing the contribution of neural pathways regulated by each of the multiple distinct neuronal subtypes of the case group to the case functional activity data by estimating the relative activity, and said. Generate multiple sets of regression coefficients with control sets regression coefficients that represent the contribution of neural pathways regulated by each of the multiple distinct neuronal subtypes of the control group to control functional activity data, ii) of the above case sets. Calculate the difference measurement between the regression coefficient and the regression coefficient of the control set, and iii) when the difference measurement for one or more regression coefficients meets the threshold criteria, the regression coefficient of the case set is the neural circuit associated with the neuropathy. When it is determined to be a level biomarker, or when the difference measurement for one or more regression coefficients does not meet the threshold criteria, it is determined that the regression coefficient of the case set is not a neural circuit level biomarker associated with the neuropathy. Provide a method characterized by doing.
ある場合には、前記対照グループは神経障害を患っていない個体を含む。ある場合には、前記症例グループは、神経障害を患っており、前記神経障害の治療を受けている個体を含み、前記対照グループは、神経障害を患っており、前記神経障害の治療を受けていない個体を含む。 In some cases, the control group includes individuals who do not suffer from neuropathy. In some cases, the case group includes an individual suffering from a neuropathy and being treated for the neuropathy, and the control group is suffering from a neuropathy and being treated for the neuropathy. Includes no individuals.
本開示は、神経疾患の個体を処置する方法であって、i) 上記又は本明細書の他の箇所に記載されているような方法を行うことにより、神経障害を患っている第1の個体の脳の複数のニューロンサブタイプの各々によって調節される神経経路の相対活動を推定し、ii) 推定された相対活動に基づき、前記複数のニューロンサブタイプの一又は複数のニューロンの活動を調節するのに十分なように前記脳の領域を刺激することを特徴とする方法を提供する。 The present disclosure is a method of treating an individual with a neurological disorder, i) a first individual suffering from a neurological disorder by performing a method as described above or elsewhere herein. Estimate the relative activity of neural pathways regulated by each of the multiple neuronal subtypes of the brain, ii) regulate the activity of one or more neurons of the multiple neuronal subtypes based on the estimated relative activity. Provided is a method characterized by stimulating the area of the brain to be sufficient for.
ある場合には、前記神経障害は神経疾患、又は加齢に関連した神経障害である。ある場合には、前記神経疾患は、パーキンソン病、アルツハイマー病、認知症、てんかん、自閉症、双極性障害、統合失調症、トゥーレット症候群、強迫性障害、注意欠陥多動性障害、ハンチントン病、多発性硬化症又は片頭痛である。 In some cases, the neuropathy is a neurological disorder, or an age-related neuropathy. In some cases, the neurological disorders include Parkinson's disease, Alzheimer's disease, dementia, epilepsy, autism, bipolar disorder, schizophrenia, Rett syndrome, compulsive disorder, attention deficit hyperactivity disorder, Huntington's disease. , Multiple sclerosis or migraine.
本開示は、磁気共鳴画像(MRI )装置と、プロセッサと、前記プロセッサによって実行されると、前記MRI 装置に、個体の脳の機能活動を記録させることにより、前記脳の領域に関する機能活動データを生成させて、前記プロセッサに、生成された機能活動データを使用して上記又は本明細書の他の箇所に記載されているような方法を実行させる指示を有する非一時的なコンピュータ可読媒体とを備えていることを特徴とするシステムを提供する。 The present disclosure comprises a magnetic resonance imaging (MRI) device, a processor, and, when executed by the processor, causing the MRI device to record the functional activity of an individual's brain to provide functional activity data for the region of the brain. A non-temporary computer-readable medium having instructions to generate and cause the processor to use the generated functional activity data to perform a method as described above or elsewhere herein. It provides a system characterized by being equipped.
ある場合には、前記システムは、脳深部刺激デバイス又は経頭蓋磁気刺激デバイスを更に備えている。ある場合には、前記システムは、ユーザインタフェース、及び前記プロセッサから前記ユーザインタフェースにデータを送信するデータコネクタを更に備えている。 In some cases, the system further comprises a deep brain stimulation device or a transcranial magnetic stimulation device. In some cases, the system further comprises a user interface and a data connector for transmitting data from the processor to the user interface.
本明細書では「ポリペプチド」、「ペプチド」及び「タンパク質」という用語は、任意の長さのアミノ酸のポリマーを指すために互換的に使用される。ポリマーは線形であってもよく、修飾アミノ酸を含んでもよく、非アミノ酸によって遮断されてもよい。用語は、例えばジスルフィド結合形成、グリコシル化、脂質化、アセチル化、リン酸化、又は標識成分との接合などの任意の他の操作など、修飾されたアミノ酸ポリマーを更に包含する。本明細書で使用される場合、「アミノ酸」という用語は、天然アミノ酸及び/又は非天然アミノ酸又は合成アミノ酸を指し、グリシン、及びD型又はL型の光学異性体の両方、及びアミノ酸類似体及びペプチドミメティクスを含む。 As used herein, the terms "polypeptide," "peptide," and "protein" are used interchangeably to refer to polymers of amino acids of any length. The polymer may be linear, may contain modified amino acids, or may be blocked by non-amino acids. The term further includes modified amino acid polymers such as, for example, any other operation such as disulfide bond formation, glycosylation, lipidation, acetylation, phosphorylation, or conjugation with a labeling component. As used herein, the term "amino acid" refers to natural and / or unnatural or synthetic amino acids, both glycine and D- or L-type optical isomers, and amino acid analogs and amino acids. Includes peptide mimetics.
「遺伝子改変」という用語は、異種核酸(例えば細胞外の核酸)の細胞への導入に続いて細胞内で誘起された永続的又は一時的な遺伝子変化を指す。遺伝子変化(「改変」)は、異種核酸をホスト細胞のゲノムに取り込むことにより、又は異種核酸を染色体外因子として一時的若しくは安定的に維持することにより達成され得る。ここで細胞が真核細胞の場合、永続的な遺伝子変化は核酸を細胞のゲノムに導入することにより達成され得る。遺伝子改変の好適な方法として、ウイルス感染、トランスフェクション、接合、原形質融合、電気穿孔法、パーティクルガン技術、リン酸カルシウム沈殿、直接マイクロインジェクション、及び同種のものが含まれる。 The term "gene modification" refers to a permanent or transient genetic change induced intracellularly following the introduction of a heterologous nucleic acid (eg, an extracellular nucleic acid) into a cell. Genetic alterations (“modifications”) can be achieved by incorporating the heterologous nucleic acid into the genome of the host cell, or by temporarily or stably maintaining the heterologous nucleic acid as an extrachromosomal factor. Here, if the cell is a eukaryotic cell, permanent genetic alterations can be achieved by introducing nucleic acid into the cell's genome. Suitable methods of genetic modification include virus infection, transfection, conjugation, plasma fusion, electroporation, particle gun technology, calcium phosphate precipitation, direct microinjection, and the like.
「複数」とは、少なくとも2つのメンバーを含む。ある場合には、複数は少なくとも10、少なくとも100 、少なくとも1000、少なくとも10,000、少なくとも100,000 、少なくとも106 、少なくとも107 、少なくとも108 又は少なくとも109 、又はそれ以上のメンバーを含んでもよい。 The term "plural" includes at least two members. In some cases, the plurality may include at least 10, at least 100, at least 1000, at least 10,000, at least 100,000, at least 10 6 , at least 10 7 , at least 10 8 or at least 10 9 , or more.
本明細書に使用されている「個体」とは、本明細書に記載の方法及び技術に従う任意の好適な動物であってもよく、ある場合には個体は、哺乳類、鳥類、爬虫類、両生類などを含む脊椎動物であってもよい。個体は、例えばヒト、マウス、ラット、ネコ、イヌ、ブタ、ウマ、ウシ、サル、非ヒト霊長類など、任意の好適な哺乳動物であってもよい。 As used herein, the "individual" may be any suitable animal according to the methods and techniques described herein, and in some cases the individual may be a mammal, bird, reptile, amphibian, etc. It may be a vertebrate including. The individual may be any suitable mammal, such as, for example, humans, mice, rats, cats, dogs, pigs, horses, cows, monkeys, non-human primates.
本明細書に使用されている「動的」とは、系統の時間的に変化する性質を記述するために使用されてもよい。 As used herein, "dynamic" may be used to describe the time-varying nature of a lineage.
本明細書に使用されている「静的」とは、性質のあらゆる時間依存性に関係なく、系統の性質を記述するために使用されてもよい。 As used herein, "static" may be used to describe the properties of a lineage, regardless of any time dependence of the properties.
本明細書に使用されている「機能活動」は、系統の第1の要素の変化の時間的に変化する指標を指してもよく、変化は系統の第2の要素に特異的効果をもたらす。 As used herein, "functional activity" may refer to a time-varying indicator of change in the first element of the lineage, which results in a specific effect on the second element of the lineage.
本明細書に使用されている「ニューロンサブタイプ」は、ニューロンの静的同一性及び/又はニューロンの動的性質に基づくニューロンの分類を指してもよい。ニューロンの静的同一性は、マーカ発現(例えばmRNA転写又はタンパク質発現)、解剖学的位置及び/又は結合などを含んでもよい。ニューロンの動的性質は、脱分極/活動電位発火のパターン(例えば頻度、継続時間、タイミングなど)を含んでもよい。ある場合には、例えばニューロンが異なる脱分極性刺激パターンに別個の反応を示す場合、単一のニューロンが多数のサブタイプに属してもよい。 As used herein, the "neuron subtype" may refer to the classification of neurons based on the static identity of the neurons and / or the dynamic properties of the neurons. The static identity of the neuron may include marker expression (eg, mRNA transcription or protein expression), anatomical location and / or binding. The dynamic nature of the neuron may include patterns of depolarization / action potential firing (eg frequency, duration, timing, etc.). In some cases, a single neuron may belong to multiple subtypes, for example if the neuron responds differently to different depolarizing stimulus patterns.
本明細書に使用されている「回路網」は、縁部を通って互いに直接的又は間接的に結合されているノードの集合体を指してもよい。本明細書に使用されている「直接」は、単一の縁部を通った2つのノード間の結合を指してもよい。本明細書に使用されている「間接」は、少なくとも2つの縁部及び少なくとも第3の介在するノードを必要とする2つのノード間の結合を指してもよい。回路網内の単一のノードは、回路網の他の1つのノード、複数のノード又は全てのノードに直接結合されてもよい。単一のノードは、特定の時間に他の一又は複数のノードに結合されてもよく、他の時間にあらゆるノードに結合されなくてもよい。本明細書に使用されている「ノード」は、要素、例えばニューロンの実質的に機能上等価な集合体を含んでもよい。ニューロンのサブタイプは神経回路網のノードを定めてもよい。本明細書に使用されている「相互に結合され」は、各ノードが他の少なくとも1つのノードに直接結合されているノードの集合体を記述するために使用されてもよい。 As used herein, "network" may refer to a collection of nodes that are directly or indirectly coupled to each other through edges. As used herein, "directly" may refer to a connection between two nodes through a single edge. As used herein, "indirect" may refer to a connection between two nodes that requires at least two edges and at least a third intervening node. A single node in a network may be directly coupled to another node, multiple nodes or all nodes in the network. A single node may be joined to one or more other nodes at a particular time and may not be joined to any node at any other time. As used herein, a "node" may include an element, eg, a substantially functionally equivalent collection of neurons. The neuron subtype may define a node in the neural network. As used herein, "mutually coupled" may be used to describe a collection of nodes in which each node is directly coupled to at least one other node.
本明細書に使用されている「結合性」は、回路網の2つのノード間の機能的結合の強度の指標を指してもよい。この指標は、構造的態様(例えば神経突起の数、一又は複数のニューロンに亘るシナプス結合の数)を反映してもよく、及び/又は結合の機能的態様(例えばシナプスの強度)を反映してもよい。 As used herein, "coupling" may refer to an indicator of the strength of the functional coupling between two nodes in a network. This indicator may reflect structural aspects (eg, number of neurites, number of synaptic connections across one or more neurons) and / or functional aspects of connections (eg, synaptic strength). May be.
本明細書に使用されている「神経経路」は、回路網のノード間の結合性の特異的分布によって定められたニューロンの回路網の機能的な状態を指してもよい。機能的な状態は、回路網中のニューロンの一又は複数のサブタイプの特異的活動によって促進又は誘起されてもよい。 As used herein, "nerve pathway" may refer to the functional state of a neuronal network as defined by the specific distribution of connectivity between the nodes of the network. Functional states may be promoted or induced by the specific activity of one or more subtypes of neurons in the network.
本明細書に使用されている「モデル」は、ある場合にはパラメータの数より小さい次元性を有する経験的な情報に基づき生成されてもよい定められた一組のパラメータを使用した系統(例えば回路網を形成するニューロンの集合体)を表してもよい。この表示は、系統の実際の解剖学的性質及び/又は機能的性質の近似であってもよい。「結合性モデル」は、回路網のノード間の機能的結合の強度を表す動的モデルを指してもよい。「回路網モデル」は、結合(つまり回路網のトポロジーの表示)の強度に関係なく回路網のノード間の物理的結合及び機能的結合を静的に表してもよい。 As used herein, a "model" is a lineage using a defined set of parameters that may in some cases be generated based on empirical information having a dimensionality smaller than the number of parameters (eg,). It may represent a collection of neurons that form a network). This indication may be an approximation of the actual anatomical and / or functional properties of the lineage. A "coupling model" may refer to a dynamic model that represents the strength of functional coupling between nodes in a network. A "network model" may statically represent physical and functional coupling between nodes in a network, regardless of the strength of the coupling (ie, the representation of the topology of the network).
本明細書に使用されている「同一性」は、対象、例えばニューロンの静的な性質を指してもよい。静的な性質は、細胞又はニューロンによるマーカ、例えば受容体の発現であってもよい。 As used herein, "identity" may refer to the static nature of an object, eg, a neuron. The static property may be the expression of a marker, eg, a receptor, by a cell or neuron.
本明細書に使用されている「神経活動」は、ニューロンの電気的活動(例えばニューロンの膜電位の変化)、及び一又は複数のニューロン、例えば神経経路のニューロンの電気的活動の間接的指標を指してもよい。従って、神経活動は、電場電位の変化、細胞内イオン濃度(例えば細胞内カルシウム濃度)の変化、及び例えば機能的磁気共鳴画像法で血液酸素濃度依存性(BOLD)信号によって測定されるような、ニューロンの電気的活動によって誘起される磁気共鳴の変化を指してもよい。 As used herein, "nerve activity" refers to an indirect indicator of the electrical activity of a neuron (eg, a change in the membrane potential of a neuron) and the electrical activity of one or more neurons, eg, a neuron in a neural pathway. You may point. Thus, neural activity is such that changes in electric field potentials, changes in intracellular ion concentrations (eg, intracellular calcium concentrations), and, for example, as measured by blood oxygen concentration dependent (BOLD) signals by functional magnetic resonance imaging. It may refer to changes in magnetic resonance induced by the electrical activity of neurons.
本明細書に使用されている「静止」又は「静止状態」は、明示的又は外部的に促されたタスクを行わない個体を指してもよい。静止状態fMRIデータのような静止状態機能活動データは、機能活動データを収集しながら、明示的なタスクを行うように指示されていない個体から集められた機能活動データを指してもよい。 As used herein, "rest" or "rest" may refer to an individual who does not perform an explicitly or externally prompted task. Resting state functional activity data, such as resting state fMRI data, may refer to functional activity data collected from individuals who are not instructed to perform an explicit task while collecting functional activity data.
本明細書で使用される場合、「差測定」という用語は、2つの値又は2つのベクトル間の関係の任意の測定(例えば減算、除算、相関性、偏差など)を指す。 As used herein, the term "difference measurement" refers to any measurement of the relationship between two values or two vectors (eg subtraction, division, correlation, deviation, etc.).
本開示を更に記述する前に、開示された主題は記述された特定の実施形態に限定されず、言うまでもなくそれ自体変わり得ると理解されたい。本明細書に使用されている専門用語は、具体的な実施形態について説明するためだけのものであり、本開示の範囲は添付の特許請求の範囲によってのみ限定されるので、限定的であることを意図するものではないことも更に理解されたい。 Before further describing the present disclosure, it should be understood that the disclosed subject matter is not limited to the particular embodiments described and, of course, can vary in itself. The terminology used herein is for illustration purposes only and is limited as the scope of this disclosure is limited only by the appended claims. It should also be further understood that it is not intended.
ある範囲の値が与えられる場合、その範囲の上限及び下限の間の、文脈が別段に明示しない限りは下限の単位の10分の1までの各介在値、及びその記載された範囲内の任意の他の記載された値又は介在する値が開示された主題に包含されることを理解されたい。これらのより小さい範囲の上限及び下限は、より小さい範囲内に独立して含まれてもよく、記載された範囲内の任意の具体的に除外された限度を条件として開示された主題に更に包含される。記載された範囲が限度のうちの一方又は両方を含む場合、これらの含まれた限度の一方又は両方を除外した範囲も開示された主題に包含される。 Given a range of values, between the upper and lower bounds of the range, each intervention value up to one tenth of the lower bound unit, and any within its stated range, unless the context explicitly states. It should be understood that other described or intervening values are included in the disclosed subject matter. The upper and lower limits of these smaller ranges may be included independently within the smaller range and are further included in the disclosed subject matter subject to any specifically excluded limits within the stated range. Will be done. Where the stated scope includes one or both of the limits, the scope excluding one or both of these included limits is also included in the disclosed subject matter.
特に定義されていない限り、本明細書に使用されている全ての技術的用語及び科学的用語は、開示された主題が属する技術分野の当業者によって共通して理解されているものと同じ意味を有する。本明細書に記載のものと同様又は同等である全ての方法及び材料を、開示された主題の実施又はテストに更に使用することができるが、好ましい方法及び材料を本明細書に記載している。本明細書に述べられている全ての刊行物は、引用されている刊行物に関連して本方法及び/又は本材料を開示して記載すべく参照によって本明細書に組み込まれている。 Unless otherwise defined, all technical and scientific terms used herein have the same meaning as commonly understood by one of ordinary skill in the art to which the disclosed subject matter belongs. Have. All methods and materials similar to or equivalent to those described herein can be further used in the practice or testing of the disclosed subject matter, but preferred methods and materials are described herein. .. All publications described herein are incorporated herein by reference to disclose and describe the Method and / or the Material in connection with the publications cited.
単数形の「1つの(a )」、「1つの(an)」及び「その(the )」が、本明細書及び添付の特許請求の範囲で用いられている場合、文脈が別段に明示しない限り、複数の指示対象を含むことに留意しなければならない。従って、例えば「ニューロン」への言及はこのような複数のニューロンを含んでおり、「プロセッサ」への言及は、一又は複数のプロセッサ及び当業者に公知のこの均等物などへの言及を含んでいる。更に、請求項がいかなる選択的な要素も排除して記載されていることに留意すべきである。従って、この記述は、請求項の要素の記載に関する「唯一の」、「のみの」等の排他的用語の使用、又は「否定的な」限定の使用のための先行記載として機能すべく意図される。 If the singular forms "one (a)", "one (an)" and "the" are used within the scope of the present specification and the accompanying claims, the context is not specified otherwise. As long as it should be noted that it includes multiple referents. Thus, for example, a reference to a "neuron" includes a plurality of such neurons, and a reference to a "processor" includes a reference to one or more processors and such equivalents known to those of skill in the art. There is. Furthermore, it should be noted that the claims are stated excluding any optional elements. Accordingly, this statement is intended to serve as a precursor to the use of exclusive terms such as "only", "only", or the use of "negative" limitations with respect to the description of the elements of the claim. To.
明瞭化のために別々の実施形態との関連で記述されている開示された主題の特定の特徴も、単一の実施形態で組み合わせて提供され得ることが認識される。逆に、簡潔化のために単一の実施形態との関連で記述されている開示された主題の様々な特徴も、個別に又は任意の好適な下位組み合わせで提供され得る。本開示に係る実施形態の全ての組み合わせは、開示された主題によって明確に包含されており、各々及び全ての組み合わせが個別に明示的に開示されているかのように、本明細書に開示されている。加えて、様々な実施形態及びその要素の全ての下位組み合わせも、本開示によって明確に包含されており、各々及び全てのこのような下位組み合わせが個別に明示的に本明細書に開示されているかのように、本明細書に開示されている。 It is recognized that certain features of the disclosed subject matter described in the context of separate embodiments for clarity can also be provided in combination in a single embodiment. Conversely, various features of the disclosed subject matter described in the context of a single embodiment for brevity may also be provided individually or in any suitable subcombination. All combinations of embodiments relating to this disclosure are expressly encapsulated by the disclosed subject matter and are disclosed herein as if each and all combinations were expressly disclosed individually. There is. In addition, various embodiments and all subcombinations thereof are also expressly included by this disclosure, and are each and all such subcombinations individually and expressly disclosed herein. As disclosed herein.
本明細書に記載されている刊行物は、本出願の出願日に先立ってその開示のためだけに提供されている。本明細書では、先行発明を理由として、開示された主題がこのような刊行物に先行する権限がないことを認めるものであると解釈されるべきではない。更に、提供される刊行物の日付は、実際の公開日とは異なる場合があり、個別に確認する必要がある。 The publications described herein are provided solely for disclosure prior to the filing date of this application. It should not be construed herein to acknowledge that the disclosed subject matter does not have the authority to precede such publications because of the prior invention. In addition, the dates of publications provided may differ from the actual publication dates and must be confirmed individually.
上述したように、脳の機能活動データを解析するための方法及びシステムを提供する。一般的には、本開示は、非侵襲的にモニタされる脳の機能活動とこの機能活動の基礎となるニューロン機構との関係を記述するモデルを構築するために、神経回路内の別個の神経経路の細胞型特異的活性化及び/又は周波数特異的活性化に対する神経経路の反応を解析するための方法及びシステムを含んでいる。神経回路の反応は、局所的な神経回路反応の局所電場電位(LFP )記録又はマルチユニット活動(MUA )記録から脳全体の反応の機能的磁気共鳴画像法(fMRI)まで様々な方法によって測定されてもよい。特に、細胞型特異的神経経路及び/又は周波数特異的神経経路に生じさせる神経回路の結合性が本方法によって推定されてもよい。 As described above, a method and a system for analyzing functional activity data of the brain are provided. In general, the present disclosure presents separate nerves within neural circuits to build models that describe the relationship between non-invasively monitored brain functional activity and the neuronal mechanisms underlying this functional activity. Includes methods and systems for analyzing the response of neural pathways to cell-type-specific activation and / or frequency-specific activation of pathways. Neural circuit responses are measured by a variety of methods, from local electric field potential (LFP) or multi-unit activity (MUA) recording of local neural circuit responses to functional magnetic resonance imaging (fMRI) of whole-brain responses. May be. In particular, the connectivity of neural circuits resulting in cell-type-specific neural pathways and / or frequency-specific neural pathways may be estimated by this method.
本開示は、上記に記載されているような細胞型特異的ニューロン活動及び/又は周波数特異的ニューロン活動への神経回路レベルの反応の経験的測定から推定されるような細胞型特異的神経経路及び/又は周波数特異的神経経路の一次結合として、測定された脳の機能活動から得られた結合性モデルをモデル化することにより、非侵襲的に測定される個体、例えば静止状態の個体の脳の機能活動の基礎となる細胞型特異的神経経路及び/又は周波数特異的神経経路を推定するための方法及びシステムを更に含んでいる。 The present disclosure presents cell-type-specific neural pathways and / or cell-type-specific neural pathways as inferred from empirical measurements of neural circuit-level responses to cell-type-specific neuronal activity and / or frequency-specific neuronal activity as described above. / Or the brain of an individual measured non-invasively, eg, a quiescent individual, by modeling a connectivity model obtained from measured brain functional activity as the primary coupling of frequency-specific neural pathways. It further includes methods and systems for estimating cell type-specific neural pathways and / or frequency-specific neural pathways underlying functional activity.
従って、本方法及び本システムによって、動物の有効な神経生物物理学的モデルを使用した静止状態の脳の機能活動データに基づき、健康なヒト及び罹患したヒトの脳のニューロン機構の定量的特性解析が可能になり得る。 Therefore, this method and this system will quantitatively characterize the neuronal mechanisms of healthy and affected human brains based on quiescent brain functional activity data using valid animal neurobiological models. Can be possible.
方法
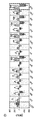
本開示の実施形態を図2A及び図2Bを参照して記述する。図2Aは、脳の機能活動データを解析する方法の実施形態を示す。本方法は、個体、例えばヒトの個体の脳の機能活動に関する一組のデータ、例えばfMRIデータを得ること2100を有してもよい。fMRIデータは、ある場合には静止状態のfMRIデータであってもよい。機能活動データを処理して、例えば計算処理して、注目する領域を表すノード間の機能的結合の回路網モデル2121によって制限された結合性モデルを生成してもよい2120。基底核−視床皮質系の回路網モデルの一例が図6に示されている。結合性モデルをあらゆる好適なアルゴリズム、例えば動的因果モデリング(DCM )を使用して生成してもよい。
METHODS: Embodiments of the present disclosure are described with reference to FIGS. 2A and 2B. FIG. 2A shows an embodiment of a method for analyzing functional activity data of the brain. The method may have 2100 to obtain a set of data, such as fMRI data, on the functional activity of the brain of an individual, eg, a human individual. The fMRI data may be stationary fMRI data in some cases. Functional activity data may be processed, eg, computationally processed, to generate a connectivity model limited by the
そのため、結合性モデルを使用して、様々なニューロンサブタイプに関して結合性推定値2141に対して線形回帰を行って回帰係数を得る2140。回帰係数は、異なるニューロンサブタイプによって夫々調節される異なる神経経路の相対活動の推定値を与える。
Therefore, we use a connectivity model to perform linear regression on
本開示は、ニューロンサブタイプ特異的結合性推定値を推定する方法を更に提供する(図2B)。このような方法は、ニューロンのサブタイプ特異的な選択的活性化によって生じる神経回路の機能活動を測定すること2200を有してもよい。ニューロンのサブタイプ特異的な選択的調節、例えば脱分極又は過分極は、例えば光遺伝学的刺激又は電気生理学的刺激を含んでもよく、選択的刺激に応じた機能活動を、例えば光遺伝学fMRI(ofMRI )のようなfMRIによって測定してもよい。本明細書に使用されている「選択的」は、作用が与えられるか、又は性質が存在する第2のグループのメンバーの割合と比較して、第1のグループ内のメンバーのより大きな割合に与えられる作用又は存在する性質を記述するために使用されてもよく、相対的割合は、作用又は性質の機能的重要性が主に第1のグループのメンバーへの影響に起因し得るような割合である。 The present disclosure further provides a method for estimating neuron subtype-specific connectivity estimates (Fig. 2B). Such methods may have 2200 to measure the functional activity of neural circuits caused by subtype-specific selective activation of neurons. Neuron subtype-specific selective regulation, such as depolarization or hyperpolarization, may include, for example, optogenetic or electrophysiological stimuli, and functional activity in response to selective stimuli, such as optogenetic fMRI. It may be measured by fMRI such as (ofMRI). As used herein, "selective" refers to a greater proportion of members within the first group compared to the proportion of members of the second group to whom the action is given or the property is present. It may be used to describe a given action or property, and the relative percentage is such that the functional importance of the action or property can be primarily due to the effect on the members of the first group. Is.
測定されたニューロンサブタイプ特異的機能活動データを処理して、例えば計算処理して、注目する領域を表すノード間の機能的結合の回路網モデル2121によって制限されたサブタイプ特異的結合性モデルを生成してもよい2220。ニューロンサブタイプ毎に、ニューロンサブタイプの活動によって調節される神経経路の結合性を、サブタイプ特異的結合性モデルから推定してもよい2240。
The measured neuron subtype-specific functional activity data can be processed, for example, computationally to create a subtype-specific connectivity model limited by
データ収集2100, 2200、結合性モデルの生成2120, 2220、線形回帰解析2140及びニューロンサブタイプ特異的結合性の推定を、以下に述べるようなシステムを使用して行ってもよく、このシステムは、一又は複数のプロセッサと、一又は複数のプロセッサによって実行されると一又は複数のプロセッサに本開示の方法を実行させる神経経路解析プログラムとを備えている。
ニューロンサブタイプ特異的結合性推定値をあらゆる好適な個体から得てもよい。ある場合には、ニューロンサブタイプ特異的結合性推定値を、脳の機能活動データを解析する個体と同一の個体から得る。ある実施形態では、ニューロンサブタイプ特異的結合性推定値を、脳の機能活動データを解析する第1の個体とは異なる第2の個体から得る。第2の個体は、第1の個体が属する種と同一の種又は異なる種の個体であってもよい。ある場合には、第2の個体及び第1の個体は両方共、哺乳類であるが、哺乳類の異なる種に属する。ある場合には、第1の個体及び第2の個体は、齧歯動物、ネコ科の動物、イヌ科の動物、サル、非ヒト霊長類及びヒトから夫々選択される。 Neuron subtype-specific connectivity estimates may be obtained from any suitable individual. In some cases, neuron subtype-specific connectivity estimates are obtained from the same individual that analyzes brain functional activity data. In certain embodiments, neuron subtype-specific connectivity estimates are obtained from a second individual that is different from the first that analyzes brain functional activity data. The second individual may be an individual of the same species or a different species as the species to which the first individual belongs. In some cases, the second and first individuals are both mammals, but belong to different species of mammals. In some cases, the first and second individuals are selected from rodents, felines, canines, monkeys, non-human primates and humans, respectively.
ニューロンサブタイプ機能活動データを含む機能活動データは、機能活動データのあらゆる好適な形式であってもよい。機能活動データは、ニューロン活動が個体のニューロンのレベルで空間的に分解されない脳の領域内のニューロンの集団的な活動の測定値を含んでもよい。言い換えれば、測定された機能活動データの成分は、あらゆる特異的なニューロンサブタイプに容易に起因し得ない(例えば、成分を推定するためにアルゴリズムを適用せずに、成分はあらゆる特異的なニューロンサブタイプに起因し得ない)。ある場合には、機能活動データは、機能的磁気共鳴画像法(fMRI)、脳磁図(MEG )、脳波記録法(EEG )又はこれらの組合せから得られたデータである。 The functional activity data, including the neuron subtype functional activity data, may be in any suitable form of the functional activity data. Functional activity data may include measurements of collective activity of neurons within areas of the brain where neuronal activity is not spatially degraded at the level of individual neurons. In other words, the components of the measured functional activity data cannot be easily attributed to any specific neuron subtype (eg, without applying an algorithm to estimate the components, the components are any specific neuron. Cannot be due to subtype). In some cases, functional activity data is data obtained from functional magnetic resonance imaging (fMRI), magnetoencephalography (MEG), electroencephalography (EEG), or a combination thereof.
ある場合には、機能活動データを、静止状態、例えば目が覚めている静止状態の個体から得る。従って、ある場合には、機能活動データを得る個体は、データを得るために個体がモニタされている間に行う明示的なタスクを与えられなくてもよい。 In some cases, functional activity data is obtained from quiescent, eg, awake, quiescent individuals. Thus, in some cases, an individual obtaining functional activity data may not be given an explicit task to perform while the individual is being monitored to obtain the data.
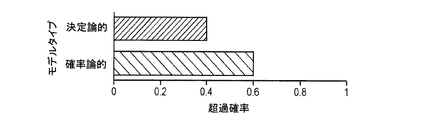
ニューロンサブタイプ特異的結合性モデルを含む結合性モデルは、大規模な機能活動データに基づく脳の生物物理学的性質をモデル化するあらゆる好適な方法、例えばfMRI、MEG 又はEEG を使用して生成されてもよい。ある場合には、動的因果モデリング(DCM )のような畳み込み原理に基づくアルゴリズムを使用して結合性モデルを生成する。ある場合には、DCM がスペクトルDCM 又は時間領域DCM であってもよい。ある場合には、spDCM が確率論的spDCM 又は決定論的spDCM である。好適なDCM 法は、例えばFriston, Karl J.等著,「A DCM for resting state fMRI」,Neuroimage,94 (2014): 396-407に記載されており、この開示は参照によって本明細書に組み込まれる。ある場合には、ニューラルマスモデリング(NMM )のようなニューロンのメゾスコピック性質に基づくアルゴリズムを使用して結合性モデルを生成する。 Connectivity models, including neuron subtype-specific connectivity models, are generated using any suitable method for modeling the biophysical properties of the brain based on extensive functional activity data, such as fMRI, MEG or EEG. May be done. In some cases, an algorithm based on the convolution principle, such as dynamic causal modeling (DCM), is used to generate the connectivity model. In some cases, the DCM may be a spectral DCM or a time domain DCM. In some cases, the spDCM is either a stochastic spDCM or a deterministic spDCM. Suitable DCM methods are described, for example, in Friston, Karl J. et al., "A DCM for resting state fMRI", Neuroimage, 94 (2014): 396-407, the disclosure of which is incorporated herein by reference. Is done. In some cases, algorithms based on the mesoscopic properties of neurons, such as neural mass modeling (NMM), are used to generate connectivity models.
ニューロンサブタイプ特異的結合性モデルを含む結合性モデルを生成するプロセスは、注目する脳領域の相互に結合されたノード間の機能的結合の回路網モデルによって制限されてもよい。ある場合には、本開示の実施形態によれば、脳の機能活動データが解析される個体の結合性モデルを生成するために使用される回路網モデルは、ニューロンサブタイプ特異的結合性モデルを生成するために使用される同一の結合性モデルである。 The process of generating a connectivity model, including a neuron subtype-specific connectivity model, may be limited by a network model of functional connectivity between interconnected nodes in the brain region of interest. In some cases, according to embodiments of the present disclosure, the network model used to generate an individual connectivity model from which brain functional activity data is analyzed is a neuron subtype-specific connectivity model. The same connectivity model used to generate.
回路網モデルのノードは一又は複数の解剖学的脳領域及び/又は機能的脳領域を表してもよい。好適な解剖学的脳領域及び/又は機能的脳領域は、視床、皮質、腹側被蓋野(VTA )、前頭前皮質(PFC )、側坐核(NAc )、扁桃体(BLA )、黒質(SN)、腹側淡蒼球、淡蒼球、背側線条体、腹側線条体、視床下核(STN )、前方尾状核被殻(CPu )、淡蒼球外節(GPe )、淡蒼球内節(GPi )、海馬、歯状回、帯状回、嗅内皮質、嗅覚皮質、運動皮質、小脳を含むが、これらに限定されない。ノードは、ある場合には、上記に記載されているような解剖学的脳領域及び/又は機能的脳領域のあらゆる小領域を更に表してもよく、小領域は、上記に記載されているような解剖学的脳領域及び/又は機能的脳領域の少なくとも一部を含んでいる。ノードは、ある場合には解剖学的脳領域及び/又は機能的脳領域のあらゆる超領域を更に表してもよく、超領域は、上記に記載されているような2以上の解剖学的脳領域及び/又は機能的脳領域(又はその一部)を含んでいる。 The nodes of the network model may represent one or more anatomical and / or functional brain regions. Suitable anatomical and / or functional brain regions are the thorax, cortex, ventral putamen (VTA), prefrontal cortex (PFC), lateral sac nucleus (NAc), globus pallidus (BLA), globus pallidus. (SN), ventral globus pallidus, globus pallidus, dorsal cingulate, ventral striatum, subthalamic nucleus (STN), anterior caudate putamen (CPu), external globus pallidum (GPe), Includes, but is not limited to, the external globus pallidum (GPi), hippocampus, dentate gyrus, cingulate gyrus, entorhinal cortex, olfactory cortex, motor cortex, and cerebrum. The node may, in some cases, further represent any subregion of the anatomical and / or functional brain region as described above, the subregion as described above. Includes at least a portion of a anatomical and / or functional brain region. The node may further represent any superregion of the anatomical and / or functional brain region in some cases, where the superregion is more than one anatomical brain region as described above. And / or contains a functional brain region (or part thereof).
ある実施形態では、脳及び/又は回路網モデルの領域は、哺乳類の様々な種に亘って保護されている神経系を表す。保護されている神経系は、個体の2つの異なる種の間で同様の時間的順序で同様に解剖学的及び/又は機能的に定められた脳構造の機能活動を示し得る。ある場合には、保護されている神経系は、図1に示されているような基底核−視床皮質回路である。 In certain embodiments, areas of the brain and / or network model represent a nervous system that is protected across various species of mammals. The protected nervous system may exhibit functional activity of similarly anatomically and / or functionally defined brain structures in similar temporal order between two different species of an individual. In some cases, the protected nervous system is the basal ganglia-thalamic cortex circuit as shown in FIG.
回路網モデルは、あらゆる好適な数のノードを含んでもよい。ある場合には、回路網モデルは、2以上、3以上、例えば4以上、5以上、6以上、7以上、8以上、9以上、10以上、15以上、20以上、50以上、100 以上、1,000 以上の相互に結合されたノードを含んでおり、ある実施形態では、回路網モデルは、100,000 以下、例えば10,000以下、5,000 以下、1,000 以下、500 以下、200 以下、100 以下、80以下、60以下、40以下、20以下、15以下、10以下のノードを含んでいる。ある実施形態では、回路網モデルは2〜100,000 の範囲の数のノードを含んでおり、例えば3〜100,000 、4〜10,000、4〜5,000 、4〜1,000 、4〜500 、4〜200 、4〜100 、4〜80、5〜60、5〜40、5〜20、6〜15の範囲の数のノードを含んでいる。
The network model may include any suitable number of nodes. In some cases, the network model is 2 or more, 3 or more, for example, 4 or more, 5 or more, 6 or more, 7 or more, 8 or more, 9 or more, 10 or more, 15 or more, 20 or more, 50 or more, 100 or more, It contains more than 1,000 interconnected nodes, and in one embodiment the network model is 100,000 or less, eg 10,000 or less, 5,000 or less, 1,000 or less, 500 or less, 200 or less, 100 or less, 80 or less, 60. Below, 40 or less, 20 or less, 15 or less, and 10 or less nodes are included. In one embodiment, the network model contains a number of nodes in the range 2-100,000, eg 3-100,000, 4-10,000, 4-5,000, 4-1,000, 4-500, 4-200, 4-. It contains a number of nodes in the
回路網モデルをあらゆる好適な源から導き出してもよい。ある場合には、回路網モデルは、回路網のノードに対応する脳領域間の解剖学的結合及び/又は機能的結合に関する公開された文献の調査に基づいている。ある場合には、回路網モデルは、経験的データ、例えば拡散テンソルfMRIデータ、免疫組織化学データ、トレーサデータなどに基づいている。ある場合には、回路網モデルは拡散テンソルfMRIデータに基づいている。ある場合には、回路網モデルは免疫組織化学データに基づいている。ある場合には、回路網モデルはトレーサデータに基づいている。 The network model may be derived from any suitable source. In some cases, the network model is based on a search of published literature on anatomical and / or functional connections between brain regions corresponding to network nodes. In some cases, the network model is based on empirical data such as diffusion tensor fMRI data, immunohistochemical data, tracer data, and the like. In some cases, the network model is based on diffusion tensor fMRI data. In some cases, the network model is based on immunohistochemical data. In some cases, the network model is based on tracer data.
回帰係数を、あらゆる好適な回帰法を使用して結合性モデルから導き出してもよい。ある場合には、回帰は一般線形モデル、線形最小二乗回帰、ロバスト線形回帰、サポートベクトルマシン、二次計画法又はリッジ回帰である。ある場合には、回帰は一般線形モデルである。ある場合には、回帰は線形最小二乗回帰である。ある場合には、回帰はロバスト線形回帰である。ある場合には、回帰はサポートベクトルマシンである。ある場合には、回帰は二次計画法である。ある場合には、回帰はリッジ回帰である。 The regression coefficients may be derived from the connectivity model using any suitable regression method. In some cases, the regression is a general linear model, linear least squares regression, robust linear regression, support vector machine, quadratic programming or ridge regression. In some cases, the regression is a general linear model. In some cases, the regression is linear least squares regression. In some cases, the regression is a robust linear regression. In some cases, regression is a support vector machine. In some cases, regression is a quadratic programming. In some cases, the regression is a ridge regression.
ニューロンサブタイプは、脳のニューロンのあらゆる好適な性質を使用して定められてもよい。ニューロンサブタイプを定める性質は、物理的形状、位置、マーカ発現、活動パターン(例えば活動の頻度、継続時間又は大きさなど)及びこれらの組合せを含んでもよいが、これらに限定されない。 Neuron subtypes may be determined using any suitable property of neurons in the brain. Properties that determine neuron subtypes may include, but are not limited to, physical shape, location, marker expression, activity patterns (eg, frequency, duration or magnitude of activity, etc.) and combinations thereof.
ニューロンサブタイプは、あらゆる好適な脳領域からのニューロンを含んでもよい。好適な脳領域は、視床、皮質、腹側被蓋野(VTA )、前頭前皮質(PFC )、側坐核(NAc )、扁桃体(BLA )、黒質(SN)、腹側淡蒼球、淡蒼球、背側線条体、腹側線条体、視床下核(STN )、前方尾状核被殻(CPu )、淡蒼球外節(GPe )、淡蒼球内節(GPi )、海馬、歯状回、帯状回、嗅内皮質、嗅覚皮質、運動皮質、小脳を含むが、これらに限定されない。 The neuron subtype may include neurons from any suitable brain region. Suitable brain regions are the subthalamic nucleus, cortex, ventral cortex (VTA), prefrontal cortex (PFC), lateral sciatic nucleus (NAc), tonsillar (BLA), melanosis (SN), ventral globus pallidus, Globus pallidus, dorsal striatum, ventral striatum, subthalamic nucleus (STN), anterior caudate nucleus shell (CPu), external globus pallidum (GPe), internal globus pallidus (GPi), hippocampus , But not limited to, dentate gyrus, cingulate gyrus, entorhinal cortex, olfactory cortex, motor cortex, and globus pallidus.
ニューロンサブタイプは、ニューロンのあらゆる好適な物理的形状に基づき分類されてもよい。好適なニューロンタイプは、中型有棘ニューロン(MSN )、錐体細胞、小さなゲル状細胞、紡錘状細胞、顆粒細胞、卵形細胞、淡蒼球細胞、小さな網様体、大きな網様体及びプルキンエ細胞を含むが、これらに限定されない。 Neuron subtypes may be classified based on any suitable physical shape of the neuron. Suitable neuron types are medium-sized spiny neurons (MSNs), pyramidal cells, small gel-like cells, spindle-shaped cells, granule cells, oval cells, paleospheric cells, small reticulum, large reticulum and Purkinje. Includes, but is not limited to, cells.
ニューロンサブタイプは、サブタイプのニューロンによって生成される一又は複数の神経伝達物質によって定められてもよい。ある場合には、ニューロンサブタイプのニューロンは、ドーパミン作動性ニューロン、コリン作動性ニューロン、ガンマアミノ酪酸(GABA)作動性ニューロン、グルタミン酸作動性ニューロン又はペプチド作動性ニューロン及び同種のものであるが、これらに限定されない。 Neuron subtypes may be defined by one or more neurotransmitters produced by subtype neurons. In some cases, neuronal subtype neurons are dopaminergic neurons, cholinergic neurons, gamma-aminobutyric acid (GABA) -operated neurons, glutamate-operated neurons or peptide-operated neurons and the like. Not limited to.
ニューロンサブタイプは、あらゆる好適な受容体発現によって定められてもよい。サブタイプのニューロンによって発現される好適な受容体は、ドーパミン受容体サブタイプ(D1,D2,D3,D4及び/又はD5);代謝型グルタミン酸受容体サブタイプ(mGluR1,mGluR2,mGluR3,mGluR4,mGluR5,mGluR6,mGluR7及び/又はmGluR8);イオンチャネル型グルタミン酸受容体サブタイプ(α−アミノ−3−ヒドロキシ−5−メチル−4−イソキサゾールプロピオン酸(AMPA)、カイニン酸及び/又はN−メチル−D−アスパラギン酸塩(NMDA));代謝型アセチルコリン受容体サブタイプ(M1,M2,M3,M4及び/又はM5);イオンチャネル型アセチルコリン受容体サブタイプ;GABAA 受容体サブタイプ(α,β,γ,δ,ε,π,θ及び/又はρ);及び/又はGABAB 受容体サブタイプ(GABAB1及び/又はGABAB2)を含むが、これらに限定されない。 The neuron subtype may be determined by any suitable receptor expression. Suitable receptors expressed by subtypes of neurons are dopamine receptor subtypes (D 1 , D 2 , D 3 , D 4 and / or D 5 ); metabolic glutamate receptor subtypes (mGluR 1 , mGluR). 2 , mGluR 3 , mGluR 4 , mGluR 5 , mGluR 6 , mGluR 7 and / or mGluR 8 ); Ion-channel glutamate receptor subtype (α-amino-3-hydroxy-5-methyl-4-isoxazolepropion) Acid (AMPA), quinic acid and / or N-methyl-D-asparaginate (NMDA)); Metabolic acetylcholine receptor subtypes (M 1 , M 2 , M 3 , M 4 and / or M 5 ); Ion-channel acetylcholine receptor subtypes; GABA A receptor subtypes (α, β, γ, δ, ε, π, θ and / or ρ); and / or GABA B receptor subtypes (GABA B1 and / or) GABA B2 ), but not limited to these.
ニューロンサブタイプは、サブタイプのニューロンによるあらゆる他の好適なマーカの発現によって定められてもよい。 The neuron subtype may be determined by the expression of any other suitable marker by the subtype of neuron.
複数のニューロンサブタイプは、あらゆる好適な数のサブタイプを含んでもよい。ある場合には、ニューロンサブタイプの数は、2以上、例えば3以上、4以上、5以上、6以上、7以上、8以上、9以上、10以上、15以上、20以上、50以上、100 以上であり、ある実施形態では、10,000以下、例えば5,000 以下、1,000 以下、500 以下、200 以下、100 以下、80以下、60以下、40以下、20以下、15以下、10以下である。ある実施形態では、ニューロンサブタイプは2〜10,000の範囲の数のサブタイプを含んでおり、例えば2〜5,000 、2〜1,000 、2〜500 、2〜200 、2〜100 、2〜80、2〜60、2〜40、2〜20、2〜10の範囲の数のサブタイプを含んでいる。 Multiple neuron subtypes may include any suitable number of subtypes. In some cases, the number of neuron subtypes is 2, for example, 3 or more, 4 or more, 5 or more, 6 or more, 7 or more, 8 or more, 9 or more, 10 or more, 15 or more, 20 or more, 50 or more, 100. In a certain embodiment, the number is 10,000 or less, for example, 5,000 or less, 1,000 or less, 500 or less, 200 or less, 100 or less, 80 or less, 60 or less, 40 or less, 20 or less, 15 or less, and 10 or less. In certain embodiments, neuron subtypes include a number of subtypes in the range of 2 to 10,000, such as 2 to 5,000, 2 to 1,000, 2 to 500, 2 to 200, 2 to 100, 2 to 80, 2 Includes a number of subtypes ranging from ~ 60, 2-40, 2-20, 2-10.
ある実施形態では、2つのニューロンサブタイプ間のニューロンサブタイプ特異的結合性推定値は実質的に互いに統計的に関連がない。ある場合には、2つのニューロンサブタイプ間のニューロンサブタイプ特異的結合性推定値は、0.5 以下、例えば0.4 以下、0.3 以下、0.2 以下、0.1 以下、0.05以下、0.03以下、0.01以下の相関係数、例えばピアソンの相関係数を有してもよく、−0.5 以上、例えば−0.4 以上、−0.3 以上、−0.2 以上、−0.1 以上、−0.05 以上、−0.03 以上、0.01以上の相関係数を有してもよい。ある実施形態では、2つのニューロンサブタイプ間のニューロンサブタイプ特異的結合性推定値は、−0.5 〜0.5 、例えば−0.4 〜0.4 、−0.3 〜0.3 、−0.2 〜0.2 、−0.1 〜0.1 、−0.05〜0.05、−0.03〜0.03の範囲の相関係数、例えばピアソンの相関係数を有してもよい。 In certain embodiments, the neuron subtype-specific connectivity estimates between the two neuron subtypes are substantially not statistically related to each other. In some cases, the neuron subtype-specific connectivity estimates between the two neuron subtypes are 0.5 or less, eg 0.4 or less, 0.3 or less, 0.2 or less, 0.1 or less, 0.05 or less, 0.03 or less, 0.01 or less phase relationships. It may have a correlation coefficient of numbers, for example Pearson, with a correlation coefficient of -0.5 or higher, such as -0.4 or higher, -0.3 or higher, -0.2 or higher, -0.1 or higher, -0.05 or higher, -0.03 or higher, 0.01 or higher. May have. In one embodiment, the neuron subtype-specific connectivity estimates between the two neuron subtypes are -0.5 to 0.5, such as -0.4 to 0.4, -0.3 to 0.3, -0.2 to 0.2, -0.1 to 0.1,-. It may have a correlation coefficient in the range of 0.05 to 0.05, −0.03 to 0.03, for example, a Pearson correlation coefficient.
個体は個体の脳の機能活動データを解析するためのあらゆる好適な個体であってもよい。ある場合には、個体はヒトの個体である。ある場合には、ヒトは健康なヒト、又は神経障害を有するヒトである。神経障害はあらゆる神経障害であってもよい。ある場合には、神経障害は疾患、例えば神経疾患によって引き起こされる。神経疾患は、ニューロンの回路網の病理的活動に関連したあらゆる疾患であってもよい。好適な神経疾患は、パーキンソン病、アルツハイマー病、認知症、てんかん、自閉症、双極性障害、統合失調症、トゥーレット症候群、強迫性障害、注意欠陥多動性障害、ハンチントン病、多発性硬化症又は片頭痛を含むが、これらに限定されない。ある実施形態では、神経障害は脳機能の加齢に関連した障害である。 The individual may be any suitable individual for analyzing functional activity data of the individual's brain. In some cases, the individual is a human individual. In some cases, the human is a healthy human or a human with a neuropathy. The neuropathy may be any neuropathy. In some cases, neuropathy is caused by a disease, such as a neurological disorder. The neurological disorder may be any disorder associated with the pathological activity of the neural network of neurons. Suitable neurological disorders include Parkinson's disease, Alzheimer's disease, dementia, epilepsy, autism, bipolar disorder, schizophrenia, Tourette's syndrome, compulsive disorder, attention deficit hyperactivity disorder, Huntington's disease, multiple sclerosis. Including, but not limited to, dementia or migraine. In certain embodiments, neuropathy is an age-related disorder of brain function.
サブタイプ特異的機能活動を測定するためのニューロンの選択的活性化を、あらゆる好適な方法を用いて行ってもよい。ニューロンの選択的活性化の好適な方法は、光遺伝学的刺激、単一ユニット電気生理学などを含むが、これらに限定されない。光遺伝学的刺激に適した複数の方法及びシステムの例が、米国特許第8696722 号明細書、米国特許第8834546 号明細書及び米国特許第9271674 号明細書、米国特許出願公開第2016/0270723 号明細書、国際出願第PCT /US2016/043179号、国際出願第PCT /US2016/064250号及び国際出願第PCT /US2016/049508号に更に詳細に記載されており、これらの開示は参照によって本明細書に組み込まれる。 Selective activation of neurons to measure subtype-specific functional activity may be performed using any suitable method. Suitable methods of selective activation of neurons include, but are not limited to, optogenetic stimulation, single unit electrophysiology, and the like. Examples of multiple methods and systems suitable for photogenetic stimulation are US Patent No. 8966722, US Pat. No. 8834546 and US Pat. No. 9271674, US Patent Application Publication No. 2016/0270723. It is described in more detail in the specification, International Application No. PCT / US2016 / 043179, International Application No. PCT / US2016 / 064250 and International Application No. PCT / US2016 / 049508, which are disclosed herein by reference. Will be incorporated into.
ニューロンが光遺伝学的刺激によって選択的に活性化される場合、ニューロンはニューロンを過分極又は脱分極させるように構成された一又は複数の光活性化ポリペプチドを発現してもよい。好適な光活性化ポリペプチド及び光活性化ポリペプチドの使用方法を以下に更に記載する。 If a neuron is selectively activated by optogenetic stimuli, the neuron may express one or more photoactivated polypeptides configured to hyperpolarize or depolarize the neuron. Suitable photoactivated polypeptides and methods of using the photoactivated polypeptides are further described below.
光活性化ポリペプチド
本開示の光活性化ポリペプチドは、ニューロンに活性化光刺激を照射することによりサブタイプのニューロンを選択的に活性化するためのあらゆる好適な光活性化ポリペプチドであってもよい。場合によっては、光活性化ポリペプチドは光活性化イオンチャネルポリペプチドである。光活性化イオンチャネルポリペプチドは、ポリペプチドに活性化波長の光を照射すると、一又は複数のイオンが標的細胞の原形質膜を通過可能であるように適合されている。光活性化タンパク質は、少数のイオンが光の光子によって原形質膜を通過することを容易にするイオンポンプタンパク質として特徴付けられてもよく、又はチャネルが開いているときにイオン流が原形質膜を自在に貫流することを可能にするイオンチャネルタンパク質として特徴付けられてもよい。ある実施形態では、光活性化ポリペプチドは、活性化波長の光によって活性化されると、細胞を脱分極させる。ある実施形態では、光活性化ポリペプチドは、活性化波長の光によって活性化されると、細胞を過分極させる。好適な過分極性ポリペプチド及び脱分極性ポリペプチドは、本技術分野では公知であり、例えばチャネルロドプシン(例えばChR2)、ChR2の変異体(例えばC128S 、D156A 、C128S + D156A 、E123A 、E123T )、iC1C2 、C1C2、GtACR2、NpHR、eNpHR3.0、C1V1、VChR1 、VChR2 、SwiChR、Arch、ArchT 、KR2 、ReaChR、ChiEF 、Chronos 、ChRGR 、CsChrimson及び同種のものを含む。ある場合には、光活性化ポリペプチドは、本明細書に記述されているような、更に例えば本明細書に参照によって組み込まれるRajasethupathy等著,Nature,2015年10月29日,526(7575):653に記述されているようなbReaCh-ES を含む。過分極性オプシン及び脱分極性オプシンは様々な刊行物に記述されており、例えばBerndt及びDeisseroth著,2015年,Science,349:590 ;Berndt等著,2014年,Science ,344:420 ;及びGuru等著,2015年7月25日,Intl. J. Neuropsychopharmacol.,p.1-8 (PMID 26209858 )参照。
PhotoActivating Polypeptides The photoactivating polypeptides of the present disclosure are all suitable photoactivating polypeptides for selectively activating subtype neurons by irradiating neurons with an activating photostimulus. May be good. In some cases, the photoactivated polypeptide is a photoactivated ion channel polypeptide. Photoactivated ion channel polypeptides are adapted such that when the polypeptide is irradiated with light of activation wavelength, one or more ions can cross the plasma membrane of the target cell. The photoactivated protein may be characterized as an ion pump protein that facilitates the passage of a small number of ions through the original plasma membrane by photons of light, or the ion flow is the original plasma membrane when the channel is open. May be characterized as an ion channel protein that allows it to flow freely. In certain embodiments, the photoactivated polypeptide depolarizes the cell when activated by light of activation wavelength. In certain embodiments, the photoactivated polypeptide hyperpolarizes the cell when activated by light of activation wavelength. Suitable hyperpolarizing and depolarizing polypeptides are known in the art, such as channelrhodopsin (eg ChR2), variants of ChR2 (eg C128S, D156A, C128S + D156A, E123A, E123T), iC1C2. , C1C2, GtACR2, NpHR, eNpHR3.0, C1V1, VChR1, VChR2, SwiChR, Arch, ArchT, KR2, ReaChR, ChiEF, Chronos, ChRGR, CsChrimson and the like. In some cases, the photoactivated polypeptide, as described herein, further described by reference, eg, Rajasethupathy et al., Nature, October 29, 2015, 526 (7575). Includes bReaCh-ES as described in: 653. Hyperpolarizing opsin and depolarizing opsin have been described in various publications, such as Berndt and Deisseroth, 2015, Science, 349: 590; Berndt et al., 2014, Science, 344: 420; and Guru et al. See, July 25, 2015, Intl. J. Neuropsychopharmacol., P. 1-8 (PMID 26209858).
光活性化ポリペプチドは、あらゆる好適な方法を使用してニューロンに導入されてもよい。ある場合には、注目するサブタイプのニューロンは遺伝子改変されて光活性化ポリペプチドを発現する。ある場合には、ニューロンは、光活性化ポリペプチドをコードするヌクレオチド配列を有する核酸を含むウイルスベクター、例えばアデノ随伴ウイルスベクターを使用して遺伝子改変されてもよい。ウイルスベクターは、ニューロンサブタイプ、タイミング、誘発因子の存在などに応じて光活性化ポリペプチドの発現を制御するためのあらゆる好適な制御因子(例えばプロモータ、エンハンサ、組換え部位など)を含んでもよい。 The photoactivated polypeptide may be introduced into neurons using any suitable method. In some cases, the subtype of neuron of interest is genetically modified to express a photoactivated polypeptide. In some cases, neurons may be genetically modified using a viral vector containing a nucleic acid having a nucleotide sequence encoding a photoactivated polypeptide, such as an adeno-associated virus vector. The viral vector may contain any suitable regulator (eg, promoter, enhancer, recombination site, etc.) for controlling the expression of the photoactivated polypeptide depending on the neuron subtype, timing, presence of inducer, etc. ..
ニューロン特異的プロモータ及び他の制御因子(例えばエンハンサ)は本技術分野では公知である。好適なニューロン特異的制御配列は、ニューロン特異的エノラーゼ(NSE )プロモータ(例えばEMBL HSENO2 ,X51956;更に、例えば米国特許第6649811 号明細書、米国特許第5387742 号明細書参照);芳香族アミノ酸デカルボキシラーゼ(AADC)プロモータ;神経フィラメントプロモータ(例えばGenBank HUMNFL,L04147参照);シナプシンプロモータ(例えばGenBank HUMSYNIB,M55301参照);thy-1 プロモータ(例えば、Chen等著,1987年,Cell,51:7-19 ;及びLlewellyn 等著,2010年,Nat. Med. ,16:1161 参照);セロトニン受容体プロモータ(例えばGenBank S62283参照);チロシンヒドロキシラーゼ(TH)プロモータ(例えば、Nucl. Acids. Res. ,15:2363-2384,1987年及びNeuron,6:583-594 1991年参照);GnRHプロモータ(例えばRadovick等著,Proc. Natl. Acad. Sci. USA,88:3402-3406,1991年参照);L7プロモータ(例えばOberdick等著,Science ,248:223-226 ,1990年参照);DNMTプロモータ(例えばBartge等著,Proc. Natl. Acad. Sci. USA,85:3648-3652,1988年参照);エンケファリンプロモータ(例えばComb等著,EMBO J. ,17:3793-3805,1988年参照);ミエリン塩基性タンパク質(MBP )プロモータ;CMV エンハンサ/血小板由来増殖因子−βプロモータ(例えば、Liu 等著,(2620),Gene Therapy,11:52-60);運動ニューロン特異的遺伝子Hb9 プロモータ(例えば、米国特許第7632679 号明細書;及びLee 等著,(2620),Development ,131:3295-3306 参照);及びCa(2+)−カルモジュリン依存性プロテインキナーゼII(CaMKIIα)プロモータのαサブユニット(例えば、Mayford 等著,1996年,Proc. Natl. Acad. Sci. USA,93:13250参照)を含むが、これらに限定されない。他の好適なプロモータとして、伸張因子(EF)1α及びドーパミントランスポータ(DAT )プロモータが含まれる。 Neuron-specific promoters and other regulators (eg enhancers) are known in the art. Suitable neuron-specific control sequences are neuron-specific enolase (NSE) promoters (eg, EMBL HSENO2, X51956; and also see, eg, US Pat. No. 6,648,811, US Pat. No. 5,387,742); aromatic amino acid decarboxylase. (AADC) Promoter; Neurofilament promoter (see, eg, GenBank HUMNFL, L04147); Synapsin promoter (see, eg, GenBank HUMSYNIB, M55301); thy-1 promoter (eg, Chen et al., 1987, Cell, 51: 7-19). And Llewellyn et al., 2010, Nat. Med., 16: 1161); Serotonin receptor promoter (see, eg, GenBank S62283); Tyrosine hydroxylase (TH) promoter (see, eg, Nucl. Acids. Res., 15 :). 2363-2384, 1987 and Neuron, 6: 583-594, 1991); GnRH promoter (see, eg, Radivick et al., Proc. Natl. Acad. Sci. USA, 88: 3402-3406, 1991); L7 promoter. (See, for example, Oberdick et al., Science, 248: 223-226, 1990); DNMT promoter (see, for example, Bartge et al., Proc. Natl. Acad. Sci. USA, 85: 3648-3652, 1988); Enkephalin promoter (See, eg, Comb et al., EMBO J., 17: 3793-3805, 1988); Myelin basic protein (MBP) promoter; CMV enhancer / platelet-derived growth factor-β promoter (eg, Liu et al., (2620)). , Gene Therapy, 11: 52-60); motor neuron-specific gene Hb9 promoter (see, eg, US Pat. No. 7,632,679; and Lee et al., (2620), Development, 131: 3295-3306); and Ca. (2 + )-Contains α-subunits of the carmodulin-dependent protein kinase II (CaMKIIα) promoter (see, eg, Mayford et al., 1996, Proc. Natl. Acad. Sci. USA, 93: 13250). Not limited. Other suitable promoters include stretch factor (EF) 1α and dopamine transporter (DAT) promoters.
ある場合には、光活性化ポリペプチドのニューロンサブタイプ特異的発現は、例えばCre-Lox 組換え、Flp-FRT 組換えなどの組換えシステムを使用することにより達成されてもよい。組換えを使用した遺伝子の細胞型特異的発現は、例えばFenno 等著,Nat Methods.,2014年7月,11(7):763 ;及びGompf 等著,Front Behav Neurosci. ,2015年7月2日;9:152 に記載されており、これらは参照によって本明細書に組み込まれる。 In some cases, neuron subtype-specific expression of the photoactivated polypeptide may be achieved by using a recombination system such as Cre-Lox recombination, Flp-FRT recombination, for example. Cell-type-specific expression of genes using recombination is described, for example, by Fenno et al., Nat Methods., July 2014, 11 (7): 763; and Gompf et al., Front Behav Neurosci., July 2, 2015. Date; 9: 152, which are incorporated herein by reference.
システム
上記に記載されているような本開示の方法を行うためのシステムを本明細書に更に提供する。図2Cを参照すると、本システム2500は、fMRIデバイス2700、プロセッサ2610及びメモリ2620(例えばコンピュータ可読媒体上の非一時的なメモリ)を備えてもよい。メモリ2620は、プロセッサ2610によって実行されると、fMRIデバイス2700に個体の脳の機能活動を記録させて個体の機能活動データを生成させ、更に本明細書に記載されているような機能活動データを解析する方法を行わせるアプリケーション2624又はプログラムを含んでもよい。
System A system for performing the methods of the present disclosure as described above is further provided herein. Referring to FIG. 2C, the
fMRIデバイス2700はあらゆる好適なデバイスであってもよい。好適なデバイスが、例えば米国特許第8834546 号明細書、米国特許出願公開第2016/0270723 号明細書、国際出願第PCT /US2016/043179号、国際出願第PCT /US2016/064250号及び国際出願第PCT /US2016/049508号に記載されており、これらの開示は参照によって本明細書に組み込まれる。
The
システム2500は、一又は複数の処理装置(本明細書では「プロセッサ」とも称される)2610、メモリ2620(つまりコンピュータ可読記憶媒体)、入出力(I/O )インタフェース2640及び通信インタフェース2630を備えている。これらの構成要素は一又は複数の通信バス又は信号線を介して互いに通信する。ある実施形態では、メモリ2620、つまりコンピュータ可読記憶媒体又はコンピュータ可読記憶メモリは、オペレーティングシステム2622、プログラム2624、モジュール、指示及び記憶データを記憶している。一又は複数のプロセッサはメモリに接続されており、これらのプログラム、モジュール及び指示を実行して記憶データを読み書きすべく動作可能である。
ある実施形態では、処理装置2610は、シングルコアマイクロプロセッサ又はマルチコアマイクロプロセッサのような一又は複数のマイクロプロセッサを有している。ある実施形態では、処理装置は一又は複数の汎用プロセッサを有している。ある実施形態では、処理装置は(例えば、本明細書に記載されている方法を実行するようにプログラムされた)一又は複数の専用プロセッサを有している。
In certain embodiments, the
ある実施形態では、メモリ2620は、高速ランダムアクセスメモリ、例えばDRAM、SRAM、DDR RAM 又は他のランダムアクセス固体メモリ装置を有している。ある実施形態では、メモリは不揮発性メモリ、例えば一又は複数の磁気ディスク記憶装置、光ディスク記憶装置、フラッシュメモリ装置又は他の不揮発性固体記憶装置を有している。ある実施形態では、メモリは、処理装置2610から遠隔地に配置された一又は複数の記憶装置を有している。メモリ、或いはメモリ内の一又は複数の不揮発性メモリ装置がコンピュータ可読記憶媒体を有している。ある実施形態では、メモリは非一時的なコンピュータ可読記憶媒体を有している。
In certain embodiments, the
ある実施形態では、I/O インタフェース2640は、一又は複数の入出力装置、例えば一又は複数のディスプレイ、キーボード、(トラックパッド若しくはタッチセンサディスプレイのタッチセンサ面のような)タッチセンサ面、スピーカ及びマイクロホンに接続されている。I/O インタフェースは、ユーザからユーザ入力(例えば音声入力、キーボード入力、タッチ入力など)を受けて、ユーザ入力に応じてユーザ入力を処理するように構成されてもよい。I/O インタフェースは、システム2500上で実行される様々なプログラム指示に応じて出力(例えば音、画像、テキストなど)をユーザに提示するように更に構成されてもよい。
In certain embodiments, the I /
ある実施形態では、通信インタフェース2630は、一又は複数の有線通信ポート及び/又は無線送受信回路を有している。一又は複数の有線通信ポートは、一又は複数の有線インタフェース、例えばイーサネット(登録商標)、ユニバーサルシリアルバス(USB )、FIREWIRE(登録商標)などを介して通信信号を送受信する。無線回路は、通信ネットワーク及び他の通信デバイスとRF信号、赤外線信号及び/又は光信号を送受信する。無線通信は、複数の通信規格、通信プロトコル及び通信技術、例えばGSM(登録商標) 、EDGE、CDMA、TDMA、Bluetooth (登録商標)、Wi-Fi、VoIP、Wi-MAXのいずれか、又はあらゆる他の好適な無線通信プロトコルを使用してもよい。ネットワーク通信インタフェースによって、ネットワーク、例えばインターネット、イントラネット及び/又は無線ネットワーク、例えば携帯電話ネットワーク、ローカルエリアネットワーク(LAN )、無線ローカルエリアネットワーク(WLAN)及び/又はメトロポリタンエリアネットワーク(MAN )及び他のデバイスとシステム2500との通信が可能になる。ネットワーク通信インタフェースは、ネットワーク上でシステムと他のデバイスとの通信を促進するように構成されている。
In certain embodiments, the
ある態様では、システムはコンピュータ2600を備えてもよく、このコンピュータは個人のデバイス(例えばラップトップ、デスクトップ、仕事場のコンピュータ、携帯機器など)であってもよい。個人のデバイスであるコンピュータは、ネットワークに接続される必要がなくてもよい。他の場合では、個人のデバイスであるコンピュータは、ネットワーク(例えば上記に記載されているような有線接続又は無線接続)に接続されている。
In some embodiments, the system may include a
ある態様では、コンピュータ2600はサーバ又はサーバの集合体であり、I/O インタフェースを必要としなくてもよい。例えば、コンピュータ2600はサーバであってもよく、本開示の神経経路解析プログラム2124はユーザによってウェブサイトを通じてアクセスされてもよい。
In some embodiments, the
ある実施形態では、オペレーティングシステム2622(例えばLINUX (登録商標)、UNIX(登録商標)、OS X(登録商標)、WINDOWS (登録商標)又は埋め込まれたオペレーティングシステム)は、一般的なシステムタスク(例えばメモリ管理、記憶装置の制御、電力管理など)を制御して管理するための様々なソフトウェア部品及び/又はドライバを有しており、様々なハードウェア部品、ファームウェア部品及びソフトウェア部品間の通信を促進する。 In certain embodiments, the operating system 2622 (eg, LINUX®, UNIX®, OS X®, WINDOWS® or embedded operating system) is a general system task (eg, an embedded operating system). It has various software components and / or drivers for controlling and managing memory management, storage device control, power management, etc., and promotes communication between various hardware components, firmware components and software components. do.
システム2500は単なる一例であり、システム2500が示された部品をより多く若しくはより少なく有してもよく、2以上の部品を組み合わせてもよく、又は部品の異なる構成若しくは配置を有してもよいことに注目すべきである。図2Cに示されている様々な部品は、一又は複数の信号処理集積回路及び/又は特定用途向け集積回路又はこれらの組合せを含むハードウェア、ソフトウェア、ファームウェアで実現されてもよい。
図2Cでは、神経経路解析プログラム2624は、メモリ2620に記憶された一又は複数のプログラムを有しており、本明細書に記載されている方法の一又は複数の実施形態に係る方法を行うための指示を含んでもよい。神経経路解析プログラム2624は、以下の例のモジュール、そのサブセット又はそのスーパーセットのいずれかを有してもよい。
In FIG. 2C, the neural
ある場合には、神経経路解析プログラム2624は、上記に記載されているような個体の脳の領域に関する機能活動データを計算処理して、本明細書に記載されているように、領域を表す相互に結合されたノード間の機能的結合の回路網モデル2628に基づき機能活動データから結合性モデルを生成し、本明細書に記載されているようにa)結合性モデルと、b)相互に結合されたノード間のニューロンサブタイプ特異的結合性推定値2627との線形回帰から一組の係数を導くことにより、複数のニューロンサブタイプの各々によって調節される神経経路の相対活動の推定値を生成するように構成されてもよい。
In some cases, the neural
本システム2500は、個体の脳の機能活動を測定するように構成されたfMRIデバイス2700を備えてもよい。コンピュータシステム2600は、通信インタフェース2630を介してfMRIデバイスと通信してもよく、例えば、コンピュータシステムはfMRIデバイスの動作を制御する、及び/又はfMRIデバイスから機能画像データを検索することができる。
The
神経経路解析プログラム2624は、領域を表す相互に結合されたノード間の機能的結合の回路網モデル2628に基づき機能活動データから結合性モデルを生成するように構成されたモデル生成モジュール、例えばspDCM モジュール2625を有してもよい。
The neural
神経経路解析プログラム2624は、a)結合性モデルとb)ニューロンサブタイプ特異的結合性推定値2627との線形回帰を行って、異なるニューロンサブタイプによって調節される神経経路の機能活動データへの寄与を表す一組の係数を導くように構成された線形回帰モジュール2626を有してもよい。
The neural
本明細書に記載された方法は、コンピュータシステム2600によって行われてもよい。ある実施形態では、コンピュータシステム2600は分散型コンピュータシステムである。例えば、コンピュータシステム2600は、第2組の一又は複数のプロセッサから遠隔地に配置された第1組の一又は複数のプロセッサを有してもよい。ある実施形態では、コンピュータシステム2600は、ウェブインタフェースを提供するように構成されたウェブサーバを有している。ある実施形態では、ウェブインタフェースはデータを受けるように構成されている。ある実施形態では、ウェブインタフェースは結果を表示するように構成されている。
The method described herein may be performed by
ある態様では、神経経路解析プログラム2624はユーザによって設定可能であってもよい。例えば、神経経路解析プログラムは、回路網モデル2628、ニューロンサブタイプ特異的結合性推定値2627、神経変動などを含めてモデル生成アルゴリズム及び/又は線形回帰アルゴリズムに適用するか否かなどの一又は複数の設定、或いは本明細書に記載された方法の一又は複数の実施形態の実行を可能にするあらゆる他の設定をユーザに決定させ得るように構成されたユーザインタフェースモジュール(不図示)を有してもよい。
In some embodiments, the neural
ある実施形態では、システム2500は、fMRIデバイス2700によってモニタされている個体の脳領域を刺激するように構成された脳刺激デバイス2800、例えば脳深部刺激デバイス又は経頭蓋磁気刺激デバイスを備えている。ある実施形態では、コンピュータシステム2600は、本開示の方法に従って脳の機能活動データに寄与する神経経路の解析に基づき脳刺激デバイスを制御するように構成されてもよい。例えば、個体が患っている神経障害に関連した神経経路の個体の活動が不十分であると神経経路解析が示す場合、コンピュータシステムは、神経経路を脳刺激デバイスを介して調節する関連した脳領域に適切な刺激を与えることにより、個体の脳の神経経路活動のレベルの均衡を再度保ってもよい。
In certain embodiments, the
有用性
本開示の方法及びシステムは、個体の非侵襲的に得られる脳の機能活動データの基礎となる神経経路機構の理解が望まれる様々な用途に使用される。本方法及び本システムは、神経障害、例えばパーキンソン病の基礎となる神経経路の機構的理解を得る際、神経障害に関する診断/予後/予測ツールを提供する際、新しい治療(例えば医薬品開発及び/又は脳深部刺激のための)例えば細胞特異的な治験及び/又は周波数依存性の治験の開発に貢献する際、神経障害の中核症状、例えばパーキンソン病(PD)のジスキネジア及び/又は動作緩慢の進行のモニタを支援する際、神経障害の治療の効力などをモニタする際などに使用されてもよい。
Usefulness The methods and systems of the present disclosure are used in a variety of applications for which an understanding of the neural pathway mechanisms underlying the non-invasively obtained brain functional activity data of an individual is desired. The method and the system provide new therapies (eg, drug development and / or) in providing diagnostic / prognostic / predictive tools for neurological disorders, such as gaining a mechanistic understanding of the neurological pathways underlying Parkinson's disease. In contributing to the development of, for example, cell-specific and / or frequency-dependent trials (for deep brain stimulation), the progression of core symptoms of neurological disorders, such as Parkinson's disease (PD) dyskinesia and / or slow motion. It may be used to assist monitoring, to monitor the efficacy of treatment for neurological disorders, and the like.
従って、本開示の態様は、上記に記載されているような方法及びシステムを使用して、神経障害に関連した神経回路レベルバイオマーカを識別する方法を含んでいる。本明細書に使用されているような「関連」は、障害の治療との関係を含む神経経路と神経障害とのあらゆる特異的な関係を指してもよい。関係は因果関係又は相関関係であってもよい。 Accordingly, aspects of the present disclosure include methods and systems as described above for identifying neural circuit level biomarkers associated with neuropathy. As used herein, "association" may refer to any specific relationship between a neural pathway and a neuropathy, including its relationship to the treatment of the disorder. The relationship may be a causal relationship or a correlation.
従って、本明細書に記載されているような脳の機能活動データの解析に基づき様々なニューロンサブタイプによって調節される神経経路の相対活動を推定する方法を使用して、神経障害に関連する一又は複数の態様に関して互いに異なる2つのグループの個体からの解析結果を比較することにより、神経障害に関連した神経回路レベルバイオマーカを識別してもよい。解析は、ニューロンサブタイプ特異的結合性推定値を脳の機能活動データに関する結合性モデルに個体のグループ毎に関連付ける一組の回帰係数を与えてもよい。その後、様々な組の回帰係数間の差測定を計算して、1つのグループの回帰係数の分布が別のグループの分布とは異なるか否かを判断してもよい。2つのグループが神経障害を患っている個体の症例グループ、及び神経障害を患っていない個体の対照グループである場合、差測定は、回帰係数の症例組が神経障害に関連した神経回路レベルバイオマーカであることを示してもよい。2つのグループが、神経障害を患って神経障害の治療を受けている個体の症例グループ、及び神経障害を患って神経障害の治療を受けていない個体の対照グループである場合、差測定は、回帰係数の症例組が神経障害の治療に関連した神経回路レベルバイオマーカであることを示してもよい。 Therefore, one associated with neuropathy is associated with neuropathy using methods such as those described herein that estimate the relative activity of neural pathways regulated by various neuronal subtypes based on analysis of brain functional activity data. Alternatively, neural circuit level biomarkers associated with neuropathy may be identified by comparing analysis results from two different groups of individuals in multiple embodiments. The analysis may give a set of regression coefficients that correlate neuron subtype-specific connectivity estimates to a connectivity model for brain functional activity data for each group of individuals. You may then calculate the difference measurements between the various sets of regression coefficients to determine if the distribution of the regression coefficients in one group is different from the distribution in another group. If the two groups are a case group of individuals with neuropathy and a control group of individuals without neuropathy, the difference measurement is a neural circuit level biomarker in which the regression coefficient case set is associated with neuropathy. It may be shown that. If the two groups are a case group of individuals suffering from neuropathy and receiving treatment for neuropathy, and a control group of individuals suffering from neuropathy and not receiving treatment for neuropathy, the difference measurement regresses. It may be shown that the case set of coefficients is a neural circuit level biomarker associated with the treatment of neuropathy.
差測定は、異なる組の回帰係数間の関係のあらゆる好適な指標であってもよい。好適な差測定は、減算、除算、相関関係、偏差を含むが、これらに限定されない。ある場合には、差測定は、ピアソンの積率相関係数、スピアマンの順位相関係数、二乗平均平方根誤差(RMSE)、ユークリッド距離又は平均絶対偏差(MAD )である。 The difference measurement may be any suitable indicator of the relationship between different sets of regression coefficients. Suitable difference measurements include, but are not limited to, subtraction, division, correlation, and deviation. In some cases, the difference measurements are Pearson's product-moment correlation coefficient, Spearman's rank correlation coefficient, squared mean square error (RMSE), Euclidean distance or mean absolute deviation (MAD).
差測定を閾値基準と比較してもよい。差測定が閾値基準を満たす場合、神経回路レベルバイオマーカと神経障害との関連性が存在すると結論付けられてもよい。ある場合には、閾値基準が閾値を有しており、閾値を超える(又は閾値未満の)差測定は、神経回路レベルバイオマーカと神経障害との関連性を裏付ける。ある場合には、差測定は統計的に有意な値、例えばp値であり、p値未満の差測定は、神経回路レベルバイオマーカと神経障害との関連性を裏付ける。 Difference measurements may be compared to threshold criteria. If the difference measurement meets the threshold criteria, it may be concluded that there is an association between neural circuit level biomarkers and neuropathy. In some cases, the threshold criterion has a threshold, and measurement of differences above (or below) the threshold supports the association between neural circuit level biomarkers and neuropathy. In some cases, the difference measurement is a statistically significant value, eg, a p-value, and a difference measurement below the p-value supports the association between neural circuit level biomarkers and neuropathy.
別の態様では、本明細書に記載されているような脳の機能活動データの解析に基づき様々なニューロンサブタイプによって調節される神経経路の相対活動を推定する方法を使用して、個体の神経障害の治療に対する進行、予後及び/又は反応に関して神経回路レベルバイオマーカの予測値を評価してもよい。 In another aspect, an individual's nerves use a method of estimating the relative activity of neural pathways regulated by various neuronal subtypes based on the analysis of functional activity data of the brain as described herein. Predictions of neural circuit level biomarkers may be evaluated with respect to progression, prognosis and / or response to treatment of the disorder.
ある実施形態では、本明細書に記載されているような脳の機能活動データの解析に基づき様々なニューロンサブタイプによって調節される神経経路の相対活動を推定する方法を使用して、神経障害の治療法に関するパラメータを決定又は調節してもよい。ある場合には、脳刺激療法(例えば、刺激の周波数、刺激の標的、刺激の継続時間などの刺激パラメータを有する脳深部刺激、経頭蓋磁気刺激など)の刺激プロトコルを脳の機能活動の解析に基づき調節してもよい。 In certain embodiments, a method of estimating the relative activity of neural pathways regulated by various neuronal subtypes based on the analysis of functional activity data of the brain as described herein is used for neuropathy. Parameters for treatment may be determined or adjusted. In some cases, the stimulation protocol of brain stimulation therapy (eg, deep brain stimulation with stimulation parameters such as stimulation frequency, stimulation target, stimulation duration, transcranial magnetic stimulation, etc.) can be used to analyze functional activity of the brain. It may be adjusted based on.
神経障害はあらゆる好適な神経障害であってもよい。ある場合には、神経障害は神経疾患、又は加齢に関連した神経障害である。ある実施形態では、神経疾患は、パーキンソン病、アルツハイマー病、認知症、てんかん、自閉症、双極性障害、統合失調症、トゥーレット症候群、強迫性障害、注意欠陥多動性障害、ハンチントン病、多発性硬化症又は片頭痛である。 The neuropathy may be any suitable neuropathy. In some cases, neuropathy is a neurological disorder, or age-related neuropathy. In certain embodiments, the neurological disorders include Parkinson's disease, Alzheimer's disease, dementia, epilepsy, autism, bipolar disorder, schizophrenia, Rett syndrome, compulsive disorder, attention deficit hyperactivity disorder, Huntington's disease, Multiple sclerosis or migraine.
更なる実施形態
本開示の更なる実施形態を以下に記述する。
Further Embodiments Further embodiments of the present disclosure are described below.
本開示の実施形態は、a)動物データ、b)計算モデリング及びc)ヒトデータの3つのモジュールを含んでいる。図8は、本開示の実施形態の3つのモジュール及びワークフローを示す。 The embodiments of the present disclosure include three modules: a) animal data, b) computational modeling and c) human data. FIG. 8 shows the three modules and workflows of the embodiments of the present disclosure.
第1のモジュールは、動物の脳のデータの実験計画、計測、取得及び処理を含んでいる。このモジュールは、光遺伝学的ツール及び/又は他の神経調節ツールを用いて特異的なニューロンタイプを操作しながら、侵襲的記録及び/又は非侵襲的記録を使用して脳機能をマッピングする技術を与える。第2のモジュールは、動物データの計算モデリングを指す。第2のモジュールは、特異的なニューロンタイプの光遺伝学的(非)活性化によって駆動される神経障害及び/又は精神障害に関与している脳回路網を推定する。最後に、第3のモジュールは、ヒトの脳データの取得、処理及び回路網解析を構成している。第3のモジュールは、静止状態の条件中に疾患特異的なヒトの脳回路網への特異的な細胞型及び刺激周波数の寄与を検査して定量化する。 The first module includes experimental design, measurement, acquisition and processing of animal brain data. This module is a technique for mapping brain function using invasive and / or non-invasive records while manipulating specific neuronal types using optogenetic and / or other neuromodulatory tools. give. The second module refers to computational modeling of animal data. The second module estimates brain networks involved in neurological and / or psychiatric disorders driven by optogenetic (non-) activation of specific neuronal types. Finally, the third module constitutes the acquisition, processing and network analysis of human brain data. The third module examines and quantifies the contribution of specific cell types and stimulus frequencies to disease-specific human brain networks during quiescent conditions.
M1:動物データ
第1のモジュールは、動物の細胞型及び周波数に特異的な神経画像データを収集すべく用いられる手順を含んでもよい。侵襲的/非侵襲的な神経記録に関連した
1537924829311_0
を使用して、脳機能をマッピングしながら、異なる周波数の光パルスを使用して特異的な細胞の調節を可能にする。光遺伝学fMRI(ofMRI )は、脳領域間のニューロン結合性をインビボで調査するツールを与える。
M1: Animal data The first module may include procedures used to collect neuroimaging data specific for animal cell type and frequency. Related to invasive / non-invasive neural recording
1537924829311_0
Allows specific cell regulation using light pulses of different frequencies while mapping brain function. Optogenetics fMRI (ofMRI) provides a tool for in vivo investigation of neuronal connectivity between brain regions.
このモジュール内では光遺伝学的実験が行われ、実験は、特異的なニューロンタイプ(例えば興奮性錐体ニューロン及び/又は抑制介在ニューロン)を標的とし、次に特異的な脳回路(例えば基底核経路)を駆動する。特異的な細胞型によって駆動されるこれらの脳回路は、ヒトの脳データに観察される全分散に寄与してもよく、潜在的に本発明者らは、ヒトの脳回路網へのこのような特定の寄与を定量化することができる(より詳細には第3のモジュール参照)。 Optogenetic experiments are performed within this module, targeting specific neuron types (eg, excitatory pyramidal neurons and / or inhibitory interneurons), and then specific brain circuits (eg, basal ganglia). Path) is driven. These brain circuits driven by specific cell types may contribute to the total dispersion observed in human brain data, potentially we have this to the human brain network. Specific contributions can be quantified (see the third module for more details).
例えば、基底核回路の2つのニューロンタイプの機能的有意性が調査されてもよい。基底核は、目標指向運動作用に重要な神経核の系統発生的に古く、進化的に保存されたグループである。ある場合には、回路モデルをヒトに変換するとき、及び治療介入を開発及び/又は試験するとき、進化的に保存された脳領域を考慮に入れてもよい。図2は、マウス及びヒトの基底核−視床皮質複合体の解剖学的マスクを示す。 For example, the functional significance of two neuronal types in the basal ganglia circuit may be investigated. The basal ganglia is a phylogenetically old and evolutionarily conserved group of nerve nuclei important for target-oriented motor action. In some cases, evolutionarily conserved brain regions may be taken into account when converting circuit models to humans and when developing and / or testing therapeutic interventions. FIG. 2 shows an anatomical mask of the mouse and human basal ganglia-thalamic cortex complex.
基底核は、随意運動を制御する複数の相互に結合された皮質下神経核を含んでいる。基底核の2つの出力核、淡蒼球内節態様及び黒質(網様部)は視床を持続的に抑制し、皮質に投射を送信して運動を開始又は終了させる。この抑制出力は、線条体から延びる直接路及び間接路によって調整されると考えられている。線条体内で、2つの出力核に直接突出する中型有棘ニューロン(MSN )は、送信を促進するD1ドーパミン受容体を有している一方、間接路に突出する中型有棘ニューロンは、送信を低下させるD2ドーパミン受容体を有している。これらの経路は比較的よく特徴付けられ、組織分布的に分離され、機能的に反対であるので、異なるニューロンの寄与を分離するためのシステムを与え得る。 The basal ganglia contains multiple interconnected subcortical nuclei that control voluntary movements. The two output nuclei of the basal ganglia, the internal globus pallidum and the substantia nigra (pars reticulata), continuously suppress the thalamus and send projections to the cortex to initiate or terminate movement. This suppression power is believed to be regulated by direct and indirect paths extending from the striatum. Within the striatum, medium-sized spiny neurons (MSNs) that project directly into the two output nuclei have D1 dopamine receptors that facilitate transmission, while medium-sized spiny neurons that project into the indirect tract transmit transmission. It has a D2 dopamine receptor that lowers it. These pathways are relatively well characterized, tissue-distributed and functionally opposite, which may provide a system for separating the contributions of different neurons.
これらの光遺伝学的実験では、基底核−視床皮質複合体の作業に対する背内側尾状核−被殻態様内の各ニューロンタイプの影響を確立してもよい。2つの光遺伝学的操作によって、静止状態データ中の脳活動の細胞型依存性反応及び周波数依存性反応に関する説明が与えられてもよい。表1は実験計画の例を示す。 These optogenetic experiments may establish the effect of each neuron type within the dorsomedial caudate-putamen aspect on the work of the basal ganglia-thalamic cortex complex. Two optogenetic manipulations may provide an explanation for the cell type-dependent and frequency-dependent responses of brain activity in rest state data. Table 1 shows an example of an experimental design.

ある実施形態では、より多くのofMRI データが収集されてもよく、最初の計画が第2の要因で更新されてもよい。表2は、例えば、基底核回路の作業に対して高刺激周波数及び低刺激周波数でD1-MSN細胞型及びD2-MSN細胞型の個別の影響を評価し得る2×2要因計画を示す。 In certain embodiments, more of MRI data may be collected and the initial plan may be updated with a second factor. Table 2 shows, for example, a 2 × 2 factor scheme that can assess the individual effects of D1-MSN and D2-MSN cell types on the work of the basal ganglia circuit at high and low stimulation frequencies.
ある実施形態では、線条体態様内の3つの異なる領域(亜領域)に照射してもよい。注目する亜領域は、例えば腹側線条体、背側尾状核及び背側前被殻を含んでいる。従って、第3の要因の定義及び実施は照明源の位置を含んでもよい。この要因を用いて、遠隔の脳領域への光刺激の空間効果を明らかにする新たな組のリグレッサを生成してもよい。 In certain embodiments, three different regions (subregions) within the striatal aspect may be irradiated. Subregions of interest include, for example, the ventral striatum, the dorsal caudate nucleus and the dorsal anterior putamen. Therefore, the definition and implementation of the third factor may include the location of the illumination source. This factor may be used to generate a new set of regressors that reveal the spatial effects of light stimulation on distant brain regions.
M2:計算モデリング
計算モデリングツールボックスは、前のモジュール、つまり光遺伝学及びマルチモーダル記録技術を使用して収集されたデータから脳システムをモデル化して特徴付けてもよい。計算モデリングツールボックスは、撮像/記録技術−光遺伝学fMRI、LFP 、MUA 、SUA 及び光学撮像反応、及び生物物理学的モデリングイニシアチブ−メゾスコピック性質に基づき畳み込み原理及び/又はニューラルマスモデリング(NMM )に基づく動的因果モデリング(DCM )を含んでいる。計算モデリングと共に光遺伝学及び撮像方法を組み合わせることにより、脳回路網の生物学的基礎が理解されてもよい。
M2: Computational Modeling The Computational Modeling Toolbox may model and characterize the brain system from data collected using previous modules, optogenetics and multimodal recording techniques. Computational Modeling Toolbox is a convolutional principle and / or neural mass modeling (NMM) based on imaging / recording techniques-optogenetics fMRI, LFP, MUA, SUA and optical imaging reactions, and biophysical modeling initiatives-mesoscopic properties. Includes dynamic causal modeling (DCM) based on. By combining optogenetics and imaging methods with computational modeling, the biological basis of brain networks may be understood.
上記に導入されているように、ofMRI を使用して基底核経路に関する2つの細胞型の寄与を調査してもよい。このモデリングユニット内では、スペクトルDCM (spDCM )を使用して脳領域間の有効な結合性を推定してもよい。刺激部位と同側の尾状核−被殻態様(CPu )、淡蒼球外節(GPe )、淡蒼球内節(GPi )、視床下核(STN )、黒質(SN)、視床(THL )及び運動皮質(MOT )態様から構成された7つのノードの脳回路網をモデル化してもよい。 As introduced above, ofMRI may be used to investigate the contribution of two cell types to the basal ganglia pathway. Within this modeling unit, spectral DCM (spDCM) may be used to estimate effective connectivity between brain regions. Caudate nucleus-putamen aspect (CPu), external globus pallidum (GPe), internal globus pallidum (GPi), subthalamic nucleus (STN), substantia nigra (SN), thalamic (SN) on the ipsilateral side of the stimulation site A seven-node brain network composed of THL) and motor cortex (MOT) aspects may be modeled.
一般に、結合性アルゴリズムは、神経生物学的に妥当性のある候補間のデータの最も適切な生成モデルの識別に基づいてもよい。モデルを制限するために、拡散テンソルMRI 免疫組織化学データ及び/又は文献検索を通じて得られた解剖学的結合性情報を一般に使用する。特にこの場合、本発明者らは文献を検索して最も可能性が高い生成モデルを選択した。図6は、この例で使用されてもよい結合機構の例を示す。 In general, the associative algorithm may be based on the identification of the most appropriate generative model of data between neurobiologically valid candidates. Diffusion tensor MRI immunohistochemical data and / or anatomical connectivity information obtained through literature searches are commonly used to limit the model. Especially in this case, the inventors searched the literature and selected the most probable generative model. FIG. 6 shows an example of a coupling mechanism that may be used in this example.
ある実施形態では、上記に記載された他の実験(要因)、つまり高周波でのD1-MSN刺激及びD2-MSN刺激を同様に行って脳回路網の推定を続行してもよい。図7A〜7Cで低周波刺激に関して行われたように、この解析は高周波での新たな組の回路網推定値を生成する。 In certain embodiments, the other experiments (factors) described above, namely D1-MSN stimulation and D2-MSN stimulation at high frequency, may be performed in the same manner to continue the estimation of the brain network. This analysis produces a new set of network estimates at high frequencies, as was done for low frequency stimuli in Figures 7A-7C.
M3:ヒトデータ
ある実施形態では、第3のモジュールはヒトに行われる実験、データ収集及び解析を含んでいる。上述したように、本開示の態様は、動物(m1、m2、・・・)で収集されたデータを用いて構築されたモデルをヒトのfMRIデータに変換することを含んでいる。この手法によって、健康なヒトの脳及び罹患したヒトの脳の脳回路網機能の細胞型特異的な記述が与えられてもよい。動物モデルで既に検査されている脳回路網と同一の脳回路網が検査されてもよく、ヒトの脳の各細胞型依存性回路網及び周波数依存性回路網の寄与が、一般線形モデル(GLM )のような回帰分析又はサポートベクトルマシン(SVM )のような上級統計手法によって推定されてもよい。
M3: Human data In certain embodiments, the third module includes experiments, data acquisition and analysis performed on humans. As mentioned above, aspects of the present disclosure include converting a model constructed using data collected in animals (m 1 , m 2, ...) To human fMRI data. This technique may provide a cell-type specific description of the brain network function of a healthy human brain and an affected human brain. The same brain network that has already been tested in the animal model may be tested, and the contribution of each cell type-dependent and frequency-dependent network of the human brain is the general linear model (GLM). ) May be estimated by regression analysis or advanced statistical methods such as support vector machines (SVM).
これらの解析は、個体(αi 、βi 、・・・)毎に回帰係数を生成してもよく、回帰係数は、注目する静止状態の脳回路網、例えば基底核−視床皮質回路への特異的な細胞型(及び周波数)の影響を明らかにし得る。これらの回帰係数、これ以降の神経生理学的スコアは、これらの個体に観察される行動、形質又は症状を潜在的に特徴付けられ得るベクトル部分空間を構成してもよい。そのため、これらのスコアの分布は個体(α、β、・・・)全体に亘って推定されて検査されてもよく、これらのスコアに関する統計的な差が、健康な脳と罹患した脳との間でグループレベルで調査されてもよい。この状況では、グループ解析はこれらの解析に適している。 These analyzes may generate regression coefficients for each individual (α i , β i , ...), The regression coefficients to the quiescent brain network of interest, such as the basal ganglia-thalamic cortex circuit. The effects of specific cell types (and frequencies) can be revealed. These regression coefficients, and subsequent neurophysiological scores, may constitute vector subspaces that can potentially characterize the behaviors, traits or symptoms observed in these individuals. Therefore, the distribution of these scores may be estimated and tested throughout the individual (α, β, ...), and statistical differences in these scores between healthy and affected brains. It may be investigated at the group level between them. In this situation, group analysis is suitable for these analyses.
例えば、前の例を考慮すると、正常なヒトの脳及びパーキンソン病のヒトの脳の基底核−視床皮質回路網へのD1-MSN細胞型及びD2-MSN細胞型の寄与はrsfMRIによって定量化されてもよい。ある場合には、2つの光遺伝学的操作に関して、脳領域間の有効な結合性の2つの異なる統計的に略関連がないパターンが存在してもよい(図7A〜7C参照)。言い換えれば、D1結合性推定値とD2結合性推定値との間でピアソンの相関係数rは0.02である。 For example, considering the previous example, the contribution of D1-MSN and D2-MSN cell types to the basal ganglia-thalamic cortex network of normal human brain and human brain with Parkinson's disease is quantified by rsfMRI. You may. In some cases, there may be two different statistically unrelated patterns of effective binding between brain regions for two optogenetic manipulations (see Figures 7A-7C). In other words, Pearson's correlation coefficient r between the D1 binding estimate and the D2 binding estimation is 0.02.
与えられたi番目のヒトの被験体の同一の静止状態回路網が推定されてもよく、D1-MSN細胞型及びD2-MSN細胞型の寄与が計算されてもよい。言い換えれば、多重線形回帰問題を以下の式(I) によって解いてもよい。
spDCMi=αi×[spDCMD1-MSN]+βi×[spDCMD2-MSN]+ζi×[constant]
(式(I) 最初の実験計画を考慮した多重線形回帰)
The same quiescent network of a given i-th human subject may be estimated and the contributions of D1-MSN and D2-MSN cell types may be calculated. In other words, the multiple linear regression problem may be solved by the following equation (I).
spDCM i = α i × [spDCM D1-MSN ] + β i × [spDCM D2-MSN ] + ζ i × [constant]
(Equation (I) Multiple linear regression considering the first experimental design)
ここで、spDCMiはi番目のヒトの被験体に関する回路網推定値(つまり結合性パラメータ)のベクトルであり、spDCMD1-MSN及びspDCMD2-MSNは、D1-MSN刺激及びD2-MSN刺激に関する平均回路網推定値(例えば閾値処理された推定値)のベクトルであり、αi 及びβi は、i番目のヒトの被験体の静止状態回路網への直接路及び間接路の寄与を示し、iは1〜Nsであり、Nsは参加者の総数である。 Here, spDCM i is a vector of network estimates (ie, associative parameters) for the i-th human subject, and spDCM D1-MSN and spDCM D2-MSN are for D1-MSN and D2-MSN stimuli. A vector of mean network estimates (eg, thresholded estimates), where α i and β i indicate the contribution of direct and indirect paths to the quiescent network of the i-th human subject. i is 1 to N s , and N s is the total number of participants.
グループ間の差を識別するとき、この手法は2つの(多変量)分布p(αc ,βc )及びp(αp ,βp )を生成してもよく、ここで、対{αc ,βc }及び{αp ,βp }は、対照のグループ及びパーキンソン病のグループに関する直接路回路網及び間接路回路網の寄与を夫々示す。2つのグループを比較することによって、神経生理学的スコアの分布の統計的な差p(αc ,βc )対p(αp ,βp )が観察されてもよく、この差は、D1-MSN細胞型及びD2-MSN細胞型に関するPDコホートの異常な神経生物現象を示し得る。 When identifying differences between groups, this technique may generate two (multivariate) distributions p (α c , β c ) and p (α p , β p ), where pair {α c. , Β c } and {α p , β p } indicate the contribution of the direct and indirect network to the control group and the Parkinson's disease group, respectively. By comparing the two groups, a statistical difference in the distribution of neurophysiological scores p (α c , β c ) vs. p (α p , β p ) may be observed, and this difference is D1- It may show aberrant neurobiological phenomena in the PD cohort for MSN and D2-MSN cell types.
上記に注記されているように、より多くの複合体実験計画、例えば2×2要因計画がある実施形態で使用されてもよい。同様に、より多くの光遺伝学的実験(要因)を用いることにより、同一の多重線形回帰手法を使用してもよい。例えば、上記の2×2要因計画を考慮すると、回帰モデルは以下の式(II)によって以下のように実施され得る。
spDCMi=αi×[spDCMD1-MSN,low-frequency]+βi×[spDCMD2-MSN,low-frequency]+γi×[spDCMD1-MSN,high-frequency]+δi×[spDCMD2-MSN,high-frequency]+ζi×[constant]
(式(II) 2×2要因計画を考慮した多重線形回帰)
As noted above, more complex experimental designs, such as 2x2 factor designs, may be used in certain embodiments. Similarly, the same multiple linear regression technique may be used by using more optogenetic experiments (factors). For example, considering the above 2 × 2 factor plan, the regression model can be implemented by the following equation (II) as follows.
spDCM i = α i × [spDCM D1-MSN, low-frequency ] + β i × [spDCM D2-MSN, low-frequency ] + γ i × [spDCM D1-MSN, high-frequency ] + δ i × [spDCM D2-MSN , high-frequency ] + ζ i × [constant]
(Equation (II) Multiple linear regression considering 2 × 2 factor design)
ここで、spDCMiはi番目のヒトの被験体に関する回路網推定値(つまり結合性パラメータ)のベクトルであり、spDCMD1-MSN, low-frequency及びspDCMD2-MSN, low-frequencyは、低周波でのD1-MSN刺激及びD2-MSN刺激に関する平均回路網推定値(例えば閾値処理された推定値)のベクトルであり、spDCMD1-MSN, high-frequency及びspDCMD2-MSN, high-frequencyは、高周波でのD1-MSN刺激及びD2-MSN刺激に関する平均回路網推定値(例えば閾値処理された推定値)のベクトルであり、αi 及びβi は、i番目のヒトの被験体の静止状態回路網への低周波でのD1-MSN刺激及びD2-MSN刺激の寄与を示し、γi 及びδi は、高周波でのD1-MSN刺激及びD2-MSN刺激の寄与を示し、iは1〜Nsであり、Nsは参加者の総数である。 Here, spDCM i is a vector of network estimates (ie, coupling parameters) for the i-th human subject, and spDCM D1-MSN, low-frequency and spDCM D2-MSN, low-frequency are low frequencies. Vectors of mean network estimates (eg, thresholded estimates) for D1-MSN and D2-MSN stimuli in, spDCM D1-MSN, high-frequency and spDCM D2-MSN, high-frequency . Vectors of mean network estimates (eg, thresholded estimates) for D1-MSN and D2-MSN stimuli at high frequencies, where α i and β i are quiescent circuits of the i-th human subject. Low frequency D1-MSN and D2-MSN stimulation contributes to the network, γ i and δ i indicate high frequency D1-MSN and D2-MSN stimulation contributions, and i 1-N s and N s is the total number of participants.
次に、この手法は、新たな組の2つの(多変量)分布p(αc ,βc ,γc ,δc )及びp(αp ,βp ,γp ,δp )を生成してもよく、ここで、四重項{αc ,βc ,γc ,δc }及び{αp ,βp ,γp ,δp }は、対照のグループ及びパーキンソン病のグループに関する静止状態回路網への低刺激周波数及び高刺激周波数でのD1-MSN及びD2-MSNの寄与を夫々示してもよい。再度、2つのグループを比較することにより、神経生理学的スコアの統計的な差p(αc ,βc ,γc ,δc )対p(αp ,βp ,γp ,δp )が観察されてもよく、この差は、同様に細胞型及び刺激周波数に関して基本的な生物学に関する洞察を与えてもよい。 This method then produces a new set of two (multivariate) distributions p (α c , β c , γ c , δ c ) and p (α p , β p , γ p , δ p ). Here, the quadruples {α c , β c , γ c , δ c } and {α p , β p , γ p , δ p } are quiescent states for the control group and the Parkinson's disease group. The contributions of D1-MSN and D2-MSN at low and high stimulation frequencies to the network may be shown respectively. By comparing the two groups again, the statistical difference in neurophysiological scores p (α c , β c , γ c , δ c ) vs. p (α p , β p , γ p , δ p ) was found. It may be observed and this difference may also provide basic biological insights regarding cell type and stimulation frequency.
要約すると、このモジュールは動物で既に推定されている脳回路網と同一の脳回路網を推定し、静止状態のヒトの脳データへの各細胞型(及び刺激周波数)回路網記述の寄与を確立する。このユニットは、診断ツールとしての機能を果たし、更に新たな治療(細胞特異的治験及び周波数依存性治験)の開発に更に寄与し得る一組の神経生理学的スコアを生成してもよく、症状の中核(例えばPDのジスキネジア及び/又は動作緩慢)の進行をモニタするのを潜在的に支援してもよい。 In summary, this module estimates the same brain network as the brain network already estimated in animals and establishes the contribution of each cell type (and stimulation frequency) network description to quiescent human brain data. do. This unit may serve as a diagnostic tool and generate a set of neurophysiological scores that may further contribute to the development of new therapies (cell-specific and frequency-dependent trials). It may potentially assist in monitoring the progression of the core (eg, PD dyskinesia and / or bradykinesia).
細胞型
線条体内の全てのニューロンの90〜95%に相当する中型有棘ニューロン(MSN )は、2つの混合された亜集団を含んでいる。MSN の1つの亜集団は(物質P及びダイノルフィンと共に)高レベルのドーパミンD1受容体を発現し(D1-MSN)、他の亜集団は(エンケファリンと共に)高レベルのドーパミンD2受容体を発現する(D2-MSN)。
Medium-sized spiny neurons (MSNs), which represent 90-95% of all neurons in the cell-type striatum, contain two mixed subpopulations. One subpopulation of MSN expresses high levels of dopamine D1 receptors (with substance P and dynorphin) (D1-MSN) and the other subpopulation expresses high levels of dopamine D2 receptors (with enkephalin). (D2-MSN).
生物物理学的モデリングイニシアチブ
スペクトルDCM は、分布した神経回路網の結合されたニューロン変動の生物物理学的に妥当性のあるモデルから予測交差スペクトルを生成する決定論的モデルである。ニューラルマスモデリング(NMM )は、平均された発火頻度及び膜電位によって表される神経集団全体の平均活動を記述する。両方の手法は、非侵襲性の脳の画像測定法、つまりfMRI、MEG 及びEEG のための生成モデルとして使用されてもよい。
Biophysical Modeling Initiative Spectrum DCM is a deterministic model that produces predictive cross-spectrums from biophysically relevant models of connected neuronal variability in distributed neural networks. Neural mass modeling (NMM) describes the average activity of the entire neural population represented by the average firing frequency and membrane potential. Both methods may be used as non-invasive EEG imaging methods, namely generative models for fMRI, MEG and EEG.
実施例
以下の実施例は、開示された主題をどのように作製して使用するかについての完全な開示及び説明を当業者に提供するために記載されるのであって、本発明者らが自身の発明であるとみなすものの範囲を限定することを意図するものではなく、また、以下の実験が、行われた全ての又は唯一の実験であると表明することを意図するものでもない。使用された数値(例えば、量、温度等)に関して正確性を確保するために努力がなされたが、ある程度の実験誤差及び偏差は考慮に入れられるべきである。別途記載のない限り、部は重量部であり、分子量は重量平均分子量であり、温度は摂氏であり、圧力は大気圧であるか又は大気圧に近い圧力である。例えば、bp(塩基対)、kb(キロベース)、pl(ピコリットル)、s又はsec(秒)、min(分)、h又はhr(時)、aa(アミノ酸)、kb(キロベース)、bp(塩基対)、nt(ヌクレオチド)、i.m.(筋肉内)、i.p.(腹腔内)、s.c.(皮下)などの標準的な略語が使用され得る。
Examples The following examples are described to provide those skilled in the art with complete disclosure and explanation of how the disclosed subject matter is made and used, and the inventors themselves are themselves. It is not intended to limit the scope of what is considered to be an invention of the invention, nor is it intended to state that the following experiments are all or the only experiments performed. Efforts have been made to ensure accuracy with respect to the numbers used (eg, quantity, temperature, etc.), but some experimental error and deviation should be taken into account. Unless otherwise stated, parts are parts by weight, molecular weight is weight average molecular weight, temperature is in degrees Celsius, and pressure is at or near atmospheric pressure. For example, bp (base pair), kb (kilobase), pl (picolitre), s or sec (seconds), min (minutes), h or hr (hours), aa (amino acid), kb (kilobase), bp (base pair), nt (nucleotide), i. m. (Intramuscular), i. p. (Intra-abdominal cavity), s. c. Standard abbreviations such as (subcutaneous) may be used.
実施例1:マウスに光遺伝学機能的磁気共鳴画像法(ofMRI )を使用する運動制御の基礎となる全体的な脳回路機構の細胞型特異的調査
D1中型有棘ニューロン(MSN )及びD2中型有棘ニューロン(MSN )をインビボで選択的に駆動するために、ドーパミンD1受容体調節要素又はドーパミンD2受容体調節要素夫々の制御下でCre リコンビナーゼを発現する細菌人工染色体(BAC )トランスジェニックマウス系統を使用した。double-floxed inverted(DIO )組換えアデノ随伴ウイルス(AAV )2ウイルスが背内側線条体に注入されて、ChR2黄色蛍光タンパク質(YFP )をCre 発現ニューロンに発現させて、両方の経路の選択的な光遺伝学的制御を可能にする。直接路の抑制性中型有棘ニューロン(D1-MSN)及び間接路の抑制性中型有棘ニューロン(D2-MSN)がインビボで選択的に駆動され得ることを確認するために、背内側線条体の光遺伝学的刺激を20秒間繰り返している間の動物の回転行動を評価した。既に示されているように、両方の線条体のD1-MSN又はD2-MSNの片側刺激は強い対側回転及び同側回転を夫々生じさせた(図3C及び図3F;刺激期間及び非刺激期間の同側性/対側性の差に関するウィルコクソンの符号付順位検定;D1,p = 0.0005;D2,p = 0.002 )。
Example 1: Cell-type-specific investigation of the overall brain circuit mechanism underlying motor control using optogenetic functional magnetic resonance imaging (ofMRI) in mice
Expressing Cre recombinase under the control of dopamine D1 receptor regulators or dopamine D2 receptor regulators to selectively drive D1 medium spinous neurons (MSNs) and D2 medium spinous neurons (MSNs) in vivo. Bacterial artificial chromosome (BAC) transgenic mouse strains were used. Double-floxed inverted (DIO) recombinant adeno-associated virus (AAV) 2 virus is injected into the dorsomedial striatum to express ChR2 yellow fluorescent protein (YFP) in Cre-expressing neurons, selectively in both pathways. Enables optogenetic control. To confirm that the inhibitory medium spiny neurons (D1-MSN) of the direct tract and the inhibitory medium spiny neurons (D2-MSN) of the indirect tract can be selectively driven in vivo, the dorsomedial striatum. The rotational behavior of the animals was evaluated during 20 seconds of repeated optogenetic stimulation. As already shown, unilateral stimulation of D1-MSN or D2-MSN of both striatums produced strong contralateral and ipsilateral rotations, respectively (Fig. 3C and Fig. 3F; stimulation period and non-stimulation). Wilcoxon signed rank test for ipsilateral / contralateral differences in duration; D1, p = 0.0005; D2, p = 0.002).
D1-MSN及びD2-MSN両方の刺激により、刺激部位でのインビボ細胞外記録中に線条体の発火頻度が著しく増加した(図3B及び図3E)。抑制性D1-MSN及び抑制性D2-MSNによって駆動される脳全体のBOLD反応を評価するために、光遺伝学的D1-MSN刺激又は光遺伝学的D2-MSN刺激を20秒間繰り返している間の脳全体の機能的磁気共鳴画像法(fMRI)を行った。fMRI画像の取得は、スライディングウィンドウ再構成を用いて25×25mm2 の面内視野(FOV )及び0.36×0.36×0.5 mm3 の空間分解能を有するように設計されており、繰り返し時間(TR)毎に画像を更新した。2次元マルチスライスグラジェントエコーシーケンスは4インターリーブスパイラルリードアウト、750 msのTR及び12msのエコー時間を使用し、23の冠状スライスを得た。スパイラルk空間サンプルは、2次元グリッド再構成法によって再構成された。最後に、特注設計のGPU ベースのシステムを使用してリアルタイム動き補正を行った。反復刺激に著しく同期したものとしてアクティブボクセルを識別した。刺激部位でのローカル信号は、D1-MSN刺激及びD2-MSN刺激の両方に関して正であり(図3J)、抑制性ニューロンの活動が正のBOLD反応を誘発し得るという広く議論された問題点を確認したことが重要である。D2-MSN刺激はより大きな振幅のBOLD信号を生じさせたことが興味深い。これは、D2-MSNがより高い入力抵抗により所定量の電流注入に関してより興奮性を有することを示す以前の結果と十分一致している。 Both D1-MSN and D2-MSN stimulation significantly increased the frequency of striatal firing during in vivo extracellular recording at the site of stimulation (FIGS. 3B and 3E). While repeating optogenetic D1-MSN stimulation or optogenetic D2-MSN stimulation for 20 seconds to evaluate the brain-wide BOLD response driven by inhibitory D1-MSN and inhibitory D2-MSN A functional magnetic resonance imaging (fMRI) of the entire brain was performed. The acquisition of fMRI images is designed to have an in-plane field of view (FOV) of 25 × 25 mm 2 and a spatial resolution of 0.36 × 0.36 × 0.5 mm 3 using sliding window reconstruction, and per iteration time (TR). Updated the image to. The 2D multi-slice gradient echo sequence used 4 interleaved spiral readouts, a TR of 750 ms and an echo time of 12 ms to obtain 23 coronal slices. The spiral k-space sample was reconstructed by the two-dimensional grid reconstruction method. Finally, real-time motion compensation was performed using a custom-designed GPU-based system. Active voxels were identified as being significantly synchronized with repetitive stimuli. Local signals at the site of stimulation are positive for both D1-MSN and D2-MSN stimulation (Fig. 3J), addressing the widely discussed problem that inhibitory neuronal activity can elicit a positive BOLD response. It is important to confirm. It is interesting to note that the D2-MSN stimulation produced a larger amplitude BOLD signal. This is in good agreement with previous results showing that D2-MSNs are more excitatory with respect to a given amount of current injection due to higher input resistance.
その後、下流の基底核回路要素、例えば視床下核、黒質、淡蒼球、視床及び皮質を分割した(図3I)。技術開発によって提供される高画質により、これらの領域の信号の検出に成功することができた。従来、fMRI信号は、空気−組織界面近くのこれらの領域に信号ドロップアウト及び大きな画像のゆがみを有している。高度なシミング法が、画質を改善するために高速撮像と組み合わせて利用された。更に、ロバストでリアルタイムの動き補正の使用により、小核から生じる信号を分解する能力が大幅に高められた。 Subsequently, downstream basal ganglia circuit elements such as the subthalamic nucleus, substantia nigra, globus pallidus, thalamus and cortex were divided (Fig. 3I). Due to the high image quality provided by the technological development, we were able to succeed in detecting signals in these areas. Traditionally, fMRI signals have signal dropouts and large image distortions in these areas near the air-tissue interface. Advanced shimming methods have been used in combination with high-speed imaging to improve image quality. In addition, the use of robust, real-time motion correction has greatly enhanced the ability to decompose signals originating from the micronucleus.
図3A-3Jは、D1-MSN刺激及びD2-MSN刺激を用いたofMRI を示す。図3Aは、背内側線条体の20Hz D1-MSN 刺激により、平均発火頻度(n = 120 ,100 %)の増加(図3B)及び対側回転(n = 13,*** P<0.001 )の数の増加(図3C)が生じたことを示している。図3Dは、背内側線条体の20Hz D2-MSN 刺激により、平均発火頻度(n = 15,93%)の増加(図3E)及び同側回転(n = 11,** P<0.005)の数の増加(図3F)が生じたことを示している。図3G及び3Hは、グループに関する活性化マップがD1-MSN刺激及びD2-MSN刺激中に、基底核を含む皮質領域及び皮質下領域の大規模な調節を実証していることを示している。著しく変調されたボクセルは、20Hzの刺激を20秒間6回繰り返すサイクルに関する位相に応じて色分けされる。図3Iは、図3Jでの時系列抽出に使用された注目領域(ROI )を示す。図3Jは、各ROI 内でのD1-MSN刺激及びD2-MSN刺激中のアクティブボクセルの平均時系列(夫々、左/赤トレース及び右/青トレース)を示す。値は動物全体の平均値+/- s.e.m.である(n = 13(D1-MSN),11(D2-MSN))。反応の方向は、前方尾状核被殻及び淡蒼球外節(GPe )を除いて一般に反対である。
Figure 3A-3J shows of MRI with D1-MSN stimulation and D2-MSN stimulation. Figure 3A shows an increase in mean firing frequency (n = 120, 100%) and contralateral rotation (n = 13, *** P <0.001) due to 20 Hz D1-MSN stimulation of the dorsomedial striatum. It shows that an increase in the number of (Fig. 3C) has occurred. Figure 3D shows an increase in mean firing frequency (n = 15,93%) (Fig. 3E) and ipsilateral rotation (n = 11, ** P <0.005) due to 20 Hz D2-MSN stimulation of the dorsomedial striatum. It shows that an increase in the number (Fig. 3F) has occurred. Figures 3G and 3H show that activation maps for groups demonstrate extensive regulation of cortical and subcortical regions, including the basal ganglia, during D1-MSN and D2-MSN stimulation. Significantly modulated voxels are color coded according to the phase for a cycle of repeating a 20
GPe 、GPi 、STN 、SN、視床及び運動皮質を含む刺激部位以外の同側基底核−視床皮質ループの全ての領域では、所与の領域での誘発反応は、D1-MSN刺激とD2-MSN刺激との間で定性的に異なる時間的プロファイルを示した(図3J)。一般に、D1-MSN刺激中に正の反応が誘発された一方、D2-MSN刺激中に負の反応が誘発された。時間パターンのこれらの差を定量化するために、各ROI 内のアクティブボクセルの平均位相を比較した。この値は、モデル化されたデータに最良適合するシヌソイドの時間的な変化を表した(図4A)。前方尾状核被殻での変調されたボクセルの平均位相は、D1-MSN刺激とD2-MSN刺激との間で有意差がなかった(図4B及び4C;p>0.05,循環的なワトソン−ウィリアムズの検定)。対照的に、GPe 、Gpi 、STN 、SN、視床、及び皮質の12に分割された全ての領域での誘発反応は有意差があった(図4B及び4C;p<0.001 ,循環的なワトソン−ウィリアムズの検定)。誘発反応を更に特徴付けるために、次に各ROI の時系列の積分(ΣBOLD)を計算した(図4D)。前方尾状核被殻を除いて、全てのROI は、D1-MSN刺激中に正の平均ΣBOLD値を示し、D2-MSN刺激中に負の平均ΣBOLD値を示した。この差は、基底核の出力核GPi 及びSN、視床、及び12に分割された皮質領域の内の10を含む、ほとんどの試験されたROI に亘って有意であった(p<0.05;両側t検定)。 In all regions of the ipsilateral basal ganglia-thalamic cortex loop except for stimulation sites including GPe, GPi, STN, SN, thalamus and motor cortex, evoked responses in a given region are D1-MSN stimulation and D2-MSN. It showed a temporal profile that was qualitatively different from that of the stimulus (Fig. 3J). In general, a positive response was elicited during D1-MSN stimulation, while a negative response was elicited during D2-MSN stimulation. To quantify these differences in time patterns, the average phases of active voxels within each ROI were compared. This value represented the temporal variation of the sinusoid that best fits the modeled data (Fig. 4A). The mean phase of modulated voxels in the anterior caudate putamen was not significantly different between D1-MSN and D2-MSN stimulation (Fig. 4B and 4C; p> 0.05, cyclic Watson- Williams test). In contrast, evoked responses in all 12 divided regions of GPe, Gpi, STN, SN, thalamus, and cortex were significantly different (Fig. 4B and 4C; p <0.001, cyclic Watson-. Williams test). To further characterize the evoked response, the time series integral (ΣBOLD) of each ROI was then calculated (Fig. 4D). With the exception of the anterior caudate nucleus putamen, all ROIs showed a positive mean ΣBOLD value during D1-MSN stimulation and a negative mean ΣBOLD value during D2-MSN stimulation. This difference was significant across most tested ROIs, including the output nuclear GPi and SN of the basal ganglia, the thalamus, and 10 of the 12-divided cortical regions (p <0.05; bilateral t). Test).
図4A〜4Dは、D1-MSN刺激及びD2-MSN刺激が別個で反対のfMRI応答を駆動することを示している。図4Aは、2つのfMRI時系列に関する位相計算を示す。図4Bは、D1-MSN刺激及びD2-MSN刺激中の基底核視床皮質ループ内の位相値の分布を示す。太い矢印は動物全体の平均値を示す。前方尾状核被殻(刺激部位)を除いた全ての領域は著しく異なる位相値を示す(p<0.001 、循環的なワトソン−ウィリアムズの検定;D1-MSN刺激及びD2-MSN刺激夫々に関してn = 12動物及び11動物)。図4Cは、図4Bの循環的なワトソン−ウィリアムズの検定からのp値のヒストグラムを示す。図4Dは、D1-MSN刺激及びD2-MSN刺激間の統計的な比較結果を用いたROI 毎のΣBOLD値の定量化結果を示す。 Figures 4A-4D show that D1-MSN and D2-MSN stimuli drive separate and opposite fMRI responses. FIG. 4A shows a phase calculation for two fMRI time series. FIG. 4B shows the distribution of phase values within the basal ganglia thalamic cortex loop during D1-MSN and D2-MSN stimulation. The thick arrow shows the average value of the whole animal. All regions except the anterior caudate putamen (stimulation site) show significantly different phase values (p <0.001, cyclic Watson-Williams test; n = for D1-MSN and D2-MSN stimulation respectively. 12 animals and 11 animals). FIG. 4C shows a histogram of p-values from the cyclic Watson-Williams test of FIG. 4B. FIG. 4D shows the quantification result of the ΣBOLD value for each ROI using the statistical comparison result between the D1-MSN stimulus and the D2-MSN stimulus.
D1-MSN刺激及びD2-MSN刺激によって誘発されるBOLD反応の多様性を考慮すると、これら2つの反応の関係は、基本的なニューロン活動が次に検証されたことを反映していた。具体的には、ofMRI を用いて巨視的なスケールで測定された直接路及び間接路の反対の影響が、単一ユニットの活動レベルで更に存在した。従って、D1-MSN刺激及びD2-MSN刺激によって誘発される反応の差が夫々最小有意及び最大有意であり(図4C)、ΣBOLDの符号が2つの刺激グループで夫々同一及び反対である(図4D)線条体及び視床の細胞外記録を行った。D2-MSN刺激によって誘発される線条体のBOLD反応の大きさはD1-MSN刺激によって誘発される反応の大きさより僅かに大きいが、両方の時系列は、20Hzの光送達で明瞭且つ安定した増加を示した(図5A)。2つの代表的ニューロンからのペリイベントヒストグラムは、両方の経路の刺激によって誘発されるBOLDの増加が反復試験に亘って発火頻度の増加と関連付けられていることを示した(図5B)。実際、記録された略全てのユニットは発火頻度の著しい増加を示した(図5C;D1-MSN刺激及びD2-MSN刺激夫々に関して7動物全体でn=144/144 ユニット及び5動物全体でn=122/123 ユニット,p<0.05片側対応t検定)。線条体の刺激部位で観察されるBOLD信号とは異なり、視床のfMRI BOLD 信号はD1-MSN刺激及びD2-MSN刺激中に反対の反応を示した。具体的には、誘発される時系列は、D1-MSN刺激及びD2-MSN刺激夫々で顕著且つ確実な増加及び減少を示した(図5D)。2つの代表的ニューロンからのペリイベント時間ヒストグラムは、これらの変化が多くの反復試験で常に駆動され得るニューロン活動の対応する変化と関連付けられていることを示している(図5E)。実際、全ての記録されたニューロン全体で単一ユニットの95%は、D1-MSN刺激中に発火頻度の増加を示した(図5F;8動物全体でn=107/114 ユニット;p<0.05片側対応t検定)。D2-MSN刺激中に、記録されたユニットの1%のみが発火頻度の増加を示した(5動物全体でn=1/70ユニット;p<0.05片側対応t検定)。しかしながら、fMRI BOLD 信号と一致して、細胞の79%は、D2-MSN刺激中に発火頻度の減少を示した(図5F;n=55/70 )。従って、ofMRI で測定された視床活動の直接路及び間接路の広範囲の反対の影響がニューロンレベルで更に確認された。 Given the diversity of BOLD responses evoked by D1-MSN and D2-MSN stimuli, the relationship between these two responses reflected the next validation of basic neuronal activity. Specifically, the opposite effects of direct and indirect routes measured on a macroscopic scale using ofMRI were further present at the activity level of a single unit. Therefore, the difference in response evoked by D1-MSN stimulation and D2-MSN stimulation is the least significant and the maximum significant, respectively (Fig. 4C), and the sign of ΣBOLD is the same and opposite in the two stimulation groups, respectively (Fig. 4D). ) Extracellular recordings of the striatum and thalamus were performed. The magnitude of the striatal BOLD response evoked by D2-MSN stimulation was slightly greater than the magnitude of the response evoked by D1-MSN stimulation, but both time series were clear and stable with 20 Hz light delivery. It showed an increase (Fig. 5A). Perievent histograms from two representative neurons showed that stimulation-induced increases in BOLD in both pathways were associated with increased firing frequency over repeated trials (Fig. 5B). In fact, almost all recorded units showed a significant increase in firing frequency (Fig. 5C; n = 144/144 units in all 7 animals and n = in 5 animals for each of D1-MSN and D2-MSN stimulations). 122/123 units, p <0.05 one-sided t-test). Unlike the BOLD signal observed at the site of striatal stimulation, the thalamic fMRI BOLD signal showed the opposite response during D1-MSN and D2-MSN stimulation. Specifically, the evoked time series showed marked and definite increases and decreases with D1-MSN stimulation and D2-MSN stimulation, respectively (Fig. 5D). Perievent time histograms from two representative neurons show that these changes are associated with corresponding changes in neuronal activity that can always be driven in many iterative tests (Fig. 5E). In fact, 95% of single units across all recorded neurons showed increased firing frequency during D1-MSN stimulation (Fig. 5F; n = 107/114 units across 8 animals; p <0.05 unilateral). Corresponding t-test). During D2-MSN stimulation, only 1% of recorded units showed increased firing frequency (n = 1/70 units across 5 animals; p <0.05 one-sided student's t-test). However, consistent with the fMRI BOLD signal, 79% of cells showed reduced firing frequency during D2-MSN stimulation (Fig. 5F; n = 55/70). Therefore, the widespread opposite effects of direct and indirect tracts of thalamic activity measured by ofMRI were further confirmed at the neuronal level.
図5A〜5Fは、ニューロン活動がD1-MSN刺激及びD2-MSN刺激中に線条体及び視床で誘発されるfMRI応答の極性を反映させることを示す。図5Aは、D1-MSN刺激及びD2-MSN刺激の両方が顕著な正のfMRI応答を駆動することを示している。動物全体の平均±s.t.e(D1及びD2夫々に関してn=12及び11)。図5Bでは2つの代表的ニューロンのペリイベント時間ヒストグラムが、直接路刺激中及び間接路刺激中の両方で線条体のニューロン活動の即時且つ持続的な増加を示している。図5Cは、D1-MSN刺激及びD2-MSN刺激中に線条体の記録された略全ての細胞が発火頻度を増加させていることを示している。図5Dは、D1-MSN刺激が顕著な正のBOLD反応を駆動する一方、D2-MSN刺激が視床で顕著な負の反応を駆動することを示している。動物全体の平均±s.t.e(D1及びD2夫々に関してn=12及び11)。図5Eは、直接路の刺激がニューロン活動の持続的増加を誘発する一方、間接路の刺激がニューロン活動の即時且つ持続的な減少を誘発することを示している。図5Fは、D1-MSN刺激中に記録された略全ての細胞が発火頻度を増加させている一方、D2-MSN刺激中に記録されたユニットの大部分が発火頻度を減少させていることを示している。 Figures 5A-5F show that neuronal activity reflects the polarity of the fMRI response evoked in the striatum and thalamus during D1-MSN and D2-MSN stimulation. FIG. 5A shows that both D1-MSN and D2-MSN stimuli drive a prominent positive fMRI response. Average for the whole animal ± s.t.e (n = 12 and 11 for D1 and D2 respectively). In FIG. 5B, perievent time histograms of two representative neurons show an immediate and sustained increase in striatal neuronal activity during both direct and indirect tract stimulation. FIG. 5C shows that almost all recorded striatal cells increased firing frequency during D1-MSN and D2-MSN stimulation. Figure 5D shows that the D1-MSN stimulus drives a prominent positive BOLD response, while the D2-MSN stimulus drives a prominent negative response in the thalamus. Average for the whole animal ± s.t.e (n = 12 and 11 for D1 and D2 respectively). Figure 5E shows that direct tract stimulation induces a sustained increase in neuronal activity, while indirect tract stimulation induces an immediate and sustained decrease in neuronal activity. Figure 5F shows that almost all cells recorded during D1-MSN stimulation increased firing frequency, while most of the units recorded during D2-MSN stimulation decreased firing frequency. Shows.
実施例2:全脳回路の基底核経路の動的調節の計算モデリング
動的因果モデル(DCM )の概要
DCM は、一連の特定の摂動、つまり実験タスク中に相互に結合された領域の動的系として脳をモデル化する。ここで、摂動は実施例1に示されている光刺激であった。u(t)によって定められる単一入力が光遺伝学的操作の影響、つまり0及び1の二乗関数をコード化すると仮定すると、光遺伝学fMRI(ofMRI )応答に関するDCM の状態式及び測定式は以下の通りである。
状態モデル:(dx(t)/dt)=f(x(t),θn,u(t))=Ax(t)+Cu(t)+ω(t)
測定モデル:y(t)=g(θh)×x(t)+ε(t)
(式1 時間領域のofMRI 応答に関するDCM の状態式及び測定式)
Example 2: Computational modeling of dynamic regulation of basal ganglia pathways in whole brain circuits Overview of dynamic causal model (DCM)
DCM models the brain as a series of specific perturbations, the dynamic systems of interconnected regions during an experimental task. Here, the perturbation was the light stimulus shown in Example 1. Assuming that the single input defined by u (t) encodes the effect of optogenetic manipulation, that is, the squared function of 0 and 1, the DCM state and measurement equations for optogenetic fMRI (ofMRI) responses are It is as follows.
State model: (dx (t) / dt) = f (x (t), θ n , u (t)) = Ax (t) + Cu (t) + ω (t)
Measurement model: y (t) = g (θ h ) × x (t) + ε (t)
(Equation 1-hour region of MRI response DCM state and measurement equations)
ここで、x(t)がニューロン状態を表し、θn =(A, C)はニューロンパラメータであり、Aは内在的結合強度のマトリクスであり、Cは光遺伝学的入力の強度を示し、g(θh)は、血管拡張、血流、血液量及びデオキシヘモグロビン量の変化によってニューロン状態x(t)を予測されるBOLD信号y(t)に関連付ける非線形畳み込み演算子であり、θh は血液動態パラメータである。 Where x (t) represents the neuron state, θ n = (A, C) is the neuron parameter, A is the matrix of intrinsic binding strength, and C is the strength of the optogenetic input. g (θh) is a non-linear convolution operator that associates the neuronal state x (t) with the predicted BOLD signal y (t) by changes in vasodilation, blood flow, blood volume and deoxyhemoglobin volume, where θ h is blood. It is a dynamic parameter.
スペクトルDCM
スペクトルDCM は、分布した神経回路網の結合されたニューロン変動の生物物理学的に妥当性のあるモデルから予測交差スペクトルを生成する決定論的モデルに基づいている。
Spectrum DCM
The spectral DCM is based on a deterministic model that produces a predictive cross-spectrum from a biophysically valid model of connected neuronal variability in a distributed neural network.
スペクトルDCM を使用して細胞型特異的ofMRI データをモデル化した。ニューロンレベル、つまりω(t) 及び観察レベル、つまりε(t) での変動をパラメータ化する一次の自己回帰モデル、つまりAR(1) プロセス(式1)は、以下のように周波数領域で書き換えられた。
状態モデル:X(f)=(j2πf−A)-1(CU(f)+ω(f))
測定モデル:y(f)=G(θh)(j2πf−A)-1(CU(f))+ω(f)+ε(f)
(式2 周波数領域のofMRI 応答に関するDCM の状態式及び測定式)
クロススペクトル応答:Gy(f)=Y(f)Y(f)*=S(f)Gi(f)S(f)*+Gε(f)
(式3 クロススペクトル応答)
Cell type-specific of MRI data were modeled using spectral DCM. The first-order autoregressive model that parameters the variability at the neuron level, ω (t) and the observation level, ε (t), the AR (1) process (Equation 1), is rewritten in the frequency domain as follows: Was done.
State model: X (f) = (j2πf−A) -1 (CU (f) + ω (f))
Measurement model: y (f) = G (θ h ) (j2πf−A) -1 (CU (f)) + ω (f) + ε (f)
(
Cross-spectrum response: G y (f) = Y (f) Y (f) * = S (f) G i (f) S (f) * + G ε (f)
(
ここで、Gu(f)=PSD{u(t)}、 Here, G u (f) = PSD {u (t)},
Gu(f) は実験入力のパワースペクトル密度(PSD )であり、Gω(f)は、一次の自己回帰プロセスとしてパラメータ化された内在的神経変動のスペクトル密度であり、Gε(f)は、一次の自己回帰プロセスとして更にパラメータ化された観察ノイズのスペクトル密度である。 G u (f) is the power spectral density (PSD) of the experimental input, and G ω (f) is the spectral density of the intrinsic neural variation parameterized as a first-order autoregressive process, G ε (f). Is the spectral density of the observed noise further parameterized as a first-order autoregressive process.
![]()
![]()
AR1,ω及びAR1,εは対応する自己回帰係数である。S(f)=G(θh)(j2πf−A)-1は伝達関数(TF)を示し、Gi(f)=CGu(f)CT+Gω(f)は入力関数を示す。この数式を用いて、内在的神経変動、つまりGω(f)項(確率論的モデリング)を含めることができるか、又は内在的神経変動を含めることができない(決定論的モデリング)。 AR 1, ω and AR 1, ε are the corresponding autoregressive coefficients. S (f) = G (θ h ) (j2πf−A) -1 indicates the transfer function (TF), and G i (f) = CG u (f) C T + G ω (f) indicates the input function. This formula can be used to include intrinsic neural fluctuations, ie the G ω (f) term (stochastic modeling), or cannot include intrinsic neural fluctuations (deterministic modeling).
モデル反転及びベイズモデル選択(BMS )
式3に記述されているクロススペクトル応答を使用して、ラプラス近似の条件下で変動自由エネルギを用いてモデルを反転した。この研究では、負の自由エネルギの推定値がログモデル証拠への近似として使用された。モデリングの最適なタイプ(つまり、確率論的又は決定論的)を選択するために、fMRI応答のためのベイズモデル選択(BMS )を使用した。この設定では、最適なモデルの検索が適合と複雑性との最良のバランスを表すモデルの選択に対応した。被験体全体の潜在的な不均一性を説明するグループレベルの変量効果BMS 機構を更に使用した。神経変動を含めることにより、モデルが更に適合された。
Model inversion and Bayesian model selection (BMS)
The cross-spectrum response described in
結果
ofMRI を使用して基底核経路に関する2つの細胞型の寄与を調査した。このモデリングユニット内では、スペクトルDCM (spDCM )を使用して脳領域間の有効な結合性を推定した。刺激部位と同側の尾状核−被殻態様(CPu )、淡蒼球外節(GPe )、淡蒼球内節(GPi )、視床下核(STN )、黒質(SN)、視床(THL )及び運動皮質(MOT )態様から構成された7つのノードの脳回路網をモデル化した。モデルを制限するために、文献の解剖学的結合性情報を検索して、神経生物学的に妥当性のある候補(図6)間のデータに関する最も可能性の高い生成モデルを選択した。
result
We investigated the contribution of two cell types to the basal ganglia pathway using ofMRI. Within this modeling unit, spectral DCM (spDCM) was used to estimate effective connectivity between brain regions. Caudate nucleus-putamen aspect (CPu), external globus pallidum (GPe), internal globus pallidum (GPi), subthalamic nucleus (STN), substantia nigra (SN), thalamic (SN) on the ipsilateral side of the stimulation site We modeled a brain network of seven nodes composed of THL) and motor cortex (MOT) aspects. To limit the model, the anatomical connectivity information in the literature was searched to select the most probable generative model for the data between the neurobiologically valid candidates (FIG. 6).
20HzのD1-MSN刺激及びD2-MSN刺激での測定されたofMRI 応答を、スペクトルDCM を使用してモデル化した。1つの領域から他の領域への情報の流れ全体を定量化する結合性(解剖学的結合性ではない)を、スペクトルDCM を使用して推定した(図7A〜7C)。結果は、結合性推定値が2つのニューロンタイプの刺激の間で著しく異なり、2つの経路の別個の動態を反映していることを明瞭に示した。より具体的には、基底核の2つの出力核への線条体の結合は、D2-MSN刺激と比較してD1-MSN刺激中により大きく、この結果は文献に十分裏付けられている。同様に、運動皮質から視床への結合はD1実験で更により大きかった。他方で、視床下核から黒質への結合はD2操作でより強く、運動皮質から視床下核への結合はD2操作で負の極性を有した。 The measured of MRI responses at 20 Hz D1-MSN and D2-MSN stimuli were modeled using spectral DCM. Connectivity (not anatomical connectivity) that quantifies the entire flow of information from one region to another was estimated using spectral DCM (Figs. 7A-7C). The results clearly show that the connectivity estimates differ significantly between the two neuronal type stimuli and reflect the distinct dynamics of the two pathways. More specifically, the binding of the striatum to the two output nuclei of the basal ganglia is greater during D1-MSN stimulation compared to D2-MSN stimulation, and this result is well supported in the literature. Similarly, the connection from the motor cortex to the thalamus was even greater in the D1 experiment. On the other hand, the binding from the subthalamic nucleus to the substantia nigra was stronger with D2 manipulation, and the binding from the motor cortex to the subthalamic nucleus had negative polarity with D2 manipulation.
従って、基底核回路の古典的モデルと一致するD1-MSN直接路に、線条体(Cpu )から淡蒼球内節(Gpi )及び黒質(SN)への直接の情報の流れのみが存在した。他方では、視床下核(STN )からSNへの情報の流れのみがD2-MSN間接路に存在した。これらの結果は、D2-MSNのベータ帯域刺激によって、運動皮質からSTN への強い抑制的影響がもたらされるという機械論的な関連付けの可能性(図7B)が提供される。 Therefore, in the D1-MSN direct path, which is consistent with the classical model of the basal ganglia circuit, there is only a direct flow of information from the striatum (Cpu) to the internal globus pallidum (Gpi) and substantia nigra (SN). did. On the other hand, only the flow of information from the subthalamic nucleus (STN) to the SN was present in the D2-MSN indirect pathway. These results provide the possibility of a mechanistic association that beta-band stimulation of D2-MSN results in a strong inhibitory effect from the motor cortex on STN (Fig. 7B).
図7A〜7Cは、基底核経路によって駆動される全脳回路機能のスペクトル動的因果モデリングを示す。20HzのD1-MSN刺激及びD2-MSN刺激を用いたofMRI データのスペクトル動的因果モデルによって、基底核経路全体の結合性(情報の流れ)が定量的に推定される。図7Aは20HzのD1-MSN刺激を用いた結合性を示し、図7Bは20HzのD2-MSN刺激を用いた結合性を示す。図7Cは、D1(黒)MSN刺激実験及びD2(灰色)MSN刺激実験に関する平均結合性推定値を示す。黒い星印は、統計的に有意な結合を示す位置を表す。* p<0.1 、** p<0.01 、*** p<0.001 。 Figures 7A-7C show spectral dynamic causal modeling of whole-brain circuit function driven by the basal ganglia pathway. Spectral dynamic causal models of of MRI data using 20 Hz D1-MSN and D2-MSN stimuli quantitatively estimate the connectivity (information flow) of the entire basal ganglia pathway. FIG. 7A shows the binding with the 20Hz D1-MSN stimulus, and FIG. 7B shows the binding with the 20Hz D2-MSN stimulus. FIG. 7C shows mean binding estimates for D1 (black) MSN stimulation experiments and D2 (gray) MSN stimulation experiments. Black asterisks represent positions that show statistically significant binding. * p <0.1, ** p <0.01, *** p <0.001.
実施例3:運動障害を細胞精度で診断するためのヒトfMRIデータの定量的モデリング
K23 NS075097及びP50 AG047366(Stanford ADRC)の一部として既に収集されたデータを使用する。5年のプロジェクトの間に、498 個体からの画像データを使用する。具体的には、パーキンソン病(PD)の245 人の患者、及びこれら2つの研究からの243 の神経生物学的に正常な対照データをこの計画に含める。研究仮説がこれらの集団に関係するので、軽度認知障害を有する被験体が含まれている。K23 からの118 の参加者(断続的な薬剤投与中の80のPD及び38の正常対照)は既に募集されており、全ての研究手順を完了した。P50 AG047366(Stanford ADRC)からの残りの370 の参加者(断続的な薬剤投与中の165 のPD及び205 の正常対照)は現在募集されている。スキャンに関して、厚さが4.0 mmの29の軸スライスを得て、2秒の繰り返し時間、30ミリ秒のエコー時間、80°のフリップ角、20cmの視野及び3.125 mmの面内空間分解能を与える64×64のマトリクスサイズのパラメータと共にT2* 強調グラジェントエコースパイラルイン−アウトパルスシーケンスを用いて、全脳をカバーするAC−PCラインと平行に0.5 mmのスキップで収集した。ADRCデータは、490 msのTR、30msのTE、45°のフリップ角、3mmの等方分解能で収集される。42スライスを取得する6(同時的に取得されるスライスの数)の加速係数、[1;5;2;6;3;7;4] の取得順序及び222 ×222 mmの視野と共にマルチバンド取得を使用する。
Example 3: Quantitative modeling of human fMRI data for diagnosing motor disorders with cell accuracy
Use the data already collected as part of K23 NS075097 and P50 AG047366 (Stanford ADRC). Image data from 498 individuals will be used during the 5-year project. Specifically, 245 patients with Parkinson's disease (PD) and 243 neurobiologically normal control data from these two studies will be included in this plan. Subjects with mild cognitive impairment are included because the study hypothesis relates to these populations. 118 participants from K23 (80 PDs and 38 normal controls on intermittent drug administration) were already recruited and completed all study procedures. The remaining 370 participants from P50 AG047366 (Stanford ADRC) (165 PDs and 205 normal controls on intermittent drug administration) are currently being recruited. For scanning, obtain 29 axial slices with a thickness of 4.0 mm and give a repeat time of 2 seconds, an echo time of 30 ms, a flip angle of 80 °, a field of view of 20 cm and an in-plane spatial resolution of 3.125 mm 64. Collected with a 0.5 mm skip parallel to the AC-PC line covering the entire brain using a T2 * -enhanced gradient echo spiral in-out pulse sequence with a matrix size parameter of × 64. ADRC data is collected with TR of 490 ms, TE of 30 ms, flip angle of 45 °, and isotropic resolution of 3 mm. Multi-band acquisition with 42 acceleration factors of 6 (number of slices acquired simultaneously) to acquire 42 slices, acquisition order of [1; 5; 2; 6; 3; 7; 4] and a field of view of 222 × 222 mm. To use.
実施例4:光遺伝学fMRIのための動的因果モデリングを用いた脳回路機能
概要
脳全体の同時的な測定から動的且つ細胞型特異的な結合性マップを開発するために実験を行った。このような動的因果モデリング(DCM )に関して光遺伝学fMRI実験を行い、細胞型特異的な脳全体の機能的な測定結果を得ることが可能になり、細胞型特異性を用いて分布した脳回路網の領域間の因果関係をパラメータ化するために使用した。脳全体の基底核−視床皮質回路網に適用されると、DCM は経験的に観察される時系列を正確に再現し、最も強い結合が光遺伝学的に刺激された経路の重要な結合であった。動的結合性の定量的且つ細胞型特異的な記述を使用して、神経回路の動態のシステムレベルでの理解を確定し、より有効な神経調節治療法の設計を容易にすることが可能である。
Example 4: Outline of brain circuit function using dynamic causal modeling for optogenetics fMRI An experiment was conducted to develop a dynamic and cell-type specific connectivity map from simultaneous measurements of the entire brain. .. Optogenetics fMRI experiments can be performed on such dynamic causal modeling (DCM) to obtain functional measurement results of the entire cell type-specific brain, and the brain distributed using cell type specificity. Used to parameterize causal relationships between regions of the network. When applied to the basal ganglia-thalamic cortex network throughout the brain, DCM accurately reproduces the empirically observed time series, with the strongest connections being important connections in optogenetically stimulated pathways. there were. Quantitative and cell-type-specific descriptions of dynamic connectivity can be used to establish a system-level understanding of neural circuit dynamics and facilitate the design of more effective neuromodulatory therapies. be.
導入部
神経系の重要な機能の多くは、運動制御を担う基底核−視床皮質回路を含む脳全体の大規模な分布した回路網によって調整される。多数の脳領域とニューロン集団との有効な結合性が、運動制御の基礎となる回路機構を理解するために決定された。有効な結合性は、脳領域間の因果結合又は指令された結合として従来、定められている一方、機能的な結合性は、脳領域間の相関関係を指す。これらの因果関係を決定することにより、基底核に関わる神経疾患の更なる理解を促進して、パーキンソン病のための脳深部刺激(DBS )のような運動障害のための治療法の最適化を可能にする。
Many of the key functions of the introductory nervous system are coordinated by a large, distributed network throughout the brain, including the basal ganglia-thalamic cortex circuit responsible for motor control. Effective connectivity between multiple brain regions and neuronal populations was determined to understand the circuit mechanisms underlying motor control. Effective connectivity is traditionally defined as causal or directed binding between brain regions, while functional connectivity refers to correlation between brain regions. Determining these causal relationships facilitates a better understanding of neurological disorders involving the basal ganglia and optimizes treatments for movement disorders such as deep brain stimulation (DBS) for Parkinson's disease. enable.
機能的MRI (fMRI)により、血液酸素濃度依存性(BOLD)信号のような代わりの血液動態反応を通じて大規模な脳回路網に亘る神経活動が非侵襲的に測定される。基底核−視床皮質回路網は細胞型特異的な回路網機能を定めるために使用され得る。線条体−基底核の主要な入力構造は、周囲の基底核の神経核に固有の抑制性投射を送信するD1受容体発現中型有棘ニューロン(D1-MSN)及びD2受容体発現中型有棘ニューロン(D2-MSN)を含む別個の細胞型を有している。D1-MSNは、基底核の2つの出力核、つまり淡蒼球内節及び黒質網様部に直接突出しており、下流の視床皮質回路の脱抑制によって運動行動を促進すると考えられている一方、D2-MSNは、淡蒼球外節及び視床下核を介して2つの出力核に間接的に突出しており、視床皮質回路を抑制することにより運動を抑制すると考えられている。 Functional MRI (fMRI) non-invasively measures neural activity across large brain networks through alternative hemokinetic responses such as blood oxygen concentration-dependent (BOLD) signals. The basal ganglia-thalamic cortex network can be used to define cell type-specific network functions. The major input structures of the striatum-basal ganglia are D1 receptor-expressing medium-sized spiny neurons (D1-MSN) and D2 receptor-expressing medium-sized spines that send inhibitory projections specific to the nucleus of the surrounding basal ganglia. It has a distinct cell type containing neurons (D2-MSN). While D1-MSN projects directly into the two output nuclei of the basal ganglia, the internal globus pallidum and the substantia nigra pars reticulata, it is thought to promote motor behavior by desuppressing the downstream thalamic cortex circuit. , D2-MSN indirectly protrudes into two output nuclei via the external globus pallidum and the subthalamic nucleus, and is thought to suppress movement by suppressing the thalamic cortical circuit.
光遺伝学fMRI(ofMRI )は、細胞型特異的な摂動によって生じる脳全体に亘る機能活動のモニタリングに使用され得る。例えば、基底核−視床皮質回路網に亘る活動の反対のパターンは、D1-MSN又はD2-MSNの選択的な刺激で特徴付けられた。脳全体に亘る時間信号パターンは正確に追跡され、基本的な単一ユニット電気生理学と略一致することが分かっている。 Optogenetics fMRI (ofMRI) can be used to monitor functional activity throughout the brain caused by cell-type-specific perturbations. For example, the opposite pattern of activity across the basal ganglia-thalamic cortex network was characterized by selective stimulation of D1-MSN or D2-MSN. Time signal patterns throughout the brain have been accurately tracked and have been found to be in good agreement with basic single-unit electrophysiology.
本明細書で行われている実験では、動的因果モデリング(DCM )を使用して、細胞型特異性を有する分布した脳回路網の領域間の因果関係をパラメータ化した。DCM は、神経画像データの様々な回路網モデルに関する結合(有効な結合性)及び証拠を推定することを可能にするベイズ手法である。非線形モデル、確率手法及びスペクトル構築を含む幅広い種類のモデルを使用してもよい。確率論的DCM では、有効な結合性及び内在的(ニューロン)変動の両方が推定される。同時EEG-fMRI記録を使用して確率論的DCM が神経生物学的検証の対象にされて高い再現性を提示することが示された。スペクトルDCM (spDCM )は内在的変動をパラメータ化して、ニューロン活動の決定論的モデルを適合させ、確率論的DCM と比較して計算速度を著しく上昇させる。 In the experiments performed herein, dynamic causal modeling (DCM) was used to parameterize causal relationships between distributed brain network regions with cell type specificity. DCM is a Bayesian technique that makes it possible to estimate coupling (effective connectivity) and evidence for various network models of neuroimaging data. A wide variety of models may be used, including non-linear models, stochastic methods and spectral construction. Probabilistic DCM estimates both effective connectivity and intrinsic (neuronal) variability. Using simultaneous EEG-fMRI recordings, probabilistic DCM has been shown to be the subject of neurobiological validation and present high reproducibility. Spectral DCMs (spDCMs) parameterize intrinsic variability to fit deterministic models of neuronal activity and significantly increase computational speed compared to stochastic DCMs.
この実施例では、スペクトルDCM を使用して、細胞型特異性を有する基底核−視床皮質回路網領域間の相互作用を調査し、観察された活性化パターンを有効な結合性強度を表す定量パラメータに関連付けた。動的因果モデリング手法を使用して、基底核を越えて細胞型特異性を有する脳全体の回路網を実証する機能的関係性を決定した。 In this example, a spectral DCM is used to investigate the interaction between the basal ganglia-thalamic cortex network region with cell type specificity, and the observed activation pattern is a quantitative parameter that represents the effective binding strength. Associated with. Dynamic causal modeling techniques were used to determine functional relationships demonstrating a whole brain network with cell-type specificity across the basal ganglia.
結果
ofMRI データの動的因果モデリング
D1-MSN刺激ofMRI データ及びD2-MSN刺激ofMRI データを計算的にモデル化して有効な結合強度を識別するために、スペクトルDCM を使用した。fMRIに関して、DCM を時系列に直接適合させる(標準DCM)、又はフーリエ変換を適用した後のデータの相互スペクトル密度に適合させる(スペクトルDCM )ことができる。標準DCM 及びスペクトルDCM の両方は、実験効果を越えて内在的変動を更に含むことができる。実験効果及び内在的変動は通常共に考慮されないが、この実施例で使用されるfMRI時系列は、光遺伝学的に制御される実験刺激(つまり決定論的入力)下で導き出され、同一データの決定論的モデル及び確率論的モデルの比較を可能にした。確率論的な内在的変動がデータを説明するために必要であるか否かを更に決定した。従って、内在的変動を有するスペクトルDCM 及び内在的変動を有さないスペクトルDCM を用いてベイズモデルの比較を行った。スペクトルDCM の適合の質を定量化するために、スペクトルDCM からの事後推定は標準(確率論的)DCM で事前推定として使用され、時系列は再度反転された。このため、その後、観察された信号と比較される時間領域の予測反応が与えられた。回路網モデルが、既知の基底核の解剖学的構造に基づき先験的生成モデルとして使用するために選択された。尾状核−被殻(CPu )、淡蒼球外節(GPe )、淡蒼球内節(GPi )、視床下核(STN )、黒質(SN)、視床(THL )及び運動皮質(MCX )を含む7つのノード脳回路網を使用した。運動皮質を感覚皮質(SCX )に置き換えることにより定められる代替の回路網を更にモデル化して、回路網に対する摂動の際の結合性推定値の安定性として本明細書に定められている回路網の安定性を検査した。
result
Dynamic causal modeling of ofMRI data
Spectral DCMs were used to computationally model D1-MSN stimulus of MRI and D2-MSN stimulus of MRI data to identify effective binding strengths. For fMRI, the DCM can be adapted directly to the time series (standard DCM) or to the mutual spectral density of the data after applying the Fourier transform (spectral DCM). Both standard and spectral DCMs can further include intrinsic variability beyond the experimental effect. Experimental effects and intrinsic variability are usually not considered either, but the fMRI time series used in this example are derived under optogenetically controlled experimental stimuli (ie, deterministic inputs) and of the same data. Allowed comparison of deterministic and stochastic models. It was further determined whether stochastic intrinsic variability was necessary to explain the data. Therefore, Bayesian models were compared using a spectral DCM with intrinsic variability and a spectral DCM without intrinsic variability. To quantify the quality of the fit of the spectral DCM, the post-estimation from the spectral DCM was used as a pre-estimation in the standard (stochastic) DCM and the time series was inverted again. For this reason, a predictive response in the time domain compared to the observed signal was then given. A network model was selected for use as an a priori generative model based on the known basal ganglia anatomy. Caudate nucleus-putamen (CPu), external globus pallidum (GPe), internal globus pallidum (GPi), subthalamic nucleus (STN), substantia nigra (SN), thalamus (THL) and motor cortex (MCX) ) Was used, and a 7-node brain network including) was used. Further modeling the alternative network defined by replacing the motor cortex with the sensory cortex (SCX), of the network defined herein as the stability of connectivity estimates during perturbations to the network. The stability was inspected.
解剖学的な注目領域がノード毎に定められ、ボクセル平均されたfMRI時系列が抽出された(図9A〜図9D)。図10A 及び図10B は、研究全体に亘って使用された生成モデルの先験的結合機構を示す。結合性推定値が、時系列を10の異なる遮断周波数でローパスフィルタした後に計算され、各結合の有意性が、被験体全体で結合性推定値をゼロに対して試験することにより各遮断周波数で決定された(D1:n = 12及びD2:n = 10)。偽発見率(FDR )を使用して、(被験体間レベルで)回路網結合の多くの試験に関して生じるp値を補正した。p値の有意な変動性が遮断周波数全体で観察された(図11)。モデルの最終出力に関して、有意な結合及び略有意な結合の数の加重和を最大化するフィルタ遮断周波数を選択した。0.05未満の補正されたp値を有する結合が有意とみなされた一方、0.05と0.10との間の補正されたp値を有する結合は略有意とみなされた。D1-MSN刺激及びD2-MSN刺激並びにMCX 回路網及びSCX 回路網下で結合を比較するとき、統計的有意性のために同一の基準を適用した。 Anatomical areas of interest were defined for each node and voxel-averaged fMRI time series were extracted (FIGS. 9A-9D). Figures 10A and 10B show the a priori coupling mechanism of the generative model used throughout the study. Coupling estimates are calculated after lowpass filtering the time series at 10 different cutoff frequencies, and the significance of each binding is at each cutoff frequency by testing the binding estimates against zero across the subject. Determined (D1: n = 12 and D2: n = 10). False discovery rate (FDR) was used to correct the p-values that occurred for many tests of network coupling (at the intersubject level). Significant volatility of the p-value was observed across the cutoff frequency (Fig. 11). For the final output of the model, a filter cutoff frequency was selected that maximizes the weighted sum of the number of significant and approximately significant bonds. Bindings with a corrected p-value of less than 0.05 were considered significant, while bonds with a corrected p-value between 0.05 and 0.10. The same criteria were applied for statistical significance when comparing D1-MSN and D2-MSN stimuli as well as binding under the MCX and SCX networks.
モデル内の内在的変動及び観察ノイズパラメータをモデル化するために、振幅係数及び自己回帰モデル係数によってパラメータ化された一次〜四次の自己回帰モデルを使用した。上記に記載されているように、各回路網の内在的変動の重要性が、確率論的モデリング及び決定論的モデリングに関するモデル方程式で内在的変動を有する結果及び内在的変動を有さない結果を夫々比較することにより更に決定された。特に、変量効果ベイズモデル選択(BMS )を使用して、最大のモデル証拠を与える2つのモデリング手法のいずれか、言い換えれば正確性と複雑性との最良のバランスを選択し、自己回帰プロセスの最適な順序を調べた。本明細書に記述されている実験は、自己回帰モデリング、内在的変動を有するモデル及び内在的変動を有さないモデルの比較、並びにローパスフィルタ遮断周波数の最適化された選択を含んでいる。 To model the intrinsic variation and observed noise parameters in the model, a first-order to fourth-order autoregressive model parameterized by the amplitude and autoregressive model coefficients was used. As described above, the importance of the intrinsic variability of each network has the consequences of having intrinsic variability and no intrinsic variability in the model equations for stochastic and deterministic modeling. It was further determined by comparing each. In particular, we use random effects Bayesian model selection (BMS) to choose one of the two modeling techniques that give the greatest model evidence, in other words the best balance between accuracy and complexity, and optimize the autoregressive process. I checked the order. The experiments described herein include autoregressive modeling, comparison of models with and without intrinsic variability, and optimized selection of lowpass filter cutoff frequencies.
D1-MSN刺激回路網及びD2-MSN刺激回路網
D1-MSN刺激中の有意な結合は直接路の活性化とほとんど一致した(図12A 及び12D )。被験体全体の95%信頼区間、補正されていないp値及び補正されたp値と共に平均結合性推定値が、図13に示されている表3に記載されている。注目すべきことに、MCX 回路網及びSCX 回路網の両方で最も強い結合性推定値を示す投射がCPu からGPi (MCX 回路網の平均結合性推定値:0.9177Hz,p値[補正]:0.0072)であり、CPu からSN(MCX 回路網の平均結合性推定値:0.9155Hz,p値[補正]:3.6572×10⁻⁵)であり、これらは直接路の2つの定められた結合である。標準(確率論的)DCM で事前推定としてスペクトルDCM からの事後推定を使用する際に、結果として生じる時系列は、MCX 回路網モデル及びSCX 回路網モデルの両方に関して脳領域全体に亘る経験的に観察されたBOLD反応の振幅、極性及び遅延を再現した(図12B 及び12E )。一般に、(内在的変動を有する)確率論的モデルは決定論的モデルより優れていた。MCX 回路網では、確率論的モデリングの超過確率(つまり、このモデリング手法が考慮対象のあらゆる他のモデリング手法より可能性が高い確率)は0.9148であった(図12C )。SCX 回路網では、確率論的モデリングのモデル超過確率は0.5918であった(図12F )。
D1-MSN stimulation network and D2-MSN stimulation network
Significant binding during D1-MSN stimulation was almost consistent with direct tract activation (Figs. 12A and 12D). Mean binding estimates along with 95% confidence intervals for the entire subject, uncorrected p-values and corrected p-values are shown in Table 3 shown in FIG. Notably, the projections showing the strongest coupling estimates in both the MCX and SCX networks are from CPu to GPi (MCX network average coupling estimates: 0.9177Hz, p-value [correction]: 0.0072. ), From CPu to SN (MCX network average coupling estimate: 0.9155Hz, p value [correction]: 3.6572 × 10 -5 ), and these are two defined couplings of the direct path. When using post-estimation from a spectral DCM as a pre-estimation in a standard (stochastic) DCM, the resulting time series is empirical across the brain region for both the MCX and SCX network models. The amplitude, polarity and delay of the observed BOLD reaction were reproduced (Figs. 12B and 12E). In general, stochastic models (with intrinsic variability) were superior to deterministic models. In the MCX network, the overprobability of stochastic modeling (that is, the probability that this modeling method is more likely than any other modeling method considered) was 0.9148 (Figure 12C). In the SCX network, the model excess probability for stochastic modeling was 0.5918 (Fig. 12F).
D2-MSN刺激に対する脳全体のfMRI応答はD1-MSN刺激によって誘発されるfMRI応答とは著しく異なった。特に、皮質下領域の多くが刺激中に信号の減少を示した。上述した同一の先験的回路網を使用することにより、間接路の活性化を反映した有意な結合がもたらされたことが重要である(図14A 及び14D )。被験体全体の95%信頼区間、補正されていないp値及び補正されたp値と共に平均結合性推定値が、図15に示されている表4に記載されている。MCX 回路網モデル及びSCX 回路網モデルの両方の最大の結合はGPe からSTN (MCX 回路網の平均結合性推定値:1.1176Hz,p値(補正):5.7809×10⁻⁴)であり、これは間接路の重要な投射であった。これらの事後推定から計算された時系列は、視床内の顕著な負の信号のようなD2-MSN刺激によって生じた別個のBOLD反応と更に正確に一致した(図14B 及び14E )。D1-MSN刺激のように、確率論的モデルは被験体の大部分で決定論的モデルより優れていた。確率論的モデリングの超過確率は、MCX 回路網で0.6025であり(図14C )、SCX 回路網で0.7529であった(図14F )。 The brain-wide fMRI response to D2-MSN stimulation was significantly different from the fMRI response evoked by D1-MSN stimulation. In particular, many of the subcortical areas showed a decrease in signal during stimulation. It is important that the use of the same a priori network described above resulted in significant coupling reflecting activation of the indirect pathway (Figs. 14A and 14D). Mean binding estimates along with 95% confidence intervals for the entire subject, uncorrected p-values and corrected p-values are shown in Table 4 shown in FIG. The maximum coupling of both the MCX network model and the SCX network model is from GPe to STN (MCX network average connectivity estimate: 1.1176Hz, p-value (correction): 5.7809 × 10 -4 ). It was an important projection of the indirect route. The time series calculated from these post-estimations more accurately matched the separate BOLD responses generated by D2-MSN stimuli, such as marked negative signals in the thalamus (FIGS. 14B and 14E). Like D1-MSN stimulation, stochastic models were superior to deterministic models in most subjects. The excess probability of stochastic modeling was 0.6025 in the MCX network (Fig. 14C) and 0.7529 in the SCX network (Fig. 14F).
モデル推定と基本的な生理学との密接な関係の観点から、同一のモデリングの枠組を使用して、D1-MSN刺激及びD2-MSN刺激中の回路網を推定した。生成モデル、変動及び事前推定は同一のままであった。これは、提案されたアルゴリズムが様々な光遺伝学fMRI実験をパラメータ化する際に使用するために一般化され得ることを実証した。 From the perspective of the close relationship between model estimation and basic physiology, the same modeling framework was used to estimate the network during D1-MSN and D2-MSN stimulation. The generative model, variability and pre-estimation remained the same. This demonstrated that the proposed algorithm could be generalized for use in parameterizing various optogenetics fMRI experiments.
MCX 回路網モデルとSCX 回路網モデルとの比較
D1-MSNで駆動される回路網の安定性を検査した。SCX とのMCX の交換はモデル内のあらゆる結合の強度を変えず(図16A 及び図17(表5))、運動皮質及び感覚皮質がD1-MSN刺激中に基底核回路に対して相応する影響を一般に及ぼすという考えを裏付けている。同様に、D2-MSN刺激モデルに関して運動皮質を感覚皮質と置き換えることにより、領域間の結合性推定値の強度は著しく変わらなかった(図16B 及び図17(表5))。皮質内の自己結合の強度のみが置換後に異なった(略有意,p<0.10)。まとめると、これらの結果は、D1-MSN刺激回路網及びD2-MSN刺激回路網での動的因果モデリングの安定性を実証した。
Comparison of MCX network model and SCX network model
The stability of the network driven by D1-MSN was inspected. The exchange of MCX with SCX did not change the strength of any connections in the model (Fig. 16A and Fig. 17 (Table 5)), and the corresponding effects of the motor and sensory cortex on the basal ganglia circuit during D1-MSN stimulation. Supports the idea of giving to the general public. Similarly, replacing the motor cortex with the sensory cortex for the D2-MSN stimulation model did not significantly change the intensity of the interregional connectivity estimates (FIGS. 16B and 17 (Table 5)). Only the strength of self-coupling within the cortex was different after replacement (approximately significant, p <0.10). In summary, these results demonstrate the stability of dynamic causal modeling in the D1-MSN stimulation network and the D2-MSN stimulation network.
D1-MSN刺激回路網モデルとD2-MSN刺激回路網モデルとの比較
D1-MSN刺激回路網モデルとD2-MSN刺激回路網モデルとを定量的に比較するために、各モデルの生じた結合性推定値の統計比較を行った(図18及び図19(表6))。CPu からGPi への結合及びCPu からSNへの結合、つまり直接路の定められた投射は、MCX 回路網及びSCX 回路網の両方でD1-MSN刺激中に著しく増加した。STN からSNへの結合、つまり間接路内の別の有意な投射は、SCX 回路網でD2-MSN刺激中に増加した(略有意,p<0.10)。D1-MSN刺激とD2-MSN刺激との間で皮質の遠心性神経の強度の差が更に観察された。他方では、MCX からTHL への結合が、D1-MSN刺激中に著しく増加した。これらの投射は一般に、D1-MSN刺激中に正であり、D2-MSN刺激中に負であった。更に、D1-MSN刺激とD2-MSN刺激との間で領域内推定値に複数の有意差が存在した(図19(表6))。
Comparison of D1-MSN stimulation network model and D2-MSN stimulation network model
In order to quantitatively compare the D1-MSN stimulation network model and the D2-MSN stimulation network model, statistical comparisons of the boundness estimates generated by each model were performed (Fig. 18 and Fig. 19 (Table 6)). ). CPu-to-GPi binding and CPu-to-SN binding, or direct-path-defined projections, were significantly increased during D1-MSN stimulation in both the MCX and SCX networks. The binding of STN to SN, another significant projection in the indirect pathway, was increased during D2-MSN stimulation in the SCX network (approximately significant, p <0.10). Further differences in cortical efferent nerve intensity differences were observed between D1-MSN and D2-MSN stimulation. On the other hand, MCX to THL binding was significantly increased during D1-MSN stimulation. These projections were generally positive during D1-MSN stimulation and negative during D2-MSN stimulation. In addition, there were multiple significant differences in intraregional estimates between D1-MSN stimuli and D2-MSN stimuli (FIG. 19 (Table 6)).
CPu 内の自己結合パラメータの大きさが、MCX 回路網及びSCX 回路網の両方のD1-MSN刺激中に著しく増加した(更に負であった)。GPe では、自己結合パラメータの大きさが、MCX 回路網でD2-MSN刺激中に著しく増加した(更に負であった)。更に、GPi の自己結合パラメータの大きさが、SCX 回路網でD2-MSN刺激中に増加した(更に負であった)(略有意、p<0.10)。同様にSTN の自己結合パラメータの大きさが、MCX 回路網でD2-MSN刺激中に増加した(更に負であった)(略有意、p<0.10)。SN内の自己結合パラメータの大きさが、MCX 回路網及びSCX 回路網の両方でD2-MSN刺激中に著しく増加した(更に負であった)。最後にSCX 回路網では、SCX の自己結合パラメータの大きさが、D2-MSN刺激中に著しく増加した(更に負であった)。 The magnitude of the self-coupling parameters in the CPu was significantly increased (and even negative) during D1-MSN stimulation in both the MCX and SCX networks. In GPe, the magnitude of the self-coupling parameter was significantly increased (and even negative) during D2-MSN stimulation in the MCX network. In addition, the magnitude of the GPi self-binding parameters increased (and was even negative) during D2-MSN stimulation in the SCX network (approximately significant, p <0.10). Similarly, the magnitude of the STN self-binding parameter was increased (and even negative) during D2-MSN stimulation in the MCX network (approximately significant, p <0.10). The magnitude of the self-coupling parameters in the SN was significantly increased (and even negative) during D2-MSN stimulation in both the MCX and SCX networks. Finally, in the SCX network, the magnitude of the SCX self-binding parameters increased significantly (and was even negative) during D2-MSN stimulation.
検討
基底核経路の回路図が解剖学的結合性及び電気生理学的活動を分離して測定することにより従来通り示されているが、これらは脳全体に亘って同時に直接測定されなかった。本明細書に開示されたモデルは、生きた被験体で測定されたデータに基づき細胞型特異的な動的脳回路図を構築するために脳全体の光遺伝学fMRI測定値を利用している。これらの実験では、D1-受容体発現線条体MSN 又はD2受容体発現線条体MSN の細胞型特異的な刺激中に誘発されるfMRI応答によって測定される脳全体の回路網機能をパラメータ化することができる計算手法が開発された。意外にも、D1-MSN刺激中の最も強い結合はCPu からGPi 及びSNまでの遠心性神経であったが、D2-MSN刺激中の最も強い結合はGPe からSTN であった。これらは夫々直接路及び間接路の重要な投射であった。2つの刺激グループの結合性推定値を比較することにより、直接路に属する結合がD1-MSN刺激中により大きく、間接路に属する結合がD2-MSN刺激中により大きかったことが更に示された。これらの結果により、細胞型特異的な介在の下の分布した回路網内の有効な結合性の選択的な変化を検出して、領域間の有効な結合性が活性化された細胞型によってどのように決まるかを明らかにするという本明細書に開示された方法の能力が確認された。形式上、本明細書は、基底核−視床皮質系の既知の機能解剖学及びシナプス回路にアピールすることにより光遺伝学fMRI DCMの構成検証結果を提示している。
Examination Traditionally, schematics of the basal ganglia pathway have been shown by measuring anatomical connectivity and electrophysiological activity separately, but these were not measured directly across the brain at the same time. The models disclosed herein utilize optogenetic fMRI measurements throughout the brain to construct cell-type-specific dynamic brain schematics based on data measured in living subjects. .. In these experiments, we parameterized the network-wide function of the entire brain as measured by fMRI responses evoked during cell-type-specific stimulation of D1-receptor-expressing striatum MSN or D2 receptor-expressing striatum MSN. A calculation method that can be used has been developed. Surprisingly, the strongest binding during D1-MSN stimulation was the efferent nerve from CPu to GPi and SN, while the strongest binding during D2-MSN stimulation was from GPe to STN. These were important projections of direct and indirect routes, respectively. Comparing the binding estimates of the two stimulus groups further showed that the bindings belonging to the direct pathway were greater during the D1-MSN stimulation and the bindings belonging to the indirect pathway were greater during the D2-MSN stimulation. These results detect selective changes in effective binding within distributed networks under cell type-specific interventions, and which cell type activates effective binding between regions. The ability of the method disclosed herein to determine how to determine is confirmed. Formally, the present specification presents optogenetic fMRI DCM constitutive validation results by appealing to known functional anatomy and synaptic circuits of the basal ganglia-thalamic cortex system.
確率論的モデルは、回路網及び刺激グループ全体に亘って決定論的モデルより優れていた。確率論的モデルによって示されたより大きなモデル証拠は、実験刺激によって厳密に説明することができない神経突起が存在したことを示唆した。従って、内在的変動を説明する確率論的モデリングは、測定データを説明するために正確性と複雑性との最良のバランス(つまり最大のモデル証拠)を提供する(図20のA〜D)ので、将来のモデリング研究に最適であって、実験全体に亘って更なる一般化を提示し得る。これらの内在的変動の複雑性の最適度を、増加する次数の自己回帰モデルの適合により更に検査した。結果は、局所的な時間的相関関係(例えばAR(1) プロセス又はAR(2) プロセス)の比較的低い次数が回路網及び刺激グループ全体に亘って最適であることを示した(図20のE〜H)。 The stochastic model was superior to the deterministic model across the network and the stimulus group. The larger model evidence presented by the stochastic model suggested that there were neurites that could not be explained exactly by experimental stimuli. Therefore, stochastic modeling to explain intrinsic variability provides the best balance between accuracy and complexity (ie, maximum model evidence) to explain the measured data (A-D in Figures 20). It is ideal for future modeling studies and may present further generalizations throughout the experiment. The optimality of the complexity of these intrinsic variability was further examined by fitting an autoregressive model of increasing order. The results showed that the relatively low order of local temporal correlations (eg AR (1) process or AR (2) process) was optimal across the network and stimulation group (Fig. 20). E to H).
運動皮質を感覚皮質と置き換えることにより、基底核−視床皮質回路内の結合性パラメータの安定性が実証された。MCX をSCX に置き換えるとき、領域間の結合性推定値の強度に有意差が観察されず(図17(表5))、両方の回路網モデルは同様の結合をもたらした(図13(表3)及び図15(表4))。この性質は、因果推定アルゴリズムがロバストであるとみなされることに当てはまる。しかしながら、どちらかのモデルを選択したことにより、D1-MSN刺激及びD2-MSN刺激に亘って統計効果が変わったことに注目すべきである(図13(表3)及び図15(表4))。例えば、視床から皮質への結合は、D2-MSN刺激中にSCX 回路網モデルに統計的有意性がなく、刺激部位から皮質への経路を残さず、従って、基底核−視床皮質系内の因果関係の解釈が損われた(図14D )。この点に関して、MCX 回路網モデルは、両方の摂動中に視床から皮質への結合及び皮質から線条体への結合を含む、系統全体に亘る領域間の因果関係を示したので、SCX 回路網モデルより機構的な洞察を提供し得る(図12及び図14)。D2-MSN刺激中の視床から感覚皮質への因果関係は検出されず、これは、視床がD2-MSN刺激中に感覚皮質ではなく運動皮質に直接影響を及ぼし得ることを示し得る。このため、両方の回路網モデルを用いて観察された反応の正確な予測が妨げられなかった。これは、回路網モデルに明示的に含まれなかった隠されたニューロン反応を説明することができるモデル方程式の内在的変動が包含されているためであり得る。 Replacing the motor cortex with the sensory cortex demonstrated the stability of the connectivity parameters within the basal ganglia-thalamic cortex circuit. When replacing the MCX with the SCX, no significant difference was observed in the strength of the connectivity estimates between the regions (Figure 17 (Table 5)), and both network models resulted in similar coupling (Figure 13 (Table 3)). ) And FIG. 15 (Table 4)). This property applies to the fact that causal inference algorithms are considered robust. However, it should be noted that the selection of either model changed the statistical effect across D1-MSN and D2-MSN stimuli (Fig. 13 (Table 3) and Fig. 15 (Table 4)). ). For example, thalamic-to-cortical connections have no statistical significance in the SCX network model during D2-MSN stimulation and leave no pathway from the stimulation site to the cortex, thus leaving a causal effect within the basal ganglia-thalamic cortex system. The interpretation of the relationship was impaired (Fig. 14D). In this regard, the MCX network model showed a causal relationship between regions throughout the lineage, including thalamus-to-cortex and cortex-to-striatum connections during both perturbations, so the SCX network. It may provide more mechanistic insights than the model (Figs. 12 and 14). No causal relationship from the thalamus to the sensory cortex during D2-MSN stimulation was detected, which may indicate that the thalamus may directly affect the motor cortex rather than the sensory cortex during D2-MSN stimulation. This did not interfere with the accurate prediction of the reactions observed using both network models. This may be due to the inclusion of intrinsic variations in model equations that can explain hidden neuronal responses that were not explicitly included in the network model.
D1-MSN刺激及びD2-MSN刺激中の有意な結合の符号は、fMRI応答の時間的プロファイル及び極性の多様性と一致していた。例えば、D1-MSN刺激中、基底核全体に亘る時系列は増加した。予期した通り、基底核−視床皮質系全体に亘る有意な結合性推定値は正であった(図12及び図13(表3))。感覚皮質の最初の低下がこの例外とみなされ得るが、実験モデルは、この一時的な現象を皮質の活性化での遅延の反映として解釈した。D2-MSN刺激中、結合性推定値はCPu から皮質に至るまで正であった(図14及び図15(表4))。しかしながら、特に視床でのBOLD反応は、一般的に刺激中に減少した。従って、間接路のフィードフォワード態様は、STN 、GPi 、SN及び視床内に観察された反応の減少について説明しなかった。それにもかかわらず、信号が皮質を通過すると、この問題点は解決され得る。図14に示されているように、皮質からSTN への結合は著しく負であったが、STN からGPi への結合、GPi からTHL への結合及びSTN からSNへの結合は正であった。この経路に沿って乗算演算を適用すると、STN 、GPi 、SN及びTHL 内に負の反応がもたらされ、この経路が、D2-MSN刺激中に統計的に有意であって負であり、これらの領域内の負のBOLD反応について説明するハイパー直接路であり得ることが示された。 Significant binding signs during D1-MSN and D2-MSN stimulation were consistent with the temporal profile and polarity diversity of fMRI responses. For example, during D1-MSN stimulation, the time series throughout the basal ganglia increased. As expected, significant connectivity estimates across the basal ganglia-thalamic cortex system were positive (FIGS. 12 and 13 (Table 3)). The initial decline in the sensory cortex can be considered an exception to this, but experimental models interpreted this transient phenomenon as a reflection of the delay in cortical activation. During D2-MSN stimulation, the binding estimates were positive from CPu to the cortex (Fig. 14 and Fig. 15 (Table 4)). However, the BOLD response, especially in the thalamus, was generally reduced during stimulation. Therefore, the indirect route feedforward aspect did not explain the reduced response observed in STN, GPi, SN and thalamus. Nevertheless, this problem can be solved as the signal passes through the cortex. As shown in Figure 14, cortex-to-STN binding was significantly negative, while STN-to-GPi binding, GPi-to-THL binding, and STN-to-SN binding were positive. Applying multiplication operations along this pathway results in negative responses within STN, GPi, SN and THL, which are statistically significant and negative during D2-MSN stimulation. It has been shown that it can be a hyper-direct path explaining the negative BOLD reaction within the region of.
正常な基底核情報処理の理解を越えて、結果は、この回路網の欠陥から生じる運動障害の機構に対する洞察を与えた。例えば、光遺伝学的に駆動するD2-MSNは、直接路及び間接路の活動に不均衡を生じさせることにより、パーキンソン病(PD)に関連付けられている線条体のドーパミンの損失をシミュレートした。D2-MSN刺激からの結合性解析は、PDに一般に観察される複数の特徴を明らかにした。第一に、系統的に更に負の自己結合パラメータが、D1-MSN刺激と比較して、D2-MSN刺激中に基底核の神経核(STN 、Gpe 、Gpi 及びSN)内に観察された。自己結合の多くは、MCX 回路網モデル及びSCX 回路網モデルの両方でD1-MSN刺激とD2-MSN刺激との統計的に有意な差又は略有意な差を示した(図19(表6))。状態方程式の数学的な解決(以下の方法の詳細を参照)に基づき、更に負の自己結合強度が、活性化状態に達するために必要な時間がより短いことを示した。この1つの解釈は、基底核内の脳領域がD2-MSN刺激中に、より速く同期したということであった。STN 及びGPi の同期性及び神経発振の増加が、PDの霊長類モデル及び齧歯類モデルに観察された。PDのサルにおいてSTN 活動が下流の基底核活動と相互に関連することが更に示されている。STN 発振とPD症状との因果関係は定義しにくいままであるが、随意運動、ドーパミン補充療法及びSTN-DBS 療法によって病理学的発振が抑えられることが示された。PDへの別のあり得る関連性として、D1-MSN刺激中ではなく、D2-MSN刺激中に統計的に有意なMCX-STN 結合及び略有意なSCX-STN 結合が観察された。皮質−STN 相互作用がPD機構に関与していた。ある場合には、STN 刺激の抗パーキンソン病作用がM1-STN経路の選択的活性化に起因する。 Beyond the understanding of normal basal ganglia information processing, the results provide insight into the mechanism of dyskinesia resulting from defects in this network. For example, optogenetically driven D2-MSN simulates striatal dopamine loss associated with Parkinson's disease (PD) by creating an imbalance in direct and indirect tract activity. did. Binding analysis from D2-MSN stimulation revealed several features commonly observed in PD. First, systematically more negative self-binding parameters were observed in the basal ganglia nuclei (STN, Gpe, Gpi and SN) during D2-MSN stimulation compared to D1-MSN stimulation. Many of the self-couplings showed statistically significant or substantially significant differences between D1-MSN and D2-MSN stimuli in both the MCX and SCX network models (Fig. 19 (Table 6)). ). Based on the mathematical solution of the equation of state (see details of the method below), we have also shown that the negative self-bonding strength requires less time to reach the activated state. One interpretation was that brain regions within the basal ganglia synchronized faster during D2-MSN stimulation. Increased STN and GPi synchrony and neural oscillations were observed in primate and rodent models of PD. It has been further shown that STN activity correlates with downstream basal ganglia activity in monkeys with PD. Although the causal relationship between STN oscillation and PD symptoms remains difficult to define, it has been shown that voluntary movement, dopamine replacement therapy and STN-DBS therapy suppress pathological oscillation. Another possible association to PD was observed to be statistically significant MCX-STN binding and substantially significant SCX-STN binding during D2-MSN stimulation rather than during D1-MSN stimulation. Cortical-STN interactions were involved in the PD mechanism. In some cases, the anti-Parkinson's disease effect of STN stimulation is due to the selective activation of the M1-STN pathway.
PDのための神経刺激療法は、基底核−視床皮質系のニューロン活動を調節することを目的としている。臨床的に、DBS によりPDの運動症状の処置を対象とする最も一般的な脳領域はSTN 及びGPi である。PDのDBS のための正確な作用機序が不明瞭なままであるが、多くの仮説が提案されている。例えば、DBS は、基底核とM1のような皮質領域との間の異常な同期発振活動を調節し得る。治療法の代替案として、最近のデータは、硬膜外の長期間運動皮質刺激(MCS )がPDのような運動障害に起因する症状を更に改善し得ることを示した。MCS のための可能な作用機序の中には、STN 刺激と同様に、基底核の神経核での同期した発振活動を低下させると仮定されている。本明細書に開示された実験で開発された結合性解析を使用して、治療標的として異なる領域の有効性を解明してもよい。例えば、運動皮質がD2-MSN刺激中に皮質下構造とのより強い結合性を示すという結果は、運動皮質の調節がパーキンソン病の回路にバランスを取り戻し得ることを示し、この領域が基底核回路網活動の下方調節に重要な役割を果たすことを示した。 Neurostimulation therapy for PD is aimed at regulating neuronal activity in the basal ganglia-thalamic cortex system. Clinically, the most common brain regions targeted for the treatment of motor symptoms of PD by DBS are STN and GPi. The exact mechanism of action for DBS in PD remains unclear, but many hypotheses have been proposed. For example, DBS can regulate anomalous synchronous oscillation activity between the basal ganglia and cortical regions such as M1. As an alternative treatment, recent data have shown that long-term epidural motor cortical stimulation (MCS) can further improve symptoms caused by movement disorders such as PD. Some possible mechanisms of action for MCS have been hypothesized to reduce synchronized oscillatory activity in the nucleus of the basal ganglia, as well as STN stimulation. The connectivity analysis developed in the experiments disclosed herein may be used to elucidate the effectiveness of different regions as therapeutic targets. For example, the results that the motor cortex shows stronger connectivity with subcortical structures during D2-MSN stimulation indicate that regulation of the motor cortex can rebalance the circuit of Parkinson's disease, a region of which is the basal ganglia circuit. It has been shown to play an important role in the downward regulation of network activity.
D1-MSN刺激とD2-MSN刺激との有意な領域間結合及び略有意な領域間結合の別個の統計的に略関係がないパターンが存在した(MCX 回路網モデル及びSCX 回路網モデル夫々に関してピアソンの相関関数r=−0.0036及び−0.0165)。分散空間表現では、有効な結合性の直交配置を使用して識別性を最大化してもよい。例えば、直交配置は、別個の細胞型を有する2つの集団の個別の同一性及び処理内容を維持する際に有用であり得る。加えて、統計的に関係がないパターンを用いて2つの独立したシーケンス(例えば一組の運動プログラム)を同時的に放出し、(例えば大脳皮質内で)受信情報を後で分離することができる。 There were distinct, statistically unrelated patterns of significant interregional and substantially significant interregional coupling between D1-MSN and D2-MSN stimuli (Pearson for each of the MCX and SCX network models). Correlation functions r = -0.0036 and -0.0165). In distributed space representations, valid connective orthogonal arrangements may be used to maximize discriminativeness. For example, orthogonal arrangements can be useful in maintaining the individual identity and processing content of two populations with distinct cell types. In addition, two independent sequences (eg, a set of motor programs) can be emitted simultaneously using statistically unrelated patterns to later separate received information (eg, within the cerebral cortex). ..
本開示の方法は、特異的な細胞型によって駆動される脳領域間の因果的影響を決定するために使用されてもよく、この因果的影響は、光遺伝学fMRI及び本明細書に開示されている回路網モデルを利用することにより健康な脳及び罹患した脳で定量化されて比較され得る。特異的な細胞集団によって駆動される神経経路がどのようにPDのような疾患に寄与するかを知ることにより、疾患の定量的回路機構に基づく治療の開発を支援し、有効性を高めて副作用を削減した改善された対象の治療法がもたらされる。 The methods of the present disclosure may be used to determine causal effects between brain regions driven by specific cell types, which causal effects are disclosed in optogenetics fMRI and herein. It can be quantified and compared in healthy and affected brains by utilizing the network model. By knowing how neural pathways driven by specific cell populations contribute to diseases such as PD, we support the development of treatments based on the quantitative circuit mechanism of the disease, increasing their effectiveness and side effects. An improved treatment for the subject is brought about.
方法の詳細
実験モデル及び被験体の詳細
マウス
遺伝子発現神経系アトラス(GENSAT)からの細菌人工染色体(BAC )介在トランスジェニックマウス系統を被験体として使用した(オス、18〜20g、4週齢以下)。マウスは、ドーパミンD1受容体(BAC-Cre Drd1a-262マウス、RRID:MMRRC_017264-UCD)調節要素又はドーパミンD2受容体(BAC-Cre Drd2-44マウス、RRID:MMRRC_017263-UCD)調節要素のいずれかの制御下でCre リコンビナーゼを発現した。double-floxed inverted(DIO )組換えAAV1ウイルスAAV-EF1a-DIOhChR2(H134R) - EYFP を背内側線条体に注入し(+0.48mm Ap、−1.50mm ML、−3.00mm DV)、D1発現中型有棘ニューロン又はD2発現中型有棘ニューロンにチャネルロドプシン2を発現させた。Addgene プラスミド#20298 を使用してノースカロライナ大学のvector core からウイルスを得た。動物を、カニューレを埋め込んだ後に個々に収容して、食物及び水を適宜与えた。全ての実験手順及び動物の飼育を、NIH のガイドライン、UCLA Institutional Animal Care and Use Committee (IACUC )のガイドライン及びスタンフォード大学IACUC のガイドラインに厳密に従って行った。動物は、ofMRI 実験に先立って機能性オプシン発現を確認するために行動回転試験に関与していたが、その他の点では実験に使われておらず、健康であった。比較されるグループ(D1-MSN刺激及びD2-MSN刺激)は単に動物の遺伝的性質(つまりD1-Cre及びD2-Cre)によって決定されたので、動物を実験グループに割り当てるためのランダム化手順は必要ではなかった。サンプルサイズを推定するための手順を使用しなかった。
Details of the method Experimental model and details of the subject A bacterial artificial chromosome (BAC) -mediated transgenic mouse strain from the mouse gene-expressing nervous system atlas (GENSAT) was used as the subject (male, 18-20 g, 4 weeks old or younger). .. Mice are either dopamine D1 receptor (BAC-Cre Drd1a-262 mice, RRD: MMRRC_017264-UCD) regulatory elements or dopamine D2 receptor (BAC-Cre Drd2-44 mice, RRD: MMRRC_017263-UCD) regulatory elements. Cre recombinase was expressed under control. double-floxed inverted (DIO) recombinant AAV1 virus AAV-EF1a-DIOhChR2 (H134R)-EYFP injected into the dorsomedial striatum (+ 0.48 mm Ap, -1.50 mm ML, -3.00 mm DV), medium
方法の詳細
ofMRI 実験
7 Tesla Bruker Biospec小動物MRI システムを使用してfMRIスキャニングを行った。単一のofMRI スキャンは、6分間に亘って1分間に1回与えられる光刺激の6つの20秒のパルス列を含んだ。光刺激を、105 mm直径の光ファイバを介して30%のデューティサイクルで20Hzで与えた。473 nmのレーザ源(Laserglow Technologies,Toronto,ON)に接続された光ファイバは較正されて2.5 mWの出力電力を有した。fMRIスキャニング中、動物を、O2(35%)、N2O (65%)及びイソフルラン(0.4 %〜0.7 %;Henry Schein,Melville,NY,USA)の混合物を使用して較正済の気化器(Vet Equipment,,Pleasanton,CA,USA)で非常に軽く麻酔しながら、磁石のアイソセンタに置いた。空気流加熱器(SA Instrument,Stony Brook,NY,USA)を使用して体温を36〜38℃に維持した。グラジェントエコー(GRE )BOLD法を使用して、光刺激中のfMRI画像を得た。fMRI画像の取得は、スライディングウィンドウ再構成を用いて25×25mm2 の面内視野(FOV )及び0.36×0.36×0.5 mm3 の空間分解能を有するように設計されており、繰り返し時間(TR)毎に画像を更新した。2次元マルチスライスグラジェントエコーシーケンスは4インターリーブスパイラルリードアウト、750 msのTR及び12msのエコー時間を使用して23の冠状スライスを得た。スパイラルk空間サンプルは、2次元グリッド再構成法を通して再構成された。最後に、特注設計のGPU ベースのシステムを使用して、リアルタイム動き補正を行った。
Details of the method
ofMRI experiment
7 Tesla Bruker Biospec fMRI scanning was performed using a small animal MRI system. A single of MRI scan included six 20-second pulse trains of light stimuli given once per minute over a 6-minute period. Photostimulation was applied at 20 Hz with a 30% duty cycle via a 105 mm diameter optical fiber. Fiber optics connected to a 473 nm laser source (Laserglow Technologies, Toronto, ON) were calibrated and had an output power of 2.5 mW. During fMRI scanning, animals are calibrated using a mixture of O 2 (35%), N 2 O (65%) and isoflurane (0.4% to 0.7%; Henry Schein, Melville, NY, USA). It was placed in the isocenter of the magnet under very light anesthesia with (Vet Equipment ,, Pleasanton, CA, USA). Body temperature was maintained at 36-38 ° C using an air flow heater (SA Instrument, Stony Brook, NY, USA). Gradient echo (GRE) BOLD method was used to obtain fMRI images during photostimulation. The acquisition of fMRI images is designed to have an in-plane field of view (FOV) of 25 × 25 mm 2 and a spatial resolution of 0.36 × 0.36 × 0.5 mm 3 using sliding window reconstruction, and per iteration time (TR). Updated the image to. The 2D multi-slice gradient echo sequence obtained 23 coronary slices using 4 interleaved spiral readouts, 750 ms TR and 12 ms echo time. Spiral k-space samples were reconstructed through a two-dimensional grid reconstruction method. Finally, real-time motion correction was performed using a custom-designed GPU-based system.
加熱、及び視覚に関連するアーチファクトを避けるために、ofMRI 実験中に予防策を講じた。視覚に関連するアーチファクトを確実に生成させないために、各被験体の目を黒い絶縁テープで慎重に覆った。光ファイバケーブルと埋め込まれたカニューレとの接続部分も、光のあらゆる漏れを防ぐために黒いテープで覆った。更に、加熱を防ぐために、刺激は30%のデューティサイクルで2.5 mWであった。使用された105 mm直径のファイバを考慮したこれらの数により、86.6mW/mm2の時間平均光パワー密度になる。56〜167 mW/mm2の時間平均光強度の範囲は、あらゆるアーチファクト由来の反応を引き起こした範囲をはるかに下回る。光遺伝学的なD1-MSN刺激及びD2-MSN刺激が単に正のローカルBOLD信号をもたらしたことを示す結果に加えて、これらのデータは、加熱交絡因子が現在の実験に存在しなかったことを実証した。 Precautions were taken during the ofMRI experiment to avoid heating and visual-related artifacts. Each subject's eyes were carefully covered with black insulating tape to ensure that no visual-related artifacts were generated. The connection between the fiber optic cable and the embedded cannula was also covered with black tape to prevent any leakage of light. In addition, to prevent heating, the stimulus was 2.5 mW with a 30% duty cycle. Considering the 105 mm diameter fibers used, these numbers result in a time average optical power density of 86.6 mW / mm 2. The time average light intensity range of 56-167 mW / mm 2 is well below the range that caused the reaction from any artifact. In addition to the results showing that optogenetic D1-MSN and D2-MSN stimuli simply resulted in a positive local BOLD signal, these data show that the heating confounders were not present in the current experiment. Demonstrated.
ofMRI データ処理
各動物の個々のスキャンに対応する動き補正画像を、まずNiftyRegツールボックスを使用して単一の共通座標フレームに並べた。次に、MATLAB(MathWorks,Natick,MA)のmrVista ソフトウェアパッケージ(Vision Imaging Science and Technology Laboratory,Stanford University,CA)を使用して刺激部位の平均コヒーレンス値を計算することにより、各画像の信号品質を定量化した。スキャニングセッション及び動物毎に、N個の最良の動き補正画像を平均した。ここで、Nは典型的には14であり、10以上である。最後に、統計的パラメトリックマッピングツールボックス(SPM12,Welcome Trust Centre for Neuroimaging,London,UK)を使用してスライス−タイミング補正及び画像の平滑化(4mm FWHM ガウスカーネル)を行った。
ofMRI data processing Motion-corrected images corresponding to individual scans of each animal were first aligned in a single common coordinate frame using the NiftyReg toolbox. Next, the signal quality of each image is determined by calculating the average coherence value of the stimulation site using the mrVista software package (Vision Imaging Science and Technology Laboratory, Stanford University, CA) of MATLAB (MathWorks, Natick, MA). Quantified. N best motion-corrected images were averaged for each scanning session and animal. Here, N is typically 14, greater than or equal to 10. Finally, slice-timing correction and image smoothing (4 mm FWHM Gaussian kernel) were performed using the Statistical Parametric Mapping Toolbox (SPM12, Wellcome Trust Center for Neuroimaging, London, UK).
刺激に先立って収集された30秒のベースライン期間に関連したBOLD信号の変調率として時系列をボクセル毎に計算した。起こり得るスキャナドリフトを補正するための時間的なトレンド除去及び平均補正後、デジタル規格マウス脳地図からの解剖学的領域を使用して、注目領域(ROI )特異的な解析のために脳を分割した。最後に、時系列を各ROI 内の全てのボクセルに亘って平均した。 A time series was calculated for each voxel as the modulation factor of the BOLD signal associated with the 30 second baseline period collected prior to the stimulus. After temporal trend removal and mean correction to correct for possible scanner drift, the brain is divided for region of interest (ROI) -specific analysis using anatomical regions from digital standard mouse brain atlas. did. Finally, the time series was averaged across all voxels within each ROI.
動的因果モデリング
動的因果モデリング(DCM )は、一連の特定の摂動又は実験タスク中に、相互に結合された領域の動的系として脳をモデル化する。ここで、摂動は光刺激であった。u(t)によって定められる単一の決定論的入力が光遺伝学的操作の影響(つまり、レーザがオフであるときに0の二乗関数、及びレーザがオンであるときに1の二乗関数)をコード化し、u(t)が、内在的変動と称される確率論的領域依存の障害を表すと仮定すると、式1は、時間領域のofMRI 応答の一般的DCM の状態空間モデルを示す。
(dx(t)/dt)=f(x(t),θn,u(t))=Ax(t)+Cu(t)+ω(t),
y(t)=g(x(t),θh)+ε(t) (式1)
Dynamic Causal Modeling Dynamic Causal Modeling (DCM) models the brain as a dynamic system of interconnected regions during a series of specific perturbation or experimental tasks. Here, the perturbation was a light stimulus. The single deterministic input defined by u (t) is the effect of optogenetic manipulation (ie, the squared function of 0 when the laser is off, and the squared function of 1 when the laser is on). And suppose u (t) represents a stochastic domain-dependent disorder called intrinsic variability,
(dx (t) / dt) = f (x (t), θ n , u (t)) = Ax (t) + Cu (t) + ω (t),
y (t) = g (x (t), θ h ) + ε (t) (Equation 1)
ここで、x(t)がニューロン状態であり、θn =(A, C)はニューロンパラメータであり、Aは内在的結合強度のマトリクスであり、Cは光遺伝学的入力の強度であり、g(x(t),θh) は、血管拡張、血流、血液量及びデオキシヘモグロビン量の変化によってニューロン状態x(t)を予測されるBOLD信号y(t)に関連付ける非線形演算子であり、θh は血液動態パラメータであり、ε(t)は観察ノイズである。この研究では、入力関数u(t)を特にCPu 回路網ノードに適用してインビボ光遺伝学的刺激の影響をモデル化した。関数f(x(t),θn,u(t)) 及び関数g(x(t),θh) は、Friston らによって導入された関数と同一である。 Where x (t) is the neuron state, θ n = (A, C) is the neuron parameter, A is the matrix of intrinsic binding strength, C is the strength of the optogenetic input, and so on. g (x (t), θ h ) is a non-linear operator that associates the neuronal state x (t) with the predicted BOLD signal y (t) by changes in vasodilation, blood flow, blood volume and deoxyhemoglobin volume. , Θ h is a hemodynamic parameter, and ε (t) is an observation noise. In this study, the input function u (t) was specifically applied to the CPu network node to model the effects of in vivo optogenetic stimuli. The function f (x (t), θ n , u (t)) and the function g (x (t), θ h ) are identical to the functions introduced by Friston et al.
スペクトルDCM
スペクトルDCM は、分布した神経系の結合された内在的変動の生物物理学的に妥当性のあるモデルから交差スペクトルを予測した決定論的モデルに基づいている。適切な脳回路網モデルを生成するために内在的変動及び観察ノイズを考慮に入れるべきである。そのため、内在的変動(及び観察ノイズ)の性質をパラメータ化する必要がある。この研究では、本発明者らは、内在的変動u(t)及び観察ノイズε(t) を自由なパラメータとして振幅及び自己回帰係数と共にパラメータ化した一次〜四次[つまり、AR(1) プロセス〜AR(4) プロセス]の自己回帰モデルを選択した。このステップを、SPM12 ツールボックスで関数spm_csd_fmri_mtf.mを変更することによって行った。関数f(x(t),θn,u(t)) 及び関数g(x(t),θh)の線形化後、式1を周波数領域で書き直すことができる。式2は、周波数領域のofMRI 応答のDCM の状態空間モデルを示す。
Spectrum DCM
The spectral DCM is based on a deterministic model that predicts cross-spectrum from a biophysically valid model of the connected intrinsic variability of the distributed nervous system. Intrinsic variability and observational noise should be taken into account in order to generate a suitable brain network model. Therefore, it is necessary to parameterize the nature of intrinsic variation (and observation noise). In this study, we set the intrinsic variation u (t) and the observed noise ε (t) as free parameters and parameterized them together with the amplitude and autoregressive coefficient [that is, the AR (1) process. ~ AR (4) Process] autoregressive model was selected. This step was done by modifying the function spm_csd_fmri_mtf.m in the SPM12 toolbox. After linearizing the function f (x (t), θ n , u (t)) and the function g (x (t), θ h ),
上記に記載されているように、スペクトルDCM は、観察されたBOLD反応の相互スペクトル密度Y(f)を予測した。式3は、ofMRI に関するDCM のクロススペクトル応答を示す。
As described above, the spectral DCM predicted the mutual spectral density Y (f) of the observed BOLD reaction.
ここで、Gu(f) は実験入力のパワースペクトル密度であった。Gw,n(f)は、n次の自己回帰プロセスとしてパラメータ化された内在的変動のスペクトル密度であった。Gε,n(f)は、n次の自己回帰プロセスとして更にパラメータ化された観察ノイズのスペクトル密度であった。これらの項はFriston らによって導入された項と同一であったが、Gw,n(f)及びGε,n(f)は自己回帰プロセスとしてパラメータ化された。σ2 w,n及びσ2 ε,nは、n次の対応する自己回帰プロセスの分散であり、ARw,n及びARε,nは対応する自己回帰係数であった。この数式を用いて、内在的変動をGw,n(f)項によって含めることができる(確率論的モデリング)、又は除外することができる(決定論的モデリング)。そのために、関数spm_csd_fmri_mtf.mをSPM12 で変更した。 Here, Gu (f) was the power spectral density of the experimental input. G w, n (f) was the spectral density of the intrinsic variation parameterized as the nth-order autoregressive process. G ε, n (f) was the spectral density of the observed noise further parameterized as the nth-order autoregressive process. These terms were identical to those introduced by Friston et al., But G w, n (f) and G ε, n (f) were parameterized as autoregressive processes. σ 2 w, n and σ 2 ε, n were the variances of the corresponding autoregressive processes of order n, and AR w, n and AR ε, n were the corresponding autoregressive coefficients. Using this formula, intrinsic variability can be included or excluded by the G w, n (f) term (stochastic modeling) or excluded (deterministic modeling). To that end, I modified the function spm_csd_fmri_mtf.m in SPM12.
式4は、ofMRI に関するDCM のクロススペクトル応答の簡略版を示す。
実験計画
D1-MSN刺激実験及びD2-MSN刺激実験を無作為化した順序で行った。モデルを実施する研究者は、個々の被験体の実験グループを知らされていなかった。サンプルサイズを推定するための手順を使用しなかった。
Experimental design
D1-MSN stimulation experiments and D2-MSN stimulation experiments were performed in a randomized order. The researchers performing the model were not informed of the experimental groups of the individual subjects. No procedure was used to estimate the sample size.
定量化及び統計解析
有効な結合性推定値の計算
データのオーバーフィッテングを避けるために、生の時系列をローパスフィルタした後に生成モデルを推定した。4つの回路網モデル毎に、被験体全体の平均時系列を適合させて、AR(1) プロセスの一次導関数が4´10-5以下である周波数を計算することにより、適切な遮断周波数を領域毎に推定した。D1-MSN刺激中、領域全体に亘って、0.2489Hzの平均遮断周波数及び0.2137〜0.2841Hzの95%信頼区間がMCX 回路網に関して得られ、0.2533Hzの平均遮断周波数及び0.2209〜0.2858Hzの95%信頼区間がSCX 回路網に関して得られた。D2-MSN刺激中、0.2623Hzの平均遮断周波数及び0.2241〜0.3004Hzの95%信頼区間がMCX 回路網に関して得られ、0.2563Hzの平均遮断周波数及び0.2105〜0.3022Hzの95%信頼区間がSCX 回路網に関して得られた。従って、0.21〜0.30Hzの遮断周波数を0.01Hzのステップサイズで使用して生成モデルを評価し、これら10の遮断周波数からの結合性推定値及びp値の分布を生成した。最適な遮断周波数を、(整合フィルタ定理と一致する)p値の識別性を最大化した遮断周波数として選択した。特に、有意な結合及び略有意な結合(夫々1.0 及び0.5 の重み)の数の加重和を最大化した遮断周波数を選択した。これらは、D1-MSN刺激中、MCX 回路網及びSCX 回路網夫々に関して0.29Hz及び0.24Hzであり、D2-MSN刺激中、MCX 回路網及びSCX 回路網夫々に関して0.27Hz及び0.22Hzであった。
Quantification and Statistical Analysis Calculation of Effective Coupling Estimates To avoid data overfitting, the generative model was estimated after low-pass filtering the raw time series. Appropriate cutoff frequency is determined by fitting the mean time series of the entire subject for each of the four network models and calculating the frequency at which the first derivative of the AR (1) process is 4'10 -5 or less. Estimated for each region. During D1-MSN stimulation, an average cutoff frequency of 0.2489 Hz and a 95% confidence interval of 0.2137 to 0.2841 Hz were obtained for the MCX network over the entire region, with an average cutoff frequency of 0.2533 Hz and 95% of 0.2209 to 0.2858 Hz. Confidence intervals were obtained for the SCX network. During D2-MSN stimulation, an average cutoff frequency of 0.2623 Hz and a 95% confidence interval of 0.2241 to 0.3004 Hz were obtained for the MCX network, an average cutoff frequency of 0.2563 Hz and a 95% confidence interval of 0.2105 to 0.3022 Hz were obtained for the SCX network. Obtained with respect to. Therefore, the generative model was evaluated using a cutoff frequency of 0.21 to 0.30 Hz with a step size of 0.01 Hz, and a distribution of coupling estimates and p-values from these 10 cutoff frequencies was generated. The optimum cutoff frequency was selected as the cutoff frequency that maximized the distinctiveness of the p-value (consistent with the Matched Filter theorem). In particular, a cutoff frequency was selected that maximized the weighted sum of the number of significant and approximately significant bonds (weights of 1.0 and 0.5, respectively). These were 0.29 Hz and 0.24 Hz for the MCX and SCX networks, respectively, during D1-MSN stimulation, and 0.27 Hz and 0.22 Hz for the MCX and SCX networks, respectively, during D2-MSN stimulation.
式4に記述されているクロススペクトル応答を使用して、ラプラス近似の条件下で変動自由エネルギを最小化することにより、回路網モデルを反転した(つまり、回路網パラメータを推定した)。特に、負の自由エネルギの推定値がログモデル証拠の近似として使用された。このステップを、SPM12 で関数spm_nlsi_GN.mを呼び出すことによって行った。最適なモデリング手法(つまり、確率論的又は決定論的)、及びwinning手法内の自己回帰プロセスの最適な順序を選択するために、ベイズモデル選択(BMS )を使用し、被験体全体の潜在的な不均一性を説明するグループレベルの変量効果BMS 機構を使用した。
The cross-spectrum response described in
まず、モデルの2つのファミリー(確率論的及び決定論的)を比較した。各ファミリーは一次〜四次の自己回帰モデルを含んでいる。そのために、ベイズモデル選択をまず使用して、確率論的ファミリー及び決定論的ファミリーの超過確率を計算した。このステップを、SPM12 で関数spm_run_bms_dcm.mを使用して7つのローパスフィルタ遮断周波数毎に行った。確率論的モデリングが刺激及び注目する回路網毎に遮断周波数全体で最適である(図20のA〜D)ことを見出した後、ベイズモデルを使用して、確率論的仮定の下で最大の負の自由エネルギ(つまり、モデル証拠)を与えた自己回帰モデルの次数を決定した。異なる次数のARプロセスを試験する理由は、モデルの複雑性(つまり自由なパラメータの数)の増加が自由エネルギを最小化したか否かを調査するためであった。解析により、1つのwinningモデルではなく、比較可能な超過確率を有するモデルのサブセットが明らかになった。D1-MSN刺激では、AR(1) プロセスが両方の回路網の場合で最適であったが、D2-MSN刺激では、AR(2) プロセスがMCX モデルで優れており、AR(1) プロセスがSCX モデル最適であった(図20のE〜H)。明らかなwinningモデルがどちらの光遺伝学的操作でも得られなかったので、ベイズモデル平均化(BMA )を使用して、信頼できるパラメータ推定値を計算してモデルの不確実性を説明した。この計算を、SPM12 で関数spm_run_bms_dcm.mを呼び出すことによって行った。BMA は、パラメータ推定値に対応するモデル事後確率により重みを加えることによって、生成モデル(例えば自己回帰プロセス)に亘って回路網推定値を平均化した。 First, two families of models (stochastic and deterministic) were compared. Each family contains a first-order to fourth-order autoregressive model. To that end, Bayesian model selection was first used to calculate the excess probabilities of stochastic and deterministic families. This step was performed for each of the seven lowpass filter cutoff frequencies using the function spm_run_bms_dcm.m in SPM12. After finding that stochastic modeling is optimal across cutoff frequencies for each stimulus and network of interest (ADs in Figures 20), the Bayesian model is used to maximize under probabilistic assumptions. We determined the order of the autoregressive model given negative free energy (ie, model evidence). The reason for testing different order AR processes was to investigate whether the increased model complexity (ie, the number of free parameters) minimized the free energy. Analysis revealed a subset of models with comparable excess probabilities rather than a single winning model. For D1-MSN stimulation, the AR (1) process was optimal for both networks, whereas for D2-MSN stimulation, the AR (2) process was superior in the MCX model and the AR (1) process was The SCX model was optimal (E to H in Figure 20). Since no clear winning model was obtained with either optogenetic operation, Bayesian model averaging (BMA) was used to calculate reliable parameter estimates to explain the model uncertainty. This calculation was done by calling the function spm_run_bms_dcm.m in SPM12. BMA averaged network estimates across generative models (eg, autoregressive processes) by weighting the model posterior probabilities corresponding to the parameter estimates.
BMA の前に、あり得る外れ値を識別するためにwinningモデルを被験体レベルでチェックした。D2-MSN刺激グループ内の被験体が、1.00に等しい超過確率でAR(3) のwinningモデルを示した。この外れ値の存在の確認するために、BMA の後、ユークリッド距離を、同一タイプの刺激の被験体全体でグループ平均推定値及び個々の推定値の(非)類似性の指標として計算した。この被験体に関して計算されたユークリッド距離は、D2-MSN刺激グループの平均ユークリッド距離の分布によって定められた信頼区間内にないことが観察され、この被験体を後の解析から除外した。 Prior to BMA, the winning model was checked at the subject level to identify possible outliers. Subjects in the D2-MSN stimulation group showed a winning model of AR (3) with an excess probability equal to 1.00. To confirm the presence of this outlier, after BMA, the Euclidean distance was calculated as an indicator of (non-) similarity between group mean estimates and individual estimates across subjects of the same type of stimulus. It was observed that the Euclidean distance calculated for this subject was not within the confidence interval determined by the distribution of the mean Euclidean distance in the D2-MSN stimulation group, and this subject was excluded from subsequent analysis.
統計情報
最後に、BMA の後、平均確率論的モデルから生じる結合性推定値平均を使用して、(以下に示すように統計的検定の仮定を評価するために古典的なt検定を用いた)通常の方法で被験体間レベルでD1-MSN刺激及びD2-MSN刺激の統計的有意性を検査した。各遮断周波数で推定された回路網パラメータを使用して、光遺伝学的刺激内の統計的有意性及び光遺伝学的刺激間の統計的有意性を決定した。各遮断周波数での同一の刺激内の結合性強度の統計的有意性を、1サンプルのt検定によって評価し、95%信頼区間を遮断周波数全体に亘って計算した。同様に、各遮断周波数でのMCX 回路網とSCX 回路網との統計的な差、及びD1-MSN刺激回路網とD2-MSN刺激回路網との統計的な差を2サンプルのt検定によって評価し、95%信頼区間を遮断周波数全体に亘って計算した。その後、偽発見率(FDR )を使用して、先験的回路網結合の数に等しい数の試験、つまり図10B に示されているような24の結合/試験で多くの試験を補正した。統計的検定の正確なp値は、図13(表3)、図15(表4)、図17(表5)及び図19(表6)に報告されている。報告された全てのモデリング結果(図12、図14、図16、図18、図11及び図20、図13(表3)、図15(表4)、図17(表5)及び図19(表6)に関して、統計試験に使用された被験体の数は、D1-MSN刺激ではn=12であり、D2-MSN刺激ではn=10であった。前のセクションで説明されているように、D2-MSN刺激グループからの1つの被験体は外れ値として除外された。図9に示されている時系列は、D2-MSN刺激中に当初にスキャンされた(つまり、外れ値を含む)11の被験体の平均を表す。
Statistics Finally, after BMA, we used the classical t-test to evaluate the assumptions of the statistical test (as shown below, using the mean binding estimates resulting from the mean stochastic model. ) The statistical significance of D1-MSN stimulation and D2-MSN stimulation was examined at the inter-subject level in the usual manner. The network parameters estimated at each cutoff frequency were used to determine the statistical significance within and between optogenetic stimuli. The statistical significance of binding strength within the same stimulus at each cutoff frequency was evaluated by one sample t-test and 95% confidence intervals were calculated over the entire cutoff frequency. Similarly, the statistical difference between the MCX and SCX networks at each cutoff frequency and the statistical difference between the D1-MSN stimulation network and the D2-MSN stimulation network are evaluated by a two-sample t-test. Then, the 95% confidence interval was calculated over the entire cutoff frequency. False discovery rate (FDR) was then used to correct many tests with a number of tests equal to the number of a priori network couplings, namely 24 couplings / tests as shown in Figure 10B. The exact p-values for the statistical test are reported in Figure 13 (Table 3), Figure 15 (Table 4), Figure 17 (Table 5) and Figure 19 (Table 6). All reported modeling results (Fig. 12, Fig. 14, Fig. 16, Fig. 18, Fig. 11 and Fig. 20, Fig. 13 (Table 3), Fig. 15 (Table 4), Fig. 17 (Table 5) and Fig. 19 (Fig. 12). With respect to Table 6), the number of subjects used in the statistical test was n = 12 for D1-MSN stimulation and n = 10 for D2-MSN stimulation, as described in the previous section. , One subject from the D2-MSN stimulation group was excluded as outliers. The timeline shown in FIG. 9 was initially scanned during D2-MSN stimulation (ie, including outliers). Represents the average of 11 subjects.
本発明者らは、(MATLABで実行されるような)リリーフォース検定を使用して結合性推定値の正規性を試験した。より具体的には、本発明者らは、合計960 の統計的検定を与える2つの光遺伝学的刺激、2つの注目する回路網及び10の遮断周波数の各々で計算された24の結合性推定値のガウス性を試験した。試験の大部分(88%)で、結合性推定値が正常に分布しているという帰無仮説を却下しなかった(未補正p>0.05)。従って、本発明者らは、グループ内の統計的有意性及びグループ間の統計的有意性を検査するためにパラメトリック検定(古典的なt検定)を選んだ。 We tested the normality of the binding estimates using a release force test (as performed in MATLAB). More specifically, we give a total of 960 statistical tests for two optogenetic stimuli, two networks of interest and 24 connectivity estimates calculated for each of the 10 cutoff frequencies. The Gaussian nature of the value was tested. Most of the trials (88%) did not reject the null hypothesis that the binding estimates were normally distributed (uncorrected p> 0.05). Therefore, we chose the parametric test (classical t-test) to test the statistical significance within and between groups.
本開示はその特定の実施形態に関して説明されてきたが、当業者は様々な変更をなし得ること、並びに本開示の主旨及び範囲から逸脱することなく等価物に置き換え得ることを理解すべきである。加えて、特定の状況、材料、物質組成、プロセス、プロセスステップ又は複数のプロセスに適合するため、本開示の目的、主旨及び範囲には多くの変更がなされ得る。このような変更は全て、以下に添付された特許請求の範囲内にあると意図される。 Although the present disclosure has been described with respect to its particular embodiments, one of ordinary skill in the art should understand that various modifications can be made and that they can be replaced with equivalents without departing from the gist and scope of the present disclosure. .. In addition, many changes may be made to the purpose, gist and scope of the present disclosure to suit a particular situation, material, material composition, process, process step or process. All such changes are intended to be within the claims attached below.
関連出願の相互参照
本願は、2016年2月1日に出願された米国仮出願第62/289741号の優先権を主張しており、その開示が参照によって本明細書に組み込まれる。
Cross-reference to related applications This application claims the priority of US Provisional Application No. 62/289741 filed February 1, 2016, the disclosure of which is incorporated herein by reference.
連邦政府の支援を受けた研究の記載
本発明は、国立衛生研究所によって与えられた助成金第1R01NS091461を用いて政府の支援を受けてなされた。政府は本発明において決められた権利を有している。
Description of Federally Supported Research The present invention was made with government support using Grant No. 1 R01NS091461 granted by the National Institutes of Health. The government has the rights determined in the present invention.
Claims (33)
前記機能活動データを計算処理する際に、
i) 前記複数のニューロンサブタイプの各々に対応するノードを有して前記領域を表す相互に結合されたノード間の機能的結合の回路網モデルに基づき前記機能活動データから、相互に結合されたノード間の機能的結合の強度を表す結合性モデルを生成し、
ii) a)前記結合性モデルとb)相互に結合された前記ノード間のニューロンサブタイプ特異的結合性推定値との線形回帰から一組の係数を導き、
前記神経経路の相対活動を推定する際に、ii) 一組の係数を導く前に、iii) 前記ニューロンサブタイプ特異的結合性推定値を生成し、
前記ニューロンサブタイプ特異的結合性推定値を生成する際に、ニューロンサブタイプ毎に、
前記第1の個体の脳の領域に相当する一又は複数の第2の個体の脳の領域に関して、機能的磁気共鳴画像法(fMRI)、脳磁図(MEG )及び/又は脳波記録法(EEG )によって得られた、前記一又は複数の第2の個体の脳のニューロンサブタイプのニューロンの選択的な活動調節によって引き起こされる前記一又は複数の第2の個体の脳の領域内の複数のニューロンの集団的な活動を表すニューロンサブタイプ機能活動データから、前記複数のニューロンサブタイプ毎に、前記回路網モデルに基づきニューロンサブタイプ特異的結合性モデルを生成し、
前記ニューロンサブタイプ特異的結合性モデルの前記一又は複数の第2の個体全体に亘る平均に基づき、前記複数のニューロンサブタイプ毎に前記回路網モデルの相互に結合されたノード間の結合性を推定し、
前記線形回帰の一組の係数は、複数の別個のニューロンサブタイプの各々によって調節される神経経路の機能活動データへの寄与を表すことを特徴とする方法。 For a region of the brain of a first individual, a collective of multiple neurons within said region obtained by functional magnetic resonance imaging (fMRI), magnetoencephalography (MEG) and / or electroencephalography (EEG). By computing functional activity data representing activity, we estimate the relative activity of neural pathways regulated by each of multiple neuronal subtypes.
When calculating the functional activity data,
i) Mutually coupled from the functional activity data based on a network model of functional coupling between interconnected nodes having nodes corresponding to each of the plurality of neuron subtypes representing the region. Generates a connectivity model that represents the strength of functional coupling between nodes
ii) a) Derivation of a set of coefficients from a linear regression of the connectivity model and b) a neuron subtype-specific connectivity estimate between the interconnected nodes.
In estimating the relative activity of the neural pathways, ii) before deriving a set of coefficients, iii) generate the neuron subtype-specific connectivity estimates.
In generating the neuron subtype-specific connectivity estimates, for each neuron subtype,
Functional magnetic resonance imaging (fMRI), magnetoencephalography (MEG) and / or electroencephalogram recording (EEG) with respect to the brain region of one or more second individuals corresponding to the brain region of the first individual. Of the multiple neurons within the region of the brain of the one or more second individuals resulting from the selective regulation of activity of neurons of the neuron subtype of the brain of the one or more second individuals. from neuronal subtypes functional activity data representative of the collective activities, for each of the plurality of neurons subtypes, generate based-out Men u Ron subtype specific binding model to the network model,
Based on the average over the whole of the one or more second individuals of the neuron subtype-specific connectivity model, the connectivity between the interconnected nodes of the network model for each of the plurality of neuron subtypes. Estimate and
A method characterized in that a set of coefficients of the linear regression represents a contribution to functional activity data of a neural pathway regulated by each of a plurality of distinct neuronal subtypes.
i) 神経障害を患っている第1の個体の症例グループ及び第1の個体の対照グループを有する第1の個体の複数のグループの各第1の個体に請求項1〜18のいずれか一項に記載の方法を行うことにより、複数のニューロンサブタイプの各々によって調節される神経経路の相対活動を推定し、
前記相対活動を推定することにより、
前記症例グループの複数の別個のニューロンサブタイプの各々によって調節される神経経路の症例機能活動データへの寄与を表す症例組の回帰係数、及び
前記対照グループの複数の別個のニューロンサブタイプの各々によって調節される神経経路の対照機能活動データへの寄与を表す対照組の回帰係数
を有する複数組の回帰係数を生成し、
ii) 前記症例組の回帰係数と前記対照組の回帰係数との差測定を計算し、
iii) 一又は複数の回帰係数に関する差測定が閾値基準を満たすとき、前記症例組の回帰係数が前記神経障害に関連した神経回路レベルバイオマーカであると判断する、或いは一又は複数の回帰係数に関する差測定が前記閾値基準を満たさないとき、前記症例組の回帰係数が前記神経障害に関連した神経回路レベルバイオマーカではないと判断することを特徴とする方法。 A method for identifying neural circuit level biomarkers associated with neuropathy.
i) any one of the first bill each first individual of the plurality of groups of individuals to claim 1 to 18 having a control group of case group and the first individual first individuals suffering from neuropathy By performing the method described in, the relative activity of neural pathways regulated by each of multiple neuronal subtypes is estimated.
By estimating the relative activity,
By the regression coefficients of the case sets representing the contribution of neural pathways to the case functional activity data regulated by each of the multiple distinct neuronal subtypes of the case group, and by each of the multiple distinct neuronal subtypes of the control group. Generate multiple sets of regression coefficients with control sets of regression coefficients that represent the contribution of regulated neural pathways to control function activity data.
ii) Calculate the difference measurement between the regression coefficient of the case group and the regression coefficient of the control group.
iii) When the difference measurement for one or more regression coefficients meets the threshold criteria, it is determined that the regression coefficient of the case set is a neural circuit level biomarker associated with the neuropathy, or for one or more regression coefficients. A method comprising determining that the regression coefficient of the case set is not a neural circuit level biomarker associated with the neuropathy when the difference measurement does not meet the threshold criteria.
前記対照グループは、神経障害を患っており、前記神経障害の治療を受けていない個体を含むことを特徴とする請求項26に記載の方法。 The case group includes individuals suffering from a neuropathy and being treated for the neuropathy.
26. The method of claim 26, wherein the control group comprises an individual suffering from a neuropathy and not being treated for the neuropathy.
プロセッサと、
前記プロセッサによって実行されると、
前記MRI 装置に、個体の脳の機能活動を記録させることにより、前記脳の領域に関する機能活動データを生成させて、
前記プロセッサに、生成された機能活動データを使用して請求項1〜22のいずれか一項に記載の方法を実行させる
指示を有する非一時的なコンピュータ可読媒体と
を備えていることを特徴とするシステム。 Magnetic resonance imaging (MRI) equipment and
With the processor
When executed by the processor
By having the MRI apparatus record the functional activity of an individual's brain, the functional activity data relating to the brain region is generated.
It is characterized in that the processor is provided with a non-transitory computer-readable medium having an instruction to perform the method according to any one of claims 1 to 22 using the generated functional activity data. System to do.
Applications Claiming Priority (3)
| Application Number | Priority Date | Filing Date | Title |
|---|---|---|---|
| US201662289741P | 2016-02-01 | 2016-02-01 | |
| US62/289,741 | 2016-02-01 | ||
| PCT/US2017/015659 WO2017136285A1 (en) | 2016-02-01 | 2017-01-30 | Method and systems for analyzing functional imaging data |
Publications (3)
| Publication Number | Publication Date |
|---|---|
| JP2019508109A JP2019508109A (en) | 2019-03-28 |
| JP2019508109A5 JP2019508109A5 (en) | 2020-03-12 |
| JP6987062B2 true JP6987062B2 (en) | 2021-12-22 |
Family
ID=59500084
Family Applications (1)
| Application Number | Title | Priority Date | Filing Date |
|---|---|---|---|
| JP2018539982A Active JP6987062B2 (en) | 2016-02-01 | 2017-01-30 | Methods and systems for analyzing functional image data |
Country Status (6)
| Country | Link |
|---|---|
| US (1) | US11564615B2 (en) |
| EP (1) | EP3410926A4 (en) |
| JP (1) | JP6987062B2 (en) |
| KR (1) | KR20180107224A (en) |
| CA (1) | CA3012463A1 (en) |
| WO (1) | WO2017136285A1 (en) |
Families Citing this family (27)
| Publication number | Priority date | Publication date | Assignee | Title |
|---|---|---|---|---|
| GB201702600D0 (en) * | 2017-02-17 | 2017-04-05 | Biomax Informatics Ag | Neurological data processing |
| WO2018191310A1 (en) | 2017-04-11 | 2018-10-18 | Peaklogic, Inc. | Minimum neuronal activation threshold transcranial magnetic stimulation at personalized resonant frequency |
| JP7428386B2 (en) | 2017-11-10 | 2024-02-06 | エルビス・コーポレイション | Efficacy and/or treatment parameter recommendation using individual patient data and treatment brain network maps |
| US11227692B2 (en) * | 2017-12-28 | 2022-01-18 | International Business Machines Corporation | Neuron model simulation |
| KR102058625B1 (en) | 2018-01-12 | 2019-12-23 | 서울대학교병원 | Method for diagnosis of dizziness by analysis of the brain function connectivity and system adopting thereof |
| AU2019244107B2 (en) * | 2018-03-28 | 2024-10-24 | Icahn School Of Medicine At Mount Sinai | Systems and methods for processing connectivity values between sub-processing regions |
| WO2020005525A1 (en) * | 2018-06-26 | 2020-01-02 | University Of Southern California | Methods and analytical tools for the study and treatment of epileptogenesis |
| US11385310B2 (en) | 2018-07-30 | 2022-07-12 | Koninklijke Philips N.V. | Functional magnetic resonance imaging systems and methods |
| JP6812022B2 (en) * | 2018-10-11 | 2021-01-13 | 株式会社国際電気通信基礎技術研究所 | Brain function binding correlation value adjustment method, brain function binding correlation value adjustment system, brain activity classifier harmonization method, brain activity classifier harmonization system, and brain activity biomarker system |
| CN109528197B (en) * | 2018-11-20 | 2022-07-08 | 中国科学院脑科学与智能技术卓越创新中心 | Individual prediction method and system for mental diseases based on brain function map |
| CN113365561B (en) * | 2019-02-08 | 2024-03-12 | 株式会社岛津制作所 | Brain function measuring device |
| SG11202113100TA (en) * | 2019-05-31 | 2021-12-30 | Univ Kyoto | Information processing device, screening device, information processing method, screening method, and program |
| WO2021051064A1 (en) * | 2019-09-12 | 2021-03-18 | The General Hospital Corporation | System and method for determining treatment outcomes for neurological disorders based on functional connectivity parameters |
| WO2021067464A1 (en) | 2019-10-01 | 2021-04-08 | The Board Of Trustees Of The Leland Stanford Junior University | Joint dynamic causal modeling and biophysics modeling to enable multi-scale brain network function modeling |
| KR20220113741A (en) * | 2019-12-06 | 2022-08-16 | 더 보드 어브 트러스티스 어브 더 리랜드 스탠포드 주니어 유니버시티 | Imaging of individual hippocampal seizures and long-term effects of repeated seizures |
| US20210170180A1 (en) * | 2019-12-09 | 2021-06-10 | Washington University | Systems and methods of precision functional mapping-guided personalized neuromodulation |
| EP4128090A4 (en) * | 2020-03-27 | 2024-05-01 | Tata Consultancy Services Limited | Model driven sub-system for design and execution of experiments |
| US11037296B1 (en) * | 2020-08-07 | 2021-06-15 | Omniscient Neurotechnology Pty Limited | Deriving target data from selected brain data |
| JP2022006151A (en) * | 2020-09-01 | 2022-01-12 | 昇 松本 | Digital nerve cell information processor |
| US11264137B1 (en) | 2020-10-08 | 2022-03-01 | Omniscient Neurotechnology Pty Limited | Centrality rankings of network graphs generated using connectomic brain data |
| US11264138B1 (en) * | 2020-10-08 | 2022-03-01 | Omniscient Neurotechnology Pty Limited | Generating brain network impact scores |
| US20240075310A1 (en) * | 2020-12-10 | 2024-03-07 | Beth Israel Deaconess Medical Center, Inc. | Targeting Trancranial Magnetic Stimulation to Specific Brain Regions and Evaluating the Reduction of Symptoms of Psychotic Disorders |
| US11699232B2 (en) * | 2021-09-01 | 2023-07-11 | Omniscient Neurotechnology Pty Limited | Brain hub explorer |
| WO2023200729A1 (en) * | 2022-04-11 | 2023-10-19 | Regents Of The University Of Minnesota | Closed-loop neurostimuation using global optimization-based temporal prediction |
| CN120225250A (en) * | 2022-09-30 | 2025-06-27 | 小利兰·斯坦福大学董事会 | Solving brain circuit functions and dysfunctions by computational modeling and optogenetic functional magnetic resonance imaging |
| WO2025054159A1 (en) * | 2023-09-05 | 2025-03-13 | University Of Louisville Research Foundation, Inc. | Computed-aided system for diagnosis of neurological disorders |
| CN118155855B (en) * | 2024-03-14 | 2024-09-13 | 武汉市精神卫生中心 | Biphasic obstacle neurodynamic evolution analysis method based on magnetic resonance imaging observation |
Family Cites Families (13)
| Publication number | Priority date | Publication date | Assignee | Title |
|---|---|---|---|---|
| AU646877B2 (en) | 1990-06-15 | 1994-03-10 | Scios Nova Inc. | Transgenic non-human mammal displaying the amyloid-forming pathology of alzheimer's disease |
| US5985930A (en) | 1996-11-21 | 1999-11-16 | Pasinetti; Giulio M. | Treatment of neurodegenerative conditions with nimesulide |
| US7632679B2 (en) | 2002-07-16 | 2009-12-15 | The Trustees Of Columbia University In The City Of New York | Systems and methods for screening for modulators of neural differentiation |
| US20040092809A1 (en) * | 2002-07-26 | 2004-05-13 | Neurion Inc. | Methods for measurement and analysis of brain activity |
| EP1955190B1 (en) * | 2005-11-10 | 2018-08-29 | In Silico Biosciences, Inc. | Method and apparatus for computer modeling the human brain for predicting drug effects |
| US8696722B2 (en) | 2010-11-22 | 2014-04-15 | The Board Of Trustees Of The Leland Stanford Junior University | Optogenetic magnetic resonance imaging |
| EP3708077B1 (en) * | 2011-09-09 | 2024-06-19 | The Regents of The University of California | In vivo visualization and control of pathological changes in neural circuits |
| US10849563B2 (en) | 2012-03-19 | 2020-12-01 | University Of Florida Research Foundation, Inc. | Methods and systems for brain function analysis |
| WO2016011137A1 (en) * | 2014-07-15 | 2016-01-21 | Brigham And Women's Hospital, Inc. | Systems and methods for generating biomarkers based on multivariate classification of functional imaging and associated data |
| KR102644929B1 (en) | 2015-07-21 | 2024-03-08 | 더 보드 오브 트러스티스 오브 더 리랜드 스탠포드 쥬니어 유니버시티 | Carbon fiber optical terminals for magnetic resonance imaging-compatible optogenetics |
| WO2017040538A1 (en) | 2015-08-31 | 2017-03-09 | The Board Of Trustees Of The Leland Stanford Junior University | Compressed sensing high resolution functional magnetic resonance imaging |
| EP3386374B1 (en) | 2015-12-09 | 2024-09-11 | The Board of Trustees of the Leland Stanford Junior University | Method for functional brain circuit analysis |
| US20190264285A1 (en) * | 2018-02-23 | 2019-08-29 | Northwestern University | Polymorphisms for predicting treatment response to antipsychotic drugs and idenfying new drug targets |
-
2017
- 2017-01-30 EP EP17747983.9A patent/EP3410926A4/en active Pending
- 2017-01-30 WO PCT/US2017/015659 patent/WO2017136285A1/en active Application Filing
- 2017-01-30 JP JP2018539982A patent/JP6987062B2/en active Active
- 2017-01-30 KR KR1020187025340A patent/KR20180107224A/en active Pending
- 2017-01-30 US US16/072,476 patent/US11564615B2/en active Active
- 2017-01-30 CA CA3012463A patent/CA3012463A1/en active Pending
Also Published As
| Publication number | Publication date |
|---|---|
| US20180368720A1 (en) | 2018-12-27 |
| JP2019508109A (en) | 2019-03-28 |
| KR20180107224A (en) | 2018-10-01 |
| EP3410926A4 (en) | 2019-08-28 |
| CA3012463A1 (en) | 2017-08-10 |
| EP3410926A1 (en) | 2018-12-12 |
| WO2017136285A1 (en) | 2017-08-10 |
| US11564615B2 (en) | 2023-01-31 |
Similar Documents
| Publication | Publication Date | Title |
|---|---|---|
| JP6987062B2 (en) | Methods and systems for analyzing functional image data | |
| US11672466B2 (en) | System and method for modeling brain dynamics in normal and diseased states | |
| US11357402B2 (en) | Compressed sensing high resolution functional magnetic resonance imaging | |
| Desai et al. | Mapping brain networks in awake mice using combined optical neural control and fMRI | |
| Grimm et al. | Optogenetic activation of striatal D1R and D2R cells differentially engages downstream connected areas beyond the basal ganglia | |
| Nakamura et al. | fMRI detects bilateral brain network activation following unilateral chemogenetic activation of direct striatal projection neurons | |
| Riemann et al. | From unspecific to adjusted, how the BOLD response in the rat hippocampus develops during consecutive stimulations | |
| Krautwald et al. | Electrical stimulation of the lateral entorhinal cortex causes a frequency-specific BOLD response pattern in the rat brain | |
| Olavarria et al. | Deafferentation‐induced plasticity of visual callosal connections: predicting critical periods and analyzing cortical abnormalities using diffusion tensor imaging | |
| AU2023353999A1 (en) | Solving brain circuit function and dysfunction with computational modeling and optogenetic functional magnetic resonance imaging | |
| KR20250106273A (en) | Solving Brain Circuit Function and Dysfunction Using Computer Modeling and Optogenetic Functional Magnetic Resonance Imaging | |
| Grimm et al. | Optogenetic activation of striatal D1/D2 medium spiny neurons differentially engages downstream connected areas beyond the basal ganglia | |
| AU2023354003A1 (en) | Pathology modifying neuromodulation therapy design | |
| KR20250105375A (en) | Pathological alteration neuromodulation therapy design | |
| Boyden et al. | Articles in PresS. J Neurophysiol (December 15, 2010). doi: 10.1152/jn. 00828.2010 | |
| Buckner et al. | Mapping brain networks in awake mice using combined | |
| HK40032430A (en) | System and method for modeling brain dynamics in normal and diseased states |
Legal Events
| Date | Code | Title | Description |
|---|---|---|---|
| A521 | Request for written amendment filed |
Free format text: JAPANESE INTERMEDIATE CODE: A523 Effective date: 20200128 |
|
| A621 | Written request for application examination |
Free format text: JAPANESE INTERMEDIATE CODE: A621 Effective date: 20200128 |
|
| A977 | Report on retrieval |
Free format text: JAPANESE INTERMEDIATE CODE: A971007 Effective date: 20210126 |
|
| A131 | Notification of reasons for refusal |
Free format text: JAPANESE INTERMEDIATE CODE: A131 Effective date: 20210209 |
|
| A521 | Request for written amendment filed |
Free format text: JAPANESE INTERMEDIATE CODE: A523 Effective date: 20210423 |
|
| A131 | Notification of reasons for refusal |
Free format text: JAPANESE INTERMEDIATE CODE: A131 Effective date: 20210713 |
|
| A521 | Request for written amendment filed |
Free format text: JAPANESE INTERMEDIATE CODE: A523 Effective date: 20211001 |
|
| TRDD | Decision of grant or rejection written | ||
| A01 | Written decision to grant a patent or to grant a registration (utility model) |
Free format text: JAPANESE INTERMEDIATE CODE: A01 Effective date: 20211102 |
|
| A61 | First payment of annual fees (during grant procedure) |
Free format text: JAPANESE INTERMEDIATE CODE: A61 Effective date: 20211130 |
|
| R150 | Certificate of patent or registration of utility model |
Ref document number: 6987062 Country of ref document: JP Free format text: JAPANESE INTERMEDIATE CODE: R150 |
|
| R250 | Receipt of annual fees |
Free format text: JAPANESE INTERMEDIATE CODE: R250 |