JP6738320B2 - Visualization of spectral image data - Google Patents
Visualization of spectral image data Download PDFInfo
- Publication number
- JP6738320B2 JP6738320B2 JP2017511326A JP2017511326A JP6738320B2 JP 6738320 B2 JP6738320 B2 JP 6738320B2 JP 2017511326 A JP2017511326 A JP 2017511326A JP 2017511326 A JP2017511326 A JP 2017511326A JP 6738320 B2 JP6738320 B2 JP 6738320B2
- Authority
- JP
- Japan
- Prior art keywords
- computed tomography
- image
- blend
- spectral
- images
- Prior art date
- Legal status (The legal status is an assumption and is not a legal conclusion. Google has not performed a legal analysis and makes no representation as to the accuracy of the status listed.)
- Active
Links
Images


Classifications
-
- G—PHYSICS
- G06—COMPUTING; CALCULATING OR COUNTING
- G06T—IMAGE DATA PROCESSING OR GENERATION, IN GENERAL
- G06T5/00—Image enhancement or restoration
- G06T5/50—Image enhancement or restoration by the use of more than one image, e.g. averaging, subtraction
-
- G—PHYSICS
- G06—COMPUTING; CALCULATING OR COUNTING
- G06T—IMAGE DATA PROCESSING OR GENERATION, IN GENERAL
- G06T7/00—Image analysis
- G06T7/0002—Inspection of images, e.g. flaw detection
- G06T7/0012—Biomedical image inspection
-
- G—PHYSICS
- G06—COMPUTING; CALCULATING OR COUNTING
- G06T—IMAGE DATA PROCESSING OR GENERATION, IN GENERAL
- G06T2200/00—Indexing scheme for image data processing or generation, in general
- G06T2200/24—Indexing scheme for image data processing or generation, in general involving graphical user interfaces [GUIs]
-
- G—PHYSICS
- G06—COMPUTING; CALCULATING OR COUNTING
- G06T—IMAGE DATA PROCESSING OR GENERATION, IN GENERAL
- G06T2207/00—Indexing scheme for image analysis or image enhancement
- G06T2207/10—Image acquisition modality
- G06T2207/10072—Tomographic images
- G06T2207/10081—Computed x-ray tomography [CT]
-
- G—PHYSICS
- G06—COMPUTING; CALCULATING OR COUNTING
- G06T—IMAGE DATA PROCESSING OR GENERATION, IN GENERAL
- G06T2207/00—Indexing scheme for image analysis or image enhancement
- G06T2207/20—Special algorithmic details
- G06T2207/20212—Image combination
- G06T2207/20221—Image fusion; Image merging
Description
以下は、概してスペクトル画像データの視覚化に関し、コンピューター断層撮影(CT)への特定の適用を用いて記述される。 The following relates generally to the visualization of spectral image data with specific application to computed tomography (CT).
スペクトル(又はマルチエネルギー)CTは、いくつかの異なる方法で実行されることができる。 たとえば、一つの実施例は、複数のX線管を備えるスキャナを含む。 他の実施例は、kVpスイッチングにより構成されるスキャナを含む。 他の実施例は、マルチレイヤ検出器を使用する。 他の実施例は、フォトンカウンティング検出器を使用する。 他の実施例は、上記の一つ又はそれより多くの組合せを含む。 このような実施例は、いくつかの異なるタイプのボリュメトリック情報を提供することができる。 Spectral (or multi-energy) CT can be performed in several different ways. For example, one embodiment includes a scanner with multiple x-ray tubes. Another embodiment includes a scanner configured with kVp switching. Another embodiment uses a multi-layer detector. Another embodiment uses a photon counting detector. Other embodiments include combinations of one or more of the above. Such an embodiment may provide several different types of volumetric information.
たとえば、画像データは広帯域減衰値(すなわち従来のCT)、異なるX線エネルギー帯における減衰値及び仮想モノクロ画像を含むことができる。 造影剤(例えばヨウ素又はガドリニウム)が使われる場合、造影剤定量マップ及び仮想非造影(VNC)画像は導出されることができる。 造影剤定量マップは、例えば、mg/mlにおけるヨウ素のローカルな濃度を示すことができる。 VNC画像は、造影剤の投与なしの従来のCT画像に類似する仮想(計算)画像を示す。 For example, the image data can include broadband attenuation values (ie, conventional CT), attenuation values in different x-ray energy bands, and virtual monochrome images. If a contrast agent (eg iodine or gadolinium) is used, a contrast agent quantification map and virtual non-contrast (VNC) images can be derived. The contrast agent quantitation map can show, for example, the local concentration of iodine in mg/ml. VNC images show virtual (computed) images similar to conventional CT images without the administration of contrast agent.
他のアプローチは、ボリュメトリックZ-エフェクティブマップを計算し、各々の画像ボクセルにおける物質化合物の平均原子番号を推定する。 他のアプローチは、カルシウム、尿酸、鉄化合物及び数種類のターゲット造影剤のような更なる物質のためのボリュメトリックマップを生成する。他のアプローチは、潅流マップ、テクスチャ解析マップ、及びコンピュータ支援決定(CAD)結果のようなボリュメトリックマップを生成する。 Another approach is to calculate a volumetric Z-effect map and estimate the average atomic number of the substance compound in each image voxel. Other approaches generate volumetric maps for additional substances such as calcium, uric acid, iron compounds and some targeted contrast agents. Other approaches generate volumetric maps such as perfusion maps, texture analysis maps, and computer aided decision (CAD) results.
臨床視覚化のために、グレイスケールで、解剖学的CT画像に類似する画像データタイプを示すことは一般的である。 このように、ユーザーは標準的な方法で画像を把握することができる。定量物質値又は機能分析を示す他の画像データセットは、通常適切なカラーマップを使って示される。 異なる画像タイプの組合せは、たとえば、標準的な画像融合によって、又はより高度な技術及びその組合せによってなされることができる。 For clinical visualization, it is common to show image data types in gray scale, similar to anatomical CT images. In this way, the user can perceive the image in a standard way. Other image data sets showing quantitative substance values or functional analyzes are usually shown using appropriate color maps. The combination of different image types can be done, for example, by standard image fusion or by more sophisticated techniques and combinations thereof.
更に、医師は一つより多くのグレイスケール画像を見ることを所望し得る。 通常の例は、造影剤を用いる場合及び造影剤を用いない場合の両方において、スキャンボリュームをレビューする。 スペクトルCTが使われるとき、VNC画像は非造影スキャンを置換することができ、放射線量及び臨床ワークフロー負荷を節減することができる。 スペクトルCTにおいて、異なるエネルギーで計算される異なる仮想モノクログレイスケール画像の間の連続的選択を可能にし、又は異なるエネルギー帯画像の表示を可能にすることも一般的である。 Further, the physician may desire to see more than one grayscale image. A common example is to review the scan volume both with and without contrast agent. When spectral CT is used, VNC images can replace non-contrast scans, saving radiation dose and clinical workflow load. In spectral CT, it is also common to allow continuous selection between different virtual monochrome grayscale images calculated at different energies, or to display different energy band images.
従来の視覚化技術は、選択領域の異なる画像層又は隣り合わせの現在の異なる情報層の間の双方向スイッチングにより選択層を融合する。 不都合なことに、このような技術は、例えば複数の情報層の同時臨床レビューにおける実際的な複雑さのために、複数の情報層のレビューにあまり適していない。このように、このようなタスクをより効率的に及び/又は使いやすくするための改善された技術に対する未解決の必要性がある。 Conventional visualization techniques fuse the selection layers by bidirectional switching between different image layers in the selection area or different current information layers next to each other. Unfortunately, such techniques are not well suited for multiple information layer reviews due to, for example, the practical complexity of simultaneous clinical review of multiple information layers. Thus, there is an unmet need for improved techniques to make such tasks more efficient and/or easy to use.
ここに記述される態様は、上記の問題及びその他に対処する。 The aspects described herein address the above issues and others.
以下は、複数のスペクトルCTボリュメトリック情報タイプの効率的なビューイングのための双方向視覚化アプローチを記述する。 例えば、ユーザーは、変化する半透明のオーバレイで覆われる、複数の異なるブレンド中間画像を通じて第一のタイプの画像から第二の異なるタイプの画像まで表示画像を変えるため、単一の双方向ブレンドポイントパラメータを使ってマルチブレンド画像を連続的に変形させることができる。 一つの例において、これは、異なるエネルギー依存特性をレビューする間、オブザーバーが関心構造のフォーカス又は認知を失わないことを可能にする。 The following describes an interactive visualization approach for efficient viewing of multiple spectral CT volumetric information types. For example, a user may change the displayed image from a first type of image to a second different type of image through a number of different blended intermediate images covered by varying translucent overlays, thus creating a single bidirectional blend point. The parameters can be used to continuously transform the multi-blend image. In one example, this allows the observer not to lose focus or cognition of the structure of interest while reviewing different energy dependent properties.
一つの態様において、本方法は、複数の異なるタイプのスペクトル画像を第一のスペクトル画像データブレンドマップの第一のブレンドポイントに基づいて第一の単一ブレンド画像に結合することを含む。 第一のブレンドポイントは、第一のセットの重み値を含む。 第一のセットの重み値は、複数の異なるタイプのスペクトル画像の各々のための重み値を含む。 複数の異なるタイプのスペクトル画像は、第一のセットの重み値に基づいて結合される。 本方法は、表示装置を介して第一の単一ブレンド画像を表示するステップを更に含む。 In one aspect, the method includes combining a plurality of different types of spectral images into a first single blend image based on a first blend point of a first spectral image data blend map. The first blend point includes a first set of weight values. The first set of weight values includes weight values for each of a plurality of different types of spectral images. Multiple different types of spectral images are combined based on a first set of weight values. The method further includes displaying the first single blended image via the display device.
他の態様において、計算システムは、スペクトルデータ視覚化モジュールの命令を記憶するメモリと、スペクトル画像データブレンドマップを示す信号を受信し、スペクトル画像データブレンドマップに対応する異なるタイプのスペクトル画像のサブセットを取り出し、第一の単一画像を生成するスペクトル画像データブレンドマップの第一のブレンドに基づいて異なるタイプのスペクトル画像の取り出されるサブセットを結合し、第一の単一画像を視覚的に示すプロセッサとを含む。 In another aspect, a computing system receives a memory storing instructions for a spectral data visualization module and a signal indicative of a spectral image data blend map, and a subset of different types of spectral images corresponding to the spectral image data blend map. And a processor for combining the retrieved subsets of different types of spectral images based on a first blend of the spectral image data blend maps to retrieve and generate a first single image, and to visually represent the first single image. including.
別の態様において、コンピュータ可読記憶媒体がコンピュータ可読命令で符号化される。コンピュータ可読命令は、プロセッサによって実行されるとき、プロセッサに、複数の異なるブレンド中間スペクトル画像を通じて第一のタイプのスペクトル画像から第二の異なるタイプの画像まで表示スペクトル画像を変化させる。 In another aspect, a computer-readable storage medium is encoded with computer-readable instructions. Computer readable instructions, when executed by the processor, cause the processor to change the displayed spectral image from a first type of spectral image to a second type of spectral image through a plurality of different blended intermediate spectral images.
本発明は、様々なコンポーネント及びコンポーネントの構成、並びに様々なステップ及びステップの構成の形を取り得る。図面は好ましい実施形態を例示するためのものに過ぎず、本発明を限定するものとして解釈すべきではない。 The invention may take form in various components and arrangements of components, and in various steps and arrangements of steps. The drawings are only for purposes of illustrating the preferred embodiments and are not to be construed as limiting the invention.
まず最初に図1を参照すると、コンピューター断層撮影(CT)スキャナのようなイメージングシステム100が例示される。 イメージングシステム100は概して静止ガントリ102及び静止ガントリ102によって回転可能に支持され、z軸に関して検査領域106のまわりを回転する回転ガントリ104を含む。 寝台のような被験体支持部107は、検査領域106における被験体又は対象物を支持する。 被験体支持部107は、被験体又は対象物のスキャンのために検査領域106に関して被験体又は対象物をガイドするようにスキャンと協調して移動可能である。
Referring first to FIG. 1, an
X線管のような放射線源108は、回転ガントリ104によって回転可能に支持され、回転ガントリ104により回転し、検査領域106を横断する放射線を放射する。 一つの例において、コントローラは放射線源108の平均又はピークの放射電圧を制御する。 これは、積分期間及び/又はその他以内において二つ又はそれより多くの放射電圧(例えば、80及び140kVp、100及び120kVpなど)間で放射電圧を切り替えることを含む。 バリエーションにおいて、イメージングシステム100は、異なる放射電圧で放射線を放射する少なくとも二つの放射線源108を含む。他のバリエーションにおいて、放射線源108は単一の広帯域X線管を含む。
A
検出器アレイ112は、放射線源108に対して検査領域106に対向する角アークに対する。 検出器アレイ112は、検査領域106を横断して、それを示す投影データを生成する放射線を検出する。 放射線源電圧が少なくとも二つの放射電圧間で切り替えられ、及び/又は二つの異なる放射電圧で二つ又はそれより多くのX線管放射線を含む場合、検出器アレイ112は、放射線源電圧の各々のための投影データを生成する。
The
再構成器114は、ボリュメトリック画像データを生成する投影データを再構成する。 画像データ及び/又はそれから導出される画像データの例は、限定されるものではないが、広帯域減衰値、異なるX線エネルギー帯画像データ、仮想モノクロ画像データ、造影剤定量画像データ、仮想非造影(VNC)画像データ、ボリュメトリックZ-エフェクティブ画像データ、カルシウムボリュメトリック画像データ、尿酸酸性のボリュメトリック画像データ、鉄化合物ボリュメトリック画像データ、ターゲット造影剤ボリュメトリック画像データ、潅流画像データ、テクスチャ解析画像データ等に基づく従来の(非スペクトル)画像データを含む。
The
計算システム122は、一時的記憶媒体を除き、物理メモリ及び/又は他の非一時的記憶媒体を含むコンピュータ読取り可能な記憶媒体(「メモリ」)126において記憶される少なくとも一つのコンピュータ読取り可能な命令を実行する少なくとも一つのプロセッサ124(例えば、マイクロプロセッサ、中央演算処理装置など)を含む。マイクロプロセッサ124は、搬送波、信号、又は他の一時的媒体によって運ばれる一つ又はそれより多くのコンピュータ可読命令も実行することができる。計算システム122は、ディスプレイモニター、フィルマ等のような出力装置128及びマウス、キーボード等のような入力装置130を更に含む。
命令は、この例において、スペクトルデータ視覚化モジュール132を含む。 以下に詳細に説明するように、スペクトルデータ視覚化モジュール132は、一つの例において、ユーザーインタラクティブグラフィカルユーザインタフェース(GUI)において、異なるブレンドスペクトル画像タイプのセットを視覚的に表示する。 たとえば、スペクトルデータ視覚化モジュール132は、複数の中間の異なるブレンドスペクトル画像タイプを通じて、スペクトル画像の一つのタイプからスペクトル画像の他のタイプにわたる、一連のブレンドスペクトル画像タイプのユーザー選択される一つを表示することができる。一つのブレンド画像から他へ切り替えることは、単一ブレンドポイントパラメータを通じてなされることができる。 表示は、中間画像の少なくとも二つの間で異なる透明度レベルを使って中間画像上にわたって半透明画像オーバレイを重ね合わせることも含む。一つの例において、これはスペクトル画像データの視覚化を効果的及び/又は容易に使うことを可能にする。
The instructions include, in this example, a spectral
記載の計算システム122は、データリポジトリ134から得られる画像データを処理する。 データリポジトリの例は、画像保管通信システム(PACS)、放射線医学情報システム(RIS)、病院情報システム(HIS)、電子医療記録(EMR)、データベース、サーバー、イメージングシステム、コンピュータ及び/又は他のデータリポジトリを含む。 データは、医療用ディジタルイメージング及び通信(DICOM)、ヘルスレベル7(HL7)並びに/又は他のプロトコルを介して転送され得る。バリエーションにおいて、画像データはイメージングシステム100及び/又は他のイメージングシステムから得られることができる。
The described
図2は、スペクトルデータ視覚化モジュール132の例を図示する。
FIG. 2 illustrates an example of the spectral
スペクトルデータ視覚化モジュール132は、複数のスペクトル画像データブレンドマップ202を含む。 スペクトル画像データブレンドマップ202の各々は、スペクトル画像データの同じ又は異なる組合せのために異なるブレンドスキームを規定する。 スペクトル画像データブレンドマップ202は、デフォルトであってもよく、ユーザー規定されてもよい。 各々のブレンドスキームは、少なくとも二つの異なるブレンドポイントパラメータを含み、各々は異なるスペクトル画像データタイプの異なるブレンド寄与を規定する。 ブレンドマップ202は、ウインドウ/レベル、透明度、カラーマップ等のような他の視覚化パラメータから独立し得る。
Spectral
スペクトルデータ視覚化モジュール132の例は、ブレンドマップオプションプレゼンター204を更に含む。 ブレンドマップオプションプレゼンター204は、ディスプレイモニター出力装置128で示されるGUIにおいて、利用可能なスペクトル画像データブレンドマップのリストを視覚的に示し、リストは複数のスペクトル画像データブレンドマップ202に基づく。 リストは、一つの例において、ポップアップ、ドロップダウン、リスト等のメニューのようなメニューにおける入力装置(例えば、マウス)選択可能なグラフィックインディシア(例えば、アイコン、テキスト、ピクチャなど)として視覚的に示される。
The example spectral
スペクトルデータ視覚化モジュール132の例は、スペクトル画像データセットレトリーバ206を更に含む。 スペクトル画像データセットレトリーバ206は、(例えば、入力装置130及び/又はその他を介して)ユーザー、デフォルト、プロトコル等、リストからの選択関心スペクトル画像ブレンドマップを示す入力信号を受信することに応じて、選択関心ブレンドマップに基づいてデータリポジトリ134及び/又は他の記憶装置から異なる画像データタイプの二つ又はそれより多くのセットを取り出す。
The example spectral
スペクトルデータ視覚化モジュール132の例は、スペクトル画像データブレンダー208を更に含む。 スペクトル画像データブレンダー208は、異なるスペクトル画像タイプを結合し、取り出される異なる画像データタイプ及び選択スペクトル画像ブレンドマップに基づいて、一連のブレンド画像を生成する。特定の画像データタイプのためのブレンドは、100%と等しいブレンド画像データタイプからの全寄与を用いて、0パーセントの寄与から100%の寄与までの範囲で変動することができ、通常、このようにブレンドされる画像は構造情報を表す。
The example spectral
特定の画像データタイプのためのブレンドは代わりに、ブレンド画像上に重ね合わされる画像オーバレイのための透明度レベルに対応してもよい。 このような画像は、機能的又は定量的データを表す。 このデータは、カラーで示されることができる。 このデータは、ブレンドグレイスケール画像レンジの部分に関してある状態を有してもよく、他のレンジ部分に関してより少ない、又は無しの状態を示してもよい。 このような例において、ブレンドグレイスケール画像が機能的又は定量的情報のより少ない状態を有する場合、このデータは、最大半透明カラー強度が現れるようにもたらされることができる。 The blend for a particular image data type may instead correspond to the transparency level for the image overlay overlaid on the blended image. Such images represent functional or quantitative data. This data can be shown in color. This data may have some states for parts of the blended grayscale image range and may show less or no states for other range parts. In such an example, if the blended grayscale image has less state of functional or quantitative information, this data can be provided such that maximum translucent color intensity appears.
スペクトルデータ視覚化モジュール132の例は、ブレンドスペクトル画像データプレゼンター210を更に含む。 ブレンドスペクトル画像データプレゼンター210は、ディスプレイモニター出力装置128を介して、ブレンドスペクトル画像の一つ又はそれより多くを視覚的に示す。 一つの例において、ブレンドスペクトル画像の全ては、並行して視覚的に示される。 他の例において、ブレンドスペクトル画像の全てより少ない数(例えば、一度に一つ、一度に二つなど)が視覚的に示される。
The example spectral
スペクトルデータ視覚化モジュール132の例は、ブレンドポイントオプションプレゼンター212を更に含む。 ブレンドマップオプションプレゼンター204は、ディスプレイモニター出力装置128において表されるGUIで、選択ブレンドマップのためのブレンドポイントのリストを視覚的に示す。 これは、各々のブレンドポイントにおける特定のブレンドを図的及び/又は数的に示すこと、現在表示されるブレンドポイントを示すこと、他のブレンドポイントにスイッチする方法を提供すること等を含む。
The example spectral
以下は、3つの異なる画像データセットタイプ(仮想非造影画像、ヨウ素単独画像及び従来コントラスト画像)がブレンドされる上記の特定の非限定的な例を記述する。 The following describes the above specific non-limiting examples in which three different image dataset types (virtual non-contrast image, iodine alone image and conventional contrast image) are blended.
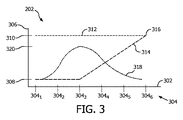
図3は、スペクトル画像データブレンドマップ202の例を示す。 x軸302は、異なるブレンドポイント304を示す。 この例において、6つの異なるブレンドポイント3041 … 3046が存在する。 y軸306は、最小値308(例えば、ゼロ(0))から最大値310(例えば、1(1))の範囲で変動する、相対重みを示す。 他の例において、ブレンドポイントは多かれ少なかれ存在し得る。
FIG. 3 shows an example of the spectral image data blend
第一のカーブ312は、異なるブレンドポイント304の機能として仮想非造影画像のための第一の重みを表す。 この例において、第一の重みは常に最大値310になる。
The
第二のカーブ314は、異なるブレンドポイント304の機能として従来コントラスト画像316まで、仮想非造影画像と更に結合されるように、ヨウ素単独画像をスケーリングする第二の重みを表す。この例において、第二の重みは、第一のブレンド3041から第3のブレンドポイント3043までで最小値308になり、第6のブレンドポイント3046において最大値になり、最小値から最大値までその間で線形に増加する。 ヨウ素単独画像データのスケーリングは、造影剤分布の有意な解釈を維持する正確なHUスケールまでデータをスケーリングする。
The
第三のカーブ318は、異なるブレンドポイントの機能として、ヨウ素単独画像の視覚化表示(例えばカラーマップ透明度)のための第3の重みを表す。 この例において、第3の重みは通常、最小値308及び最大310の間で、重み320においてベルのピークを備えるベル形状になる。
The
上記の重みは、非限定的であり、説明目的のために提供され、他の重みもここに考えられることが理解されるべきである。 It should be understood that the above weights are non-limiting and are provided for illustrative purposes, other weights are contemplated herein.
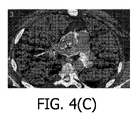
図4は、図3のスペクトル画像データブレンドマップ202のブレンドポイントの各々に対するブレンド画像例を示す。 図4(A)はブレンドポイント1に対する画像を示し、図4(B)はブレンドポイント2に対する画像を示し、 図4(C)はブレンドポイント3に対する画像を示し、図4(D)はブレンドポイント4に対する画像を示し、 図4(E)はブレンドポイント5に対する画像を示し、図4(F)はブレンドポイント6に対する画像を示す。
FIG. 4 shows an example blend image for each of the blend points of the spectral image data blend
この例において、仮想非造影画像、ヨウ素単独画像及び従来コントラスト画像は、グレイスケール値においてハウンスフィールドユニットを使って表される。 オーバレイ定量ヨウ素単独画像もこの場合、グレイスケールで表される。 しかしながら、他の視覚化がここに考えられることを理解すべきである。 たとえば、各々のボクセルにおける純粋なヨウ素の量を定量化する定量ヨウ素単独画像データは、代わりに半透明カラーマップにおいて表されることができる。 In this example, virtual non-contrast images, iodine-only images and conventional contrast images are represented using Hounsfield units at grayscale values. The overlay quantitative iodine alone image is also represented in this case in gray scale. However, it should be understood that other visualizations are possible here. For example, quantitative iodine-only image data quantifying the amount of pure iodine in each voxel can instead be represented in a translucent color map.
一つの例において、図3のスペクトル画像データブレンドマップ202は、ブレンドスペクトル画像データに伴って表示される。 この例において、表示されるスペクトル画像データブレンドマップは、ブレンドポイントオプション212を示す。 このように、ユーザーは、特定のブレンドポイントに対応する画像を可視化するために単に関心ブレンドポイント上でクリックすることができる。
In one example, the spectral image data blend
選択可能な専用ブレンドポイントを通じて、ユーザーは、仮想非造影画像、従来コントラストCT画像、及び融合ヨウ素単独画像データのブレンドを通じて、仮想非造影画像から従来コントラストCT画像に画像を変えることができる。このように表示画像を徐々に変えることによって、オブザーバーは評価中に関連する構造のフォーカス及び認知を失わない一方、異なる特性を評価する。 Through a selectable dedicated blend point, the user can change the image from a virtual non-contrast image to a conventional contrast CT image through a blend of virtual non-contrast image, conventional contrast CT image, and fused iodine alone image data. By gradually changing the displayed image in this way, the observer evaluates different properties while not losing the focus and cognition of the relevant structure during the evaluation.
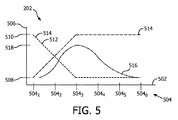
図5は、低エネルギー画像、従来コントラスト画像及びヨウ素単独画像のためのスペクトル画像データブレンドマップ例を示す。 FIG. 5 shows examples of spectral image data blend maps for low energy images, conventional contrast images and iodine alone images.
x軸502は、異なるブレンドポイント504を表す。 この例において、6つの異なるブレンドポイント5041,… ,5046がある。 y軸506は最小値508(例えば、ゼロ(0))から最大値510(例えば、1(1))の範囲になる相対重みを表す。他の例において、多かれ少なかれブレンドポイントが存在し得る。
The
第一のカーブ512は、異なるブレンドポイント504の機能として低エネルギー画像514をスケーリングする第一の重みを表す。 この例において、第一の重みは、第一のブレンドポイント5041における最大値510並びに第3のブレンドポイント5043及びその後における最小値508になる。
The
第二のカーブ514は、異なるブレンドポイント504の機能として従来コントラスト画像をスケーリングする第二の重みを表す。 この例において、第二の重みは、第一のブレンドポイント5041における最小値508になり、第3のブレンドポイント5043及びその後における最大値510まで線形に増加する。
The
第三のカーブ516は、異なるブレンドポイントの機能として、ヨウ素単独画像の透明性のための第3の重みを表す。 この例において、第3の重みは通常、最小値508及び最大値510の間で、重み520においてベルのピークを備えるベル形状になる。
The
このオプションで、グレイスケールは予め選択される低エネルギーで仮想モノクロ画像から始まり、連続的に従来CT画像に変換される。 融合スケールは、ヨウ素マップ又は他の定量マップを表す。重みは、融合定量マップによる従来CT、従来CT画像単独に対して、モノクロ低エネルギーの連続ビューを可能にするように設計される。 With this option, the grayscale is transformed into a conventional CT image, starting from a preselected low energy virtual monochrome image. The fusion scale represents the iodine map or other quantitative map. The weights are designed to allow monochrome low-energy continuous views for conventional CT, conventional CT images alone with fused quantitative maps.
図6は、低エネルギー画像、高エネルギー画像及びヨウ素単独画像のためのスペクトル画像データブレンドマップ例を表す。 FIG. 6 represents example spectral image data blend maps for low energy images, high energy images and iodine alone images.
x軸602は、異なるブレンドポイント604を表す。この例において、6つの異なるブレンドポイント6041,… ,6046がある。 y軸606は最小値608(例えば、ゼロ(0))から最大値610(例えば、1(1))の範囲になる相対重みを表す。他の例において、多かれ少なかれブレンドポイントが存在し得る。
The
第一のカーブ612は、異なるブレンドポイント604の機能として低エネルギー画像614をスケーリングする第一の重みを表す。 この例において、第一の重みは、第一のブレンドポイント6041における最大値610並びに第6のブレンドポイント6043及びその後における最小値608になる。
The
第二のカーブ616は、異なるブレンドポイント604の機能として高エネルギー画像618をスケーリングする第二の重みを表す。 この例において、第一の重みは、第一のブレンドポイント6041における最小値610並びに第6のブレンドポイント6043及びその後における最大値608になる。
The
第三のカーブ620は、異なるブレンドポイントの機能として、ヨウ素単独画像の透明性のための第3の重みを表す。 この例において、第3の重みは、ブレンドポイント1 6041からブレンドポイント6 6046までの「S」字形になる。
The
この例は、高エネルギーモノクロ画像に結合される間、その最大値を得る定量マップオーバレイに異なるモノクロ画像の間の連続シフトを結合する。 This example combines a continuous shift between different monochrome images into a quantitative map overlay that obtains its maximum while being combined with a high energy monochrome image.
上記の例において、例えば、カラーオーバレイを意図する、示されたヨウ素マップカーブは、スペクトルCT Z-エフェクティブマップ、ダイナミックコントラスト強調CT潅流マップ、CTテクスチャ解析マップ、スペクトルCTターゲット造影剤マップ、スペクトルCT尿酸マップ等のような他の機能的又は定量的データタイプと置換されることができることに注意すべきである。 In the above example, the iodine map shown, for example intended for color overlay, is a spectral CT Z-effective map, a dynamic contrast enhanced CT perfusion map, a CT texture analysis map, a spectral CT target contrast agent map, a spectral CT uric acid. It should be noted that it can be replaced with other functional or quantitative data types such as maps etc.
図7は、スペクトル画像データを視覚化する方法例を示す。 FIG. 7 shows an example method for visualizing spectral image data.
行為の順序は限定的ではないことを理解すべきである。そのため、他の順序も本明細書で予期される。加えて、一つ若しくは複数の行為が省略され且つ/又は一つ若しくは複数の追加の行為が含められても良い。 It should be understood that the order of actions is not limiting. As such, other orders are also contemplated herein. Additionally, one or more acts may be omitted and/or one or more additional acts may be included.
702において、患者のスペクトル画像データが得られる。 ここに記載されるように、スペクトル画像データは、それから導出され、及び/又はシミュレーションされる再構成スペクトル画像データ及び/又はボリュメトリックセットを含む。スペクトル画像データは、患者の同じスキャン又は異なるスキャンからもたらされ得る。 At 702, patient spectral image data is obtained. As described herein, spectral image data includes reconstructed spectral image data and/or volumetric sets derived therefrom and/or simulated. The spectral image data may come from the same scan of the patient or different scans.
704において、所定の関心スペクトル画像データブレンドマップを特定する信号が受信される。 ここに論じられるように、各々のマップは、画像データタイプのそれ自体の組合せを含み、各々の画像データタイプは、重みのそれ自体のセットを各々備える複数のブレンドポイントを含む。 At 704, a signal identifying a predetermined spectral image data blend map of interest is received. As discussed herein, each map includes its own combination of image data types, and each image data type includes a plurality of blend points, each with its own set of weights.
706において、複数の異なるスペクトル画像データタイプは、特定された所定のスペクトル画像データブレンドマップに基づいて取得スペクトル画像データから取り出される。 At 706, a plurality of different spectral image data types are retrieved from the acquired spectral image data based on the identified predetermined spectral image data blend maps.
708において、取り出される複数の異なるスペクトル画像データタイプは、選択される所定のスペクトル画像データブレンドマップによってブレンドされる。 必要な場合、たとえば、画像データセットは、画像レジストレーションアルゴリズムによって空間的にレジストレーションされ、異なる画像データセットが異なるスキャンからもたらされる。 At 708, the retrieved different spectral image data types are blended according to a selected predetermined spectral image data blend map. If necessary, for example, the image datasets are spatially registered by an image registration algorithm, with different image datasets coming from different scans.
710において、ブレンドポイントの少なくとも一つに対応する少なくとも一つのブレンド画像が視覚的に表示される。 表示する特定の画像は、デフォルト、ユーザー選択、イメージングプロトコル等に基づかれ得る。 At 710, at least one blend image corresponding to at least one of the blend points is visually displayed. The particular image to display may be based on defaults, user preferences, imaging protocols, etc.
712において、異なる関心ブレンドポイントを示す第二の信号は受信される。 一つの例において、これは所定のマウス移動、キーボードアロー、スクリーンに示されるスライダー、テキストボックスにおける数字入力などを通じて実現されることができる。 At 712, a second signal indicative of different blend points of interest is received. In one example, this can be accomplished through certain mouse movements, keyboard arrows, sliders shown on the screen, number entry in text boxes, etc.
714において、新たな関心ブレンドポイントに対応する少なくとも一つのブレンド画像が視覚的に表示される。 At 714, at least one blended image corresponding to the new blend point of interest is visually displayed.
行為712/714は、ビューイングの間、繰り返されることができる。
716において、随意に、表示されるブレンド画像は、ブレンドマップから独立する操作を通じて、視覚的に強調されることができる。 At 716, optionally, the displayed blended image can be visually enhanced through operations independent of the blend map.
718において、随意に、異なる所定の関心スペクトル画像データブレンドを特定する第3の信号が受信され、少なくとも行為706-710が繰り返される。 At 718, optionally, a third signal identifying a different predetermined spectrum of interest image data blend is received and at least acts 706-710 are repeated.
上記の内容は、コンピュータプロセッサによって実行されるときに記載された行為をそのプロセッサに実行させる、コンピュータ可読記憶媒体上に符号化され又は埋め込まれるコンピュータ可読命令によって実施され得る。加えて、又は代わりに、コンピュータ可読命令の少なくとも一つが信号、搬送波、又は他の一時的媒体によって運ばれる。 The foregoing may be implemented by computer readable instructions encoded or embedded on a computer readable storage medium, which when executed by a computer processor causes the processor to perform the described acts. Additionally or alternatively, at least one of the computer readable instructions is carried by a signal, carrier wave, or other transitory medium.
本発明が好ましい実施形態に関して説明されてきた。上記の詳細な説明を読んで理解するとき、他者は修正形態及び改変形態に気付くことがある。添付の特許請求の範囲又はその均等物の範囲内に含まれる限り、本発明はこのような全ての修正形態及び改変形態を含むものとして構成されることを意図する。 The invention has been described with reference to the preferred embodiments. When reading and understanding the above detailed description, others may be aware of modifications and variations. It is intended that the invention be construed as including all such modifications and alterations insofar as they come within the scope of the appended claims or the equivalents thereof.
Claims (15)
前記第一のブレンドポイントは、第一のセットの重み値を含み、 前記第一のセットの重み値は、前記複数の異なるタイプのスペクトルコンピューター断層撮影画像の各々の構造スペクトルコンピューター断層撮影画像のための重み値を含み、 前記少なくとも二つの構造スペクトルコンピューター断層撮影画像は、前記第一のセットの重み値に基づいて結合される、ステップと、
表示装置を介して前記第一の単一ブレンド構造コンピューター断層撮影画像を表示するステップと、
前記第一のスペクトルコンピューター断層撮影画像データブレンドマップの前記第一のブレンドポイントに基づいて前記複数の異なるタイプのスペクトルコンピューター断層撮影画像からの機能スペクトルコンピューター断層撮影画像を前記表示された第一の単一ブレンド構造コンピューター断層撮影画像にわたって重ね合わせるステップであって、前記機能スペクトルコンピューター断層撮影画像は機能情報を表し、
前記第一のブレンドポイントは第一のセットの透明度値を含み、前記第一のセットの透明度値は、前記複数の異なるタイプのスペクトルコンピューター断層撮影画像の各機能スペクトルコンピューター断層撮影画像のための透明度値を含み、前記機能スペクトルコンピューター断層撮影画像は、前記第一のセットの透明度値に基づいて前記表示された第一の単一ブレンド構造コンピューター断層撮影画像にわたって重ね合わされる、ステップと、
前記第一のスペクトルコンピューター断層撮影画像データブレンドマップのグラフィカル表示を視覚的に表示するステップであって、前記グラフィカル表示は、前記少なくとも二つの構造スペクトルコンピューター断層撮影画像の各々の前記重み値及び前記機能スペクトルコンピューター断層撮影画像の前記透明度値を視覚的に示す、ステップと
を有する、方法。 First Spectral Computed Tomography Image Data Blending at least two structural Spectral Computed Tomography images from different types of Spectral Computed Tomography images based on a first blend point in a blend map Combining with a tomographic image, wherein the at least two structure spectrum computed tomographic images represent structural information,
The first blend point comprises a first set of weight values, the first set of weight values for structural spectral computed tomography images of each of the plurality of different types of spectral computed tomography images. And the at least two structure spectral computed tomography images are combined based on the first set of weight values,
Displaying the first single blend structure computed tomography image via a display device;
Based on the first blend point of the first spectral computed tomography image data blend map, a functional spectral computed tomography image from the plurality of different types of spectral computed tomography images is displayed in the first single image. One blended structure computed tomographic image overlaid, wherein the functional spectrum computed tomographic image represents functional information;
The first blend point comprises a first set of transparency values, the first set of transparency values being transparency for each functional spectral computed tomography image of the plurality of different types of spectral computed tomography images. Values, the functional spectral computed tomography image is overlaid over the displayed first single blend structure computed tomography image based on the first set of transparency values.
Visually displaying a graphical representation of the first spectral computed tomography image data blend map, the graphical representation comprising the weight value and the function of each of the at least two structural spectral computed tomography images. Visually indicating the transparency value of the spectral computed tomography image.
前記第二のブレンドポイントは、第二のセットの重み値を含み、 前記第二のセットの重み値は、前記複数の異なるタイプのスペクトルコンピューター断層撮影画像の前記構造スペクトルコンピューター断層撮影画像の各々のための重み値を含み、前記第一及び第二のセットの重み値は異なり、 前記少なくとも二つの構造スペクトルコンピューター断層撮影画像は、前記第二のセットの重み値に基づいて結合される、ステップと、
前記表示装置を介して前記第二の単一ブレンド構造コンピューター断層撮影画像を表示するステップと
を更に有する、請求項1に記載の方法。 Combining the at least two structural spectral computed tomographic images that are identical to each other based on a second blend point of the first spectral computed tomographic image data blend map into a second single blend structural computed tomographic image. ,
The second blend point comprises a second set of weighting values, the second set of weighting values for each of the structural spectral computed tomography images of the plurality of different types of spectral computed tomography images. The first and second sets of weight values are different, the at least two structural spectral computed tomography images are combined based on the second set of weight values. ,
Displaying the second monoblend structure computed tomographic image through the display device.
前記選択に対応する前記第一又は第二の単一ブレンド構造コンピューター断層撮影画像を表示するステップと
を更に有する、請求項2に記載の方法。 Receiving a signal indicative of selection of one of the first or second blend points;
Displaying the first or second monoblend structure computed tomographic image corresponding to the selection.
前記第二の選択に対応する前記第一又は第二の単一ブレンド構造コンピューター断層撮影画像の他方を表示するステップと
を更に有する、請求項3に記載の方法。 Receiving a second signal indicative of the other second selection of one of the first or second blend points;
4. The method of claim 3, further comprising displaying the other of the first or second single blend structure computed tomographic images corresponding to the second selection.
を更に有する、請求項2に記載の方法。 Superimposing the functional spectral computed tomography image over the second single blend structure computed tomography image based on the second blend point, the second blend point comprising a second set of Including a transparency value, the second set of transparency values includes a transparency value for each functional spectral computed tomography image of the plurality of different types of spectral computed tomography images, wherein the functional spectral computed tomography image is 3. The method of claim 2, further comprising the step of: superimposing over the displayed second single blend structure computed tomographic image based on the second set of transparency values.
透明度レベルに基づいて前記機能画像を重ね合わせるステップと、
前記第一のブレンドポイントのために第一の透明度レベルを使うステップと、
前記第二のブレンドポイントのために第二の異なる透明度レベルを使うステップと
を更に有する、請求項6に記載の方法。 One of the plurality of different types of spectral images is a functional image that represents functional information, the blending comprising overlaying the functional images over at least two blends of the plurality of different types of spectral images;
Superimposing the functional images on the basis of the transparency level,
Using a first transparency level for the first blend point;
7. The method of claim 6, further comprising using a second different transparency level for the second blend point.
を更に有する、請求項7に記載の方法。 8. The method of claim 7, further comprising the step of overlaying the functional image data type as a translucent color overlay.
前記第二の異なるスペクトルコンピューター断層撮影画像データブレンドマップの第一のブレンドポイントに基づいて異なるセットの構造スペクトルコンピューター断層撮影画像を第三の単一ブレンド構造コンピューター断層撮影画像に結合するステップと、
前記第二の異なるスペクトルコンピューター断層撮影画像データブレンドマップの第二のブレンドポイントに基づいて前記異なるセットの構造スペクトルコンピューター断層撮影画像を第四の単一ブレンド構造コンピューター断層撮影画像に結合するステップと、
前記選択に対応する前記第三又は第四の単一ブレンド構造コンピューター断層撮影画像の一つを表示するステップと
を更に有する、請求項1乃至10の何れか一項に記載の方法。 Receiving an input representative of a selection of a second different spectral computed tomography image data blend map;
Combining a different set of structural spectral computed tomographic images into a third single blend structural computed tomographic image based on a first blend point of the second different spectral computed tomographic image data blend map;
Combining the different set of structural spectral computed tomographic images into a fourth single blend structural computed tomographic image based on a second blend point of the second different spectral computed tomographic image data blend map;
11. Displaying one of the third or fourth single blend structure computed tomography images corresponding to the selection, further comprising the method of any of claims 1-10.
命令を実行するように構成されるプロセッサであって、前記命令は前記プロセッサに、
第一のスペクトルコンピューター断層撮影画像データブレンドマップの第一のブレンドポイントに基づいて複数の異なるタイプのスペクトルコンピューター断層撮影画像からの少なくとも二つの構造スペクトルコンピューター断層撮影画像を第一の単一ブレンド構造コンピューター断層撮影画像に結合するステップであって、前記少なくとも二つの構造スペクトルコンピューター断層撮影画像は構造情報を表し、
前記第一のブレンドポイントは、第一のセットの重み値を含み、 前記第一のセットの重み値は、前記複数の異なるタイプのスペクトルコンピューター断層撮影画像の各々の構造スペクトルコンピューター断層撮影画像のための重み値を含み、前記少なくとも二つの構造スペクトルコンピューター断層撮影画像は、前記第一のセットの重み値に基づいて結合される、ステップと、
表示装置を介して前記第一の単一ブレンド構造コンピューター断層撮影画像を表示するステップと、
前記第一のスペクトルコンピューター断層撮影画像データブレンドマップの前記第一のブレンドポイントに基づいて前記複数の異なるタイプのスペクトルコンピューター断層撮影画像からの機能スペクトルコンピューター断層撮影画像を前記表示された第一の単一ブレンド構造コンピューター断層撮影画像にわたって重ね合わせるステップであって、前記機能スペクトルコンピューター断層撮影画像は機能情報を表し、
前記第一のブレンドポイントは第一のセットの透明度値を含み、前記第一のセットの透明度値は、前記複数の異なるタイプのスペクトルコンピューター断層撮影画像の各機能スペクトルコンピューター断層撮影画像のための透明度値を含み、前記機能スペクトルコンピューター断層撮影画像は、前記第一のセットの透明度値に基づいて前記表示された第一の単一ブレンド構造コンピューター断層撮影画像にわたって重ね合わされる、ステップと、
前記第一のスペクトルコンピューター断層撮影画像データブレンドマップのグラフィカル表示を視覚的に表示するステップであって、前記グラフィカル表示は、前記少なくとも二つの構造スペクトルコンピューター断層撮影画像の各々の前記重み値及び前記機能スペクトルコンピューター断層撮影画像の前記透明度値を視覚的に示す、ステップと
を実行させる、プロセッサと
を有する、計算システム。 A memory configured to store the instructions of the spectral data visualization module,
A processor configured to execute instructions, wherein the instructions direct the processor
First Spectral Computed Tomography Image Data Blending At least two structural spectral computed tomography images from different types of spectral computed tomography images based on a first blend point of the map Combining with a tomographic image, wherein the at least two structure spectrum computed tomographic images represent structural information,
The first blend point comprises a first set of weight values, the first set of weight values for structural spectral computed tomography images of each of the plurality of different types of spectral computed tomography images. , The at least two structural spectral computed tomography images are combined based on the first set of weight values, and
Displaying the first single blend structure computed tomography image via a display device;
Based on the first blend point of the first spectral computed tomography image data blend map, a functional spectral computed tomography image from the plurality of different types of spectral computed tomography images is displayed in the first single image. One blended structure computed tomographic image overlaid, wherein the functional spectrum computed tomographic image represents functional information;
The first blend point comprises a first set of transparency values, the first set of transparency values being transparency for each functional spectral computed tomography image of the plurality of different types of spectral computed tomography images. Values, the functional spectral computed tomography image is overlaid over the displayed first single blend structure computed tomography image based on the first set of transparency values.
Visually displaying a graphical representation of the first spectral computed tomography image data blend map, the graphical representation comprising the weight value and the function of each of the at least two structural spectral computed tomography images. A processor for performing the steps of visually indicating the transparency value of the spectral computed tomography image.
請求項14に記載の計算システム。 The processor uses the transparency value for each of a different set of weight values and a plurality of different blend points,
The calculation system according to claim 14.
Applications Claiming Priority (3)
| Application Number | Priority Date | Filing Date | Title |
|---|---|---|---|
| US201462046472P | 2014-09-05 | 2014-09-05 | |
| US62/046,472 | 2014-09-05 | ||
| PCT/IB2015/056765 WO2016035048A1 (en) | 2014-09-05 | 2015-09-04 | Visualization of spectral image data |
Publications (3)
| Publication Number | Publication Date |
|---|---|
| JP2017529906A JP2017529906A (en) | 2017-10-12 |
| JP2017529906A5 JP2017529906A5 (en) | 2018-10-11 |
| JP6738320B2 true JP6738320B2 (en) | 2020-08-12 |
Family
ID=54292839
Family Applications (1)
| Application Number | Title | Priority Date | Filing Date |
|---|---|---|---|
| JP2017511326A Active JP6738320B2 (en) | 2014-09-05 | 2015-09-04 | Visualization of spectral image data |
Country Status (5)
| Country | Link |
|---|---|
| US (1) | US10546370B2 (en) |
| EP (1) | EP3189496A1 (en) |
| JP (1) | JP6738320B2 (en) |
| CN (1) | CN106663319B (en) |
| WO (1) | WO2016035048A1 (en) |
Families Citing this family (9)
| Publication number | Priority date | Publication date | Assignee | Title |
|---|---|---|---|---|
| US10074190B2 (en) * | 2014-10-30 | 2018-09-11 | Koninklijke Philips N.V. | Texture analysis map for image data |
| KR102598268B1 (en) * | 2016-10-28 | 2023-11-06 | 삼성전자주식회사 | Apparatus and method for rearranging protocols in radiography system |
| CN110072457A (en) * | 2016-12-15 | 2019-07-30 | 皇家飞利浦有限公司 | Vascular structure is visualized |
| EP3695251A1 (en) | 2017-10-09 | 2020-08-19 | Koninklijke Philips N.V. | Material-selective adaptive blending of volumetric image data |
| JP6923414B2 (en) * | 2017-10-13 | 2021-08-18 | キヤノンメディカルシステムズ株式会社 | X-ray computed tomography equipment, medical imaging equipment, and programs |
| EP3735631A4 (en) * | 2018-03-01 | 2021-03-03 | Samsung Electronics Co., Ltd. | Devices, methods, and computer program for displaying user interfaces |
| EP3605448A1 (en) * | 2018-08-01 | 2020-02-05 | Koninklijke Philips N.V. | Method for providing automatic adaptive energy setting for ct virtual monochromatic imaging |
| US11210779B2 (en) * | 2018-09-07 | 2021-12-28 | Siemens Healthcare Gmbh | Detection and quantification for traumatic bleeding using dual energy computed tomography |
| CN113487572A (en) * | 2021-07-07 | 2021-10-08 | 中国人民解放军总医院第一医学中心 | Medical image deep learning method and device based on homologous multi-window technology |
Family Cites Families (23)
| Publication number | Priority date | Publication date | Assignee | Title |
|---|---|---|---|---|
| US5187658A (en) * | 1990-01-17 | 1993-02-16 | General Electric Company | System and method for segmenting internal structures contained within the interior region of a solid object |
| US6226352B1 (en) * | 1998-09-08 | 2001-05-01 | Veritas Pharmaceuticals, Inc. | System and method for radiographic imaging of tissue |
| US6628983B1 (en) * | 2000-10-25 | 2003-09-30 | Koninklijke Philips Electronics N.V. | Nuclear imaging systems and methods with feature-enhanced transmission imaging |
| US8090429B2 (en) * | 2004-06-30 | 2012-01-03 | Siemens Medical Solutions Usa, Inc. | Systems and methods for localized image registration and fusion |
| DE102006001681B4 (en) | 2006-01-12 | 2008-07-10 | Wismüller, Axel, Dipl.-Phys. Dr.med. | Method and device for displaying multi-channel image data |
| JP5389321B2 (en) * | 2006-10-02 | 2014-01-15 | ジーイー・メディカル・システムズ・グローバル・テクノロジー・カンパニー・エルエルシー | X-ray tomography equipment |
| JP5107569B2 (en) * | 2006-12-13 | 2012-12-26 | ジーイー・メディカル・システムズ・グローバル・テクノロジー・カンパニー・エルエルシー | X-ray CT system |
| US7920669B2 (en) | 2007-07-25 | 2011-04-05 | Siemens Aktiengesellschaft | Methods, apparatuses and computer readable mediums for generating images based on multi-energy computed tomography data |
| US8233683B2 (en) * | 2007-08-24 | 2012-07-31 | Siemens Aktiengesellschaft | Methods for non-linear image blending, adjustment and display |
| JP2009237747A (en) * | 2008-03-26 | 2009-10-15 | Denso Corp | Data polymorphing method and data polymorphing apparatus |
| US8115784B2 (en) * | 2008-11-26 | 2012-02-14 | General Electric Company | Systems and methods for displaying multi-energy data |
| EP2389663B1 (en) | 2009-01-22 | 2018-10-31 | Koninklijke Philips N.V. | Pixel-feature hybrid fusion for pet/ct images |
| JP5666781B2 (en) * | 2009-02-27 | 2015-02-12 | 株式会社東芝 | X-ray imaging apparatus and X-ray image processing method |
| US20100310036A1 (en) | 2009-06-04 | 2010-12-09 | General Electric Company | Computed tomography method and apparatus |
| JP5877833B2 (en) | 2010-07-22 | 2016-03-08 | コーニンクレッカ フィリップス エヌ ヴェKoninklijke Philips N.V. | Multiple image fusion |
| JP5755031B2 (en) * | 2011-05-30 | 2015-07-29 | ジーイー・メディカル・システムズ・グローバル・テクノロジー・カンパニー・エルエルシー | Image generating apparatus, X-ray CT apparatus, and program |
| WO2013000120A1 (en) * | 2011-06-28 | 2013-01-03 | 株式会社日立医疗器械 | Image processing method and image processing apparatus |
| US9646393B2 (en) * | 2012-02-10 | 2017-05-09 | Koninklijke Philips N.V. | Clinically driven image fusion |
| JP2013172825A (en) * | 2012-02-24 | 2013-09-05 | Toshiba Corp | X-ray ct apparatus, and image display method |
| US8976264B2 (en) * | 2012-09-04 | 2015-03-10 | Duelight Llc | Color balance in digital photography |
| US9042512B2 (en) * | 2012-11-13 | 2015-05-26 | General Electric Company | Multi-sector computed tomography image acquisition |
| CN103049895B (en) * | 2012-12-17 | 2016-01-20 | 华南理工大学 | Based on the multimode medical image fusion method of translation invariant shearing wave conversion |
| CN103617605A (en) * | 2013-09-22 | 2014-03-05 | 天津大学 | Transparency weight fusion method for three-modality medical image |
-
2015
- 2015-09-04 EP EP15778724.3A patent/EP3189496A1/en not_active Withdrawn
- 2015-09-04 JP JP2017511326A patent/JP6738320B2/en active Active
- 2015-09-04 CN CN201580047435.4A patent/CN106663319B/en active Active
- 2015-09-04 WO PCT/IB2015/056765 patent/WO2016035048A1/en active Application Filing
- 2015-09-04 US US15/503,427 patent/US10546370B2/en active Active
Also Published As
| Publication number | Publication date |
|---|---|
| EP3189496A1 (en) | 2017-07-12 |
| US20170228857A1 (en) | 2017-08-10 |
| JP2017529906A (en) | 2017-10-12 |
| CN106663319A (en) | 2017-05-10 |
| WO2016035048A1 (en) | 2016-03-10 |
| CN106663319B (en) | 2021-07-27 |
| US10546370B2 (en) | 2020-01-28 |
Similar Documents
| Publication | Publication Date | Title |
|---|---|---|
| JP6738320B2 (en) | Visualization of spectral image data | |
| US9140803B2 (en) | Acquisition protocol assessment apparatus | |
| Megibow et al. | Dual-energy computed tomography: image acquisition, processing, and workflow | |
| US10269146B2 (en) | Image data segmentation and display | |
| JP2020175206A (en) | Image visualization | |
| US10074190B2 (en) | Texture analysis map for image data | |
| JP2020044341A (en) | Reconstructed image data visualization | |
| JP5614870B2 (en) | Rule-based volume drawing and exploration system and method | |
| US20200294653A1 (en) | Spectral (mulit-energy) imaging visualization | |
| JP6483677B2 (en) | 3D image data analysis and navigation | |
| JP6014496B2 (en) | Single scan multiprocedure imaging | |
| Jadidi et al. | Dependency of image quality on acquisition protocol and image processing in chest tomosynthesis—a visual grading study based on clinical data | |
| Hoffman et al. | Assessing nodule detection on lung cancer screening CT: the effects of tube current modulation and model observer selection on detectability maps | |
| WO2023088986A1 (en) | Optimized 2-d projection from 3-d ct image data |
Legal Events
| Date | Code | Title | Description |
|---|---|---|---|
| A521 | Request for written amendment filed |
Free format text: JAPANESE INTERMEDIATE CODE: A523 Effective date: 20180830 |
|
| A621 | Written request for application examination |
Free format text: JAPANESE INTERMEDIATE CODE: A621 Effective date: 20180830 |
|
| A131 | Notification of reasons for refusal |
Free format text: JAPANESE INTERMEDIATE CODE: A131 Effective date: 20190530 |
|
| A977 | Report on retrieval |
Free format text: JAPANESE INTERMEDIATE CODE: A971007 Effective date: 20190531 |
|
| A601 | Written request for extension of time |
Free format text: JAPANESE INTERMEDIATE CODE: A601 Effective date: 20190826 |
|
| A521 | Request for written amendment filed |
Free format text: JAPANESE INTERMEDIATE CODE: A523 Effective date: 20191118 |
|
| A131 | Notification of reasons for refusal |
Free format text: JAPANESE INTERMEDIATE CODE: A131 Effective date: 20191203 |
|
| A601 | Written request for extension of time |
Free format text: JAPANESE INTERMEDIATE CODE: A601 Effective date: 20200226 |
|
| A521 | Request for written amendment filed |
Free format text: JAPANESE INTERMEDIATE CODE: A523 Effective date: 20200528 |
|
| TRDD | Decision of grant or rejection written | ||
| A01 | Written decision to grant a patent or to grant a registration (utility model) |
Free format text: JAPANESE INTERMEDIATE CODE: A01 Effective date: 20200618 |
|
| A61 | First payment of annual fees (during grant procedure) |
Free format text: JAPANESE INTERMEDIATE CODE: A61 Effective date: 20200717 |
|
| R150 | Certificate of patent or registration of utility model |
Ref document number: 6738320 Country of ref document: JP Free format text: JAPANESE INTERMEDIATE CODE: R150 |
|
| R250 | Receipt of annual fees |
Free format text: JAPANESE INTERMEDIATE CODE: R250 |