JP6700574B2 - Electronic device, information display control method therefor, and information display control program - Google Patents
Electronic device, information display control method therefor, and information display control program Download PDFInfo
- Publication number
- JP6700574B2 JP6700574B2 JP2015186328A JP2015186328A JP6700574B2 JP 6700574 B2 JP6700574 B2 JP 6700574B2 JP 2015186328 A JP2015186328 A JP 2015186328A JP 2015186328 A JP2015186328 A JP 2015186328A JP 6700574 B2 JP6700574 B2 JP 6700574B2
- Authority
- JP
- Japan
- Prior art keywords
- altitude
- display
- graph
- range
- value
- Prior art date
- Legal status (The legal status is an assumption and is not a legal conclusion. Google has not performed a legal analysis and makes no representation as to the accuracy of the status listed.)
- Active
Links
Images


Description
本発明は、人体に装着又は携帯して使用する小型の電子機器及びその情報表示制御方法、情報表示制御プログラムに関する。 The present invention relates to a small electronic device that is worn on or carried by a human body, an information display control method therefor, and an information display control program.
近年、スマートフォン(高機能携帯電話機)やスマートウォッチ(腕時計型携帯端末)、GPSロガー(全地球測位システム(GPS)を利用した移動経路記録装置)等、人体に装着又は携帯して使用する小型の電子機器の普及が著しい。これらの機器は、使用者(ユーザ)に様々な情報を提供するためのディスプレイを有している。例えば特許文献1には、腕時計型の外観を有する登山支援情報処理装置において、現在時刻のほか、移動経過時間や現在高度等の数値情報、休憩案内塔の文字情報、登山ルートにおける標高差変化を示すグラフ等の各種の情報を、表示部に随時更新して表示することが開示されている。
In recent years, smart phones (high-performance mobile phones), smart watches (wrist watch type mobile terminals), GPS loggers (moving route recording devices using the Global Positioning System (GPS)), etc. The spread of electronic devices is remarkable. These devices have a display for providing various information to a user (user). For example, in
上述したような装着型や携帯型の電子機器においては、小型軽量であることに加え、表示面積の狭い表示部に各種の情報が視認性良く表示され、ユーザがその表示内容を直感的に把握できることが望ましい。そのため、表示部に簡略化された文字情報やアイコン等の図形を表示する場合には、当該表示部の表示面積が狭い場合であっても、当該情報を視認性良く提供することができるが、登山ルートの地図情報や高度変化のグラフ等の画像情報を表示する場合には、当該情報を視認性良く表示することができない場合がある。例えば、上述した特許文献1においては、登山ルートにおける標高差変化を示す情報が、ドットを積み重ねたグラフにより表示した例(図1参照)が記載されている。ここでは、グラフの表示領域(縦軸の標高範囲)が予め規定されているため、グラフの上限以上の標高の場合には、ドット表示が飽和してしまい(下限から上限までドットが表示されてしまい)、正確な高度変化をユーザに提供することができないという問題を有している。これはグラフの下限以下の標高の場合も同様であり、グラフにドットが全く表示されず、正確な標高差変化(高度変化)をユーザに提供することができない。
In the wearable and portable electronic devices as described above, in addition to being small and lightweight, various information is displayed on the display unit with a small display area with good visibility, and the user intuitively understands the displayed content. It is desirable to be able to. Therefore, when displaying simplified character information or graphics such as icons on the display unit, the information can be provided with good visibility even when the display area of the display unit is small. When displaying image information such as map information of a mountain climbing route or a graph of altitude change, the information may not be displayed with good visibility. For example, in the above-mentioned
そこで、本発明は、上述した問題点に鑑み、小型の表示部を備えた電子機器であっても、ユーザが必要とする情報を把握しやすい形態で表示することができる電子機器及びその情報表示制御方法、情報表示制御プログラムを提供することを目的とする。 Therefore, in view of the above-mentioned problems, the present invention is an electronic device including a small display unit, which can display information required by a user in a form that is easy to grasp, and an information display thereof. An object is to provide a control method and an information display control program.
本発明に係る電子機器は、
表示部と、
設定された移動ルート上の複数の時刻の各々に対する複数の高度の値を示すグラフを、前記表示部の、横軸が前記移動ルート上の時刻に対応するように設定され、縦軸が前記高度の値に対応するように設定されたグラフ表示領域に表示させるとともに、前記グラフの表示形態を制御する制御部と、
を備え、
前記制御部は、現在時刻に至るまでの過去の時刻における前記高度の値を示す第1表示形態と、現在時刻以降の将来の時刻における前記高度の値を示す第2表示形態と、を表示の形態を異ならせて前記グラフ表示領域に表示させることを特徴とする。
The electronic device according to the present invention is
Display part,
A graph showing a plurality of altitude values for each of a plurality of times set on the travel route, the horizontal axis of the display unit is set so as to correspond to the time on the travel route, the vertical axis is the altitude. While displaying in the graph display area set to correspond to the value of, the control unit for controlling the display form of the graph,
Equipped with
The control unit displays a first display form showing a value of the altitude at a past time up to the current time and a second display form showing a value of the altitude at a future time after the current time. It is characterized in that it is displayed in the graph display area in different forms .
本発明に係る情報表示制御方法は、
設定された移動ルート上の複数の時刻の各々に対する複数の高度の値を示すグラフを、表示部の、横軸が前記移動ルート上の時刻に設定され、縦軸が前記高度の値に設定されたグラフ表示領域に表示し、
前記グラフの表示形態を制御し、
前記表示形態の制御において、
現在時刻に至るまでの過去の時刻における前記高度の値を示す第1表示形態と、現在時刻以降の将来の時刻における前記高度の値を示す第2表示形態と、を表示の形態を異ならせて前記グラフ表示領域に表示させる、
ことを特徴とする。
The information display control method according to the present invention,
The graph showing a plurality of elevation value for each of a plurality of time on the set route of travel, the display unit, the horizontal axis is set to the time on the movement route, the vertical axis is set to the high value Displayed in the graph display area,
Controlling the display form of the graph,
Te control odors of the display form,
The first display form showing the value of the altitude at a past time up to the current time and the second display form showing the value of the altitude at a future time after the present time are displayed differently. Display in the graph display area,
It is characterized by
本発明に係る情報表示制御プログラムは、
コンピュータに、
設定された移動ルート上の複数の時刻の各々に対する複数の高度の値を示すグラフを、表示部の、横軸が前記移動ルート上の時刻に設定され、縦軸が前記高度の値に設定されたグラフ表示領域に表示させ、
前記グラフの表示形態を制御させ、
前記表示形態の制御において、
現在時刻に至るまでの過去の時刻における前記高度の値を示す第1表示形態と、現在時刻以降の将来の時刻における前記高度の値を示す第2表示形態と、を表示の形態を異ならせて前記グラフ表示領域に表示させる、
ことを特徴とする。
An information display control program according to the present invention,
On the computer,
The graph showing a plurality of elevation value for each of a plurality of time on the set route of travel, the display unit, the horizontal axis is set to the time on the movement route, the vertical axis is set to the high value Displayed in the graph display area,
Control the display form of the graph,
Te control odors of the display form,
The first display form showing the value of the altitude at a past time up to the current time and the second display form showing the value of the altitude at a future time after the current time are displayed differently. Display in the graph display area,
It is characterized by
本発明によれば、小型の表示部を備えた電子機器であっても、ユーザが必要とする情報を把握しやすい形態で表示することができる。 According to the present invention, even an electronic device having a small display unit can display information required by a user in a form that is easy to grasp.
以下、本発明に係る電子機器及び情報表示制御方法、情報表示制御プログラムについて、実施形態を示して詳しく説明する。ここでは、登山やトレッキング、ウォーキング等の、所望の移動ルートをユーザが移動する際に、移動ルートの少なくとも現時点を中心にした高度の過去の変化(高度履歴)又は将来の変化(予定高度)を、電子機器の表示部に表示する場合について説明する。 Hereinafter, an electronic device, an information display control method, and an information display control program according to the present invention will be described in detail with reference to embodiments. Here, when the user travels on a desired travel route such as mountain climbing, trekking, walking, etc., past changes in altitude (altitude history) or future changes (planned altitude) centered at least on the present time of the travel route are displayed. The case of displaying on the display unit of the electronic device will be described.
<電子機器>
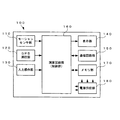
図1は、本発明に係る電子機器の適用例を示す外観図である。ここで、図1(a)は、本発明に係る電子機器をスマートウォッチに適用した場合の外観図であり、図1(b)は、電子機器をスマートフォンに適用した場合の外観図であり、図1(c)は、電子機器をGPSロガーに適用した場合の外観図である。図2は、本発明に係る電子機器の機能構成の一実施形態を示す機能ブロック図である。図3は、本実施形態に係る電子機器の表示部における表示例を示す概略図である。
<Electronic equipment>
FIG. 1 is an external view showing an application example of an electronic device according to the present invention. Here, FIG. 1A is an external view when the electronic device according to the present invention is applied to a smart watch, and FIG. 1B is an external view when the electronic device is applied to a smartphone, FIG. 1C is an external view when the electronic device is applied to a GPS logger. FIG. 2 is a functional block diagram showing an embodiment of the functional configuration of the electronic device according to the present invention. FIG. 3 is a schematic diagram showing a display example on the display unit of the electronic device according to the present embodiment.
本発明に係る電子機器は、ユーザの身体に装着、あるいは、ユーザに携帯される携帯端末であって、例えば図1(a)に示すように、腕時計型やリストバンド型等の外観形状を有するスマートウォッチ100Aを適用することができる。また、本発明に係る電子機器は、例えば図1(b)に示すようなスマートフォン100Bや、図1(c)に示すように、登山等のアウトドアにおいて、行動軌跡の記録やルート案内を行うGPSロガー100Cやナビゲーション端末等を適用することができる。以下、図1に示したような各種の機器を、便宜的に「電子機器100」と総称する。
The electronic device according to the present invention is a portable terminal worn on the user's body or carried by the user, and has an external shape such as a wristwatch type or a wristband type as shown in FIG. 1A, for example. The
このような電子機器100は、例えば図2に示すように、大別して、モーションセンサ部(測位部)110と、GPS測位部(測位部)120、入力操作部130と、表示部140と、通信回路部150と、演算回路部(制御部)160と、メモリ部(記憶部)170と、電源供給部180と、を備えている。
Such an
モーションセンサ部110は、加速度センサや角速度センサ(ジャイロセンサ)、磁気センサを有し、ユーザの動作状態(移動)に応じて電子機器100に加わる特定方向の力等や、地球の磁場(磁界)を検出する。また、GPS測位部120は、複数のGPS(Global Positioning System;全地球測位システム)衛星からの電波を受信して、緯度、経度情報に基づく地理的な位置データを取得する。モーションセンサ部110により検出されたセンサデータ(加速度データ、角速度データ、磁気データ)、及び、GPS測位部120により取得された位置データは、後述するメモリ部170の所定の記憶領域に保存される。ここで、本実施形態においては、後述するように、モーションセンサ部110により検出されたセンサデータ、及び、GPS測位部120により取得された位置データは、所定の時間間隔(後述する単位時間ごと)でユーザの現在位置を検出する際に利用される。そのため、電子機器100はモーションセンサ部110及びGPS測位部120のうち、いずれか一方のみを有しているものであってもよい。
The
入力操作部130は、図1に示した電子機器100(スマートウォッチ100Aやスマートフォン100B、GPSロガー100C等)の筐体に設けられた操作スイッチ132や、後述する表示部140の前面側(視野側)に設けられたタッチパネル134等を有し、電子機器100の動作電源や所望の機能のオン、オフ操作、各種設定等の入力操作に用いられる。
The
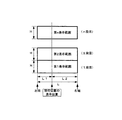
表示部140は、液晶方式や有機EL方式、電子ペーパー方式等の表示パネル142を有し、現在時刻のほか、少なくともユーザの動作中に取得した各種のデータに基づく情報を所定の形態で表示する。特に、表示部140は、例えば図3(a)、(b)に示すように、表示パネル142の所定の領域(グラフ表示領域)142aにユーザが予め登録した移動ルートに沿った高度(海抜高度又は標高であってもよい)の値を、グラフ画像等の所定の形態で表示する。グラフ表示領域142aにおける表示形態については詳しく後述する。また、表示パネル142の一部又は全部の領域の前面(ユーザの視野側)には、タッチパネル134が配置され、操作領域134aが設定されている。なお、表示パネル142は、電源供給部180に設けられたバッテリによる駆動時間を長くするため、カラー液晶方式や有機EL方式に比較して消費電力が少ない、例えばドットマトリクス方式のモノクロ液晶パネルや電子ペーパー方式の表示パネルを適用することが好ましい。
The
通信回路部150は、電子機器100の外部の機器(例えばパーソナルコンピュータ等)やネットワークとの間で、各種のデータを送信又は受信する。本実施形態においては、ユーザが所望する移動ルートに関する移動ルート情報を、例えばパーソナルコンピュータやインターネット等を介して取得して、後述するメモリ部170に保存する際や、電子機器100により取得された各種のデータ(移動履歴等)を、例えばパーソナルコンピュータやタブレット端末等により解析する際等に用いられる。ここで、通信回路部150を介して行われる通信は、例えば無線や有線、メモリカード等を用いた所定の通信形式が適用される。
The
演算回路部160は、計時機能を備えたCPU(中央演算処理装置)やMPU(マイクロプロセッサ)を有し、所定のプログラムを実行することにより、表示部140における表示動作や、モーションセンサ部110やGPS測位部120におけるセンシング動作等の、各種の動作を制御する。特に、演算回路部160は、モーションセンサ部110により取得したセンサデータを用いた自律航法や、GPS測位部120により取得した位置データに基づいて現在位置を検出し、メモリ部170に予め保存された移動ルート情報(高度情報を含む)と取得した現在位置とに基づいて、ユーザの移動中の高度の変化の履歴や予定をグラフ画像により表示パネル142のグラフ表示領域142aに表示する高度変化表示処理を実行する。この高度変化表示処理における一連の処理動作については詳しく後述する。
The
メモリ部170は、上述したモーションセンサ部110やGPS測位部120、演算回路部160等において取得されたり生成(算出)されたりしたデータ等を、時間データに関連付けて所定の記憶領域に保存する。また、メモリ部170は、ユーザにより登録された移動ルート(例えば登山ルート等)に関する移動ルート情報や、演算回路部160において実行される高度変化表示処理により生成される各種のデータを所定の記憶領域に保存する。ここで、移動ルート情報には、移動ルートに沿った高度の値を示す高度情報が含まれている。また、メモリ部170は、演算回路部160において実行される制御プログラムやアルゴリズムプログラムを保存する。なお、これらのプログラムを格納するものであってもよい。
The
電源供給部180は、電子機器100内部の各構成に駆動用電力を供給するバッテリを有し、例えば市販のボタン型電池等の一次電池や、リチウムイオン電池等の二次電池、あるいは、振動や光、熱、電磁波等のエネルギーにより発電する環境発電技術による電源等を、単独で、あるいは、併用して適用することができる。
The power supply unit 180 has a battery that supplies driving power to each component inside the
なお、図示を省略したが、本実施形態に係る電子機器100は、図2に示した構成の他に、表示部140に表示される情報や電子機器100の動作状態等を報知するための音響部(例えばスピーカやブザー等)や振動部(例えばバイブレータ等)を備えているものであってもよい。これにより、表示部140の表示(例えば傾斜の変化点)や電子機器100の動作状態(特に、異常状態)等に対応して、各種の音声やブザー音、振動を発生させてユーザに報知することができる。
Although illustration is omitted, the
<電子機器の情報表示制御方法>
(高度変化表示処理)
次に、本実施形態に係る電子機器における情報表示制御方法について説明する。まず、本実施形態に係る電子機器の情報表示制御方法に適用される高度変化表示処理について図面を参照して説明する。ここで、以下に示す高度変化表示処理は、電子機器100の演算回路部160において、所定のプログラムを実行することにより実現される。
<Information display control method for electronic devices>
(Altitude change display processing)
Next, an information display control method in the electronic device according to this embodiment will be described. First, the altitude change display processing applied to the electronic device information display control method according to the present embodiment will be described with reference to the drawings. Here, the altitude change display processing described below is realized by executing a predetermined program in the
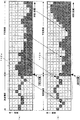
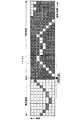
図4は、本実施形態に係る情報表示制御方法に適用される高度変化表示処理を説明するための第1の表示例を示す概略図である。また、図5、図6は、本実施形態に係る情報表示制御方法に適用される高度変化表示処理を説明するための第2の表示例を示す概略図であり、図7、図8は、本実施形態に係る情報表示制御方法に適用される高度変化表示処理を説明するための第3の表示例を示す概略図である。 FIG. 4 is a schematic diagram showing a first display example for explaining the altitude change display processing applied to the information display control method according to the present embodiment. 5 and 6 are schematic diagrams showing a second display example for explaining the altitude change display processing applied to the information display control method according to the present embodiment, and FIGS. It is a schematic diagram showing the 3rd example of a display for explaining the altitude change display processing applied to the information display control method concerning this embodiment.
図3に示したように、上述した電子機器100の表示パネル142に設定されたグラフ表示領域142aには、予め登録された移動ルートに沿った高度の値が、図4に示すように、縦軸を高度、横軸を時間(距離)とするグラフにより表示される。
As shown in FIG. 3, in the
具体的には、本実施形態においては、表示パネル142として、腕時計やスポーツウォッチ、GPSロガー等に多用されているドットマトリクス方式のモノクロ液晶パネルが適用されている。図4に示した第1の表示例のグラフに表示された各ドットは、表示パネル142の各ドット(又は複数のドットの集まり)に対応し、実線枠内塗りつぶしで表記されたドット(便宜的に、「黒ドット」と記す)により、各時刻(各距離)における移動ルートの高度が表される。
Specifically, in the present embodiment, as the
ここで、各ドットは、例えば矩形形状を有し、横方向(図面左右方向)が単位時間を示し、縦方向(図面上下方向)が単位高さを示している。この各ドットに規定される単位時間と単位高さは、ユーザの設定操作により指定された固定値に設定されている。ここで、例えば、単位時間や単位高さの設定値が、ユーザが意図せずに、例えば傾斜の程度等に応じて自動的に変化した場合には、表示部140に表示されているグラフの横軸の実際の距離や縦軸の実際の高度がその都度変化することになり、ユーザが過去及び将来の高度変化(傾斜の程度)を直感的かつ正確に把握することが困難となってしまう。このようになることを防ぐため、単位時間と単位高さの設定値は、ユーザの設定操作以外では変更されないようになっている。
Here, each dot has, for example, a rectangular shape, and the horizontal direction (horizontal direction in the drawing) indicates a unit time, and the vertical direction (vertical direction in the drawing) indicates a unit height. The unit time and unit height defined for each dot are set to fixed values specified by the user's setting operation. Here, for example, when the set value of the unit time or the unit height is changed unintentionally by the user according to, for example, the degree of inclination, the graph of the graph displayed on the
また、図4において、横軸の時間(距離)は、現在位置(図中、三角マークで表記)を基点にして図面左方向に行くにしたがって、過去の時刻(移動済みの移動ルート)を遡ることを意味し、一方、図面右方向に行くにしたがって、将来の時刻(移動予定の移動ルート)を進むことを意味する。図では、現在位置に至るまでの過去の時刻(移動済みの移動ルート;第1距離範囲)における高度の単位時間ごとの値(高度履歴)を、単位時間ごとに単一の黒ドットにより示し、現在位置以降の将来の時刻(移動予定の移動ルート;第2距離範囲)における高度の単位時間ごとの値(予定高度変化)を、単位時間ごとに棒状に積み重ねた黒ドット群により示している。ここで、将来の時刻においては、積み重ねた黒ドット群の最上段の黒ドットが予定高度を示している。このように、現在位置を境界にして、過去の高度履歴と、将来の予定高度とを異なる表示形態で表示することにより、ユーザはグラフ表示を一目見るだけで、過去及び将来の高度変化を直感的に把握することができる。 Further, in FIG. 4, the time (distance) on the horizontal axis traces past time (moved route) in the leftward direction of the drawing from the current position (indicated by a triangle mark in the drawing) as a base point. On the other hand, as it goes to the right in the drawing, it means to proceed in the future time (moving route to be moved). In the figure, the value for each unit time (altitude history) in the past time (moving route; first distance range) up to the current position is shown by a single black dot, The value of the altitude per unit time (planned altitude change) at a future time (moving route to be moved; second distance range) after the current position is shown by a group of black dots stacked in a unit for each unit time. Here, at a future time, the uppermost black dot of the stacked black dot group indicates the planned altitude. In this way, by displaying the past altitude history and the future expected altitude in different display forms with the current position as a boundary, the user can intuitively understand the past and future altitude changes by only looking at the graph display. Can be understood.
なお、高度履歴と予定高度の表示形態は、本実施形態の手法に限定されるものではなく、双方を区別して視認できるものであれば、他の手法を適用するものであってもよい。例えば、現在位置を基点にして、高度履歴と予定高度を示すドットの表示色を変えたり、いずれか一方を点滅表示させたりする手法等を適用することもできる。また、現在位置の高度を示す1列分のドットの表示色を変えたり、点滅表示させたりすることにより、高度履歴と予定高度を区別するものであってもよい。この場合、高度履歴と予定高度を示すドットは、同じ表示形態であってもよいし、異なる表示形態であってもよい。更には、例えば、高度履歴と予定高度との境界部分に縦方向にラインを表示して、高度履歴の領域と予定高度の領域とを区別できるようにして、両者を示すドットは同じ表示形態としてもよい。 In addition, the display form of the altitude history and the planned altitude is not limited to the method of the present embodiment, and other methods may be applied as long as they can be distinguished and visually recognized. For example, a method of changing the display color of the dots indicating the altitude history and the planned altitude, or displaying one of them blinking can be applied based on the current position. Further, the altitude history may be distinguished from the planned altitude by changing the display color of dots for one row indicating the altitude of the current position or by blinking the dots. In this case, the dots indicating the altitude history and the planned altitude may have the same display form or different display forms. Further, for example, a line is vertically displayed at the boundary between the altitude history and the planned altitude so that the area of the altitude history and the area of the planned altitude can be distinguished from each other, and the dots indicating the both have the same display form. Good.
このようなグラフ表示において、まず特定の時刻(第1時刻)で、例えば図4(a)に示すように、現在位置を含む所定の時間幅の高度履歴と予定高度が、図中、二点鎖線の四角で囲ったグラフ表示領域142aに表示される。ここでは、現在位置を中心にして、8単位時間分の高度履歴と、7単位時間分の予定高度の計16単位時間(現在位置を含む)分の高度変化が表示パネル142のグラフ表示領域142aに表示される。この例においては、グラフ表示領域142aの図面左方端に表示された黒ドットは、現在時点から8単位時間前に、ユーザが通過した地点の高度を示し、また、グラフ表示領域142aの図面右方端に表示された黒ドットは、現在時点から7単位時間後に、ユーザが通過する予定の地点の高度を示している。すなわち、8単位時間前の高度は4単位高さであり、所定の高度変化を経て、現在位置の高度は5単位高さとなり、7単位時間後の高度はさらに高度の変化を経て5単位高さになることを示している。
In such a graph display, first, at a specific time (first time), for example, as shown in FIG. 4A, the altitude history of a predetermined time width including the current position and the planned altitude are two points in the figure. It is displayed in a
そして、ユーザが登録された移動ルートに沿って移動するにしたがって、1単位時間ごとに、高度の変化を示すグラフが、図面左方向にシフトするようにずれてグラフ表示領域142aに表示される。すなわち、現在位置の高度が1単位時間後には左方向に1ドット分ずれて、最新の高度履歴として表示されるとともに、現在位置の右方側の予定高度が左方向に1ドット分ずれて、現在位置の高度として表示されることになる。図4(b)は、図4(a)に示した第1時刻から8単位時間後の時刻(第2時刻)における高度の変化を示すグラフと、グラフ表示領域142aにおける表示を示している。
Then, as the user moves along the registered movement route, the graph showing the change in altitude is displayed in the
なお、図4(a)、(b)においては、8単位時間の経過に対して、グラフ表示領域142aに表示されるグラフに予め設定された縦軸の上限と下限との間の範囲(高度範囲)内で、高度が変化した場合を示したが、高度の変化がグラフに設定された高度範囲に対して偏っている場合等には、高度履歴と予定高度が適切に表示されるように、当該高度範囲の幅を固定したままで、グラフの表示範囲を縦軸方向に随時ずらすようにしてもよい。この手法については、後述する具体例において詳述する。また、図4(a)、(b)においては、高度の変化を示すグラフの、現在位置を含む所定範囲領域の高度の変化を、グラフ表示領域142aに表示する場合について説明したが、本発明はこれに限定されるものではなく、移動ルート全体での高度の変化を示すグラフをグラフ表示領域142aに表示するものであってもよい。
In FIGS. 4A and 4B, the range between the upper limit and the lower limit of the vertical axis that is preset in the graph displayed in the
また、本実施形態においては、図4に示したグラフ表示(第1の表示例)に加えて、例えば登り坂や下り坂が続いて、移動ルートに沿った高度の値の変化が予めグラフに設定されている高度範囲を逸脱する(すなわち、縦軸の上限を上回る、又は、下限を下回る)場合には、図6、図8に示すようなグラフ表示(第2、第3の表示例)が適用される。ここで、図6、図8に示すグラフ表示に係る仕様(縦軸の高度範囲や、ドット単位の設定等)は、上述した第1の表示例(図4)と同じである。 Further, in the present embodiment, in addition to the graph display (first display example) shown in FIG. 4, for example, an uphill or a downhill continues, and a change in altitude value along the moving route is displayed in advance in a graph. When it deviates from the set altitude range (that is, exceeds the upper limit of the vertical axis or falls below the lower limit), the graph display as shown in FIGS. 6 and 8 (second and third display examples) Is applied. Here, the specifications related to the graph display shown in FIGS. 6 and 8 (altitude range on the vertical axis, setting in dot units, etc.) are the same as those in the first display example (FIG. 4) described above.
すなわち、例えば図5においては、現在時点から7単位時間前を起点にして登り坂(又は登りの傾向)が始まり、現在位置においてグラフの上限高度(8単位高さ)に達した以降も、さらに登り坂(又は、登り傾向)が続く状態を示している。この場合、現在位置以降の予定高度(図中、点線枠内ハッチングで表記されたドット)が予めグラフの縦軸に設定された高度範囲の上限を上回るため、図5に示すように、各時刻の高度表示が黒ドットで埋め尽くされることになり、グラフに高度履歴とともに予定高度を表示することができない状態となる。そのため、ユーザに予定高度に関する情報(移動済みのルートの高度履歴に対する比較を含む)を提供することができない。 That is, for example, in FIG. 5, an uphill (or a climbing tendency) starts 7 units time before the current time point, and after reaching the upper limit altitude (8 unit height) of the graph at the current position, It shows a state where the climbing slope (or climbing tendency) continues. In this case, the planned altitude after the current position (dots shown by hatching in the dotted frame in the figure) exceeds the upper limit of the altitude range set in advance on the vertical axis of the graph. Therefore, as shown in FIG. Since the altitude display of will be filled with black dots, the planned altitude cannot be displayed together with the altitude history on the graph. Therefore, it is not possible to provide the user with information about the planned altitude (including comparison with the altitude history of the route that has been moved).
そこで、本実施形態の第2の表示例においては、図6に示すように、現在位置以降に登り坂(又は、登り傾向)が続いて、予定高度がグラフの上限を上回った場合には、当該上限を上回った高度部分を、グラフの下限側から黒ドットとは異なる表示状態のドットにより表示する。 Therefore, in the second display example of the present embodiment, as shown in FIG. 6, when the climbing slope (or climbing tendency) continues after the current position and the planned altitude exceeds the upper limit of the graph, The altitude portion above the upper limit is displayed from the lower limit side of the graph by a dot in a display state different from the black dot.
具体的には、図5に示したように、現在位置においてグラフの上限高度(8単位高さ)に達し、現在位置以降にさらに登り坂が続く場合には、グラフの上限高度を超過した各時刻の高度(Ht)について、グラフの縦軸に予め設定されている高度範囲(Hg;8単位高さ)に相当する高度の値を減算するシフト処理(Ht−Hg)を実行する。そして、図6に示すように、グラフ中の黒ドットで埋め尽くされた各時刻に、シフト処理後の高度を例えば黒ドットの反転色のドット(図中、点線枠内白抜きで表記されたドット;便宜的に「白ドット」と記す)により表示する。 Specifically, as shown in FIG. 5, when the upper limit altitude (8 units in height) of the graph is reached at the current position and the climbing slope continues further after the current position, each upper limit altitude of the graph is exceeded. With respect to the altitude (Ht) at time, a shift process (Ht-Hg) for subtracting the altitude value corresponding to the altitude range (Hg; 8 unit height) preset on the vertical axis of the graph is executed. Then, as shown in FIG. 6, at each time when the black dots in the graph are filled up, the altitude after the shift processing is, for example, a dot of the reverse color of the black dot (indicated by white dots in the dotted line frame in the figure). Dots; for convenience sake, referred to as “white dots”).
これにより、例えば図6に示すように、グラフの上限を超過している高度部分である、例えば現在位置の1単位時間後の高度は、黒ドットで埋め尽くされたグラフの下限から1単位高さの白ドットにより表示され、その後時間が経過するにしたがって高度が徐々に上昇して、6〜7単位時間後の高度は、同グラフの下限から6単位高さの白ドットにより表示される。なお、図5に示すように、現在位置から14単位時間以降、下り坂(又は下りの傾向)が続き、20単位時間以降ではグラフの縦軸に設定された高度範囲内の高度となっているため、図6に示すように、グラフに予定高度が棒状に積み重ねた黒ドット群により通常通り表示される。 As a result, for example, as shown in FIG. 6, the altitude portion exceeding the upper limit of the graph, for example, the altitude one unit time after the current position is one unit higher than the lower limit of the graph filled with black dots. The height is gradually increased as time elapses, and the height after 6 to 7 unit time is displayed as a white dot having a height of 6 units from the lower limit of the graph. As shown in FIG. 5, the downhill (or downhill tendency) continues after 14 unit time from the current position, and after 20 unit time, the altitude is within the altitude range set on the vertical axis of the graph. Therefore, as shown in FIG. 6, the planned altitude is normally displayed by a group of black dots stacked in a bar shape.
また、例えば図7においては、現在時点から8単位時間前を起点にして下り坂(又は下りの傾向)が始まり、現在位置においてグラフの下限高度(1単位高さ)に達した以降も、さらに下り坂(又は下りの傾向)が続く状態を示している。この場合においても、現在位置以降の予定高度(図中、点線枠内ハッチングで表記されたドット)が予めグラフの縦軸に設定された高度範囲の下限を下回るため、図7に示すように、各時刻の高度表示が白ドットで埋め尽くされることになり、グラフに高度履歴とともに予定高度を表示することができない状態となる。 In addition, for example, in FIG. 7, a downhill (or a downhill tendency) starts 8 units time before the current time point, and after reaching the lower limit altitude (1 unit height) of the graph at the current position, It shows a state in which a downhill (or a downhill tendency) continues. In this case as well, the planned altitude after the current position (dots indicated by hatching in the dotted line frame in the figure) is below the lower limit of the altitude range set in advance on the vertical axis of the graph, so as shown in FIG. The altitude display at each time is filled with white dots, and the planned altitude cannot be displayed together with the altitude history on the graph.
そこで、本実施形態の第3の表示例においては、図8に示すように、現在位置以降に下り坂(又は、下り傾向)が続いて、予定高度がグラフの下限を下回った場合には、当該下限を下回った高度部分を、グラフの上限側から黒ドットとは異なる表示状態のドットにより表示する。 Therefore, in the third display example of the present embodiment, as shown in FIG. 8, when the downhill (or downhill tendency) continues after the current position and the planned altitude is below the lower limit of the graph, The altitude part below the lower limit is displayed from the upper limit side of the graph by a dot in a display state different from the black dot.
具体的には、図7に示したように、現在位置においてグラフの下限高度(1単位高さ)に達し、現在位置以降にさらに下り坂が続く場合には、グラフの下限高度に満たない各時刻の高度(Ht)について、グラフの縦軸に予め設定されている高度範囲(Hg;8単位高さ)に相当する高度の値を加算するシフト処理(Ht+Hg)を実行する。そして、図8に示すように、グラフ中の白ドットで埋め尽くされた各時刻を、黒ドットで埋め尽くされた状態に変換した後、上記シフト処理後の高度を例えば黒ドットの反転色である白ドットにより表示する。 Specifically, as shown in FIG. 7, when the lower limit altitude (1 unit height) of the graph is reached at the current position and the downhill continues after the current position, each lower limit altitude of the graph is not reached. With respect to the altitude (Ht) at the time point, a shift process (Ht+Hg) for adding a value of the altitude corresponding to the altitude range (Hg; 8 unit height) preset on the vertical axis of the graph is executed. Then, as shown in FIG. 8, after converting each time filled with white dots in the graph into a state filled with black dots, the altitude after the shift processing is expressed by, for example, a reverse color of black dots. It is displayed by a certain white dot.
これにより、例えば図8に示すように、グラフの下限に満たない高度部分である、例えば現在位置の1〜2単位時間後の高度は、黒ドットで埋め尽くされたグラフの下限から8単位高さ(換言すると、グラフの上限から1単位高さ)の白ドットにより表示され、その後時間が経過するにしたがって高度が徐々に下降して、14〜15単位時間後の高度は、同グラフの下限から2単位高さの白ドットにより表示される。
As a result, for example, as shown in FIG. 8, an altitude portion that is less than the lower limit of the graph, for example, an
なお、図7において、現在位置から20単位時間以降では、グラフの下限からさらに8単位高さ以上、高度が下降した状態となっているため、図8に示すように、グラフに白ドットによる予定高度が表示されない状態となる。このような場合には、高度の値を示すドットを、黒と白の2種類よりも多い多色に設定したり、点滅表示させたり、点滅速度を変更したりすることにより、図8に示したグラフの予定高度の高度範囲をさらに逸脱した高度を表示するようにしてもよい。また、同様の技術思想により、図6において、グラフの上限からさらに8単位高さ以上、高度が上昇して、グラフに白ドットによる予定高度が表示されない場合には、高度の値の変化を示すドットの種類を変更することにより、図6に示したグラフの予定高度の高度範囲をさらに逸脱した高度を表示するようにしてもよい。 In addition, in FIG. 7, after 20 unit time from the current position, since the altitude is further lowered by 8 unit height or more from the lower limit of the graph, as shown in FIG. The altitude is not displayed. In such a case, the dots indicating the altitude value can be displayed in FIG. 8 by setting them in more than two colors of black and white, blinking them, or changing the blinking speed. It is also possible to display altitudes further deviating from the altitude range of the planned altitude in the graph. Further, according to the same technical idea, in FIG. 6, when the altitude is further increased by 8 units or more from the upper limit of the graph and the planned altitude by white dots is not displayed in the graph, the change of the altitude value is shown. By changing the dot type, the altitude further deviating from the altitude range of the planned altitude in the graph shown in FIG. 6 may be displayed.
このように、本実施形態におけるグラフ表示(第1〜第3の表示例)においては、同一のグラフ中に、過去の高度履歴と将来の予定高度とが異なる表示形態で表示される。加えて、予め縦軸に設定されたグラフの高度範囲を逸脱する、より高い高度やより低い高度に対して、グラフの高度範囲に相当する高度の値だけシフトさせるシフト処理を行うことにより、グラフの縦軸に設定された高度範囲内の高度と、同高度範囲を逸脱した高度とが、同一のグラフ中に、異なる表示形態で表示される。これにより、従来は表示部の表示範囲を逸脱してしまって表示されなかった高度の領域を、同一のグラフ中に表示することができるので、実質的に、より広い範囲の高度の変化に関する情報を提供することができる。したがって、ユーザはグラフ表示を一目見るだけで、過去及び将来の高度の変化(登り坂や下り坂の傾斜や継続の程度等)を直感的かつ正確に把握することができる。また、例えば、どの程度の傾斜をどれだけ登って(又は、下って)きたか、といった過去の移動の記録や実績、また、あとどの程度登り(又は、下り)が続くのか、といった将来の移動の予定や計画等を、適切に検証したり確認したりすることができる。 As described above, in the graph display (first to third display examples) in the present embodiment, the past altitude history and the future planned altitude are displayed in different display forms in the same graph. In addition, by performing a shift process that shifts the altitude value corresponding to the altitude range of the graph to a higher altitude or a lower altitude that deviates from the altitude range of the graph set in advance on the vertical axis, the graph The altitude within the altitude range set on the vertical axis of and the altitude deviating from the altitude range are displayed in different display forms in the same graph. As a result, it is possible to display the altitude region that has not been displayed because it has deviated from the display range of the display unit in the same graph in the past. Can be provided. Therefore, the user can intuitively and accurately grasp changes in altitude in the past and in the future (inclination of uphill and downhill, degree of continuation, etc.) just by looking at the graph display. In addition, for example, records and results of past movements such as how much slope and how much you have climbed (or descended), and future movements such as how many more climbs (or descends) you will continue. It is possible to properly verify and confirm the schedule and plan of.
なお、上記のシフト処理において、グラフの上限高度を超過した高度については、グラフの縦軸の高度範囲に相当する高度の値を減算し、グラフの下限高度に満たない高度については、グラフの縦軸の高度範囲に相当する高度の値を加算するとした。グラフ表示領域142aにできるだけ多くの情報を表示するためには、このようにすることが好ましいが、本発明はこの構成に限るものではない。すなわち、グラフの上限高度を超過した高度について、ゼロより大きく、グラフの高度範囲に相当する高度より小さい値を減算して、グラフの上限高度を超過した高度の少なくとも一部によるグラフがグラフ表示領域142aに表示されるようにしてもよいし、グラフの下限高度に満たない高度について、ゼロより大きく、グラフの高度範囲に相当する高度より小さい値を加算して、グラフの下限高度に満たない高度の少なくとも一部によるグラフがグラフ表示領域142aに表示されるようにしてもよい。
In the above shift processing, for altitudes that exceed the upper limit altitude of the graph, the value of the altitude corresponding to the altitude range on the vertical axis of the graph is subtracted, and for altitudes below the lower limit altitude of the graph, The value of the altitude corresponding to the altitude range of the axis is added. This is preferable in order to display as much information as possible in the
また、グラフの縦軸に設定された高度範囲内の高度と、同高度範囲を逸脱した高度とを、同一のグラフ中に、異なる表示形態で表示するとしたが、本発明はこの形態に限るものではない。例えば、高度範囲内の高度と高度範囲を逸脱した高度との境界部分に縦方向にラインを表示して、高度範囲内の高度の領域と高度範囲を逸脱した高度の領域とが区別できるようにして、高度範囲内の高度の表示形態と高度範囲を逸脱した高度の表示形態とは同じとしてもよい。 Further, the altitude within the altitude range set on the vertical axis of the graph and the altitude deviating from the altitude range are displayed in the same graph in different display forms, but the present invention is not limited to this form. is not. For example, a vertical line is displayed at the boundary between the altitude within the altitude range and the altitude outside the altitude range so that the altitude region within the altitude range can be distinguished from the altitude range outside the altitude range. Thus, the display form of altitudes within the altitude range and the display form of altitudes outside the altitude range may be the same.
(情報表示制御方法の具体例)
次に、本実施形態に係る電子機器における情報表示制御方法の具体例について、図面を参照して説明する。ここでは、ユーザが電子機器100を装着又は携帯した状態で、登山ルート(移動ルート)を移動したときの、グラフ表示領域142aに表示されるグラフの表示状態の変化について説明する。ここで、以下に示す情報表示制御方法の各処理動作は、電子機器100の演算回路部160において、所定のプログラムを実行することにより実現される。また、上述したグラフ表示方法と同等の処理動作については説明を簡略化する。
(Specific example of information display control method)
Next, a specific example of the information display control method in the electronic device according to the present embodiment will be described with reference to the drawings. Here, a change in the display state of the graph displayed in the
(第1の具体例)
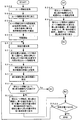
図9、図10は、本実施形態に係る情報表示制御方法の第1の具体例を示すフローチャートである。また、図11は、本具体例に係る情報表示制御方法に適用されるグラフの表示範囲を規定するための概略図であり、図12は、本具体例に係る情報表示制御方法おける高度の変化の表示状態を示す詳細図である。
(First specific example)
9 and 10 are flowcharts showing a first specific example of the information display control method according to the present embodiment. FIG. 11 is a schematic diagram for defining the display range of the graph applied to the information display control method according to this specific example, and FIG. 12 is a change in altitude in the information display control method according to this specific example. 3 is a detailed diagram showing a display state of FIG.
本実施形態に係る情報表示制御方法の第1の具体例においては、図9、図10のフローチャートに示すように、まず、演算回路部160は、ユーザが所望する登山ルート情報を取得し(ステップS102)、グラフ表示領域142aにおけるグラフ表示に適したデータに加工する(ステップS104)。ここで、ユーザが所望する登山ルート情報は、ルート中の各地点における高度情報を含むものであって、ユーザが外部の機器やネットワークを介して取得したものであってもよいし、メモリ部170に予め保存されている複数の登山ルートからユーザが選択するものであってもよい。また、登山ルート情報のデータ加工においては、演算回路部160は、取得した登山ルート情報に含まれる登山ルートの終着点(GOAL位置)の後に、グラフ表示領域142aに表示されるグラフに設定された表示範囲の、横軸方向の時間範囲(図11に示す左右端間の距離範囲L)分に相当するゼロデータ(高度情報を含まない空データ)を付加する処理を行う。そして、加工処理された登山ルート情報は、登録データとしてメモリ部170の所定の領域に保存される。
In the first specific example of the information display control method according to the present embodiment, as shown in the flowcharts of FIGS. 9 and 10, first, the
次いで、電子機器100を装着又は携帯したユーザが登録された登山ルートに沿って移動を開始すると(ステップS106)、演算回路部160は、ユーザの現在位置を取得する(ステップS108)。具体的には、演算回路部160は、モーションセンサ部110により取得されたセンサデータを用いた自律航法や、GPS測位部120により取得された位置データに基づいて現在位置を取得する。ここで、演算回路部160は、上記の自律航法により現在位置を取得する手法と、GPS測位により現在位置を取得する手法とのいずれか一方を適用するものであってもよいし、常時自律航法により現在位置を取得しつつ、間欠的にGPS測位を行って現在位置の取得精度を補完して、現在位置を取得するものであってもよい。
Next, when the user wearing or carrying the
次いで、演算回路部160は、取得した現在位置に基づいて、登録された登山ルート情報から、グラフ表示領域142aに表示されるグラフに設定された表示範囲の、横軸方向の時間範囲(距離範囲L)分の部分ルート情報を取得する(ステップS110)。ここで、本具体例においては、図11に示すように、グラフ表示領域142aに表示されるグラフの表示範囲の縦軸方向の高度範囲をH、横軸方向の時間範囲に相当する、左右端間の距離範囲をL、現在位置の表示位置を距離範囲Lの左端に設定する。すなわち、演算回路部160は、登録された登山ルート情報のうち、現在位置を基点にして移動予定の距離範囲L分の登山ルート情報を、部分ルート情報として抽出する。
Then, the
次いで、演算回路部160は、取得した部分ルート情報の中から、最高高度及び最低高度を取得する(ステップS112)。具体的には、登山ルート情報に含まれる高度情報は登山ルートに沿った高度の変化を示す連続する曲線と考えることができるので、例えば、この曲線を微分することにより求まる極値を相互に比較することにより最高高度及び最低高度を算出することができる。
Next, the
次いで、演算回路部160は、グラフの表示範囲の下限を、取得した最低高度に設定したときに、取得した部分ルート情報の現在位置の高度がグラフの上限と下限の範囲(すなわち、高度範囲H)内にあるか否かを判定する(ステップS114)。演算回路部160は、現在位置の高度がグラフの高度範囲Hの範囲内にある場合(ステップS114のYes)には、ステップS116に進み、一方、現在位置の高度がグラフの高度範囲H内にない場合(ステップS114のNo)には、図10に示すフローチャートのステップS122に進む。
Next, when the lower limit of the display range of the graph is set to the acquired minimum altitude, the
ステップS116においては、演算回路部160は、取得した部分ルート情報において、グラフの表示範囲の下限を、取得した最低高度に設定したときに、部分ルート情報の高度にグラフの表示範囲(すなわち、高度範囲H)の範囲外となる部分があるか否かを判定する。演算回路部160は、取得した部分ルート情報の高度にグラフの高度範囲H外となる部分がない場合(ステップS116のNo)には、ステップS118に進み、一方、部分ルート情報の高度に高度範囲H外となる部分がある場合(ステップS116のYes)には、ステップ132に進む。
In step S116, when the lower limit of the display range of the graph in the acquired partial route information is set to the acquired minimum altitude, the
ステップS118においては、演算回路部160は、図11に示したグラフの表示範囲の下限を、取得した最低高度に設定するとともに、表示範囲の左端に現在位置を設定して、部分ルート情報の高度を、例えば第1表示形態で表示範囲に表示する。すなわち、図12に示すような高度の変化を有する登山ルートにおいて、現在位置を基点(グラフの表示範囲の左端)にして距離範囲L分の予定高度を表示する場合、図中(a)、(b)、(h)、(i)に示すように、最低高度が表示範囲の下限に設定され、かつ、距離範囲Lにおける全ての高度が、単位時間ごとに黒ドットを棒状に積み重ね、高度を示す最上段のドットより下方側を黒ドットで埋め尽くした状態(第1表示形態)で表示範囲に表示される。このようにステップS118の処理動作により生成されるグラフは、距離範囲Lにおける全ての高度が高度範囲H内に収まるグラフである。
In step S118, the
次いで、演算回路部160は、現在位置が終着点(GOAL位置)か否かを判定する(ステップS120)。現在位置が終着点である場合(ステップS120のYes)には、情報表示制御方法の一連の処理動作を終了し、一方、現在位置が終着点でない場合(ステップS120のNo)には、ステップS108に戻って、演算回路部160は、ユーザの現在位置を取得する処理を再度実行する。
Next, the
また、ステップS116において、取得した部分ルート情報の高度に高度範囲H外となる部分がある場合(ステップS116のYes)には、演算回路部160は、部分ルート情報において、グラフの表示範囲の下限を最低高度に設定したときに、グラフの表示範囲(高度範囲H)外となる高度部分を、範囲外ルート情報として取得する(ステップS132)。
In addition, in step S116, when there is a portion outside the altitude range H in the altitude of the acquired partial route information (Yes in step S116), the
次いで、演算回路部160は、グラフの表示範囲の下限を最低高度に設定するとともに、表示範囲の左端に現在位置を設定して、部分ルート情報から範囲外ルート情報を除いた高度部分を、第1表示形態で表示範囲に表示し、範囲外ルート情報の高度部分を、第2表示形態で表示範囲に表示する(ステップS134)。すなわち、図12に示した登山ルートにおいて、図中(c)、(d)に示すように、最低高度が表示範囲の下限に設定され、かつ、距離範囲Lにおいて高度範囲H内に収まる高度部分は、単位時間ごとに黒ドットを棒状に積み重ね、高度を示す最上段のドットより下方側を黒ドットで埋め尽くした状態(第1表示形態)で表示範囲に表示される。また、高度範囲Hの上限を上回った高度部分は、高度範囲Hに相当する高度の値を減算するシフト処理を行い、黒ドットで埋め尽くされた各時刻において高度を示すドットの表示色を反転した状態(第2表示形態)で表示範囲に表示される。このようにステップS134の処理動作により生成されたグラフは、上述した第2の表示例において、現在位置以降の予定高度を表示した部分に対応する。そして、演算回路部160は、ステップS134におけるグラフ表示の後、上述したステップS120に進む。
Next, the
また、ステップS114において、現在位置の高度がグラフの高度範囲H内にない場合(ステップS114のNo)には、演算回路部160は、グラフの表示範囲の上限を、取得した最高高度に設定したときに、部分ルート情報の現在位置の高度がグラフの上限と下限の範囲(高度範囲H)内にあるか否かを判定する(ステップS122)。演算回路部160は、現在位置の高度がグラフの高度範囲H内にある場合(ステップS122のYes)には、ステップS124に進み、一方、現在位置の高度がグラフの高度範囲H内にない場合(ステップS122のNo)には、ステップS128に進む。
If the altitude at the current position is not within the altitude range H of the graph in step S114 (No in step S114), the
ステップS124においては、演算回路部160は、部分ルート情報において、グラフの表示範囲の上限を最高高度に設定したときに、部分ルート情報の高度が高度範囲H外となる部分があるか否かを判定する。演算回路部160は、部分ルート情報の高度に高度範囲H外となる部分がない場合(ステップS124のNo)には、ステップS126に進み、一方、部分ルート情報の高度に高度範囲H外となる部分がある場合(ステップS124のYes)には、ステップ142に進む。
In step S124, the arithmetic
ステップS126においては、演算回路部160は、図11に示したグラフの表示範囲の上限を、取得した最高高度に設定するとともに、表示範囲の左端に現在位置を設定して、部分ルート情報の高度を、例えば第1表示形態で表示範囲に表示する。すなわち、図12に示した登山ルートにおいて、図中(g)に示すように、最高高度が表示範囲の上限に設定され、かつ、距離範囲Lにおける全ての高度が、単位時間ごとに黒ドットを棒状に積み重ねた状態(第1表示形態)で表示範囲に表示される。このようにステップS126の処理動作により生成されるグラフは、距離範囲Lにおける全ての高度が高度範囲H内に収まるグラフである。そして、演算回路部160は、ステップS126におけるグラフ表示の後、上述したステップS120に進む。
In step S126, the
また、ステップS124において、部分ルート情報の高度に高度範囲H外となる部分がある場合(ステップS124のYes)には、演算回路部160は、部分ルート情報において、グラフの表示範囲の上限を最高高度に設定したときに、高度範囲H外となる高度部分を、範囲外ルート情報として取得する(ステップS142)。
Further, in step S124, when there is a portion outside the altitude range H in the altitude of the partial route information (Yes in step S124), the
次いで、演算回路部160は、グラフの表示範囲の上限を最高高度に設定するとともに、表示範囲の左端に現在位置を設定して、部分ルート情報から範囲外ルート情報を除いた高度部分を、第1表示形態で表示範囲に表示し、範囲外ルート情報の高度部分を、第2表示形態で表示範囲に表示する(ステップS144)。すなわち、図12に示した登山ルートにおいて、図中(e)、(f)に示すように、最高高度が表示範囲の上限に設定され、かつ、距離範囲Lにおいて高度範囲H内に収まる高度部分は、上述した第1表示形態で表示範囲に表示されるとともに、高度範囲Hの下限を下回った高度部分は、高度範囲Hに相当する高度の値を加算するシフト処理を行い、ドットの表示色を反転した状態(第2表示形態)で表示範囲に表示される。そして、演算回路部160は、ステップS144におけるグラフ表示の後、上述したステップS120に進む。
Next, the
また、ステップS122において、現在位置の高度が高度範囲H内にない場合(ステップS122のNo)には、演算回路部160は、部分ルート情報において、グラフの表示範囲の高さ方向の中央に、現在位置の高度が表示されるように、表示範囲の上限、下限を設定したときに、部分ルート情報の高度に高度範囲H外となる部分があるか否かを判定する(ステップS128)。演算回路部160は、部分ルート情報の高度にグラフの高度範囲H外となる部分がない場合(ステップS128のNo)には、ステップS130に進み、一方、部分ルート情報の高度に高度範囲Hがとなる部分がある場合(ステップS128のYes)には、ステップ152に進む。
Further, in step S122, when the altitude of the current position is not within the altitude range H (No in step S122), the
ステップS130においては、演算回路部160は、図11に示したグラフの表示範囲の高さ方向の中央に、現在位置の高度が表示されるように、表示範囲の上限、下限を設定するとともに、表示範囲の左端に現在位置を設定して、部分ルート情報の高度を、例えば第1表示形態で表示範囲に表示する。このようにステップS130の処理動作により生成されるグラフは、距離範囲Lにおける全ての高度が高度範囲H内に収まるグラフである。演算回路部160は、ステップS130におけるグラフ表示の後、上述したステップS120に進む。
In step S130, the
また、ステップS128において、部分ルート情報の高度に高度範囲H外となる部分がある場合(ステップS128のYes)には、演算回路部160は、部分ルート情報において、グラフの表示範囲の高さ方向の中央に、現在位置の高度が表示されるように、表示範囲の上限、下限を設定したときに、高度範囲H外となる高度部分を、範囲外ルート情報として取得する(ステップS152)。
Further, in step S128, when there is a portion outside the altitude range H in the altitude of the partial route information (Yes in step S128), the
次いで、演算回路部160は、グラフの表示範囲の高さ方向の中央に、現在位置の高度が表示されるように、表示範囲の上限、下限を設定して、部分ルート情報から範囲外ルート情報を除いた高度部分を、第1表示形態で表示範囲に表示し、範囲外ルート情報の高度部分を、第2表示形態で表示範囲に表示する(ステップS154)。すなわち、現在位置の高度が表示範囲の中央に設定され、かつ、距離範囲Lにおいて高度範囲H内に収まる高度部分は、上述した第1表示形態で表示範囲に表示されるとともに、高度範囲Hを逸脱した高度部分は、高度範囲Hに相当する高度の値だけシフトさせるシフト処理を行い、ドットの表示色を反転した状態(第2表示形態)で表示範囲に表示される。演算回路部160は、ステップS154におけるグラフ表示の後、上述したステップS120に進む。
Next, the
本具体例においては、上述した一連の処理動作を繰り返し実行することにより、図12(a)〜(i)に示すように、予め登録された登山ルートを移動するユーザが装着又は携帯した電子機器の表示部140に、現在位置から先の移動予定のルートにおける高度の変化(予定高度)が随時表示される。ここで、グラフに設定された距離範囲内の高度が、グラフに設定された高度範囲を逸脱する場合には、高度範囲に相当する高度の値だけシフトさせるシフト処理を行うことにより、高度範囲内の高度と、同高度範囲を逸脱した高度とが、同一のグラフ中に異なる表示形態で表示される。また、所定の距離範囲(横軸方向の範囲)及び高度範囲(縦軸方向の範囲)が設定されたグラフに、移動予定のルートにおける高度の変化の概ね全体が適切に表示されるように、当該距離範囲における最低高度が当該高度範囲の下限、又は、当該距離範囲における最高高度が当該高度範囲の上限となるように、グラフの表示範囲を高さ方向(縦軸方向)に随時ずらすように制御される。
In this specific example, by repeatedly executing the series of processing operations described above, as shown in FIGS. 12A to 12I, an electronic device worn or carried by a user who travels through a pre-registered mountain climbing route. On the
これによれば、所定の距離範囲及び高度範囲に設定されたグラフに、従来は表示部の表示範囲を逸脱してしまって表示されなかった高度変化の領域を含む、より広い範囲の高度変化を適切に表示させることができるので、ユーザはグラフ表示を一目見るだけで、将来の高度の変化(登り坂や下り坂の傾斜や継続の程度等)を直感的かつ正確に把握することができる。 According to this, in the graph set to the predetermined distance range and altitude range, the altitude change in a wider range including the area of the altitude change that has not been displayed because it has deviated from the display range of the display unit in the past. Since it can be appropriately displayed, the user can intuitively and accurately grasp future changes in altitude (inclination of uphill and downhill, degree of continuation, etc.) at a glance at the graph display.
なお、本具体例においては、高度の表示形態として、単位時間ごとに黒ドットを棒状に積み重ね、高度を示す最上段のドットより下方側を黒ドットで埋め尽くして表示する形態(第1表示形態)と、グラフの高度範囲を逸脱した高度に対して、所定の換算シフト処理を施して、黒ドットで埋め尽くされた各時刻において反転色の白ドットにより高度を表示する形態(第2表示形態)とを適用する場合について説明した。本発明はこれに限定されるものではなく、第3表示形態として、例えば単位時間ごとの高度を単一の黒ドット又は白ドットにより表示して、当該ドットより下方側を埋め尽くさない形態等を適用するものであってもよい。 In this specific example, as a display form of altitude, black dots are stacked in a rod shape every unit time, and the lower side of the uppermost dot indicating the altitude is filled with black dots and displayed (first display form). ) And an altitude deviating from the altitude range of the graph, a predetermined conversion shift process is performed, and the altitude is displayed by white dots of the reverse color at each time when the black dots are filled (second display mode). ) And are applied. The present invention is not limited to this, and as the third display form, for example, a form in which the altitude per unit time is displayed by a single black dot or white dot and the lower side of the dot is not filled up is displayed. It may be applied.
(第2の具体例)
図13、図14は、本実施形態に係る情報表示制御方法の第2の具体例を示すフローチャートである。また、図15は、本具体例に係る情報表示制御方法に適用されるグラフの表示範囲を規定するための概略図であり、図16は、本具体例に係る情報表示制御方法おける高度の変化の表示状態を示す詳細図である。ここで、上述した第1の具体例と同等の処理動作については説明を簡略化する。
(Second specific example)
13 and 14 are flowcharts showing a second specific example of the information display control method according to the present embodiment. FIG. 15 is a schematic diagram for defining the display range of a graph applied to the information display control method according to this specific example, and FIG. 16 is a change in altitude in the information display control method according to this specific example. 3 is a detailed diagram showing a display state of FIG. Here, the description of the processing operation equivalent to that of the above-described first specific example will be simplified.
上述した第1の具体例においては、グラフの表示範囲に、現在位置を基点(始点)にして将来の移動予定のルートにおける高度の変化を表示する場合について説明した。第2の具体例においては、グラフの表示範囲内に、現在位置を基点にして過去の移動済みのルートにおける高度履歴と、将来の移動予定のルートにおける予定高度とを表示する場合について説明する。 In the above-described first specific example, a case has been described in which, in the display range of the graph, the change in altitude on the route scheduled to move in the future is displayed with the current position as the base point (start point). In the second specific example, a case will be described in which the altitude history of a route that has been moved in the past and the planned altitude of a route that is scheduled to be moved in the future are displayed in the display range of the graph based on the current position.
本実施形態に係る情報表示制御方法の第2の具体例においては、図13、図14のフローチャートに示すように、まず、演算回路部160は、登山ルート情報を取得し(ステップS202)、グラフ表示に適したデータに加工する(ステップS204)。ここで、本具体例においては、図15に示すように、グラフの表示範囲の縦軸方向の高度範囲をH、横軸方向の時間範囲に相当する、左右端間の距離範囲をLに設定するとともに、現在位置を距離範囲L内の左端以外の任意の位置に設定する。図では現在位置から過去側である距離範囲Lの左端までの距離をL1、現在位置から将来側である距離範囲Lの右端までの距離をL2と規定する。これらの距離L1、L2は用途に応じて任意の数値に設定することができる。例えば、登山等の移動中や移動前において、移動予定のルートの高度の変化をユーザに提供する場合には、将来側の距離L2を過去側の距離L1よりも大きく(例えば距離範囲Lの60%〜100%に)設定して、予定高度の表示比率を高くすることができる。一方、移動時の休憩中や移動後において、移動後のルートの高度の変化をユーザに提供する場合には、過去側の距離L1を将来側の距離L2よりも大きく(例えば距離範囲Lの60%〜100%に)設定して、高度履歴の表示比率を高くすることができる。すなわち、本具体例においては、登山ルート情報のうち、現在位置を基点とする移動済みの距離L1における高度履歴と、移動予定の距離L2における予定高度が、グラフの表示範囲に任意の比率で表示される。
In the second specific example of the information display control method according to the present embodiment, as shown in the flowcharts of FIGS. 13 and 14, first, the
また、登山ルート情報のデータ加工においては、演算回路部160は、取得した登山ルート情報に含まれる登山ルートの出発点(START位置)の前に、グラフに設定された表示範囲の、現在位置から距離範囲Lの左端までの距離L1分に相当するゼロデータを付加し、終着点(GOAL位置)の後に、グラフに設定された表示範囲の、現在位置から距離範囲Lの右端までの距離L2分に相当するゼロデータを付加する処理を行う。加工処理された登山ルート情報は、登録データとしてメモリ部170に保存される。
Further, in the data processing of the mountain climbing route information, the
次いで、ユーザが登山ルートに沿って移動を開始すると(ステップS206)、演算回路部160は、ユーザの現在位置を取得する(ステップS208)。そして、演算回路部160は、取得した現在位置に基づいて、登山ルート情報から、図15に示したグラフの表示範囲に設定された現在位置の表示位置を基点にして、距離L1だけ前の第1位置(距離範囲Lの左端)から、距離L2だけ後の第2位置(距離範囲Lの右端)までの部分ルート情報を取得する(ステップS210)。すなわち、演算回路部160は、登録された登山ルート情報のうち、現在位置を基点にして移動済みの距離L1の位置から移動予定の距離L2の位置までの距離範囲L分の登山ルート情報を、部分ルート情報として抽出する。
Then, when the user starts moving along the mountain climbing route (step S206), the
次いで、演算回路部160は、取得した部分ルート情報の中から、最高高度及び最低高度を取得し(ステップS212)、グラフの表示範囲の下限を、取得した最低高度に設定したときに、部分ルート情報の第1位置の高度がグラフの高度範囲Hの上限と下限の範囲内にあるか否かを判定する(ステップS214)。演算回路部160は、第1位置の高度がグラフの高度範囲H内にある場合(ステップS214のYes)には、ステップS216に進み、一方、第1位置の高度がグラフの高度範囲H内にない場合(ステップS214のNo)には、図14に示すフローチャートのステップS222に進む。
Next, the
ステップS216においては、演算回路部160は、取得した部分ルート情報において、グラフの表示範囲の下限を、最低高度に設定したときに、部分ルート情報の高度にグラフの高度範囲H外となる部分があるか否かを判定する(ステップS216)。演算回路部160は、部分ルート情報の高度にグラフの高度範囲H外となる部分がない場合(ステップS216のNo)には、ステップS218に進み、一方、部分ルート情報の高度に高度範囲H外となる部分がある場合(ステップS216のYes)には、ステップ232に進む。
In step S216, when the lower limit of the display range of the graph is set to the lowest altitude in the acquired partial route information, the
ステップS218においては、演算回路部160は、図15に示したグラフの表示範囲の下限を、取得した最低高度に設定するとともに、表示範囲の左端に第1位置を設定して、部分ルート情報を表示範囲に、第1位置から現在位置までの高度部分を、第3表示形態で表示し、現在位置から第2位置までの高度部分を、第1表示形態で表示する。すなわち、図16に示すような高度の変化を有する登山ルートにおいて、現在位置を基点にして距離L1だけ前の第1位置から距離L2だけ後の第2位置までの距離範囲L分の予定高度を表示する場合、図中(a)〜(c)、(i)、(j)に示すように、最低高度が表示範囲の下限に設定される。加えて、第1位置から現在位置までの高度部分(高度履歴)は、例えば単位時間ごとの高度を単一の黒ドットにより表示して、表示範囲の当該ドットより下方側を埋め尽くさない第3表示形態で表示され、現在位置から第2位置までの高度部分(予定高度)は、例えば第1表示形態で表示される。このようにステップS218の処理動作により生成されるグラフは、距離範囲Lにおける全ての高度が高度範囲H内に収まるグラフであって、上述した第1の表示例に対応する。そして、演算回路部160は、ステップS218におけるグラフ表示の後、現在位置が終着点(GOAL位置)か否かを判定し(ステップS220)、現在位置が終着点である場合(ステップS220のYes)には、一連の処理動作を終了し、終着点でない場合(ステップS220のNo)には、ステップS208に戻って、ユーザの現在位置を取得する処理を再度実行する。
In step S218, the
また、ステップS216において、部分ルート情報の高度に高度範囲H外となる部分がある場合(ステップS216のYes)には、演算回路部160は、部分ルート情報において、グラフの表示範囲の下限を最低高度に設定したときに、グラフの表示範囲(高度範囲H)外となる高度部分を、範囲外ルート情報として取得する(ステップS232)。
Further, in step S216, when there is a portion outside the altitude range H in the altitude of the partial route information (Yes in step S216), the
次いで、演算回路部160は、グラフの表示範囲の下限を最低高度に設定するとともに、表示範囲の左端に第1位置を設定して、部分ルート情報から範囲外ルート情報を除いた高度部分を、第1表示形態及び第3表示形態で表示範囲に表示し、範囲外ルート情報の高度部分を、第2表示形態で表示範囲に表示する(ステップS234)。すなわち、図16に示した登山ルートにおいて、図中(d)〜(f)に示すように、最低高度が表示範囲の下限に設定され、かつ、距離範囲Lにおいて高度範囲H内に収まる高度部分は、各高度を示すドットが上述した第1表示形態及び第3表示形態で表示範囲に表示されるとともに、高度範囲Hの上限を上回った高度部分は、高度範囲Hに相当する高度の値を減算するシフト処理を行い、表示色を反転した状態(第2表示形態)で表示範囲に表示されたグラフがステップS234の処理動作により生成される。これらのグラフは、上述した第2の表示例に対応する。そして、演算回路部160は、ステップS234におけるグラフ表示の後、上述したステップS220に進む。
Next, the
また、ステップS214において、第1位置の高度がグラフの高度範囲H内にない場合(ステップS214のNo)には、演算回路部160は、グラフの表示範囲の上限を、取得した最高高度に設定したときに、部分ルート情報の第1位置の高度がグラフの上限と下限の範囲(高度範囲H)内にあるか否かを判定する(ステップS222)。演算回路部160は、第1位置の高度がグラフの高度範囲H内にある場合(ステップS222のYes)には、ステップS224に進み、一方、第1位置の高度がグラフの高度範囲H内にない場合(ステップS222のNo)には、ステップS228に進む。
When the altitude at the first position is not within the altitude range H of the graph in step S214 (No in step S214), the
ステップS224においては、演算回路部160は、部分ルート情報において、グラフの表示範囲の上限を最高高度に設定したときに、部分ルート情報の高度が高度範囲H外となる部分があるか否かを判定する。演算回路部160は、部分ルート情報の高度に高度範囲H外となる部分がない場合(ステップS224のNo)には、ステップS226に進み、一方、部分ルート情報の高度に高度範囲H外となる部分がある場合(ステップS224のYes)には、ステップ242に進む。
In step S224, the arithmetic
ステップS226においては、演算回路部160は、図15に示したグラフの表示範囲の上限を、取得した最高高度に設定するとともに、表示範囲の左端に第1位置を設定して、部分ルート情報の高度を、第1表示形態及び第3表示形態で表示範囲に表示する。このようにステップS226の処理動作により生成されるグラフは、距離範囲Lにおける全ての高度が高度範囲H内に収まるグラフである。そして、演算回路部160は、ステップS226におけるグラフ表示の後、上述したステップS220に進む。
In step S226, the arithmetic
また、ステップS224において、部分ルート情報の高度に高度範囲H外となる部分がある場合(ステップS224のYes)には、演算回路部160は、部分ルート情報において、グラフの表示範囲の上限を最高高度に設定したときに、高度範囲H外となる高度部分を、範囲外ルート情報として取得する(ステップS242)。
In step S224, when there is a portion of the altitude of the partial route information outside the altitude range H (Yes in step S224), the
次いで、演算回路部160は、グラフの表示範囲の上限を最高高度に設定するとともに、表示範囲の左端に第1位置を設定して、部分ルート情報から範囲外ルート情報を除いた高度部分を、第1表示形態及び第3表示形態で表示範囲に表示し、範囲外ルート情報の高度部分を、第2表示形態で表示範囲に表示する(ステップS244)。すなわち、図16に示した登山ルートにおいて、図中(g)、(h)に示すように、最高高度が表示範囲の上限に設定され、かつ、距離範囲Lにおいて高度範囲H内に収まる高度部分は、上述した第1表示形態及び第3表示形態で表示範囲に表示されるとともに、高度範囲Hの下限を下回った高度部分は、高度範囲Hに相当する高度の値を加算する換算シフト処理を行い、ドットの表示色を反転した状態(第2表示形態)で表示範囲に表示される。このようにステップS244の処理動作により生成されたグラフは、上述した第3の表示例に対応する。そして、演算回路部160は、ステップS244におけるグラフ表示の後、上述したステップS220に進む。
Next, the
また、ステップS222において、第1位置の高度が高度範囲H内にない場合(ステップS222のNo)には、演算回路部160は、部分ルート情報において、グラフの表示範囲の高さ方向の中央に、第1位置の高度が表示されるように、表示範囲の上限、下限を設定したときに、部分ルート情報の高度に高度範囲H外となる部分があるか否かを判定する(ステップS228)。演算回路部160は、部分ルート情報の高度にグラフの高度範囲H外となる部分がない場合(ステップS228のNo)には、ステップS230に進み、一方、部分ルート情報の高度に高度範囲H外となる部分がある場合(ステップS228のYes)には、ステップ252に進む。
If the altitude at the first position is not within the altitude range H in step S222 (No in step S222), the
ステップS230においては、演算回路部160は、図15に示したグラフの表示範囲の高さ方向の中央に、第1位置の高度が表示されるように、表示範囲の上限、下限を設定するとともに、表示範囲の左端に第1位置を設定して、部分ルート情報の高度を、第1表示形態及び第3表示形態で表示範囲に表示する。このようにステップS230の処理動作により生成されるグラフは、距離範囲Lにおける全ての高度が高度範囲H内に収まるグラフである。演算回路部160は、ステップS230におけるグラフ表示の後、上述したステップS220に進む。
In step S230, the
また、ステップS228において、部分ルート情報の高度に高度範囲H外となる部分がある場合(ステップS228のYes)には、演算回路部160は、部分ルート情報において、グラフの表示範囲の高さ方向の中央に、第1位置の高度が表示されるように、表示範囲の上限、下限を設定したときに、高度範囲H外となる高度部分を、範囲外ルート情報として取得する(ステップS252)。
In addition, in step S228, when there is a portion outside the altitude range H in the altitude of the partial route information (Yes in step S228), the
次いで、演算回路部160は、グラフの表示範囲の高さ方向の中央に、第1位置の高度が表示されるように、表示範囲の上限、下限を設定して、部分ルート情報から範囲外ルート情報を除いた高度部分を、第1表示形態及び第3表示形態で表示範囲に表示し、範囲外ルート情報の高度部分を、第2表示形態で表示範囲に表示する(ステップS254)。すなわち、第1位置の高度が表示範囲の中央に設定され、かつ、距離範囲Lにおいて高度範囲H内に収まる高度部分は、上述した第1表示形態及び第3表示形態で表示範囲に表示されるとともに、高度範囲Hを逸脱した高度部分に対しては、高度範囲Hに相当する高度の値だけシフトさせるシフト処理を行い、ドットの表示色を反転した状態(第2表示形態)で表示範囲に表示される。演算回路部160は、ステップS254におけるグラフ表示の後、上述したステップS220に進む。
Then, the
本具体例においては、上述した一連の処理動作を繰り返し実行することにより、図16(a)〜(j)に示すように、登山ルートを移動するユーザが装着又は携帯した電子機器の表示部140に、現在位置を基点とする過去の高度履歴と将来の予定高度とが随時表示される。ここで、グラフに表示される過去の高度履歴と将来の予定高度とは異なる表示形態で表示される。また、距離範囲及び高度範囲が設定されたグラフに、過去の高度履歴と将来の予定高度の概ね全体が適切に表示されるように、当該距離範囲における最低高度が当該高度範囲の下限、又は、当該距離範囲における最高高度が当該高度範囲の上限となるように、グラフの表示範囲を高さ方向に随時ずらすように制御される。
In the present specific example, by repeatedly executing the series of processing operations described above, as shown in FIGS. 16A to 16J, the
これによれば、上述した第1の具体例に示した作用効果に加え、移動済みのルートから移動予定のルートに至るまでの高度の変化の概ね全体が適切に表示されるので、ユーザはグラフ表示を一目見るだけで、過去の高度の変化や移動の記録、実績と比較しつつ、将来の高度の変化(登り坂や下り坂の傾斜や継続の程度等)や移動の予定、計画等を適切に検証したり確認したりすることができる。 According to this, in addition to the action and effect shown in the above-described first specific example, almost the entire change in altitude from the route that has been moved to the route that is scheduled to be moved is appropriately displayed. With a glance at the display, you can compare future altitude changes and movement records, and records, and make future changes in altitude (uphill and downhill slopes, degree of continuation, etc.), travel plans, and plans. It can be properly verified and confirmed.
(第3の具体例)
図17は、本実施形態に係る情報表示制御方法の第3の具体例を示すフローチャートである。また、図18は、本具体例に係る情報表示制御方法に適用されるグラフの表示範囲を規定するための概略図であり、図19は、本具体例に係る情報表示制御方法おける高度の変化の表示状態を示す詳細図である。ここで、上述した第1及び第2の具体例と同等の処理動作については説明を簡略化する。
(Third specific example)
FIG. 17 is a flowchart showing a third specific example of the information display control method according to this embodiment. 18 is a schematic diagram for defining the display range of the graph applied to the information display control method according to this specific example, and FIG. 19 is a change in altitude in the information display control method according to this specific example. 3 is a detailed diagram showing a display state of FIG. Here, the description of the processing operations equivalent to those of the above-described first and second specific examples will be simplified.
上述した第1及び第2の具体例においては、グラフに高度の変化(特に、現在位置の高度を含む予定高度)の概ね全体が適切に表示されるように、グラフの表示範囲を高さ方向(縦軸方向)に任意の数値分、随時ずらすように制御する場合について説明した。第3の具体例においては、グラフに設定された高度範囲分の高度の変化ごとに、グラフの表示範囲を高さ方向(縦軸方向)に段階的に切り換えるように制御する場合について説明する。 In the above-described first and second specific examples, the graph display range is set in the height direction so that almost the entire change in altitude (particularly, the planned altitude including the altitude at the current position) is appropriately displayed in the graph. The case has been described in which control is performed so as to shift by an arbitrary numerical value in the (ordinate direction) at any time. In the third specific example, a case will be described in which the display range of the graph is controlled so as to be switched stepwise in the height direction (vertical axis direction) for each change in altitude corresponding to the altitude range set in the graph.
本実施形態に係る情報表示制御方法の第3の具体例においては、図17のフローチャートに示すように、まず、演算回路部160は、登山ルート情報を取得し(ステップS302)、グラフ表示に適したデータに加工する(ステップS304)。ここで、本具体例においては、図18に示すように、上述した第2の具体例と同様に、距離範囲Lが設定されたグラフにおける、距離範囲L内の左端を除く任意の位置に現在位置が設定され、当該現在位置を基点として高度履歴と予定高度が、同一のグラフ中に表示される。また、登山ルート情報のデータ加工においても、上述した第2の具体例と同様に、演算回路部160は、取得した登山ルート情報に含まれる登山ルートの出発点(START位置)の前に、距離L1分に相当するゼロデータを付加し、終着点(GOAL位置)の後に、距離L2分に相当するゼロデータを付加する処理を行う。
In the third specific example of the information display control method according to the present embodiment, as shown in the flowchart of FIG. 17, first, the
次いで、演算回路部160は、登山ルート情報全体の中から、最高高度及び最低高度を取得し、登山ルート全体の高度の変化を表示するために必要とする表示範囲の段数nを算出する(ステップS306)。本具体例においては、図18に示すように、登所定の高度範囲Hが設定されたグラフの表示範囲を縦軸方向に隣接するように複数(n段)配列する(又は、複数積み上げる)ことにより、登山ルート全体の高度の変化(すなわち、最高高度と最低高度との差分)を表示する。具体的には、例えば登山ルート中の最高高度と最低高度との差分が1000mであり、グラフに設定された高度範囲Hが100mである場合、登山ルート全体を表示するために必要とする表示範囲の段数nは10段(=1000÷100)と算出される。
Next, the
次いで、ユーザが登山ルートに沿って移動を開始すると(ステップS308)、演算回路部160は、ユーザの現在位置を取得する(ステップS310)。そして、演算回路部160は、取得した現在位置に基づいて、登山ルート情報から、図18に示したグラフの表示範囲に設定された現在位置の表示位置を基点にして、距離L1だけ前の第1位置(距離範囲Lの左端)から、距離L2だけ後の第2位置(距離範囲Lの右端)までの部分ルート情報を取得する(ステップS312)。
Next, when the user starts moving along the mountain climbing route (step S308), the
次いで、演算回路部160は、現在位置の高度が含まれる表示範囲の段数mを取得する(ステップS314)。ここで、段数mは、ステップS306において算出された、登山ルート全体を表示するために必要とする表示範囲の段数n以下の値となる。そして、演算回路部160は、現在位置の高度が含まれるm段目の表示範囲を、第m表示範囲に設定する(ステップS316)。
Next, the
次いで、演算回路部160は、ステップS312において取得された部分ルート情報において、第m表示範囲外となる高度部分があるか否かを判定する(ステップS318)。演算回路部160は、部分ルート情報に第m表示範囲外となる高度部分がない場合(ステップS318のNo)には、ステップS320に進み、一方、部分ルート情報に第m表示範囲外となる高度部分がある場合(ステップS318のYes)には、ステップS324に進む。
Next, the
ステップS320においては、演算回路部160は、表示範囲の左端に第1位置を設定して、取得した部分ルート情報を第m表示範囲に、第1位置から現在位置までの高度部分を、第3表示形態で表示し、現在位置から第2位置までの高度部分を、第1表示形態で表示する。すなわち、図19に示すような高度の変化を有する登山ルートにおいて、現在位置を基点にして距離L1だけ前の第1位置から距離L2だけ後の第2位置までの距離範囲L分の予定高度を表示する場合、図中(b)、(h)〜(j)に示すように、第m表示範囲(ここではm=1;1段目の表示範囲)に、第3表示形態で高度履歴が表示され、第1表示形態で予定高度が表示される。このようにステップS320の処理動作により生成されるグラフは、距離範囲Lにおける全ての高度が第m表示範囲の高度範囲H内に収まるグラフであって、上述した第1の表示例に対応する。そして、演算回路部160は、ステップS320におけるグラフ表示の後、現在位置が終着点(GOAL位置)か否かを判定し(ステップS322)、現在位置が終着点である場合(ステップS322のYes)には、一連の処理動作を終了し、終着点でない場合(ステップS322のNo)には、ステップS310に戻って、ユーザの現在位置を取得する処理を再度実行する。
In step S320, the
また、ステップS318において、部分ルート情報に第m表示範囲外となる高度部分がある場合(ステップS318のYes)には、演算回路部160は、部分ルート情報から、第m表示範囲外となる範囲外ルート情報を取得する(ステップS324)。
In step S318, when the partial route information includes an altitude part outside the m-th display range (Yes in step S318), the
次いで、演算回路部160は、表示範囲の左端に第1位置を設定して、部分ルート情報から範囲外ルート情報を除いた高度部分を、第1表示形態及び第3表示形態で第m表示範囲に表示し、範囲外ルート情報の高度部分を、第2表示形態で第m表示範囲に表示する(ステップS326)。すなわち、図19に示した登山ルートにおいて、図中(c)、(d)、に示すように、距離範囲Lにおいて第m表示範囲の高度範囲H内に収まる高度部分は、各高度を示すドットが上述した第1表示形態及び第3表示形態で第m表示範囲に表示されるとともに、第m表示範囲の高度範囲Hを逸脱した高度部分に対して、高度範囲Hに相当する高度の値だけシフトさせるシフト処理を行い、表示色を反転した状態(第2表示形態)で、第m表示範囲に表示されたグラフがステップS326の処理動作により生成される。これらのグラフは、上述した第2又は第3の表示例に対応する。そして、演算回路部160は、ステップS234におけるグラフ表示の後、上述したステップS220に進む。
Next, the
本具体例においては、上述した一連の処理動作を繰り返し実行することにより、図19(a)〜(j)に示すように、登山ルートを移動するユーザが装着又は携帯した電子機器の表示部140に、現在位置を基点とする過去の高度履歴と将来の予定高度とが随時表示される。ここで、グラフに表示される過去の高度履歴と将来の予定高度とは異なる表示形態で表示される。また、距離範囲及び高度範囲が設定されたグラフに、過去の高度履歴と将来の予定高度の概ね全体が適切に表示されるように、現在位置の高度が、グラフの表示範囲に設定されている高度範囲Hの上限又は下限に達するたびに、グラフの表示範囲が隣接する表示範囲に段階的に切り替わるように制御される。
In this specific example, by repeatedly executing the series of processing operations described above, as shown in FIGS. 19A to 19J, the
これによれば、上述した第1及び第2の具体例と同様に、所定の距離範囲及び高度範囲に設定されたグラフに、従来表示部の表示範囲を逸脱して表示されなかった高度変化の領域を含む、より広い範囲の高度の変化を適切に表示させることができるので、ユーザはグラフ表示を一目見るだけで、将来の高度変化(登り坂や下り坂の傾斜や継続の程度等)を直感的かつ正確に把握することができる。 According to this, similarly to the above-described first and second specific examples, in the graph set to the predetermined distance range and altitude range, there is a change in altitude that is not displayed outside the display range of the conventional display unit. Since it is possible to properly display a wider range of altitude changes including areas, the user can see future altitude changes (uphill and downhill slopes and extents of continuation, etc.) at a glance at the graph display. Can be grasped intuitively and accurately.
なお、上述した各具体例においては、表示部140のグラフ表示領域142aに、過去及び将来の高度の変化を示すグラフ画像を表示する場合について説明したが、上述したように、グラフの表示範囲を高さ方向(縦軸方向)に随時又は段階的にずらすさせるように制御する場合には、少なくともグラフの高度範囲の上限及び下限の高度を示す数値を表示することが望ましい。このような高度の数値表示を行う場合には、演算回路部160は、グラフの表示範囲を高さ方向にずらすさせるたびに、高度の数値表示を更新するように制御する。また、表示範囲の随時又は段階的なずらしが実行されるたびに、グラフの表示色を変更したり、メッセージを表示したりする等の通知動作を併せて実行することが望ましい。
In each of the specific examples described above, a case has been described in which the
以上、本発明のいくつかの実施形態について説明したが、本発明は、上述した実施形態に限定されるものではなく、特許請求の範囲に記載された発明とその均等の範囲を含むものである。
以下に、本願出願の当初の特許請求の範囲に記載された発明を付記する。
Although some embodiments of the present invention have been described above, the present invention is not limited to the above-described embodiments and includes the inventions described in the claims and their equivalents.
The inventions described in the initial claims of the present application will be additionally described below.
(付記)
[1]
表示部と、
設定された移動ルート上の複数の位置の各々に対する複数の高度の値を示すグラフを、前記表示部の、横軸が前記移動ルート上の位置に対応するように設定され、縦軸が前記高度の値に対応するように設定されたグラフ表示領域に表示させるとともに、前記グラフの表示形態を制御する制御部と、
を備え、
前記制御部は、前記複数の高度の値が、前記グラフ表示領域の前記縦軸に設定されている高度範囲外の値を含んでいるとき、前記高度範囲外の前記高度の値を、前記高度範囲内となる値にシフトさせるシフト処理を行い、前記シフト処理を行った後の前記高度の値による前記グラフを前記グラフ表示領域に表示させることを特徴とする電子機器。
(Appendix)
[1]
Display part,
A graph showing a plurality of altitude values for each of the plurality of positions on the set traveling route is set so that the horizontal axis of the display unit corresponds to the position on the traveling route, and the vertical axis indicates the altitude. While displaying in the graph display area set to correspond to the value of, the control unit for controlling the display form of the graph,
Equipped with
The control unit, when the plurality of altitude values include a value outside the altitude range set on the vertical axis of the graph display area, the altitude value outside the altitude range is set to the altitude. An electronic device characterized by performing a shift process for shifting to a value within a range and displaying the graph according to the altitude value after the shift process in the graph display area.
[2]
前記制御部は、前記高度範囲内の前記高度の値による前記グラフを、第1表示形態で前記グラフ表示領域に表示させ、前記シフト処理を行った後の前記高度の値による前記グラフを、前記第1表示形態と異なる第2表示形態で、前記グラフ表示領域に表示させることを特徴とする[1]に記載の電子機器。
[2]
The control unit displays the graph by the value of the altitude within the altitude range in the graph display area in the first display form, and the graph by the value of the altitude after performing the shift process, The electronic device according to [1], wherein the electronic device is displayed in the graph display area in a second display form different from the first display form.
[3]
前記制御部は、前記シフト処理において、前記高度の値が、前記グラフ表示領域の前記高度範囲の上限を上回っているとき、前記高度の値から前記高度範囲に相当する前記高度の値を減算し、前記高度の値が、前記グラフ表示領域の前記高度範囲の下限を下回っているとき、前記高度の値に前記高度範囲に相当する前記高度の値を加算することを特徴とする[1]に記載の電子機器。
[3]
In the shift process, the control unit subtracts the altitude value corresponding to the altitude range from the altitude value when the altitude value exceeds the upper limit of the altitude range of the graph display area. When the altitude value is below the lower limit of the altitude range of the graph display area, the altitude value corresponding to the altitude range is added to the altitude value [1]. Electronic device described.
[4]
前記電子機器の現在位置を取得する測位部を備え、
前記グラフ表示領域の前記横軸の範囲は所定の距離範囲に設定され、
前記制御部は、
前記移動ルートの全体に沿った高度の値を有するルート情報より、前記移動ルートにおける前記現在位置を含む前記距離範囲での前記高度の値を有する部分ルート情報を取得し、
前記グラフとして、前記部分ルート情報における前記距離範囲の前記高度の値を表示させることを特徴とする[1]乃至[3]のいずれか一項に記載の電子機器。
[4]
A positioning unit for acquiring the current position of the electronic device,
The range of the horizontal axis of the graph display area is set to a predetermined distance range,
The control unit is
From the route information having an altitude value along the entire travel route, obtain partial route information having the altitude value in the distance range including the current position in the travel route,
The electronic device according to any one of [1] to [3], wherein the altitude value of the distance range in the partial route information is displayed as the graph.
[5]
前記電子機器が前記移動ルートを移動しているとき、
前記制御部は、前記移動ルートにおける前記距離範囲として、前記移動ルートにおける現在より前に移動済みの第1距離範囲と、前記移動ルートにおける現在より後に移動予定の第2距離範囲とを設定し、
前記第1距離範囲に対する前記グラフを、前記第1表示形態及び前記第2表示形態と異なる第3表示形態で前記グラフ表示領域に表示させることを特徴とする請求項[4]に記載の電子機器。
[5]
When the electronic device is moving on the movement route,
The control unit sets, as the distance range in the movement route, a first distance range that has been moved before the present in the movement route and a second distance range that is scheduled to move after the present in the movement route,
The electronic device according to
[6]
設定された移動ルート上の複数の位置の各々に対する複数の高度の値を示すグラフを、表示部の、横軸が前記移動ルート上の位置に設定され、縦軸が前記高度の値に設定されたグラフ表示領域に表示し、
前記グラフの表示形態を制御し、
前記表示形態の制御において、
前記複数の高度の値が、前記グラフ表示領域の前記縦軸に設定されている高度範囲外の値を含んでいるとき、前記高度範囲外の前記高度の値を、前記高度範囲内となる値にシフトさせるシフト処理を行い、
前記シフト処理を行った後の前記高度の値による前記グラフを前記グラフ表示領域に表示させる、
ことを特徴とする情報表示制御方法。
[6]
A graph showing a plurality of altitude values for each of a plurality of positions on the set traveling route, the horizontal axis of the display unit is set to the position on the traveling route, the vertical axis is set to the altitude value. Displayed in the graph display area,
Controlling the display form of the graph,
In the control of the display form,
When the plurality of altitude values include a value outside the altitude range set on the vertical axis of the graph display area, the altitude value outside the altitude range is a value within the altitude range. Shift process to shift to
Displaying the graph according to the altitude value after performing the shift process in the graph display area,
An information display control method characterized by the above.
[7]
コンピュータに、
設定された移動ルート上の複数の位置の各々に対する複数の高度の値を示すグラフを、表示部の、横軸が前記移動ルート上の位置に設定され、縦軸が前記高度の値に設定されたグラフ表示領域に表示させ、
前記グラフの表示形態を制御させ、
前記表示形態の制御において、
前記複数の高度の値が、前記グラフ表示領域の前記縦軸に設定されている高度範囲外の値を含んでいるとき、前記高度範囲外の前記高度の値を、前記高度範囲内となる値にシフトさせるシフト処理を行わせ、
前記シフト処理を行った後の前記高度の値による前記グラフを前記グラフ表示領域に表示させる、
ことを特徴とする情報表示制御プログラム。
[7]
On the computer,
A graph showing a plurality of altitude values for each of the plurality of positions on the set traveling route, the horizontal axis of the display is set to the position on the traveling route, the vertical axis is set to the altitude value Displayed in the graph display area,
Control the display form of the graph,
In the control of the display form,
When the plurality of altitude values include a value outside the altitude range set on the vertical axis of the graph display area, the altitude value outside the altitude range is a value within the altitude range. Shift processing to shift to
Displaying the graph according to the altitude value after performing the shift process in the graph display area,
An information display control program characterized by the above.
100 電子機器
110 モーションセンサ部
120 GPS測位部
140 表示部
142 表示パネル
142a グラフ表示領域
160 演算回路部(制御部)
100
Claims (7)
設定された移動ルート上の複数の時刻の各々に対する複数の高度の値を示すグラフを、前記表示部の、横軸が前記移動ルート上の時刻に対応するように設定され、縦軸が前記高度の値に対応するように設定されたグラフ表示領域に表示させるとともに、前記グラフの表示形態を制御する制御部と、
を備え、
前記制御部は、現在時刻に至るまでの過去の時刻における前記高度の値を示す第1表示形態と、現在時刻以降の将来の時刻における前記高度の値を示す第2表示形態と、を表示の形態を異ならせて前記グラフ表示領域に表示させることを特徴とする電子機器。 Display part,
A graph showing a plurality of altitude values for each of a plurality of times set on the travel route, the horizontal axis of the display unit is set so as to correspond to the time on the travel route, the vertical axis is the altitude. While displaying in the graph display area set to correspond to the value of, the control unit for controlling the display form of the graph,
Equipped with
The control unit displays a first display form showing a value of the altitude at a past time up to the current time and a second display form showing a value of the altitude at a future time after the current time. An electronic device, wherein the electronic device is displayed in the graph display area in different forms .
前記制御部は、前記第1表示形態では、各時刻における前記高度の値を、各時刻における高度の値を示すドットのみを塗りつぶした単一塗りつぶしドットにより示し、前記第2表示形態では、各時刻における前記高度の値を、各時刻における高度の値を示すドットまで、塗りつぶしたドットを積み重ねた塗りつぶしドット群により示すことを特徴とする請求項1に記載の電子機器。 The graph display area has a two-dimensional shape in which dots of a predetermined shape are arranged in a horizontal direction and a vertical direction,
In the first display mode, the control unit indicates the altitude value at each time by a single filled dot that fills only the dots indicating the altitude value at each time, and in the second display mode, each time 2. The electronic device according to claim 1, wherein the value of the altitude in is indicated by a filled dot group in which filled dots are stacked up to a dot indicating the value of the altitude at each time .
前記グラフ表示領域の前記横軸の範囲は所定の距離範囲に設定され、
前記制御部は、
前記移動ルートの全体に沿った高度の値を有するルート情報より、前記移動ルートにおける前記現在時刻における位置である現在位置を含む前記距離範囲での前記高度の値を有する部分ルート情報を取得し、
前記グラフとして、前記部分ルート情報における前記距離範囲の前記高度の値を表示させることを特徴とする請求項1乃至4のいずれか一項に記載の電子機器。 A positioning unit for acquiring the current position of the electronic device,
The range of the horizontal axis of the graph display area is set to a predetermined distance range,
The control unit is
From route information having an altitude value along the entire travel route, obtain partial route information having the altitude value in the distance range including the current position which is the position at the current time in the travel route,
The electronic device according to any one of claims 1 to 4 , wherein the altitude value of the distance range in the partial route information is displayed as the graph.
前記グラフの表示形態を制御し、
前記表示形態の制御において、
現在時刻に至るまでの過去の時刻における前記高度の値を示す第1表示形態と、現在時刻以降の将来の時刻における前記高度の値を示す第2表示形態と、を表示の形態を異ならせて前記グラフ表示領域に表示させる、
ことを特徴とする情報表示制御方法。 The graph showing a plurality of elevation value for each of a plurality of time on the set route of travel, the display unit, the horizontal axis is set to the time on the movement route, the vertical axis is set to the high value Displayed in the graph display area,
Controlling the display form of the graph,
Te control odors of the display form,
The first display form showing the value of the altitude at a past time up to the current time and the second display form showing the value of the altitude at a future time after the current time are displayed differently. Display in the graph display area,
An information display control method characterized by the above.
設定された移動ルート上の複数の時刻の各々に対する複数の高度の値を示すグラフを、表示部の、横軸が前記移動ルート上の時刻に設定され、縦軸が前記高度の値に設定されたグラフ表示領域に表示させ、
前記グラフの表示形態を制御させ、
前記表示形態の制御において、
現在時刻に至るまでの過去の時刻における前記高度の値を示す第1表示形態と、現在時刻以降の将来の時刻における前記高度の値を示す第2表示形態と、を表示の形態を異ならせて前記グラフ表示領域に表示させる、
ことを特徴とする情報表示制御プログラム。 On the computer,
The graph showing a plurality of elevation value for each of a plurality of time on the set route of travel, the display unit, the horizontal axis is set to the time on the movement route, the vertical axis is set to the high value Displayed in the graph display area,
Control the display form of the graph,
Te control odors of the display form,
The first display form showing the value of the altitude at a past time up to the current time and the second display form showing the value of the altitude at a future time after the present time are displayed differently. Display in the graph display area,
An information display control program characterized by the above.
Priority Applications (1)
| Application Number | Priority Date | Filing Date | Title |
|---|---|---|---|
| JP2015186328A JP6700574B2 (en) | 2015-09-24 | 2015-09-24 | Electronic device, information display control method therefor, and information display control program |
Applications Claiming Priority (1)
| Application Number | Priority Date | Filing Date | Title |
|---|---|---|---|
| JP2015186328A JP6700574B2 (en) | 2015-09-24 | 2015-09-24 | Electronic device, information display control method therefor, and information display control program |
Publications (2)
| Publication Number | Publication Date |
|---|---|
| JP2017062132A JP2017062132A (en) | 2017-03-30 |
| JP6700574B2 true JP6700574B2 (en) | 2020-05-27 |
Family
ID=58429439
Family Applications (1)
| Application Number | Title | Priority Date | Filing Date |
|---|---|---|---|
| JP2015186328A Active JP6700574B2 (en) | 2015-09-24 | 2015-09-24 | Electronic device, information display control method therefor, and information display control program |
Country Status (1)
| Country | Link |
|---|---|
| JP (1) | JP6700574B2 (en) |
Family Cites Families (6)
| Publication number | Priority date | Publication date | Assignee | Title |
|---|---|---|---|---|
| JP3194282B2 (en) * | 1991-11-15 | 2001-07-30 | カシオ計算機株式会社 | Data display control device and data display control method |
| JP2001215162A (en) * | 2000-01-31 | 2001-08-10 | Seiko Instruments Inc | Portable measuring device and display method |
| JP2003186852A (en) * | 2001-12-21 | 2003-07-04 | Casio Comput Co Ltd | Graphical representation apparatus, program, and graphical representation method |
| US7254516B2 (en) * | 2004-12-17 | 2007-08-07 | Nike, Inc. | Multi-sensor monitoring of athletic performance |
| JP2012032367A (en) * | 2010-07-07 | 2012-02-16 | Software Factory:Kk | Portable information terminal |
| JP6515620B2 (en) * | 2015-03-23 | 2019-05-22 | カシオ計算機株式会社 | Electronic device, progress indication method and program |
-
2015
- 2015-09-24 JP JP2015186328A patent/JP6700574B2/en active Active
Also Published As
| Publication number | Publication date |
|---|---|
| JP2017062132A (en) | 2017-03-30 |
Similar Documents
| Publication | Publication Date | Title |
|---|---|---|
| US20170265142A1 (en) | Sensor data extraction system, sensor data extraction method, and computer-readable storage medium having sensor data extraction program stored thereon | |
| JP6347097B2 (en) | Portable device and heartbeat arrival time measurement control method | |
| CN102449560B (en) | Sports watch | |
| US10085692B2 (en) | Exercise support device, exercise support method, and computer-readable storage medium having exercise support program stored therein | |
| US10342462B2 (en) | Application of gait characteristics for mobile | |
| US20180043212A1 (en) | System, method, and non-transitory computer readable medium for recommending a route based on a user's physical condition | |
| US20180028863A1 (en) | Swimming information processing system, information processing apparatus, swimming information processing method, and program | |
| JP6149893B2 (en) | Data extraction system, data extraction method, and data extraction program | |
| US10488222B2 (en) | Mobile device control leveraging user kinematics | |
| JP6015900B2 (en) | Information processing apparatus, exercise support information providing system, exercise support information providing method, and exercise support information providing program | |
| US20170273637A1 (en) | Information processing device and information processing method | |
| US20190240537A1 (en) | Exercise data display device, exercise data display method, and computer readable non-transitory storage medium with program stored thereon | |
| JP2014182063A (en) | Device, system and program for outputting travel information | |
| JP2009222407A (en) | Portable type walk support device | |
| JP6515620B2 (en) | Electronic device, progress indication method and program | |
| US20150099477A1 (en) | Portable apparatus and cumulative time display control method | |
| JP6037102B2 (en) | Information processing apparatus, electronic device, movement support information providing system, and movement support information providing method | |
| JP6036010B2 (en) | Network service system, member terminal, server and program | |
| JP6700574B2 (en) | Electronic device, information display control method therefor, and information display control program | |
| JP5892305B2 (en) | Activity amount measuring device, activity amount measuring system, program and recording medium | |
| CN106918324B (en) | Information processing apparatus, information processing method, and storage medium | |
| US20170136338A1 (en) | Exercise information measuring apparatus, program, and control method | |
| JP6229830B2 (en) | Exercise support device, exercise support method, and exercise support program | |
| JP2015066005A (en) | Activity support device, portable terminal, and activity support system | |
| JP2023079989A (en) | Running course display device and program |
Legal Events
| Date | Code | Title | Description |
|---|---|---|---|
| A621 | Written request for application examination |
Free format text: JAPANESE INTERMEDIATE CODE: A621 Effective date: 20180920 |
|
| A131 | Notification of reasons for refusal |
Free format text: JAPANESE INTERMEDIATE CODE: A131 Effective date: 20190830 |
|
| A977 | Report on retrieval |
Free format text: JAPANESE INTERMEDIATE CODE: A971007 Effective date: 20190830 |
|
| A521 | Written amendment |
Free format text: JAPANESE INTERMEDIATE CODE: A523 Effective date: 20191016 |
|
| TRDD | Decision of grant or rejection written | ||
| A01 | Written decision to grant a patent or to grant a registration (utility model) |
Free format text: JAPANESE INTERMEDIATE CODE: A01 Effective date: 20200401 |
|
| A61 | First payment of annual fees (during grant procedure) |
Free format text: JAPANESE INTERMEDIATE CODE: A61 Effective date: 20200414 |
|
| R150 | Certificate of patent or registration of utility model |
Ref document number: 6700574 Country of ref document: JP Free format text: JAPANESE INTERMEDIATE CODE: R150 |