JP6430596B2 - Equipment control based on failure judgment - Google Patents
Equipment control based on failure judgment Download PDFInfo
- Publication number
- JP6430596B2 JP6430596B2 JP2017136255A JP2017136255A JP6430596B2 JP 6430596 B2 JP6430596 B2 JP 6430596B2 JP 2017136255 A JP2017136255 A JP 2017136255A JP 2017136255 A JP2017136255 A JP 2017136255A JP 6430596 B2 JP6430596 B2 JP 6430596B2
- Authority
- JP
- Japan
- Prior art keywords
- failure
- brake
- data
- degree
- computing device
- Prior art date
- Legal status (The legal status is an assumption and is not a legal conclusion. Google has not performed a legal analysis and makes no representation as to the accuracy of the status listed.)
- Active
Links
Images


Classifications
-
- G—PHYSICS
- G05—CONTROLLING; REGULATING
- G05B—CONTROL OR REGULATING SYSTEMS IN GENERAL; FUNCTIONAL ELEMENTS OF SUCH SYSTEMS; MONITORING OR TESTING ARRANGEMENTS FOR SUCH SYSTEMS OR ELEMENTS
- G05B23/00—Testing or monitoring of control systems or parts thereof
- G05B23/02—Electric testing or monitoring
- G05B23/0205—Electric testing or monitoring by means of a monitoring system capable of detecting and responding to faults
- G05B23/0218—Electric testing or monitoring by means of a monitoring system capable of detecting and responding to faults characterised by the fault detection method dealing with either existing or incipient faults
- G05B23/0243—Electric testing or monitoring by means of a monitoring system capable of detecting and responding to faults characterised by the fault detection method dealing with either existing or incipient faults model based detection method, e.g. first-principles knowledge model
- G05B23/0254—Electric testing or monitoring by means of a monitoring system capable of detecting and responding to faults characterised by the fault detection method dealing with either existing or incipient faults model based detection method, e.g. first-principles knowledge model based on a quantitative model, e.g. mathematical relationships between inputs and outputs; functions: observer, Kalman filter, residual calculation, Neural Networks
-
- G—PHYSICS
- G01—MEASURING; TESTING
- G01M—TESTING STATIC OR DYNAMIC BALANCE OF MACHINES OR STRUCTURES; TESTING OF STRUCTURES OR APPARATUS, NOT OTHERWISE PROVIDED FOR
- G01M99/00—Subject matter not provided for in other groups of this subclass
- G01M99/008—Subject matter not provided for in other groups of this subclass by doing functionality tests
-
- G—PHYSICS
- G05—CONTROLLING; REGULATING
- G05B—CONTROL OR REGULATING SYSTEMS IN GENERAL; FUNCTIONAL ELEMENTS OF SUCH SYSTEMS; MONITORING OR TESTING ARRANGEMENTS FOR SUCH SYSTEMS OR ELEMENTS
- G05B17/00—Systems involving the use of models or simulators of said systems
- G05B17/02—Systems involving the use of models or simulators of said systems electric
-
- G—PHYSICS
- G06—COMPUTING; CALCULATING OR COUNTING
- G06F—ELECTRIC DIGITAL DATA PROCESSING
- G06F17/00—Digital computing or data processing equipment or methods, specially adapted for specific functions
- G06F17/10—Complex mathematical operations
- G06F17/18—Complex mathematical operations for evaluating statistical data, e.g. average values, frequency distributions, probability functions, regression analysis
-
- G—PHYSICS
- G05—CONTROLLING; REGULATING
- G05B—CONTROL OR REGULATING SYSTEMS IN GENERAL; FUNCTIONAL ELEMENTS OF SUCH SYSTEMS; MONITORING OR TESTING ARRANGEMENTS FOR SUCH SYSTEMS OR ELEMENTS
- G05B23/00—Testing or monitoring of control systems or parts thereof
- G05B23/02—Electric testing or monitoring
- G05B23/0205—Electric testing or monitoring by means of a monitoring system capable of detecting and responding to faults
- G05B23/0218—Electric testing or monitoring by means of a monitoring system capable of detecting and responding to faults characterised by the fault detection method dealing with either existing or incipient faults
- G05B23/0221—Preprocessing measurements, e.g. data collection rate adjustment; Standardization of measurements; Time series or signal analysis, e.g. frequency analysis or wavelets; Trustworthiness of measurements; Indexes therefor; Measurements using easily measured parameters to estimate parameters difficult to measure; Virtual sensor creation; De-noising; Sensor fusion; Unconventional preprocessing inherently present in specific fault detection methods like PCA-based methods
Description
本発明は故障判定に基づいた設備制御技術に関する。 The present invention relates to equipment control technology based on failure determination.
統計モデルは、受信されたデータに基づいて、判定及び他のタイプの予測を行うために使用することができる。例えば、統計モデルは計算モデルの一種であって、データのより大きい母集団から判定される類似データに関する情報に部分的に基づいたデータに関する仮定の集合を含む。一例として、統計モデルに含まれる仮定の集合は、複数の確率分布を記述することができる。例えば、統計モデルは、1つ又は複数のランダム変数、また場合によっては、ランダムではない変数を関連付ける、1つ又は複数の数式で構成されてよい。通常、統計モデルは予測を行うために使用される前に、多量の履歴データを使用して改良することができる。しかしながら、十分な量の改良用データが利用できない場合、正確な統計モデルを生成することは困難であることがある。 The statistical model can be used to make decisions and other types of predictions based on the received data. For example, a statistical model is a type of computational model that includes a set of assumptions about data based in part on information about similar data determined from a larger population of data. As an example, the set of assumptions included in the statistical model can describe multiple probability distributions. For example, a statistical model may consist of one or more mathematical formulas that associate one or more random variables, and possibly non-random variables. Typically, statistical models can be refined using large amounts of historical data before being used to make predictions. However, it may be difficult to generate an accurate statistical model if a sufficient amount of improvement data is not available.
受信されたデータに基づいて、判定及び他のタイプの処理の精度を高める。 Based on the received data, improve the accuracy of decisions and other types of processing.
いくつかの実施態様は、設備の状態を判定し、状態に基づいて少なくとも1つの処置を実行するための構成及び技法を含む。いくつかの例では、計算装置は設備の物理モデルに基づいてシミュレーションされたデータを生成することがある。例えば、シミュレーションされたデータは、設備の少なくとも1つの故障モードについて、それぞれ複数の故障の程度の複数の確率分散を含むことがある。さらに、計算装置は、設備の測定された測定基準を示すセンサデータを受信することがある。計算装置は、設備の故障モード及び故障の程度を判定するために、受信されたセンサデータをシミュレーションされたデータと比較することができる。設備の判定された故障モード及び故障の程度に少なくとも部分的に基づいて、計算装置は通知又は制御信号の少なくとも1つを送信することができる。 Some implementations include configurations and techniques for determining equipment status and performing at least one action based on the status. In some examples, the computing device may generate simulated data based on a physical model of the facility. For example, the simulated data may include a plurality of probability variances, each with a degree of failure, for at least one failure mode of the facility. In addition, the computing device may receive sensor data indicating the measured metric of the facility. The computing device can compare the received sensor data with the simulated data to determine the failure mode and degree of failure of the facility. Based at least in part on the determined failure mode and degree of failure of the facility, the computing device can send at least one of a notification or control signal.
いくつかの実施態様では、計算装置は設備の物理モデルを受信することがあり、物理モデルによって生成されるシミュレーションされたデータと設備の履歴データとの差異を決定することがある。さらに、計算装置は、シミュレーションされたデータに基づいて統計モデルを生成してよい。例えば、統計モデルは、設備の少なくとも1つの故障モードについてそれぞれ複数の故障の程度の複数の確率分布を含んでよい。さらに、計算装置は設備の測定された測定基準を示すセンサデータを受信してよく、差異に基づいて受信されたセンサデータを正規化してよい。さらに、統計モデルに基づいて、計算装置は、設備の故障の程度を判定定するために、受信されたセンサデータをシミュレーションされたデータと比較してよく、判定された故障の程度に基づいて少なくとも1つの処置を実行してよい。 In some implementations, the computing device may receive a physical model of the facility and may determine the difference between the simulated data generated by the physical model and the historical data of the facility. Further, the computing device may generate a statistical model based on the simulated data. For example, the statistical model may include a plurality of probability distributions each of a plurality of failure degrees for at least one failure mode of the facility. Further, the computing device may receive sensor data indicating the measured metric of the facility and may normalize the received sensor data based on the difference. Further, based on the statistical model, the computing device may compare the received sensor data with the simulated data to determine the degree of equipment failure, and at least based on the determined degree of failure. One procedure may be performed.
発明を実施するための形態は、添付の図を参照して説明される。図中、参照番号の最も左側の数字は、参照番号が最初に表示される図を特定する。異なる図での同じ参照番号の使用は、類似する又は同一の項目又は特徴を示す。 The detailed description is described with reference to the accompanying figures. In the figure, the leftmost digit of the reference number identifies the figure in which the reference number is displayed first. The use of the same reference numbers in different figures indicates similar or identical items or features.
受信されたデータに基づいて、判定及び他のタイプの処理の精度を高めることができる。 Based on the received data, the accuracy of the determination and other types of processing can be increased.
本明細書のいくつかの実施態様は、設備の、条件に基づいた監視、保守、及び/又は制御のための技法及び構成を対象としている。開示されているシステムは、物理モデル及びシミュレータを利用して、実際の改良データが十分にない場合に統計モデルジェネレータによって改良データとして使用できるシミュレーションされたデータを生成してよい。従って、統計モデルジェネレータは、オペレータによって使用できる分析結果を生成するためのリアルタイム現場データを分析するために使用可能な統計モデルを提供してよい。例えば、オペレータは、設備を制御するための制御信号を送信してよい、及び/又は例えば設備の保守が推奨されることをユーザに知らせるためにユーザ計算装置に通知を送信してよい。結果的に、本明細書のいくつかの例は、計算装置が、保守が設備に対して実行されるべきかどうか、設備が停止される、それともそれ以外の場合制御されるべきかどうか、アラートその他の通知が送信されるべきかどうか等を判定するために設備の状態を監視する条件に基づいた保守及び/または制御を可能にする。いくつかの例は、受信されたセンサデータから設備の故障モード及び故障の程度を予測することに少なくとも部分的に基づいて条件に基づいた保守及び予測保守を可能にする。 Some embodiments herein are directed to techniques and configurations for condition-based monitoring, maintenance, and / or control of equipment. The disclosed system may utilize a physical model and a simulator to generate simulated data that can be used as improved data by a statistical model generator when there is not enough actual improved data. Thus, the statistical model generator may provide a statistical model that can be used to analyze real-time field data to generate analysis results that can be used by an operator. For example, the operator may send a control signal to control the equipment and / or send a notification to the user computing device to inform the user that maintenance of the equipment is recommended, for example. As a result, some examples herein show that the computing device is alerting whether maintenance should be performed on the facility, whether the facility should be shut down, or otherwise controlled. Allows maintenance and / or control based on conditions that monitor equipment status to determine whether other notifications should be sent, etc. Some examples allow condition-based maintenance and predictive maintenance based at least in part on predicting equipment failure modes and extents of failure from received sensor data.
いくつかの例では、計算装置は、例えばネットワーク接続又は直接的な接続を通して現場の設備からデータを受信することにより、条件に基づいた制御及び又は保守を可能にすることがある。計算装置は統計モデルを使用し、受信された現場データを記憶し、分析してよい。分析結果が、故障の程度とともに設備の特定の故障モードの発生等の、設備の閾値条件を示したら、計算装置は、示された条件に基づいて少なくとも1つの処置を実行してよい。システムは、受信されたセンサデータとシミュレーションされたデータとの比較によって故障モード及び故障の程度を予測できる。システムは、センサモードを受信する前に、シミュレーションされたデータを作成してよい。従って、システムは、限られたセンサを有する及び/又はサンプリングレートが低い設備の故障モード及び故障の程度を予測できる。 In some examples, the computing device may allow condition-based control and / or maintenance, for example, by receiving data from field equipment through a network connection or direct connection. The computing device may use a statistical model to store and analyze the received field data. If the analysis result indicates a threshold condition of the facility, such as the occurrence of a specific failure mode of the facility along with the degree of failure, the computing device may perform at least one action based on the indicated condition. The system can predict the failure mode and the degree of failure by comparing the received sensor data with the simulated data. The system may create simulated data before receiving the sensor mode. Thus, the system can predict the failure mode and degree of failure of equipment with limited sensors and / or low sampling rate.
条件に基づいた制御及び保守監視を実行するために、計算装置は統計モデルを作成してよいが、設備の様々な異なるタイプの故障の十分な履歴データを有していないことがある。例えば、典型的な統計プロセスでは、統計モデルは、ターゲット設備の故障に関して正確に予測できるようにターゲット設備に関する多量の故障データを活用してよい。ただし、疎データ、低サンプリングレートの場合等の多くのタイプの設備の場合、統計モデルを改良する上ではた量の故障データしか利用できないことがある。従って、この問題に対処するために、本明細書のいくつかの例は、メイン知識及び実験データを活用して、統計モデルとともに物理モデルを生成することがある。物理モデルは、設備の物理特性を記述する1つ又は複数の方程式を含んでよい。従って、物理モデルは多種様々の故障モード及び故障の程度をシミュレーションできることがある。例えば、物理モデルはシミュレーションされた故障データを生成するために使用されてよく、シミュレーションされた故障データは統計モデルを改良するために使用されてよい。統計モデルが改良された後、計算装置は統計モデルを使用して、ターゲット設備について受信されたセンサデータに基づいてターゲットデータの故障モード及び故障の程度を予測してよい。 To perform condition-based control and maintenance monitoring, the computing device may create a statistical model, but may not have sufficient historical data for various different types of equipment failures. For example, in a typical statistical process, the statistical model may take advantage of a large amount of failure data for the target facility so that it can be accurately predicted for failure of the target facility. However, for many types of equipment, such as sparse data and low sampling rates, only a large amount of failure data may be available to improve the statistical model. Thus, to address this problem, some examples herein may utilize the main knowledge and experimental data to generate a physical model along with a statistical model. The physical model may include one or more equations that describe the physical characteristics of the facility. Thus, the physical model may be able to simulate a wide variety of failure modes and failure levels. For example, the physical model may be used to generate simulated fault data, and the simulated fault data may be used to improve the statistical model. After the statistical model is improved, the computing device may use the statistical model to predict the failure mode and extent of failure of the target data based on sensor data received for the target equipment.
物理モデルは、ターゲット設備に関する実験データ及びドメイン知識を使用し、作成されてよい。物理モデルは、正常な動作モード、予想される故障モード、及び予想される故障の程度に関してシミュレーションされたデータを生成するためにシミュレータによって使用されてよい。次に、統計モデルジェネレータは、履歴データとシミュレーションされたデータの両方を使用し、統計モデルを生成してよい。分析を実行するための統計モデルの使用中、統計モデルの使用には、分析中の受信センサデータの正規化プロセス及び予測プロセスを含んでよい。予測器は、受信センサデータに基づいて故障モード及び故障の程度を予測するために統計モデルを使用してよい。いくつかの例では、センサデータは、ターゲット設備と関連付けられた1つ又は複数のセンサから例えば直接的な接続を通して又はネットワーク上で受信され、ほぼリアルタイムで分析されることがある。予測器は、例えばターゲット設備を制御する、及び/又は設備人員に通知を送信する等の、分析結果に基づいた少なくとも1つの動作を実行可能なオペレータに分析結果を提供してよい。 The physical model may be created using experimental data and domain knowledge about the target equipment. The physical model may be used by the simulator to generate simulated data regarding normal operating modes, expected failure modes, and expected failure extents. The statistical model generator may then generate a statistical model using both historical data and simulated data. During use of the statistical model to perform the analysis, use of the statistical model may include a normalization process and a prediction process of the received sensor data being analyzed. The predictor may use a statistical model to predict failure modes and degree of failure based on received sensor data. In some examples, sensor data may be received from one or more sensors associated with the target facility, eg, through a direct connection or over a network, and analyzed in near real time. The predictor may provide the analysis results to an operator capable of performing at least one action based on the analysis results, such as, for example, controlling the target equipment and / or sending a notification to equipment personnel.
本明細書のいくつかの実施態様は、統計モデルに履歴データ及びシミュレーションされたデータを統合することがある。例えば、シミュレータは、予想されるあらゆる故障モード及び予想されるあらゆる故障の程度を含んでよい、正常な動作モード及び異常な動作モードの履歴データに対応するシミュレーションされたデータを生成してよい。さらに、物理モデルから生成されるシミュレーションされたデータは、ターゲット設備と関連付けられたセンサで測定されるセンサデータと同じ量に従って、測定、定量化、及び/又は正規化可能である。 Some implementations herein may integrate historical data and simulated data into a statistical model. For example, the simulator may generate simulated data corresponding to historical data for normal and abnormal operating modes, which may include every expected failure mode and every expected failure degree. Further, the simulated data generated from the physical model can be measured, quantified, and / or normalized according to the same amount of sensor data that is measured with a sensor associated with the target facility.
説明のために、いくつかの実施態様例は、シミュレーションされたデータに基づいて統計モデルを改良し、ターゲット設備からセンサデータを受信し、例えば通知及び/又はブレーキその他の設備を制御するための制御信号を送信するため等、設備の状態を判定するために統計モデルを使用する計算装置の環境で説明される。しかしながら、本明細書の実施態様は提供される特定の例に制限されず、本明細書の開示を鑑みて当業者に明らかになるように、他のタイプの設備、他のタイプの環境、他のシステムアーキテクチャ、他のタイプの計算モデル等に拡張されてよい。 For illustration purposes, some example embodiments improve the statistical model based on simulated data, receive sensor data from the target equipment, and control for controlling notifications and / or brakes and other equipment, for example. It will be described in the context of a computing device that uses a statistical model to determine the state of equipment, such as to transmit signals. However, the embodiments herein are not limited to the specific examples provided, and other types of equipment, other types of environments, others, as will be apparent to those skilled in the art in view of the disclosure herein. System architecture, other types of computational models, etc.
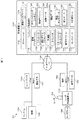
図1は、いくつかの実施態様に従って設備を制御、及び/又は通知を提供することができるシステム100のアーキテクチャ例を示す。システム100は、1つ又は複数のネットワーク106を通して等、1つ又は複数のセンサ104と直接的に又は間接的に通信できる少なくとも1つの計算装置102を含む。例えば、センサ104は、設備108の1つ又は複数の測定基準を測定するために設備108と関連付けられてよい。さらに、計算装置102は、1つ又は複数のネットワーク106を通して1つ又は複数のユーザ計算装置110と通信可能でもよい。
FIG. 1 illustrates an example architecture of a
いくつかの例では、計算装置102は、1つ又は複数のサーバ、パーソナルコンピュータ、組み込みプロセッサ、または任意のいくつかの方法で組み込まれてよい他のタイプの計算装置を含んでよい。例えば、他のコンピュータアーキテクチャが追加的に又は代わりに使用されてよいが、サーバの場合、モジュール、他の機能構成要素、及びデータストレージの少なくとも一部分が、例えばサーバのクラスタ、データセンタのサーバファーム、クラウドでホストされる計算サービス等の中で少なくとも1つのサーバに実装されてよい。代わりに、例えば埋め込みシステム、電子制御装置(ECU)等の場合でのように、計算装置102は1つまたは複数の車両ECU、他のタイプの組み込みプロセッサ、その他のプログラム可能計算装置を含んでよい。
In some examples,
示されている例では、計算装置102は1つ又は複数のプロセッサ112、1つ又は複数の通信インタフェース114、及び1つ又は複数のコンピュータ可読媒体116を含むか、計算装置102と関連付けさせてよい。各プロセッサ112は単一の処理ユニット又はいくつかの処理ユニットであってよく、単一の若しくは複数の計算ユニット又は複数の処理コアを含んでよい。プロセッサ112は、1つ又は複数の中央演算処理装置、マイクロプロセッサ、マイクロコンピュータ、マイクロコントローラ、デジタルシグナルプロセッサ、状態機械、論理回路網、及び/又は操作命令に基づいて信号を操作する任意の装置として実装できる。例えば、プロセッサ112は、本明細書に説明されるアルゴリズム及びプロセスを実行するように特にプログラムされた又は構成された1つ又は複数のハードウェアプロセッサ及び/又は任意の適切なタイプの論理回路であってよい。プロセッサ112は、本明細書に説明される機能を実行するようにプロセッサ112をプログラムできる、コンピュータ可読媒体116に記憶されるコンピュータ可読命令を取り込み、実行するように構成されてよい。
In the illustrated example,
コンピュータ可読媒体116は、コンピュータ可読命令、データ構造、プログラムモジュール、その他のデータ等の情報の記憶のための任意のタイプの技術で実装される揮発性メモリ及び不揮発性メモリ並びに/又は取外し可能媒体及び取外し不能媒体を含んでよい。例えば、コンピュータ可読媒体116は、RAM、ROM、EEPROM、フラッシュメモリ、その他のメモリ技術、光学記憶装置、ソリッドステートストレージ、磁気テープ、磁気ディスクストレージ、RAIDストレージシステム、ストレージアレイ、ネットワーク接続ストレージ、ストレージエリアネットワーク、クラウドストレージ、又は所望の情報を記憶するために使用でき、計算装置によってアクセスできる任意の他の媒体を含んでよいが、これに限定されるものではない。計算装置102の構成に応じて、コンピュータ可読媒体116は、言及される場合には、非一過性のコンピュータ可読媒体が、エネルギー、搬送波信号、電磁波、及び/又は信号自体等の媒体を除外する限り有形の非一過性媒体であってよい。いくつかの場合、コンピュータ可読媒体116は計算装置102と同じ場所にあってもよく、他の例では、コンピュータ可読媒体116は計算装置102から部分的に離れていてもよい。
Computer
コンピュータ可読媒体116は、プロセッサ112によって実行可能である任意の数の機能構成要素を記憶するために使用されてよい。多くの実施態様では、これらの機能構成要素は、プロセッサ112によって実行可能であり、実行時、本明細書では計算装置102に帰する処置を実行するようにプロセッサ112を特にプログラムする命令又はプログラムを含む。コンピュータ可読媒体116に記憶される機能構成要素は、管理アプリケーション118を含んでよい。管理アプリケーション118は、1つ又は複数のコンピュータプログラム、コンピュータ可読命令、実行可能コード、又はプロセッサ112に、ターゲット設備108を監視・制御し、保守人員、設備オペレータ、その他の設備人員に通知を送信する等の様々なタスクを実行させるために実行可能である部分を含んでよい。示されている例では、管理アプリケーション118は、シミュレーションされたデータを生成するためのシミュレータ120、少なくとも部分的にシミュレーションされたデータから統計モデルを生成するための統計モデルジェネレータ122、予測を行うために統計モデルを使用するための予測器124、及び予測に基づいて少なくとも1つの動作を実行するためのオペレータ126を含む。これらの構成要素のそれぞれは管理アプリケーション118の実行可能モジュール、又はその一部分であってよい。又他の例では、これらの構成要素のいくつか又はすべてが、個別に実行可能なコンピュータプログラムであってよい。
The computer
さらに、機能構成要素は、計算装置102の様々な機能を制御・管理可能なオペレーティングシステム128を含んでよい。いくつかの場合、機能構成要素は、コンピュータ可読媒体116のローカルメモリ部分の中にロードされるコンピュータ可読媒体116のストレージ部分に記憶され、1つ又は複数のプロセッサ112によって実行されることがある。他の多くのソフトウェア構成及び/又はハードウェア構成は、本明細書の開示の利点を有する当業者に明らかになるだろう。
Further, the functional components may include an
さらに、コンピュータ可読媒体116は、本明細書に説明される機能及びサービスを実行するために使用されるデータ及びデータ構造を記憶してよい。例えば、コンピュータ可読媒体116は、1つ又は複数の物理モデル130、物理モデル130を決定するために使用可能な実験データ132、履歴センサデータ136及び保守データ138を含むことがある履歴データ134、シミュレータ120によって生成可能なシミュレーションされたデータ140、統計モデルジェネレータ122によって生成可能な統計モデル142、センサ104及び/又は設備108から受信可能なセンサデータ144、並びに統計モデル142及びセンサデータ144に基づいて生成されてよい1つ又は複数の分析結果146を記憶してよい。例えば、管理アプリケーション118は、設備108に関係するセンサデータ144を受信してよく、設備108の現在の状態を示す少なくとも1つの分析結果146を決定するために統計モデル142及びセンサデータ144を使用してよい。
In addition, computer
さらに以下に説明されるように、管理アプリケーション118は、設備108を制御すること、故障がないか設備108を監視すること、ユーザ計算装置110等の設備人員にアラートその他の通知を送信すること等の機能を実行するために統計モデル142から下される判定を使用してよい。また、計算装置102は、プログラム、ドライバ等を含んでよい他の機能構成要素及びデータ、並びに機能構成要素によって使用又は生成される他のデータを含むか維持してよい。さらに、計算装置102は、他の論理構成要素、プログラム可能構成要素、及び物理構成要素を多数含んでよく、その内、上述されたものは、本明細書の説明に関係する例にすぎない。
As will be described further below, the
通信インタフェース114は、例えば1つ又は複数のネットワーク106上で、他の様々な装置との通信を可能にするための1つ又は複数のインタフェース及びハードウェア構成要素を含んでよい。従って、通信インタフェース114は、センサ104、設備108、及び/又はユーザ計算装置110と通信するためにネットワーク106への接続を提供する1つ又は複数のポートを含むか1つ又は複数のポートに結合されてよい。例えば、通信インタフェース114は、以下にさらに列挙されるように、BLUETOOTH(登録商標)等の近距離通信だけではなく、LAN(ローカルエリアネットワーク)、WAN(広域ネットワーク)、インターネット、ケーブルネットワーク、セルラーネットワーク、無線ネットワーク(例えば、Wi−Fi)、及び有線ネットワーク(例えば、光ファイバ、イーサネット(登録商標)、ファイバチャネル)、直接的な接続の内の1つ又は複数も通して通信を可能にしてよい。
The
1つ又は複数のネットワーク106は、イントラネット等のLAN、インターネット等のWAN、セルラーネットワーク等の無線ネットワーク、Wi−Fi等のローカル無線ネットワーク、BLUETOOTH(登録商標)等の短距離無線通信、光ファイバ、イーサネット、ファイバチャネルを含む有線ネットワークを含む任意のタイプのネットワーク、又は任意の他の係るネットワーク、直接有線接続、又はその任意の組合せを含んでよい。従って、1つまたは複数のネットワーク106は、有線通信技術及び/又は無線通信技術の両方を含んでよい。係る通信に使用される構成要素は、ネットワークのタイプ、選択された環境、又はその両方に少なくとも部分的に依存することができる。係るネットワーク上で通信するためのプロトコルは周知であり、本明細書では詳細に説明されない。従って、計算装置102、センサ104、及び/又は設備108、並びにユーザ計算装置110は、有線接続又は無線接続、及びその組合せを使用し、1つ又は複数のネットワーク106上で通信できる。
The one or
いくつかの例では、計算装置102は、設備108の1つ若しくは複数の特徴その他の測定基準を測定するために設備108と関連付けられる1つ又は複数のセンサ104からセンサデータ144を受信してよい。例えば、管理アプリケーション118は、設備108の状態を分析するために設備108についての受信されたセンサデータ144を使用してよい。設備108の判定された状態に基づいて、管理アプリケーション118は、設備108を制御するための制御信号150を送信する、及び/又は設備108の状態に関して、設備人員等のユーザ154に通知するためにユーザ計算装置110に通知152を送信してよい。従って、いくつかの例では、少なくとも1つのユーザ計算装置110は設備108を監視するための監視システム148の一部であってよい。
In some examples, the
センサ104は、単一のターゲット設備108、又は複数の設備108を監視してよい。センサ104は、例えば計算装置102にセンサデータ144を送信するために、計算装置102とネットワーク106上で通信する能力を含んでよい。いくつかの場合、センサ104又はそれと関連付けられた装置は、計算装置102について説明されたハードウェア構成に類似するが、センサ104が本明細書に説明される様々な測定機能及び通信機能を実行できるようにするために異なる機能構成要素及びデータを有するハードウェア構成を含んでよい。
The
他の例では、センサ104は、設備108の中に統合されてよく、設備108は計算装置102と直接的に通信してよく、計算装置102は設備108と直接通信してよい。この場合、管理アプリケーション118は設備108からセンサデータ144を受信してよく、設備108から受信されたセンサデータ144に基づいて制御信号150を使用し、設備108を直接制御してよい。
In other examples, the
ユーザ計算装置110は、デスクトップ、ワークステーション、サーバ、ラップトップ、タブレット計算装置、モバイル機器、スマートフォン、ウェアラブルデバイス等の適切なタイプの計算装置、又はネットワーク上でデータを送受信できる他のタイプの計算装置であってよい。いくつかの場合、ユーザ計算装置110は、計算装置102について説明されたハードウェア構成に類似するが、ユーザ計算装置110が本明細書に説明される様々な機能を実行できるようにするために異なるデータ構成要素及び機能構成要素を有するハードウェア構成を含んでよい。いくつかの例では、ユーザ計算装置110は、例えば管理アプリケーション118から受信される通知152を提示するためのディスプレイ156を含んでよい。例えば、通知152はユーザ154に設備108の状態を示してよい。さらに、ユーザ154が保守作業員その他の設備人員である場合、ユーザ154はユーザ計算装置110を使用して、例えば計算装置102に管理データを送信するために、設備108に関する保守データ138を入力してよい。又他の例では、設備108を計算装置102に保守データ138を送信するために使用することもできる。例えば、保守データ138は保守作業員又は設備人員の身分、設備108の識別子(設備ID)、設備108の保守点検その他の点検が実行された時刻、設備108の状態等の保守の結果、及び設備108になされる任意の保守を含んでよい。
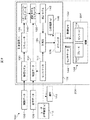
図2は、いくつかの実施態様に係るシステム100の動作の例を示す。この例では、設備108が、機械204の構成要素であるブレーキ202を含むと仮定する。一例として、機械204はエレベータであってよく、エレベータは、例えばエレベータの停止中のエレベータの動きを制御する、乗客の乗降中にエレベータを適所に保持する等のためにブレーキ202を使用する。他の例では、機械204は列車、トラック、バス、自動車、飛行機等の車両であってよく、ブレーキ202は車両を遅くするか停止するために使用されてよい。さらに別の例では、機械204はその動作中にブレーキを使用する任意の他のタイプの機械であってよい。
FIG. 2 illustrates an example of the operation of the
いくつかの場合、破線206で示されるように、計算装置102は機械204の中に少なくとも部分的に含まれてもよい、及び/又は機械204と同一場所に配置されてもよく、他の場合には、計算装置102は、例えば上述された1つ又は複数のネットワーク106上で機械204と通信中等に、機械204から離れて位置してもよい。さらにこの例はブレーキ202を有する設備108の実装を通してシステム100の動作を説明しているが、別の例では、システム100は他のタイプの設備108及び機械204を監視・制御するために使用されてよい。
In some cases, as indicated by dashed
示されている例では、センサ104はセンサ104からセンサデータ144を受信してよく、計算装置102にセンサデータ144を送信してよい。いくつかの例では、センサ104は、例えば一日単位、時間単位等の規則正しい間隔で、又は他の所望の間隔でセンサデータ144を送信してよい。例えば、センサ104は、センサ104から制動回数の測定値を周期的に受信してよく、間隔に亘る平均制動回数を決定してよい。一例として、制動回数は、ブレーキ202自体又は機械204が、ブレーキ202がかけられた後に完全停止するまでにかかる時間の長さであってよい。従って、センサ104は、制動回数を測定するための少なくとも1つのタイマを含んでよい。さらに、センサ104は機械204及び/又はブレーキ202の減速を測定するための加速センサ、ブレーキによってかけられる制動力を測定するための力センサ、ブレーキをかけるためのモータによって使用される電流の量を測定するための電流センサ、ブレーキをかけるために使用される流体圧力の量を測定するための油圧センサ等の設備108の他の測定基準を測定するための他の様々なタイプのセンサを含んでよい。
In the example shown,
計算装置102は、リアルタイム現場データとしてセンサデータ144を受信すると、例えば設備108の状態のほぼリアルタイムの判定を可能にするために、予測器124にセンサデータ144を提供してよい。例えば、ほぼリアルタイムの判定は、センサデータ144がセンサ104から受信される時間間隔に少なくとも部分的に基づいて「ほぼリアルタイム」であってよい。
When computing
さらに、計算装置102は履歴データ134とともにセンサデータ144を記憶してよい。例えば、計算装置102は、履歴データ134を記憶する記憶装置その他のコンピュータ可読媒体にリアルタイムセンサデータ144を蓄積してよい。また、履歴データ134は、例えば保守作業員によってアップロードされる保守レポートから抽出可能な、保守作業員その他の設備人員から受信される保守データ138も含んでよい。
Further, the
物理モデル130は、1つ又は複数の方程式として物理現象を説明する。この例では、物理モデル130は、ブレーキ202の静的表現及び/又は動的表現、並びに機械204のドメイン等の例えばニュートン物理学の観点から、ブレーキ202の動作及び特性を説明する1つ又は複数の公式を含んでよい。従って、物理モデル130は、ブレーキ202及び機械204の実際の物理的な構成に応じて、機械質量、ブレーキ摩擦係数、印加される制動力、並びにブレーキ202及び機械204の他の様々な物理特性及び特徴の間の相互作用を説明する公式を含んでよい。物理モデルの生成は、多数の物理学及び工学の教科書の主題であり、従って物理モデル130の初期の生成の追加の説明は本明細書には示されない。
The
さらに、物理モデル130は、予想されるあらゆる故障モード及び故障の程度を含む、設備108の正常モード及び異常モードを説明する能力を含んでよい。ブレーキ故障モードの例には、ブレーキ摩耗、ブレーキ粘着、ブレーキ障害、及び/又はブレーキをかけるために使用される電気モータ若しくは油圧システムの故障等の制動原動力の故障を含んでよい。さらに、他の例で0%〜100%等の他の範囲が使用されることもあるが、本明細書のいくつかの例に従って、故障の程度は0から1の範囲としてもよい。故障の程度が0であるとき、ブレーキ構成要素は通常の状態にあると分類されてよい。ブレーキ202が摩耗するにつれ、又はブレーキ202の動作がそれ以外の場合悪化するにつれ、故障の程度は1に近づき、ブレーキは故障モードにあると分類されてよい。
Further, the
物理モデル130は、例えばユーザ計算装置110の1つから計算装置102によって受信可能な実験データ132に少なくとも部分的に基づいて生成・検証されてよい。例えば、設備人員その他のユーザは、設備108の様々な故障モード及び故障の程度を判定するために設備108を用いて1つ又は複数の実験を実行してよい。従って、実験データ132は設備108に関するドメイン知識を提供してよい。さらに以下に説明されるように、物理モデル130はシミュレーションされたデータ140を生じさせるためにシミュレータ120によって使用されてよい。シミュレーションされたデータ140は、実験データ132に基づいて評価されてよい。いくつかの例では、物理モデル130は、評価結果に基づいて調整その他変更されることがある。(例えば実験データ132の閾値偏差の中で)十分正確なシミュレーションされたデータ140を生じさせるために物理モデルが示されると、シミュレーションされたデータ140は、履歴データ134とともに、統計モデルジェネレータ122に提供されてよい。統計モデルジェネレータ122は、シミュレーションされたデータ140を使用し、統計モデル142を改良するように構成されてよい。いくつかの例では、予測器124に提供される前に、改良された統計モデル142が正確さに関して評価されてよい。さらに、統計モデルジェネレータ122は、統計モデルの使用中にセンサデータ144を正規化するために使用されてよいシミュレーションされたデータと履歴データ134との差異「△」を決定してよい。
The
統計モデル142の生成が完了すると、統計モデル142が予測器124に提供される。予測器124は、ブレーキ202の電流状態を示す分析結果146を決定するために統計モデル142及び受信されたセンサデータ144を使用してよい。オペレータ126は、予測器124によって決定された分析結果146を受信してよく、分析結果146に基づいて少なくとも1つの動作を実行してよい。分析結果146は、例えばデータベースその他の記憶アーキテクチャ等の、コンピュータ可読媒体116に、予測器124によってさらに記憶されてよい。
When the generation of the
オペレータ126が分析結果146に基づいて実行してよい動作の例は、ユーザ計算装置110にアラートその他の通知152を送信することを含んでよい。さらに又は代わりに、管理アプリケーション118のオペレータ126は設定値を自動的に調整するか、その他設備108を制御してよい。このようにして、分析結果146は、設備108を制御するためのフィードバックとして使用されてよく、それによって設備108の動作を改善する。例えば、機械204がエレベータであり、分析結果が、ブレーキ202が故障した又は故障に近い(例えば、故障の程度は指定閾値を超える)ことを示すと仮定する。オペレータ126は、ブレーキ202が修理できるまでエレベータの使用を防ぐために、例えばエレベータを停止するための制御信号150をエレベータに送信してよい。別の例として、分析結果146が、不十分な制動力がかけられていることを示す場合、オペレータ126はブレーキ202にかかる原動力を増加させるための制御信号150を機械204に送信してよい。機械が例えば列車、トラック、バス、自動車、飛行機等の車両である場合等の別の例として、オペレータ126は、ブレーキ202の磨耗が故障の閾値程度を超えると判定することに応えて制動力を増加させてよい、及び/又は検出されたブレーキ状態を車両のオペレータに警告するために、車両のオペレータに示されるアラートその他の通知を送信してよい。他の多くの変形形態は、機械204及び設備108の性質に少なくとも部分的に応じて当業者に明らかとなる。
Examples of operations that the
本明細書でいくつかの実施態様で使用可能な適切な統計モデル142の例は、予測モデル、決定木、分類子、線形回帰モデル等の回帰モデル、サポートベクトルマシン、及びマルコフモデル及び隠れマルコフモデル等の確率論的モデル、再帰型ニューラルネット等の人工神経ネットワークを含んでよい。従って、本明細書の実施態様は受信されたセンサデータ144に従って予測を提供できる。分析結果146は設備108の状態を表示してよく、設備108のより正確な制御、設備の緊急停止等を可能にすることによって設備108の動作を改善してよい。
Examples of suitable
さらに、いくつかの例では、本明細書に説明される動作の一部分は、機械204から遠隔である計算装置102の第1の計算装置によって実行され、動作の別の部分は、機械204と同一場所に配置される又は機械204に含まれる計算装置102の第2の計算装置によって実行されることがある。一例として、第1の計算装置102は、物理モデル130、シミュレータ120、及びシミュレーションされたデータ140及び統計モデル142を生成するため等の動作を実行するための統計モデルジェネレータ122を含んでよい。以後、統計モデル142は、予測器124及びオペレータ126を含む第2の計算装置102に提供されてよい。従って、第2の計算装置102では、予測器124はセンサデータ144を受信し、オペレータ126に分析結果146を提供してよい。オペレータ126は、分析結果146に基づいて制御信号150又は通知152の1つ又は複数を送信してよい。一例として、第1の計算装置102はサーバ、パーソナルコンピュータ等であってよく、第2の計算装置102はECU等の埋め込み計算装置であってよい。他の多くの変形態様は、本明細書の開示の利点を有する当業者に明らかになる。
Further, in some examples, some of the operations described herein are performed by a first computing device of
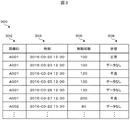
図3は、いくつかの実施態様に係る履歴データを表すデータ構造例300を示す。この例では、データ構造300は、監視される設備の識別子等の設備ID302、時刻304、制動回数306、及び状態308を含む表である。各行は、異なるセンサ報告間隔のための測定された制動回数306に対応する。例えば、センサが日々、計算装置102にターゲット設備の感知された制動回数を送信すると仮定する。いくつかの場合、感知された制動回数306は、時間間隔に亘って測定される複数の測定された制動回数の平均であることがある。代わりに、制動回数306は間隔の間に採取される単一の制動回数測定値であってよいが、これは精度の落ちる測定値を生じさせることがある。他の例では、履歴データは、制動力、ブレーキをかけるために消費されるエネルギー等の、センサによって測定される他のパラメータ又は追加パラメータを含んでよい。
FIG. 3 illustrates an
時刻304は、センサデータが計算装置102によって受信された(又はセンサ104によって記録若しくは送信された)日付及び時刻を示してよい。さらに、状態308は、保守作業員その他の設備人員によって示される設備の状態308を示してよい。例えば、保守作業員は設備の状態を周期的にチェックしてよく、判定された状態に基づいて保守レポートを提出してよい。保守レポートには、保守作業員によって観察される設備の状態を含んでよい。報告された状態は、保守データとともに含まれる日付に基づいた特定の日付及び時刻に相互に関連付けられてよい。
多くのタイプの設備にとって、保守点検は通常、1カ月に1度、2週間に1度等、たまにしか実行されないことがある。保守レポートが特定の間隔受信されなかった、又は保守レポートが設備の報告される状態を含まなかった場合、状態は「データなし」を示してよい。統計モデルジェネレータは、さらに以下に説明されるように、正規化プロセスを実行するための状態情報を使用してよい。このプロセスで、統計モデルジェネレータは通常状態に関する履歴データを利用してよい。図3の例で示されるように、設備108の様々な故障モードに関する非常に疎のデータがあってよい。従って、履歴データ単独では正確な統計モデルを改良するには不十分であることがある。
For many types of equipment, maintenance inspections are usually performed only occasionally, such as once a month or once every two weeks. If a maintenance report has not been received for a particular interval, or if the maintenance report did not include the reported status of the equipment, the status may indicate “no data”. The statistical model generator may use state information to perform a normalization process, as further described below. In this process, the statistical model generator may utilize historical data regarding normal conditions. As shown in the example of FIG. 3, there may be very sparse data regarding various failure modes of the
図4、図5、図6、図8、及び図12は、いくつかの実施態様に係るプロセス例を示す流れ図である。プロセスは、いくつか又はすべてがハードウェア、ソフトウェア、またはその組合せで実装されてよい一連の動作を表す論理流れ図のブロックの集合として示される。ソフトウェアの状況から見ると、ブロックは、1つ又は複数のプロセッサによって実行されるときに、列挙される動作を実行するようにプロセッサをプログラムする1つ又は複数のコンピュータ可読媒体に記憶されるコンピュータ実行可能命令を表してよい。概して、コンピュータ実行可能命令は特定の機能を実行する又は特定のデータ型を実装するルーチン、プログラム、オブジェクト、構成要素、データ構造等を含む。ブロックが説明される順序は、制限として解釈されるべきではない。任意の数の説明されるブロックは、プロセス又は代替プロセスを実装するために任意の順序で及び/又は並行して結合でき、ブロックのすべてが実行される必要はない。プロセスは多種様々の他の環境、フレームワーク、及びシステムで実装されてよいが、説明のために、プロセスは、本明細書の例に説明される環境、フレームワーク、及びシステムを参照して説明される。 4, 5, 6, 8, and 12 are flow diagrams illustrating example processes according to some implementations. A process is shown as a collection of blocks in a logical flow diagram that represents a series of operations, some or all of which may be implemented in hardware, software, or a combination thereof. In the context of software, a computer execution stored on one or more computer readable media that programs a processor to perform the listed operations when executed by one or more processors. Possible instructions may be represented. Generally, computer-executable instructions include routines, programs, objects, components, data structures, etc. that perform particular functions or implement particular data types. The order in which the blocks are described should not be construed as a limitation. Any number of the described blocks can be combined in any order and / or in parallel to implement a process or alternative process, and not all of the blocks need to be executed. Although the process may be implemented in a wide variety of other environments, frameworks, and systems, for purposes of explanation, the process is described with reference to the environments, frameworks, and systems described in the examples herein. Is done.
図4は、いくつかの実装に係る物理モデルを生成するためのプロセス例400を示す流れ図である。いくつかの例では、プロセス400は計算装置102その他の適切な計算装置によって少なくとも部分的に実行されてよい。
FIG. 4 is a flow diagram illustrating an
402で、計算装置は実験データを受信してよい。例えば、設備108の知識を有する人等のユーザは設備108を試験することによって実験データを収集してよい。一例として、実験データは、設備の様々な異なる故障モードのために及び故障の様々な程度のために相対的に高いサンプリングレートで収集されてよい。例えば、設備がブレーキである場合、実験は、様々な異なる負荷下で等、様々な異なるレベルの磨耗でのブレーキの停止時間を決定することを含んでよい。いくつかの場合、追加のセンサは、例えば減速情報、負荷情報、制動力、及び他の測定基準を決定するために使用されることがある。
At 402, the computing device may receive experimental data. For example, a user, such as a person with knowledge of the
404で、計算装置は、ドメイン知識及び実験データに基づいて作成される候補物理モデルを受信してよい。例えば、ユーザは設備構成及び使用目的の知識(つまりドメイン知識)に基づいて、及びさらに実験データに基づいて候補物理モデルを決定してよい。 At 404, the computing device may receive a candidate physical model created based on domain knowledge and experimental data. For example, the user may determine a candidate physical model based on equipment configuration and knowledge of purpose of use (ie, domain knowledge), and further based on experimental data.
406で、計算装置は試験シミュレーションデータを生成するために候補物理モデル及びシミュレータを使用し、シミュレーションを実行してよい。さらに以下に説明されるように、シミュレータは、様々な異なる故障モード及び様々な故障モードの様々な故障の程度の結果を判定するための物理モデルに複数の異なるパラメータを提供するように構成されるアルゴリズム、コンピュータプログラム等であってよい。いくつかの場合、シミュレータの出力は、さらに以下に説明されるように、複数の確率分布の形をとるシミュレーションされたデータであることがある。シミュレーションを実行する一例は、図5に関して以下に説明される。 At 406, the computing device may use the candidate physical model and the simulator to generate test simulation data and perform a simulation. As further described below, the simulator is configured to provide a plurality of different parameters to the physical model for determining the results of various different failure modes and various failure degrees of various failure modes. It may be an algorithm, a computer program, or the like. In some cases, the output of the simulator may be simulated data that takes the form of multiple probability distributions, as further described below. An example of performing a simulation is described below with respect to FIG.
408で、計算装置は、試験シミュレーションされたデータと実験データとの差異Dを決定することでシミュレーションの結果を評価してよい。例えば、試験シミュレーションされたデータは、シミュレーションされたデータと実験データとの差異Dを決定するために実験データと比較されてよい。 At 408, the computing device may evaluate the simulation results by determining a difference D between the test simulated data and the experimental data. For example, test simulated data may be compared with experimental data to determine a difference D between the simulated data and experimental data.
410で、シミュレーションされたデータと実験データとの差異Dが閾値偏差を超える場合、プロセスは412に移動する。他方、シミュレーションされたデータと実験データとの差異Dが閾値偏差未満である場合、プロセスは414に移動する。いくつかの例では、閾値偏差は統計モデルでの誤差の許容レベルに基づいて決定されることがある。 If the difference D between the simulated data and the experimental data exceeds the threshold deviation at 410, the process moves to 412. On the other hand, if the difference D between the simulated data and the experimental data is less than the threshold deviation, the process moves to 414. In some examples, the threshold deviation may be determined based on an acceptable level of error in the statistical model.
412で、シミュレーションされたデータと実験データとの差異Dが閾値偏差を超える場合、計算装置は候補物理モデルの1つ又は複数のパラメータを更新その他変更してよく、プロセスは変更されたパラメータを使って再びシミュレーションを実行するために406に戻ってよい。406〜410のプロセスは、差異Dが閾値偏差よりも小さくなるまで繰り返されてよい。 At 412, if the difference D between the simulated data and the experimental data exceeds a threshold deviation, the computing device may update or change one or more parameters of the candidate physical model, and the process uses the changed parameters. You may return to 406 to run the simulation again. The process from 406 to 410 may be repeated until the difference D is less than the threshold deviation.
414で、シミュレーションされたデータと実験データとの差異Dが閾値偏差未満である場合、物理モデルは十分に正確であると見なされてよく、計算装置は、図5に関して以下に説明されるように、統計モデルを生成する上で使用するためのシミュレーションされたデータを生成するために物理モデル及びシミュレータを使用してよい。 At 414, if the difference D between the simulated data and the experimental data is less than the threshold deviation, the physical model may be considered sufficiently accurate and the computing device may be as described below with respect to FIG. Physical models and simulators may be used to generate simulated data for use in generating statistical models.
図5は、いくつかの実施態様に従ってシミュレーションデータを生成するためのプロセス例500を示す流れ図である。いくつかの例では、プロセス500は、計算装置102その他の適切な計算装置によって実行されることがある。物理モデルが作成された後、シミュレータは、正常モードや、あらゆる故障モードや、あらゆる故障モードの故障のあらゆる程度に備えてシミュレーションされたデータを生成してよい。いくつかの例では、シミュレーションされたデータは確率分布の形をとることがある。あらゆる故障モード及び故障の程度の分布を生成するために、システムに対する負荷はポワソン分布又はガウス分布等の分布としてモデル化されてよい。例えば、エレベータの場合、荷重はエレベータの乗客の体重及びエレベータ自体の重量に少なくとも部分的に基づいてモデル化されてよい。車両の場合、荷重は、乗員、燃料、車両重量等に基づいてモデル化されてよい。シミュレータは確率分布に基づいて無作為にデータをサンプリングしてよく、所与の故障モード及び所与の故障の程度の制動回数の分布を作成してよい。図5は、複数の故障モード及び故障モードあたりの複数の故障の程度の分布を作成するためのプロセス例を含む。
FIG. 5 is a flow diagram illustrating an
502で、計算装置は処理のためのモードFMi(例えば、正常、摩耗、粘着、障害、運動の故障)を選択してよい。例えば、プロセスはそれぞれの選択されたモードの故障の程度ごとに確率分布を決定してよい。 At 502, the computing device may select a mode FM i for processing (eg, normal, wear, adhesion, failure, movement failure). For example, the process may determine a probability distribution for each degree of failure in each selected mode.
504で、計算装置は選択されたモードの第1の故障の程度、例えばDoFj=0.0で起動してよい。本明細書の例では、0.0は故障なしを表し、1.0は完全な故障を表してよいが、他の例では他の範囲が使用されてよい。 At 504, the computing device may be activated with a first failure degree of the selected mode, eg, DoF j = 0.0. In the examples herein, 0.0 may represent no failure and 1.0 may represent a complete failure, although other ranges may be used in other examples.
506で、計算装置はランダム負荷Nkを選択してよい。例えば、上述されたようにシステムに対する負荷は、ポワソン分布又はガウス分布等の分布としてモデル化されてよい。 At 506, the computing device may select a random load Nk . For example, as described above, the load on the system may be modeled as a distribution such as a Poisson distribution or a Gaussian distribution.
508で、計算装置は、xijk=(FMi、DoFj、Nk)のシミュレートに基づくなどして確率分布を決定してよい。FMiはi番目の故障モードであり、DoFjはj番目の故障の程度であり、Nkは、例えば負荷力のポワソン分布から無作為に選択される、k番目の無作為にサンプリングされた負荷力であり、Tは、例えばk=1からk=Tまでシミュレーションされるサンプルの数であり、xijkはFMi、DoFj、及びNkでシミュレーションされる制動回数である。シミュレーションされたデータは、さらに以下に説明されるように、あらゆる故障モードのあらゆる故障の程度の制動回数のヒストグラムとして表されてよい。さらに、他の例では、xijkは制動力等の他のパラメータであってよい。さらに別の例として、xijkは1つの変数ではなく、複数の変数であってよい。例えば、xijkは制動回数及び制動力、その他のシミュレーションされたパラメータを含むベクトルであってよい。 At 508, the computing device may determine a probability distribution, such as based on a simulation of x ijk = (FM i , DoF j , N k ). FM i is the i-th failure mode, DoF j is the degree of the j-th failure, and N k is randomly sampled, for example, randomly from the Poisson distribution of load force. For example, T is the number of samples simulated from k = 1 to k = T, and x ijk is the number of brakings simulated with FM i , DoF j , and N k . The simulated data may be represented as a histogram of the number of brakings for any failure degree in any failure mode, as further described below. Furthermore, in other examples, x ijk may be other parameters such as braking force. As yet another example, x ijk may be a plurality of variables instead of a single variable. For example, x ijk may be a vector containing the number of brakings and braking forces, and other simulated parameters.
510で、計算装置は無作為サンプリングされた負荷力Nkのkが所定の数T未満であるかどうかを判定してよい。例えば、1つの負荷力Nk、つまりk番目の無作為にサンプリングされた負荷力が入力されるとき、シミュレータは1つの制動回数を計算する。結果的に、制動回数の(例えば、ヒストグラムとしての)確率分布を得るために、シミュレータは1000回等の制動回数を計算することがある。数Tは、適切な数のサンプルが各故障モードで故障の程度ごとに十分な分布を得るために決定されることが確実になるように事前に定義されてよい。従って、サンプリングの数kがTに達すると、DoFjが更新されるように、プロセスは512に進む。Nkの場合、kがT未満であると、プロセスは506に戻って別のランダム負荷力Nkを選択し、電流確率分布のために別の制動回数を計算する。 At 510, the computing device may determine whether k of the randomly sampled load force N k is less than a predetermined number T. For example, when one load force N k , that is, the kth randomly sampled load force is input, the simulator calculates one braking number. Consequently, to obtain a probability distribution of the number of brakings (eg, as a histogram), the simulator may calculate the number of brakings, such as 1000 times. The number T may be predefined to ensure that an appropriate number of samples is determined to obtain a sufficient distribution for each degree of failure in each failure mode. Thus, when the number of samples k reaches T, the process proceeds to 512 so that DoF j is updated. For N k , if k is less than T, the process returns to 506 to select another random load force N k and calculate another number of brakings for the current probability distribution.
512で、計算装置は、故障の程度DoFjが1.0に達したかどうかを判定してよい。達していない場合、プロセスは514に移動し、これによりDoFjは増分され、プロセスは次の故障の程度について繰り返される。 At 512, the computing device may determine whether the degree of failure DoF j has reached 1.0. If not, the process moves to 514, which causes DoF j to be incremented and the process repeated for the next degree of failure.
514で、故障の程度(DoFj)が1.0未満である場合、計算装置は、例えばj=j+0.1等、DoFjを増分してよく、プロセスは次の故障の程度のために繰り返される。本明細書の例では、故障の程度は0.0から1.0に10分の1の単位で増分されてよいが、他の例では他の範囲及び/又は増分が使用されてよい。 At 514, if the degree of failure (DoF j ) is less than 1.0, the computing device may increment DoF j , eg, j = j + 0.1, and the process is repeated for the next degree of failure. It is. In the examples herein, the degree of failure may be incremented in units of tenths from 0.0 to 1.0, but other ranges and / or increments may be used in other examples.
516で、故障の程度DoFjが1.0に達すると、計算装置は、まだ処理されていない任意の他の故障モードFMiがあるかどうかを判定してよい。ある場合、プロセスは、次の故障モードFMiのシミュレーションされたデータを生じさせる次の故障モードを選択するためにブロック502に戻ってよい。 At 516, when the failure degree DoF j reaches 1.0, the computing device may determine if there are any other failure modes FM i that have not yet been processed. If so, the process may return to block 502 to select the next failure mode that yields simulated data for the next failure mode FM i .
518では、他方、シミュレーションデータがモードFMのすべてについて生成された場合、計算装置はシミュレーションされたデータを統計モデルジェネレータに提供してよい。 At 518, on the other hand, if simulation data is generated for all of the modes FM, the computing device may provide the simulated data to the statistical model generator.
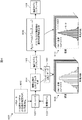
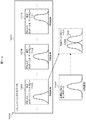
図6は、いくつかの実施態様に係る確率密度関数を決定するプロセス例600を示す。シミュレーションされたデータ140は、あらゆる故障モードのあらゆる故障の程度に関する制動回数の複数のヒストグラムとして表されてよい。図5に関して上述されたように、シミュレータ120に提供されるパラメータ602は、故障モードFMi、故障の程度DoFj、及び負荷力Nkを含む。図5に関して上述されたように、及び604で示されるように、シミュレータ120は、制動回数の複数のヒストグラム606を含んでよいシミュレーションされたデータ140を生成するために物理モデル130及びパラメータ602を使用する。各ヒストグラム606は、各故障モードFMi及び故障の程度DoFjについて制動回数対その制動回数のサンプルの数(頻度)を表してよい。
FIG. 6 illustrates an
シミュレーションされたデータ140は、統計モデルジェネレータ122に提供されてよい。統計モデルを生成するためにシミュレーションされたデータ140を使用する前に、統計モデルジェネレータ122はシミュレーションされたデータに対してデータ平滑化を実行してよい。示されている例では、データ平滑化のために、統計モデルジェネレータ122は制動回数の各ヒストグラム606にカーネル密度推定(KDE)を適用してよい。KDEはランダム変数の確率密度関数を推定するためのノンパラメトリック手法である。KDEは、母集団についての推論が有限データサンプルに基づいて行われる根本的なデータ平滑化問題である。代わりに、他の例では他のデータ平滑化技法が使用されてよい。
608に示されるように、確率密度Pij(x)は、FMi及びDoFjごとに以下の方程式(1)を使用し、計算されてよい。 As shown at 608, the probability density P ij (x) may be calculated using the following equation (1) for each FM i and DoF j .

上式ではxijkは図5で決定されたシミュレーションされた制動回数である。従って、各ヒストグラム606にKDEを適用することによって610に示されるように、統計モデルジェネレータ122は、あらゆる故障モード及びあらゆる故障の程度に対応する制動回数の確率密度612を生成してよい。その結果、統計モデルジェネレータ122はあらゆる故障モード及びあらゆる故障の程度に対応する制動回数の確率密度を有する。統計モデルジェネレータ122は、シミュレーションされたデータの確率密度を有する統計モデル142を作成してよい。
In the above equation, x ijk is the simulated number of braking times determined in FIG. Accordingly, as indicated at 610 by applying KDE to each
図7は、いくつかの実施態様に係る統計モデル142に含まれることのある情報の例を示す。例えば、統計モデル142は、故障モード704(例えば、正常、摩耗、粘着等)の表示、故障の程度706、及び関連付けられた確率データセット710のデータID708等を含んでよい、故障モードデータ構造702を含むことができる。確率データセット710は、故障モードデータ構造702の対応する故障モードについて、故障の程度の確率分布を表す制動回数712及び関連付けられた確率714を含んでよい。例えば、各確率データセット710は、特定の故障モードの特定の故障の程度の確率分布716に対応して、異なる制動回数の複数の確率714を含む。さらに、それぞれの故障の程度の確率データセット710は、他の故障の程度及び故障モードの他の確率データセット710に関して正規化されてよい。この例では、確率データは0〜1000の目盛りに正規化されるが、他の例では任意の他の所望される目盛りが使用されることがある。
FIG. 7 illustrates an example of information that may be included in the
さらに、統計モデル142と関連付けられた情報は、各設備と関連付けられた△を示すデルタ表720を含んでよい。従って、デルタ表720は、設備を識別する設備ID722、及び設備について決定されてよい差異△724を含んでよい。例えば、シミュレーションされたデータと履歴センサデータとの間に偏差がないように、完全な物理モデルを作成することが可能でない場合がある。従って、物理モデルが図4のプロセスでどのくらいの回数上記で精緻化されるのかに関わりなく、履歴センサデータとシミュレーションされたデータの間には依然としてなんらかの差異△がある場合がある。いくつかの例では、説明されない場合、この△は統計モデルによって作り出されている誤判定又は検出漏れにつながることがある。
Further, the information associated with the
△の影響を削減するために、いくつかの実施態様は、△に基づいて追加の正規化を適用することがある。例えば、統計モデルジェネレータ122は、受信されたセンサデータに統計モデルを適用するために受信されたセンサデータを正規化してよい。例えば、受信されたセンサデータは、正常(故障なし)モードに対応するシミュレーションされたデータと、正常(故障なし)モード、つまり、故障の程度が0.0と見なされるときに正常な動作状態に対応する履歴センサデータとの差異として概算されてよい△に基づいて正規化されてよい。この正規化例は、以下の方程式(2)によって定義されてよい。
In order to reduce the impact of Δ, some implementations may apply additional normalization based on Δ. For example, the
上式では、△=xsensorData_normal ‐ xsimulation_normalであり、xtは時間tでの受信されたセンサデータからの制動回数であり、xt’は時間tでの受信されたセンサデータの正規化された制動回数であり、xsensorData_normalは正常な状態、つまり故障の程度が0.0と見なされるときの、対応する履歴センサデータからの制動回数であり、xsimulation_normalは、故障の程度が0.0と見なされるときに正常な状態に対応するシミュレーションされたデータからの制動回数である。従って、△724は、特定の設備722について、及び対応する統計モデルに使用されるシミュレーションデータについて事前に決定されてよい。xt’の値は、センサデータxtが△の値に基づいて受信された後に決定されてよい。一例として、計算装置は、正常な動作として分類された故障の程度を有するシミュレーションされたデータの第1の確率分布を決定し、正常な動作として分類された状態を有する履歴センサデータの第2の確率分布を決定することによって、及び第1の確率分布と第2の確率分布の間の偏差に基づいて差異△を決定することによって△を決定してよい。代替策として、受信されたセンサデータとシミュレーションされたデータの差異を正規化するための別の技法は、正常な状態に対する差異値の比率等、相対的な特徴を適用することを含んでよい。この例では、制動回数自体等の絶対値は使用されないが、代わりに相対値は以下の方程式(3)によって定められてよい。
Where Δ = x sensorData_normal −x simulation_normal , where x t is the number of brakings from the received sensor data at time t, and x t ′ is the normalized sensor data received at time t X sensorData_normal is the number of times of braking from the corresponding history sensor data in a normal state, that is, when the degree of failure is regarded as 0.0, and x simulation_normal is the degree of failure of 0.0 The number of brakings from the simulated data corresponding to the normal state when considered. Thus,
上式では、xtは時間tでの制動回数であり、x0は正常な状態での制動回数である。方程式(3)は、シミュレーションされたデータと受信されたセンサデータの両方に使用されてよい。例えば、シミュレーションされたデータの正常な状態の制動回数x0は、履歴センサデータの正常な状態の制動回数x0とは異なることがあるので、シミュレーションされたデータのxtの値及びセンサデータのxtの値はこの差異に従って正規化される。さらに、他の例では、xは制動力その他の制動パラメータであってよい。さらに他の例では、xは1つの変数ではなく、複数の変数を含んでよい。例えば、xは制動回数及び制動力を含むベクトルであってよい。 In the above equation, x t is the number of braking at time t, x 0 is the number of braking in a normal state. Equation (3) may be used for both simulated data and received sensor data. For example, the braking count x 0 normal conditions of simulated data, because there are different from the number of braking x 0 normal conditions of historical sensor data, the simulated data x t value and sensor data the value of x t is normalized in accordance with this difference. Further, in other examples, x may be a braking force or other braking parameter. In yet another example, x may include multiple variables rather than a single variable. For example, x may be a vector including the number of times of braking and braking force.
図8は、いくつかの実施態様に従って故障モード及び故障の程度を予測器が予測できるプロセス例800を示す流れ図である。いくつかの例では、プロセス800は、計算装置102その他の適切な計算装置によって実行されることがある。
FIG. 8 is a flow diagram illustrating an
802で、計算装置は分析のためにセンサデータを受信してよい。例えば、センサ又は設備の1つ又は複数は計算装置にセンサデータを送信してよい。センサデータは、本明細書のいくつかの例では制動回数である、設備の少なくとも1つの測定された測定基準を示してよい。ただし他の例では、他の測定基準が使用されてよい。例えば、センサデータは制動力その他の測定されたパラメータを含んでよい。さらにいくつかの場合、制動回数及び制動力の組合せ等の複数のパラメータが、故障モード及び故障の程度を判定するために使用されることがある。 At 802, the computing device may receive sensor data for analysis. For example, one or more of the sensors or equipment may send sensor data to the computing device. The sensor data may indicate at least one measured metric of the facility, which is the number of brakings in some examples herein. However, in other examples, other metrics may be used. For example, the sensor data may include braking force and other measured parameters. Further, in some cases, multiple parameters such as a combination of the number of times of braking and braking force may be used to determine the failure mode and the degree of failure.
804で、計算装置は、上述された方程式(2)又は方程式(3)を使用し、統計モデルによりうまく適合するために受信されたセンサデータを正規化してよい。 At 804, the computing device may normalize the received sensor data to better fit the statistical model using equation (2) or equation (3) described above.
806で、計算装置は、所与の故障モード及び所与の故障の程度について制動回数の確率を決定してよい。例えば、図6及び図7に関して上述されたように、統計モデルジェネレータは統計モデルを提供するためにあらゆる故障モード及びあらゆる故障の程度に対応する確率を計算してよい。 At 806, the computing device may determine the probability of braking times for a given failure mode and a given degree of failure. For example, as described above with respect to FIGS. 6 and 7, the statistical model generator may calculate probabilities corresponding to every failure mode and every degree of failure to provide a statistical model.
808で、計算装置は故障モード及び故障の程度の確率を決定してよい。例えば、予測器はすべての事後確率P(DoF,FM|xt’)を計算してよい。図9は、これらの計算の結果に基づいて決定されてよいデータ構造例を示す。これらの計算は以下の方程式(4)に基づいて実行されてよい。 At 808, the computing device may determine the failure mode and failure probability. For example, the predictor may calculate all posterior probabilities P (DoF, FM | x t ′). FIG. 9 shows an example data structure that may be determined based on the results of these calculations. These calculations may be performed based on equation (4) below.
810で、計算装置は最大の確率を有する故障モード及び故障の程度を選択してよい。例えば、計算装置は、正規化されたセンサデータを808で計算された事後確率と比較してよく、以下の方程式(5)に従って等、最大の事後確率に対応する故障の程度を選択してよい。 At 810, the computing device may select the failure mode and the degree of failure with the greatest probability. For example, the computing device may compare the normalized sensor data with the posterior probability calculated at 808, and may select the degree of failure corresponding to the maximum posterior probability, such as according to equation (5) below. .
方程式5に基づいた最大確率で故障モードFM及び故障の程度DoFを判定する例は、図9に関してさらに以下に説明される。従って、図9のデータ構造における確率に基づいて、xt’が単一の値(例えば制動回数)であるとき、最大確率は、受信されたセンサデータに対応する故障モード及び故障の程度を判定するために図9のデータ構造から決定されてよい。 An example of determining the failure mode FM and failure degree DoF with the maximum probability based on Equation 5 is described further below with respect to FIG. Thus, based on the probability in the data structure of FIG. 9, when x t ′ is a single value (eg, number of brakings), the maximum probability determines the failure mode and degree of failure corresponding to the received sensor data. In order to do so, it may be determined from the data structure of FIG.
代わりに、受信されたセンサデータが測定された測定基準の分布である場合、以下に説明される方程式6及び方程式7が故障モード及び故障の程度を判定するために使用されてよい。例えば、計算装置が制動回数xt’の分布を受信すると、計算装置は、以下の方程式(6)に基づいて、正規化されたセンサデータq(xt’)の分布と、あらゆる故障モード及びあらゆる故障の程度に対応する複数の分布との間の相対的なエントロピーとして距離を計算してよい。
Alternatively, if the received sensor data is a distribution of measured metrics,
次いで計算装置は、以下の方程式(7)に基づいて最小相対エントロピーを有する故障モード及び故障の程度を選択してよい。 The computing device may then select the failure mode and the degree of failure with the least relative entropy based on equation (7) below.
この技法の例は、図10に関して以下にさらに説明される。さらに、いくつかの場合xは、制動力のような異なるパラメータ、又は制動回数及び制動力を結合するベクトル等のパラメータの組合せであることがある。 An example of this technique is described further below with respect to FIG. Furthermore, in some cases x may be a different parameter such as braking force, or a combination of parameters such as a vector that combines the number of times of braking and braking force.
812で、最大確率を有すると判定された故障モード及び故障の程度に少なくとも部分的に基づいて、計算装置はターゲット設備を制御するための信号を送信してよい、及び/又は設備を監視する監視システムと関連付けられたユーザ計算装置等のユーザ計算装置に通知を送信してよい。一例として、計算装置は、設備自体又は設備に関連付けられた機械を制御するため等、設備を制御するために信号を送信してよい。例えば、設備がエレベータ用のブレーキである場合、計算装置は制動力を増加させるため等、ブレーキを制御するための制御信号を送信してよい。計算装置が、ブレーキの状態が劣化し、従ってエレベータの運転がもはや安全ではないと判定する場合等の他の例では、計算装置はブレーキが修理されるまでエレベータの運転を止めるための信号を送信することがある。さらに又は代わりに、別の例として、計算装置は、例えばユーザ計算装置等の監視システムに通知を送信してよい。さらに、いくつかの例では、制御信号は特定の状況でターゲット設備に送信されるに過ぎないことがある。例えば、緊急性の閾値レベルが判定される場合、計算装置は設備を停止するための制御信号を送信してよく、ユーザ計算装置に通知を送信してもよい。例えば計算装置は、設備人員に補正処置を講じるように警告するためにユーザ計算装置110のディスプレイ156にアラートを提示させる通知を送信してよい。
At 812, the computing device may send a signal to control the target equipment and / or monitor to monitor the equipment based at least in part on the failure mode and degree of failure determined to have the maximum probability. The notification may be sent to a user computing device such as a user computing device associated with the system. As an example, the computing device may send a signal to control the facility, such as to control the facility itself or a machine associated with the facility. For example, if the facility is an elevator brake, the computing device may send a control signal to control the brake, such as to increase the braking force. In other examples, such as when the computing device determines that the condition of the brake has deteriorated and therefore the elevator is no longer safe, the computing device sends a signal to stop the elevator until the brake is repaired. There are things to do. Additionally or alternatively, as another example, the computing device may send a notification to a monitoring system, such as a user computing device. Further, in some examples, the control signal may only be sent to the target equipment in certain situations. For example, if the threshold level of urgency is determined, the computing device may send a control signal to stop the facility, or send a notification to the user computing device. For example, the computing device may send a notification that causes an alert to be presented on the
別の例として、設備が、列車、トラック、バス、自動車、飛行機等の車両のブレーキであり、ブレーキ202が車両を遅くする又は停止するために使用されてよいと仮定する。計算装置は、例えばブレーキの故障の程度を判定することに基づいてブレーキがかけられるときに制動力を増加させるため等、ブレーキを制御するために制御信号を送信してよい。計算装置がブレーキの状態が劣化し、従って車両の運転がもはや安全でないと判定する場合等の他の例では、計算装置は、ブレーキが修理されるまで車両の運転が安全ではない旨の通知を提供するために車両のオペレータに緊急アラートその他の通知を送信してよい。
As another example, suppose the facility is a brake on a vehicle such as a train, truck, bus, car, airplane, etc., and the
図9はいくつかの実施態様に係る事後確率を含むデータ構造例900を示す。この例では、データ構造900は、図7の故障モードデータ構造702に少なくとも部分的に対応し、故障モード704及び故障の程度706を含む。この例では、各故障モード及び各故障の程度の事後確率902は、例えば図8に関して上述された方程式4を使用し、受信されたセンサデータについて決定されている。この例では、データ構造900の情報に基づいて、904に示されるように最大の事後確率902が0.40であると仮定する。従って、904での最大の確率の決定に基づいて、故障モードは、ブレーキが「摩耗している」と判定されることがあり、故障の程度は0.2であると判定される。オペレータは、例えば、図11に関してさらに以下に説明されるように、分析結果としてこの情報を使用してよい。
FIG. 9 illustrates an example data structure 900 that includes posterior probabilities according to some implementations. In this example, data structure 900 corresponds at least in part to failure
図10は、受信されたセンサデータに基づいて、いくつかの実施態様に係る最大確率を有する故障モード及び故障の程度を判定する例1000を示す。例えば、いくつかの場合、計算装置は検出された値の分布としてセンサデータを受信してよく、上述された方程式(2)又は(3)の1つを適用することに基づいて正規化されたセンサデータ1002を生成してよい。図8に関して上述されたように、計算装置が制動回数xt’の分布を受信するとき、計算装置は、正規化されたセンサデータの分布q(xt’)と、上述された方程式6に基づいたあらゆる故障モード及びあらゆる故障の程度に対応するシミュレーションされたデータ1004の複数の分布との間の相対エントロピーとして距離を決定してよい。このようにして、計算装置は、決定されるだろう多くの中からのいくつかの例として1006、1008、及び1010等の複数の相対エントロピーを決定してよい。
FIG. 10 illustrates an example 1000 of determining a failure mode with a maximum probability and a degree of failure based on received sensor data according to some implementations. For example, in some cases, the computing device may receive sensor data as a distribution of detected values, normalized based on applying one of equations (2) or (3) described above.
計算装置は、正規化されたセンサデータ1002に関して最小の相対エントロピーを有する故障モード及び故障の程度を判定するために、上述された方程式7を適用してよい。従って、この例ではシミュレーションされたデータ1006が正規化されたセンサデータ1002に対して5.0の相対エントロピーを有し、シミュレーションされたデータ1008が正規化されたセンサデータ1002に対して1.2の相対エントロピーを有し、シミュレーションされたデータ1010が正規化されたセンサデータ1002に対して3.1の相対エントロピーを有すると仮定する。
The computing device may apply
さらに、計算装置が、シミュレーションされたデータ1008がすべてのシミュレーションされたデータ1004の中から正規化されたセンサデータ1002に対して最小の相対エントロピーを有すると判定すると仮定する。従って、計算装置は、設備の現在の状態が、故障モードx及び故障の程度0.2であってよいシミュレーションされたデータ1008によって指定される状態に最も近いと判定してよい。予測器は、図11に関して以下にさらに説明されるように、示された故障モード及び故障の程度に基づいて設備の状態を判定してよいオペレータにこの情報を提供してよい。
Further assume that the computing device determines that the
図11は、いくつかの実施態様に係る受信されたセンサデータ及び統計モデルからの予測器によって生成される分析結果を含むデータ構造例1100を示す。データ構造1100は、設備ID1102、時間1104、制動回数1106、機械状態1108、故障モード1110、及び故障の程度1112を含む。一例として、図1及び図2に関して上述された管理アプリケーションのオペレータはデータ構造1100を生成してよく、データ構造1100のコンテンツに基づいた追加の動作を実行してよい。例えば、1114に示されるように、故障モードは相応して0.0の故障程度を有し、正常であると判定され、オペレータは機械状態1108を正常であると指定した。係る場合、オペレータは処置を講じないか、代わりに計算装置若しくは他の監視システムに、設備の状態が正常であることを示す通知を送信してよい。
FIG. 11 illustrates an example data structure 1100 that includes received sensor data and analysis results generated by a predictor from a statistical model, according to some implementations. Data structure 1100 includes
別の例として、1116に示されるように、分析結果が、故障モードが、ブレーキが摩耗し、故障の程度が0.5であることを示すと仮定する。この例では、オペレータは、機械状態が「警告」であり、結果としてオペレータはユーザ計算装置110その他の監視システムに、設備が摩耗していること、及び保守が実行されるべきであることを示す通知を送信してよい。
As another example, as shown at 1116, assume that the analysis results indicate that the failure mode indicates that the brake is worn and the degree of failure is 0.5. In this example, the operator indicates that the machine condition is “warning” and as a result, the operator indicates to the
別の例として、1118で示されるように、分析結果が、故障モードが、ブレーキが摩耗し、故障の程度が0.8であることを示すと仮定する。この例では、オペレータは、ユーザ計算装置110その他の監視システムに、設備が摩耗していること、及びアラートが発せられたことを示す通知を送信してよい。さらに、発令中のアラートに基づいて、オペレータは、設備に保守が実行されるまで設備及び/又は設備に関連付けられた機械を安全ではないとして停止してよい。一例として、閾値は、例えば「正常」はDoF<0.4である、「警告」は0.4<DoF<0.7である、及び「アラート」はDoF>0.7である、又は設備人員によって決定されてよい他の適切な閾値等、機械状態1108を判定するために確立されてよい。さらに、本明細書のいくつかの例には、3つを超えるまたは3つ未満の機械状態1108があることがある。
As another example, as shown at 1118, assume that the analysis results indicate that the failure mode indicates that the brake is worn and the degree of failure is 0.8. In this example, the operator may send a notification to the
さらに、1120で、故障モードは、ブレーキが粘着しており、故障の程度が0.3であると仮定する。いくつかの例では、「正常」、「警告」、及び「アラート」の故障の程度の閾値は異なる故障モードで異なっていることがある。一方、他の例では、閾値は同じであってよい。例えば、粘着しているブレーキは、摩耗しているブレーキよりも危険であることがあり、従って警告及び/又はアラートがより低い閾値等で発せられてよいと仮定する。この例では、「警告」は粘着故障モードについて0.3DoF及び摩耗故障モードについて0.4DoFで発生してよいと仮定する。 Further, at 1120, the failure mode assumes that the brake is sticking and the degree of failure is 0.3. In some examples, the “normal”, “warning”, and “alert” failure degree thresholds may be different for different failure modes. On the other hand, in other examples, the threshold may be the same. For example, assume that a sticking brake may be more dangerous than a worn brake, so that warnings and / or alerts may be issued at a lower threshold or the like. In this example, it is assumed that a “warning” may occur at 0.3 DoF for the adhesion failure mode and 0.4 DoF for the wear failure mode.
図12は、いくつかの実施態様に従って設備を制御する及び/又は通知を送信するためのプロセス例1200を示す流れ図である。いくつかの例では、プロセス1200は計算装置102その他の適切な計算装置によって実行されることがある。
FIG. 12 is a flow diagram illustrating an
1202で、計算装置は、設備の複数の故障モードの複数の故障の程度のためにシミュレーションされたデータを生成するために物理モデルを使用してよい。例えば、シミュレーションされたデータは、設備の複数の故障モードについて、それぞれ複数の故障の程度の複数の確率分布を含んでよい。 At 1202, the computing device may use the physical model to generate simulated data for multiple failure degrees for multiple failure modes of the facility. For example, the simulated data may include a plurality of probability distributions, each of a plurality of failure degrees, for a plurality of failure modes of the facility.
1204で、計算装置は、物理モデルを使用し、生成されるシミュレーションされたデータと、設備の履歴センサデータとの差異△を決定してよい。例えば、計算装置は正常モード(故障なしモード)での設備の動作に対応する履歴センサデータを受信してよい。さらに、計算装置は、正常な動作として分類される故障の程度を有するシミュレーションされたデータの確率分布を決定してよく、正常な動作として分類された状態を有する履歴センサデータの第2の確率分布を決定してよい。計算装置は、第1の確率分布と第2の確率分布の間の偏差に基づいて差異△を決定してよい。 At 1204, the computing device may use a physical model to determine a difference Δ between the generated simulated data and the historical sensor data of the facility. For example, the computing device may receive history sensor data corresponding to the operation of the equipment in the normal mode (no failure mode). Further, the computing device may determine a probability distribution of simulated data having a degree of failure classified as normal operation, and a second probability distribution of historical sensor data having a state classified as normal operation. May be determined. The computing device may determine the difference Δ based on the deviation between the first probability distribution and the second probability distribution.
1206で、計算装置はシミュレーションされたデータに基づいて統計モデルを生成してよく、統計モデルは設備の複数の故障モードについて、それぞれ複数の故障の程度の複数の確率分布を含む。例えば、計算装置は、設備の複数の故障モードについて、それぞれ複数の故障の程度の複数の確率分布の確率密度を決定してよい。さらに、計算装置は、複数の故障モードについて、それぞれ複数の故障の程度の複数の確率分布の確率密度の事後確率を決定してよい。 At 1206, the computing device may generate a statistical model based on the simulated data, the statistical model including a plurality of probability distributions, each of a plurality of failure degrees, for a plurality of failure modes of the facility. For example, the computing device may determine the probability density of a plurality of probability distributions each having a degree of a plurality of failures for a plurality of failure modes of the facility. Further, the computing device may determine the posterior probability of the probability density of a plurality of probability distributions each having a degree of a plurality of failures for a plurality of failure modes.
1208で、計算装置は設備の測定された測定基準を示すセンサデータを受信してよい。例えば、計算装置は設備と関連付けられた1つ又は複数のセンサからセンサデータを受信してよい。いくつかの例では、測定された測定基準は、測定された制動回数、制動力、及び/その他のパラメータであってよい。 At 1208, the computing device may receive sensor data indicative of the measured metric of the facility. For example, the computing device may receive sensor data from one or more sensors associated with the facility. In some examples, the measured metrics may be measured braking times, braking forces, and / or other parameters.
1210で、計算装置は差異△に基づいて受信されたセンサデータを正規化してよい。受信されたセンサデータを正規化する例は、方程式(2)及び(3)に関して上述される。 At 1210, the computing device may normalize the received sensor data based on the difference Δ. An example of normalizing received sensor data is described above with respect to equations (2) and (3).
1212で、統計モデルに基づいて、計算装置は、受信されたセンサデータをシミュレーションされたデータと比較して、設備の故障の程度を判定してよい。例えば、受信されたセンサデータが個々の測定である場合、計算装置は方程式4及び方程式5を使用して計算された事後確率に基づく最大確率の決定から設備の故障モード及び故障の程度を判定してよい。代わりに、受信されたセンサデータがセンサ測定値の分布である場合、計算装置は、受信されたセンサデータと、シミュレーションされたデータの複数の分布との間で方程式6及び方程式7を使用し、最小相対エントロピーを決定することによって設備の故障モード及び故障の程度を判定してよい。
At 1212, based on the statistical model, the computing device may compare the received sensor data with the simulated data to determine the extent of equipment failure. For example, if the received sensor data is an individual measurement, the computing device determines the failure mode and degree of failure of the facility from the determination of the maximum probability based on the posterior probability calculated using Equation 4 and Equation 5. It's okay. Alternatively, if the received sensor data is a distribution of sensor measurements, the computing device uses Equation 6 and
1214で、計算装置は、故障の程度及び故障のモードの1つ又は複数の閾値との判定に基づいて、設備の状態を判定してよい。例えば、計算装置は、設備の故障モード及び故障の程度を1つ又は複数の閾値と比較して、設備の状態を判定してよい。一例として、設備がブレーキである場合、計算装置は、ブレーキの故障モード及び故障の程度を1つ又は複数の閾値と比較して、例えばブレーキの磨耗が許容できる摩耗を超えると判定してよい。 At 1214, the computing device may determine the state of the facility based on the determination of the degree of failure and one or more thresholds of the failure mode. For example, the computing device may determine the state of the facility by comparing the failure mode and the degree of failure of the facility with one or more thresholds. As an example, if the facility is a brake, the computing device may compare the brake failure mode and the degree of failure to one or more thresholds and determine, for example, that the brake wear exceeds acceptable wear.
1216で、判定された状態に少なくとも部分的に基づいて、計算装置は、設備を制御するための制御信号又は設備の状態の表示を提供する通知の少なくとも1つを送信してよい。設備がブレーキである上述された場合では、ブレーキの磨耗が許容可能な摩耗の閾値を超えると判定することに少なくとも部分的に基づいて、計算装置は、例えば機械に少なくとも1つの動作を止めさせるため等、機械を制御するため、及び/又は例えば制動力を増加させるため等、構成要素を制御するために、ブレーキが構成要素である機械に制御信号を送信してよい。例えば、上述されたように、機械がエレベータである場合、計算装置は、ブレーキを修理できるまでエレベータに運転を止めさせる信号を送信してよく、機械が車両である場合、かけられる制動力が増加されてよい。 At 1216, based at least in part on the determined state, the computing device may send at least one of a control signal for controlling the facility or a notification that provides an indication of the state of the facility. In the case described above, where the equipment is a brake, the computing device is based, for example, on causing the machine to stop at least one operation based at least in part on determining that the brake wear exceeds an acceptable wear threshold. In order to control the machine and / or to control a component, for example to increase the braking force, a control signal may be sent to the machine in which the brake is a component. For example, as described above, if the machine is an elevator, the computing device may send a signal that causes the elevator to stop operating until the brakes can be repaired, and if the machine is a vehicle, the braking force applied is increased. May be.
本明細書に説明されるプロセス例は、説明のために提供されるプロセスの例にすぎない。本明細書の本開示に鑑みて、他の多くの変形形態が当業者に明らかになるであろう。さらに、本明細書の本開示は、プロセスを実行するための適切なシステム、アーキテクチャ、及び環境のいくつかの例を説明しているが、本明細書の実施態様は示され、説明されている特定の例に制限されていない。さらに、本開示は、図面に説明され、示されるように、様々な実施態様例を提供する。しかしながら、本開示は本明細書に説明され示される実施態様に制限されることはなく、当業者に既知であるように、又は当業者に既知となるように、他の実施態様に及ぶことがある。 The example processes described herein are only examples of processes provided for illustration. Many other variations will be apparent to those skilled in the art in view of the present disclosure herein. Furthermore, while this disclosure herein describes some examples of suitable systems, architectures, and environments for performing the processes, embodiments herein are shown and described. You are not limited to a specific example. Further, the present disclosure provides various example embodiments as illustrated and shown in the drawings. However, the present disclosure is not limited to the embodiments described and shown herein, and may extend to other embodiments as known to those skilled in the art or as known to those skilled in the art. is there.
本明細書に説明される様々な命令、プロセス、及び技法は、コンピュータ可読媒体に記憶され、本明細書でプロセッサによって実行されるプログラムモジュール等、コンピュータ実行可能命令の一般的な文脈で検討してよい。概して、プログラムモジュールは、特定のタスクを実行する又は特定の抽象データ型を実装するためのルーチン、プログラム、オブジェクト、構成要素、データ構造、実行可能コード等を含む。これらのプログラムモジュール等はネイティブコードとして実行してよい、又は例えばバーチャルマシンその他のジャストインタイムコンピレーション実行環境などにダウンロードし、実行してよい。通常、プログラムモジュールの機能性は、様々な実施態様で所望のように組み合わせたり分散したりしてよい。これらのモジュール及び技法の実装は、コンピュータ記憶媒体に記憶しても、何らかの形の通信媒体全体で送信してもよい。 The various instructions, processes, and techniques described herein are discussed in the general context of computer-executable instructions, such as program modules, stored on a computer-readable medium and executed by a processor herein. Good. Generally, program modules include routines, programs, objects, components, data structures, executable code, etc. that perform particular tasks or implement particular abstract data types. These program modules and the like may be executed as native code, or may be downloaded and executed in a virtual machine or other just-in-time compilation execution environment, for example. In general, the functionality of the program modules may be combined or distributed as desired in various embodiments. Implementations of these modules and techniques may be stored on a computer storage medium or transmitted across some form of communication medium.
主題は、構造上の特徴及び/又は方法論的な行為に特有の言語で説明されてきたが、添付特許請求の範囲に定められる主題は必ずしも説明されている特定の特徴又は行為に制限されていないことが理解されるべきである。むしろ、特定の特徴及び行為は特許請求の範囲を実施する形式例として開示される。 Although the subject matter has been described in language specific to structural features and / or methodological acts, the subject matter defined in the claims is not necessarily limited to the specific features or acts described. It should be understood. Rather, the specific features and acts are disclosed as example forms of implementing the claims.
100:システム、110:ユーザ計算装置 100: system, 110: user computing device
Claims (9)
1つ又は複数のプロセッサと、
前記1つ又は複数のプロセッサは、
前記設備に含まれるブレーキの物理モデルを受信し、
前記物理モデルに基づいて前記ブレーキの制動回数に関する故障の程度を表す複数の確率分布を含む、シミュレーションされたデータを生成し、
前記シミュレーションされたデータを平滑化することで、前記故障の程度に対応する前記ブレーキの制動回数の確率密度を含む統計モデルを生成し、
前記ブレーキの状態を示す少なくとも1つの測定されたセンサデータ受信し、
前記統計モデルに基づいて、前記センサデータを前記シミュレーションされたデータの前記確率分布と比較して、最大確率を有する故障の程度を判定し、
前記判定結果に基づいて、前記ブレーキを制御するための制御信号を送信し、
前記1つ又は複数のプロセッサに、前記物理モデルを受信させること、前記シミュレーションされたデータを生成させること、前記センサデータを受信させること、前記統計モデルを生成すること前記センサデータを前記シミュレーションされたデータと比較させること、および、前記制御信号を送信させることを実行するようにプログラムする実行可能命令を維持する1つ又は複数の非一過性のコンピュータ可読媒体と、
を備える設備制御システム。 An equipment control system based on failure determination,
One or more processors;
The one or more processors are:
Receiving a physical model of a brake included in the equipment;
Generating simulated data including a plurality of probability distributions representing a degree of failure related to the number of braking times of the brake based on the physical model;
By smoothing the simulated data, a statistical model including a probability density of the number of braking times of the brake corresponding to the degree of the failure is generated,
Receiving at least one measured sensor data indicative of the state of the brake;
Based on the statistical model, the sensor data is compared with the probability distribution of the simulated data to determine the degree of failure with a maximum probability;
Based on the determination result, a control signal for controlling the brake is transmitted,
Causing the one or more processors to receive the physical model; generating the simulated data; receiving the sensor data; generating the statistical model; One or more non-transitory computer-readable media that maintain executable instructions that are programmed to perform data comparison and causing the control signal to be transmitted;
An equipment control system comprising:
正常な動作として分類される故障の程度を有する前記シミュレーションされたデータの第1の確率分布を決定し、
正常な動作として分類される状態を有する前記履歴データの第2の確率分布を決定し、
前記第1の確率分布と前記第2の確率分布の間の偏差に基づいて前記差異を決定することと、
を含む、請求項2に記載の設備制御システム。 To determine the difference between the simulated data and the historical data,
Determining a first probability distribution of the simulated data having a degree of failure classified as normal operation;
Determining a second probability distribution of the historical data having a state classified as normal operation;
Determining the difference based on a deviation between the first probability distribution and the second probability distribution;
The facility control system according to claim 2, comprising:
前記ブレーキの状態を判定するために、前記ブレーキの前記故障の程度を1つ又は複数の閾値と比較することと、
前記状態に少なくとも部分的に基づいて、計算装置に通知を送信することであって、前記通知が前記状態の表示を含む、通知を送信することと、
をさらに含む、請求項1に記載の設備制御システム。 The executable instruction to program is
Comparing the degree of failure of the brake with one or more thresholds to determine the state of the brake;
Sending a notification to a computing device based at least in part on the state, wherein the notification includes an indication of the state; and
The facility control system according to claim 1, further comprising:
前記ブレーキの前記故障モード及び前記故障の程度を1つ又は複数の閾値と比較して、前記ブレーキの磨耗が許容可能な摩耗の閾値を超えると判定することと、
前記ブレーキの磨耗が許容可能な摩耗の前記閾値を超えると判定することに少なくとも部分的に基づいて、前記ブレーキが構成要素である機械に、前記機械に動作を止めさせるための前記制御信号を送信することと、
をさらに含む、請求項1に記載の設備制御システム。 The brake is a component of the machine, and the executable instructions to program are:
Comparing the failure mode and the degree of failure of the brake with one or more thresholds to determine that wear of the brake exceeds an acceptable wear threshold;
Transmitting the control signal to cause the machine of which the brake is a component to cause the machine to stop operating based at least in part on determining that wear of the brake exceeds the threshold of acceptable wear To do
The facility control system according to claim 1, further comprising:
前記設備制御システムは、
ブレーキの物理モデルを受信し、
前記物理モデルに基づいて前記ブレーキの制動回数に関する故障の程度を表す複数の確率分布を含む、シミュレーションされたデータを生成し、前記シミュレーションされたデータを平滑化することで、前記故障の程度に対応する前記ブレーキの制動回数の確率密度を含む統計モデルを生成し、
前記ブレーキの状態を示す少なくとも1つの測定されたセンサデータを受信し、
前記統計モデルに基づいて、前記センサデータを前記シミュレーションされたデータの前記確率分布と比較して、最大確率を有する故障の程度を判定し、
前記判定結果に基づいて、前記ブレーキを制御するための制御信号を送信することを特徴とする故障判定に基づいた設備制御方法。 A facility control method using a facility control system based on a failure determination including one or more processors,
The facility control system includes:
Receive the physical model of the brake,
Corresponding to the degree of failure by generating simulated data including a plurality of probability distributions representing the degree of failure regarding the number of times of braking of the brake based on the physical model, and smoothing the simulated data Generating a statistical model including a probability density of the number of braking times of the brake;
Receiving at least one measured sensor data indicative of a state of the brake;
Based on the statistical model, the sensor data is compared with the probability distribution of the simulated data to determine the degree of failure with a maximum probability;
A facility control method based on failure determination, wherein a control signal for controlling the brake is transmitted based on the determination result.
前記状態に少なくとも部分的に基づいて、前記通知又は前記制御信号の前記少なくとも1つを送信することであって、前記通知が前記ブレーキの前記状態の表示を含み、前記制御信号が前記ブレーキの少なくとも1つの機能を制御する、前記通知又は前記制御信号の前記少なくとも1つを送信することと、
をさらに含む、請求項7に記載の設備制御方法。 Comparing the degree of failure of the brake with one or more thresholds to determine the state of the brake;
Transmitting the at least one of the notification or the control signal based at least in part on the state, wherein the notification includes an indication of the state of the brake, and the control signal is at least of the brake. Sending the at least one of the notification or the control signal to control one function;
The facility control method according to claim 7, further comprising:
正常な動作として分類される故障の程度を有する前記シミュレーションされたデータの第1の確率分布を決定し、
正常な動作として分類される状態を有する前記履歴データの第2の確率分布を決定し、
前記第1の確率分布と前記第2の確率分布の間の偏差に基づいて前記差異を決定することを特徴とする請求項8に記載の設備制御方法。 To determine the difference between the simulated data and the sensor data,
Determining a first probability distribution of the simulated data having a degree of failure classified as normal operation;
Determining a second probability distribution of the historical data having a state classified as normal operation;
The equipment control method according to claim 8, wherein the difference is determined based on a deviation between the first probability distribution and the second probability distribution.
Applications Claiming Priority (2)
| Application Number | Priority Date | Filing Date | Title |
|---|---|---|---|
| US15/208662 | 2016-07-13 | ||
| US15/208,662 US10466142B2 (en) | 2016-07-13 | 2016-07-13 | Equipment control based on failure determination |
Publications (2)
| Publication Number | Publication Date |
|---|---|
| JP2018010636A JP2018010636A (en) | 2018-01-18 |
| JP6430596B2 true JP6430596B2 (en) | 2018-11-28 |
Family
ID=59337489
Family Applications (1)
| Application Number | Title | Priority Date | Filing Date |
|---|---|---|---|
| JP2017136255A Active JP6430596B2 (en) | 2016-07-13 | 2017-07-12 | Equipment control based on failure judgment |
Country Status (3)
| Country | Link |
|---|---|
| US (1) | US10466142B2 (en) |
| EP (1) | EP3270252B1 (en) |
| JP (1) | JP6430596B2 (en) |
Families Citing this family (15)
| Publication number | Priority date | Publication date | Assignee | Title |
|---|---|---|---|---|
| GB2571359A (en) | 2018-02-27 | 2019-08-28 | Airbus Operations Ltd | Brake monitoring |
| DE102018205660A1 (en) * | 2018-04-13 | 2019-10-17 | Siemens Aktiengesellschaft | Simulating statistically modeled sensor data |
| US20210229282A1 (en) * | 2018-06-04 | 2021-07-29 | Nissan Motor Co., Ltd. | Abnormality determination device and abnormality determination method |
| DE102018209250A1 (en) * | 2018-06-11 | 2019-12-12 | Bayerische Motoren Werke Aktiengesellschaft | Control device, method for controlling a control device, computer-readable storage medium and control system |
| US10956378B2 (en) * | 2018-08-28 | 2021-03-23 | International Business Machines Corporation | Hierarchical file transfer using KDE-optimized filesize probability densities |
| JP7089705B2 (en) * | 2018-08-31 | 2022-06-23 | 株式会社安川電機 | Brake diagnostic device and brake diagnostic system |
| US10882500B2 (en) | 2018-11-30 | 2021-01-05 | Raytheon Technologies Corporation | Systems and methods for brake failure detection using retract braking |
| EP3696629A1 (en) * | 2019-02-12 | 2020-08-19 | Siemens Aktiengesellschaft | Method for monitoring an industrial installation, computer program, computer-readable medium and system |
| WO2020205324A1 (en) * | 2019-04-01 | 2020-10-08 | Bp Corporation North America Inc. | Dynamic digital replicas of production facilities |
| CN110161876B (en) * | 2019-04-29 | 2021-01-08 | 南京航空航天大学 | Optimization method for brake pedal feedback of electric power-assisted brake system |
| US10839621B1 (en) * | 2019-07-24 | 2020-11-17 | Toyota Motor Engineering & Manufacturing North America, Inc. | Altering a vehicle based on driving pattern comparison |
| KR102303406B1 (en) * | 2019-11-18 | 2021-09-16 | 울산대학교 산학협력단 | Method for something wrong diagnosis of industrial equipment and the device |
| US11360843B2 (en) | 2020-07-10 | 2022-06-14 | Hitachi, Ltd. | System and signal processing method for failure mode identification |
| JP2023012668A (en) * | 2021-07-14 | 2023-01-26 | 三菱重工業株式会社 | Failure predicting device, failure predicting method, and program |
| WO2024075164A1 (en) * | 2022-10-03 | 2024-04-11 | 株式会社Subaru | Information processing device and program |
Family Cites Families (8)
| Publication number | Priority date | Publication date | Assignee | Title |
|---|---|---|---|---|
| US5299452A (en) * | 1992-12-08 | 1994-04-05 | Eaton Corporation | Method and apparatus for estimating vehicle braking system effectiveness |
| CA2211815A1 (en) | 1997-07-29 | 1999-01-29 | Craig Luker | Method and apparatus for determining vehicle brake effectiveness |
| US7260501B2 (en) * | 2004-04-21 | 2007-08-21 | University Of Connecticut | Intelligent model-based diagnostics for system monitoring, diagnosis and maintenance |
| US8144005B2 (en) * | 2008-05-29 | 2012-03-27 | General Electric Company | System and method for advanced condition monitoring of an asset system |
| JP5093022B2 (en) | 2008-09-19 | 2012-12-05 | トヨタ自動車株式会社 | In-wheel motor control device |
| US8751129B2 (en) * | 2011-12-08 | 2014-06-10 | Continental Automotive Systems, Inc. | Electronic brake system controls adaptation based upon brake component condition |
| JP6135545B2 (en) | 2014-02-24 | 2017-05-31 | 株式会社デンソー | Correction value generation device, failure diagnosis device, correction value generation program, and failure diagnosis program |
| US20160097699A1 (en) * | 2014-10-07 | 2016-04-07 | General Electric Company | Estimating remaining usage of a component or device |
-
2016
- 2016-07-13 US US15/208,662 patent/US10466142B2/en active Active
-
2017
- 2017-07-12 JP JP2017136255A patent/JP6430596B2/en active Active
- 2017-07-12 EP EP17180841.3A patent/EP3270252B1/en active Active
Also Published As
| Publication number | Publication date |
|---|---|
| EP3270252B1 (en) | 2020-12-23 |
| US20180017467A1 (en) | 2018-01-18 |
| US10466142B2 (en) | 2019-11-05 |
| JP2018010636A (en) | 2018-01-18 |
| EP3270252A1 (en) | 2018-01-17 |
Similar Documents
| Publication | Publication Date | Title |
|---|---|---|
| JP6430596B2 (en) | Equipment control based on failure judgment | |
| JP7076887B2 (en) | Fall protection event generation and monitoring | |
| RU2719064C2 (en) | Integrated system and methods for controlling and monitoring vehicles | |
| JP6937173B2 (en) | Prediction methods and systems for structural repairs in heavy aircraft maintenance | |
| JP6442091B2 (en) | Automobile parts destruction prevention system, automobile parts destruction prevention method, and non-transitory computer-readable medium | |
| US20190102494A1 (en) | System for tracking incremental damage accumulation | |
| US7684936B2 (en) | Method, apparatus and computer program product for determining a future time of a component | |
| US9530256B2 (en) | Generating cumulative wear-based indicators for vehicular components | |
| JP6879873B2 (en) | Failure probability evaluation system | |
| EP3255588A1 (en) | Probabilistic remaining usage life of aircraft structures | |
| CN111435557A (en) | Fault detection device for detecting problems with machine components | |
| CN112727965B (en) | Fault monitoring method and device for brake of coal mining machine | |
| EP3617826A1 (en) | Management monitoring system | |
| RU2573266C1 (en) | Method of monitoring digital transmission systems and apparatus therefor | |
| WO2021005943A1 (en) | Failure probability assessment system and method therefor | |
| JP2014178861A (en) | Abnormal driving action detection device | |
| CN113919597A (en) | Method and device for predicting the landing load of an aircraft | |
| EP3637121B1 (en) | System and method of adaptive remaining useful life estimation using constraint convex regression from degradation measurement | |
| WO2021064144A1 (en) | Method and system for continuous estimation and representation of risk | |
| WO2021172249A1 (en) | Wear state prediction method, wear state prediction device, wear state prediction program, and prediction model generation method | |
| US11967822B2 (en) | Method for predicting power generation and remaining useful life per system and system for performing the same | |
| Wang et al. | Near-extreme system condition and near-extreme remaining useful time for a group of products | |
| CN113800352A (en) | Elevator braking torque detection method and device | |
| RU2735296C1 (en) | Method for multi-parameter monitoring of complex electrotechnical objects state | |
| CN114008549A (en) | Method for determining remaining usage period, remaining usage period determining circuit, remaining usage period determining apparatus |
Legal Events
| Date | Code | Title | Description |
|---|---|---|---|
| A131 | Notification of reasons for refusal |
Free format text: JAPANESE INTERMEDIATE CODE: A131 Effective date: 20180417 |
|
| A977 | Report on retrieval |
Free format text: JAPANESE INTERMEDIATE CODE: A971007 Effective date: 20180419 |
|
| A521 | Request for written amendment filed |
Free format text: JAPANESE INTERMEDIATE CODE: A523 Effective date: 20180612 |
|
| A131 | Notification of reasons for refusal |
Free format text: JAPANESE INTERMEDIATE CODE: A131 Effective date: 20180821 |
|
| A521 | Request for written amendment filed |
Free format text: JAPANESE INTERMEDIATE CODE: A523 Effective date: 20181003 |
|
| TRDD | Decision of grant or rejection written | ||
| A01 | Written decision to grant a patent or to grant a registration (utility model) |
Free format text: JAPANESE INTERMEDIATE CODE: A01 Effective date: 20181023 |
|
| A61 | First payment of annual fees (during grant procedure) |
Free format text: JAPANESE INTERMEDIATE CODE: A61 Effective date: 20181031 |
|
| R150 | Certificate of patent or registration of utility model |
Ref document number: 6430596 Country of ref document: JP Free format text: JAPANESE INTERMEDIATE CODE: R150 |