JP6282229B2 - Accurate analyte measurement of electrochemical test strips based on multiple discrete measurements defined by the sensed physical properties of the sample, including the analyte - Google Patents
Accurate analyte measurement of electrochemical test strips based on multiple discrete measurements defined by the sensed physical properties of the sample, including the analyte Download PDFInfo
- Publication number
- JP6282229B2 JP6282229B2 JP2014549535A JP2014549535A JP6282229B2 JP 6282229 B2 JP6282229 B2 JP 6282229B2 JP 2014549535 A JP2014549535 A JP 2014549535A JP 2014549535 A JP2014549535 A JP 2014549535A JP 6282229 B2 JP6282229 B2 JP 6282229B2
- Authority
- JP
- Japan
- Prior art keywords
- approximately equal
- signal
- magnitude
- sample
- time interval
- Prior art date
- Legal status (The legal status is an assumption and is not a legal conclusion. Google has not performed a legal analysis and makes no representation as to the accuracy of the status listed.)
- Expired - Fee Related
Links
Images


Classifications
-
- G—PHYSICS
- G01—MEASURING; TESTING
- G01N—INVESTIGATING OR ANALYSING MATERIALS BY DETERMINING THEIR CHEMICAL OR PHYSICAL PROPERTIES
- G01N27/00—Investigating or analysing materials by the use of electric, electrochemical, or magnetic means
- G01N27/26—Investigating or analysing materials by the use of electric, electrochemical, or magnetic means by investigating electrochemical variables; by using electrolysis or electrophoresis
- G01N27/28—Electrolytic cell components
- G01N27/30—Electrodes, e.g. test electrodes; Half-cells
- G01N27/327—Biochemical electrodes, e.g. electrical or mechanical details for in vitro measurements
- G01N27/3271—Amperometric enzyme electrodes for analytes in body fluids, e.g. glucose in blood
- G01N27/3274—Corrective measures, e.g. error detection, compensation for temperature or hematocrit, calibration
-
- G—PHYSICS
- G01—MEASURING; TESTING
- G01N—INVESTIGATING OR ANALYSING MATERIALS BY DETERMINING THEIR CHEMICAL OR PHYSICAL PROPERTIES
- G01N27/00—Investigating or analysing materials by the use of electric, electrochemical, or magnetic means
- G01N27/26—Investigating or analysing materials by the use of electric, electrochemical, or magnetic means by investigating electrochemical variables; by using electrolysis or electrophoresis
- G01N27/28—Electrolytic cell components
- G01N27/30—Electrodes, e.g. test electrodes; Half-cells
- G01N27/327—Biochemical electrodes, e.g. electrical or mechanical details for in vitro measurements
- G01N27/3271—Amperometric enzyme electrodes for analytes in body fluids, e.g. glucose in blood
- G01N27/3272—Test elements therefor, i.e. disposable laminated substrates with electrodes, reagent and channels
-
- G—PHYSICS
- G16—INFORMATION AND COMMUNICATION TECHNOLOGY [ICT] SPECIALLY ADAPTED FOR SPECIFIC APPLICATION FIELDS
- G16B—BIOINFORMATICS, i.e. INFORMATION AND COMMUNICATION TECHNOLOGY [ICT] SPECIALLY ADAPTED FOR GENETIC OR PROTEIN-RELATED DATA PROCESSING IN COMPUTATIONAL MOLECULAR BIOLOGY
- G16B40/00—ICT specially adapted for biostatistics; ICT specially adapted for bioinformatics-related machine learning or data mining, e.g. knowledge discovery or pattern finding
- G16B40/10—Signal processing, e.g. from mass spectrometry [MS] or from PCR
Description
(優先権)
この出願は、以前に出願された、いずれも2011年12月29日の同じ日に出願の米国仮特許出願第61/581,087号(代理人整理番号DDI5220USPSP)、同第61/581,089号(代理人整理番号DDI5220USPSP1)、同第61/581,099号(代理人整理番号DDI5220USPSP2)、及び同第61/581,100号(代理人整理番号DDI5221USPSP)、並びに2012年5月31日出願の米国仮特許出願第61/654,013号(代理人整理番号(DDI5228USPSP)に基づく優先権の利益をそれぞれが主張する、以前に出願された2012年12月28日出願の国際特許出願第PCT/GB2012/053276号、同第PCT/GB2012/053277号、及び同第PCT/GB2012/053279号に基づく優先権の利益を主張するものであり、これらの先行出願をいずれも恰も本明細書に全体が記載されているものと同様にして、参照により本明細書に組み込まれる。
(priority)
This application is a previously filed US Provisional Patent Application No. 61 / 581,087 (Attorney Docket No. DDI5220USPSP), both filed on the same day of December 29, 2011, 61 / 581,089. No. (Attorney Docket No. DDI5220USPSP1), the No. 61 / 581,099 (Attorney Docket No. DDI5220USPSP2), and the No. 61 / 581,100 (Attorney Docket No. DDI5221USPSP), and May 31, 2012, filed US Provisional Patent Application No. 61 / 654,013 (priority international patent application PCT filed on Dec. 28, 2012, each claiming the benefit of priority based on Attorney Docket Number (DDI5228USPSP)) / GB2012 / 053276, PCT / GB2012 / 053277 And claims the benefit of priority under the No. PCT / GB2012 / 053279, in a manner similar to that entirety as if herein Any of these prior applications is described, the present by reference Incorporated in the description.
LifeScan,Incより販売されるOneTouch(登録商標)Ultra(登録商標)全血検査キットに使用されるものなどの電気化学的グルコースバイオセンサは、糖尿病患者からの血液試料中の血糖値を測定するように設計されている。グルコースの測定は、グルコースオキシダーゼ酵素(GO)によるグルコースの選択的酸化に基づいて行うことができる。グルコースバイオセンサにおいて生じうる反応は、下式1及び2にまとめられる。
式1 グルコース+GO(酸化型)→グルコン酸+GO(還元型)
式2 GO(還元型)+2Fe(CN)6 3−→GO(酸化型)+2Fe(CN)6 4−
Electrochemical glucose biosensors, such as those used in the OneTouch® Ultra® whole blood test kit sold by LifeScan, Inc., measure blood glucose levels in blood samples from diabetic patients Designed to. The measurement of glucose can be performed based on the selective oxidation of glucose by glucose oxidase enzyme (GO). The reactions that can occur in a glucose biosensor are summarized in
式1に示されるように、グルコースは、グルコースオキシダーゼ(GO(ox))の酸化型によってグルコン酸に酸化される。GO(酸化型)は「酸化型酵素」と呼ばれる場合があることに留意されたい。式1の反応では、酸化型酵素GO(酸化型)は、GO(還元型)として示される還元された状態に変換される(すなわち「還元型酵素」)。次に、還元型酵素GO(還元型)は、式2に示されるようにFe(CN)6 3−(酸化型メディエータ又はフェリシアニドと呼ばれる)との反応によってGO(ox)に再酸化される。GO(還元型)が酸化された状態GO(酸化型)に戻る際、Fe(CN)6 3−はFe(CN)6 4−(還元型メディエータ又はフェロシアニドと呼ばれる)に還元される。
As shown in
上記の反応が2つの電極間に検査シグナルを加えて行われる場合、電極表面で還元型メディエータが電気化学的に再酸化されることによって検査電流を発生させることができる。したがって、理想的な環境では、上記の化学反応において生成するフェロシアニドの量は電極間に配置される試料中のグルコースの量と正比例するため、発生する検査電流は、試料のグルコース含量に比例することになる。フェリシアニドなどのメディエータは、グルコースオキシダーゼなどの酵素から電子を受容し、この電子を電極に供与する化合物である。試料中のグルコース濃度が高くなると、生成する還元型メディエータの量も増えるため、還元型メディエータの再酸化によって生じる検査電流とグルコース濃度との間には直接的な関係がある。具体的には、電気的界面をまたいだ電子の移動によって、検査電流の流れが生じる(酸化されるグルコース1モルにつき2モルの電子)。したがって、グルコースの導入により生じる検査電流はグルコース電流と呼ぶこともできる。 When the above reaction is performed by applying a test signal between two electrodes, a test current can be generated by electrochemically reoxidizing the reduced mediator on the electrode surface. Therefore, in an ideal environment, the amount of ferrocyanide produced in the above chemical reaction is directly proportional to the amount of glucose in the sample placed between the electrodes, so the test current generated should be proportional to the glucose content of the sample. become. Mediators such as ferricyanide are compounds that accept electrons from an enzyme such as glucose oxidase and donate these electrons to an electrode. As the glucose concentration in the sample increases, the amount of reduced mediator produced also increases, so there is a direct relationship between the test current generated by reoxidation of the reduced mediator and the glucose concentration. Specifically, the movement of electrons across the electrical interface results in a flow of test current (2 moles of electrons per mole of glucose oxidized). Therefore, the test current generated by the introduction of glucose can also be called the glucose current.
電気化学的バイオセンサは、測定値に好ましくない影響を与え、検出される信号のの精度低下につながりうる特定の血液成分の存在によって悪影響を受ける場合がある。この精度低下は誤ったグルコース指示値を与え、患者が例えば潜在的に危険な血糖値に気づかないといったことにつながる怖れがある。1つの例として、血液のヘマトクリット値(すなわち、赤血球が占める血液量の比率(%))は、得られる検体濃度の測定値に誤った影響を与えることがある。 Electrochemical biosensors can be adversely affected by the presence of certain blood components that can adversely affect measurements and lead to reduced accuracy of the detected signal. This loss of accuracy can give false glucose readings and can lead to patients not being aware of, for example, potentially dangerous blood glucose levels. As one example, the hematocrit value of blood (ie, the percentage of blood volume occupied by red blood cells) may erroneously affect the resulting analyte concentration measurement.
血中の赤血球量の変動により、使い捨て電気化学的バイオセンサによって測定されるグルコース指示値の変動を引き起こす可能性がある。一般的に、高ヘマトクリット値において負のバイアス(すなわち、検体濃度が低く計算される)が認められる一方で、低ヘマトクリット値では正のバイアス(すなわち、検体濃度が高く計算される)が認められる。高ヘマトクリット値では、化学反応物質を溶媒和する血漿量が少ないために、赤血球は例えば酵素と電気化学的メディエータとの反応を阻害し、化学物質の溶解速度を低下させ、メディエータの拡散を遅くする可能性がある。これらの要因により、電気化学的プロセスにおいて発生する電流が少なくなることから、予想されるよりも低いグルコース指示値となりうる。これに対して、低ヘマトクリット値では、少ない赤血球数が電気化学的反応に予想よりも低く影響する場合があり、その結果、電流の測定値がより高くなりうる。更に、血液試料の抵抗値もヘマトクリット値に依存しており、電圧及び/又は電流の測定値に影響を与えうる。 Variations in the amount of red blood cells in the blood can cause variations in the glucose readings measured by the disposable electrochemical biosensor. In general, a negative bias (ie, a low analyte concentration is calculated) is observed at high hematocrit values, while a positive bias (ie, a high analyte concentration is calculated) at low hematocrit values. At high hematocrit, the amount of plasma that solvates chemical reactants is low, so red blood cells inhibit, for example, the reaction between enzymes and electrochemical mediators, slowing the rate of chemical dissolution and slowing the diffusion of mediators there is a possibility. These factors can lead to lower glucose readings than expected because less current is generated in the electrochemical process. In contrast, at low hematocrit values, a small number of red blood cells may affect the electrochemical reaction less than expected, resulting in higher current measurements. Furthermore, the resistance value of the blood sample also depends on the hematocrit value and can affect the measured values of voltage and / or current.
ヘマトクリット値による血糖値の変動を低減する、又は防止するための幾つかの策が講じられている。例えば、試料から赤血球を除去するためのメッシュを組み込むんだバイオセンサが設計されており、又は赤血球の粘性を高めることで低ヘマトクリット値が濃度測定に及ぼす影響を小さくするように設計された各種の化合物若しくは製剤を含んだものもある。他の検査ストリップとして、ヘマトクリット値の影響を補正する目的でヘモグロビン濃度を決定するように構成された溶解剤及び溶解剤のシステムを含むものもある。更に、交流信号による流体試料の電気的応答若しくは血液試料を光に曝露した後の光学的変動の変化を測定することにより、又は試料チャンバの充填時間の関数に基づいてヘマトクリット値を測定することによってヘマトクリット値を測定するように構成されたバイオセンサもある。ヘマトクリット値の検出を行う方策の共通の方法の1つは、測定されたヘマトクリット値を用いて、測定された検体濃度を補正又は変更することであるが、この方法は、以下の米国特許出願公開第2010/0283488号、同第2010/0206749号、同第2009/0236237号、同第2010/0276303号、同第2010/0206749号、同第2009/0223834号、同第2008/0083618号、同第2004/0079652号、同第2010/0283488号、同第2010/0206749号、同第2009/0194432号、又は米国特許第7,972,861号及び同第7,258,769号にそれぞれ一般的に図示及び説明されており、これらはいずれも、参照により本明細書に組み込まれる。 Several measures have been taken to reduce or prevent blood sugar level fluctuations due to hematocrit levels. For example, biosensors have been designed that incorporate a mesh to remove red blood cells from the sample, or various designs designed to reduce the impact of low hematocrit on concentration measurements by increasing red blood cell viscosity. Some contain compounds or formulations. Other test strips include solubilizers and solubilizer systems configured to determine hemoglobin concentration in order to compensate for the effects of hematocrit values. In addition, by measuring the electrical response of the fluid sample due to an alternating signal or the change in optical variation after exposing the blood sample to light, or by measuring the hematocrit value based on a function of the fill time of the sample chamber Some biosensors are configured to measure hematocrit values. One common method of strategy for detecting hematocrit values is to use the measured hematocrit value to correct or change the measured analyte concentration, which is disclosed in the following US patent application publications: 2010/0283488, 2010/0206749, 2009/0236237, 2010/0276303, 2010/0206749, 2009/0223834, 2008/0083618, 2008 Generally in US 2004/0079652, 2010/0283488, 2010/0206749, 2009/0194432, or US Pat. Nos. 7,972,861 and 7,258,769, respectively. Both illustrated and described, both of which are incorporated herein by reference. It is incorporated seen.
本願出願人は、試料採取の時点とヘマトクリット値との間の関係を利用して、電気化学的バイオセンサからより正確な検体濃度を計算するために使用することが可能な特定の試料採取時点を導出又は計算するための改良されたグルコース測定を可能とするための方法の様々な実施形態を提供したものである。この新たに提供される方法は、検体測定値に補正又は改変を行うことに頼らないことで、検査時間を短縮するとともに精度を高めるものである。 The Applicant uses the relationship between the time of sampling and the hematocrit value to determine a specific sampling time point that can be used to calculate a more accurate analyte concentration from an electrochemical biosensor. Various embodiments of a method for enabling improved glucose measurement for derivation or calculation are provided. This newly provided method shortens the examination time and increases the accuracy by not relying on correcting or modifying the sample measurement value.
第1の態様では、バイオセンサにより生理学的試料から検体濃度を決定する方法が提供される。バイオセンサは、少なくとも2つの電極及びこれらの電極の少なくとも1つに配置された試薬を有する。この方法は、前記少なくとも2つの電極のいずれか1つに生理学的試料を付着させることによって検体検査シーケンスを開始する工程と、前記試料に第1の信号を印加することにより試料の物理的特性を導出する工程と、前記試料に、前記検査シーケンスと重なり合う第1のサンプリング持続時間にわたって第2の信号を流すことにより、前記試料から、前記第1のサンプリング持続時間における時間及び大きさの両方と相関した第1の過渡信号出力を得る工程と、前記試料の物理的特性に基づいて、前記第1のサンプリング持続時間内で検査シーケンスの間の特定のサンプリング時間を抽出する工程と、前記第2のサンプリング持続時間が前記第1のサンプリング持続時間と重なり合うように前記特定のサンプリング時間に基づいて前記第2のサンプリングを規定する工程と、前記第1の過渡信号から、第2のサンプリング持続時間に対して参照される第2の過渡信号を得る工程と、前記第2の過渡信号を前記第2のサンプリング持続時間に対して別個の時間間隔に分割する工程と、前記第2のサンプリング持続時間内の別個の選択された時間間隔における前記第2の過渡信号のそれぞれの大きさを導出する工程と、前記別個の選択された時間間隔における前記第2の過渡信号のそれぞれの大きさに基づいて検体濃度を決定する工程と、によって実現することができる。 In a first aspect, a method for determining an analyte concentration from a physiological sample by a biosensor is provided. The biosensor has at least two electrodes and a reagent disposed on at least one of these electrodes. The method includes the steps of initiating an analyte test sequence by attaching a physiological sample to any one of the at least two electrodes, and applying a first signal to the sample to determine the physical properties of the sample. Deriving and correlating both the time and magnitude in the first sampling duration from the sample by flowing a second signal through the sample for a first sampling duration that overlaps the test sequence Obtaining a first transient signal output, extracting a specific sampling time during an inspection sequence within the first sampling duration based on the physical characteristics of the sample, and the second The first sampling time based on the specific sampling time such that a sampling duration overlaps the first sampling duration. Defining a sampling of the second transient signal, obtaining a second transient signal referenced from the first transient signal for a second sampling duration, and extracting the second transient signal to the second sampling signal. Dividing the duration into separate time intervals; deriving the magnitude of each of the second transient signals in separate selected time intervals within the second sampling duration; and Determining the analyte concentration based on the magnitude of each of the second transient signals in separate selected time intervals.
第2の態様では、バイオセンサにより生理学的試料から検体濃度を決定する方法が提供される。バイオセンサは、少なくとも2つの電極及びこれらの電極の少なくとも1つに配置された試薬を有する。この方法は、前記少なくとも2つの電極のいずれか1つに生理学的試料を付着させることによって検体検査シーケンスを開始する工程と、前記試料に第1の信号を印加することにより試料の物理的特性を導出する工程と、前記試料に、前記検査シーケンスと重なり合う第1のサンプリング持続時間にわたって第2の信号を流すことにより、前記試料から、前記第1のサンプリング持続時間における時間及び大きさの両方と相関した第1の過渡信号出力を得る工程と、前記試料の物理的特性に基づいて、前記第1のサンプリング持続時間内で検査シーケンスの間の特定のサンプリング時間を抽出する工程と、前記第1の過渡信号から第2のサンプリング持続時間にわたる第2の過渡信号を得る工程と、前記第2のサンプリング持続時間内の選択された時間間隔における前記第2の過渡信号のそれぞれの大きさを導出する工程と、前記選択された時間間隔における前記第2の過渡信号のそれぞれの大きさに基づいて検体濃度を決定する工程と、によって実現することができる。 In a second aspect, a method for determining an analyte concentration from a physiological sample by a biosensor is provided. The biosensor has at least two electrodes and a reagent disposed on at least one of these electrodes. The method includes the steps of initiating an analyte test sequence by attaching a physiological sample to any one of the at least two electrodes, and applying a first signal to the sample to determine the physical properties of the sample. Deriving and correlating both the time and magnitude in the first sampling duration from the sample by flowing a second signal through the sample for a first sampling duration that overlaps the test sequence Obtaining a first transient signal output, extracting a specific sampling time during an inspection sequence within the first sampling duration based on a physical property of the sample, and the first Obtaining a second transient signal from the transient signal over a second sampling duration, and selecting within the second sampling duration Deriving the magnitude of each of the second transient signals in a selected time interval; determining the analyte concentration based on each magnitude of the second transient signal in the selected time interval; Can be realized.
第3の態様では、バイオセンサにより生理学的試料から検体濃度を決定する方法が提供される。バイオセンサは、少なくとも2つの電極及びこれらの電極の少なくとも1つに配置された試薬を有する。この方法は、前記少なくとも2つの電極のいずれか1つに生理学的試料を付着させることによって検体検査シーケンスを開始する工程と、前記試料に第1の信号を印加することにより試料の物理的特性を導出する工程と、第1のサンプリング持続時間内の特定のサンプリング時間を抽出する工程と、前記第1のサンプリング持続時間にわたって前記試料に第2の信号を流す工程と、前記第1のサンプリング持続時間の持続時間にわたって前記試料から第1の過渡信号出力を測定又はサンプリングする工程と、前記第1のサンプリング持続時間内の前記特定のサンプリング時間を含む特定の時間の範囲を規定する工程と、前記特定の時間の範囲内のそれぞれの別個の時間間隔において複数の前記第1の過渡信号の大きさを得る工程と、前記得る工程からの前記第1の過渡信号の大きさに基づいて検体濃度を決定する工程と、によって実現することができる。 In a third aspect, a method for determining an analyte concentration from a physiological sample by a biosensor is provided. The biosensor has at least two electrodes and a reagent disposed on at least one of these electrodes. The method includes the steps of initiating an analyte test sequence by attaching a physiological sample to any one of the at least two electrodes, and applying a first signal to the sample to determine the physical properties of the sample. Deriving, extracting a particular sampling time within a first sampling duration, flowing a second signal through the sample over the first sampling duration, and the first sampling duration Measuring or sampling a first transient signal output from the sample for a duration of: defining a range of specific times including the specific sampling time within the first sampling duration; Obtaining a plurality of magnitudes of the first transient signal at each distinct time interval within a time range of And determining an analyte concentration based on the magnitude of the first transient signal from degree can be achieved by.
第4の態様では、バイオセンサにより生理学的試料から検体濃度を決定する方法が提供される。バイオセンサは、少なくとも2つの電極及びこれらの電極の少なくとも1つに配置された試薬を有する。この方法は、前記少なくとも2つの電極のいずれか1つに生理学的試料を付着させることによって検体検査シーケンスを開始する工程と、前記試料に第1の信号を印加することにより試料の物理的特性を導出する工程と、第1のサンプリング持続時間内で特定のサンプリング時間を抽出する工程と、前記第1のサンプリング持続時間にわたって前記試料に第2の信号を流す工程と、前記第1のサンプリング持続時間の持続時間にわたって前記試料から第1の過渡信号出力を測定又はサンプリングする工程と、おおよそ前記特定のサンプリング時間における以外の時間間隔で複数の前記第1の過渡信号出力の大きさを得る工程と、前記得る工程からの前記複数の第1の過渡信号の大きさに基づいて検体濃度を決定する工程と、によって実現することができる。 In a fourth aspect, a method for determining an analyte concentration from a physiological sample by a biosensor is provided. The biosensor has at least two electrodes and a reagent disposed on at least one of these electrodes. The method includes the steps of initiating an analyte test sequence by attaching a physiological sample to any one of the at least two electrodes, and applying a first signal to the sample to determine the physical properties of the sample. Deriving, extracting a specific sampling time within a first sampling duration, passing a second signal through the sample over the first sampling duration, and the first sampling duration Measuring or sampling a first transient signal output from the sample over a duration of time; obtaining a plurality of first transient signal output magnitudes at time intervals approximately other than at the particular sampling time; Determining the analyte concentration based on the magnitude of the plurality of first transient signals from the obtaining step. Door can be.
第5の態様では、バイオセンサにより生理学的試料から検体濃度を決定する方法が提供される。バイオセンサは、少なくとも2つの電極及びこれらの電極の少なくとも1つに配置された試薬を有する。この方法は、前記少なくとも2つの電極のいずれか1つに生理学的試料を付着させることによって複数のバイオセンサのそれぞれについて検体検査シーケンスを開始する工程と、前記試料に第1の信号を印加することによって前記複数のバイオセンサのそれぞれについて前記試料の物理的特性を導出する工程と、前記複数のバイオセンサのそれぞれについて第1のサンプリング持続時間内の特定のサンプリング時間を抽出する工程と、前記複数のバイオセンサのそれぞれについて前記第1のサンプリング持続時間にわたって前記試料に第2の信号を流す工程と、前記複数のバイオセンサのそれぞれについて前記第1のサンプリング持続時間の持続時間にわたって前記試料から第1の過渡信号出力を測定又はサンプリングする工程と、前記複数のバイオセンサのそれぞれについて前記第1のサンプリング持続時間内の前記特定のサンプリング時間を含む特定の時間の範囲を規定する工程と、前記複数のバイオセンサのそれぞれについて前記特定の時間の範囲内のそれぞれの別個の時間間隔において複数の前記第1の過渡信号の大きさを得る工程と、前記複数のバイオセンサのそれぞれについて、前記得る工程からの前記第1の過渡信号の大きさに基づいて検体濃度を決定する工程であって、前記複数のバイオセンサについて前記決定する工程により決定される複数の検体濃度間の誤差が、30%、42%、及び55%のヘマトクリット値のそれぞれにおける基準値と比較して±15%未満である工程と、によって実現することができる。 In a fifth aspect, a method for determining an analyte concentration from a physiological sample by a biosensor is provided. The biosensor has at least two electrodes and a reagent disposed on at least one of these electrodes. The method includes initiating an analyte test sequence for each of a plurality of biosensors by attaching a physiological sample to any one of the at least two electrodes, and applying a first signal to the sample. Deriving a physical property of the sample for each of the plurality of biosensors, extracting a specific sampling time within a first sampling duration for each of the plurality of biosensors, and Flowing a second signal through the sample for the first sampling duration for each of the biosensors; and from the sample for a duration of the first sampling duration for each of the plurality of biosensors. Measuring or sampling a transient signal output, and the plurality Defining a specific time range including the specific sampling time within the first sampling duration for each of the biosensors; and each of the plurality of biosensors within the specific time range Obtaining a plurality of first transient signal magnitudes in separate time intervals and, for each of the plurality of biosensors, determining an analyte concentration based on the first transient signal magnitude from the obtaining step. An error between the plurality of analyte concentrations determined by the determining step for the plurality of biosensors is compared to a reference value at each of the 30%, 42%, and 55% hematocrit values. And a process that is less than ± 15%.
これらの態様では、以下の特徴を様々な組み合わせで用いることもできる。例えば、前記特定の時間の範囲は、前記特定のサンプリング時間よりも前に測定された第1の過渡信号の大きさを含んでよく、前記特定のサンプリング時間を抽出する工程は、前記試料の物理的特性に基づいて前記第1のサンプリング持続時間内の規定された特定のサンプリング時間を計算することを含んでよく、前記規定された特定のサンプリング時間を計算する工程は、以下の形の式を用いることを含んでよい。すなわち、 In these embodiments, the following features can be used in various combinations. For example, the range of the specific time may include a magnitude of a first transient signal measured before the specific sampling time, and the step of extracting the specific sampling time may include the physics of the sample. Calculating a specified specific sampling time within the first sampling duration based on a dynamic characteristic, wherein calculating the specified specific sampling time includes an expression of the form Using may be included. That is,
特定のサンプリング時間=x1Hx2+x3
式中、
「特定のサンプリング時間」は、バイオセンサの出力信号をサンプリングする検査シーケンスの開始からの時点として指定され、
Hは、試料の物理的特性を表し、
x1は、約4.3e5であるか、又は4.3e5に等しいか、又は4.3e5の与えられた数値の±10%、5%、又は1%に等しく、
x2は、約(−)3.9であるか、又は−3.9に等しいか、又は−3.9の与えられた数値の±10%、5%、又は1%に等しく、
x3は、約4.8であるか、又は4.8に等しいか、又は4.8の与えられた数値の±10%、5%、又は1%に等しい。
Specific sampling time = x 1 H x 2 + x 3
Where
The “specific sampling time” is designated as the point in time from the start of the test sequence that samples the biosensor output signal,
H represents the physical properties of the sample,
x 1 is approximately 4.3e5, or equal to 4.3e5, or equal to ± 10%, 5%, or 1% of a given numerical value of 4.3e5;
x 2 is about (−) 3.9, or equal to −3.9, or equal to ± 10%, 5%, or 1% of a given numerical value of −3.9,
x 3 is either about 4.8, or equal to 4.8, or ± 10% of the numerical value given 4.8, 5%, or equal to 1%.
これらの態様に関して、以下の特徴をこれらの態様とともに様々な組み合わせで用いることもできる。例えば、前記第2のサンプリング持続時間を規定する工程は、前記規定された特定のサンプリング時間と所定の時点との間の差の絶対値を得ることによって開始時間(T1)及び前記特定のサンプリング時点に概ね等しい終了時間(T2)を規定することを含んでよく、前記第1のサンプリング持続時間は前記試料を付着させる工程から約10秒以内を含んでよく;前記得る工程は、前記第1のサンプリング持続時間と重なり合い、前記第1の過渡信号の一部及び前記第2のサンプリング持続時間の時間に対するその大きさを含む第2のサンプリング持続時間を規定することを更に含んでよく、ただし前記部分は第2の過渡信号として指定され;前記第2の過渡信号を得る工程は、前記第2のサンプリング持続時間内である第2の過渡信号として指定される第1の過渡信号の一部分を前記第1の過渡信号から抽出することを含んでよく;前記別個の選択された時間間隔で前記第2の過渡信号のそれぞれの大きさを導出する工程が、それぞれの選択された時間間隔の間に第2の過渡信号の大きさを計算することを含んでよく;前記分割する工程が、前記第2の過渡信号を、概ね開始時間における時間間隔1から概ね終了時間における時間間隔22までの少なくとも22個の時間間隔に順次分割することを含んでよい。
With respect to these embodiments, the following features may be used in various combinations with these embodiments. For example, the step of defining the second sampling duration includes a start time (T1) and the specific sampling time point by obtaining an absolute value of a difference between the specified specific sampling time and a predetermined time point. The first sampling duration may include within about 10 seconds of depositing the sample; and the obtaining step may include defining the end time (T2) approximately equal to Defining a second sampling duration that overlaps with the sampling duration and includes a portion of the first transient signal and its magnitude relative to a time of the second sampling duration, wherein the portion Is designated as a second transient signal; obtaining the second transient signal comprises: a second transient signal that is within the second sampling duration; Extracting a portion of the first transient signal specified from the first transient signal; deriving a magnitude of each of the second transient signals at the separate selected time interval. A step may include calculating a magnitude of a second transient signal during each selected time interval; the step of dividing the second transient signal approximately at a time interval at a start time. Sequential division into at least 22 time intervals from 1 to a
他の特徴と同様、以下の特徴もこれらの上記の態様と組み合わせて用いることができる。例えば、検体濃度の決定は、以下の形の式を用いることによって得ることができ、すなわち、 As with other features, the following features can also be used in combination with these above aspects. For example, determination of analyte concentration can be obtained by using an equation of the form:

Gは、検体濃度を表し、
I1は、時間間隔17における第2の過渡信号の大きさにほぼ等しいか、又はI1は、時間間隔17における第2の過渡信号の大きさに等しいか、又はI1は、時間間隔17における第2の過渡信号の大きさ±10%、5%、若しくは1%に等しく、
I2は、時間間隔13における第2の過渡信号の大きさにほぼ等しいか、又はI2は、時間間隔13における第2の過渡信号の大きさに等しいか、又はI2は、時間間隔13における第2の過渡信号の大きさ±10%、5%、若しくは1%に等しく、
I3は、時間間隔5における第2の過渡信号の大きさにほぼ等しいか、又はI3は、時間間隔5における第2の過渡信号の大きさに等しいか、又はI3時間間隔5における第2の過渡信号の大きさ±10%、5%、若しくは1%に等しく、
I4は、時間間隔3における第2の過渡信号の大きさにほぼ等しいか、又はI4は、時間間隔3における第2の過渡信号の大きさに等しいか、又はI4は、時間間隔3における第2の過渡信号の大きさ±10%、5%、若しくは1%に等しく、
I5は、時間間隔22における第2の過渡信号の大きさにほぼ等しいか、又はI5は、時間間隔22における第2の過渡信号の大きさに等しいか、又はI5は、時間間隔22における第2の過渡信号の大きさ±10%、5%、若しくは1%に等しく、
x1は、0.75にほぼ等しいか、又はx1は、0.75に等しいか、又はx1は、0.75±10%、5%、若しくは1%に等しく、
x2は、337.27にほぼ等しいか、又はx2は、337.27に等しいか、又はx2は、337.27±10%、5%、若しくは1%に等しく、
x3は、(−)16.81にほぼ等しいか、又はx3は、(−)16.81に等しいか、又はx3は、(−)16.81±10%、5%、若しくは1%に等しく、
x4は、1.41にほぼ等しいか、又はx4は、1.41に等しいか、又はx4は、1.41±10%、5%、若しくは1%に等しく、
x5は、2.67にほぼ等しいか、又はx5は、2.67に等しいか、又はx5は、2.67±10%、5%、若しくは1%に等しく、
又は、検体濃度の決定は、以下の形の式を用いることによって得ることができ、すなわち、
G represents the analyte concentration,
I 1 is approximately equal to the magnitude of the second transient signal in the
I 2 is approximately equal to the magnitude of the second transient signal in the
I 3 is approximately equal to the magnitude of the second transient signal at
I 4 is approximately equal to the magnitude of the second transient signal in the
I 5 is approximately equal to the magnitude of the second transient signal in the
x 1 is approximately equal to 0.75, or x 1 is equal to 0.75, or x 1 is equal to 0.75 ± 10%, 5%, or 1%,
x 2 is approximately equal to 337.27, or x 2 is equal to 337.27, or x 2 is equal to 337.27 ± 10%, 5%, or 1%;
x 3 is approximately equal to (−) 16.81, or x 3 is equal to (−) 16.81, or x 3 is (−) 16.81 ± 10%, 5%, or 1 Equal to%
x 4 is approximately equal to 1.41, or x 4 is equal to 1.41, or x 4 is equal to 1.41 ± 10%, 5%, or 1%;
x 5 is approximately equal to 2.67, or x 5 is equal to 2.67, or x 5 is equal to 2.67 ± 10%, 5%, or 1%;
Alternatively, determination of analyte concentration can be obtained by using an equation of the form:
Gは、検体濃度を表し、
I1は、時間間隔11における第2の過渡信号の大きさにほぼ等しいか、又はI1は、時間間隔11における第2の過渡信号の大きさに等しいか、又はI1は、時間間隔11における第2の過渡信号の大きさ±10%、5%、若しくは1%に等しく、
I2は、時間間隔7における第2の過渡信号の大きさにほぼ等しいか、又はI2は、時間間隔7における第2の過渡信号の大きさに等しいか、又はI2は、時間間隔7における第2の過渡信号の大きさ±10%、5%、若しくは1%に等しく、
x1は、0.59にほぼ等しいか、又はx1は、0.59に等しいか、又はx1は、0.59±10%、5%、若しくは1%に等しく、
x2は、2.51にほぼ等しいか、又はx2は、2.51に等しいか、又はx2は、2.51±10%、5%、若しくは1%に等しく、
x3は、(−)12.74にほぼ等しいか、又はx3は、(−)12.74に等しいか、又はx3は、(−)12.74±10%、5%、若しくは1%に等しく、
x4は、(−)188.31にほぼ等しいか、又はx4は、(−)188.31に等しいか、又はx4は、(−)188.31±10%、5%、若しくは1%に等しく、
x5は、9.2にほぼ等しいか、又はx5は、9.2に等しいか、又はx5は、9.2±10%、5%、若しくは1%に等しく、
又は、検体濃度の決定は、以下の形の式を用いることによって得ることができ、すなわち、
G represents the analyte concentration,
I 1 is approximately equal to the magnitude of the second transient signal in the time interval 11, or I 1 is equal to the magnitude of the second transient signal in the time interval 11, or I 1, the time interval 11 Equal to the magnitude of the second transient signal at ± 10%, 5%, or 1%,
I 2 is approximately equal to the magnitude of the second transient signal in the
x 1 is approximately equal to 0.59, or x 1 is equal to 0.59, or x 1 is equal to 0.59 ± 10%, 5%, or 1%;
x 2 is approximately equal to 2.51, or x 2 is equal to 2.51, or x 2 is equal to 2.51 ± 10%, 5%, or 1%,
x 3 is approximately equal to (−) 12.74, or x 3 is equal to (−) 12.74, or x 3 is (−) 12.74 ± 10%, 5%, or 1 Equal to%
x 4 is approximately equal to (−) 188.31, or x 4 is equal to (−) 188.31, or x 4 is (−) 188.31 ± 10%, 5%, or 1 Equal to%
x 5 is approximately equal to 9.2, or x 5 is equal to 9.2, or x 5 is equal to 9.2 ± 10%, 5%, or 1%,
Alternatively, determination of analyte concentration can be obtained by using an equation of the form:
Gは、検体濃度を表し、
I1は、時間間隔20における第2の過渡信号の大きさにほぼ等しいか、又はI1は、時間間隔20における第2の過渡信号の大きさに等しいか、又はI1は、時間間隔20における第2の過渡信号の大きさ±10%、5%、若しくは1%に等しく、
I2は、時間間隔22における第2の過渡信号の大きさにほぼ等しいか、又はI2は、時間間隔22における第2の過渡信号の大きさに等しいか、又はI2は、時間間隔22における第2の過渡信号の大きさ±10%、5%、若しくは1%に等しく、
I3は、時間間隔19における第2の過渡信号の大きさにほぼ等しいか、又はI3は、時間間隔19における第2の過渡信号の大きさに等しいか、又はI3は、時間間隔19における第2の過渡信号の大きさ±10%、5%、若しくは1%に等しく、
x1は、20.15にほぼ等しいか、又はx1は、20.15に等しいか、又はx1は、20.15±10%、5%、若しくは1%に等しく、
x2は、1.0446にほぼ等しいか、又はx2は、1.0446に等しいか、又はx2は、1.0446±10%、5%、若しくは1%に等しく、
x3は、0.95にほぼ等しいか、又はx3は、0.95に等しいか、又はx3は、0.95±10%、5%、若しくは1%に等しく、
x4は、1.39にほぼ等しいか、又はx4は、1.39に等しいか、又はx4は、1.39±10%、5%、若しくは1%に等しく、
x5は、(−)0.71にほぼ等しいか、又はx5は、(−)0.71に等しいか、又はx5は、(−)0.71±10%、5%、若しくは1%に等しく、
x6は、0.11にほぼ等しいか、又はx6は、0.11に等しいか、又はx6は、0.11±10%、5%、若しくは1%に等しく、
又は、検体濃度の決定は、以下の形の式を用いることによって得ることができ、すなわち、
G represents the analyte concentration,
I 1 is approximately equal to the magnitude of the second transient signal in the
I 2 is approximately equal to the magnitude of the second transient signal in the
I 3 is approximately equal to the magnitude of the second transient signal in the time interval 19, or I 3 is equal to the magnitude of the second transient signal in the time interval 19, or I 3, the time interval 19 Equal to the magnitude of the second transient signal at ± 10%, 5%, or 1%,
x 1 is approximately equal to 20.15, or x 1 is equal to 20.15, or x 1 is equal to 20.15 ± 10%, 5%, or 1%;
x 2 is approximately equal to 1.0446, or x 2 is equal to 1.0446, or x 2 is equal to 1.0446 ± 10%, 5%, or 1%;
x 3 is approximately equal to 0.95, or x 3 is equal to 0.95, or x 3 is equal to 0.95 ± 10%, 5%, or 1%,
x 4 is approximately equal to 1.39, or x 4 is equal to 1.39, or x 4 is equal to 1.39 ± 10%, 5%, or 1%;
x 5 is approximately equal to (−) 0.71, or x 5 is equal to (−) 0.71, or x 5 is (−) 0.71 ± 10%, 5%, or 1 Equal to%
x 6 is approximately equal to 0.11, or x 6 is equal to 0.11, or x 6 is equal to 0.11 ± 10%, 5%, or 1%;
Alternatively, determination of analyte concentration can be obtained by using an equation of the form:
Gは、検体濃度を表し、
I1は、時間間隔5における第2の過渡信号の大きさにほぼ等しいか、又はI1は、時間間隔5における第2の過渡信号の大きさに等しいか、又はI1は、時間間隔5における第2の過渡信号の大きさ±10%、5%、若しくは1%に等しく、
I2は、時間間隔1における第2の過渡信号の大きさにほぼ等しいか、又はI2は、時間間隔1における第2の過渡信号の大きさに等しいか、又はI2は、時間間隔1における第2の過渡信号の大きさ±10%、5%、若しくは1%に等しく、
I3は、時間間隔2における第2の過渡信号の大きさにほぼ等しいか、又はI3は、時間間隔2における第2の過渡信号の大きさに等しいか、又はI3は、時間間隔2における第2の過渡信号の大きさ±10%、5%、若しくは1%に等しく、
I4は、時間間隔10における第2の過渡信号の大きさにほぼ等しいか、又はI4は、時間間隔10における第2の過渡信号の大きさに等しいか、又はI4は、時間間隔10における第2の過渡信号の大きさ±10%、5%、若しくは1%に等しく、
I5は、時間間隔22における第2の過渡信号の大きさにほぼ等しいか、又はI5は、時間間隔22における第2の過渡信号の大きさに等しいか、又はI5は、時間間隔22における第2の過渡信号の大きさ±10%、5%、若しくは1%に等しく、
x1は、0.70にほぼ等しいか、又はx1は、0.70に等しいか、又はx1は、0.70±10%、5%、若しくは1%に等しく、
x2は、0.49にほぼ等しいか、又はx2は、0.49に等しいか、又はx2は、0.49±10%、5%、若しくは1%に等しく、
x3は、28.59にほぼ等しいか、又はx3は、28.59に等しいか、又はx3は、28.59±10%、5%、若しくは1%に等しく、
x4は、0.7にほぼ等しいか、又はx4は、0.7に等しいか、又はx4は、0.7±10%、5%、若しくは1%に等しく、
x5は、15.51にほぼ等しいか、又はx5は、15.51に等しいか、又はx5は、15.51±10%、5%、若しくは1%に等しく、
又は、検体濃度の決定は、以下の形の式を用いることによって得ることができ、すなわち、
G represents the analyte concentration,
I 1 is approximately equal to the magnitude of the second transient signal in the
I 2 is approximately equal to the magnitude of the second transient signal in the
I 3 is approximately equal to the magnitude of the second transient signal in the
I 4 is approximately equal to the magnitude of the second transient signal in the
I 5 is approximately equal to the magnitude of the second transient signal in the
x 1 is approximately equal to 0.70, or x 1 is equal to 0.70, or x 1 is equal to 0.70 ± 10%, 5%, or 1%;
x 2 is approximately equal to 0.49, or x 2 is equal to 0.49, or x 2 is equal to 0.49 ± 10%, 5%, or 1%;
x 3 is approximately equal to 28.59, or x 3 is equal to 28.59, or x 3 is equal to 28.59 ± 10%, 5%, or 1%;
x 4 is approximately equal to 0.7, or x 4 is equal to 0.7, or x 4 is equal to 0.7 ± 10%, 5%, or 1%;
x 5 is approximately equal to 15.51, or x 5 is equal to 15.51, or x 5 is equal to 15.51 ± 10%, 5%, or 1%,
Alternatively, determination of analyte concentration can be obtained by using an equation of the form:
Gは、検体濃度を表し、
I1は、時間間隔19における第2の過渡信号の大きさにほぼ等しいか、又はI1は、時間間隔19における第2の過渡信号の大きさに等しいか、又はI1は、時間間隔19における第2の過渡信号の大きさ±10%、5%、若しくは1%に等しく、
I2は、時間間隔16における第2の過渡信号の大きさにほぼ等しいか、又はI2は、時間間隔16における第2の過渡信号の大きさに等しいか、又はI2は、時間間隔16における第2の過渡信号の大きさ±10%、5%、若しくは1%に等しく、
I3は、時間間隔11における第2の過渡信号の大きさにほぼ等しいか、又はI3は、時間間隔11における第2の過渡信号の大きさに等しいか、又はI3は、時間間隔11における第2の過渡信号の大きさ±10%、5%、若しくは1%に等しく、
I4は、時間間隔5における第2の過渡信号の大きさにほぼ等しいか、又はI4は、時間間隔5における第2の過渡信号の大きさに等しいか、又はI4は、時間間隔5における第2の過渡信号の大きさ±10%、5%、若しくは1%に等しく、
x1は、(−)1.68にほぼ等しいか、又はx1は、(−)1.68に等しいか、又はx1は、(−)1.68±10%、5%、若しくは1%に等しく、
x2は、0.95にほぼ等しいか、又はx2は、0.95に等しいか、又はx2は、0.95±10%、5%、若しくは1%に等しく、
x3は、(−)4.97にほぼ等しいか、又はx3は、(−)4.97に等しいか、又はx3は、(−)4.97±10%、5%、若しくは1%に等しく、
x4は、6.29にほぼ等しいか、又はx4は、6.29に等しいか、又はx4は、6.29±10%、5%、若しくは1%に等しく、
x5は、3.08にほぼ等しいか、又はx5は、3.08に等しいか、又はx5は、3.08±10%、5%、若しくは1%に等しく、
x6は、(−)5.84にほぼ等しいか、又はx6は、(−)5.84に等しいか、又はx6は、(−)5.84±10%、5%、若しくは1%に等しく、
x7は、(−)0.47にほぼ等しいか、又はx7は、(−)0.47に等しいか、又はx7は、(−)0.47±10%、5%、若しくは1%に等しく、
x8は、0.01にほぼ等しいか、又はx8は、0.01に等しいか、又はx8は、0.01±10%、5%、若しくは1%に等しく、
又は、検体濃度の決定は、以下の形の式を用いることによって得ることができ、すなわち、
G represents the analyte concentration,
I 1 is approximately equal to the magnitude of the second transient signal in the time interval 19, or I 1 is equal to the magnitude of the second transient signal in the time interval 19, or I 1, the time interval 19 Equal to the magnitude of the second transient signal at ± 10%, 5%, or 1%,
I 2 is approximately equal to the magnitude of the second transient signal in the
I 3 is approximately equal to the magnitude of the second transient signal in the time interval 11, or I 3 is equal to the magnitude of the second transient signal in the time interval 11, or I 3, the time interval 11 Equal to the magnitude of the second transient signal at ± 10%, 5%, or 1%,
I 4 is approximately equal to the magnitude of the second transient signal in the
x 1 is approximately equal to (−) 1.68, or x 1 is equal to (−) 1.68, or x 1 is (−) 1.68 ± 10%, 5%, or 1 Is equal to
x 2 is approximately equal to 0.95, or x 2 is equal to 0.95, or x 2 is equal to 0.95 ± 10%, 5%, or 1%;
x 3 is approximately equal to (−) 4.97, or x 3 is equal to (−) 4.97, or x 3 is (−) 4.97 ± 10%, 5%, or 1 Is equal to
x 4 is approximately equal to 6.29, or x 4 is equal to 6.29, or x 4 is equal to 6.29 ± 10%, 5%, or 1%;
x 5 is approximately equal to 3.08, or x 5 is equal to 3.08, or x 5 is equal to 3.08 ± 10%, 5%, or 1%;
x 6 is approximately equal to (−) 5.84, or x 6 is equal to (−) 5.84, or x 6 is (−) 5.84 ± 10%, 5%, or 1 Is equal to
x 7 is approximately equal to (−) 0.47, or x 7 is equal to (−) 0.47, or x 7 is (−) 0.47 ± 10%, 5%, or 1 Is equal to
x 8 is approximately equal to 0.01, or x 8 is equal to 0.01, or x 8 is equal to 0.01 ± 10%, 5%, or 1%;
Alternatively, determination of analyte concentration can be obtained by using an equation of the form:
Gは、検体濃度を表し、
I1は、時間間隔16における第2の過渡信号の大きさにほぼ等しいか、又はI1は、時間間隔16における第2の過渡信号の大きさに等しいか、又はI1は、時間間隔16における第2の過渡信号の大きさ±10%、5%、若しくは1%に等しく、
I2は、時間間隔5における第2の過渡信号の大きさにほぼ等しいか、又はI2は、時間間隔5における第2の過渡信号の大きさに等しいか、又はI2は、時間間隔5における第2の過渡信号の大きさ±10%、5%、若しくは1%に等しく、
I3は、時間間隔12における第2の過渡信号の大きさにほぼ等しいか、又はI3は、時間間隔12における第2の過渡信号の大きさに等しいか、又はI3は、時間間隔12における第2の過渡信号の大きさ±10%、5%、若しくは1%に等しく、
I4は、時間間隔14における第2の過渡信号の大きさにほぼ等しいか、又はI4は、時間間隔14における第2の過渡信号の大きさに等しいか、又はI4は、時間間隔14における第2の過渡信号の大きさ±10%、5%、若しくは1%に等しく、
x1は、1.18にほぼ等しいか、又はx1は、1.18に等しいか、又はx1は、1.18±10%、5%、若しくは1%に等しく、
x2は、0.97にほぼ等しいか、又はx2は、0.97に等しいか、又はx2は、0.97±10%、5%、若しくは1%に等しく、
x3は、(−)11.32にほぼ等しいか、又はx3は、(−)11.32に等しいか、又はx3は、(−)11.32±10%、5%、若しくは1%に等しく、
x4は、38.76にほぼ等しいか、又はx4は、38.76に等しいか、又はx4は、38.76±10%、5%、若しくは1%に等しく、
x5は、(−)39.32にほぼ等しいか、又はx5は、(−)39.32に等しいか、又はx5は、(−)39.32±10%、5%、若しくは1%に等しく、
x6は、0.0928にほぼ等しいか、又はx6は、0.0928に等しいか、又はx6は、0.0928±10%、5%、若しくは1%に等しく、
x7は、(−)0.85にほぼ等しいか、又はx7は、(−)0.85に等しいか、又はx7は、(−)0.85±10%、5%、若しくは1%に等しく、
x8は、1.75にほぼ等しいか、又はx8は、1.75に等しいか、又はx8は、1.75±10%、5%、若しくは1%に等しく、
x9は、(−)9.38にほぼ等しいか、又はx9は、(−)9.38に等しいか、又はx9は、(−)9.38±10%、5%、若しくは1%に等しく、
x10は、0.25にほぼ等しいか、又はx10は、0.25に等しいか、又はx10は、0.25±.10%、5%、若しくは1%に等しい。
G represents the analyte concentration,
I 1 is approximately equal to the magnitude of the second transient signal in the
I 2 is approximately equal to the magnitude of the second transient signal in the
I 3 is approximately equal to the magnitude of the second transient signal in the
I 4 is approximately equal to the magnitude of the second transient signal in the
x 1 is approximately equal to 1.18, or x 1 is equal to 1.18, or x 1 is equal to 1.18 ± 10%, 5%, or 1%;
x 2 is approximately equal to 0.97, or x 2 is equal to 0.97, or x 2 is equal to 0.97 ± 10%, 5%, or 1%,
x 3 is approximately equal to (−) 11.32, or x 3 is equal to (−) 11.32, or x 3 is (−) 11.32 ± 10%, 5%, or 1 Equal to%
x 4 is approximately equal to 38.76, or x 4 is equal to 38.76, or x 4 is equal to 38.76 ± 10%, 5%, or 1%;
x 5 is approximately equal to (−) 39.32, or x 5 is equal to (−) 39.32, or x 5 is (−) 39.32 ± 10%, 5%, or 1 Equal to%
x 6 is approximately equal to 0.0928, or x 6 is equal to 0.0928, or x 6 is equal to 0.0928 ± 10%, 5%, or 1%;
x 7 is approximately equal to (−) 0.85, or x 7 is equal to (−) 0.85, or x 7 is (−) 0.85 ± 10%, 5%, or 1 Equal to%
x 8 is approximately equal to 1.75, or x 8 is equal to 1.75, or x 8 is equal to 1.75 ± 10%, 5%, or 1%;
x 9 is approximately equal to (−) 9.38, or x 9 is equal to (−) 9.38, or x 9 is (−) 9.38 ± 10%, 5%, or 1 Equal to%
x 10 is approximately equal to 0.25, or x 10 is equal to 0.25, or x 10 is 0.25 ±. Equal to 10%, 5%, or 1%.
これらの特徴のいずれにおいても、複数の前記別個の時間間隔のそれぞれにおける前記第2の過渡信号の大きさは、それぞれの時間間隔を通じてサンプリングされる信号の平均の大きさを含んでよく;前記第1の信号を印加する工程、及び前記第2の信号を流す工程は、連続した順序であってよく;前記第1の信号を印加する工程は、前記第2の信号を流す工程と重なり合ってよく;前記第1の信号を印加する工程は、前記試料に交流信号を適用することにより前記交流信号の出力から試料の物理的特性を決定することを含んでよく;前記第1の信号を印加する工程は、前記試料に光学信号を適用することにより前記光学信号の出力から試料の物理的特性を決定することを含んでよく;前記物理的特性はヘマトクリット値を含んでよく、前記検体はグルコースを含んでよく;前記物理的特性は、試料の粘性、ヘマトクリット値、温度、又は密度の少なくとも1つを含んでよく;前記適用する工程は、第1及び第2の交流信号を異なるそれぞれの周波数で流すことを含み、第1の周波数は第2の周波数よりも低い周波数を有してよく;前記第1の周波数は前記第2の周波数よりも少なくとも1桁低くてよく;前記第1の周波数は、約10kHz〜約250kHz、又は約10kHz〜約90kHzの範囲の任意の周波数を含んでよく;前記得る工程は、前記第1の過渡信号から、前記第2のサンプリング持続時間に対して参照される第2の過渡信号を抽出することを含んでよく;前記得る工程は、第1の過渡信号から、第2のサンプリング持続時間の外側の信号を除去することによって第2のサンプリング持続時間内に第2の過渡信号を残すことを含んでよく;前記導出する工程は、前記第2のサンプリング持続時間内のそれぞれの別個の時間間隔について前記第2の過渡信号の大きさを保存することを含んでよい。 In any of these features, the magnitude of the second transient signal in each of the plurality of distinct time intervals may include an average magnitude of the signal sampled over each time interval; Applying the first signal and flowing the second signal may be in a sequential order; applying the first signal may overlap the flowing second signal. Applying the first signal may include determining a physical property of the sample from the output of the AC signal by applying an AC signal to the sample; applying the first signal; The step may include determining a physical property of the sample from the output of the optical signal by applying an optical signal to the sample; the physical property may include a hematocrit value, The body may include glucose; the physical property may include at least one of sample viscosity, hematocrit, temperature, or density; and the applying step differs between the first and second alternating signals The first frequency may have a lower frequency than the second frequency; the first frequency may be at least an order of magnitude lower than the second frequency; The frequency of 1 may include any frequency in the range of about 10 kHz to about 250 kHz, or about 10 kHz to about 90 kHz; the obtaining step may be performed from the first transient signal to the second sampling duration. Extracting the second transient signal referenced in the above; the obtaining step includes removing a signal outside the second sampling duration from the first transient signal. Leaving a second transient signal within a second sampling duration; the deriving step may include the second transient signal for each distinct time interval within the second sampling duration. Containing the size may be included.
第5の態様では、バイオセンサと検体計測器をを有する検体分析システムが提供される。バイオセンサは、基板と、それぞれの電極コネクタに接続される複数の電極とを有する。検体計測器は、ハウジングと、前記バイオセンサの前記それぞれの電極コネクタに接続されるように構成されたバイオセンサポートコネクタとを有する。計測器は、検査シーケンスの間に前記複数の電極に電気信号を印加するか又は複数の電極からの電気信号を検知するために前記バイオセンサポートコネクタと電気的に導通したマイクロプロセッサを更に有する。マイクロプロセッサは、(a)前記複数の電極に第1の信号を印加することにより、特定のサンプリング時間を与えるための試料の物理的特性を導出し、(b)前記複数の電極に第2の信号を印加し、(c)前記複数の電極からの第1の過渡出力信号を測定し、(d)前記第1の出力信号から第2の過渡出力信号を抽出し、(e)複数の別個の時間間隔にわたって第2の過渡出力信号の大きさを決定し、(f)複数の前記別個の時間間隔の選択された時間間隔における前記第2の過渡出力信号の大きさから検体濃度を計算するように構成される。 In a fifth aspect, a sample analysis system having a biosensor and a sample measuring instrument is provided. The biosensor has a substrate and a plurality of electrodes connected to each electrode connector. The analyte measuring instrument has a housing and a biosensor port connector configured to be connected to the respective electrode connector of the biosensor. The instrument further includes a microprocessor in electrical communication with the biosensor port connector to apply an electrical signal to the plurality of electrodes or to detect an electrical signal from the plurality of electrodes during a test sequence. The microprocessor (a) derives a physical property of the sample to give a specific sampling time by applying a first signal to the plurality of electrodes, and (b) a second is applied to the plurality of electrodes. Applying a signal; (c) measuring a first transient output signal from the plurality of electrodes; (d) extracting a second transient output signal from the first output signal; and (e) a plurality of discrete signals. A second transient output signal magnitude over a plurality of time intervals, and (f) calculating an analyte concentration from the second transient output signal magnitude at a selected time interval of the plurality of distinct time intervals. Configured as follows.
第6の態様では、検査ストリップと検体計測器とを有する検体測定システムが提供される。検査ストリップは、基板と、基板上に配置され、それぞれの電極コネクタに接続された複数の電極とを有する。検体計測器は、ハウジングと、前記検査ストリップの前記それぞれの電極コネクタに接続されるように構成された検査ストリップポートコネクタとを有する。計測器は、検査シーケンスの間に前記複数の電極に電気信号を印加するか又は複数の電極からの電気信号を検知するために前記検査ストリップポートコネクタと電気的に導通したマイクロプロセッサを更に有する。マイクロプロセッサは、検査シーケンスの間に前記複数の電極に電気信号を印加するか又は前記複数の電極からの電気信号を検知するように前記検査ストリップポートコネクタと電気的に導通しており、マイクロプロセッサは、(a)前記複数の電極に第1の信号を印加することにより、特定のサンプリング時間を与えるための物理的特性を導出し、(b)前記複数の電極に第2の信号を印加し、(c)前記複数の電極からの第1の過渡出力信号を測定し、(d)前記第1の出力信号から第2の過渡出力信号を抽出し、(e)複数の別個の時間間隔にわたって前記第2の過渡出力信号の大きさを決定し、(f)複数の前記別個の時間間隔の内の選択された時間間隔において、前記第2の過渡出力信号の大きさから検体濃度を計算することにより、検査シーケンスの開始の約10秒以内に検体濃度を告知するように構成される。 In a sixth aspect, an analyte measurement system having a test strip and an analyte measuring instrument is provided. The test strip has a substrate and a plurality of electrodes disposed on the substrate and connected to respective electrode connectors. The analyte meter has a housing and a test strip port connector configured to be connected to the respective electrode connector of the test strip. The instrument further includes a microprocessor in electrical communication with the test strip port connector to apply an electrical signal to the plurality of electrodes or to detect an electrical signal from the plurality of electrodes during a test sequence. The microprocessor is in electrical communication with the test strip port connector to apply an electrical signal to the plurality of electrodes or to detect an electrical signal from the plurality of electrodes during a test sequence; (A) deriving physical characteristics for giving a specific sampling time by applying a first signal to the plurality of electrodes, and (b) applying a second signal to the plurality of electrodes. (C) measuring a first transient output signal from the plurality of electrodes; (d) extracting a second transient output signal from the first output signal; and (e) over a plurality of distinct time intervals. Determining a magnitude of the second transient output signal, and (f) calculating an analyte concentration from the magnitude of the second transient output signal in a selected time interval of the plurality of distinct time intervals. By Configured to announce analyte concentration within about 10 seconds of the start of the test sequence.
第7の態様では、ハウジングと、検査ストリップのそれぞれの電極コネクタに接続されるように構成された検査ストリップポートコネクタとを有する検体計測器が提供される。計測器は、検査シーケンスの間に前記検査ストリップの複数の電極に電気信号を印加するか又は複数の電極からの電気信号を検知するために前記検査ストリップポートコネクタと電気的に導通したマイクロプロセッサを更に有する。マイクロプロセッサは、(a)前記複数の電極に第1の信号を印加することにより、特定のサンプリング時間を与えるための試料の物理的特性を導出し、(b)前記複数の電極に第2の信号を印加し、(c)前記複数の電極からの第1の過渡出力信号を測定し、(d)前記第1の出力信号から第2の過渡出力信号を抽出し、(e)複数の別個の時間間隔にわたって第2の過渡出力信号の大きさを決定し、(f)複数の前記別個の時間間隔の選択された時間間隔における前記第2の過渡出力信号の大きさから検体濃度を計算するように構成される。 In a seventh aspect, an analyte meter is provided having a housing and a test strip port connector configured to be connected to a respective electrode connector of the test strip. The instrument includes a microprocessor in electrical communication with the test strip port connector to apply electrical signals to or detect electrical signals from the plurality of electrodes during the test sequence. Also have. The microprocessor (a) derives a physical property of the sample to give a specific sampling time by applying a first signal to the plurality of electrodes, and (b) a second is applied to the plurality of electrodes. Applying a signal; (c) measuring a first transient output signal from the plurality of electrodes; (d) extracting a second transient output signal from the first output signal; and (e) a plurality of discrete signals. A second transient output signal magnitude over a plurality of time intervals, and (f) calculating an analyte concentration from the second transient output signal magnitude at a selected time interval of the plurality of distinct time intervals. Configured as follows.
第5、第6、及び第7の態様のいずれにおいても、以下の特徴を上記の態様と組み合わせて用いることができる。例えば、前記複数の電極は、物理的特性を測定するための少なくとも2つの電極、及び検体濃度を測定するための少なくとも2つの他の電極を有してよく;前記少なくとも2つの電極及び前記少なくとも2つの他の電極は、前記基板上に設けられた同じチャンバ内に配置されてよく;前記少なくとも2つの電極及び前記少なくとも2つの他の電極は、前記基板上に設けられた異なるチャンバ内に配置されてもよく;前記少なくとも2つの電極は、物理的特性及び検体濃度を測定するための2つの電極を含んでよく;前記複数の電極は、物理的特性及び検体濃度を測定するための2つの電極を含んでよく;電極のすべてが前記基板によって規定される同じ平面上に配置されてもよく;前記少なくとも2つの他の電極に近接して試薬が配置され、前記少なくとも2つの電極上に試薬が配置されなくともよく;複数の前記別個の時間間隔は少なくとも22個の別個の時間間隔を含んでよく;前記特定のサンプリング時間は、以下の形の式を用いて計算することができる。すなわち、 In any of the fifth, sixth, and seventh aspects, the following features can be used in combination with the above aspects. For example, the plurality of electrodes may comprise at least two electrodes for measuring physical properties and at least two other electrodes for measuring analyte concentration; the at least two electrodes and the at least two Two other electrodes may be disposed in the same chamber provided on the substrate; the at least two electrodes and the at least two other electrodes are disposed in different chambers provided on the substrate. The at least two electrodes may include two electrodes for measuring physical properties and analyte concentration; and the plurality of electrodes include two electrodes for measuring physical properties and analyte concentration All of the electrodes may be disposed on the same plane defined by the substrate; a reagent is disposed proximate to the at least two other electrodes; The reagent may not be disposed on the at least two electrodes; the plurality of separate time intervals may include at least 22 separate time intervals; the specific sampling time uses an equation of the form Can be calculated. That is,
特定のサンプリング時間=x1Hx2+x3
式中、
「特定のサンプリング時間」は、バイオセンサの出力信号をサンプリングする検査シーケンスの開始からの時点として指定され、
Hは、試料の物理的特性を表し、
x1は、約4.3e5を表すか、又は4.3e5に等しいか、又は4.3e5の与えられた数値の±10%、5%、若しくは1%に等しく、
x2は、約(−)3.9を表すか、又は−3.9に等しいか、又は−3.9の与えられた数値の±10%、5%、若しくは1%に等しく、
x3は、約4.8を表すか、又は−3.9に等しいか、又は−3.9の与えられた数値の±10%、5%、若しくは1%に等しい。
Specific sampling time = x 1 H x 2 + x 3
Where
The “specific sampling time” is designated as the point in time from the start of the test sequence that samples the biosensor output signal,
H represents the physical properties of the sample,
x 1 represents about 4.3e5, or equals 4.3e5, or equals ± 10%, 5%, or 1% of a given numerical value of 4.3e5;
x 2 represents about (−) 3.9, or equal to −3.9, or equal to ± 10%, 5%, or 1% of a given numerical value of −3.9,
x 3 either represents about 4.8, or equal to -3.9, or ± 10% of the numerical value given -3.9, equal to 5%, or 1%.
上記に示したように、他の特徴を、第5、第6、及び第7の態様とともに用いることもできる。例えば、マイクロプロセッサは、以下の形の式により検体濃度を計算することができる。すなわち、 As indicated above, other features can also be used with the fifth, sixth, and seventh aspects. For example, the microprocessor can calculate the analyte concentration according to an equation of the form: That is,
Gは、検体濃度を表し、
I1は、時間間隔17における第2の過渡信号の大きさにほぼ等しいか、又はI1は、時間間隔17における第2の過渡信号の大きさに等しいか、又はI1は、時間間隔17における第2の過渡信号の大きさ±10%、5%、若しくは1%に等しく、
I2は、時間間隔13における第2の過渡信号の大きさにほぼ等しいか、又はI2は、時間間隔13における第2の過渡信号の大きさに等しいか、又はI2は、時間間隔13における第2の過渡信号の大きさ±10%、5%、若しくは1%に等しく、
I3は、時間間隔5における第2の過渡信号の大きさにほぼ等しいか、又はI3は、時間間隔5における第2の過渡信号の大きさに等しいか、又はI3時間間隔5における第2の過渡信号の大きさ±10%、5%、若しくは1%に等しく、
I4は、時間間隔3における第2の過渡信号の大きさにほぼ等しいか、又はI4は、時間間隔3における第2の過渡信号の大きさに等しいか、又はI4は、時間間隔3における第2の過渡信号の大きさ±10%、5%、若しくは1%に等しく、
I5は、時間間隔22における第2の過渡信号の大きさにほぼ等しいか、又はI5は、時間間隔22における第2の過渡信号の大きさに等しいか、又はI5は、時間間隔22における第2の過渡信号の大きさ±10%、5%、若しくは1%に等しく、
x1は、0.75にほぼ等しいか、又はx1は、0.75に等しいか、又はx1は、0.75±10%、5%、若しくは1%に等しく、
x2は、337.27にほぼ等しいか、又はx2は、337.27に等しいか、又はx2は、337.27±10%、5%、若しくは1%に等しく、
x3は、(−)16.81にほぼ等しいか、又はx3は、(−)16.81に等しいか、又はx3は、(−)16.81±10%、5%、若しくは1%に等しく、
x4は、1.41にほぼ等しいか、又はx4は、1.41に等しいか、又はx4は、1.41±10%、5%、若しくは1%に等しく、
x5は、2.67にほぼ等しいか、又はx5は、2.67に等しいか、又はx5は、2.67±10%、5%、若しくは1%に等しい。
G represents the analyte concentration,
I 1 is approximately equal to the magnitude of the second transient signal in the
I 2 is approximately equal to the magnitude of the second transient signal in the
I 3 is approximately equal to the magnitude of the second transient signal at
I 4 is approximately equal to the magnitude of the second transient signal in the
I 5 is approximately equal to the magnitude of the second transient signal in the
x 1 is approximately equal to 0.75, or x 1 is equal to 0.75, or x 1 is equal to 0.75 ± 10%, 5%, or 1%,
x 2 is approximately equal to 337.27, or x 2 is equal to 337.27, or x 2 is equal to 337.27 ± 10%, 5%, or 1%;
x 3 is approximately equal to (−) 16.81, or x 3 is equal to (−) 16.81, or x 3 is (−) 16.81 ± 10%, 5%, or 1 Equal to%
x 4 is approximately equal to 1.41, or x 4 is equal to 1.41, or x 4 is equal to 1.41 ± 10%, 5%, or 1%;
x 5 is approximately equal to 2.67, or x 5 is equal to 2.67, or x 5 is 2.67 ± 10% equal to 5%, or 1%.
別の例として、マイクロプロセッサは、以下の形の式により検体濃度を計算することもできる。すなわち、 As another example, the microprocessor can calculate the analyte concentration according to an equation of the form: That is,
Gは、検体濃度を表し、
I1は、時間間隔11における第2の過渡信号の大きさにほぼ等しいか、又はI1は、時間間隔11における第2の過渡信号の大きさに等しいか、又はI1は、時間間隔11における第2の過渡信号の大きさ±10%、5%、若しくは1%に等しく、
I2は、時間間隔7における第2の過渡信号の大きさにほぼ等しいか、又はI2は、時間間隔7における第2の過渡信号の大きさに等しいか、又はI2は、時間間隔7における第2の過渡信号の大きさ±10%、5%、若しくは1%に等しく、
x1は、0.59にほぼ等しいか、又はx1は、0.59に等しいか、又はx1は、0.59±10%、5%、若しくは1%に等しく、
x2は、2.51にほぼ等しいか、又はx2は、2.51に等しいか、又はx2は、2.51±10%、5%、若しくは1%に等しく、
x3は、(−)12.74にほぼ等しいか、又はx3は、(−)12.74に等しいか、又はx3は、(−)12.74±10%、5%、若しくは1%に等しく、
x4は、(−)188.31にほぼ等しいか、又はx4は、(−)188.31に等しいか、又はx4は、(−)188.31±10%、5%、若しくは1%に等しく、
x5は、9.2にほぼ等しいか、又はx5は、9.2に等しいか、又はx5は、9.2±10%、5%、若しくは1%に等しい。
G represents the analyte concentration,
I 1 is approximately equal to the magnitude of the second transient signal in the time interval 11, or I 1 is equal to the magnitude of the second transient signal in the time interval 11, or I 1, the time interval 11 Equal to the magnitude of the second transient signal at ± 10%, 5%, or 1%,
I 2 is approximately equal to the magnitude of the second transient signal in the
x 1 is approximately equal to 0.59, or x 1 is equal to 0.59, or x 1 is equal to 0.59 ± 10%, 5%, or 1%;
x 2 is approximately equal to 2.51, or x 2 is equal to 2.51, or x 2 is equal to 2.51 ± 10%, 5%, or 1%,
x 3 is approximately equal to (−) 12.74, or x 3 is equal to (−) 12.74, or x 3 is (−) 12.74 ± 10%, 5%, or 1 Equal to%
x 4 is approximately equal to (−) 188.31, or x 4 is equal to (−) 188.31, or x 4 is (−) 188.31 ± 10%, 5%, or 1 Equal to%
x 5 is approximately equal to 9.2, or x 5 is equal to 9.2, or x 5 is equal to 9.2 ± 10%, 5%, or 1%.
別の例において、マイクロプロセッサは、以下の形の式により検体濃度を計算することもできる。すなわち、 In another example, the microprocessor may calculate the analyte concentration according to an equation of the form That is,
I1は、時間間隔20における第2の過渡信号の大きさにほぼ等しいか、又はI1は、時間間隔20における第2の過渡信号の大きさに等しいか、又はI1は、時間間隔20における第2の過渡信号の大きさ±10%、5%、若しくは1%に等しく、
I2は、時間間隔22における第2の過渡信号の大きさにほぼ等しいか、又はI2は、時間間隔22における第2の過渡信号の大きさに等しいか、又はI2は、時間間隔22における第2の過渡信号の大きさ±10%、5%、若しくは1%に等しく、
I3は、時間間隔19における第2の過渡信号の大きさにほぼ等しいか、又はI3は、時間間隔19における第2の過渡信号の大きさに等しいか、又はI3は、時間間隔19における第2の過渡信号の大きさ±10%、5%、若しくは1%に等しく、
x1は、20.15にほぼ等しいか、又はx1は、20.15に等しいか、又はx1は、20.15±10%、5%、若しくは1%に等しく、
x2は、1.0446にほぼ等しいか、又はx2は、1.0446に等しいか、又はx2は、1.0446±10%、5%、若しくは1%に等しく、
x3は、0.95にほぼ等しいか、又はx3は、0.95に等しいか、又はx3は、0.95±10%、5%、若しくは1%に等しく、
x4は、1.39にほぼ等しいか、又はx4は、1.39に等しいか、又はx4は、1.39±10%、5%、若しくは1%に等しく、
x5は、(−)0.71にほぼ等しいか、又はx5は、(−)0.71に等しいか、又はx5は、(−)0.71±10%、5%、若しくは1%に等しく、
x6は、0.11にほぼ等しいか、又はx6は、0.11に等しいか、又はx6は、0.11±10%、5%、若しくは1%に等しい。
I 1 is approximately equal to the magnitude of the second transient signal in the
I 2 is approximately equal to the magnitude of the second transient signal in the
I 3 is approximately equal to the magnitude of the second transient signal in the time interval 19, or I 3 is equal to the magnitude of the second transient signal in the time interval 19, or I 3, the time interval 19 Equal to the magnitude of the second transient signal at ± 10%, 5%, or 1%,
x 1 is approximately equal to 20.15, or x 1 is equal to 20.15, or x 1 is equal to 20.15 ± 10%, 5%, or 1%;
x 2 is approximately equal to 1.0446, or x 2 is equal to 1.0446, or x 2 is equal to 1.0446 ± 10%, 5%, or 1%;
x 3 is approximately equal to 0.95, or x 3 is equal to 0.95, or x 3 is equal to 0.95 ± 10%, 5%, or 1%,
x 4 is approximately equal to 1.39, or x 4 is equal to 1.39, or x 4 is equal to 1.39 ± 10%, 5%, or 1%;
x 5 is approximately equal to (−) 0.71, or x 5 is equal to (−) 0.71, or x 5 is (−) 0.71 ± 10%, 5%, or 1 Equal to%
x 6 is approximately equal to 0.11, or x 6 is equal to 0.11, or x 6 is equal to 0.11 ± 10%, 5%, or 1%.
また、マイクロプロセッサは、以下の形の式により検体濃度を計算することもできる。すなわち、 The microprocessor can also calculate the analyte concentration according to the following formula. That is,
Gは、検体濃度を表し、
I1は、時間間隔5における第2の過渡信号の大きさにほぼ等しいか、又はI1は、時間間隔5における第2の過渡信号の大きさに等しいか、又はI1は、時間間隔5における第2の過渡信号の大きさ±10%、5%、若しくは1%に等しく、
I2は、時間間隔1における第2の過渡信号の大きさにほぼ等しいか、又はI2は、時間間隔1における第2の過渡信号の大きさに等しいか、又はI2は、時間間隔1における第2の過渡信号の大きさ±10%、5%、若しくは1%に等しく、
I3は、時間間隔2における第2の過渡信号の大きさにほぼ等しいか、又はI3は、時間間隔2における第2の過渡信号の大きさに等しいか、又はI3は、時間間隔2における第2の過渡信号の大きさ±10%、5%、若しくは1%に等しく、
I4は、時間間隔10における第2の過渡信号の大きさにほぼ等しいか、又はI4は、時間間隔10における第2の過渡信号の大きさに等しいか、又はI4は、時間間隔10における第2の過渡信号の大きさ±10%、5%、若しくは1%に等しく、
I5は、時間間隔22における第2の過渡信号の大きさにほぼ等しいか、又はI5は、時間間隔22における第2の過渡信号の大きさに等しいか、又はI5は、時間間隔22における第2の過渡信号の大きさ±10%、5%、若しくは1%に等しく、
x1は、0.70にほぼ等しいか、又はx1は、0.70に等しいか、又はx1は、0.70±10%、5%、若しくは1%に等しく、
x2は、0.49にほぼ等しいか、又はx2は、0.49に等しいか、又はx2は、0.49±10%、5%、若しくは1%に等しく、
x3は、28.59にほぼ等しいか、又はx3は、28.59に等しいか、又はx3は、28.59±10%、5%、若しくは1%に等しく、
x4は、0.7にほぼ等しいか、又はx4は、0.7に等しいか、又はx4は、0.7±10%、5%、若しくは1%に等しく、
x5は、15.51にほぼ等しいか、又はx5は、15.51に等しいか、又はx5は、15.51±10%、5%、若しくは1%に等しく、
又は、マイクロプロセッサは、以下の形の式によって検体濃度を計算する。すなわち、
G represents the analyte concentration,
I 1 is approximately equal to the magnitude of the second transient signal in the
I 2 is approximately equal to the magnitude of the second transient signal in the
I 3 is approximately equal to the magnitude of the second transient signal in the
I 4 is approximately equal to the magnitude of the second transient signal in the
I 5 is approximately equal to the magnitude of the second transient signal in the
x 1 is approximately equal to 0.70, or x 1 is equal to 0.70, or x 1 is equal to 0.70 ± 10%, 5%, or 1%;
x 2 is approximately equal to 0.49, or x 2 is equal to 0.49, or x 2 is equal to 0.49 ± 10%, 5%, or 1%;
x 3 is approximately equal to 28.59, or x 3 is equal to 28.59, or x 3 is equal to 28.59 ± 10%, 5%, or 1%;
x 4 is approximately equal to 0.7, or x 4 is equal to 0.7, or x 4 is equal to 0.7 ± 10%, 5%, or 1%;
x 5 is approximately equal to 15.51, or x 5 is equal to 15.51, or x 5 is equal to 15.51 ± 10%, 5%, or 1%,
Alternatively, the microprocessor calculates the analyte concentration according to an equation of the form That is,
Gは、検体濃度を表し、
I1は、時間間隔19における第2の過渡信号の大きさにほぼ等しいか、又はI1は、時間間隔19における第2の過渡信号の大きさに等しいか、又はI1は、時間間隔19における第2の過渡信号の大きさ±10%、5%、若しくは1%に等しく、
I2は、時間間隔16における第2の過渡信号の大きさにほぼ等しいか、又はI2は、時間間隔16における第2の過渡信号の大きさに等しいか、又はI2は、時間間隔16における第2の過渡信号の大きさ±10%、5%、若しくは1%に等しく、
I3は、時間間隔11における第2の過渡信号の大きさにほぼ等しいか、又はI3は、時間間隔11における第2の過渡信号の大きさに等しいか、又はI3は、時間間隔11における第2の過渡信号の大きさ±10%、5%、若しくは1%に等しく、
I4は、時間間隔5における第2の過渡信号の大きさにほぼ等しいか、又はI4は、時間間隔5における第2の過渡信号の大きさに等しいか、又はI4は、時間間隔5における第2の過渡信号の大きさ±10%、5%、若しくは1%に等しく、
x1は、(−)1.68にほぼ等しいか、又はx1は、(−)1.68に等しいか、又はx1は、(−)1.68±10%、5%、若しくは1%に等しく、
x2は、0.95にほぼ等しいか、又はx2は、0.95に等しいか、又はx2は、0.95±10%、5%、若しくは1%に等しく、
x3は、(−)4.97にほぼ等しいか、又はx3は、(−)4.97に等しいか、又はx3は、(−)4.97±10%、5%、若しくは1%に等しく、
x4は、6.29にほぼ等しいか、又はx4は、6.29に等しいか、又はx4は、6.29±10%、5%、若しくは1%に等しく、
x5は、3.08にほぼ等しいか、又はx5は、3.08に等しいか、又はx5は、3.08±10%、5%、若しくは1%に等しく、
x6は、(−)5.84にほぼ等しいか、又はx6は、(−)5.84に等しいか、又はx6は、(−)5.84±10%、5%、若しくは1%に等しく、
x7は、(−)0.47にほぼ等しいか、又はx7は、(−)0.47に等しいか、又はx7は、(−)0.47±10%、5%、若しくは1%に等しく、
x8は、0.01にほぼ等しいか、又はx8は、0.01に等しいか、又はx8は、0.01±10%、5%、若しくは1%に等しく、
又は、マイクロプロセッサは、以下の形の式によって検体濃度を計算する。すなわち、
G represents the analyte concentration,
I 1 is approximately equal to the magnitude of the second transient signal in the time interval 19, or I 1 is equal to the magnitude of the second transient signal in the time interval 19, or I 1, the time interval 19 Equal to the magnitude of the second transient signal at ± 10%, 5%, or 1%,
I 2 is approximately equal to the magnitude of the second transient signal in the
I 3 is approximately equal to the magnitude of the second transient signal in the time interval 11, or I 3 is equal to the magnitude of the second transient signal in the time interval 11, or I 3, the time interval 11 Equal to the magnitude of the second transient signal at ± 10%, 5%, or 1%,
I 4 is approximately equal to the magnitude of the second transient signal in the
x 1 is approximately equal to (−) 1.68, or x 1 is equal to (−) 1.68, or x 1 is (−) 1.68 ± 10%, 5%, or 1 Is equal to
x 2 is approximately equal to 0.95, or x 2 is equal to 0.95, or x 2 is equal to 0.95 ± 10%, 5%, or 1%;
x 3 is approximately equal to (−) 4.97, or x 3 is equal to (−) 4.97, or x 3 is (−) 4.97 ± 10%, 5%, or 1 Is equal to
x 4 is approximately equal to 6.29, or x 4 is equal to 6.29, or x 4 is equal to 6.29 ± 10%, 5%, or 1%;
x 5 is approximately equal to 3.08, or x 5 is equal to 3.08, or x 5 is equal to 3.08 ± 10%, 5%, or 1%;
x 6 is approximately equal to (−) 5.84, or x 6 is equal to (−) 5.84, or x 6 is (−) 5.84 ± 10%, 5%, or 1 Is equal to
x 7 is approximately equal to (−) 0.47, or x 7 is equal to (−) 0.47, or x 7 is (−) 0.47 ± 10%, 5%, or 1 Is equal to
x 8 is approximately equal to 0.01, or x 8 is equal to 0.01, or x 8 is equal to 0.01 ± 10%, 5%, or 1%;
Alternatively, the microprocessor calculates the analyte concentration according to an equation of the form That is,
Gは、検体濃度を表し、
I1は、時間間隔16における第2の過渡信号の大きさにほぼ等しいか、又はI1は、時間間隔16における第2の過渡信号の大きさに等しいか、又はI1は、時間間隔16における第2の過渡信号の大きさ±10%、5%、若しくは1%に等しく、
I2は、時間間隔5における第2の過渡信号の大きさにほぼ等しいか、又はI2は、時間間隔5における第2の過渡信号の大きさに等しいか、又はI2は、時間間隔5における第2の過渡信号の大きさ±10%、5%、若しくは1%に等しく、
I3は、時間間隔12における第2の過渡信号の大きさにほぼ等しいか、又はI3は、時間間隔12における第2の過渡信号の大きさに等しいか、又はI3は、時間間隔12における第2の過渡信号の大きさ±10%、5%、若しくは1%に等しく、
I4は、時間間隔14における第2の過渡信号の大きさにほぼ等しいか、又はI4は、時間間隔14における第2の過渡信号の大きさに等しいか、又はI4は、時間間隔14における第2の過渡信号の大きさ±10%、5%、若しくは1%に等しく、
x1は、1.18にほぼ等しいか、又はx1は、1.18に等しいか、又はx1は、1.18±10%、5%、若しくは1%に等しく、
x2は、0.97にほぼ等しいか、又はx2は、0.97に等しいか、又はx2は、0.97±10%、5%、若しくは1%に等しく、
x3は、(−)11.32にほぼ等しいか、又はx3は、(−)11.32に等しいか、又はx3は、(−)11.32±10%、5%、若しくは1%に等しく、
x4は、38.76にほぼ等しいか、又はx4は、38.76に等しいか、又はx4は、38.76±10%、5%、若しくは1%に等しく、
x5は、(−)39.32にほぼ等しいか、又はx5は、(−)39.32に等しいか、又はx5は、(−)39.32±10%、5%、若しくは1%に等しく、
x6は、0.0928にほぼ等しいか、又はx6は、0.0928に等しいか、又はx6は、0.0928±10%、5%、若しくは1%に等しく、
x7は、(−)0.85にほぼ等しいか、又はx7は、(−)0.85に等しいか、又はx7は、(−)0.85±10%、5%、若しくは1%に等しく、
x8は、1.75にほぼ等しいか、又はx8は、1.75に等しいか、又はx8は、1.75±10%、5%、若しくは1%に等しく、
x9は、(−)9.38にほぼ等しいか、又はx9は、(−)9.38に等しいか、又はx9は、(−)9.38±10%、5%、若しくは1%に等しく、
x10は、0.25にほぼ等しいか、又はx10は、0.25に等しいか、又はx10は、0.25±.10%、5%、若しくは1%に等しい。
G represents the analyte concentration,
I 1 is approximately equal to the magnitude of the second transient signal in the
I 2 is approximately equal to the magnitude of the second transient signal in the
I 3 is approximately equal to the magnitude of the second transient signal in the
I 4 is approximately equal to the magnitude of the second transient signal in the
x 1 is approximately equal to 1.18, or x 1 is equal to 1.18, or x 1 is equal to 1.18 ± 10%, 5%, or 1%;
x 2 is approximately equal to 0.97, or x 2 is equal to 0.97, or x 2 is equal to 0.97 ± 10%, 5%, or 1%,
x 3 is approximately equal to (−) 11.32, or x 3 is equal to (−) 11.32, or x 3 is (−) 11.32 ± 10%, 5%, or 1 Equal to%
x 4 is approximately equal to 38.76, or x 4 is equal to 38.76, or x 4 is equal to 38.76 ± 10%, 5%, or 1%;
x 5 is approximately equal to (−) 39.32, or x 5 is equal to (−) 39.32, or x 5 is (−) 39.32 ± 10%, 5%, or 1 Equal to%
x 6 is approximately equal to 0.0928, or x 6 is equal to 0.0928, or x 6 is equal to 0.0928 ± 10%, 5%, or 1%;
x 7 is approximately equal to (−) 0.85, or x 7 is equal to (−) 0.85, or x 7 is (−) 0.85 ± 10%, 5%, or 1 Equal to%
x 8 is approximately equal to 1.75, or x 8 is equal to 1.75, or x 8 is equal to 1.75 ± 10%, 5%, or 1%;
x 9 is approximately equal to (−) 9.38, or x 9 is equal to (−) 9.38, or x 9 is (−) 9.38 ± 10%, 5%, or 1 Equal to%
x 10 is approximately equal to 0.25, or x 10 is equal to 0.25, or x 10 is 0.25 ±. Equal to 10%, 5%, or 1%.
更なる特徴を、第5、第6、及び第7の態様とともに用いることもできる。例えば、複数の前記別個の時間間隔のそれぞれにおける前記第2の過渡信号の大きさは、それぞれの時間間隔を通じてサンプリングされる信号の平均の大きさを含んでよく;マイクロプロセッサにより計算される複数の検体濃度間の誤差は、30%ヘマトクリット値における基準値と比較して±15%未満であってよく;マイクロプロセッサにより計算される複数の検体濃度間の誤差は、42%ヘマトクリット値における基準値と比較して±15%未満であってよく;マイクロプロセッサにより計算される複数の検体濃度間の誤差は、55%ヘマトクリット値における基準値と比較して±15%未満でよい。 Additional features can also be used with the fifth, sixth, and seventh aspects. For example, the magnitude of the second transient signal in each of the plurality of distinct time intervals may include an average magnitude of the signal sampled over each time interval; The error between analyte concentrations may be less than ± 15% compared to the reference value at 30% hematocrit; the error between multiple analyte concentrations calculated by the microprocessor is the same as the reference value at 42% hematocrit. The difference between the analyte concentrations calculated by the microprocessor may be less than ± 15% compared to the reference value at the 55% hematocrit value.
これらの実施形態、特徴及び利点、並びに他の実施形態、特徴及び利点は、以下の本開示の例示的な実施形態のより詳細な説明を、はじめに下記に簡単に述べる付属の図面と併せて参照することによって当業者にとって明らかになるであろう。 These embodiments, features and advantages, as well as other embodiments, features and advantages, refer to the following more detailed description of exemplary embodiments of the present disclosure in conjunction with the accompanying drawings briefly described below. This will be apparent to those skilled in the art.
上記の態様のいずれにおいても、体液/生理学的試料は血液であってよい。上記の態様のいずれにおいても、検体はグルコースであってよい。上記の態様のいずれにおいても、物理的特性は、試料の粘性、ヘマトクリット値、又は密度の少なくとも1つを含んでよく、又は、物理的特性はヘマトクリット値であってよく、場合によってヘマトクリット値は30%〜55%である。上記の態様のいずれにおいても、第1及び第2の信号は電気信号であってよい。詳細には、前記交互変化する信号は、交互変化する電気信号であってよい。上記の態様のいずれにおいても、Hが試料の物理的特性を表すか又は物理的特性である場合には、Hはヘマトクリット値の形であってよい。上記の態様のいずれにおいても、物理的特性は、インピーダンス、又は試料への入力信号と試料からの出力信号との間の位相角の差若しくはオフセットなどの測定された特性から決定することができる。 In any of the above embodiments, the body fluid / physiological sample may be blood. In any of the above aspects, the analyte may be glucose. In any of the above aspects, the physical property may include at least one of the viscosity, hematocrit value, or density of the sample, or the physical property may be a hematocrit value, and optionally the hematocrit value is 30. % To 55%. In any of the above aspects, the first and second signals may be electrical signals. Specifically, the alternating signal may be an alternating electrical signal. In any of the above aspects, if H represents or is a physical property of the sample, H may be in the form of a hematocrit value. In any of the above aspects, the physical characteristics can be determined from measured characteristics such as impedance or phase angle difference or offset between the input signal to the sample and the output signal from the sample.
本開示の上記の各態様では、抽出する工程、規定する工程、得る工程、分割する工程、導出する工程、決定する工程、計算する工程、及び/又は保存する工程(場合により式と組み合わせて)は、電子回路又はプロセッサによって実行することができる。これらの工程は、コンピュータ可読媒体に保存された実行可能な命令として実施することも可能であり、これらの命令は、コンピュータによって実行される場合、上記の方法の任意のものの各工程を実行することができる。 In each of the above aspects of the present disclosure, an extracting step, a defining step, an obtaining step, a dividing step, a deriving step, a determining step, a calculating step, and / or a storing step (optionally combined with an expression) Can be executed by an electronic circuit or a processor. These steps can also be implemented as executable instructions stored on a computer readable medium, which, when executed by a computer, perform each step of any of the above methods. Can do.
本開示の更なる態様では、それぞれが実行可能な命令を含むコンピュータ可読媒体が介在し、これらの命令は、コンピュータによって実行される場合、上記の方法の任意のものの各工程を実行する。 In a further aspect of the disclosure, there is an intervening computer-readable medium that contains executable instructions that, when executed by a computer, perform each step of any of the above methods.
本開示の更なる態様では、上記の方法の任意のものの各工程を実行するように構成された電子回路又はプロセッサをそれぞれが有する、検査計測器又は検体検査装置などの装置が介在する。 In a further aspect of the present disclosure, there is an intervening device, such as a test meter or an analyte test device, each having an electronic circuit or processor configured to perform each step of any of the above methods.
本明細書に援用され、本明細書の一部をなす添付の図面は、現時点における本開示の好ましい実施形態を示したものであって、上記に述べた一般的説明及び下記に述べる詳細な説明とともに、本開示の特徴を説明する役割を果たすものである(同様の参照符合は、同様の要素を表す)。
以下の詳細な説明は、図面を参照しつつ読まれるべきもので、異なる図面中、同様の要素は同様の参照符号にて示してある。図面は必ずしも一定の縮尺を有さず、選択された実施形態を示したものであって、本発明の範囲を限定しようとするものではない。詳細な説明は本発明の原理を限定するものではなく、あくまでも例として説明するものである。この説明文は、当業者による発明の製造及び使用を明確に可能ならしめるものであり、出願時における発明を実施するための最良の形態と考えられるものを含む、発明の複数の実施形態、適応例、変形例、代替例、並びに使用例を述べるものである。 The following detailed description should be read with reference to the drawings, in which like elements in different drawings are designated with like reference numerals. The drawings are not necessarily to scale and are illustrative of selected embodiments and are not intended to limit the scope of the invention. The detailed description is not intended to limit the principles of the invention but is provided as an example only. This description clearly allows the person skilled in the art to make and use the invention, and includes several embodiments of the invention, including what is considered to be the best mode for carrying out the invention at the time of filing. Examples, variations, alternatives, and usage examples are described.
本明細書で任意の数値や数値の範囲について用いる「約」又は「およそ」なる用語は、構成要素の部分又は構成要素の集合が、本明細書に述べられるその意図するところの目的に沿って機能することを可能とするような適当な寸法の許容誤差を示すものである。より詳細には、「約」又は「およそ」とは、記載された値の±10%の値の範囲のことを指しうるものであり、例えば「約90%」とは81%〜99%の値の範囲のことを指しうる。本明細書で使用するところの差の「絶対値」とは、差の大きさのことを指すものであり、すなわち常に正の値である。更に、本明細書で使用するところの「患者」、「ホスト」、「ユーザ」、及び「被験者」なる用語は任意のヒト又は動物被験者のことを指し、システム又は方法をヒトにおける使用に限定することを目的としたものではないが、ヒト患者における本発明の使用は好ましい実施形態を代表するものである。本明細書で使用するところの「振動信号」とは、それぞれ、電流の極性を変更するか、又は方向を交互に変化させるか、又は多方向的である電圧信号又は電流信号を含む。本明細書で使用するところの「電気的信号」又は「信号」なる語句は、直流信号、交流信号、又は電磁スペクトル内の任意の信号を含むことを意図している。「プロセッサ」、「マイクロプロセッサ」、又は「マイクロコントローラ」なる用語は、同じ意味を有することを意図しており、互換可能に使用されることを意図している。 As used herein, the term “about” or “approximately” as used for any numerical value or range of numerical values is intended to mean that a component part or set of components is in accordance with its intended purpose as described herein. It shows the tolerances of suitable dimensions that allow it to function. More specifically, “about” or “approximately” can refer to a range of values that are ± 10% of the stated value, eg, “about 90%” is between 81% and 99%. Can refer to a range of values. As used herein, the “absolute value” of a difference refers to the magnitude of the difference, that is, it is always a positive value. Further, as used herein, the terms “patient”, “host”, “user”, and “subject” refer to any human or animal subject and limit the system or method to use in humans. Although not intended, the use of the present invention in human patients represents a preferred embodiment. As used herein, a “vibration signal” includes a voltage or current signal that changes the polarity of the current, alternately changes direction, or is multidirectional, respectively. As used herein, the phrase “electrical signal” or “signal” is intended to include a DC signal, an AC signal, or any signal in the electromagnetic spectrum. The terms “processor”, “microprocessor”, or “microcontroller” are intended to have the same meaning and are intended to be used interchangeably.
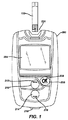
図1は、本明細書に図示及び説明される方法及び技術によって製造されたバイオセンサを用いて個人の血中の検体(例えばグルコース)濃度を検査するための検査計測器200を示している。検査計測器200は、データの入力、メニューのナビゲート、及びコマンドの実行用のボタンの形態であってよいユーザインタフェース入力装置(206、210、214)を含んでもよい。データには、検体濃度、及び/又は個人の日常の生活習慣に関連した情報を表す値が含まれうる。日常の生活習慣に関連した情報としては、個人の食餌摂取、医薬使用、健康診断の受診、全身の健康状態、及び運動レベルを挙げることができる。検査計測器200は、測定されたグルコース濃度を報告し、生活習慣に関連した情報の入力を容易にするために使用可能なディスプレイ204を更に有してもよい。
FIG. 1 illustrates a
検査計測器200は、第1のユーザインタフェース入力装置206、第2のユーザインタフェース入力装置210、及び第3のユーザインタフェース入力装置214を有してもよい。ユーザインタフェース入力装置206、210及び214は、検査装置に保存されたデータの入力及び分析を助け、利用者がディスプレイ204に表示されたユーザインタフェースを通じてナビゲートすることを可能とする。ユーザインタフェース入力装置206、210及び214は、各ユーザインタフェース入力装置をディスプレイ204上の文字と関連付ける助けとなる第1の標示208、第2の標示212、及び第3の標示216を有している。
The
検査計測器200は、バイオセンサ100(又はその変形例400、500、又は600)をストリップポートコネクタ220に挿入するか、又は第1のユーザインタフェース入力装置206を押し込んで少しの間保持するか、又はデータポート218を横切るデータトラフィックの検出によってスイッチを入れることができる。検査計測器200は、バイオセンサ100(又はその変形例400、500、又は600)を取り出すか、又は第1のユーザインタフェース入力装置206を押し込んで少しの間保持するか、又はメインメニュースクリーンから測定オフの選択肢にまでナビゲートしてこれを選択するか、又は所定の時間どのボタンも押さないことによって、スイッチを切ることができる。ディスプレイ104は必要に応じてバックライトを有してもよい。
The
一実施形態では、検査計測器200は、例えば、第1の検査ストリップバッチから第2の検査ストリップバッチに切り替える際、任意の外部ソースからの校正入力を受信しないように構成されてもよい。したがって、例示的な一実施形態では、計測器は、ユーザインタフェース(入力装置206、210、214など)、挿入される検査ストリップ、別のコードキー又はコードストリップ、データポート218などの外部ソースからの校正入力を受信しないように構成される。このような校正入力は、すべての検査ストリップバッチが実質的に均一な校正特性を有する場合には必要ではない。校正入力は、特定の検査ストリップバッチに帰する一組の値であってもよい。例えば、校正入力は、特定の検査ストリップバッチに関するバッチ傾き及びバッチ切片値を含みうる。バッチ傾き及び切片値などの校正入力は、下記に述べるように、計測器内で予め設定することができる。
In one embodiment,
図2Aを参照すると、検査計測器200の代表的な内部レイアウトが示されている。検査計測器200は、本明細書において述べられ、図示される特定の実施形態では32ビットRISCマイクロコントローラであるプロセッサ300を有しうる。本明細書において述べられ、図示される好ましい実施形態では、プロセッサ300は、Texas Instruments(Dallas,Texas)により製造される超低消費電力マイクロコントローラであるMSP 430ファミリーから選択されることが好ましい。プロセッサは、I/Oポート314を介して、本明細書において述べられ、図示される特定の実施形態ではEEPROMであるメモリ302と双方向接続することができる。データポート218、ユーザインタフェース入力装置206、210及び214、並びにディスプレイドライバ320もI/Oポート214を介してプロセッサ300に接続される。データポート218はプロセッサ300と接続することもできるが、これによりメモリ302とパーソナルコンピュータなどの外部装置との間のデータの転送が可能となる。ユーザインタフェース入力装置206、210及び214は、プロセッサ300と直接接続されている。プロセッサ300は、ディスプレイドライバ320によってディスプレイ204を制御する。メモリ302は、検査計測器200の製造時に、バッチ傾き及びバッチ切片値などの校正情報をプリロードすることができる。このプリロードされた校正情報は、ストリップポートコネクタ220を介してストリップから好適な(電流などの)信号を受信する際にプロセッサ300によってアクセス及び使用され、任意の外部ソースから校正入力を受信することなく、信号及び校正情報を使用して、対応する検体濃度(血中グルコース濃度など)を計算することができる。
Referring to FIG. 2A, a typical internal layout of the
本明細書に述べられ、図示される実施形態では、検査計測器200は、ストリップポートコネクタ220に挿入されたバイオセンサ100(又はその変形例400、500、又は600)に塗布された血液中のグルコース濃度の測定に使用される電子回路を与えるための特定用途向け集積回路(ASIC)304を有してもよい。アナログ電圧が、アナログインタフェース306を介してASIC 304に、またASIC 304から流れることができる。アナログインタフェース306からのアナログ信号は、A/D変換器316によってデジタル信号に変換することができる。プロセッサ300は更に、コア308、ROM 310(コンピュータコードを含む)、RAM 312及びクロック318を有している。一実施形態では、プロセッサ300は、例えば検体測定後の一定時間の間、ディスプレイユニットによる検体の値の表示の際に、単一の入力を除くすべてのユーザインタフェース入力を無効化するように構成(又はプログラム)される。代替的な一実施形態では、プロセッサ300は、ディスプレイユニットによる検体の値の表示の際に、単一の入力を除くすべてのユーザインタフェース入力装置からの任意の入力を無視するように構成(又はプログラム)される。計測器200の詳細な説明及び図示は、国際特許出願公開第WO2006070200号に図示、及び述べられており、当該公開を恰も本明細書に全体が記載されているものと同様にして参照により組み込まれる。
In the embodiment described and illustrated herein,
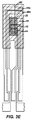
図3A(1)は、基板5上に配置された7つの層を有しうる検査ストリップ100の代表的な分解斜視図である。基板5上に配置される7つの層は、第1の導電層50(電極層50と呼ぶ場合もある)、絶縁層16、2つの重なり合った試薬層22a及び22b、接着部分24、26及び28を含む接着層60、親水層70、並びに検査ストリップ100のカバー94を形成する最上層80とすることができる。例えばスクリーン印刷プロセスを用いて、基板5上に導電層50、絶縁層16、試薬層22、及び接着層60を順次堆積させる一連の工程によって検査ストリップ100を製造することができる。電極10、12、14は、試薬層22a及び22bと接触するように配置されているのに対して、物理的特性検知電極19a及び20aは試薬層22とは離間しており、接触していない点に留意されたい。親水層70と最上層80とは、ロールストックから配置され、一体化された積層体として、又は別々の層として基板5上に積層することができる。図3A(1)に示されるように、検査ストリップ100は、遠位側部分3及び近位側部分4を有している。
FIG. 3A (1) is a representative exploded perspective view of a
検査ストリップ100は、そこから生理学的流体試料95を抜き取るか又は入れることができる試料受容チャンバ92を有しうる(図3A(2))。本明細書で検討する生理学的流体試料は血液であってよい。図3A(1)に示すように、試料受容チャンバ92は、検査ストリップ100の近位端に入口を、側縁部に出口を有しうる。流体試料95は、軸L−Lに沿って入口に適用する(図3A(2))ことによって、試料から検体を測定することができるように試料受容チャンバ92を充填することができる。図3A(1)に示されるように、試薬層22に隣接して配置された第1の接着パッド24及び第2の接着パッド26の側縁部が、それぞれ試料受容チャンバ92の壁を形成している。図3A(1)に示されるように、試料受容チャンバ92の底部すなわち「床部」は、基板5、導電層50、及び絶縁層16の一部を含みうる。図3A(1)に示すように、試料受容チャンバ92の上部すなわち「天井部」は、遠位側親水性部分32を含みうる。図3A(1)に示されるように、検査ストリップ100では、基板5は、後から適用される層を支持する助けとなる基礎として用いることができる。基板5は、ポリエチレンテトラフタレート(PET)材料(Mitsubishiにより提供されるHostaphan PET)などのポリエステルシートの形態であってよい。基板5は、呼び厚さ350マイクロメートル×幅370mm、長さ約60メートルのロールの形態であってよい。
The
導電層は、グルコースの電気化学的測定に使用することができる電極を形成するために必要とされる。第1の導電層50は、基板5上にスクリーン印刷されたカーボンインクから形成することができる。スクリーン印刷プロセスにおいて、カーボンインクはスクリーン上に載せられた後、スキージを用いてスクリーンを通じて転写される。印刷されたカーボンインクは、約140℃の高温空気で乾燥させることができる。カーボンインクは、VAGH樹脂、カーボンブラック、グラファイト(KS15)、並びに樹脂、カーボン、及びグラファイト混合物用の1つ以上の溶媒を含みうる。より詳細には、カーボンインクは、カーボンインク中に、カーボンブラック:VAGH樹脂を約2.90:1の比で、更に、グラファイト:カーボンブラックを約2.62:1の比で含むことができる。
A conductive layer is required to form an electrode that can be used for electrochemical measurements of glucose. The first
図3A(1)に示されるような検査ストリップ100では、第1の導電層50は、参照電極10、第1の作用電極12、第2の作用電極14、第3及び第4の物理的特性検知電極19a及び19b、第1の接触パッド13、第2の接触パッド15、参照接触パッド11、第1の作用電極トラック8、第2の作用電極トラック9、参照電極トラック7、及びストリップ検出用バー17を有することができる。物理的特性検知電極19a及び20aには、それぞれの電極トラック19b及び20bが設けられている。この導電層は、カーボンインクから形成することができる。第1の接触パッド13、第2の接触パッド15、及び参照接触パッド11は、検査計測器と電気的に接続されるように適合することができる。第1の作用電極トラック8は、第1の作用電極12から第1の接触パッド13までの電気的に連続した経路を与える。同様に、第2の作用電極トラック9は、第2の作用電極14から第2の接触パッド15までの電気的に連続した経路を与える。同様に、参照電極電極トラック7は、参照電極10から参照接触パッド11までの電気的に連続した経路を与える。ストリップ検出用バー17は、参照接触パッド11と電気的に接続されている。第3及び第4の電極トラック19b及び20bはそれぞれの電極19a及び20aに接続している。図3A(1)に示されるように、検査計測器は、参照接触パッド11とストリップ検出用バー17との連続性を測定することによって、検査ストリップ100が適切に挿入されたことを検出することができる。
In the
図3A(1)の検査ストリップの変形例である図3A(2)の実施形態では、更なる電極10aが、複数の電極19a、20a、14、12、及び10のいずれかの延長部として設けられている。この組み込まれた遮蔽又は接地電極10aは、使用者の指又は身体と特性測定電極19a及び20aとの間の一切の容量性カップリングを低減又は防止するために用いられる。接地電極10aは、検知電極19a及び20aから離れる方向に容量が向けられることを可能とする。これを行うには、接地電極10aを、他の5つの電極のいずれか1つ、又は、それ自体の別の接触パッド(及びトラック)に接続することで、1以上の接触パッド15、17、13にそれぞれのトラック7、8、及び9を介して接続する代わりに測定計上の接地に接続することができる。好ましい一実施形態では、接地電極10aは、試薬22が置かれた3つの電極の1つに接続される。最も好ましい実施形態では、接地電極10aは電極10に接続される。接地電極であることで、試料中のバックグラウンド干渉化合物から生じうる更なる電流が作用電極の測定値に寄与することがないように接地電極を参照電極(10)に接続することが有利である。更に、遮蔽又は接地電極10aを電極10と接続することにより、高い信号において特に制限条件となりうる対電極10のサイズを効果的に増大させるものと考えられる。図3A(2)の実施形態では、試薬は、測定電極19a及び20aと接触しないように配置されている。別の方法として、図3A(3)の実施形態では、試薬22は、試薬22が検知電極19a及び20aの少なくとも一方と接触するように配置されている。
In the embodiment of FIG. 3A (2), which is a variation of the test strip of FIG. It has been. This built-in shield or
図3A(4)に示されるような検査ストリップ100の代替的な形態では、最上層38、親水性フィルム層34、及びスペーサ29が互いに組み合わせられることにより、絶縁層16’に近接して配置された試薬層22’とともに基板5に実装するための一体化されたアセンブリを形成している。
In an alternative form of
図3A(5)では、最初の2つの電極19a及び20aは、血液受容通路18の入口の最も近くにある。各電極のトラックは、ストリップ受容ポートの5つのそれぞれの接触面と嵌合するように構成されている。ストリップ100の試料受容端部の拡大図である図3A(6)に示されるように、第1の電極トラック19aは、第2の電極トラック20aから距離L1だけ離間している。第2の電極トラック20aは、L1の約1〜1/2倍でありうる距離L2だけ電極10から離間している。電極19aの厚さh1は、第2の電極20aの厚さh2と比較して同じか又は異なる大きさでよい。電極10では、厚さh3は厚さh1の約6〜約7倍であってよく、厚さh4及びh5はそれぞれh1又はh2の約2〜約4倍であってよい。好ましい実施形態では、距離L1は約1.2mmであってよく、厚さh1は約0.2mmであってよい。
In FIG. 3A (5), the first two
バイオセンサ100(図3A(1〜6))の変形例を図3B〜3Tに示す。簡単に述べると、バイオセンサ100の変形例(図3B〜3Tに例示的に示される)に関し、これらのバイオセンサは、作用電極上に配置された酵素試薬層、第1のパターン化導電層を覆って配置され、分析用バイオセンサ内に試料チャンバを形成するように構成されたパターン化スペーサ層、及び第1のパターン化導電層の上に配置される第2のパターン化導電層を有する。第2のパターン化導電層は、第1の位相シフト測定電極及び第2の位相シフト測定電極を有している。更に、第1及び第2の位相シフト測定電極は試料チャンバ内に配置され、手持ち式検査計測器とともに、分析用バイオセンサの使用時に試料チャンバに導入される体液試料を通じて強制的に流される電気信号の位相シフトを測定するように構成されている。このような位相シフト測定電極を本明細書では体液位相シフト測定電極とも呼ぶ。本明細書に述べられる様々な実施形態の分析用バイオセンサは、第1及び第2の位相シフト測定電極が作用電極及び参照電極の上に配置されることにより、効果的に低容量の試料チャンバが実現されるという点で有利であると考えられる。これは、第1及び第2の位相シフト測定電極が作用電極及び参照電極と同一平面上となる関係に配置されていることにより、体液試料が、第1及び第2の位相シフト測定電極ばかりでなく作用電極及び参照電極を覆うためにより大きな体液試料の体積及び試料チャンバを必要とするような構成とは対照的である。 The modification of the biosensor 100 (FIG. 3A (1-6)) is shown to FIG. Briefly, with respect to variations of biosensor 100 (shown illustratively in FIGS. 3B-3T), these biosensors include an enzyme reagent layer disposed on a working electrode, a first patterned conductive layer. A patterned spacer layer disposed over and configured to form a sample chamber in the analytical biosensor, and a second patterned conductive layer disposed over the first patterned conductive layer. The second patterned conductive layer has a first phase shift measurement electrode and a second phase shift measurement electrode. In addition, the first and second phase shift measurement electrodes are disposed in the sample chamber and together with the handheld test instrument, an electrical signal that is forced to flow through the body fluid sample introduced into the sample chamber when the analytical biosensor is used. Is configured to measure the phase shift. Such a phase shift measurement electrode is also referred to herein as a body fluid phase shift measurement electrode. The analytical biosensors of the various embodiments described herein include a first and second phase shift measurement electrode disposed on a working electrode and a reference electrode to effectively reduce the volume of the sample chamber. Is considered advantageous in that it is realized. This is because the first and second phase shift measurement electrodes are arranged in the same plane as the working electrode and the reference electrode, so that the body fluid sample is composed of only the first and second phase shift measurement electrodes. In contrast to configurations that require a larger body fluid sample volume and sample chamber to cover the working electrode and the reference electrode.
図3Bの実施形態では、検体測定電極10、12及び14は図3A(1、2、3、4、5又は6)と概ね同じ形態で配置されている。しかしながら、ヘマトクリット値を検知するための電極19a及び20aは互いに離間した形態で配置されており、一方の電極19aが検査チャンバ92への入口92aに近接して配置され、他方の電極20aは検査チャンバ92の反対側の端部に配置されている。バイオセンサ上の電極の少なくとも1つは、試薬層22と接触して配置される。
In the embodiment of FIG. 3B, the
図3C、3D、3E及び3Fでは、ヘマトクリット値検知電極19a及び20aは互いに隣接して配置されており、検査チャンバ92への入口92aの反対側の端部92bに(図3C及び3D)、又は入口92aに隣接して(図3E及び3F)に配置することができる。これらの実施形態のいずれにおいても、物理的特性検知電極は試薬層22から離間しているため、これらの物理的特性検知電極がグルコースを含む流体試料(例えば血液又は間質液)の存在下で試薬の電気化学的反応による影響を受けることはない。
In FIGS. 3C, 3D, 3E and 3F, the hematocrit
図3G〜3Jを参照すると、電気化学的分析用バイオセンサ400は、電気絶縁基板層402、電気絶縁基板層上に配置された第1のパターン化導電層404、酵素試薬層406(分かりやすさのため図3Gにのみ示されている)、パターン化スペーサ層408、第1のパターン化導電層404の上に配置された第2のパターン化導電層410、及び電気絶縁性の最上層412を有している。パターン化スペーサ層408は、電気化学的分析用バイオセンサ400の内部に更に試料チャンバ414が形成され、パターン化スペーサ層408が試料チャンバ414の外壁を形成するように構成されている。
Referring to FIGS. 3G-3J, an
第1のパターン化導電層404は、対電極404a(参照電極とも呼ばれる)、第1の作用電極404b、及び第2の作用電極404cの3つの電極を有している(図3Gを参照)。
The first patterned
第2のパターン化導電層410は、第1の位相シフト測定電極411及び第2の位相シフト測定電極413を有している。第2のパターン化導電層410は、第1の位相シフトプローブ接点416及び第2の位相シフトプローブ接点418を更に有している。
The second patterned
体液試料中の検体(例えば全血試料中の血糖濃度)を調べるための電気化学的分析用バイオセンサ400の使用時には、電極404a、404b及び404cが電気化学的分析用バイオセンサの電気化学的応答を監視するために付属の計測器(図に示されていない)により使用される。電気化学的応答は、例えば、対象とする電気化学的反応により誘導される電流であってよい。次いで、こうした電流の大きさを、体液試料の位相シフトにより決定される体液試料の物理的特性(例えばヘマトクリット値)を考慮して、調べられる体液試料中に存在する検体の量と関連付けることができる。このような使用においては、体液試料は電気化学的分析用バイオセンサ400に適用されることにより、試料チャンバ414に受容される。
When the
電気絶縁基板層402は、例えば、ナイロン基板、ポリカーボネート基板、ポリイミド基板、ポリ塩化ビニル基板、ポリエチレン基板、ポリプロピレン基板、グリコール化ポリエステル(PETG)基板、ポリスチレン基板、シリコン基板、セラミック基板、ガラス基板又はポリエステル基板(例えば、厚さ7mmのポリエステル基板)を含む、当業者には周知の任意の適当な電気絶縁基板であってもよい。電気絶縁基板は、例えば、約5mmの幅寸法、約27mmの長さ寸法、約0.5mmの厚み寸法といったように任意の適当な寸法を有することができる。
The electrically insulating
第1のパターン化導電層404は、例えば、金、パラジウム、炭素、銀、白金、酸化スズ、イリジウム、インジウム、又はそれらの組み合わせ(例えば、インジウムドープ酸化スズ)などの任意の適当な導電材料で形成することができる。更に、第1のパターン化導電層404を形成するには、例えば、スパッタリング、蒸発、無電解めっき、スクリーン印刷、密着焼付け、レーザアブレーション又はグラビア印刷などの任意の適当な方法又は方法の組み合わせを使用することができる。一般的であるが非限定的なパターン化導電層の厚さは、5nm〜400nmの範囲である。
The first patterned
周知のこととして、従来の電気化学的検体バイオセンサ(例えば検査ストリップ)は、作用電極を付随する対/参照電極及び酵素試薬層とともに用いることによって対象とする検体との電気化学的反応を促進し、これによりその検体の存在及び/又は濃度を決定するものである。例えば、血液試料中のグルコース濃度を決定するための電気化学的検体バイオセンサは、酵素であるグルコースオキシダーゼ及びメディエータであるフェリシアニド(電気化学反応の間にメディエータであるフェロシアニドに還元される)を含んだ酵素試薬を使用することができる。このような従来の検体検査ストリップ及び酵素試薬層については、例えば、米国特許第5,708,247号、同第5,951,836号、同第6,241,862号、及び同第6,284,125号に述べられており、これらはいずれも参照により本出願に組み込まれる。これに関して、本明細書で提供される様々な実施形態で使用される酵素試薬層は、任意の適当な試料可溶性の酵素試薬を含んでよく、酵素試薬の選択は、決定しようとする検体及び体液試料によって決まる。例えば、血液試料中のグルコースを決定しようとする場合、酵素試薬層406は、グルコースオキシダーゼ又はグルコースデヒドロゲナーゼを、機能的動作に必要とされる他の成分とともに含むことができる。
As is well known, conventional electrochemical analyte biosensors (eg, test strips) facilitate the electrochemical reaction with a target analyte by using a working electrode with an associated counter / reference electrode and an enzyme reagent layer. This determines the presence and / or concentration of the analyte. For example, an electrochemical analyte biosensor for determining the glucose concentration in a blood sample includes the enzyme glucose oxidase and the mediator ferricyanide (which is reduced to the mediator ferrocyanide during the electrochemical reaction). Enzyme reagents can be used. For such conventional specimen test strips and enzyme reagent layers, for example, U.S. Pat. Nos. 5,708,247, 5,951,836, 6,241,862, and 6, No. 284,125, both of which are incorporated herein by reference. In this regard, the enzyme reagent layer used in the various embodiments provided herein may comprise any suitable sample soluble enzyme reagent, the choice of enzyme reagent being determined by the analyte and body fluid to be determined. Depends on the sample. For example, when attempting to determine glucose in a blood sample,
一般的に酵素試薬層406は少なくとも酵素及びメディエータを含む。適当なメディエータの例としては例えば、ルテニウム、塩化ヘキサアンミンルテニウム(III)、フェリシアニド、フェロセン、フェロセン誘導体、オスミウムビピリジル複合体、及びキノン誘導体が挙げられる。適当な酵素の例としては、グルコースオキシダーゼ、ピロロキノリンキノン(PQQ)補因子を用いるグルコースデヒドロゲナーゼ(GDH)、ニコチンアミドアデニンジヌクレオチド(NAD)補因子を用いるGDH、フラビンアデニンジヌクレオチド(FAD)補因子を用いるGDHが挙げられる。酵素試薬層406は、例えばスクリーン印刷などの任意の適当な方法を使用して製造時に適用することができる。
In general, the
出願人は、酵素試薬層406が、適当な緩衝剤(例えば、Tris HCl、シトラコン酸塩、クエン酸塩、及びリン酸塩)、ヒドロキシエチルセルロース[HEC]、カルボキシメチルセルロース、エチルセルロース及びアルギン酸塩、酵素安定化剤、並びに当該技術分野において知られる他の添加剤を更に含みうる点を特記しておく。
Applicants have noted that the
本明細書に述べられる位相シフト測定電極、検体検査ストリップ、及び関連する方法はないものの、体液試料中の検体の濃度を決定するための電極及び酵素試薬層の使用に関する更なる詳細は、米国特許第6,733,655号に見られ、これは参照により全体が本出願に組み込まれる。 Although there are no phase shift measurement electrodes, analyte test strips, and related methods described herein, further details regarding the use of electrodes and enzyme reagent layers to determine the concentration of an analyte in a body fluid sample can be found in US Pat. No. 6,733,655, which is incorporated herein by reference in its entirety.
パターン化スペーサ層408は、例えば厚さ95μmの両面感圧接着層、熱活性化接着層、又は熱硬化性接着プラスチック層を含む任意の適当な材料で形成することができる。パターン化スペーサ層408は、例えば、約1マイクロメートル〜約500マイクロメートル、好ましくは約10マイクロメートル〜約400マイクロメートル、より好ましくは約40マイクロメートル〜約200マイクロメートルの範囲の厚さを有することができる。
The patterned
第2のパターン化導電層410は、例えば、銅、銀、パラジウム、金、及び導電性炭素材料を含む任意の適当な導電性材料で形成することができる。第2のパターン化導電層410は、例えば、電気絶縁性の最上層412の下側表面上に配置するか(図3G〜3Jに示されるように)、又は電気絶縁性の最上層412の下側表面内に埋め込むことができる。第2のパターン化導電層410は、例えば20マイクロメートル〜400マイクロメートルの範囲の厚さなど、任意の適当な厚さを有することができる。
The second patterned
第2のパターン化導電層410の第1の位相シフト測定電極411と第2の位相シフト測定電極413とは、位相シフト測定に適した隙間によって試料チャンバ414内で(図3Jの水平方向に)分離されている。このような隙間は、例えば、20マイクロメートル〜1,400マイクロメートルの範囲であってよく、典型的な隙間は500マイクロメートルである。更に、試料チャンバ414内で体液試料に曝露される第1の位相シフト測定電極111及び第2の位相シフト測定電極113の表面積は、一般的には約0.5mm2であるが、例えば約0.1mm2〜約2.0mm2の範囲であってよい。
The first phase
電気化学的分析用バイオセンサ400は、例えば、第1のパターン化導電層404、酵素試薬層406、パターン化スペーサ408、第2のパターン化導電層410、及び電気絶縁性の最上層412を、電気絶縁基板層402上に順次、位置合わせして形成することによって製造することができる。例えば、スクリーン印刷、フォトリソグラフィ、グラビア印刷、化学蒸着、スパッタリング、テープ積層法、及びこれらの組み合わせなどの当業者には周知の任意の適当な方法を用いてこのような順次、位置合わせした形成を実現することができる。
The
本明細書で提供される実施形態に基づく分析用バイオセンサは、例えば、同時係属中の特許出願第13/250,525号(仮に代理人整理番号DDI5209USNPにより識別する)(これは参照により本明細書に組み込まれ、補遺に複写が添付される)に述べられるような、手持ち式検査計測器の分析用検査ストリップ試料セルインタフェースと動作可能に電気的に接続し(例えば、第1及び第2の位相シフトプローブ接点416及び418を介して)、これとともに使用されるように構成することができる。
Analytical biosensors based on the embodiments provided herein can be found, for example, in co-pending patent application No. 13 / 250,525 (tentatively identified by attorney docket number DDI5209USNP), which is hereby incorporated by reference. Operatively and electrically connected to an analytical test strip sample cell interface of a hand-held test instrument (eg, first and second) (Via phase
全血試料のリアクタンスとその試料の物理的特性(例えばヘマトクリット値)との間には一定の関係が存在することが分かっている。体液試料(例えば全血試料)の並列の容量性及び抵抗性要素としての電気的モデル化は、交流(AC)信号が体液試料を通じて強制的に流される場合、交流信号の位相シフトが交流信号の電圧の周波数及び試料の物理的特性(例えばヘマトクリット値)の両方に依存することを示している。したがって、体液試料の物理的特性(例えばヘマトクリット値)は、例えば、体液試料を通じて既知の周波数(又は複数の既知の周波数)の交流信号を流し、その位相シフトを検出することによって測定することができる。本明細書に述べられる様々な実施形態の分析用バイオセンサの位相シフト測定電極は、第1及び第2の位相シフト測定電極が試料チャンバ内に存在する体液と直接接触することから、このような位相シフト測定における使用に特に適している。 It has been found that a certain relationship exists between the reactance of a whole blood sample and the physical properties (eg, hematocrit value) of the sample. Electrical modeling as a parallel capacitive and resistive element of a bodily fluid sample (eg, a whole blood sample) is such that when an alternating current (AC) signal is forced through the bodily fluid sample, the phase shift of the alternating signal is It shows that it depends on both the frequency of the voltage and the physical properties of the sample (eg, hematocrit value). Therefore, a physical property (eg, hematocrit value) of a body fluid sample can be measured by, for example, passing an AC signal of a known frequency (or a plurality of known frequencies) through the body fluid sample and detecting its phase shift. . The phase shift measurement electrodes of the analytical biosensors of the various embodiments described herein are such that the first and second phase shift measurement electrodes are in direct contact with bodily fluids present in the sample chamber. Particularly suitable for use in phase shift measurements.
出願人は、体液試料(例えば全血試料)中の検体(グルコースなど)に決定において手持ち式検査計測器で使用するための、本明細書に述べられる分析用バイオセンサ(例えば電気化学的分析用検査ストリップ)の様々な実施形態は、電気絶縁基板、電気絶縁基板上に配置され、作用電極及び参照電極を有する第1のパターン化導電体層を有しうる点を特記しておく。分析用バイオセンサは更に、作用電気化学的上に配置された酵素試薬層、第1の第1のパターン化導電体層上に配置され、分析用バイオセンサ内に第1の試料受容通路及び検体決定試料チャンバの両方を形成する第1のパターン化スペーサ層、並びに、第1のパターン化導電体層上に配置され、少なくとも第2の試料受容通路を形成する第2のパターン化スペーサ層を有しうる。更に、分析用バイオセンサは、第2の試料受容通路と流体連通した体液位相シフト試料チャンバを更に有する。更に、分析用バイオセンサの第1の試料受容通路及び検体決定試料チャンバは、分析用バイオセンサの第2の試料受容通路及び体液位相シフト試料チャンバから隔離されている。 Applicants may use an analytical biosensor (eg, for electrochemical analysis) as described herein for use with a handheld test instrument in determining an analyte (such as glucose) in a body fluid sample (eg, a whole blood sample). It should be noted that various embodiments of the test strip may have an electrically insulating substrate, a first patterned conductor layer disposed on the electrically insulating substrate and having a working electrode and a reference electrode. The analytical biosensor is further disposed on the working electrochemically disposed enzyme reagent layer, the first first patterned conductor layer, and the first sample receiving passage and the analyte in the analytical biosensor. A first patterned spacer layer forming both of the determining sample chambers and a second patterned spacer layer disposed on the first patterned conductor layer and forming at least a second sample receiving passage. Yes. Further, the analytical biosensor further comprises a body fluid phase shift sample chamber in fluid communication with the second sample receiving passage. Further, the first sample receiving passage and the analyte determination sample chamber of the analytical biosensor are isolated from the second sample receiving passage and the body fluid phase shift sample chamber of the analytical biosensor.
出願人は、本明細書に述べられる様々な実施形態の分析用バイオセンサは、例えば検体決定試料チャンバと体液位相シフト試料チャンバとの間の隔離(流体的及び電気的な)によって体液試料中の検体の決定と、体液の位相シフト測定との間の潜在的な干渉が防止される点で有利であると考えるものである。出願人は、第1の試料受容通路及び検体決定チャンバが、より薄くともよい第1及び/又は第2のパターン化スペーサ層の部分によって第2の試料受容通路及び体液位相シフト試料チャンバから分離されていることで、小さくとも機械的に安定した断面を有する分析用バイオセンサが与えられることにより、特定の利点が得られる点を特記しておく。 Applicants have noted that the analytical biosensors of the various embodiments described herein can be used in body fluid samples, for example, by isolation (fluid and electrical) between the analyte determination sample chamber and the body fluid phase shift sample chamber. It is considered advantageous in that potential interference between analyte determination and bodily fluid phase shift measurement is prevented. Applicants have noted that the first sample receiving passage and the analyte determination chamber are separated from the second sample receiving passage and the fluid phase shift sample chamber by a portion of the first and / or second patterned spacer layer, which may be thinner. It should be noted that certain advantages are obtained by providing an analytical biosensor having a mechanically stable cross-section at a minimum.
図3K〜3Oを参照すると、電気化学的分析用バイオセンサ500は、電気絶縁基板層502、電気絶縁基板層上に配置された第1のパターン化導電体層504、酵素試薬層506(分かりやすさのため図3Kにのみ示されている)、第1のパターン化スペーサ層508、第2のパターン化スペーサ層510、及び上部カバー511を有している。図3Kの実施形態では、第1のパターン化スペーサ層508及び第2のパターン化スペーサ層510は二層構造として示されている。しかしながら、本明細書で提供される様々な実施形態で用いられる第1及び第2のパターン化スペーサ層は、一体の層とするか又は他の任意の適当に形成された層とすることができる。
Referring to FIGS. 3K-3O, an
第1のパターン化スペーサ層508は、電気化学的分析用バイオセンサ500が第1の試料受容通路512及び検体決定試料チャンバ514を更に有するように構成されている。第1のパターン化スペーサ層508もまた、体液位相シフト試料チャンバ516及び検体決定試料チャンバ通気口518(分かりやすさのため図3Kには示されていない)を形成するように構成されている。
The first
第2のパターン化スペーサ層510は、第2の試料受容通路520及び体液位相シフト試料チャンバ通気口522(分かりやすさのため図3Kには示されていない)を形成するように構成されている。
The second
第1のパターン化導電体層504は、第1の位相シフト測定電極524、第2の位相シフト測定電極526、2個の作用電極528a及び528b、並びに参照電極530を有している。分かりやすさのため、図3Lは、第1の位相シフト測定電極524及び第2の位相シフト測定電極526のみを示しており、第1のパターン化導電体層504の全体は示していない。
The first
第1の試料受容通路512及び検体決定試料チャンバ514は、第2の試料受容通路520及び体液位相シフト試料チャンバ516から流体的かつ電気的に隔離されている(分かりやすさのために第1及び第2のパターン化導電体層が省略されている図3Oを特に参照されたい)。更に、図3Oの実施形態では、体液位相シフト試料チャンバは、検体決定試料チャンバと隣り合った形態に配置されている。
The first
体液試料中の検体(例えば全血試料中の血糖濃度)を調べるための電気化学的分析用バイオセンサ500の使用時には、作用電極及び参照電極が電気化学的分析用バイオセンサの電気化学的応答を監視するために付属の計測器(図に示されていない)により使用される。電気化学的応答は、例えば、対象とする電気化学的反応により誘導される電流であってよい。次いで、こうした電流の大きさを、体液試料の位相シフトにより決定される体液試料のヘマトクリット値を考慮して、調べられる体液試料中に存在する検体の量と関連付けることができる。このような使用では、体液試料を電気化学的分析用バイオセンサ500に適用することにより、体液試料は検体決定試料チャンバ514及び体液位相シフト試料チャンバ516内に受容される。
When the
電気絶縁基板502は、例えば、ナイロン基板、ポリカーボネート基板、ポリイミド基板、ポリ塩化ビニル基板、ポリエチレン基板、ポリプロピレン基板、グリコール化ポリエステル(PETG)基板、ポリスチレン基板、シリコン基板、セラミック基板、ガラス基板又はポリエステル基板(例えば、厚さ7mmのポリエステル基板)を含む、当業者には周知の任意の適当な電気絶縁基板であってもよい。電気絶縁基板は、例えば、約5mmの幅寸法、約27mmの長さ寸法、約0.5mmの厚み寸法のように任意の適当な寸法を有することができる。
The electrically insulating
第1のパターン化導電体層504は、例えば、金、パラジウム、炭素、銀、白金、酸化スズ、イリジウム、インジウム、又はそれらの組み合わせ(例えば、インジウムドープ酸化スズ)などの任意の適当な導電材料で形成することができる。更に、第1のパターン化導電体層504を形成するには、例えば、スパッタリング、蒸発、無電解めっき、スクリーン印刷、密着焼付け、レーザアブレーション又はグラビア印刷などの任意の適当な方法又は方法の組み合わせを使用することができる。一般的であるが非限定的なパターン化導電体層の厚さは、5nm〜500nmの範囲である。
The first
出願人は、従来の電気化学的検体バイオセンサは、作用電極を付随する対/参照電極及び酵素試薬層とともに用いることによって対象とする検体との電気化学的反応を促進し、これによりその検体の存在及び/又は濃度を決定するものである点を特記しておく。例えば、血液試料中のグルコース濃度を決定するための電気化学的検体バイオセンサは、酵素であるグルコースオキシダーゼ及びメディエータであるフェリシアニド(電気化学反応の間にメディエータであるフェロシアニドに還元される)を含んだ酵素試薬を使用することができる。このような従来の検体検査ストリップ及び酵素試薬層については、例えば、米国特許第5,708,247号、同第5,951,836号、同第6,241,862号、及び同第6,284,125号に述べられており、これらはいずれも、参照により本出願に組み込まれる。これに関して、本明細書で提供される様々な実施形態で使用される酵素試薬層は、任意の適当な試料可溶性の酵素試薬を含んでよく、酵素試薬の選択は、決定しようとする検体及び体液試料によって決まる。例えば、血液試料中のグルコースを決定しようとする場合、酵素試薬層506は、グルコースオキシダーゼ又はグルコースデヒドロゲナーゼを、機能的動作に必要とされる他の成分とともに含むことができる。
Applicants have noted that conventional electrochemical analyte biosensors promote an electrochemical reaction with the analyte of interest by using a working electrode with an associated counter / reference electrode and an enzyme reagent layer, whereby the analyte's Note that the presence and / or concentration is determined. For example, an electrochemical analyte biosensor for determining the glucose concentration in a blood sample includes the enzyme glucose oxidase and the mediator ferricyanide (which is reduced to the mediator ferrocyanide during the electrochemical reaction). Enzyme reagents can be used. For such conventional specimen test strips and enzyme reagent layers, for example, U.S. Pat. Nos. 5,708,247, 5,951,836, 6,241,862, and 6, No. 284,125, both of which are incorporated herein by reference. In this regard, the enzyme reagent layer used in the various embodiments provided herein may comprise any suitable sample soluble enzyme reagent, the choice of enzyme reagent being determined by the analyte and body fluid to be determined. Depends on the sample. For example, when determining glucose in a blood sample, the
一般的に酵素試薬層506は少なくとも酵素及びメディエータを含む。適当なメディエータの例としては例えば、フェリシアニド、フェロセン、フェロセン誘導体、オスミウムビピリジル複合体、及びキノン誘導体が挙げられる。適当な酵素の例としては、グルコースオキシダーゼ、ピロロキノリンキノン(PQQ)補因子を用いるグルコースデヒドロゲナーゼ(GDH)、ニコチンアミドアデニンジヌクレオチド(NAD)補因子を用いるGDH、フラビンアデニンジヌクレオチド(FAD)補因子を用いるGDHが挙げられる。酵素試薬層506は、例えばスクリーン印刷などの任意の適当な方法を使用して製造時に適用することができる。
In general, the
出願人は、酵素試薬層506が、適当な緩衝剤(例えば、Tris HCl、シトラコン酸塩、クエン酸塩、及びリン酸塩)、ヒドロキシエチルセルロース[HEC]、カルボキシメチルセルロース、エチルセルロース及びアルギン酸塩、酵素安定化剤、並びに当該技術分野において知られる他の添加剤を更に含みうる点を特記しておく。
Applicants have noted that the
本明細書に述べられる位相シフト測定電極、体液位相シフト試料チャンバ、及び第2の試料受容通路、検体検査ストリップ、及び関連する方法はないものの、体液試料中の検体の濃度を決定するための電極及び酵素試薬層の使用に関する更なる詳細は、米国特許第6,733,655号に見られ、これは参照により本出願に組み込まれる。 Electrode for determining the concentration of an analyte in a body fluid sample, although there is no phase shift measurement electrode, body fluid phase shift sample chamber, and second sample receiving passage, analyte test strip, and related methods described herein Further details regarding the use of enzyme reagent layers are found in US Pat. No. 6,733,655, which is incorporated herein by reference.
第1及び第2のパターン化スペーサ層508及び510は、例えば厚さ95μmの両面感圧接着層、熱活性化接着層、又は熱硬化性接着プラスチック層を含む任意の適当な材料でそれぞれ形成することができる。第1のパターン化スペーサ層508は、例えば、約1マイクロメートル〜約500マイクロメートル、好ましくは約10マイクロメートル〜約400マイクロメートル、より好ましくは約40マイクロメートル〜約600マイクロメートルの範囲の厚さを有することができる。
The first and second patterned spacer layers 508 and 510 are each formed of any suitable material including, for example, a 95 μm thick double-sided pressure sensitive adhesive layer, a heat activated adhesive layer, or a thermosetting adhesive plastic layer. be able to. The first
電気化学的分析用バイオセンサ500は、例えば、第1のパターン化導電体層504、酵素試薬層506、第1のパターン化スペーサ508、及び第2のパターン化スペーサ層510を、電気絶縁基板層502上に順次、位置合わせして形成することによって製造することができる。例えば、スクリーン印刷、フォトリソグラフィ、グラビア印刷、化学蒸着、スパッタリング、テープ積層法、及びこれらの組み合わせなどの当業者には周知の任意の適当な方法を用いてこのような順次位置合わせした形成を実現することができる。
The
本実施形態に基づく分析用バイオセンサは、例えば、同時係属中の特許出願第13/250,525号(仮に代理人整理番号DDI5209USNPにより識別する)(これは参照により本明細書に組み込まれ、補遺に複写が添付される)に述べられるような、手持ち式検査計測器の分析用バイオセンサ試料セルインタフェースと動作可能に電気的に接続し、これとともに使用されるように構成することができる。 An analytical biosensor according to this embodiment is described, for example, in co-pending patent application No. 13 / 250,525 (tentatively identified by agent docket number DDI5209USNP) (which is incorporated herein by reference and added) Can be configured to be operably electrically connected to and used with an analytical biosensor sample cell interface of a hand-held test instrument, as described in US Pat.
全血試料のリアクタンスとその試料の物理的特性(例えばヘマトクリット値)との間には一定の関係が存在することが分かっている。体液試料(例えば全血試料)の並列の容量性及び抵抗性要素としての電気的モデル化は、例えば交流(AC)信号などの交互変化する信号が体液試料を通じて強制的に流される場合、交流信号の位相シフトが交流信号の電圧の周波数及び試料の物理的特性(例えばヘマトクリット値、粘性、温度)の両方に依存することを示している。したがって、体液試料の物理的特性(例えばヘマトクリット値、粘性、温度)は、例えば、体液試料を通じて既知の周波数(又は複数の既知の周波数)の交流信号を流し、その位相シフトを検出することによって測定することができる。本明細書に述べられる様々な実施形態の分析用検査ストリップの位相シフト測定電極は、第1及び第2の位相シフト測定電極が試料チャンバ内に存在する体液と直接接触することから、このような位相シフト測定における使用に特に適している。 It has been found that a certain relationship exists between the reactance of a whole blood sample and the physical properties (eg, hematocrit value) of the sample. Electrical modeling as a parallel capacitive and resistive element of a bodily fluid sample (eg, a whole blood sample) is an AC signal when alternating signals such as an alternating current (AC) signal are forced through the bodily fluid sample. Is dependent on both the frequency of the AC signal voltage and the physical properties of the sample (eg, hematocrit, viscosity, temperature). Thus, the physical properties (eg, hematocrit value, viscosity, temperature) of a bodily fluid sample are measured by, for example, passing an alternating signal of a known frequency (or multiple known frequencies) through the bodily fluid sample and detecting its phase shift. can do. The phase shift measurement electrodes of the analytical test strips of the various embodiments described herein are such that the first and second phase shift measurement electrodes are in direct contact with bodily fluid present in the sample chamber. Particularly suitable for use in phase shift measurements.
図3P〜3Tを参照すると、電気化学的分析用検査ストリップ600は、電気絶縁基板層602、電気絶縁基板層上に配置された第1のパターン化導電体層604、酵素試薬層606(分かりやすさのため図3Pにのみ示されている)、第1のパターン化スペーサ層608、第2のパターン化導電体層609、第2のパターン化スペーサ層610、及び上部カバー611を有している。図3Pの実施形態では、第1のパターン化スペーサ層608及び第2のパターン化スペーサ層610は二層構造として示されている。しかしながら、本明細書で提供される様々な実施形態で用いられる第1及び第2のパターン化スペーサ層は、一体の層とするか又は他の任意の適当に形成された層とすることができる。
3P-3T, an electrochemical
第1のパターン化スペーサ層608は、電気化学的分析用バイオセンサ600が、第1の試料受容通路612、検体決定試料チャンバ614、及び検体決定試料チャンバ通気口618(図3Pには示されていないが、図3Rに破線で示されている)を更に有するように構成されている。検体決定試料チャンバ通気口618は、検体決定試料チャンバ614内に第1の試料受容通路612を介して体液試料を導入する助けとなるように構成されている。
The first
第2のパターン化スペーサ層610は、第2の試料受容通路620、体液位相シフト試料チャンバ616、及び体液位相シフトチャンバ通気口622(図3Pには示されていないが図3Sに破線で示される)を形成するように構成されている。体液位相シフトチャンバ通気口622は、体液位相シフト試料チャンバ616内に第2の試料受容通路620を介して体液試料を導入する助けとなるように構成されている。
The second
第1のパターン化導電体層604、2個の作用電極628a及び628b(図3P及び3Qに示される)及び参照電極630(図3P及び3Qにも示される)。第2のパターン化導電体層609は、第1の位相シフト測定電極624及び第2の位相シフト測定電極626を含み、第1のパターン化スペーサ層608の上に配置されて第2のパターン化スペーサ層610の二層構造中に包埋されている。
A first patterned
第1の試料受容通路612及び検体決定試料チャンバ614は、第2の試料受容通路620及び体液位相シフト試料チャンバ616から流体的かつ電気的に隔離されている(分かりやすさのために第1及び第2のパターン化導電体層が示されていない図3Tを特に参照されたい)。
The first
検査ストリップの様々な実施形態では、検査ストリップに付着された血液試料で測定される測定値には2種類の測定値がある。一方の測定値は血液試料中のグルコースの測定値であり、他方の測定値は同じ試料中の物理的特性の測定値(例えばヘマトクリット値)である。これらの測定(グルコース及びヘマトクリット値)は、順次、同時に行うか、又は持続時間が重なっていてもよい。例えば、グルコースの測定を最初に行ってから物理的特性(例えばヘマトクリット値)の測定を行うか、物理的特性(例えばヘマトクリット値)の測定を最初に行ってからグルコースの測定を行うか、又は一方の測定の持続時間が他方の測定の持続時間と重なってもよい。各測定値について、図4A、4B及び5に関して以下に詳細に述べる。 In various embodiments of the test strip, there are two types of measurements measured on a blood sample attached to the test strip. One measurement value is a measurement value of glucose in a blood sample, and the other measurement value is a measurement value (for example, hematocrit value) of a physical property in the same sample. These measurements (glucose and hematocrit values) may be made sequentially, simultaneously or with overlapping durations. For example, the measurement of glucose is performed first and then the physical property (for example, hematocrit value) is measured, the measurement of physical property (for example, the hematocrit value) is performed, and then the measurement of glucose is performed. The duration of one measurement may overlap the duration of the other measurement. Each measurement is described in detail below with respect to FIGS. 4A, 4B and 5.
図4Aは、検査ストリップ100及び本明細書の図3A〜3Tに示されるその変形例に印加される検査信号の代表的なチャートである。流体試料を検査ストリップ100(又はその変形例400、500、又は600)に付着させる前には、検査計測器200は、第2の作用電極と参照電極との間に約400mVの第1の検査信号が印加された流体検出モードにある。約400mVの第2の検査信号を、第1の作用電極(例えばストリップ100の電極12)と参照電極(例えばストリップ100の電極10)との間に同時に印加することが好ましい。あるいは、第1の検査信号の印加の時間間隔が、第2の検査電圧の印加の時間間隔と重なるように、第2の検査信号を同時期に印加してもよい。検査計測器は、開始時間0における生理学的流体検出の前の流体検出時間間隔TFDの間、流体検出モードであってもよい。流体検出モードでは、流体が検査ストリップ100(又はその変形例400、500、又は600)に付着されることによって流体が第2の作用電極14及び参照電極10を濡らした時点を検査計測器200が判定する。例えば、第2の作用電極14における測定検査電流の充分な増大によって生理学的流体が付着されたことを検査計測器200が認識すると、検査計測器200は時間0における0秒の表示を与え、検査時間間隔T1を開始させる。検査計測器200は、例えば1m秒毎〜100m秒毎といった適当なサンプリング速度で過渡電流出力をサンプリングする。検査時間間隔T1が経過した時点で、検査信号は除去される。簡単のため、図4Aは、検査ストリップ100(又はその変形例400、500、又は600)に印加された第1の検査信号のみを示している。
FIG. 4A is a representative chart of test signals applied to the
以下は、図4Aの検査電圧が検査ストリップ100(又はその変形例400、500、又は600)に印加される際に測定される既知の過渡電流(例えば、時間の関数としてμAで測定される電流応答)からどのように検体(例えばグルコース)濃度が決定されるかについての説明である。
The following is a known transient current (eg, current measured in μA as a function of time) measured when the test voltage of FIG. 4A is applied to test strip 100 (or
図4Aでは、検査ストリップ100(又は本明細書に述べられるその変形例)に印加される第1及び第2の検査電圧は、一般的に約+100mV〜約+600mVである。電極がカーボンインクを含み、メディエータがフィリシアニドであるような一実施形態では、検査信号は約+400mVである。当業者には周知であるように、他のメディエータと電極材料との組み合わせは、異なる検査電圧を必要とする。電圧の持続時間は一般に、反応時間後約1〜約5秒間であり、一般的には反応時間後約3秒間である。一般的に検査シーケンス時間TSは、時間t0に対して測定される。図4Aで電圧401がTSの持続時間にわたって維持される際、出力信号が生成され、図4Bに示されるように、第1の作用電極12の過渡電流702が時間0から生成し、同様に第2の作用電極14の過渡電流704も時間0に対して生成する。この過程を説明する目的で、過渡信号702及び704は、同じO参照点上に置かれているが、物理的用語では、軸L−Lに沿った作用電極12及び14のそれぞれに向かう流体の流れのために、2つの信号間にはわずかな時間差がある。しかしながら、過渡電流はサンプリングされ、同じ開始時間を有するようにマイクロコントローラで設定される。図4Bでは、過渡電流は、ピーク時間Tpの近傍のピークにまで高まり、その時点から電流は時間0の約2.5秒又は約5秒後までゆっくりと低下している。約5秒の点706において、作用電極12及び14のそれぞれの出力信号を測定し、互いに加え合わせることができる。また、作用電極12及び14の一方のみからの信号を2倍にしてもよい。
In FIG. 4A, the first and second test voltages applied to test strip 100 (or variations thereof described herein) are typically between about +100 mV and about +600 mV. In one embodiment where the electrode includes carbon ink and the mediator is filicyanide, the inspection signal is about +400 mV. As is well known to those skilled in the art, other mediator and electrode material combinations require different test voltages. The duration of the voltage is generally about 1 to about 5 seconds after the reaction time, and generally about 3 seconds after the reaction time. In general, the test sequence time T S is measured against the time t 0 . When the
再び図2Bを参照すると、システムは、複数の時点又は位置T1、T2、T3、...、TNのいずれか1つにおいて、作用電極(12及び14)の少なくとも一方からの出力信号IEを測定又はサンプリングするように信号を操作する。図4Bに見られるように、時間位置は、検査シーケンスTSの任意の時点又は間隔であってよい。例えば、出力信号が測定される時間位置は、1.5秒における単一の時点T1.5、又は、2.8秒付近の時点T2.8と重なる間隔708(例えば、システムのサンプリング速度に応じて約10m秒以上)でありうる。
Referring again to FIG. 2B, the system may be configured with a plurality of time points or positions T 1 , T 2 , T 3 ,. . . , T N , manipulate the signal to measure or sample the output signal IE from at least one of the working electrodes (12 and 14). As seen in Figure 4B, the time position can be any time or interval of the test sequence T S. For example, the time position at which the output signal is measured is a single time point T 1.5 at 1.5 seconds, or an
図3B〜3Tにおける特定の検査ストリップ100又はその変形例のバッチ校正コードのオフセット及びバッチ傾きの知見より、検体(例えばグルコース)濃度を計算することができる。
From the knowledge of the offset and batch tilt of the batch calibration code of the
「切片」及び「傾き」は、1群(バッチ)の検査ストリップから校正データを測定することにより得られる値である点に留意されたい。一般的に、約1500個のストリップ(場合によりそれ以上)がそのロット又はバッチからランダムに選択される。ドナーからの生理学的流体(例えば血液試料)を、様々な検体濃度、一般的には6つの異なるグルコース濃度にスパイクする。一般的には、12人の異なるドナーからの血液を6つの濃度のそれぞれにスパイクする。8個のストリップに同じドナー及び濃度より血液を与えることにより、そのロットについて合計で12×6×8≒約576回の検査が行われる。これらは、Yellow Spring Instrument(YSI)などの標準的な実験分析装置を用いてこれらの値を測定することによって、実際の検体濃度(例えば、血中グルコース濃度)に対してベンチマークされる。測定されたグルコース濃度のグラフを実際のグルコース濃度に対して(又は、測定された電流をYSI電流に対して)プロットし、このグラフに式y=mx+cを最小二乗法によりフィッティングすることにより、このロット又はバッチからの残りのストリップについてのバッチ傾きm及びバッチ切片cの値が得られる。 Note that “intercept” and “slope” are values obtained by measuring calibration data from a group of test strips. Generally, about 1500 strips (optionally more) are randomly selected from the lot or batch. Physiological fluid (eg, a blood sample) from the donor is spiked to various analyte concentrations, typically six different glucose concentrations. In general, blood from 12 different donors is spiked into each of six concentrations. By feeding blood from the same donor and concentration in 8 strips, a total of 12 × 6 × 8≈about 576 tests are performed on the lot. These are benchmarked against the actual analyte concentration (eg, blood glucose concentration) by measuring these values using a standard laboratory analyzer such as the Yellow Spring Instrument (YSI). By plotting the measured glucose concentration graph against the actual glucose concentration (or the measured current against the YSI current) and fitting the equation y = mx + c to this graph by the least squares method, this The values of batch slope m and batch intercept c for the remaining strips from the lot or batch are obtained.
上記に述べた様々な要素、システム、及び手順は、当該技術分野においてこれまでになかった検体測定システムを提供することを出願人に可能ならしめるものであることはここで特記するに値する。詳細には、このシステムは、基板と、基板上に配置され、それぞれの電極コネクタに接続された複数の電極とを有する検査ストリップを含んでいる。システムは更に、ハウジング、検査ストリップのそれぞれの電極コネクタに接続されるように構成された検査ストリップポート、及びマイクロプロセッサ300を有する検体計測器を含んでいる。マイクロプロセッサ300は、検査ストリップポートコネクタ220と電気的に導通していることにより電気信号を印加するか、又は複数の電極からの電気信号を検知する。
It is worth noting here that the various elements, systems, and procedures described above enable applicants to provide an analyte measurement system that has never been in the art. Specifically, the system includes a test strip having a substrate and a plurality of electrodes disposed on the substrate and connected to respective electrode connectors. The system further includes an analyte meter having a housing, a test strip port configured to be connected to a respective electrode connector of the test strip, and a
図2Bを参照すると、計測器200の好ましい一実現形態の詳細が示されており、図2A及び2Bのそれぞれにおいて同じ参照符合は共通の説明を有している。図2Bにおいて、検査ストリップポートコネクタ220は、物理的特性検知電極から信号を受信するためのインピーダンス検知線EIC、物理的特性検知電極に信号を流す交流信号線AC、参照電極用の参照線Ref、及び作用電極1及び作用電極2のそれぞれからの電流検知線(すなわち、Iwe1及びIwe2)を含む5本の線によってアナログインタフェース306に接続されている。コネクタ220には、検査ストリップが挿入されたことを示すストリップ検出線221も設けることができる。アナログインタフェース306は、(1)実効インピーダンスZ’、(2)仮想インピーダンスZ”、(3)バイオセンサの作用電極1からサンプリング又は測定される電流、すなわちIwe1、(4)バイオセンサの作用電極2からサンプリング又は測定される電流、すなわちIwe2の4つの入力をプロセッサ300に与える。振動信号AC(約25kHz〜250kHz又はそれ以上の任意の値の)を物理的特性検知電極に流すために、プロセッサ300からインタフェース306への出力が1つ設けられている。位相差P(単位=°)は、実効インピーダンスZ’及び仮想インピーダンスZ”から求めることができる。すなわち、
P=tan−1{Z”/Z’} 式3.1
また、インタフェース306の線Z’及びZ”から大きさM(単位=Ω、便宜上│Z│として書き表す)を求めることができる。すなわち、
Referring to FIG. 2B, details of one preferred implementation of
P = tan −1 {Z ″ / Z ′} Equation 3.1
Further, the size M (unit = Ω, written as | Z | for convenience) can be obtained from the lines Z ′ and Z ″ of the
![]()
![]()
このシステムでは、マイクロプロセッサは、(a)第1の信号を複数の電極に印加することにより生理学的流体試料の物理的特性から特定のサンプリング時点を決定し、(b)前記複数の電極に第2の信号を印加し、(c)前記決定された特定の時点における前記複数の電極の1つからの電流出力を測定することによって検体濃度を決定するように構成される。本明細書においては「特定の時点」は、「特定された時点」と呼ぶ場合もある。このシステムでは、検査ストリップ又はバイオセンサの複数の電極は、物理的特性を測定するための少なくとも2つの電極、及び検体濃度を測定するための少なくとも2つの他の電極を含む。例えば、前記少なくとも2つの電極及び前記少なくとも2つの他の電極は、基板上に設けられた同じチャンバ内に配置される。あるいは、前記少なくとも2つの電極及び前記少なくとも2つの他の電極は、基板上に設けられた異なるチャンバ内に配置される。特定の実施形態では、電極のすべてが基板によって形成される同じ平面上に配置される点を特記しておく。詳細には、本明細書に述べられる実施形態の特定のものでは、前記少なくとも2つの他の電極に近接して試薬が配置され、前記少なくとも2つの電極上には試薬は配置されない。このシステムにおいて特記に値する特徴の1つは、検査シーケンスの一部としてバイオセンサ上に生理学的試料が付着されてから約10秒以内に正確に検体を測定することが可能である点である。 In this system, the microprocessor (a) determines a particular sampling time from the physical characteristics of the physiological fluid sample by applying a first signal to the plurality of electrodes, and (b) applies a first signal to the plurality of electrodes. 2 is applied, and (c) the analyte concentration is determined by measuring a current output from one of the plurality of electrodes at the determined specific time point. In the present specification, the “specific time point” may be referred to as “specified time point”. In this system, the plurality of electrodes of the test strip or biosensor includes at least two electrodes for measuring physical properties and at least two other electrodes for measuring analyte concentration. For example, the at least two electrodes and the at least two other electrodes are disposed in the same chamber provided on the substrate. Alternatively, the at least two electrodes and the at least two other electrodes are disposed in different chambers provided on the substrate. Note that in certain embodiments, all of the electrodes are located on the same plane formed by the substrate. In particular, in certain of the embodiments described herein, a reagent is disposed proximate to the at least two other electrodes, and no reagent is disposed on the at least two electrodes. One feature that deserves special mention in this system is that the analyte can be accurately measured within about 10 seconds after the physiological sample is deposited on the biosensor as part of the test sequence.
図5に関連して、血液試料の物理的特性(例えばヘマトクリット値)を決定するための出願人の方法の説明を与える。図5では、システム200(図2)が、第1の周波数(例えば約25kHz〜250kHz又はそれ以上の)の第1の振動入力信号800を1対の電極に印加している。システムは、第3及び第4の電極からの第1の振動出力信号802を測定又は検出するようにも構成されており、これには詳細には第1の入力及び出力信号間の第1の時間差Δt1を測定することを行う。同時に、又は重なり合う持続時間において、システムは、第2の周波数(例えば約100kHz〜約1MHz又はそれ以上、好ましくは約250kHz)の第2の振動入力信号(簡単のため示されていない)を1対の電極に印加した後、第3及び第4の電極からの第2の信号出力信号を測定又は検出してもよく、これには第1の入力及び出力振動信号間の第2の時間差Δt2(図に示されていない)を測定することを行いうる。これらの信号から、システムは、第1及び第2の時間差Δt1及びΔt2に基づいて血液試料の物理的特性(例えばヘマトクリット値)を推定する。この後、システムは、グルコース濃度を導出することができる。物理的特性(例えばヘマトクリット値)の推定は、以下の形の式を適用することによって行うことができる。すなわち、
With reference to FIG. 5, a description of Applicant's method for determining a physical property (eg, hematocrit value) of a blood sample is provided. In FIG. 5, the system 200 (FIG. 2) applies a first
C1、C2、及びC3のそれぞれは、検査ストリップの操作定数であり、
m1は、回帰データからのパラメータを表す。
Each of C 1 , C 2 , and C 3 are test strip operating constants;
m 1 represents a parameter from the regression data.
この代表的な方法の詳細は、2011年9月2日出願の米国仮特許出願第61/530,795号「Hematocrit Corrected Glucose Measurements for Electrochemical Test Strip Using Time Differential of the Signals」(代理人整理番号DDI−5214USPSP)に見出すことができ、これは参照により本明細書に組み込まれる。 Details of this representative method can be found in US Provisional Patent Application No. 61 / 530,795, “Hematocrit Corrected Glucose Measurements for Electrochemical Test Striping Dim. -5214 USPSP), which is incorporated herein by reference.
物理的特性(例えばヘマトクリット値)を決定するための別の方法は、物理的特性(例えばヘマトクリット値)の2つの独立した測定値によるものでありうる。これは、(a)第1の周波数における血液試料のインピーダンス、及び(b)第1の周波数よりも大幅に高い第2の周波数における血液試料の位相角を決定することにより得ることができる。この方法では、血液試料を未知のリアクタンス及び未知の抵抗を有する回路としてモデル化することができる。このモデルでは、測定値(a)のインピーダンス(│Z│の表記により示される)は、印加される電圧、既知の抵抗器(例えば固有ストリップ抵抗)を挟んだ電圧、及び未知のインピーダンスVzを挟んだ電圧から求めることができ、同様に、位相角の測定値(b)は、当業者によって入力信号と出力信号との間の時間差から測定することができる。この方法の詳細は、2011年9月2日出願の同時係属中の米国仮特許出願第61/530,808号(代理人整理番号DDI5215PSP)に図示及び説明されており、参照により本明細書に組み込まれる。生理学的流体試料の物理的特性(例えばヘマトクリット値、粘性、又は密度)を決定するための他の適当な方法は、例えば、米国特許第4,919,770号、又はJoachim Wegener、Charles R.Keese及びIvar Giaever、Experimental Cell Research 259,158〜166(2000)doi:10.1006/excr.2000.4919に掲載された、オンライン上でhttp://www.idealibrary.comで利用可能な「Electric Cell−Substrate Impedance Sensing(ECIS)as a Noninvasive Means to Monitor the Kinetics of Cell Spreading to Artificial Surfaces」、Takuya Kohma、Hidefumi Hasegawa、Daisuke Oyamatsu及びSusumu Kuwabata、Bull.Chem.Soc.Jpn.Vol.80,No.1,158〜165(2007)に掲載された、「Utilization of AC Impedance Measurements for Electrochemical Glucose Sensing Using Glucose Oxidase to Improve Detection Selectivity」などでも利用することができ、これらはいずれも参照により組み込まれる。 Another method for determining physical properties (eg, hematocrit value) may be by two independent measurements of physical properties (eg, hematocrit value). This can be obtained by determining (a) the impedance of the blood sample at the first frequency and (b) the phase angle of the blood sample at a second frequency that is significantly higher than the first frequency. In this way, a blood sample can be modeled as a circuit with unknown reactance and unknown resistance. In this model, the impedance of the measured value (a) (indicated by the notation of | Z |) is the voltage applied, the voltage across a known resistor (eg, intrinsic strip resistance), and the unknown impedance Vz. Similarly, the phase angle measurement (b) can be determined from the time difference between the input signal and the output signal by those skilled in the art. Details of this method are illustrated and described in co-pending US Provisional Patent Application No. 61 / 530,808 (Attorney Docket No. DDI5215PSP) filed September 2, 2011, which is hereby incorporated by reference. Incorporated. Other suitable methods for determining the physical properties (eg, hematocrit, viscosity, or density) of a physiological fluid sample are described, for example, in US Pat. No. 4,919,770, or Joachim Wegener, Charles R., et al. Keese and Ivar Giaever, Experimental Cell Research 259, 158-166 (2000) doi: 10.1006 / excr. Http: //www.2000.919, online at http: // www. idealary. Available in the com "Electric Cell-Substrate Impedance Sensing (ECIS) as a Noninvasive Means to Monitor the Kinetics of Cell Spreading to Artificial Surfaces", Takuya Kohma, Hidefumi Hasegawa, Daisuke Oyamatsu and Susumu Kuwabata, Bull. Chem. Soc. Jpn. Vol. 80, no. 1, 158-165 (2007), “Utilization of AC Impedance Measurements for Electrochemical Glucose Sensing Using Glucose Oxidase to Improve Detection, etc.”
物理的特性(例えばヘマトクリット値、密度、又は温度)は、試料のインピーダンスの位相差(例えば位相角)及び大きさを知ることにより得ることができる。1つの例では、試料のインピーダンス特性(「IC」)の物理的特性の推定値として以下の関係式が与えられる。 Physical properties (eg, hematocrit value, density, or temperature) can be obtained by knowing the phase difference (eg, phase angle) and magnitude of the sample impedance. In one example, the following relationship is given as an estimate of the physical characteristic of the impedance characteristic (“IC”) of the sample.
![]()
P(式3.1より)は、入力信号と出力信号との間の位相差(単位=°)を表し、
y1は、約−3.2e−08及びその与えられた数値の±10%、5%又は1%であり、
y2は、約4.1e−03及びその与えられた数値の±10%、5%又は1%であり、
y3は、約−2.5e+01及びその与えられた数値の±10%、5%又は1%であり、
y4は、約1.5e−01及びその与えられた数値の±100%、5%又は1%であり、
y5は、約5.0及びその与えられた数値の±10%、5%又は1%である。
![]()
P (from Equation 3.1) represents the phase difference (unit = °) between the input signal and the output signal,
y 1 is about −3.2e−08 and ± 10%, 5% or 1% of the given value;
y 2 is about 4.1e-03 and ± 10%, 5% or 1% of the given value;
y 3 is about −2.5e + 01 and ± 10%, 5% or 1% of the given value;
y 4 is about 1.5e-01 and ± 100%, 5% or 1% of the given value;
y 5 is about 5.0 and ± 10%, 5% or 1% of the given value.
入力AC信号の周波数が高い(例えば75kHzよりも高い場合)、インピーダンスMの大きさに関係するパラメータ項y1及びy2は、ここで与えられる代表的な値の±200%とすることにより、パラメータ項のそれぞれが0又は更には負の値を含むことができる点を特記しておく。これに対して、入力AC信号の周波数が低い(例えば75kHzよりも低い場合)、位相角Pに関係するパラメータ項y4及びy5は、ここで与えられる代表的な値の±200%とすることにより、パラメータ項のそれぞれが0又は更には負の値を含むことができる。本明細書で使用するところのHの大きさとは、ICの大きさに概ね等しい。代表的な一実現形態では、H又はHCTなる用語は、H又はHCTなる用語がこの出願において使用されるときはICに等しい。 When the frequency of the input AC signal is high (for example, higher than 75 kHz), the parameter terms y 1 and y 2 related to the magnitude of the impedance M are set to ± 200% of the typical values given here, Note that each of the parameter terms can contain 0 or even a negative value. On the other hand, when the frequency of the input AC signal is low (for example, lower than 75 kHz), the parameter terms y 4 and y 5 related to the phase angle P are ± 200% of the typical values given here. Thus, each of the parameter terms can contain 0 or even a negative value. As used herein, the size of H is approximately equal to the size of the IC. In one exemplary implementation, the term H or HCT is equivalent to IC when the term H or HCT is used in this application.
別の代替的な実現形態では、式3.5が与えられる。式3.5は、式3.4におけるような位相角を用いることなく、正確な二次関係を導出するものである。 In another alternative implementation, Equation 3.5 is given. Equation 3.5 derives an accurate quadratic relationship without using a phase angle as in Equation 3.4.
ICは、インピーダンス特性[%]であり、
Mは、インピーダンスの大きさ[Ω]であり、
y1は、約1.2292e1及びその与えられた数値の±10%、5%又は1%であり、
y2は、約−4.3431e2及びその与えられた数値の±10%、5%又は1%であり、
y3は、約3.5260e4及びその与えられた数値の±10%、5%又は1%である。
IC is an impedance characteristic [%],
M is the impedance size [Ω],
y 1 is about 1.2292e1 and ± 10%, 5% or 1% of the given value;
y 2 is about −4.3431e2 and ± 10%, 5% or 1% of the given value;
y 3 is about 3.5260e4 and ± 10% of the given numerical value, is 5% or 1%.
本明細書において提供される様々な要素、システム、及び知見によれば、本出願人によって、例えば血液でありうる生理学的試料から検体濃度を決定する少なくとも1つの方法(及びこうした方法の変形例)が実現される。簡単に述べると、本出願人の方法は、生理学的流体試料の少なくとも1つの物理的特性(例えばヘマトクリット値又は粘性など)についての情報又はデータを得ることと、検査シーケンスサンプリング持続時間内の特定のサンプリング時間を導出することと、所定の信号を試料を通じて流すことと、前記検査シーケンスサンプリング持続時間の持続時間にわたって試料から第1の過渡信号出力を測定又はサンプリングすることと、前記検査シーケンスサンプリング持続時間内の前記特定のサンプリング時間を含む特定の時間の範囲を規定することと、前記特定の時間の範囲内のそれぞれの別個の時間間隔で前記第1の過渡信号の大きさを抽出することと、前記特定の時間の範囲内に含まれる前記第1の過渡信号の前記抽出された大きさに基づいて検体濃度を決定することと、を含む。 According to various elements, systems, and findings provided herein, applicants have determined at least one method (and variations of such methods) to determine analyte concentration from a physiological sample, which may be blood, for example. Is realized. Briefly, Applicants' method obtains information or data about at least one physical property (eg, hematocrit value or viscosity) of a physiological fluid sample, and a specific sequence within a test sequence sampling duration. Deriving a sampling time; flowing a predetermined signal through the sample; measuring or sampling a first transient signal output from the sample for a duration of the test sequence sampling duration; and the test sequence sampling duration. Defining a specific time range including the specific sampling time within, extracting the magnitude of the first transient signal at each distinct time interval within the specific time range; Based on the extracted magnitude of the first transient signal included within the specific time range. And determining the analyte concentration Te containing.
図6Aを参照すると、本方法は、工程904において、バイオセンサ(例えば、計測器に挿入された(工程902)、図3A(1〜6)〜3T、好ましくは図3A(1〜6)に示されるような検査ストリップ100の形態の)上に生理学的試料を付着させることを含む。計測器200を起動した後、ストリップ100(又はその変形例400、500、又は600)に電圧を印加し、試料を検査チャンバ上に付着すると、印加された電圧が試料中の検体を、検査チャンバ内の試薬と検体との酵素反応によって異なる形態に物理的に変換する。試料が検査セルの毛管通路に流入する際に、試料の少なくとも1つの物理的特性が得られる(工程908)。詳細には、物理的特性を得るか又は測定する工程(工程908)が、試料に第1の信号を印加して試料の物理的特性を導出することを含みうるのに対して、酵素反応を開始する(例えば試料及び試薬に電気信号を印加することにより)工程906は、検査シーケンスと一致しうる持続時間(第1のサンプリング持続時間)にわたって試料に第2の信号を流すことを含みうる。工程910で試料を通じて第2の信号を流す(電極を介して)ことにより、第1のサンプリング持続時間と同じであってよい所定の時間にわたって(電極を介して)試料から出力信号を測定することが可能である。出力信号は、本明細書では、大きさ(例えばμA)及び時間(例えばミリ秒)の両方に関して参照される第1の過渡信号(例えば、時間及び大きさに関連した図7Aの過渡曲線1002、1004、及び1006)として特徴付けることもできる。工程912において、特定のサンプリング時間Tの抽出又は決定が試料の物理的特性の値に基づいて行われる。特定のサンプリング時間Tが物理的特性からどのようにして抽出されるかについての説明は、本出願の後の部分に示す。再び図6Aを参照すると、工程914において、第1の過渡信号出力が、約0秒〜約10秒間の検査シーケンスサンプリング持続時間にわたって測定又はサンプリングされる(第1の過渡信号が時間及び大きさの両方に関連付けられ、時間に対する大きさ(例えば電流)のプロットを与える図7Aに表される)。工程916において、第1のサンプリング持続時間における特定のサンプリング時間Tを含む特定の時間の範囲(T1〜T2)が、第2のサンプリング持続時間として規定される。工程918において、前記特定の時間の範囲(又は第2のサンプリング持続時間)内に見られる第1の過渡信号(例えば1002a)の大きさが、システムプロセッサによって測定又はサンプリングされる。これらの大きさはいずれも工程918において測定されるが、工程920において、第2のサンプリング持続時間(又は特定の時間の範囲)内の異なる時間間隔で生じる選択された大きさのみがプロセッサによって使用されることによって、これらの大きさが検体濃度の値に変換される。
Referring to FIG. 6A, the method includes, in
第1の過渡信号の大きさを抽出して第2の過渡信号を与えるプロセスは、図7C及び7Dを参照して理解することができる。図7Cには、第1の過渡信号1002aが、大きさ(単位=μA、約20〜約180μA)及び時間(約0〜約7秒間の第1のサンプリング持続時間)に関して示されている。第1の過渡信号1002aの選択された大きさを抽出するには、システムは、「第2のサンプリング持続時間」として本明細書において特徴付けられる特定の時間の範囲T1〜T2を最初に規定しなければならない。これは特定のサンプリング時間Tを決定することによって行われる。
The process of extracting the magnitude of the first transient signal to provide the second transient signal can be understood with reference to FIGS. 7C and 7D. In FIG. 7C, the first
特定のサンプリング時間Tが決定された後、この特定の範囲の開始時間T1を、特定のサンプリング時間(単位=秒)と所定の時間A(やはり単位=秒)との差を取ることによって決定することができる。終了時間T2は、概ね特定のサンプリング時間Tに等しくなるように設定される。範囲T1〜T2が規定されると、システムはこの特定の時間範囲の外のすべての過渡信号を除去し、これは図7Dに示されている。この処理を可能とするため、残りの過渡信号(この時点で第2の過渡信号1002a’として規定される)を時間間隔(好ましくは均等な時間間隔であるが、不均等な時間間隔であってもよい)に分割し、図7Dに第2の過渡信号1002a’の各時間間隔について示されるように数字1〜22として示すことができる。このシステムは、各時間間隔についてできるだけ近い大きさの値を決定することができる。しかしながら、処理を簡単にするため、各時間間隔内でサンプリングされた大きさの平均をその特定の時間間隔の大きさとして用いることが好ましい。選択された大きさを計算する際の混乱を少なくするため、本明細書では図7Eに示されるように、図7Aの第1の過渡信号から抽出された他の過渡信号とともに開始時間T1が0秒に開始するように設定されるように第2の過渡信号1002a’をオフセットさせることができる点を特記しておく。
After the specific sampling time T is determined, the start time T1 of this specific range is determined by taking the difference between the specific sampling time (unit = second) and the predetermined time A (also unit = second). be able to. The end time T2 is set to be approximately equal to the specific sampling time T. Once the range T1-T2 is defined, the system removes all transient signals outside this particular time range, which is shown in FIG. 7D. To enable this processing, the remaining transient signal (defined at this point as the second
本出願人の方法についての大まかな説明が与えられたので、次に図6A又は6Bの工程の一部で用いられる特定の方法についての詳細を説明する。詳細には、第1の信号を印加する工程は、適当な電源(例えば計測器200)により与えられる交流信号を試料に流すことにより交流信号の出力から試料の物理的特性を決定することを含む。検出される物理的特性は、粘性、ヘマトクリット値、又は密度の1以上であってよい。これは、第1の周波数が第2の周波数よりも低い、それぞれの異なる周波数の第1及び第2の交流信号を流すことを含みうる。第1の周波数は、第2の周波数よりも少なくとも一桁低いことが好ましい。一例として、第1の周波数は、約10kHz〜約100kHzの範囲の任意の周波数であってよく、第2の周波数は約250kHz〜約1MHz又はそれ以上であってよい。本明細書で使用するところの「交流信号」なる語句は、極性が交互変化する信号の一定の部分、又は交流信号全体若しくは直流オフセットを有する交流又は更には直流信号と組み合わせられた多方向信号を有しうる。 Given a general description of Applicants' method, the details of the specific method used in some of the steps of FIG. 6A or 6B will now be described. Specifically, the step of applying the first signal includes determining the physical characteristics of the sample from the output of the AC signal by flowing an AC signal provided by a suitable power source (eg, instrument 200) through the sample. . The physical property detected may be one or more of viscosity, hematocrit value, or density. This may include flowing first and second alternating signals of different frequencies, the first frequency being lower than the second frequency. The first frequency is preferably at least an order of magnitude lower than the second frequency. As an example, the first frequency can be any frequency in the range of about 10 kHz to about 100 kHz, and the second frequency can be about 250 kHz to about 1 MHz or more. As used herein, the phrase “alternating current signal” refers to a multi-directional signal combined with a certain portion of a signal with alternating polarity, or the entire alternating signal or alternating or even a direct current signal with a direct current offset. Can have.
試料の物理的特性が適当な方法により決定又は得られたならば、その物理的特性を用いて特定のサンプリング時間Tを規定し、検査シーケンスの間のその時点で検査チャンバの出力信号を使用して測定された過渡出力信号を更に精製することで試料中の検体濃度の出力を与えることができる。詳細には、本出願人は、本明細書ではヘマトクリット値が検体濃度(μAで表された電流の大きさにより示される)と関連付けられている図7Aに示されるように、物理的特性(例えばヘマトクリット値)と検体濃度との間に一定の関係を見出したものである。この関係を更に調べることにより、本発明者は、本明細書では図7Bに線708として示されるように、試料の特定のサンプリング時間と試料の物理的特性(例えばヘマトクリット値)との間の直接的な関係を導出することができた。その結果、上記式4から試料の物理的特性(例えばヘマトクリット値)を知ることによって、図7Bの関係708を用いて特定のサンプリング時間を異なるレベルの物理的特性(例えばヘマトクリット値)に適合するように指定することでより一層正確なグルコース濃度の測定を実現することが可能である。
Once the physical properties of the sample have been determined or obtained by suitable methods, the physical properties are used to define a specific sampling time T and the test chamber output signal is used at that time during the test sequence. By further purifying the transient output signal measured in this manner, an output of the analyte concentration in the sample can be provided. In particular, Applicants have identified physical properties (e.g., as shown in FIG. 7A where hematocrit values are associated with analyte concentration (indicated by the magnitude of current expressed in μA) herein). A certain relationship was found between the hematocrit value) and the analyte concentration. By further investigating this relationship, the inventor has found that the direct relationship between a particular sampling time of the sample and a physical property of the sample (eg, hematocrit value), as shown herein as
図7Aでは、検体濃度(電流出力に比例する)が増大するにしたがって、高いグルコース濃度のピーク(1002a、1004a、及び1006aにより示される)が、中間のグルコース濃度(1002b、1004b、及び1006bにより示される)と比較して右側にシフトしていることが分かる。同様に、中間のグルコース濃度のピークは、低いグルコース濃度(1002c、1004c、及び1006c)と比較して図7Aの更に右側になっている。低グルコース濃度(1002c、1004c及び1006c)の安定状態に、中間のグルコース濃度(1002b、1004b及び1006b)よりも早く達していることも分かる。このパターンは、中間のグルコース濃度と比較して高いグルコース濃度(1002a、1004a及び1006b)で繰り返されている。 In FIG. 7A, as the analyte concentration (proportional to the current output) increases, high glucose concentration peaks (indicated by 1002a, 1004a, and 1006a) are indicated by intermediate glucose concentrations (1002b, 1004b, and 1006b). It can be seen that it has shifted to the right compared to Similarly, the intermediate glucose concentration peak is further to the right of FIG. 7A compared to low glucose concentrations (1002c, 1004c, and 1006c). It can also be seen that the steady state of low glucose concentrations (1002c, 1004c and 1006c) has been reached earlier than the intermediate glucose concentrations (1002b, 1004b and 1006b). This pattern is repeated at higher glucose concentrations (1002a, 1004a and 1006b) compared to the intermediate glucose concentration.
図7Aのデータより、本発明者は、検知された物理的特性とサンプリング時間との間に本明細書で図7Bの線708として示されるような二次関係を導出することができた。図7Bでは、曲線708は、約30%、42%、及び約55%のヘマトクリット値、及びこれらのヘマトクリット値の範囲のグルコースの値にフィッティングされている(図7Aより)。この近似曲線は本発明者により下の形の式であることが分かった。すなわち、
特定のサンプリング時間=x1Hx2+x3 式4
式中(便宜上)、
「特定のサンプリング時間」は、検査ストリップの出力信号をサンプリングする検査シーケンスの開始からのおおよその時点として指定され、
Hは、試料の物理的特性(例えばヘマトクリット値の形の)を表し、
x1は、約4.3e5であり、
x2は、約−3.9であり、
x3は、約4.8である。
From the data in FIG. 7A, the inventor was able to derive a quadratic relationship between the sensed physical property and the sampling time, as shown herein as
Specific sampling time = x 1 H x 2 + x 3 Equation 4
In the formula (for convenience),
The “specific sampling time” is specified as the approximate time from the start of the test sequence that samples the output signal of the test strip,
H represents the physical properties of the sample (eg in the form of a hematocrit value)
x 1 is about 4.3e5;
x 2 is about -3.9,
x 3 is about 4.8.
本方法は1つのみのサンプリング時点を示してもよいが、本方法は、必要な数だけの時点のサンプリングを含んでもよく、例えば、検査シーケンスの開始から、開始後少なくとも約10秒以下まで、複数の別個の時点にわたって、又は連続的に(例えば10ミリ秒毎〜100ミリ秒毎などの特定のサンプリング時間において、又は所定の時間にわたって連続して)電流出力をサンプリングし、その結果を保存して検査シーケンスの終了近くに処理することが含まれうる。出願人は、適当なサンプリング時間は検査シーケンスの開始から測定されるが、任意の適当なデータを利用して出力電流をいつサンプリングするかを決定することができる点を指摘しておく。実用上の問題として、例えば100ミリ秒毎、又は更には約1ミリ秒毎に1回のサンプリングといったように、検査シーケンス全体の間に適当なサンプリング時間間隔で出力電力をサンプリングするようにシステムをプログラムすることができる。この変形例では、特定のサンプリング時間は、第1のサンプリング持続時間の特定の時間範囲を更に決定するために用いられる値である。 Although the method may indicate only one sampling time point, the method may include sampling as many time points as necessary, for example from the start of the test sequence to at least about 10 seconds or less after the start. Sample the current output over multiple discrete time points or continuously (eg, at a specific sampling time, such as every 10 milliseconds to 100 milliseconds, or continuously over a predetermined time) and save the results Processing near the end of the inspection sequence. Applicant points out that the appropriate sampling time is measured from the beginning of the test sequence, but any suitable data can be used to determine when to sample the output current. As a practical matter, the system can be configured to sample the output power at appropriate sampling time intervals during the entire test sequence, for example, every 100 milliseconds, or even about once every 1 millisecond. Can be programmed. In this variation, the specific sampling time is a value used to further determine a specific time range of the first sampling duration.
約0〜約7秒の検査シーケンスの特定のサンプリング時間について式4から計算する代わりに、本明細書で表1に関連して代表的に表されるルックアップテーブルを、式4に代えるか又は式4に加えて用いることによって適当なサンプリング時点を指定することもできる。表1では、検体濃度を決定するためにバイオセンサの信号出力がサンプリング又は測定される適当な時間を検索するために物理的特性の値がシステムのプロセッサによって使用される。例えば、物理的特性、この場合ではヘマトクリット値33%が決定された時点で、バイオセンサ100の信号出力が検体濃度の決定に使用される時間を表1から拾うことができるが、これにより特定のサンプリング時間は、検査シーケンスの開始の約5.32秒後であることが示される。
Instead of calculating from
第1の信号を印加する工程と、第2の信号を流す工程とは、その順序が、第1の信号に続いて第2の信号であるか若しくは両方の信号が順番に重なり合うか、又は第2の信号に続いて第1の信号であるか若しくは両方の信号が順番に重なり合うという点で連続した順序であることは特記すべきである。また、第1の信号を印加する工程と、第2の信号を流す工程とが同時に起こってもよい。 The step of applying the first signal and the step of flowing the second signal are in the order of the second signal following the first signal, or both signals overlap in order, or It should be noted that the second signal is followed by the first signal or a sequential order in that both signals overlap in order. Further, the step of applying the first signal and the step of flowing the second signal may occur simultaneously.
好ましい実施形態では、グルコース濃度についての電流出力の測定は、物理的特性(例えばヘマトクリット値)の推定よりも前に行われる。また、物理的特性(例えばヘマトクリット値)をグルコース濃度の測定の前に推定、測定、又は得てもよい。 In a preferred embodiment, the measurement of current output for glucose concentration is made prior to the estimation of physical properties (eg, hematocrit value). In addition, physical characteristics (eg, hematocrit value) may be estimated, measured, or obtained prior to measurement of glucose concentration.
図6Bを参照して、図6Aの方法を改良したものについて述べる。工程900〜910は、図6Aを参照して述べたものと同じであり、したがって簡単のために繰り返すことはしない。工程912’において、第1のサンプリング持続時間内の特定のサンプリング時間Tが、試料の物理的特性に基づいて規定される。工程914’において、特定のサンプリング時間Tに基づいて第2のサンプリング持続時間が規定される。第2の過渡信号(図7Dの1002a’)は、図7Dの特定の時間の範囲T1〜T2の外側にある第1の過渡信号1002aの大きさ(図7C)を消去することによって得られる。このプロセスにより、第1の過渡信号(図7Cの1002a)から第2の過渡信号(図7Dの1002a’)が得られる。図7Dに示されるように、特定の時間の範囲T1〜T2は特定の時間Tを含んでいる。詳細には、T1は特定のサンプリング時間Tと所定の時間Aとの間の差に概ね等しく、T2は特定のサンプリング時間Tに概ね等しい。別の実施形態では、T1は特定のサンプリング時間TとAとの差の絶対値に概ね等しく、その場合、T2はTに概ね等しい。好ましい実施形態では、Aは約4.2秒である。図6A又は6Bの工程920を参照すると、本明細書において既知の検体濃度の正確度を決定するための基準値又はデータ値と呼ばれる実験室の基準検体濃度と比較して、実際に測定された、大量の既知の検体濃度に基づいて本出願人により導出された様々な数学的アルゴリズムに特定の選択された第2の過渡信号(例えば1002a’)の大きさを適用することにより、工程920で検体濃度を決定することができる。詳細には、第1のアルゴリズムは、5つの異なる第2の過渡信号の大きさを用いて検体濃度(G)に達することができる。第2の過渡信号の大きさは、通常、nAで表されることから、切片は通常nAで表され、傾きは通常nA/(mg/dL)で表され、検体濃度はng/dLで与えられる。第1の検体濃度アルゴリズムは本明細書において式5として表される。すなわち、
With reference to FIG. 6B, an improvement on the method of FIG. 6A will be described. Steps 900-910 are the same as described with reference to FIG. 6A and are therefore not repeated for simplicity. In step 912 ', a specific sampling time T within the first sampling duration is defined based on the physical properties of the sample. In step 914 ', a second sampling duration is defined based on the specific sampling time T. The second transient signal (1002a 'in FIG. 7D) is obtained by eliminating the magnitude (FIG. 7C) of the first
I1=時間間隔17における信号の大きさ(T1から約3.3秒)であり、
I2=時間間隔13における信号の大きさ(開始時間T1から約2.5秒)であり、
I3=時間間隔5における信号の大きさ(開始時間T1から約0.9秒)であり、
I4=時間間隔3における信号の大きさ(開始時間T1から約0.5秒)であり、
I5=時間間隔22における信号の大きさ(開始時間T1から約4.3秒)であり、
x1=0.7503、x2=337.27、x3=(−)16.811、x4=1.4128、x5=2.6707であり、
ただし、上記に述べたように、第2の過渡信号の大きさはnAで表すことができ、x2はnAで表すことができ、x3はnA/(mg/dL)で表すことができる。
I 1 = signal magnitude at time interval 17 (approximately 3.3 seconds from T1);
I 2 = signal magnitude at time interval 13 (approximately 2.5 seconds from start time T1),
I 3 = signal magnitude at time interval 5 (approximately 0.9 seconds from start time T1),
I 4 = signal magnitude at time interval 3 (approximately 0.5 seconds from start time T1),
I 5 = signal magnitude at time interval 22 (approximately 4.3 seconds from start time T1),
x 1 = 0.7503, x 2 = 337.27, x 3 = (−) 16.811, x 4 = 1.4128, x 5 = 2.6707,
However, as mentioned above, the magnitude of the second transient signal can be represented by nA, x 2 can be represented by nA, x 3 can be represented by nA / (mg / dL) .
このアルゴリズムの第2の変形例では、抽出された第2の過渡信号の2つの大きさのみを使用して、この場合はグルコースである検体濃度(G)を決定することができる。第2のアルゴリズムは式6により表される。すなわち、
In a second variant of this algorithm, only two magnitudes of the extracted second transient signal can be used to determine the analyte concentration (G), in this case glucose. The second algorithm is represented by
I1=時間間隔11における信号の大きさ(開始時間T1から約2.1秒)であり、
I2=時間間隔7における信号の大きさ(開始時間T1から約1.3秒)であり、
x1=0.5865、x2=2.5099、x3=(−)12.738、x4=(−)188.31、x5=9.1996であり、
ただし、上記に述べたように、第2の過渡信号の大きさはnAで表すことができ、x4はnAで表すことができ、x5はnA/(mg/dL)で表すことができる。
I 1 = signal magnitude at time interval 11 (approximately 2.1 seconds from start time T1),
I 2 = signal magnitude at time interval 7 (approximately 1.3 seconds from start time T1),
x 1 = 0.5865, x 2 = 2.5099, x 3 = (−) 12.738, x 4 = (−) 188.31, x 5 = 9.11996,
However, as mentioned above, the magnitude of the second transient signal can be represented by nA, x 4 can be expressed by nA, x 5 can be expressed by nA / (mg / dL) .
このアルゴリズムの第3の変形例では、第2の過渡信号の3つの大きさのみを使用して、この場合はグルコースである検体濃度(G)を決定することができる。第3のアルゴリズムは式7により表される。すなわち、
In a third variation of this algorithm, only three magnitudes of the second transient signal can be used to determine the analyte concentration (G), in this case glucose. The third algorithm is represented by
I1=時間間隔20における信号の大きさ(開始時間T1から約3.9秒)であり、
I2=時間間隔22における信号の大きさ(開始時間T1から約4.3秒)であり、
I3=時間間隔19における信号の大きさ(開始時間T1から約3.7秒)であり、
x1=20.154、x2=1.0446、x3=0.9546、x4=1.3894、x5=(−)0.7141、x6=0.1163であり、
ただし、上記に述べたように、第2の過渡信号の大きさはnAで表すことができ、x5はnAで表すことができ、x6はnA/(mg/dL)で表すことができる。
I 1 = signal magnitude at time interval 20 (approximately 3.9 seconds from start time T1),
I 2 = the magnitude of the signal at time interval 22 (approximately 4.3 seconds from start time T1),
I 3 = signal magnitude at time interval 19 (approximately 3.7 seconds from start time T1),
x 1 = 20.154, x 2 = 1.0446, x 3 = 0.9546, x 4 = 1.3894, x 5 = (−) 0.7141, x 6 = 0.1163,
However, as mentioned above, the magnitude of the second transient signal can be represented by nA, x 5 can be represented by nA, x 6 can be expressed by nA / (mg / dL) .
このアルゴリズムの第4の変形例では、第2の過渡信号の5つの大きさを使用して、この場合はグルコースである検体濃度(G)を決定することができる。第4のアルゴリズムは式8により表される。すなわち、
In a fourth variation of this algorithm, five magnitudes of the second transient signal can be used to determine the analyte concentration (G), in this case glucose. The fourth algorithm is represented by
I1=時間間隔5における信号の大きさ(開始時間T1から約0.9秒)であり、
I2=時間間隔1における信号の大きさ(開始時間T1から約0.1秒)であり、
I3=時間間隔2における信号の大きさ(開始時間T1から約0.3秒)であり、
I4=時間間隔10における信号の大きさ(開始時間T1から約1.9秒)であり、
I5=時間間隔22における信号の大きさ(開始時間T1から約4.3秒)であり、
x1=0.7060、x2=0.4864、x3=28.5946、x4=0.6979、x5=15.5099であり、
ただし、上記に述べたように、第2の過渡信号の大きさはnAで表すことができ、x5はnAで表すことができ、x4はnA/(mg/dL)で表すことができる。
I 1 = signal magnitude at time interval 5 (approximately 0.9 seconds from start time T1),
I 2 = the magnitude of the signal in time interval 1 (about 0.1 second from start time T1),
I 3 = signal magnitude at time interval 2 (approximately 0.3 seconds from start time T1),
I 4 = signal magnitude at time interval 10 (approximately 1.9 seconds from start time T1),
I 5 = signal magnitude at time interval 22 (approximately 4.3 seconds from start time T1),
x 1 = 0.7060, x 2 = 0.4864, x 3 = 28.5946, x 4 = 0.6979, x 5 = 15.5099,
However, as mentioned above, the magnitude of the second transient signal can be represented by nA, x 5 can be represented by nA, x 4 can be expressed by nA / (mg / dL) .
このアルゴリズムの第5の変形例では、第2の過渡信号の4つの大きさを使用して、この場合はグルコースである検体濃度(G)を決定することができる。第5のアルゴリズムは式9により表される。すなわち、 In a fifth variation of this algorithm, the four magnitudes of the second transient signal can be used to determine the analyte concentration (G), in this case glucose. The fifth algorithm is represented by Equation 9. That is,
I1=時間間隔19における信号の大きさ(開始時間T1から約3.7秒)であり、
I2=時間間隔16における信号の大きさ(開始時間T1から約3.1秒)であり、
I3=時間間隔11における信号の大きさ(開始時間T1から約2.1秒)であり、
I4=時間間隔5における信号の大きさ(開始時間T1から約0.9秒)であり、
x1=(−)1.6842、x2=0.9527、x3=(−)4.9724、x4=6.2936、x5=3.0770、x6=(−)5.8427、
x7=(−)0.4714、x8=0.0079であり、
ただし、上記に述べたように、第2の過渡信号の大きさはnAで表すことができ、x7はnAで表すことができ、x8はnA/(mg/dL)で表すことができる。
I 1 = signal magnitude at time interval 19 (approximately 3.7 seconds from start time T1),
I 2 = signal magnitude at time interval 16 (approximately 3.1 seconds from start time T1);
I 3 = signal magnitude at time interval 11 (approximately 2.1 seconds from start time T1),
I 4 = signal magnitude at time interval 5 (approximately 0.9 seconds from start time T1),
x 1 = (-) 1.6842, x 2 = 0.9527, x 3 = (-) 4.9724, x 4 = 6.2936, x 5 = 3.0770, x 6 = (-) 5.8427 ,
x 7 = (−) 0.4714, x 8 = 0.0079,
However, as mentioned above, the magnitude of the second transient signal can be represented by nA, x 7 can be represented by nA, x 8 can be represented by nA / (mg / dL) .
このアルゴリズムの第6の変形例では、第2の過渡信号の4つの大きさを使用して、この場合はグルコースである検体濃度(G)を決定することができる。第6のアルゴリズムは式10により表される。すなわち、
In a sixth variation of this algorithm, the four magnitudes of the second transient signal can be used to determine the analyte concentration (G), in this case glucose. The sixth algorithm is represented by
I1=時間間隔16における信号の大きさ(開始時間T1から約3.1秒)であり、
I2=時間間隔5における信号の大きさ(開始時間T1から約0.9秒)であり、
I3=時間間隔12における信号の大きさ(開始時間T1から約2.3秒)であり、
I4=時間間隔14における信号の大きさ(開始時間T1から約2.7秒)であり、
x1=1.1842、x2=0.9740、x3=(−)11.316、x4=38.763、x5=(−)39.319、x6=0.0928であり、
x7=(−)0.8503、x8=1.7545、x9=(−)9.3804、x10=0.2465であり、
ただし、上記に述べたように、第2の過渡信号の大きさはnAで表すことができ、x9はnAで表すことができ、x10はnA/(mg/dL)で表すことができる。
I 1 = signal magnitude at time interval 16 (approximately 3.1 seconds from start time T1),
I 2 = signal magnitude at time interval 5 (approximately 0.9 seconds from start time T1),
I 3 = signal magnitude at time interval 12 (approximately 2.3 seconds from start time T1),
I 4 = signal magnitude at time interval 14 (approximately 2.7 seconds from start time T1),
x 1 = 1.1842, x 2 = 0.9740, x 3 = (−) 11.316, x 4 = 38.763, x 5 = (−) 39.319, x 6 = 0.0928,
x 7 = (−) 0.8503, x 8 = 1.7545, x 9 = (−) 9.3804, x 10 = 0.2465,
However, as mentioned above, the magnitude of the second transient signal can be represented by nA, x 9 can be expressed by nA, x 10 can be expressed by nA / (mg / dL) .
測定される式5〜10における電流出力(例えばI1、I2、I3、I4、I5)のそれぞれは、1個の作用電極を有するバイオセンサにおける1個の作用電極からの電流出力であるか、又は複数の作用電極が存在する場合には、複数の作用電極を有するバイオセンサにおける複数の作用電極からの電流出力の合計でありうる点を特記しておく。代表的な実施形態では、特定のサンプリング時点における電流出力(例えばI1、I2、I3、I4、I5)のそれぞれは、代表的なバイオセンサ100の作用電極12及び14からの電流出力の合計又は和である。例えば、式10において、第16番目の時間間隔(約3.1秒)における第1の作用電極の電流出力が120nAであり、同じ時間間隔(約3.1秒)における第2の作用電極の電流出力が150nAである場合、I1の大きさは両方の値の合計、したがって270nAとなる。同様に、I2の電流出力は、第5番目の時間間隔(約0.9秒)における第1の作用電極12からの電流出力と、第5番目の時間間隔における第2の作用電極14からの電流出力との合計である。電流の残部は、式10について同じ要領で得られる。
Current output in Equation 5-10 is measured (e.g. I 1, I 2, I 3 , I 4, I 5) each, the current output from one of the working electrode in a biosensor having one working electrode Note that in the case where there are a plurality of working electrodes, the current output from the plurality of working electrodes in a biosensor having a plurality of working electrodes can be mentioned. In the exemplary embodiment, each of the current outputs (eg, I 1 , I 2 , I 3 , I 4 , I 5 ) at a particular sampling time is determined by the current from the working
各サンプリング時間における各作用電極から合計された全電流の代わりに、各サンプリング時間における各作用電極からの電流の平均を、本明細書に述べられる式5〜10で使用することも可能であり、これには無論のこと、各サンプリング時点の測定電流が互いに足し合わされる実施形態と比較してより低い各サンプリング時間における測定電流を説明するために操作係数(当業者には周知である)に適当な改変を行うことをともなう。また、式5〜10に必要とされる各サンプリング時間における測定電流の平均を2倍し、上記の例におけるような操作係数を導出する必要なくして使用することができる。 Instead of the total current summed from each working electrode at each sampling time, the average of the current from each working electrode at each sampling time can also be used in equations 5-10 described herein, Of course, this is appropriate for the operating factor (well known to those skilled in the art) to account for the measured current at each lower sampling time compared to the embodiment where the measured currents at each sampling time are summed together. It involves making various modifications. Moreover, the average of the measurement current in each sampling time required for Formulas 5-10 can be doubled, and it can be used without having to derive an operation coefficient as in the above example.
したがって、本明細書において与えられる教示の別の利点として、本明細書では図8Aの既知の検査ストリップにおいて示されるような30%、42%、及び55%のヘマトクリット値について±20%の高めのバイアス又は誤差を生じる既知の方法と比較して検体検査測定の高い精度が実現される。詳細には、検査シーケンスを開始するためにバッチの各検査ストリップに基準濃度の検体を含む基準試料を導入する、通常は約845個(及び場合により1バッチ当たり100万個の試料(又は検査ストリップ))の試料のバッチとして検査ストリップのバッチが与えられる方法が提供される。本方法は、検体を反応させて2個の電極間の試薬と検体を反応させて検体の物理的変換を引き起こす工程と、基準試料の物理的特性を決定する工程と、前記物理的特性によって一般的に影響されない特定の複数のサンプリング時点を選択する工程と、検査ストリップのバッチの検体濃度の値の少なくとも95%が、本明細書の図8B、8C、8D、8E、8F、及び8Gに示されるように約30%〜約55%のヘマトクリット値(例えば約42%のヘマトクリット値)の範囲において基準検体濃度の±15%以内となるように前記複数の特定のサンプリング時点に基づいて検体濃度を決定する工程と、を含む。 Thus, another advantage of the teaching provided herein is that the present specification provides an increase of ± 20% for hematocrit values of 30%, 42%, and 55% as shown in the known test strip of FIG. 8A. High accuracy of analyte test measurements is achieved compared to known methods that produce bias or errors. Specifically, a reference sample containing a reference concentration of analyte is introduced into each test strip of the batch to initiate a test sequence, typically about 845 (and possibly 1 million samples per batch (or test strip) )) A batch of test strips is provided as a batch of samples. The method generally comprises a step of reacting a specimen to cause a reagent between the two electrodes to react with the specimen to cause physical conversion of the specimen, a step of determining physical characteristics of a reference sample, and the physical characteristics. And selecting at least 95% of the analyte concentration values for a batch of test strips is shown in FIGS. 8B, 8C, 8D, 8E, 8F, and 8G herein. The sample concentration based on the plurality of specific sampling time points so that it is within ± 15% of the reference sample concentration within a range of about 30% to about 55% hematocrit value (eg, about 42% hematocrit value). Determining.
図8A〜8Gのそれぞれにおいて、本明細書で述べる方法によるグルコース測定の改善を定量化するため、ストリップのバッチで実験を行った(この場合では約845個のストリップ試料)。この改善の定量化は、異なるレベルのヘマトクリット値において「バイアス」により示すことができる。次に、グルコース測定における相対誤差の推定であるバイアスを、本明細書に述べられる方法によって決定された各グルコース濃度に関して計算した。各グルコース濃度におけるバイアスは、以下の形の式によって決定した。すなわち、
バイアス絶対値≒G計算値−G基準値(G基準値が100mg/dLグルコース未満の場合)、かつ
In each of FIGS. 8A-8G, experiments were performed on batches of strips (in this case about 845 strip samples) to quantify the improvement in glucose measurement by the methods described herein. This quantification of improvement can be indicated by “bias” at different levels of hematocrit. Next, a bias, which is an estimate of the relative error in the glucose measurement, was calculated for each glucose concentration determined by the method described herein. The bias at each glucose concentration was determined by an equation of the form That is,
Bias absolute value≈G calculated value− G reference value (when the G reference value is less than 100 mg / dL glucose), and
式中、バイアス絶対値は、バイアスの絶対値であり、
バイアス%は、バイアス率(%)であり、
G計算値は、本明細書の方法によって決定されるグルコース濃度であり、
G基準値は、基準グルコース濃度である。
Where the absolute bias value is the absolute bias value,
Bias % is the bias rate (%)
The G calculated value is the glucose concentration determined by the method herein,
The G reference value is a reference glucose concentration.
図8Aにおいて、既知の検査ストリップにおいて誤差又はバイアスについて結果をプロットした場合、低いヘマトクリット値(30%)におけるグルコース濃度は、100mg/dL以上の濃度のグルコース濃度では20%よりも大きいかなりのバイアスを示している。他のヘマトクリット値の範囲(55%)では、バイアスは100mg/dL以上のグルコース濃度でやはりかなり高い。 In FIG. 8A, when the results are plotted for error or bias in a known test strip, the glucose concentration at a low hematocrit value (30%) shows a significant bias greater than 20% for glucose concentrations above 100 mg / dL. Show. In the other hematocrit range (55%), the bias is still quite high at glucose concentrations above 100 mg / dL.
これとまったく対照的に、本発明の方法を適用した場合、図8B、8C、8D、8E、8F、及び8Gより、ヘマトクリット値の両端の値(30%又は55%)におけるグルコース濃度はこの場合、グルコース濃度が100mg/dL以上であるか否かによらず、+15%及び−15%のバイアスの範囲内にあることが分かる。 In stark contrast, when the method of the present invention is applied, the glucose concentration at the end of the hematocrit value (30% or 55%) is shown in this case from FIGS. 8B, 8C, 8D, 8E, 8F, and 8G. It can be seen that the glucose concentration is within the range of + 15% and −15% bias regardless of whether the glucose concentration is 100 mg / dL or more.
グルコースデータの重心をヘマトクリット値に対してプロットした場合、データの中心軌跡は、30%、42%及び55%のグルコース濃度における重心間に延びる線1100を規定する。線1100は負の傾きを示しており、したがって低いヘマトクリット値(30%)〜高いヘマトクリット値(55%)の結果のバイアスの変動を示している。予期せざる点として、本明細書で提供される実施形態では、図8B、8C、8D、8E、8F及び8Gにおいて、グルコース濃度データの重心は、30%、42%又は55%のヘマトクリット値のパラメータとは関係なく、0バイアスで概ね平坦であることが分かる。詳細には、本発明者の第1の新規な方法の一部として式5を用いた図8Bに関して、低い、中間、又は高いヘマトクリット値についてグルコースデータの重心を結ぶ線1102は実質上水平又は平坦である。本発明者の第2の新規な方法の一部として式6を用いた図8Cに関して、3つのヘマトクリット値パラメータにおけるデータの重心を結ぶ線1104は、線1102ほどには平坦ではない。それでも、線1104の傾きは図8Aにおける既知の方法の線1100と比較した場合にはほとんど目立たない程度である。グルコース濃度を決定するための本発明者の第3の新規な方法の一部として式7を用いた図8Dに関して、データの重心を結ぶ線1106は、やはり図8Bの線1102ほどには平坦ではない。それでも、線1106の傾き(図8D)は、既知の方法の線1100(図8A)と比較した場合にはほとんど目立たない程度である。グルコース濃度を決定するための本発明者の第4の新規な方法の一部として式8を用いた図8Eに関して、データの重心を結ぶ線1108は、実質上平坦であり、ヘマトクリット値の両端の値の間のバイアスの変動が実質上目立たない程度であることを示している。本発明者の第5及び第6のそれぞれの新規な方法の一部として式9及び10をそれぞれ用いた図8F及び8Gに関して、グルコース濃度のデータの重心を結ぶ線(1110又は1112)(図8F及び8Gのそれぞれについて)は、やはりこれらの図のそれぞれにおいて実質上平坦である。
When the centroid of glucose data is plotted against the hematocrit value, the central locus of the data defines a
本出願人は、グルコース値の結果G1〜G6を与える(図8B〜8Gのそれぞれにおいて)上記に示した式は、検査ストリップ100(図3A(1)、3A(5)及び3A(6)に一般的に示される)を使用して得られたものであることを特記しておく。検査ストリップがサイズの異なる様々な電極(作用電極を含む)と使用される場合、除数パラメータ(例えば式10のx10)を、ストリップのそれぞれのサイズに固有の電流出力を測定し、電流出力の回帰分析を行って除数パラメータの調整を行うことによって調整する必要がある。 Applicants give the results G 1 -G 6 of glucose values (in each of FIGS. 8B-8G), the equation shown above is the test strip 100 (FIGS. 3A (1), 3A (5) and 3A (6 Note that it was obtained using When the test strip is used with various electrodes of different sizes (including the working electrode), the divisor parameter (eg, x 10 in Equation 10) is used to measure the current output specific to each size of the strip and Adjustment is necessary by performing regression analysis and adjusting divisor parameters.
本出願人は、6つの式はいずれも、正確なグルコース濃度の結果を与えるという点で同等であるが、それぞれの長所及び短所があることを更に特記しておく。これらの式の組み合わせを用いることによって異なる範囲にわたって最適な性能をカバーすることができる。例えば式10を低いグルコース濃度に対して用い、式5を高いグルコースに対して用いることができる。また、すべて又は一部の式を様々な順列で一緒に使用することにより、操作パラメータに応じてグルコース値の大きな変動を説明するグルコース濃度を導出することが可能である。
Applicants further note that although all six equations are equivalent in that they give accurate glucose concentration results, there are advantages and disadvantages of each. By using a combination of these equations, optimal performance can be covered over different ranges. For example,
本明細書に述べられる方法は、グルコースの決定を対象としたものであるが、こうした方法は、検体が存在する流体試料の物理的特性によって影響される他の検体に適用することも可能である(当業者により適宜改変して)。例えば、血液試料の物理的特性(例えば、ヘマトクリット値、粘性、温度又は密度)を、血液試料中のケトン又はコレステロールを決定するうえで利用することができる。他のバイオセンサの構成も利用可能である。例えば、以下の米国特許に図示及び述べられるバイオセンサを、本明細書に述べられる様々な実施形態とともに使用することができる。すなわち、米国特許第6179979号、同第6193873号、同第6284125号、同第6413410号、同第6475372号、同第6716577号、同第6749887号、同第6863801号、同第6890421号、同第7045046号、同第7291256号、同第7498132号(これらはすべて、参照により全体が本明細書に組み込まれる)。 Although the methods described herein are directed to the determination of glucose, such methods can also be applied to other analytes that are affected by the physical properties of the fluid sample in which the analyte is present. (Modified as appropriate by those skilled in the art). For example, the physical properties of a blood sample (eg, hematocrit value, viscosity, temperature, or density) can be utilized in determining ketones or cholesterol in the blood sample. Other biosensor configurations are also available. For example, the biosensors shown and described in the following US patents can be used with the various embodiments described herein. That is, U.S. Pat. 7045046, 7291256, 7498132, all of which are incorporated herein by reference in their entirety.
知られているように、物理的特性の検出は交流信号によって行う必要はなく、他の方法によって行うこともできる。例えば、適当なセンサを利用して粘性又は他の物理的特性を決定することができる(例えば米国特許出願公開第20100005865号、又は欧州特許出願公開第EP1804048 B1号)。また、下記文献に述べられるヘマトクリット値と粘性との間の既知の関係に基づいて粘性を決定し、これを用いてヘマトクリット値を導出することもできる(「Blood Rheology and Hemodynamics」by Oguz K.Baskurt,M.D.,Ph.D.,1 and Herbert J.Meiselman,Sc.D.,Seminars in Thrombosis and Hemostasis,volume 29,number 5,2003)。
As is known, the detection of physical properties need not be performed by an AC signal, but can be performed by other methods. For example, a suitable sensor can be used to determine viscosity or other physical properties (eg, US Patent Application Publication No. 20100005865, or European Patent Application Publication No. EP1804048 B1). It is also possible to determine the viscosity based on a known relationship between the hematocrit value and the viscosity described in the following document, and use this to derive the hematocrit value (“Blood Rheology and Hemodynamics” by Oguz K. Baskart. , MD, Ph.D., 1 and Herbert J. Meiselman, Sc. D., Seminars in Thrombosis and Hemostasis,
上記に述べたように、マイクロコントローラ又は同等のマイクロプロセッサ(及び、例えば図2Bのプロセッサ300などのマイクロコントローラが、意図される環境において意図される目的のために機能することを可能とする付属の要素)をコンピュータコード又はソフトウェアインストラクションとともに使用することによって本明細書に述べられる方法及び技術を実行することができる。本出願人は、図2Bの代表的なマイクロコンピュータ300(プロセッサ300の機能操作に適した要素とともに)には、図6A又は6Bの論理図を表すファームウェアが組み込まれ、コンピュータソフトウェアがロードされるものであり、このようなマイクロコントローラ300は、付属するコネクタ220及びインタフェース306並びにこれらの相当物とともに、(a)検査ストリップの複数の電極に付着された試料の検知又は推定された物理的特性に基づいて、検査ストリップに試料が付着される時点で検査シーケンスの開始から参照される少なくとも1つの時点又は時間間隔である特定のサンプリング時間を決定し、(b)前記複数の電極に第2の信号を印加することによって、複数の電極に対する第2の信号の印加により前記複数の電極からの第1の過渡出力信号を測定し、(c)前記第1の出力信号から第2の過渡出力信号を抽出し、(d)複数の別個の時間間隔にわたって前記第2の過渡出力信号の大きさを決定し、(e)複数の前記別個の時間間隔の選択された時間間隔において、前記第2の過渡出力信号の大きさから検体濃度を計算するための手段であることを特記しておく。
As noted above, a microcontroller or equivalent microprocessor (and an attached controller that allows a microcontroller, such as, for example,
計算するための手段には、式5〜10のいずれか1つ及び上記に述べたようなそれらのそれぞれのパラメータによって検体濃度を計算するようにプログラムされたマイクロプロセッサが含まれうる。 The means for calculating may include a microprocessor programmed to calculate the analyte concentration according to any one of equations 5-10 and their respective parameters as described above.
更に、本発明を特定の変形例及び説明図に関して述べたが、本発明が、述べられる変形例又は図に限定されないことは当業者には認識されるところであろう。更に、上記に述べた方法及び工程が、所定の順序で起こる所定の事象を示している場合、所定の工程は述べられた順序で行われる必要はなく、各工程が、各実施形態がそれらの意図される目的で機能することを可能とするものであるかぎり、任意の順序で行われることを意図している。したがって、特許請求の範囲に見られる本発明の開示の趣旨及び均等物の範囲内で本発明に変形が行われるかぎりにおいて、本特許がこうした変形例をも包含することは意図するところである。 Furthermore, although the invention has been described with respect to particular variations and illustrations, those skilled in the art will recognize that the invention is not limited to the variations or figures described. Further, if the methods and steps described above indicate a predetermined event that occurs in a predetermined order, the predetermined steps need not be performed in the stated order, and each step may be described by each embodiment. It is intended to be done in any order as long as it is capable of functioning for the intended purpose. Therefore, it is intended that this patent includes such modifications as long as modifications are made to the present invention within the scope of the disclosure and equivalents of the present invention found in the claims.
実施形態
以下の実施形態は特許請求されるものもされないものもある。
1.少なくとも2つの電極及び前記電極の少なくとも一方の電極に配置された試薬を有するバイオセンサによって生理学的試料から検体濃度を決定する方法であって、
該少なくとも2つの電極のいずれか1つに生理学的試料を付着させることによって検体検査シーケンスを開始する工程と、
該試料に第1の信号を印加することにより試料の物理的特性を導出する工程と、
該試料に、該検査シーケンスと重なり合う第1のサンプリング持続時間にわたって第2の信号を流すことにより、該試料から、該第1のサンプリング持続時間における時間及び大きさの両方と相関した第1の過渡信号出力を得る工程と、
該試料の物理的特性に基づいて、該第1のサンプリング持続時間内で検査シーケンスの間の特定のサンプリング時間を抽出する工程と、
該特定のサンプリング時間に基づいて、第2のサンプリング持続時間が該第1のサンプリング持続時間と重なり合うように第2のサンプリング持続時間を規定する工程と、
該第1の過渡信号から、該第2のサンプリング持続時間に対して参照される第2の過渡信号を得る工程と、
該第2の過渡信号を、該第2のサンプリング持続時間に対して別個の時間間隔に分割する工程と、
該第2のサンプリング持続時間内の別個の選択された時間間隔における該第2の過渡信号のそれぞれの大きさを導出する工程と、
該別個の選択された時間間隔における該第2の過渡信号のそれぞれの大きさに基づいて検体濃度を決定する工程と、を含む方法。
2.少なくとも2つの電極及び前記電極の少なくとも一方の電極に配置された試薬を有するバイオセンサによって生理学的試料から検体濃度を決定する方法であって、
該少なくとも2つの電極のいずれか1つに生理学的試料を付着させることによって検体検査シーケンスを開始する工程と、
該試料に第1の信号を印加することにより試料の物理的特性を導出する工程と、
該試料に、該検査シーケンスと重なり合う第1のサンプリング持続時間にわたって第2の信号を流すことにより、該試料から、該第1のサンプリング持続時間における時間及び大きさの両方と相関した第1の過渡信号出力を得る工程と、該試料の物理的特性に基づいて、該第1のサンプリング持続時間内で検査シーケンスの間の特定のサンプリング時間を抽出する工程と、
第2のサンプリング持続時間にわたって該第1の過渡信号から第2の過渡信号を得る工程と、
該第2のサンプリング持続時間内の選択された時間間隔における該第2の過渡信号のそれぞれの大きさを導出する工程と、
該選択された時間間隔における該第2の過渡信号のそれぞれの大きさに基づいて検体濃度を決定する工程と、を含む方法。
3.少なくとも2つの電極及び前記電極の少なくとも一方の電極に配置された試薬を有するバイオセンサによって生理学的試料から検体濃度を決定する方法であって、
該少なくとも2つの電極のいずれか1つに生理学的試料を付着させることによって検体検査シーケンスを開始する工程と、
該試料に第1の信号を印加することにより試料の物理的特性を導出する工程と、第1のサンプリング持続時間内の特定のサンプリング時間を抽出する工程と、
該第1のサンプリング持続時間にわたって該試料に第2の信号を流し、該第1のサンプリング持続時間の持続時間にわたって該試料から第1の過渡信号出力を測定又はサンプリングする工程と、
該第1のサンプリング持続時間内の特定のサンプリング時間を含む特定の時間の範囲を規定する工程と、
該特定の時間の範囲内のそれぞれの別個の時間間隔において複数の該第1の過渡信号の大きさを得る工程と、
該得る工程からの該第1の過渡信号の大きさに基づいて検体濃度を決定する工程と、を含む方法。
4.少なくとも2つの電極及び前記電極の少なくとも一方の電極に配置された試薬を有するバイオセンサによって生理学的試料から検体濃度を決定する方法であって、
該少なくとも2つの電極のいずれか1つに生理学的試料を付着させることによって検体検査シーケンスを開始する工程と、
該試料に第1の信号を印加することにより試料の物理的特性を導出する工程と、第1のサンプリング持続時間内の特定のサンプリング時間を抽出する工程と、
該第1のサンプリング持続時間にわたって該試料に第2の信号を流し、該第1のサンプリング持続時間の持続時間にわたって該試料から第1の過渡信号出力を測定又はサンプリングする工程と、おおよそ該特定のサンプリング時間における以外の時間間隔で複数の該第1の過渡信号出力の大きさを得る工程と、
該得る工程からの該複数の第1の過渡信号の大きさに基づいて検体濃度を決定する工程と、を含む方法。
5.少なくとも2つの電極及び前記電極の少なくとも一方の電極に配置された試薬を有するバイオセンサによって生理学的試料から検体濃度の正確性を実証する方法であって、
該少なくとも2つの電極のいずれか1つに生理学的試料を付着させることによって複数のバイオセンサのそれぞれについて検体検査シーケンスを開始する工程と、
該試料に第1の信号を印加することによって該複数のバイオセンサのそれぞれについて該試料の物理的特性を導出する工程と、
該複数のバイオセンサのそれぞれについて第1のサンプリング持続時間内の特定のサンプリング時間を抽出する工程と、
該複数のバイオセンサのそれぞれについて該第1のサンプリング持続時間にわたって該試料に第2の信号を流す工程と、
該複数のバイオセンサのそれぞれについて該第1のサンプリング持続時間の持続時間にわたって該試料から第1の過渡信号出力を測定又はサンプリングする工程と、
該複数のバイオセンサのそれぞれについて該第1のサンプリング持続時間内の該特定のサンプリング時間を含む特定の時間の範囲を規定する工程と、
該複数のバイオセンサのそれぞれについて該特定の時間の範囲内のそれぞれの別個の時間間隔において複数の該第1の過渡信号の大きさを得る工程と、
該複数のバイオセンサのそれぞれについて、該得る工程からの該第1の過渡信号の大きさに基づいて検体濃度を決定する工程であって、該複数のバイオセンサについて該決定する工程により決定される複数の検体濃度間の誤差が、30%、42%、及び55%のヘマトクリット値のそれぞれにおける基準値と比較して±15%未満である工程と、を含む方法。
6.前記特定の時間の範囲が、前記特定のサンプリング時間よりも前に測定される第1の過渡信号の大きさを含む、実施形態3又は実施形態5に記載の方法。
7.前記特定のサンプリング時間を抽出する工程が、前記試料の物理的特性に基づいて前記第1のサンプリング持続時間内の規定された特定のサンプリング時間を計算することを含む、実施形態1、2、3、4、又は5のいずれか一項に記載の方法。
8.前記規定された特定のサンプリング時間を計算する工程が、以下の形の式:
特定のサンプリング時間=x1Hx2+x3
を用いることを含み、式中、
「特定のサンプリング時間」は、バイオセンサの出力信号をサンプリングする検査シーケンスの開始からの時点として指定され、
Hは、試料の物理的特性を表し、
x1は、約4.3e5であり、
x2は、約(−)3.9であり、
x3は、約4.8である、実施形態7に記載の方法。
9.前記第2のサンプリング持続時間を規定する工程が、前記規定された特定のサンプリング時間と所定の時点との間の差の絶対値を得ることによって開始時間(T1)及び該特定のサンプリング時点に概ね等しい終了時間(T2)を規定することを含み、該第1のサンプリング持続時間が前記試料を付着させる工程から約10秒以内を含む、実施形態1に記載の方法。
10.前記得る工程が、前記第1のサンプリング持続時間と重なり合い、前記第1の過渡信号の一部分及び前記第2のサンプリング持続時間の時間に対するその大きさを含む第2のサンプリング持続時間を規定することを更に含み、該部分が第2の過渡信号として指定される、実施形態2に記載の方法。
11.前記第2の過渡信号を得る工程が、前記第2のサンプリング持続時間内である第2の過渡信号として指定される第1の過渡信号の一部分を前記第1の過渡信号から抽出することを含む、実施形態9に記載の方法。
12.前記別個の選択された時間間隔で前記第2の過渡信号のそれぞれの大きさを導出する工程が、それぞれの選択された時間間隔の間に第2の過渡信号の大きさを計算することを含む、実施形態11に記載の方法。
13.前記分割する工程が、前記第2の過渡信号を、概ね開始時間における時間間隔1から概ね終了時間における時間間隔22までの少なくとも22個の時間間隔に順次分割することを含む、実施形態12に記載の方法。
14.検体濃度の決定が、以下の形の式:
Embodiments The following embodiments may or may not be claimed.
1. A method for determining an analyte concentration from a physiological sample by a biosensor having at least two electrodes and a reagent disposed on at least one of said electrodes,
Initiating an analyte test sequence by attaching a physiological sample to any one of the at least two electrodes;
Deriving the physical properties of the sample by applying a first signal to the sample;
By passing a second signal through the sample over a first sampling duration that overlaps the test sequence, a first transient correlated from both time and magnitude in the first sampling duration from the sample. Obtaining a signal output;
Extracting a specific sampling time during a test sequence within the first sampling duration based on the physical properties of the sample;
Defining a second sampling duration based on the specific sampling time such that a second sampling duration overlaps the first sampling duration;
Obtaining, from the first transient signal, a second transient signal referenced for the second sampling duration;
Dividing the second transient signal into separate time intervals for the second sampling duration;
Deriving the magnitude of each of the second transient signals in separate selected time intervals within the second sampling duration;
Determining an analyte concentration based on the magnitude of each of the second transient signals in the distinct selected time interval.
2. A method for determining an analyte concentration from a physiological sample by a biosensor having at least two electrodes and a reagent disposed on at least one of said electrodes,
Initiating an analyte test sequence by attaching a physiological sample to any one of the at least two electrodes;
Deriving the physical properties of the sample by applying a first signal to the sample;
By passing a second signal through the sample over a first sampling duration that overlaps the test sequence, a first transient correlated from both time and magnitude in the first sampling duration from the sample. Obtaining a signal output; extracting a specific sampling time during an inspection sequence within the first sampling duration based on physical properties of the sample;
Obtaining a second transient signal from the first transient signal over a second sampling duration;
Deriving the magnitude of each of the second transient signals at a selected time interval within the second sampling duration;
Determining an analyte concentration based on the magnitude of each of the second transient signals in the selected time interval.
3. A method for determining an analyte concentration from a physiological sample by a biosensor having at least two electrodes and a reagent disposed on at least one of said electrodes,
Initiating an analyte test sequence by attaching a physiological sample to any one of the at least two electrodes;
Deriving a physical property of the sample by applying a first signal to the sample; extracting a specific sampling time within a first sampling duration;
Passing a second signal through the sample for the first sampling duration and measuring or sampling a first transient signal output from the sample for the duration of the first sampling duration;
Defining a specific time range including a specific sampling time within the first sampling duration;
Obtaining a plurality of magnitudes of the first transient signal at each distinct time interval within the particular time range;
Determining an analyte concentration based on the magnitude of the first transient signal from the obtaining step.
4). A method for determining an analyte concentration from a physiological sample by a biosensor having at least two electrodes and a reagent disposed on at least one of said electrodes,
Initiating an analyte test sequence by attaching a physiological sample to any one of the at least two electrodes;
Deriving a physical property of the sample by applying a first signal to the sample; extracting a specific sampling time within a first sampling duration;
Flowing a second signal through the sample for the first sampling duration and measuring or sampling a first transient signal output from the sample for the duration of the first sampling duration; Obtaining a plurality of first transient signal output magnitudes at time intervals other than at sampling time;
Determining an analyte concentration based on the magnitude of the plurality of first transient signals from the obtaining step.
5. A method of demonstrating accuracy of analyte concentration from a physiological sample by a biosensor having at least two electrodes and a reagent disposed on at least one of said electrodes, comprising:
Initiating an analyte test sequence for each of a plurality of biosensors by attaching a physiological sample to any one of the at least two electrodes;
Deriving physical properties of the sample for each of the plurality of biosensors by applying a first signal to the sample;
Extracting a specific sampling time within a first sampling duration for each of the plurality of biosensors;
Passing a second signal through the sample for the first sampling duration for each of the plurality of biosensors;
Measuring or sampling a first transient signal output from the sample for a duration of the first sampling duration for each of the plurality of biosensors;
Defining a specific time range including the specific sampling time within the first sampling duration for each of the plurality of biosensors;
Obtaining a plurality of first transient signal magnitudes at each distinct time interval within the particular time range for each of the plurality of biosensors;
Determining an analyte concentration for each of the plurality of biosensors based on the magnitude of the first transient signal from the obtaining step, determined by the determining step for the plurality of biosensors. And wherein the error between the plurality of analyte concentrations is less than ± 15% compared to the reference value at each of the 30%, 42%, and 55% hematocrit values.
6). 6. The method of
7).
8). The step of calculating the specified specific sampling time is an expression of the form:
Specific sampling time = x 1 H x 2 + x 3
Using the formula:
The “specific sampling time” is designated as the point in time from the start of the test sequence that samples the biosensor output signal,
H represents the physical properties of the sample,
x 1 is about 4.3e5;
x 2 is about (−) 3.9,
x 3 is about 4.8 The method of
9. Defining the second sampling duration generally includes a start time (T1) and a specific sampling time by obtaining an absolute value of a difference between the specified specific sampling time and a predetermined time. 2. The method of
10. Said obtaining step defining a second sampling duration that overlaps with said first sampling duration and includes a portion of said first transient signal and its magnitude relative to a time of said second sampling duration. The method of
11. Obtaining the second transient signal includes extracting from the first transient signal a portion of the first transient signal that is designated as a second transient signal that is within the second sampling duration. The method of embodiment 9.
12 Deriving the magnitude of each of the second transient signals at the distinct selected time interval includes calculating the magnitude of the second transient signal during each selected time interval.
13.
14 The determination of the analyte concentration is a formula of the form:
Gは、検体濃度を表し、
I1は、時間間隔17における第2の過渡信号の大きさにほぼ等しく、
I2は、時間間隔13における第2の過渡信号の大きさにほぼ等しく、
I3は、時間間隔5における第2の過渡信号の大きさにほぼ等しく、
I4は、時間間隔3における第2の過渡信号の大きさにほぼ等しく、
I5は、時間間隔22における第2の過渡信号の大きさにほぼ等しく、
x1は、0.75にほぼ等しく、
x2は、337.27にほぼ等しく、
x3は、(−)16.81にほぼ等しく、
x4は、1.41にほぼ等しく、
x5は、2.67にほぼ等しい、実施形態13に記載の方法。
15.検体濃度の決定が、以下の形の式:
G represents the analyte concentration,
I 1 is approximately equal to the magnitude of the second transient signal in
I 2 is approximately equal to the magnitude of the second transient signal in
I 3 is approximately equal to the magnitude of the second transient signal in
I 4 is approximately equal to the magnitude of the second transient signal in
I 5 is approximately equal to the magnitude of the second transient signal in
x 1 is approximately equal to 0.75,
x 2 is approximately equal to 337.27,
x 3 is approximately equal to (−) 16.81,
x 4 is approximately equal to 1.41,
x 5 is approximately equal, method of
15. The determination of the analyte concentration is a formula of the form:
Gは、検体濃度を表し、
I1は、時間間隔11における第2の過渡信号の大きさにほぼ等しく、
I2は、時間間隔7における第2の過渡信号の大きさにほぼ等しく、
x1は、0.59にほぼ等しく、
x2は、2.51にほぼ等しく、
x3は、(−)12.74にほぼ等しく、
x4は、(−)188.31にほぼ等しく、
x5は、9.2にほぼ等しい、実施形態13に記載の方法。
16.検体濃度の決定が、以下の形の式:
G represents the analyte concentration,
I 1 is approximately equal to the magnitude of the second transient signal in time interval 11;
I 2 is approximately equal to the magnitude of the second transient signal in
x 1 is approximately equal to 0.59,
x 2 is approximately equal to 2.51,
x 3 is approximately equal to (−) 12.74,
x 4 is (-) approximately equal to 188.31,
x 5 is approximately equal to 9.2, the method of
16. The determination of the analyte concentration is a formula of the form:
Gは、検体濃度を表し、
I1は、時間間隔20における第2の過渡信号の大きさにほぼ等しく、
I2は、時間間隔22における第2の過渡信号の大きさにほぼ等しく、
I3は、時間間隔19における第2の過渡信号の大きさにほぼ等しく、
x1は、20.15にほぼ等しく、
x2は、1.0446にほぼ等しく、
x3は、0.95にほぼ等しく、
x4は、1.39にほぼ等しく、
x5は、(−)0.71にほぼ等しく、
x6は、0.11にほぼ等しい、実施形態13に記載の方法。
17.検体濃度の決定が、以下の形の式:
G represents the analyte concentration,
I 1 is approximately equal to the magnitude of the second transient signal in
I 2 is approximately equal to the magnitude of the second transient signal in
I 3 is approximately equal to the magnitude of the second transient signal in time interval 19;
x 1 is approximately equal to 20.15,
x 2 is approximately equal to 1.0446,
x 3 is approximately equal to 0.95,
x 4 is approximately equal to 1.39,
x 5 is approximately equal to (−) 0.71;
x 6 is substantially equal, the method of
17. The determination of the analyte concentration is a formula of the form:
Gは、検体濃度を表し、
I1は、時間間隔5における第2の過渡信号の大きさにほぼ等しく、
I2は、時間間隔1における第2の過渡信号の大きさにほぼ等しく、
I3は、時間間隔2における第2の過渡信号の大きさにほぼ等しく、
I4は、時間間隔10における第2の過渡信号の大きさにほぼ等しく、
I5は、時間間隔22における第2の過渡信号の大きさにほぼ等しく、
x1は、0.70にほぼ等しく、
x2は、0.49にほぼ等しく、
x3は、28.59にほぼ等しく、
x4は、0.7にほぼ等しく、
x5は、15.51にほぼ等しい、実施形態13に記載の方法。
18.検体濃度の決定が、以下の形の式:
G represents the analyte concentration,
I 1 is approximately equal to the magnitude of the second transient signal in
I 2 is approximately equal to the magnitude of the second transient signal in
I 3 is approximately equal to the magnitude of the second transient signal in
I 4 is approximately equal to the magnitude of the second transient signal in
I 5 is approximately equal to the magnitude of the second transient signal in
x 1 is approximately equal to 0.70,
x 2 is approximately equal to 0.49,
x 3 is approximately equal to 28.59,
x 4 is approximately equal to 0.7,
x 5 is approximately equal to 15.51 The method of
18. The determination of the analyte concentration is a formula of the form:
Gは、検体濃度を表し、
I1は、時間間隔19における第2の過渡信号の大きさにほぼ等しく、
I2は、時間間隔16における第2の過渡信号の大きさにほぼ等しく、
I3は、時間間隔11における第2の過渡信号の大きさにほぼ等しく、
I4は、時間間隔5における第2の過渡信号の大きさにほぼ等しく、
x1は、(−)1.68にほぼ等しく、
x2は、0.95にほぼ等しく、
x3は、(−)4.97にほぼ等しく、
x4は、6.29にほぼ等しく、
x5は、3.08にほぼ等しく、
x6は、(−)5.84にほぼ等しく、
x7は、(−)0.47にほぼ等しく、
x8は、0.01にほぼ等しい、実施形態13に記載の方法。
19.検体濃度の決定が、以下の形の式:
G represents the analyte concentration,
I 1 is approximately equal to the magnitude of the second transient signal in time interval 19;
I 2 is approximately equal to the magnitude of the second transient signal in
I 3 is approximately equal to the magnitude of the second transient signal in time interval 11;
I 4 is approximately equal to the magnitude of the second transient signal in
x 1 is approximately equal to (−) 1.68,
x 2 is approximately equal to 0.95,
x 3 is approximately equal to (−) 4.97,
x 4 is approximately equal to 6.29,
x 5 is approximately equal to 3.08,
x 6 is approximately equal to (−) 5.84,
x 7 is approximately equal to (−) 0.47,
x 8 is approximately equal to 0.01, The method of
19. The determination of the analyte concentration is a formula of the form:
Gは、検体濃度を表し、
I1は、時間間隔16における第2の過渡信号の大きさにほぼ等しく、
I2は、時間間隔5における第2の過渡信号の大きさにほぼ等しく、
I3は、時間間隔12における第2の過渡信号の大きさにほぼ等しく、
I4は、時間間隔14における第2の過渡信号の大きさにほぼ等しく、
x1は、1.18にほぼ等しく、
x2は、0.97にほぼ等しく、
x3は、(−)11.32にほぼ等しく、
x4は、38.76にほぼ等しく、
x5は、(−)39.32にほぼ等しく、
x6は、0.0928にほぼ等しく、
x7は、(−)0.85にほぼ等しく、
x8は、1.75にほぼ等しく、
x9は、(−)9.38にほぼ等しく、
x10は、0.25にほぼ等しい、実施形態13に記載の方法。
20.複数の前記別個の時間間隔のそれぞれにおける前記第2の過渡信号の大きさが、それぞれの別個の時間間隔において測定される大きさの平均の大きさを含む、実施形態14〜19のいずれか一項に記載の方法。
21.前記第1の信号を印加する工程、及び前記第2の信号を流す工程が連続した順序である、実施形態1、実施形態2、実施形態3、実施形態4、又は実施形態5のいずれか一項に記載の方法。
22.前記第1の信号を印加する工程が、前記第2の信号を流す工程と重なり合う、実施形態1、実施形態2、実施形態3、実施形態4、又は実施形態5のいずれか一項に記載の方法。
23.前記第1の信号を印加する工程が、試料に交流信号を適用することにより前記交流信号の出力から試料の物理的特性を決定することを含む、実施形態1、実施形態2、実施形態3、実施形態4、又は実施形態5のいずれか一項に記載の方法。
24.前記第1の信号を印加する工程が、試料に光学信号を適用することにより前記光学信号の出力から試料の物理的特性を決定することを含む、実施形態1、実施形態2、又は実施形態3、実施形態4、又は実施形態5のいずれか一項に記載の方法。
25.前記物理的特性がヘマトクリット値を含み、前記検体がグルコースを含む、実施形態24に記載の方法。
26.前記物理的特性が、試料の粘性、ヘマトクリット値、温度、又は密度の少なくとも1つを含む、実施形態1、実施形態2、又は実施形態3、実施形態4、又は実施形態5のいずれか一項に記載の方法。
27.前記適用する工程が、第1及び第2の交流信号を異なるそれぞれの周波数で流すことを含み、第1の周波数は第2の周波数より低い周波数を有する、実施形態23に記載の方法。
28.前記第1の周波数が前記第2の周波数よりも少なくとも1桁低い、実施形態27に記載の方法。
29.前記第1の周波数が約10kHz〜約250kHzの範囲の任意の周波数を含む、実施形態28に記載の方法。
30.前記得る工程が、前記第1の過渡信号から、前記第2のサンプリング持続時間に対して参照される第2の過渡信号を抽出することを含む、実施形態2に記載の方法。
31.前記得る工程が、第1の過渡信号から、第2のサンプリング持続時間の外側の信号を除去することによって第2のサンプリング持続時間内に第2の過渡信号を残すことを含む、実施形態1又は実施形態2に記載の方法。
32.前記導出する工程が、前記第2のサンプリング持続時間内のそれぞれの別個の時間間隔について前記第2の過渡信号の大きさを保存することを含む、実施形態30又は31のいずれか一項に記載の方法。
33.
基板と、
該基板上に配置され、それぞれの電極コネクタに接続された複数の電極とを有する検査ストリップと、
ハウジングと、
該検査ストリップの該それぞれの電極コネクタに接続されるように構成された検査ストリップポートコネクタと、
検査シーケンスの間に該複数の電極に電気信号を印加するか又は該複数の電極からの電気信号を検知するように該検査ストリップポートコネクタと電気的に導通したマイクロプロセッサとを有する検体計測器と、を備える検体測定システムであって、該マイクロプロセッサが、
(a)該複数の電極に第1の信号を印加することにより、特定のサンプリング時間を与えるための試料の物理的特性を導出し、
(b)該複数の電極に第2の信号を印加し、
(c)該複数の電極からの第1の過渡出力信号を測定し、
(d)該第1の出力信号から第2の過渡出力信号を抽出し、
(e)複数の別個の時間間隔にわたって該第2の過渡出力信号の大きさを決定し、
(f)該複数の別個の時間間隔の内の選択された時間間隔において、該第2の過渡出力信号の大きさから検体濃度を計算するように構成されている、検体測定システム。
34.
基板と、
該基板上に配置され、それぞれの電極コネクタに接続された複数の電極とを有する検査ストリップと、
ハウジングと、
該検査ストリップの該それぞれの電極コネクタに接続されるように構成された検査ストリップポートコネクタと、
検査シーケンスの間に該複数の電極に電気信号を印加するか又は該複数の電極からの電気信号を検知するように該検査ストリップポートコネクタと電気的に導通したマイクロプロセッサとを有する検体計測器と、を備える検体測定システムであって、該マイクロプロセッサが、
(a)該複数の電極に第1の信号を印加することにより、特定のサンプリング時間を与えるための試料の物理的特性を導出し、
(b)該複数の電極に第2の信号を印加し、
(c)該複数の電極からの第1の過渡出力信号を測定し、
(d)該第1の出力信号から第2の過渡出力信号を抽出し、
(e)複数の別個の時間間隔にわたって該第2の過渡出力信号の大きさを決定し、
(f)該複数の別個の時間間隔の内の選択された時間間隔において、該第2の過渡出力信号の大きさから検体濃度を計算することにより、検査シーケンスの開始の約10秒以内に検体濃度を告知するように構成されている、検体測定システム。
35.前記複数の電極が、物理的特性を測定するための少なくとも2つの電極、及び検体濃度を測定するための少なくとも2つの他の電極を含む、実施形態33又は実施形態34に記載のシステム。
36.前記少なくとも2つの電極及び前記少なくとも2つの他の電極が、前記基板上に設けられた同じチャンバ内に配置される、実施形態35に記載のシステム。
37.前記少なくとも2つの電極及び前記少なくとも2つの他の電極が、前記基板上に設けられた異なるチャンバ内に配置される、実施形態35に記載のシステム。
38.前記異なるチャンバが、基板の縁部上に互いに隣接して配置される、実施形態37に記載のシステム。
39.前記少なくとも2つの電極及び前記少なくとも2つの他の電極が、流体試料を受容する共通のチャンバ内に配置される、実施形態35に記載のシステム。
40.前記複数の電極が、物理的特性及び検体濃度を測定するための2つの電極を含む、実施形態33又は実施形態34に記載のシステム。
41.電極のすべてが前記基板によって規定される同じ平面上に配置される、実施形態33〜40のいずれか一項に記載のシステム。
42.前記少なくとも2つの他の電極に近接して試薬が配置され、前記少なくとも2つの電極上に試薬が配置されない、実施形態35〜39のいずれか一項に記載のシステム。
43.前記特定のサンプリング時間が以下の形の式:
特定のサンプリング時間=x1Hx2+x3
を用いて計算され、式中、
「特定のサンプリング時間」は、前記検査ストリップの出力信号をサンプリングする検査シーケンスの開始からの時点として指定され、
Hは、試料の物理的特性を表し、
x1は、約4.3e5を表し、
x2は、約(−)3.9を表し、
x3は、約4.8を表す、実施形態33又は実施形態34に記載のシステム。
44.複数の前記別個の時間間隔が、少なくとも22の別個の時間間隔を含む、実施形態33、34、又は41のいずれか一項に記載のシステム。
45.前記マイクロプロセッサが、以下の形の式:
G represents the analyte concentration,
I 1 is approximately equal to the magnitude of the second transient signal in
I 2 is approximately equal to the magnitude of the second transient signal in
I 3 is approximately equal to the magnitude of the second transient signal in
I 4 is approximately equal to the magnitude of the second transient signal in
x 1 is approximately equal to 1.18,
x 2 is approximately equal to 0.97,
x 3 is approximately equal to (−) 11.32.
x 4 is approximately equal to 38.76,
x 5 is approximately equal to (−) 39.32;
x 6 is approximately equal to 0.0928,
x 7 is (-) approximately equal to 0.85,
x 8 is approximately equal to 1.75,
x 9 is approximately equal to (−) 9.38,
x 10 is approximately equal, method of
20. Embodiments 14-14, wherein the magnitude of the second transient signal in each of the plurality of distinct time intervals comprises an average magnitude of magnitudes measured in each distinct time interval. The method according to item.
21. Any one of
22. The step of applying the first signal according to any one of the first embodiment, the second embodiment, the third embodiment, the fourth embodiment, or the fifth embodiment, which overlaps the step of flowing the second signal. Method.
23.
24.
25. 25. The method of
26.
27. 24. The method of embodiment 23, wherein the applying step includes flowing first and second alternating signals at different respective frequencies, the first frequency having a lower frequency than the second frequency.
28. 28. The method of embodiment 27, wherein the first frequency is at least an order of magnitude lower than the second frequency.
29. 29. The method of
30. 3. The method of
31.
32. 32. The embodiment of any one of
33.
A substrate,
A test strip having a plurality of electrodes disposed on the substrate and connected to respective electrode connectors;
A housing;
A test strip port connector configured to be connected to the respective electrode connector of the test strip;
An analyte meter having a microprocessor in electrical communication with the test strip port connector to apply an electrical signal to the plurality of electrodes or to detect an electrical signal from the plurality of electrodes during a test sequence; An analyte measurement system comprising: a microprocessor comprising:
(A) deriving physical properties of the sample to give a specific sampling time by applying a first signal to the plurality of electrodes;
(B) applying a second signal to the plurality of electrodes;
(C) measuring a first transient output signal from the plurality of electrodes;
(D) extracting a second transient output signal from the first output signal;
(E) determining the magnitude of the second transient output signal over a plurality of distinct time intervals;
(F) An analyte measurement system configured to calculate an analyte concentration from a magnitude of the second transient output signal at a selected time interval of the plurality of distinct time intervals.
34.
A substrate,
A test strip having a plurality of electrodes disposed on the substrate and connected to respective electrode connectors;
A housing;
A test strip port connector configured to be connected to the respective electrode connector of the test strip;
An analyte meter having a microprocessor in electrical communication with the test strip port connector to apply an electrical signal to the plurality of electrodes or to detect an electrical signal from the plurality of electrodes during a test sequence; An analyte measurement system comprising: a microprocessor comprising:
(A) deriving physical properties of the sample to give a specific sampling time by applying a first signal to the plurality of electrodes;
(B) applying a second signal to the plurality of electrodes;
(C) measuring a first transient output signal from the plurality of electrodes;
(D) extracting a second transient output signal from the first output signal;
(E) determining the magnitude of the second transient output signal over a plurality of distinct time intervals;
(F) within about 10 seconds of the start of the test sequence by calculating the analyte concentration from the magnitude of the second transient output signal at a selected time interval of the plurality of discrete time intervals. An analyte measurement system configured to announce the concentration.
35. 35. The system of embodiment 33 or
36. 36. The system of
37. 36. The system of
38. 38. The system of embodiment 37, wherein the different chambers are disposed adjacent to each other on an edge of a substrate.
39. 36. The system of
40. 35. The system of embodiment 33 or
41. 41. The system of any one of embodiments 33-40, wherein all of the electrodes are disposed on the same plane defined by the substrate.
42. 40. The system of any one of embodiments 35-39, wherein a reagent is disposed proximate to the at least two other electrodes, and no reagent is disposed on the at least two electrodes.
43. The specific sampling time is of the form:
Specific sampling time = x 1 H x 2 + x 3
Is calculated using the formula:
A “specific sampling time” is designated as the point in time from the start of the test sequence that samples the output signal of the test strip;
H represents the physical properties of the sample,
x 1 represents approximately 4.3e5;
x 2 represents approximately (−) 3.9,
x 3 represents about 4.8, system of embodiment 33 or
44. 42. The system of any one of
45. The microprocessor has the following formula:
Gは、検体濃度を表し、
I1は、時間間隔17における第2の過渡信号の大きさにほぼ等しく、
I2は、時間間隔13における第2の過渡信号の大きさにほぼ等しく、
I3は、時間間隔5における第2の過渡信号の大きさにほぼ等しく、
I4は、時間間隔3における第2の過渡信号の大きさにほぼ等しく、
I5は、時間間隔22における第2の過渡信号の大きさにほぼ等しく、
x1は、0.75にほぼ等しく、
x2は、337.27にほぼ等しく、
x3は、(−)16.81にほぼ等しく、
x4は、1.41にほぼ等しく、
x5は、2.67にほぼ等しい、実施形態44に記載のシステム。
46.前記マイクロプロセッサが、以下の形の式:
G represents the analyte concentration,
I 1 is approximately equal to the magnitude of the second transient signal in
I 2 is approximately equal to the magnitude of the second transient signal in
I 3 is approximately equal to the magnitude of the second transient signal in
I 4 is approximately equal to the magnitude of the second transient signal in
I 5 is approximately equal to the magnitude of the second transient signal in
x 1 is approximately equal to 0.75,
x 2 is approximately equal to 337.27,
x 3 is approximately equal to (−) 16.81,
x 4 is approximately equal to 1.41,
x 5 is approximately equal to 2.67, the system of embodiment 44.
46. The microprocessor has the following formula:
Gは、検体濃度を表し、
I1は、時間間隔11における第2の過渡信号の大きさにほぼ等しく、
I2は、時間間隔7における第2の過渡信号の大きさにほぼ等しく、
x1は、0.59にほぼ等しく、
x2は、2.51にほぼ等しく、
x3は、(−)12.74にほぼ等しく、
x4は、(−)188.31にほぼ等しく、
x5は、9.2にほぼ等しい、実施形態44に記載のシステム。
47.前記マイクロプロセッサが、以下の形の式:
G represents the analyte concentration,
I 1 is approximately equal to the magnitude of the second transient signal in time interval 11;
I 2 is approximately equal to the magnitude of the second transient signal in
x 1 is approximately equal to 0.59,
x 2 is approximately equal to 2.51,
x 3 is approximately equal to (−) 12.74,
x 4 is (-) approximately equal to 188.31,
x 5 is approximately equal to 9.2, the system of embodiment 44.
47. The microprocessor has the following formula:
Gは、検体濃度を表し、
I1は、時間間隔20における第2の過渡信号の大きさにほぼ等しく、
I2は、時間間隔22における第2の過渡信号の大きさにほぼ等しく、
I3は、時間間隔19における第2の過渡信号の大きさにほぼ等しく、
x1は、20.15にほぼ等しく、
x2は、1.0446にほぼ等しく、
x3は、0.95にほぼ等しく、
x4は、1.39にほぼ等しく、
x5は、(−)0.71にほぼ等しく、
x6は、0.11にほぼ等しい、実施形態44に記載のシステム。
48.前記マイクロプロセッサが、以下の形の式:
G represents the analyte concentration,
I 1 is approximately equal to the magnitude of the second transient signal in
I 2 is approximately equal to the magnitude of the second transient signal in
I 3 is approximately equal to the magnitude of the second transient signal in time interval 19;
x 1 is approximately equal to 20.15,
x 2 is approximately equal to 1.0446,
x 3 is approximately equal to 0.95,
x 4 is approximately equal to 1.39,
x 5 is approximately equal to (−) 0.71;
x 6 is approximately equal to 0.11, the system of embodiment 44.
48. The microprocessor has the following formula:
式中、Gは、検体濃度を表し、
I1は、時間間隔5における第2の過渡信号の大きさにほぼ等しく、
I2は、時間間隔1における第2の過渡信号の大きさにほぼ等しく、
I3は、時間間隔2における第2の過渡信号の大きさにほぼ等しく、
I4は、時間間隔10における第2の過渡信号の大きさにほぼ等しく、
I5は、時間間隔22における第2の過渡信号の大きさにほぼ等しく、
x1は、0.70にほぼ等しく、
x2は、0.49にほぼ等しく、
x3は、28.59にほぼ等しく、
x4は、−0.1にほぼ等しく、
x5は、15.51にほぼ等しい、実施形態44に記載のシステム。
49.前記マイクロプロセッサが、以下の形の式:
Where G represents the analyte concentration,
I 1 is approximately equal to the magnitude of the second transient signal in
I 2 is approximately equal to the magnitude of the second transient signal in
I 3 is approximately equal to the magnitude of the second transient signal in
I 4 is approximately equal to the magnitude of the second transient signal in
I 5 is approximately equal to the magnitude of the second transient signal in
x 1 is approximately equal to 0.70,
x 2 is approximately equal to 0.49,
x 3 is approximately equal to 28.59,
x 4 is approximately equal to -0.1,
x 5 is approximately equal to 15.51, the system of embodiment 44.
49. The microprocessor has the following formula:
Gは、検体濃度を表し、
I1は、時間間隔19における第2の過渡信号の大きさにほぼ等しく、
I2は、時間間隔16における第2の過渡信号の大きさにほぼ等しく、
I3は、時間間隔11における第2の過渡信号の大きさにほぼ等しく、
I4は、時間間隔5における第2の過渡信号の大きさにほぼ等しく、
x1は、(−)1.68にほぼ等しく、
x2は、0.95にほぼ等しく、
x3は、(−)4.97にほぼ等しく、
x4は、6.29にほぼ等しく、
x5は、3.08にほぼ等しく、
x6は、(−)5.84にほぼ等しく、
x7は、(−)0.47にほぼ等しく、
x8は、0.01にほぼ等しい、実施形態44に記載のシステム。
50.前記マイクロプロセッサが、以下の形の式:
G represents the analyte concentration,
I 1 is approximately equal to the magnitude of the second transient signal in time interval 19;
I 2 is approximately equal to the magnitude of the second transient signal in
I 3 is approximately equal to the magnitude of the second transient signal in time interval 11;
I 4 is approximately equal to the magnitude of the second transient signal in
x 1 is approximately equal to (−) 1.68,
x 2 is approximately equal to 0.95,
x 3 is approximately equal to (−) 4.97,
x 4 is approximately equal to 6.29,
x 5 is approximately equal to 3.08,
x 6 is approximately equal to (−) 5.84,
x 7 is approximately equal to (−) 0.47,
x 8 is approximately equal to 0.01, the system of embodiment 44.
50. The microprocessor has the following formula:
Gは、グルコース濃度であり、
I1は、時間間隔16における第2の過渡信号の大きさにほぼ等しく、
I2は、時間間隔5における第2の過渡信号の大きさにほぼ等しく、
I3は、時間間隔12における第2の過渡信号の大きさにほぼ等しく、
I4は、時間間隔14における第2の過渡信号の大きさにほぼ等しく、
x1は、1.18にほぼ等しく、
x2は、0.97にほぼ等しく、
x3は、(−)11.32にほぼ等しく、
x4は、−38.76にほぼ等しく、
x5は、(−)39.32にほぼ等しく、
x6は、0.0928にほぼ等しく、
x7は、(−)0.85にほぼ等しく、
x8は、1.75にほぼ等しく、
x9は、(−)9.38にほぼ等しく、
x10は、0.25にほぼ等しい、実施形態44に記載のシステム。
51.複数の前記別個の時間間隔のそれぞれにおける前記第2の過渡信号の大きさが、それぞれの時間間隔を通じてサンプリングされる信号の平均の大きさを含む、実施形態33〜50のいずれか一項に記載のシステム。
52.前記マイクロプロセッサにより計算される複数の検体濃度間の誤差が、30%ヘマトクリット値における基準値と比較して±15%未満である、実施形態43〜50のいずれか一項に記載のシステム。
53.前記マイクロプロセッサにより計算される複数の検体濃度間の誤差が、42%ヘマトクリット値における基準値と比較して±15%未満である、実施形態43〜50のいずれか一項に記載のシステム。
54.前記マイクロプロセッサにより計算される複数の検体濃度間の誤差が、55%ヘマトクリット値における基準値と比較して±15%未満である、実施形態43〜50のいずれか一項に記載のシステム。
55.前記第2の過渡信号を、前記第2のサンプリング持続時間に対して別個の時間間隔に分割する工程を更に含む、実施形態2に記載の方法。
56.前記第1の過渡信号を、前記特定の時間の範囲に対して別個の時間間隔に分割する工程を更に含む、実施形態3に記載の方法。
57.前記第1の過渡信号を、前記特定の時間の範囲に対して別個の時間間隔に分割する工程を更に含む、実施形態5に記載の方法。
58.Hにより表される物理的特性が、以下の形の式:
G is the glucose concentration;
I 1 is approximately equal to the magnitude of the second transient signal in
I 2 is approximately equal to the magnitude of the second transient signal in
I 3 is approximately equal to the magnitude of the second transient signal in
I 4 is approximately equal to the magnitude of the second transient signal in
x 1 is approximately equal to 1.18,
x 2 is approximately equal to 0.97,
x 3 is approximately equal to (−) 11.32.
x 4 is approximately equal to -38.76,
x 5 is approximately equal to (−) 39.32;
x 6 is approximately equal to 0.0928,
x 7 is (-) approximately equal to 0.85,
x 8 is approximately equal to 1.75,
x 9 is approximately equal to (−) 9.38,
x 10 is approximately equal to 0.25, the system of embodiment 44.
51. 51. The embodiment of any one of embodiments 33-50, wherein the magnitude of the second transient signal in each of the plurality of distinct time intervals includes an average magnitude of the signal sampled over each time interval. System.
52. The system according to any one of embodiments 43-50, wherein the error between the plurality of analyte concentrations calculated by the microprocessor is less than ± 15% compared to a reference value at a 30% hematocrit value.
53. The system according to any one of embodiments 43-50, wherein the error between the plurality of analyte concentrations calculated by the microprocessor is less than ± 15% compared to a reference value at a 42% hematocrit value.
54. The system according to any of embodiments 43-50, wherein the error between the plurality of analyte concentrations calculated by the microprocessor is less than ± 15% compared to a reference value at 55% hematocrit value.
55. 3. The method of
56. 4. The method of
57. 6. The method of
58. The physical property represented by H is a formula of the form:
![]()
Mは、Ωを単位として測定されたインピーダンスの大きさ|Z|を表し、Pは、入力信号と出力信号との間の位相差(単位=°)を表し、
y1は、約−3.2e−08であり、
y2は、約4.1e−03であり、
y3は、約−2.5e+01であり、
y4は、約1.5e−01であり、
y5は、約5.0である、実施形態1〜57のいずれか一項に記載の方法又はシステム。
59.Hにより表される物理的特性が、以下の形の式:
![]()
M represents the impedance magnitude | Z | measured in Ω, P represents the phase difference between the input signal and the output signal (unit = °),
y 1 is approximately −3.2e−08,
y 2 is approximately 4.1e-03,
y 3 is about −2.5e + 01,
y 4 is approximately 1.5e-01,
y 5 is about 5.0, the method or system according to any one of embodiments 1-57.
59. The physical property represented by H is a formula of the form:
ICは、インピーダンス特性[%]を表し、
Mは、インピーダンスの大きさ[Ω]を表し、
y1は、約1.2292e1であり、
y2は、約−4.3431e2であり、
y3は、約3.5260e4である、実施形態1〜57のいずれか一項に記載の方法又はシステム。
IC represents an impedance characteristic [%],
M represents the magnitude of impedance [Ω],
y 1 is about 1.2292e1,
y 2 is about -4.3431e2,
y 3 is about 3.5260E4, method or system according to any one of embodiments 1-57.
本開示の更なる態様
セクション「A」
以下の態様は、米国仮特許出願第61/581,087号(代理人整理番号DDI5220USPSP)に最初に示されたものであり、本開示の一部をなすものである。
1.少なくとも2つの電極及び該電極の少なくとも1つに配置された試薬を有するバイオセンサによって生理学的試料から検体濃度を決定する方法であって、
該少なくとも2つの電極に生理学的試料を付着させることによって検体検査シーケンスを開始する工程と、
第1の電気信号を試料に印加して該試料の物理的特性を測定する工程と、
以下の形の式:
x=aH2+bH+c
から該測定された物理的特性に基づいて該試薬についてのバッチ傾きを導出する工程であって、式中、xは、導出されたバッチ傾きを表し、
Hは、測定又は推定されたヘマトクリット値であり、
aは、約1.4e−6を表し、
bは、約−3.8e−4を表し、
cは、約3.6e−2を表す、工程と、
該試料に第2の電気信号を流す工程と、該少なくとも2つの電極の少なくとも1つからの出力電流を測定する工程と、以下の形の式:
Further Aspects of the Disclosure Section “A”
The following aspects were first shown in US Provisional Patent Application No. 61 / 581,087 (Attorney Docket No. DDI5220USPSP) and form part of this disclosure.
1. A method for determining an analyte concentration from a physiological sample by a biosensor having at least two electrodes and a reagent disposed on at least one of the electrodes, comprising:
Initiating an analyte test sequence by attaching a physiological sample to the at least two electrodes;
Applying a first electrical signal to the sample to measure physical properties of the sample;
An expression of the form:
x = aH 2 + bH + c
Deriving a batch slope for the reagent based on the measured physical properties from where x represents the derived batch slope;
H is the measured or estimated hematocrit value;
a represents about 1.4e-6,
b represents about -3.8e-4,
c represents about 3.6e-2, and
Passing a second electrical signal through the sample; measuring an output current from at least one of the at least two electrodes; and an equation of the form:
G0は、検体濃度を表し、
IEは、所定の時間に測定された最終電流の合計から決定される電流(検体濃度に比例)を表し、
「切片」は、バイオセンサのバッチの校正パラメータを表し、
xは、該導出する工程から導出されたバッチ傾きを表す、工程と、を含む方法。
2.少なくとも2つの電極及び該電極の少なくとも1つに配置された試薬を有するバイオセンサによって生理学的試料から検体濃度を決定する方法であって、
該少なくとも2つの電極に生理学的試料を付着させることによって検体検査シーケンスを開始する工程と、
第1の電気信号を試料に印加して該試料の物理的特性を測定する工程と、
該測定された物理的特性に基づいて該試薬についてのバッチ傾きを導出する工程と、
該試料に第2の電気信号を流す工程と、
該少なくとも2つの電極の少なくとも1つからの出力電流を測定する工程と、該試料の該測定された物理的特性から該測定された出力信号及び導出されたバッチ傾きに基づいて検体濃度を計算する工程と、を含む方法。
3.前記第1の信号を印加する工程、及び前記第2の信号を流す工程が連続した順序である、態様A1又は態様A2に記載の方法。
4.前記第1の信号を印加する工程が、前記第2の信号を流す工程と重なり合う、態様A1又は態様A2に記載の方法。
5.前記第1の信号を印加する工程が、前記試料に交流信号を適用することによって該交流信号の出力から該試料の物理的特性を決定することを含む、態様A1又は態様A2に記載の方法。
6.前記第1の信号を印加する工程が、前記試料に光学信号を適用することによって該光学信号の出力から該試料の物理的特性を決定することを含む、態様A1又は態様A2に記載の方法。
7.前記物理的特性がヘマトクリット値を含み、前記検体がグルコースを含む、態様A5又は態様A6のいずれか一項に記載の方法。
8.前記物理的特性が、前記試料の粘性、ヘマトクリット値、及び密度の少なくとも1つを含む、態様A5又は態様A6のいずれか一項に記載の方法。
9.前記適用する工程が、第1及び第2の交流信号を、第1の周波数が第2の周波数よりも低い異なるそれぞれの周波数で流すことを含む、態様A5に記載の方法。
10.前記第1の周波数が前記第2の周波数よりも少なくとも1桁低い、態様A9に記載の方法。
11.前記第1の周波数が約10kHz〜約90kHzの範囲の任意の周波数を含む、態様A10に記載の方法。
12.前記導出する工程が、以下の形の式:
G 0 represents the analyte concentration,
IE represents the current (proportional to the analyte concentration) determined from the sum of the final currents measured at a given time,
“Section” represents the calibration parameters of a batch of biosensors,
wherein x represents a batch slope derived from the deriving step.
2. A method for determining an analyte concentration from a physiological sample by a biosensor having at least two electrodes and a reagent disposed on at least one of the electrodes, comprising:
Initiating an analyte test sequence by attaching a physiological sample to the at least two electrodes;
Applying a first electrical signal to the sample to measure physical properties of the sample;
Deriving a batch slope for the reagent based on the measured physical properties;
Passing a second electrical signal through the sample;
Measuring an output current from at least one of the at least two electrodes and calculating an analyte concentration based on the measured output signal and the derived batch slope from the measured physical properties of the sample And a method comprising:
3. The method according to aspect A1 or aspect A2, wherein the step of applying the first signal and the step of flowing the second signal are in a sequential order.
4). A method according to aspect A1 or aspect A2, wherein the step of applying the first signal overlaps with the step of flowing the second signal.
5. A method according to aspect A1 or aspect A2, in which the step of applying the first signal comprises determining a physical property of the sample from the output of the alternating signal by applying an alternating signal to the sample.
6). A method according to aspect A1 or aspect A2, wherein applying the first signal comprises determining a physical property of the sample from an output of the optical signal by applying an optical signal to the sample.
7). The method according to any one of aspects A5 or A6, wherein the physical property comprises a hematocrit value and the analyte comprises glucose.
8). The method of any one of aspects A5 or A6, wherein the physical property comprises at least one of viscosity, hematocrit value, and density of the sample.
9. The method of aspect A5, wherein the applying step includes flowing the first and second alternating signals at different respective frequencies where the first frequency is lower than the second frequency.
10. The method of aspect A9, wherein the first frequency is at least an order of magnitude lower than the second frequency.
11. The method of aspect A10, wherein the first frequency comprises any frequency in the range of about 10 kHz to about 90 kHz.
12 The deriving step is an expression of the form:
![]()
Hは、測定又は推定されたヘマトクリット値であり、
aは、約1.4e−6を表し、
bは、約−3.8e−4を表し、
cは、約3.6e−2を表す、態様A2に記載の方法。
13.前記検体濃度を計算する工程が、以下の形の式:
![]()
H is the measured or estimated hematocrit value;
a represents about 1.4e-6,
b represents about -3.8e-4,
The method of aspect A2, wherein c represents about 3.6e-2.
13. The step of calculating the analyte concentration comprises an equation of the form:
G0は、検体濃度を表し、
IEは、検査シーケンスの開始約5秒後の所定の時間に測定された最終電流の合計から決定される電流(検体濃度に比例)を表し、
「切片」は、バイオセンサのバッチの校正パラメータを表し、
xは、前記導出する工程から導出されたバッチ傾きを表す、態様A12に記載の方法。
14.
基板と、
それぞれの電極コネクタに接続された複数の電極とを有する検査ストリップと、
ハウジングと、
該検査ストリップの該それぞれの電極コネクタに接続されるように構成された検査ストリップポートコネクタと、
検査シーケンスの間に該複数の電極に電気信号を印加するか又は該複数の電極からの電気信号を検知するように該検査ストリップポートコネクタと電気的に導通したマイクロプロセッサとを有する検体計測器と、を備える検体測定システムであって、該マイクロプロセッサが、該検査シーケンスの間に、(a)該複数の電極に第1の電気信号を印加することにより、生理学的流体試料の物理的特性によって規定されるバッチ傾きを導出し、(b)該複数の電極に第2の電気信号を印加することにより、該導出されたバッチ傾きに基づいて検体濃度を決定するように構成されている検体測定システム。
15.前記複数の電極が、物理的特性を測定するための少なくとも2つの電極、及び検体濃度を測定するための少なくとも2つの他の電極を含む、態様A14に記載のシステム。
16.前記少なくとも2つの電極及び前記少なくとも2つの他の電極が、前記基板上に設けられた同じチャンバ内に配置される、態様A14に記載のシステム。
17.前記少なくとも2つの電極及び前記少なくとも2つの他の電極が、前記基板上に設けられた異なるチャンバ内に配置される、態様A14に記載のシステム。
18.前記少なくとも2つの電極が、物理的特性及び検体濃度を測定するための2つの電極を含む、態様A14に記載のシステム。
19.電極のすべてが前記基板によって規定される同じ平面上に配置される、態様A16、A17、又はA18のいずれか一項に記載のシステム。
20.前記少なくとも2つの他の電極に近接して試薬が配置され、前記少なくとも2つの電極上に試薬が配置されない、態様A17又は態様A18のいずれか一項に記載のシステム。
21.前記バッチ傾きが以下の形の式:
G 0 represents the analyte concentration,
IE represents the current (proportional to the analyte concentration) determined from the sum of the final currents measured at a given time approximately 5 seconds after the start of the test sequence;
“Section” represents the calibration parameters of a batch of biosensors,
The method of aspect A12, wherein x represents a batch slope derived from the deriving step.
14
A substrate,
A test strip having a plurality of electrodes connected to each electrode connector;
A housing;
A test strip port connector configured to be connected to the respective electrode connector of the test strip;
An analyte meter having a microprocessor in electrical communication with the test strip port connector to apply an electrical signal to the plurality of electrodes or to detect an electrical signal from the plurality of electrodes during a test sequence; Wherein the microprocessor (a) applies a first electrical signal to the plurality of electrodes during the test sequence, thereby depending on the physical characteristics of the physiological fluid sample. Specimen measurement configured to derive a defined batch slope and (b) determine a specimen concentration based on the derived batch slope by applying a second electrical signal to the plurality of electrodes. system.
15. The system of aspect A14, wherein the plurality of electrodes includes at least two electrodes for measuring physical properties and at least two other electrodes for measuring analyte concentration.
16. The system of aspect A14, wherein the at least two electrodes and the at least two other electrodes are disposed in the same chamber provided on the substrate.
17. The system of aspect A14, wherein the at least two electrodes and the at least two other electrodes are disposed in different chambers provided on the substrate.
18. The system of aspect A14, wherein the at least two electrodes comprise two electrodes for measuring physical properties and analyte concentration.
19. The system of any one of aspects A16, A17, or A18, wherein all of the electrodes are disposed on the same plane defined by the substrate.
20. The system of any one of aspects A17 or A18, wherein a reagent is disposed proximate to the at least two other electrodes, and no reagent is disposed on the at least two electrodes.
21. Formula where the batch slope is
![]()
Hは、測定又は推定されたヘマトクリット値を表し、
aは、約1.4e−6を表し、
bは、約−3.8e−4を表し、
cは、約3.6e−2を表す、態様A14に記載のシステム。
22.前記検体濃度が以下の形の式:
![]()
H represents the measured or estimated hematocrit value;
a represents about 1.4e-6,
b represents about -3.8e-4,
The system of aspect A14, wherein c represents about 3.6e-2.
22. Formula where the analyte concentration is of the form:
G0は、検体濃度を表し、
IEは、所定の時間に測定された最終電流の合計から決定される電流(検体濃度に比例)を表し、
「切片」は、検査ストリップのバッチの校正パラメータを表し、
xは、前記導出する工程から導出されたバッチ傾きを表す、態様A21に記載のシステム。
23.
基板と、
それぞれの電極コネクタに接続された複数の電極とを有する検査ストリップと、
ハウジングと、
該検査ストリップの該それぞれの電極コネクタに接続されるように構成された検査ストリップポートコネクタと、
該複数の電極に電気信号を印加するか又は該複数の電極からの電気信号を検知するように該検査ストリップポートコネクタと電気的に導通したマイクロプロセッサとを有する検体計測器と、を備える検体測定システムであって、該マイクロプロセッサが、該検査シーケンスの間に、(a)該複数の電極に第1の電気信号を印加することにより、生理学的流体試料の物理的特性によって規定されるバッチ傾きを導出し、(b)該複数の電極に第2の電気信号を印加することにより、該検査シーケンスの開始約10秒後以内に該導出されたバッチ傾きに基づいて検体濃度を決定するように構成されている検体測定システム。
24.前記複数の電極が、物理的特性を測定するための少なくとも2つの電極、及び検体濃度を測定するための少なくとも2つの他の電極を含む、態様A23に記載のシステム。
25.前記少なくとも2つの電極及び前記少なくとも2つの他の電極が、前記基板上に設けられた同じチャンバ内に配置される、態様A23に記載のシステム。
26.前記少なくとも2つの電極及び前記少なくとも2つの他の電極が、前記基板上に設けられた異なるチャンバ内に配置される、態様A23に記載のシステム。
27.前記少なくとも2つの電極が、物理的特性及び検体濃度を測定するための2つの電極を含む、態様A23に記載のシステム。
28.電極のすべてが前記基板によって規定される同じ平面上に配置される、態様A24、A25、又はA26のいずれか一項に記載のシステム。
29.前記少なくとも2つの他の電極に近接して試薬が配置され、前記少なくとも2つの電極上に試薬が配置されない、態様A23又は態様A24のいずれか一項に記載のシステム。
30.前記バッチ傾きが以下の形の式:
G 0 represents the analyte concentration,
IE represents the current (proportional to the analyte concentration) determined from the sum of the final currents measured at a given time,
“Section” represents the calibration parameters of a batch of test strips,
The system of aspect A21, wherein x represents a batch slope derived from the deriving step.
23.
A substrate,
A test strip having a plurality of electrodes connected to each electrode connector;
A housing;
A test strip port connector configured to be connected to the respective electrode connector of the test strip;
Specimen measurement comprising: a sample measuring instrument having a microprocessor in electrical communication with the test strip port connector to apply an electrical signal to the plurality of electrodes or to detect an electrical signal from the plurality of electrodes A system wherein the microprocessor is configured to: (a) apply a first electrical signal to the plurality of electrodes during the test sequence to define a batch tilt defined by physical properties of a physiological fluid sample And (b) determining the analyte concentration based on the derived batch slope within about 10 seconds after the start of the test sequence by applying a second electrical signal to the plurality of electrodes. Configured sample measurement system.
24. The system of aspect A23, wherein the plurality of electrodes includes at least two electrodes for measuring physical properties and at least two other electrodes for measuring analyte concentration.
25. The system of aspect A23, wherein the at least two electrodes and the at least two other electrodes are disposed in the same chamber provided on the substrate.
26. The system of aspect A23, wherein the at least two electrodes and the at least two other electrodes are disposed in different chambers provided on the substrate.
27. The system of aspect A23, wherein the at least two electrodes comprise two electrodes for measuring physical properties and analyte concentration.
28. The system of any one of aspects A24, A25, or A26, wherein all of the electrodes are disposed on the same plane defined by the substrate.
29. The system of any one of aspects A23 or aspect A24, wherein a reagent is disposed proximate to the at least two other electrodes and no reagent is disposed on the at least two electrodes.
30. Formula where the batch slope is
![]()
Hは、測定又は推定されたヘマトクリット値を表し、
aは、約1.4e−6を表し、
bは、約−3.8e−4を表し、
cは、約3.6e−2を表す、態様A23に記載のシステム。
31.前記検体濃度が以下の形の式:
![]()
H represents the measured or estimated hematocrit value;
a represents about 1.4e-6,
b represents about -3.8e-4,
The system of aspect A23, wherein c represents about 3.6e-2.
31. Formula where the analyte concentration is of the form:
G0は、検体濃度を表し、
IEは、所定の時間に測定された最終電流の合計から決定される電流(検体濃度に比例)を表し、
「切片」は、検査ストリップのバッチの校正パラメータを表し、
xは、前記導出する工程から導出されたバッチ傾きを表す、態様A30に記載のシステム。
32.検査ストリップの高い精度を得るための方法であって、検査ストリップのバッチを与える工程と、
基準濃度の検体を含む基準試料を該検査ストリップのバッチのそれぞれに導入することにより検査シーケンスを開始する工程と、
該検体を該検査ストリップ上の試薬と反応させることによって2つの電極間の該検体の物理的変換を引き起こす工程と、
該基準試料の物理的特性を決定する工程と、
該基準試料の該決定された物理的特性に基づいて該検査ストリップのバッチについてバッチ傾きを導出する工程と、
該検査シーケンスの間の所定の時点において該基準試料の電気的出力をサンプリングする工程と、
該規定されたバッチ傾き及びサンプリングされた電気的出力に基づいて検体濃度を計算する工程であって、該検査ストリップのバッチの最終的な検体濃度の値の少なくとも95%が該基準検体濃度の±15%以内となるように該検査ストリップのバッチのそれぞれについて最終的な検体濃度の値を与える工程と、を含む方法。
33.前記第1の信号を印加する工程、及び前記第2の信号を流す工程が連続した順序である、態様A32に記載の方法。
34.前記第1の信号を印加する工程が、前記第2の信号を流す工程と重なり合う、態様A32に記載の方法。
35.前記第1の信号を印加する工程が、前記試料に交流信号を適用することによって該交流信号の出力から該試料の物理的特性を決定することを含む、態様A32に記載の方法。
36.前記第1の信号を印加する工程が、前記試料に光学信号を適用することによって該光学信号の出力から該試料の物理的特性を決定することを含む、態様A32に記載の方法。
37.前記物理的特性がヘマトクリット値を含み、前記検体がグルコースを含む、態様A35又は態様A36のいずれか一項に記載の方法。
38.前記物理的特性が、前記試料の粘性、ヘマトクリット値、及び密度の少なくとも1つを含む、態様A35又は態様A36のいずれか一項に記載の方法。
39.前記適用する工程が、第1及び第2の交流信号を、第1の周波数が第2の周波数よりも低い異なるそれぞれの周波数で流すことを含む、態様A34に記載の方法。
40.前記第1の周波数が前記第2の周波数よりも少なくとも1桁低い、態様A39に記載の方法。
41.前記第1の周波数が約10kHz〜約90kHzの範囲の任意の周波数を含む、態様A40に記載の方法。
42.前記導出する工程が、以下の形の式:
G 0 represents the analyte concentration,
IE represents the current (proportional to the analyte concentration) determined from the sum of the final currents measured at a given time,
“Section” represents the calibration parameters of a batch of test strips,
The system of aspect A30, wherein x represents a batch slope derived from the deriving step.
32. A method for obtaining a high accuracy of a test strip, the step of providing a batch of test strips;
Initiating a test sequence by introducing a reference sample containing a reference concentration of analyte into each of the batches of the test strip;
Causing a physical conversion of the analyte between two electrodes by reacting the analyte with a reagent on the test strip;
Determining physical properties of the reference sample;
Deriving a batch slope for the batch of test strips based on the determined physical properties of the reference sample;
Sampling the electrical output of the reference sample at a predetermined time during the test sequence;
Calculating an analyte concentration based on the defined batch slope and the sampled electrical output, wherein at least 95% of the final analyte concentration value of the batch of test strips is ± the reference analyte concentration Providing a final analyte concentration value for each batch of test strips to be within 15%.
33. The method of aspect A32, wherein the step of applying the first signal and the step of flowing the second signal are in sequential order.
34. The method of aspect A32, wherein the step of applying the first signal overlaps with the step of flowing the second signal.
35. The method of aspect A32, wherein applying the first signal includes determining a physical property of the sample from the output of the alternating signal by applying an alternating signal to the sample.
36. The method of aspect A32, wherein applying the first signal comprises determining a physical property of the sample from an output of the optical signal by applying an optical signal to the sample.
37. The method according to any one of aspect A35 or aspect A36, wherein the physical property comprises a hematocrit value and the analyte comprises glucose.
38. The method of any one of aspects A35 or A36, wherein the physical property comprises at least one of viscosity, hematocrit value, and density of the sample.
39. The method of aspect A34, wherein the applying includes flowing the first and second alternating signals at different respective frequencies where the first frequency is lower than the second frequency.
40. The method of aspect A39, wherein the first frequency is at least an order of magnitude lower than the second frequency.
41. The method of aspect A40, wherein the first frequency comprises any frequency in the range of about 10 kHz to about 90 kHz.
42. The deriving step is an expression of the form:
![]()
Hは、測定又は推定されたヘマトクリット値を表し、
aは、約1.4e−6を表し、
bは、約−3.8e−4を表し、
cは、約3.6e−2を表す、態様A32に記載の方法。
43.前記検体濃度を計算する工程が、以下の形の式:
![]()
H represents the measured or estimated hematocrit value;
a represents about 1.4e-6,
b represents about -3.8e-4,
The method of embodiment A32, wherein c represents about 3.6e-2.
43. The step of calculating the analyte concentration comprises an equation of the form:
G0は、検体濃度を表し、
IEは、所定の時間に測定された最終電流の合計から決定される電流(検体濃度に比例)を表し、
「切片」は、バイオセンサのバッチの校正パラメータを表し、
xは、前記導出する工程から導出されたバッチ傾きを表す、態様A42に記載の方法。
44.生理学的試料から検体濃度を決定する方法であって、
生理学的試料をバイオセンサに付着する工程と、
該試料に電気信号を印加することによって該検体を異なる物質に変換する工程と、該試料の物理的特性を測定する工程と、該試料からの信号出力を評価する工程と、
該測定された物理的特性から該バイオセンサのパラメータを導出する工程と、該バイオセンサの該導出されたパラメータ及び該試料の該信号出力に基づいて検体濃度を決定する工程と、を含む方法。
45.前記測定する工程が、前記試料に第1の電気信号を印加することによって該試料の物理的特性を測定することを含む、態様A44に記載の方法。
46.前記評価する工程が、前記試料に第2の電気信号を流すことを含む、態様A44に記載の方法。
47.前記第1の信号を印加する工程、及び前記第2の信号を流す工程が連続した順序である、態様A46に記載の方法。
48.前記第1の信号を印加する工程が、前記第2の信号を流す工程と重なり合う、態様A46に記載の方法。
49.前記第1の信号を印加する工程が、前記試料に交流信号を適用することによって該交流信号の出力から該試料の物理的特性を決定することを含む、態様A46に記載の方法。
50.前記第1の信号を印加する工程が、前記試料に光学信号を適用することによって該光学信号の出力から該試料の物理的特性を決定することを含む、態様A44に記載の方法。
51.前記物理的特性がヘマトクリット値を含み、前記検体がグルコースを含む、態様A49又は態様A50のいずれか一項に記載の方法。
52.前記物理的特性が、前記試料の粘性、ヘマトクリット値、及び密度の少なくとも1つを含む、態様A49又は態様A50のいずれか一項に記載の方法。
53.前記適用する工程が、第1及び第2の交流信号を、第1の周波数が第2の周波数よりも低い異なるそれぞれの周波数で流すことを含む、態様A49に記載の方法。
54.前記第1の周波数が前記第2の周波数よりも少なくとも1桁低い、態様A53に記載の方法。
55.前記第1の周波数が約10kHz〜約90kHzの範囲の任意の周波数を含む、態様A54に記載の方法。
56.前記導出する工程が、以下の形の式:
G 0 represents the analyte concentration,
IE represents the current (proportional to the analyte concentration) determined from the sum of the final currents measured at a given time,
“Section” represents the calibration parameters of a batch of biosensors,
The method of aspect A42, wherein x represents a batch slope derived from the deriving step.
44. A method for determining an analyte concentration from a physiological sample, comprising:
Attaching a physiological sample to the biosensor;
Converting the analyte into a different substance by applying an electrical signal to the sample, measuring physical properties of the sample, evaluating signal output from the sample,
Deriving parameters of the biosensor from the measured physical properties and determining an analyte concentration based on the derived parameters of the biosensor and the signal output of the sample.
45. The method of aspect A44, wherein the measuring includes measuring a physical property of the sample by applying a first electrical signal to the sample.
46. The method of aspect A44, wherein the step of evaluating includes passing a second electrical signal through the sample.
47. The method of aspect A46, wherein the step of applying the first signal and the step of flowing the second signal are in a sequential order.
48. The method of aspect A46, wherein the step of applying the first signal overlaps with the step of flowing the second signal.
49. The method of aspect A46, wherein applying the first signal comprises determining a physical property of the sample from the output of the alternating signal by applying an alternating signal to the sample.
50. The method of aspect A44, wherein applying the first signal comprises determining a physical property of the sample from an output of the optical signal by applying an optical signal to the sample.
51. The method of any one of aspects A49 or aspect A50, wherein the physical property comprises a hematocrit value and the analyte comprises glucose.
52. The method of any one of aspects A49 or aspect A50, wherein the physical properties comprise at least one of viscosity, hematocrit value, and density of the sample.
53. The method of aspect A49, wherein the applying includes flowing the first and second alternating signals at different respective frequencies where the first frequency is lower than the second frequency.
54. The method of aspect A53, wherein the first frequency is at least an order of magnitude lower than the second frequency.
55. The method of aspect A54, wherein the first frequency comprises any frequency in the range of about 10 kHz to about 90 kHz.
56. The deriving step is an expression of the form:
![]()
Hは、測定又は推定されたヘマトクリット値を表し、
aは、約1.4e−6を表し、
bは、約−3.8e−4を表し、
cは、約3.6e−2を表す、態様A44に記載の方法。
57.前記検体濃度を計算する工程が、以下の形の式:
![]()
H represents the measured or estimated hematocrit value;
a represents about 1.4e-6,
b represents about -3.8e-4,
The method according to aspect A44, wherein c represents about 3.6e-2.
57. The step of calculating the analyte concentration comprises an equation of the form:
G0は、検体濃度を表し、
IEは、所定の時間に測定された最終電流の合計から決定される電流(検体濃度に比例)を表し、
「切片」は、検査ストリップのバッチの校正パラメータを表し、
xは、前記導出する工程から導出されたバッチ傾きを表す、態様A56に記載の方法。
G 0 represents the analyte concentration,
IE represents the current (proportional to the analyte concentration) determined from the sum of the final currents measured at a given time,
“Section” represents the calibration parameters of a batch of test strips,
A method according to aspect A56, wherein x represents a batch slope derived from the deriving step.
セクション「B」
以下の態様は、米国仮特許出願第61/581,089号(代理人整理番号DDI5220USPSP1)に最初に示されたものであり、本開示の一部をなすものである。
1.少なくとも2つの電極及び該電極の少なくとも一方の電極に配置された試薬を有するバイオセンサによって生理学的試料から検体濃度を決定する方法であって、
該少なくとも2つの電極に生理学的試料を付着させることによって検体検査シーケンスを開始する工程と、
第1の電気信号を試料に印加して該試料の物理的特性を導出する工程と、
該試料の物理的特性を得る工程と、
該得られた物理的特性に基づいてサンプリング時間を特定する工程と、該試料に第2の電気信号を流す工程と、
該少なくとも2つの電極の少なくとも1つの電極から該特定されたサンプリング時間における出力電流を測定する工程と、
該測定された出力電流に基づいて検体濃度を計算する工程と、を含む方法。
2.前記第1の信号を印加する工程、及び前記第2の信号を流す工程が連続した順序である、態様B1に記載の方法。
3.前記第1の信号を印加する工程が、前記第2の信号を流す工程と重なり合う、態様B1に記載の方法。
4.前記第1の信号を印加する工程が、前記試料に交流信号を適用することによって該交流信号の出力から該試料の物理的特性を決定することを含む、態様B1に記載の方法。
5.前記第1の信号を印加する工程が、前記試料に光学信号を適用することによって該光学信号の出力から該試料の物理的特性を決定することを含む、態様B1に記載の方法。
6.前記物理的特性がヘマトクリット値を含み、前記検体がグルコースを含む、態様B4又は態様B5のいずれか一項に記載の方法。
7.前記物理的特性が、前記試料の粘性、ヘマトクリット値、及び密度の少なくとも1つを含む、態様B1に記載の方法。
8.前記適用する工程が、第1及び第2の交流信号を、第1の周波数が第2の周波数よりも低い異なるそれぞれの周波数で流すことを含む、態様B4に記載の方法。
9.前記第1の周波数が前記第2の周波数よりも少なくとも1桁低い、態様B8に記載の方法。
10.前記第1の周波数が約10kHz〜約90kHzの範囲の任意の周波数を含む、態様B9に記載の方法。
11.前記特定されたサンプリング時間が、以下の形の式:
特定されたサンプリング時間=x1Hx2+x3
を用いて計算され、式中、「特定されたサンプリング時間」は、前記検査ストリップの出力信号をサンプリングする検査シーケンスの開始からの時点として指定され、
Hは、ヘマトクリット値の形の前記試料の物理的特性を表し、
x1は、約4.3e5であり、
x2は、約−3.9であり、
x3は、約4.8である、態様B1に記載の方法。
12.前記検体濃度を計算する工程が、以下の形の式:
Section “B”
The following aspects were first shown in US Provisional Patent Application No. 61 / 581,089 (Attorney Docket No. DDI5220USPSP1) and form part of this disclosure.
1. A method for determining an analyte concentration from a physiological sample by a biosensor having at least two electrodes and a reagent disposed on at least one of the electrodes, comprising:
Initiating an analyte test sequence by attaching a physiological sample to the at least two electrodes;
Applying a first electrical signal to the sample to derive physical properties of the sample;
Obtaining physical properties of the sample;
Identifying a sampling time based on the obtained physical characteristics; passing a second electrical signal through the sample;
Measuring an output current at the specified sampling time from at least one of the at least two electrodes;
Calculating an analyte concentration based on the measured output current.
2. The method of aspect B1, wherein the step of applying the first signal and the step of flowing the second signal are in a sequential order.
3. The method of aspect B1, wherein the step of applying the first signal overlaps with the step of flowing the second signal.
4). The method of aspect B1, wherein applying the first signal comprises determining a physical property of the sample from the output of the alternating signal by applying an alternating signal to the sample.
5. The method of aspect B1, wherein applying the first signal comprises determining a physical property of the sample from an output of the optical signal by applying an optical signal to the sample.
6). The method of any one of aspects B4 or B5, wherein the physical property comprises a hematocrit value and the analyte comprises glucose.
7). The method of aspect B1, wherein the physical property comprises at least one of a viscosity, a hematocrit value, and a density of the sample.
8). The method of aspect B4, wherein the applying step includes flowing the first and second alternating signals at respective different frequencies where the first frequency is lower than the second frequency.
9. The method of aspect B8, wherein the first frequency is at least an order of magnitude lower than the second frequency.
10. The method of aspect B9, wherein the first frequency comprises any frequency in the range of about 10 kHz to about 90 kHz.
11. The specified sampling time is an expression of the form:
Specified sampling time = x 1 H x 2 + x 3
Where the “specified sampling time” is specified as the point in time from the start of the test sequence that samples the output signal of the test strip;
H represents the physical properties of the sample in the form of a hematocrit value;
x 1 is about 4.3e5;
x 2 is about -3.9,
The method of embodiment B1, wherein x 3 is about 4.8.
12 The step of calculating the analyte concentration comprises an equation of the form:
G0は、検体濃度を表し、
IEは、特定されたサンプリング時間に測定された最終電流の合計から決定される電流(検体濃度に比例)を表し、
「傾き」は、この特定のストリップが属する検査ストリップのバッチの校正試験より得られる値を表し、
「切片」は、この特定のストリップが属する検査ストリップのバッチの校正試験より得られる値を表す、態様B11に記載の方法。
13.基材と、
それぞれの電極コネクタに接続された複数の電極とを有する検査ストリップと、
ハウジングと、
該検査ストリップの該それぞれの電極コネクタに接続されるように構成された検査ストリップポートコネクタと、
検査シーケンスの間に該複数の電極に電気信号を印加するか又は該複数の電極からの電気信号を検知するように該検査ストリップポートコネクタと電気的に導通したマイクロプロセッサとを有する検体計測器と、を備える検体測定システムであって、該マイクロプロセッサが、該検査シーケンスの間に、(a)該複数の電極に第1の電気信号を印加することにより、生理学的流体試料の物理的特性より特定のサンプリング時点を決定し、(b)該複数の電極に第2の電気信号を印加し、(c)該特定されたサンプリング時点において該複数の電極の1つからの電流出力を測定することにより検体濃度を決定するように構成されている検体測定システム。
14.前記複数の電極が、物理的特性を測定するための少なくとも2つの電極、及び検体濃度を測定するための少なくとも2つの他の電極を含む、態様B13に記載のシステム。
15.前記少なくとも2つの電極及び前記少なくとも2つの他の電極が、前記基板上に設けられた同じチャンバ内に配置される、態様B14に記載のシステム。
16.前記少なくとも2つの電極及び前記少なくとも2つの他の電極が、前記基板上に設けられた異なるチャンバ内に配置される、態様B14に記載のシステム。
17.前記少なくとも2つの電極が、物理的特性及び検体濃度を測定するための2つの電極を含む、態様B14に記載のシステム。
18.電極のすべてが、前記基板によって規定される同じ平面上に配置される、態様B15、B16、又はB17のいずれか一項に記載のシステム。
19.前記少なくとも2つの他の電極に近接して試薬が配置され、前記少なくとも2つの電極上に試薬が配置されない、態様B16又は態様B17のいずれか一項に記載のシステム。
20.前記特定されたサンプリング時間が、以下の形の式:
特定されたサンプリング時間=x1Hx2+x3
を用いて計算され、式中、「特定されたサンプリング時間」は、前記検査ストリップの出力信号をサンプリングする検査シーケンスの開始からの時点として指定され、
Hは、ヘマトクリット値の形の前記試料の物理的特性を表し、
x1は、約4.3e5を表し、
x2は、約−3.9を表し、
x3は、約4.8を表す、態様B13に記載のシステム。
21.前記検体濃度が以下の形の式:
G 0 represents the analyte concentration,
IE represents the current (proportional to the analyte concentration) determined from the sum of the final currents measured at the specified sampling time,
“Slope” represents the value obtained from a calibration test of a batch of test strips to which this particular strip belongs,
The method of aspect B11, wherein “section” represents a value obtained from a calibration test of a batch of test strips to which this particular strip belongs.
13. A substrate;
A test strip having a plurality of electrodes connected to each electrode connector;
A housing;
A test strip port connector configured to be connected to the respective electrode connector of the test strip;
An analyte meter having a microprocessor in electrical communication with the test strip port connector to apply an electrical signal to the plurality of electrodes or to detect an electrical signal from the plurality of electrodes during a test sequence; Wherein the microprocessor applies (a) a first electrical signal to the plurality of electrodes during the test sequence, thereby providing a physical characteristic of the physiological fluid sample. Determining a particular sampling time point, (b) applying a second electrical signal to the plurality of electrodes, and (c) measuring a current output from one of the plurality of electrodes at the identified sampling time point. An analyte measurement system configured to determine an analyte concentration by:
14 The system of aspect B13, wherein the plurality of electrodes includes at least two electrodes for measuring physical properties and at least two other electrodes for measuring analyte concentration.
15. The system of aspect B14, wherein the at least two electrodes and the at least two other electrodes are disposed in the same chamber provided on the substrate.
16. The system of aspect B14, wherein the at least two electrodes and the at least two other electrodes are disposed in different chambers provided on the substrate.
17. The system of aspect B14, wherein the at least two electrodes include two electrodes for measuring physical properties and analyte concentration.
18. The system of any one of aspects B15, B16, or B17, wherein all of the electrodes are disposed on the same plane defined by the substrate.
19. The system of any one of aspects B16 or B17, wherein a reagent is disposed proximate to the at least two other electrodes and no reagent is disposed on the at least two electrodes.
20. The specified sampling time is an expression of the form:
Specified sampling time = x 1 H x 2 + x 3
Where the “specified sampling time” is specified as the point in time from the start of the test sequence that samples the output signal of the test strip;
H represents the physical properties of the sample in the form of a hematocrit value;
x 1 represents approximately 4.3e5;
x 2 represents about -3.9,
The system of aspect B13, wherein x 3 represents approximately 4.8.
21. Formula where the analyte concentration is of the form:
G0は、検体濃度を表し、
IEは、「特定されたサンプリング時間」に測定された最終電流の合計から決定される電流(検体濃度に比例)を表し、
「傾き」は、この特定のストリップが属する検査ストリップのバッチの校正試験より得られる値を表し、
「切片」は、この特定のストリップが属する検査ストリップのバッチの校正試験より得られる値を表す、態様B20に記載のシステム。
22.
基板と、
それぞれの電極コネクタに接続された複数の電極とを有する検査ストリップと、
ハウジングと、
該検査ストリップの該それぞれの電極コネクタに接続されるように構成された検査ストリップポートコネクタと、
該複数の電極に電気信号を印加するか又は該複数の電極からの電気信号を検知するように該検査ストリップポートコネクタと電気的に導通したマイクロプロセッサとを有する検体計測器と、を備える検体測定システムであって、該マイクロプロセッサが、該検査シーケンスの間に、(a)該複数の電極に第1の電気信号を印加することにより、生理学的流体試料の物理的特性より特定のサンプリング時点を決定し、(b)該複数の電極に第2の電気信号を印加し、(c)該特定されたサンプリング時点において該複数の電極の1つからの電流出力を測定することにより検査シーケンスの開始の約10秒以内に該特定のサンプリング時点に基づいて該試料の検体濃度を決定するように構成されている検体測定システム。
23.前記複数の電極が、物理的特性を測定するための少なくとも2つの電極、及び検体濃度を測定するための少なくとも2つの他の電極を含む、態様B22に記載のシステム。
24.前記少なくとも2つの電極及び前記少なくとも2つの他の電極が、前記基板上に設けられた同じチャンバ内に配置される、態様B23に記載のシステム。
25.前記少なくとも2つの電極及び前記少なくとも2つの他の電極が、前記基板上に設けられた異なるチャンバ内に配置される、態様B23に記載のシステム。
26.前記少なくとも2つの電極が、物理的特性及び検体濃度を測定するための2つの電極を含む、態様B23に記載のシステム。
27.電極のすべてが前記基板によって規定される同じ平面上に配置される、態様B23、B24、B25、又はB26のいずれか一項に記載のシステム。
28.前記少なくとも2つの他の電極に近接して試薬が配置され、前記少なくとも2つの電極上に試薬が配置されない、態様B22又は態様B23のいずれか一項に記載のシステム。
29.前記特定されたサンプリング時間が、以下の形の式:
特定されたサンプリング時間=x1Hx2+x3
を用いて計算され、式中、「特定されたサンプリング時点」は、前記検査ストリップの出力信号をサンプリングする検査シーケンスの開始からの時点として指定され、
Hは、ヘマトクリット値の形の前記試料の物理的特性を表し、
x1は、約4.3e5を表し、
x2は、約−3.9を表し、
x3は、約4.8を表す、態様B22に記載のシステム。
30.前記検体濃度が以下の形の式:
G 0 represents the analyte concentration,
IE represents the current (proportional to the analyte concentration) determined from the sum of the final currents measured at the “specified sampling time”;
“Slope” represents the value obtained from a calibration test of a batch of test strips to which this particular strip belongs,
The system of aspect B20, wherein “section” represents a value obtained from a calibration test of a batch of test strips to which this particular strip belongs.
22.
A substrate,
A test strip having a plurality of electrodes connected to each electrode connector;
A housing;
A test strip port connector configured to be connected to the respective electrode connector of the test strip;
Specimen measurement comprising: a sample measuring instrument having a microprocessor in electrical communication with the test strip port connector to apply an electrical signal to the plurality of electrodes or to detect an electrical signal from the plurality of electrodes A system wherein the microprocessor (a) applies a first electrical signal to the plurality of electrodes during the test sequence to determine a specific sampling time point from a physical characteristic of a physiological fluid sample. Determining, and (b) applying a second electrical signal to the plurality of electrodes, and (c) starting a test sequence by measuring a current output from one of the plurality of electrodes at the specified sampling time An analyte measurement system configured to determine an analyte concentration of the sample based on the particular sampling time point within about 10 seconds of.
23. The system of aspect B22, wherein the plurality of electrodes includes at least two electrodes for measuring physical properties and at least two other electrodes for measuring analyte concentration.
24. The system of aspect B23, wherein the at least two electrodes and the at least two other electrodes are disposed in the same chamber provided on the substrate.
25. The system of aspect B23, wherein the at least two electrodes and the at least two other electrodes are disposed in different chambers provided on the substrate.
26. The system of aspect B23, wherein the at least two electrodes comprise two electrodes for measuring physical properties and analyte concentration.
27. The system according to any one of aspects B23, B24, B25, or B26, wherein all of the electrodes are disposed on the same plane defined by the substrate.
28. The system of any one of aspects B22 or B23, wherein a reagent is disposed proximate to the at least two other electrodes and no reagent is disposed on the at least two electrodes.
29. The specified sampling time is an expression of the form:
Specified sampling time = x 1 H x 2 + x 3
Where “specified sampling point” is designated as the point in time from the start of the test sequence that samples the output signal of the test strip;
H represents the physical properties of the sample in the form of a hematocrit value;
x 1 represents approximately 4.3e5;
x 2 represents about -3.9,
The system of aspect B22, wherein x 3 represents approximately 4.8.
30. Formula where the analyte concentration is of the form:
G0は、検体濃度を表し、
IEは、特定されたサンプリング時間に測定された最終電流の合計から決定される電流(検体濃度に比例)を表し、
「傾き」は、この特定のストリップが属する検査ストリップのバッチの校正試験より得られる値を表し、
「切片」は、この特定のストリップが属する検査ストリップのバッチの校正試験より得られる値を表す、態様B29に記載のシステム。
31.生理学的試料から検体濃度を決定する方法であって、
試薬が付着されたバイオセンサ上に生理学的試料を付着させる工程と、
該試料及び該試薬に電気信号を印加することによって該検体を異なる物質に変換する工程と、
該試料の物理的特性を得る工程と、
該得られた物理的特性に基づいて電流出力をサンプリングするための時点を特定する工程と、
該特定されたサンプリング時点における信号出力を測定する工程と、該試料の該測定された信号出力に基づいて検体濃度を決定する工程と、を含む方法。
32.前記得る工程が、前記試料に第2の電気信号を流すことによって該試料の物理的特性を導出することを含む、態様B31に記載の方法。
33.前記印加する工程が、前記試料に第1の電気信号を印加して該試料の物理的特性を導出することを含み、該第1の信号を印加する工程及び前記第2の信号を流す工程が連続した順序である、態様B44に記載の方法。
34.前記第1の信号を印加する工程が、前記第2の信号を流す工程と重なり合う、態様B33に記載の方法。
35.前記第1の信号を印加する工程が、前記試料に交流信号を適用することによって該交流信号の出力から該試料の物理的特性を決定することを含む、態様B33に記載の方法。
36.前記第1の信号を印加する工程が、前記試料に光学信号を適用することによって該光学信号の出力から該試料の物理的特性を決定することを含む、態様B33に記載の方法。
37.前記物理的特性がヘマトクリット値を含み、前記検体がグルコースを含む、態様B35又は態様B36のいずれか一項に記載の方法。
38.前記物理的特性が、前記試料の粘性、ヘマトクリット値、及び密度の少なくとも1つを含む、態様B36又は態様B37のいずれか一項に記載の方法。
39.前記適用する工程が、第1及び第2の交流信号を、第1の周波数が第2の周波数よりも低い異なるそれぞれの周波数で流すことを含む、態様B36に記載の方法。
40.前記第1の周波数が前記第2の周波数よりも少なくとも1桁低い、態様B39に記載の方法。
41.前記第1の周波数が約10kHz〜約90kHzの範囲の任意の周波数を含む、態様B40に記載の方法。
42.前記特定されたサンプリング時間が、以下の形の式:
特定されたサンプリング時間=x1Hx2+x3
を用いて計算され、式中、「特定されたサンプリング時間」は、前記検査ストリップの出力信号をサンプリングする検査シーケンスの開始からの時点として指定され、
Hは、ヘマトクリット値の形の前記試料の物理的特性を表し、
x1は、約4.3e5を表し、
x2は、約−3.9を表し、
x3は、約4.8を表す、態様B31に記載の方法。
43.前記検体濃度を計算する工程が、以下の形の式:
G 0 represents the analyte concentration,
IE represents the current (proportional to the analyte concentration) determined from the sum of the final currents measured at the specified sampling time,
“Slope” represents the value obtained from a calibration test of a batch of test strips to which this particular strip belongs,
The system of aspect B29, wherein “section” represents a value obtained from a calibration test of a batch of test strips to which this particular strip belongs.
31. A method for determining an analyte concentration from a physiological sample, comprising:
Attaching a physiological sample on the biosensor to which the reagent is attached;
Converting the analyte into a different substance by applying an electrical signal to the sample and the reagent; and
Obtaining physical properties of the sample;
Identifying a time point for sampling the current output based on the obtained physical characteristics;
Measuring the signal output at the specified sampling time, and determining an analyte concentration based on the measured signal output of the sample.
32. The method of aspect B31, wherein the obtaining step includes deriving a physical property of the sample by passing a second electrical signal through the sample.
33. The step of applying includes applying a first electrical signal to the sample to derive a physical property of the sample, the step of applying the first signal and the step of flowing the second signal; The method of embodiment B44, which is in sequential order.
34. The method of aspect B33, wherein the step of applying the first signal overlaps with the step of flowing the second signal.
35. The method of aspect B33, wherein applying the first signal comprises determining a physical property of the sample from the output of the alternating signal by applying an alternating signal to the sample.
36. The method of aspect B33, wherein applying the first signal comprises determining a physical property of the sample from an output of the optical signal by applying an optical signal to the sample.
37. The method of any one of aspect B35 or aspect B36, wherein the physical property comprises a hematocrit value and the analyte comprises glucose.
38. The method of any one of aspects B36 or B37, wherein the physical property comprises at least one of the viscosity, hematocrit value, and density of the sample.
39. The method of aspect B36, wherein the applying step includes flowing first and second alternating signals at different respective frequencies where the first frequency is lower than the second frequency.
40. The method of aspect B39, wherein the first frequency is at least an order of magnitude lower than the second frequency.
41. The method of aspect B40, wherein the first frequency comprises any frequency in the range of about 10 kHz to about 90 kHz.
42. The specified sampling time is an expression of the form:
Specified sampling time = x 1 H x 2 + x 3
Where the “specified sampling time” is specified as the point in time from the start of the test sequence that samples the output signal of the test strip;
H represents the physical properties of the sample in the form of a hematocrit value;
x 1 represents approximately 4.3e5;
x 2 represents about -3.9,
The method of embodiment B31, wherein x 3 represents about 4.8.
43. The step of calculating the analyte concentration comprises an equation of the form:
G0は、検体濃度を表し、
IEは、特定されたサンプリング時間に測定された最終電流の合計から決定される電流(検体濃度に比例)を表し、
「傾き」は、この特定のストリップが属する検査ストリップのバッチの校正試験より得られる値を表し、
「切片」は、この特定のストリップが属する検査ストリップのバッチの校正試験より得られる値を表す、態様B42に記載の方法。
G 0 represents the analyte concentration,
IE represents the current (proportional to the analyte concentration) determined from the sum of the final currents measured at the specified sampling time,
“Slope” represents the value obtained from a calibration test of a batch of test strips to which this particular strip belongs,
The method of aspect B42, wherein “section” represents a value obtained from a calibration test of a batch of test strips to which this particular strip belongs.
セクション「C」
以下の態様は、米国仮特許出願第61/581,099号(代理人整理番号DDI5220USPSP2)に最初に示されたものであり、本開示の一部をなすものである。
1.少なくとも2つの電極及び該電極の少なくとも一方の電極に配置された試薬を有するバイオセンサによって生理学的試料から検体濃度を決定する方法であって、
該少なくとも2つの電極に生理学的試料を付着させることによって検体検査シーケンスを開始する工程と、
第1の電気信号を試料に印加して該試料の物理的特性を導出する工程と、
該試料の物理的特性を得る工程と、
該得る工程からの該物理的特性に基づいてサンプリング時間を特定する工程と、
該得る工程からの該物理的特性に基づいて該試薬についてのバッチ傾きを導出する工程と、
該試料に第2の電気信号を流す工程と、
該少なくとも2つの電極の少なくとも1つの電極から該特定されたサンプリング時間における出力信号を測定する工程と、
該特定されたサンプリング時間における該測定された出力信号及び該導出されたバッチ傾きに基づいて検体濃度を計算する工程と、を含む方法。
2.前記第1の信号を印加する工程、及び前記第2の信号を流す工程が連続した順序である、態様C1に記載の方法。
3.前記第1の信号を印加する工程が、前記第2の信号を流す工程と重なり合う、態様C1に記載の方法。
4.前記第1の信号を印加する工程が、前記試料に交流信号を適用することによって該交流信号の出力から該試料の物理的特性を決定することを含む、態様C1に記載の方法。
5.前記第1の信号を印加する工程が、前記試料に光学信号を適用することによって該光学信号の出力から該試料の物理的特性を決定することを含む、態様C1に記載の方法。
6.前記物理的特性がヘマトクリット値を含み、前記検体がグルコースを含む、態様C4又は態様C5のいずれか一項に記載の方法。
7.前記物理的特性が、前記試料の粘性、ヘマトクリット値、及び密度の少なくとも1つを含む、態様C1に記載の方法。
8.前記適用する工程が、第1及び第2の交流信号を、第1の周波数が第2の周波数よりも低い異なるそれぞれの周波数で流すことを含む、態様C4に記載の方法。
9.前記第1の周波数が前記第2の周波数よりも少なくとも1桁低い、態様C8に記載の方法。
10.前記第1の周波数が約10kHz〜約90kHzの範囲の任意の周波数を含む、態様C9に記載の方法。
11.前記特定されたサンプリング時間が以下の形の式:
特定されたサンプリング時間=x1Hx2+x3
を用いて計算され、式中、「特定されたサンプリング時間」は、前記検査ストリップの出力信号をサンプリングする検査シーケンスの開始からの時点として指定され、
Hは、ヘマトクリット値の形の前記試料の物理的特性を表し、
x1は、約4.3e5であり、
x2は、約−3.9であり、
x3は、約4.8である、態様C1の方法。
12.前記導出された傾きが以下の形の式:
新たな傾き=aH2+bH+c
から決定され、式中、Hは、測定又は推定された物理的特性(例えばヘマトクリット値)であり、
aは、約1.35e−6であり、
bは、約−3.79e−4であり、
cは、約3.56e−2である、態様C11に記載の方法。
13.前記検体濃度を計算する工程が、以下の形の式:
Section "C"
The following aspects were first shown in US Provisional Patent Application No. 61 / 581,099 (Attorney Docket No. DDI5220USPSP2) and form part of this disclosure.
1. A method for determining an analyte concentration from a physiological sample by a biosensor having at least two electrodes and a reagent disposed on at least one of the electrodes, comprising:
Initiating an analyte test sequence by attaching a physiological sample to the at least two electrodes;
Applying a first electrical signal to the sample to derive physical properties of the sample;
Obtaining physical properties of the sample;
Identifying a sampling time based on the physical characteristics from the obtaining step;
Deriving a batch slope for the reagent based on the physical properties from the obtaining step;
Passing a second electrical signal through the sample;
Measuring an output signal at the specified sampling time from at least one of the at least two electrodes;
Calculating an analyte concentration based on the measured output signal and the derived batch slope at the specified sampling time.
2. The method of aspect C1, wherein the step of applying the first signal and the step of flowing the second signal are in a sequential order.
3. The method of aspect C1, wherein applying the first signal overlaps flowing the second signal.
4). The method of aspect C1, wherein applying the first signal comprises determining a physical property of the sample from an output of the alternating signal by applying an alternating signal to the sample.
5. The method of aspect C1, wherein applying the first signal comprises determining a physical property of the sample from an output of the optical signal by applying an optical signal to the sample.
6). The method according to any one of aspects C4 or C5, wherein the physical characteristic comprises a hematocrit value and the analyte comprises glucose.
7). The method of aspect C1, wherein the physical property comprises at least one of a viscosity, a hematocrit value, and a density of the sample.
8). The method of aspect C4, wherein the applying step includes flowing the first and second alternating signals at different respective frequencies where the first frequency is lower than the second frequency.
9. The method of aspect C8, wherein the first frequency is at least an order of magnitude lower than the second frequency.
10. The method of aspect C9, wherein the first frequency comprises any frequency in the range of about 10 kHz to about 90 kHz.
11. The specified sampling time is of the form:
Specified sampling time = x 1 H x 2 + x 3
Where the “specified sampling time” is specified as the point in time from the start of the test sequence that samples the output signal of the test strip;
H represents the physical properties of the sample in the form of a hematocrit value;
x 1 is about 4.3e5;
x 2 is about -3.9,
The method of embodiment C1, wherein x 3 is about 4.8.
12 The derived slope is an expression of the form:
New slope = aH 2 + bH + c
Where H is a measured or estimated physical property (eg, hematocrit value);
a is about 1.35e-6,
b is about −3.79e−4;
The method of aspect C11, wherein c is about 3.56e-2.
13. The step of calculating the analyte concentration comprises an equation of the form:
G0は、検体濃度を表し、
IEは、特定されたサンプリング時間に測定された最終信号の合計から決定される信号(検体濃度に比例)を表し、
「新たな傾き」は、前記測定された物理的特性から導出される値を表し、
「切片」は、この特定のストリップが属する検査ストリップのバッチの校正試験より得られる値を表す、態様C12の方法。
14.
基板と、
それぞれの電極コネクタに接続された複数の電極とを有する検査ストリップと、
ハウジングと、
該検査ストリップの該それぞれの電極コネクタに接続されるように構成された検査ストリップポートコネクタと、
検査シーケンスの間に該複数の電極に電気信号を印加するか又は該複数の電極からの電気信号を検知するように該検査ストリップポートコネクタと電気的に導通したマイクロプロセッサとを有する検体計測器と、を備える検体測定システムであって、該マイクロプロセッサが、検査シーケンスの間に、
(a)該複数の電極に第1の電気信号を印加することにより、生理学的流体試料の物理的特性より特定のサンプリング時点及びバッチ傾きを決定し、(b)該複数の電極に第2の電気信号を印加し、(c)該特定されたサンプリング時点において該複数の電極の1つからの信号出力を測定することにより該特定された時点における該測定信号及び該バッチ傾きに基づいて検体濃度を決定するように構成されている検体測定システム。
15.前記複数の電極が、物理的特性を測定するための少なくとも2つの電極、及び検体濃度を測定するための少なくとも2つの他の電極を含む、態様C14に記載のシステム。
16.前記少なくとも2つの電極及び前記少なくとも2つの他の電極が、前記基板上に設けられた同じチャンバ内に配置される、態様C15に記載のシステム。
17.前記少なくとも2つの電極及び前記少なくとも2つの他の電極が、前記基板上に設けられた異なるチャンバ内に配置される、態様C15に記載のシステム。
18.前記少なくとも2つの電極が、物理的特性及び検体濃度を測定するための2つの電極を含む、態様C15に記載のシステム。
19.電極のすべてが前記基板によって規定される同じ平面上に配置される、態様C16、C17、又はC18のいずれか一項に記載のシステム。
20.前記少なくとも2つの他の電極に近接して試薬が配置され、前記少なくとも2つの電極上に試薬が配置されない、態様C17又は態様C18のいずれか一項に記載のシステム。
21.前記特定されたサンプリング時間が以下の形の式:
特定されたサンプリング時間=x1Hx2+x3
を用いて計算され、式中、「特定されたサンプリング時間」は、前記検査ストリップの出力信号をサンプリングする検査シーケンスの開始からの時点として指定され、
Hは、ヘマトクリット値の形の前記試料の物理的特性を表し、
x1は、約4.3e5を表し、
x2は、約−3.9を表し、
x3は、約4.8を表す、態様C14に記載の方法。
22.前記導出された傾きが以下の形の式:
新たな傾き=aH2+bH+c
から決定され、式中、Hは、測定又は推定された物理的特性(例えばヘマトクリット値)であり、
aは、約1.35e−6であり、
bは、約−3.79e−4であり、
cは、約3.56e−2である、態様C21に記載の方法。
23.前記検体濃度を計算する工程が、以下の形の式:
G 0 represents the analyte concentration,
IE represents the signal (proportional to the analyte concentration) determined from the sum of the final signals measured at the specified sampling time,
“New slope” represents a value derived from the measured physical property,
The method of aspect C12, wherein “section” represents a value obtained from a calibration test of a batch of test strips to which this particular strip belongs.
14
A substrate,
A test strip having a plurality of electrodes connected to each electrode connector;
A housing;
A test strip port connector configured to be connected to the respective electrode connector of the test strip;
An analyte meter having a microprocessor in electrical communication with the test strip port connector to apply an electrical signal to the plurality of electrodes or to detect an electrical signal from the plurality of electrodes during a test sequence; An analyte measurement system comprising: a microprocessor for performing a test sequence;
(A) applying a first electrical signal to the plurality of electrodes to determine a specific sampling time and batch slope from physical properties of the physiological fluid sample; and (b) applying a second to the plurality of electrodes. Applying an electrical signal and (c) measuring the signal output from one of the plurality of electrodes at the specified sampling time point based on the measurement signal and the batch slope at the specified time point An analyte measurement system configured to determine the.
15. The system of aspect C14, wherein the plurality of electrodes includes at least two electrodes for measuring physical properties and at least two other electrodes for measuring analyte concentration.
16. The system of aspect C15, wherein the at least two electrodes and the at least two other electrodes are disposed in the same chamber provided on the substrate.
17. The system of aspect C15, wherein the at least two electrodes and the at least two other electrodes are disposed in different chambers provided on the substrate.
18. The system of aspect C15, wherein the at least two electrodes include two electrodes for measuring physical properties and analyte concentration.
19. The system according to any one of aspects C16, C17, or C18, wherein all of the electrodes are disposed on the same plane defined by the substrate.
20. The system of any one of aspects C17 or C18, wherein a reagent is disposed proximate to the at least two other electrodes and no reagent is disposed on the at least two electrodes.
21. The specified sampling time is of the form:
Specified sampling time = x 1 H x 2 + x 3
Where the “specified sampling time” is specified as the point in time from the start of the test sequence that samples the output signal of the test strip;
H represents the physical properties of the sample in the form of a hematocrit value;
x 1 represents approximately 4.3e5;
x 2 represents about -3.9,
The method of aspect C14, wherein x 3 represents about 4.8.
22. The derived slope is an expression of the form:
New slope = aH 2 + bH + c
Where H is a measured or estimated physical property (eg, hematocrit value);
a is about 1.35e-6,
b is about −3.79e−4;
The method of aspect C21, wherein c is about 3.56e-2.
23. The step of calculating the analyte concentration comprises an equation of the form:
G0は、検体濃度を表し、
IEは、特定されたサンプリング時間に測定された最終信号の合計から決定される信号(検体濃度に比例)を表し、
「新たな傾き」は、前記測定された物理的特性から導出される値を表し、
「切片」は、この特定のストリップが属する検査ストリップのバッチの校正試験より得られる値を表す、態様C22に記載の方法。
24.
基板と、
それぞれの電極コネクタに接続された複数の電極とを有する検査ストリップと、
ハウジングと、
該検査ストリップの該それぞれの電極コネクタに接続されるように構成された検査ストリップポートコネクタと、
該複数の電極に電気信号を印加するか又は該複数の電極からの電気信号を検知するように該検査ストリップポートコネクタと電気的に導通したマイクロプロセッサとを有する検体計測器と、を備える検体測定システムであって、該マイクロプロセッサが、検査シーケンスの間に
(a)該複数の電極に第1の電気信号を印加することにより、生理学的流体試料の物理的特性より特定のサンプリング時点及びバッチ傾きを決定し、
(b)該複数の電極に第2の電気信号を印加し、
(c)該特定されたサンプリング時点において該複数の電極の1つからの信号出力を測定することにより検査シーケンスの開始の約10秒以内に該特定のサンプリング時点及び該バッチ傾きに基づいて該試料の検体濃度を決定するように構成されている検体測定システム。
25.前記複数の電極が、物理的特性を測定するための少なくとも2つの電極、及び検体濃度を測定するための少なくとも2つの他の電極を含む、態様C24に記載のシステム。
26.前記少なくとも2つの電極及び前記少なくとも2つの他の電極が、前記基板上に設けられた同じチャンバ内に配置される、態様C24に記載のシステム。
27.前記少なくとも2つの電極及び前記少なくとも2つの他の電極が、前記基板上に設けられた異なるチャンバ内に配置される、態様C24に記載のシステム。
28.前記少なくとも2つの電極が、物理的特性及び検体濃度を測定するための2つの電極を含む、態様C24に記載のシステム。
29.電極のすべてが前記基板によって規定される同じ平面上に配置される、態様C24、C25、C26、又はC27のいずれか一項に記載のシステム。
30.前記少なくとも2つの他の電極に近接して試薬が配置され、前記少なくとも2つの電極上に試薬が配置されない、態様C23又は態様C24のいずれか一項に記載のシステム。
31.前記特定されたサンプリング時間が以下の形の式:
特定されたサンプリング時間=x1Hx2+x3
を用いて計算され、式中、「特定されたサンプリング時間」は、前記検査ストリップの出力信号をサンプリングする検査シーケンスの開始からの時点として指定され、
Hは、ヘマトクリット値の形の前記試料の物理的特性を表し、
x1は、約4.3e5を表し、
x2は、約−3.9を表し、
x3は、約4.8を表す、態様C24に記載のシステム。
32.前記導出された傾きが以下の形の式:
新たな傾き=aH2+bH+c
から決定され、式中、「新たな傾き」は、導出された傾きを表し、
Hは、測定又は推定された物理的特性(例えばヘマトクリット値)であり、
aは、約1.35e−6であり、
bは、約−3.79e−4であり、
cは、約3.56e−2である、態様C31に記載のシステム。
33.前記検体濃度を計算する工程が、以下の形の式:
G 0 represents the analyte concentration,
IE represents the signal (proportional to the analyte concentration) determined from the sum of the final signals measured at the specified sampling time,
“New slope” represents a value derived from the measured physical property,
The method of aspect C22, wherein “section” represents a value obtained from a calibration test of a batch of test strips to which this particular strip belongs.
24.
A substrate,
A test strip having a plurality of electrodes connected to each electrode connector;
A housing;
A test strip port connector configured to be connected to the respective electrode connector of the test strip;
Specimen measurement comprising: a sample measuring instrument having a microprocessor in electrical communication with the test strip port connector to apply an electrical signal to the plurality of electrodes or to detect an electrical signal from the plurality of electrodes A system wherein the microprocessor (a) applies a first electrical signal to the plurality of electrodes during a test sequence to thereby determine a specific sampling time point and batch slope from a physical characteristic of a physiological fluid sample. Decide
(B) applying a second electrical signal to the plurality of electrodes;
(C) measuring the signal output from one of the plurality of electrodes at the specified sampling time point based on the specific sampling time point and the batch slope within about 10 seconds of the start of the test sequence An analyte measurement system configured to determine an analyte concentration of the.
25. The system of aspect C24, wherein the plurality of electrodes includes at least two electrodes for measuring physical properties and at least two other electrodes for measuring analyte concentration.
26. The system of aspect C24, wherein the at least two electrodes and the at least two other electrodes are disposed in the same chamber provided on the substrate.
27. The system of aspect C24, wherein the at least two electrodes and the at least two other electrodes are disposed in different chambers provided on the substrate.
28. The system of aspect C24, wherein the at least two electrodes include two electrodes for measuring physical properties and analyte concentration.
29. The system according to any one of aspects C24, C25, C26, or C27, wherein all of the electrodes are disposed on the same plane defined by the substrate.
30. The system of any one of aspects C23 or C24, wherein a reagent is disposed proximate to the at least two other electrodes and no reagent is disposed on the at least two electrodes.
31. The specified sampling time is of the form:
Specified sampling time = x 1 H x 2 + x 3
Where the “specified sampling time” is specified as the point in time from the start of the test sequence that samples the output signal of the test strip;
H represents the physical properties of the sample in the form of a hematocrit value;
x 1 represents approximately 4.3e5;
x 2 represents about -3.9,
The system of aspect C24, wherein x 3 represents approximately 4.8.
32. The derived slope is an expression of the form:
New slope = aH 2 + bH + c
Where “new slope” represents the derived slope,
H is a measured or estimated physical property (eg, hematocrit value),
a is about 1.35e-6,
b is about −3.79e−4;
The system of aspect C31, wherein c is about 3.56e-2.
33. The step of calculating the analyte concentration comprises an equation of the form:
G0は、検体濃度を表し、
IEは、特定されたサンプリング時間に測定された最終信号の合計から決定される信号(検体濃度に比例)を表し、
「新たな傾き」は、前記測定された物理的特性から導出される値を表し、
「切片」は、この特定のストリップが属する検査ストリップのバッチの校正試験より得られる値を表す、態様C32に記載の方法。
34.検査ストリップの高い精度を得る方法であって、
検査ストリップのバッチを与える工程と、
基準濃度の検体を含む基準試料を該検査ストリップのバッチのそれぞれに導入することにより検査シーケンスを開始する工程と、
該検体を反応させて該2つの電極の間で該検体の物理的変換を生じさせる工程と、
該基準試料の物理的特性を決定する工程と、
該決定された物理的特性に基づいて該検査ストリップのバッチのバッチ傾きを導出する工程と、
該測定された物理的特性によって規定される該検査シーケンスの間の特定された時点において該基準試料の電気的出力をサンプリングする工程と、
該特定された時点及び導出されたバッチ傾きに基づいて検体濃度を計算する工程であって、該検査ストリップのバッチの最終的な検体濃度の値の少なくとも95%が該基準検体濃度の±15%以内となるように該検査ストリップのバッチのそれぞれについて最終的な検体濃度の値を与える工程と、を含む方法。
35.前記反応させる工程が、前記試料に第2の電気信号を流すことを含み、前記決定する工程が、該試料に第1の電気信号を印加することによって該試料の物理的特性を導出することを含み、該第1の信号を印加する工程及び前記第2の信号を流す工程が連続した順序である、態様C34に記載の方法。
36.前記第1の信号を印加する工程が、前記第2の信号を流す工程と重なり合う、態様C35に記載の方法。
37.前記第1の信号を印加する工程が、前記試料に交流信号を適用することによって該交流信号の出力から該試料の物理的特性を決定することを含む、態様C34に記載の方法。
38.前記第1の信号を印加する工程が、前記試料に光学信号を適用することによって該光学信号の出力から該試料の物理的特性を決定することを含む、態様C34に記載の方法。
39.前記物理的特性がヘマトクリット値を含み、前記検体がグルコースを含む、態様C37又は態様C38のいずれか一項に記載の方法。
40.前記物理的特性が、前記試料の粘性、ヘマトクリット値、及び密度の少なくとも1つを含む、態様C37又は態様C38のいずれか一項に記載の方法。
41.前記適用する工程が、第1及び第2の交流信号を、第1の周波数が第2の周波数よりも低い異なるそれぞれの周波数で流すことを含む、態様C37に記載の方法。
42.前記第1の周波数が前記第2の周波数よりも少なくとも1桁低い、態様C41に記載の方法。
43.前記第1の周波数が約10kHz〜約90kHzの範囲の任意の周波数を含む、態様C41に記載の方法。
44.前記特定されたサンプリング時間が、以下の形の式:
特定されたサンプリング時間=x1Hx2+x3
を用いて計算され、式中、「特定されたサンプリング時間」は、前記検査ストリップの出力信号をサンプリングする検査シーケンスの開始からの時点として指定され、
Hは、ヘマトクリット値の形の前記試料の物理的特性を表し、
x1は、約4.3e5を表し、
x2は、約−3.9を表し、
x3は、約4.8を表す、態様C34に記載の方法。
45.前記導出された傾きが以下の形の式:
新たな傾き=aH2+bH+c
から決定され、式中、Hは測定又は推定された物理的特性(例えばヘマトクリット値)であり、
aは、約1.35e−6であり、
bは、約−3.79e−4であり、
cは、約3.56e−2である、態様C44に記載の方法。
46.前記検体濃度を計算する工程が、以下の形の式:
G 0 represents the analyte concentration,
IE represents the signal (proportional to the analyte concentration) determined from the sum of the final signals measured at the specified sampling time,
“New slope” represents a value derived from the measured physical property,
The method of aspect C32, wherein “section” represents a value obtained from a calibration test of a batch of test strips to which this particular strip belongs.
34. A method for obtaining high accuracy of a test strip,
Providing a batch of test strips;
Initiating a test sequence by introducing a reference sample containing a reference concentration of analyte into each of the batches of the test strip;
Reacting the analyte to cause physical conversion of the analyte between the two electrodes;
Determining physical properties of the reference sample;
Deriving a batch slope of the batch of test strips based on the determined physical properties;
Sampling the electrical output of the reference sample at a specified time during the test sequence defined by the measured physical property;
Calculating an analyte concentration based on the identified time point and the derived batch slope, wherein at least 95% of the final analyte concentration value of the batch of test strips is ± 15% of the reference analyte concentration Providing a final analyte concentration value for each of the batches of test strips to be within.
35. The step of reacting includes passing a second electrical signal through the sample, and the step of determining derives a physical property of the sample by applying a first electrical signal to the sample. Including the step of applying the first signal and passing the second signal in a sequential order.
36. The method of aspect C35, wherein the step of applying the first signal overlaps with the step of flowing the second signal.
37. The method of aspect C34, wherein applying the first signal comprises determining a physical property of the sample from the output of the alternating signal by applying an alternating signal to the sample.
38. The method of aspect C34, wherein applying the first signal includes determining a physical property of the sample from an output of the optical signal by applying an optical signal to the sample.
39. The method of any one of aspects C37 or C38, wherein the physical property comprises a hematocrit value and the analyte comprises glucose.
40. The method of any one of aspects C37 or C38, wherein the physical property comprises at least one of viscosity, hematocrit value, and density of the sample.
41. The method of aspect C37, wherein the applying step includes flowing the first and second alternating signals at different respective frequencies where the first frequency is lower than the second frequency.
42. The method of aspect C41, wherein the first frequency is at least an order of magnitude lower than the second frequency.
43. The method of aspect C41, wherein the first frequency comprises any frequency in the range of about 10 kHz to about 90 kHz.
44. The specified sampling time is an expression of the form:
Specified sampling time = x 1 H x 2 + x 3
Where the “specified sampling time” is specified as the point in time from the start of the test sequence that samples the output signal of the test strip;
H represents the physical properties of the sample in the form of a hematocrit value;
x 1 represents approximately 4.3e5;
x 2 represents about -3.9,
The method of aspect C34, wherein x 3 represents about 4.8.
45. The derived slope is an expression of the form:
New slope = aH 2 + bH + c
Where H is a measured or estimated physical property (eg, hematocrit value);
a is about 1.35e-6,
b is about −3.79e−4;
The method of aspect C44, wherein c is about 3.56e-2.
46. The step of calculating the analyte concentration comprises an equation of the form:
G0は、検体濃度を表し、
IEは、特定されたサンプリング時間に測定された最終信号の合計から決定される信号(検体濃度に比例)を表し、
「新たな傾き」は、前記測定された物理的特性から導出される値を表し、
「切片」は、この特定のストリップが属する検査ストリップのバッチの校正試験より得られる値を表す、態様C45に記載の方法。
47.生理学的試料から検体濃度を決定する方法であって、
試薬が付着されたバイオセンサ上に生理学的試料を付着させる工程と、
該試料及び該試薬に電気信号を印加することによって該検体を異なる物質に変換する工程と、
該試料の物理的特性を得る工程と、
該特定する工程からの該物理的特性に基づいて信号出力のサンプリングの時点を特定する工程と、
該バイオセンサのバッチ傾きを導出する工程と、
該特定されたサンプリング時点において信号出力を測定する工程と、該特定されたサンプリング時点における該試料の測定信号出力及び該導出されたバッチ傾きに基づいて検体濃度を決定する工程と、を含む方法。
48.前記得る工程が、前記試料に第2の電気信号を流すことによって該試料の物理的特性を導出することを含む、態様C47に記載の方法。
49.前記印加する工程が、前記試料に第1の電気信号を印加して該試料の物理的特性を導出することを含み、該第1の信号を印加する工程及び前記第2の信号を流す工程が連続した順序である、態様C48に記載の方法。
50.前記第1の信号を印加する工程が、前記第2の信号を流す工程と重なり合う、態様C49に記載の方法。
51.前記第1の信号を印加する工程が、前記試料に交流信号を適用することによって該交流信号の出力から該試料の物理的特性を決定することを含む、態様C50に記載の方法。
52.前記第1の信号を印加する工程が、前記試料に光学信号を適用することによって該光学信号の出力から該試料の物理的特性を決定することを含む、態様C50に記載の方法。
53.前記物理的特性がヘマトクリット値を含み、前記検体がグルコースを含む、態様C51又は態様C52のいずれか一項に記載の方法。
54.前記物理的特性が、前記試料の粘性、ヘマトクリット値、及び密度の少なくとも1つを含む、態様C52又は態様C53のいずれか一項に記載の方法。
55.前記適用する工程が、第1及び第2の交流信号を、第1の周波数が第2の周波数よりも低い異なるそれぞれの周波数で流すことを含む、態様C53に記載の方法。
56.前記第1の周波数が前記第2の周波数よりも少なくとも1桁低い、態様C55に記載の方法。
57.前記第1の周波数が約10kHz〜約90kHzの範囲の任意の周波数を含む、態様C56に記載の方法。
58.前記特定されたサンプリング時間が以下の形の式:
特定されたサンプリング時間=x1Hx2+x3
を用いて計算され、式中、「特定されたサンプリング時間」は、前記検査ストリップの出力信号をサンプリングする検査シーケンスの開始からの時点として指定され、
Hは、ヘマトクリット値の形の前記試料の物理的特性を表し、
x1は、約4.3e5を表し、
x2は、約−3.9を表し、
x3は、約4.8を表す、態様C47に記載の方法。
59.前記導出された傾きが以下の形の式:
新たな傾き=aH2+bH+c
から決定され、式中、Hは、測定又は推定された物理的特性(例えばヘマトクリット値)であり、
aは、約1.35e−6であり、
bは、約−3.79e−4であり、
cは、約3.56e−2である、態様C58に記載の方法。
60.前記検体濃度を計算する工程が、以下の形の式:
G 0 represents the analyte concentration,
IE represents the signal (proportional to the analyte concentration) determined from the sum of the final signals measured at the specified sampling time,
“New slope” represents a value derived from the measured physical property,
The method of aspect C45, wherein “section” represents a value obtained from a calibration test of a batch of test strips to which this particular strip belongs.
47. A method for determining an analyte concentration from a physiological sample, comprising:
Attaching a physiological sample on the biosensor to which the reagent is attached;
Converting the analyte into a different substance by applying an electrical signal to the sample and the reagent; and
Obtaining physical properties of the sample;
Identifying a time point of sampling of the signal output based on the physical characteristics from the identifying step;
Deriving a batch tilt of the biosensor;
Measuring a signal output at the specified sampling time, and determining an analyte concentration based on the measurement signal output of the sample and the derived batch slope at the specified sampling time.
48. The method of aspect C47, wherein the obtaining step includes deriving a physical property of the sample by passing a second electrical signal through the sample.
49. The applying step includes applying a first electrical signal to the sample to derive a physical characteristic of the sample, the step of applying the first signal and the step of flowing the second signal The method of aspect C48, which is in sequential order.
50. The method of aspect C49, wherein the step of applying the first signal overlaps with the step of flowing the second signal.
51. The method of aspect C50, wherein applying the first signal includes determining a physical property of the sample from the output of the alternating signal by applying an alternating signal to the sample.
52. The method of aspect C50, wherein applying the first signal comprises determining a physical property of the sample from an output of the optical signal by applying an optical signal to the sample.
53. The method of any one of aspects C51 or C52, wherein the physical characteristic comprises a hematocrit value and the analyte comprises glucose.
54. The method of any one of aspects C52 or C53, wherein the physical characteristics comprise at least one of viscosity, hematocrit value, and density of the sample.
55. The method of aspect C53, wherein the applying includes flowing the first and second alternating signals at different respective frequencies where the first frequency is lower than the second frequency.
56. The method of aspect C55, wherein the first frequency is at least an order of magnitude lower than the second frequency.
57. The method of aspect C56, wherein the first frequency comprises any frequency in the range of about 10 kHz to about 90 kHz.
58. The specified sampling time is of the form:
Specified sampling time = x 1 H x 2 + x 3
Where the “specified sampling time” is specified as the point in time from the start of the test sequence that samples the output signal of the test strip;
H represents the physical properties of the sample in the form of a hematocrit value;
x 1 represents approximately 4.3e5;
x 2 represents about -3.9,
The method of aspect C47, wherein x 3 represents about 4.8.
59. The derived slope is an expression of the form:
New slope = aH 2 + bH + c
Where H is a measured or estimated physical property (eg, hematocrit value);
a is about 1.35e-6,
b is about −3.79e−4;
The method of aspect C58, wherein c is about 3.56e-2.
60. The step of calculating the analyte concentration comprises an equation of the form:
G0は、検体濃度を表し、
IEは、特定されたサンプリング時間に測定された最終信号の合計から決定される信号(検体濃度に比例)を表し、
「新たな傾き」は、前記測定された物理的特性から導出される値を表し、
「切片」は、この特定のストリップが属する検査ストリップのバッチの校正試験より得られる値を表す、態様C59に記載の方法。
61.aが約−1.98e−6であり、bが約−2.87e−5であり、cが約2.67e−2である、態様C12、C22、C32、C44、又はC59の対応する1つの方法又はシステム。
G 0 represents the analyte concentration,
IE represents the signal (proportional to the analyte concentration) determined from the sum of the final signals measured at the specified sampling time,
“New slope” represents a value derived from the measured physical property,
The method of aspect C59, wherein “section” represents a value obtained from a calibration test of a batch of test strips to which this particular strip belongs.
61. A corresponding 1 of aspect C12, C22, C32, C44, or C59, wherein a is about -1.98e-6, b is about -2.87e-5, and c is about 2.67e-2. Methods or systems.
セクション「D」
以下の態様は、米国仮特許出願第61/581,100号(代理人整理番号DDI5221USPSP)に最初に示されたものであり、本開示の一部をなすものである。
1.少なくとも2つの電極及び該電極の少なくとも1つに配置された試薬を有するバイオセンサによって生理学的試料から検体濃度を決定する方法であって、
該少なくとも2つの電極に生理学的試料を付着させることによって検体検査シーケンスを開始する工程と、
第1の電気信号を試料に印加して該試料の物理的特性を測定する工程と、
該試料に第2の電気信号を流すことによって該検体と該試薬との酵素反応を引き起こす工程と、
該検査シーケンスの開始からの所定のサンプリング時点に基づいて検体濃度を推定する工程と、
該推定された検体の異なる定性的カテゴリーが行列の最も左の列に示され、該測定された物理的特性の異なる定性的カテゴリーが行列の最も上の行に示され、サンプリング時間が行列の残りのセルに示された行列を含むルックアップテーブルからサンプリング時点を選択する工程と、
該ルックアップテーブルからの該選択されたサンプリング時点において該試料からの信号出力を測定する工程と、
該選択されたサンプリング時点においてサンプリングされた測定出力信号から、以下の形の式:
Section “D”
The following aspects were first shown in US Provisional Patent Application No. 61 / 581,100 (Attorney Docket No. DDI5221USPSP) and form part of this disclosure.
1. A method for determining an analyte concentration from a physiological sample by a biosensor having at least two electrodes and a reagent disposed on at least one of the electrodes, comprising:
Initiating an analyte test sequence by attaching a physiological sample to the at least two electrodes;
Applying a first electrical signal to the sample to measure physical properties of the sample;
Causing an enzymatic reaction between the analyte and the reagent by passing a second electrical signal through the sample;
Estimating the analyte concentration based on a predetermined sampling time from the start of the test sequence;
Different qualitative categories of the estimated analyte are shown in the leftmost column of the matrix, different qualitative categories of the measured physical properties are shown in the top row of the matrix, and the sampling time is the rest of the matrix Selecting a sampling time point from a look-up table containing the matrix shown in
Measuring the signal output from the sample at the selected sampling time from the look-up table;
From the measured output signal sampled at the selected sampling instant, an equation of the form:
ITは、特定されたサンプリング時間Tに測定された最終信号の合計から決定される信号(検体濃度に比例)を表し、
「傾き」は、この特定のストリップが属する検査ストリップのバッチの校正試験より得られる値を表し、
「切片」は、この特定のストリップが属する検査ストリップのバッチの校正試験より得られる値を表す工程と、を含む方法。
2.少なくとも2つの電極及び該電極の少なくとも1つに配置された試薬を有するバイオセンサによって生理学的試料から検体濃度を決定する方法であって、
該少なくとも2つの電極に生理学的試料を付着させることによって検体検査シーケンスを開始する工程と、
第1の電気信号を試料に印加して該試料の物理的特性を測定する工程と、
該試料に第2の電気信号を流すことによって該検体と該試薬との酵素反応を引き起こす工程と、
該検査シーケンスの開始からの所定のサンプリング時点に基づいて検体濃度を推定する工程と、
該測定された物理的特性及び該推定された検体濃度の両方に基づいてサンプリング時点を選択する工程と、
該選択されたサンプリング時点において該試料からの信号出力を測定する工程と、
該選択されたサンプリング時点においてサンプリングされた測定出力信号から検体濃度を計算する工程とを含む方法。
3.前記第1の信号を印加する工程、及び前記第2の信号を流す工程が連続した順序である、態様D1又は態様D2に記載の方法。
4.前記第1の信号を印加する工程が、前記第2の信号を流す工程と重なり合う、態様D1又は態様D2に記載の方法。
5.前記第1の信号を印加する工程が、前記試料に交流信号を適用することによって該交流信号の出力から該試料の物理的特性を決定することを含む、態様D1又は態様D2に記載の方法。
6.前記物理的特性がヘマトクリット値を含み、前記検体がグルコースを含む、態様D5に記載の方法。
7.前記物理的特性が、前記試料の粘性、ヘマトクリット値、及び密度の少なくとも1つを含む、態様D5又は態様D6のいずれか一項に記載の方法。
8.前記適用する工程が、第1及び第2の交流信号を、第1の周波数が第2の周波数よりも低い異なるそれぞれの周波数で流すことを含む、態様D5に記載の方法。
9.前記第1の周波数が前記第2の周波数よりも少なくとも1桁低い、態様D8に記載の方法。
10.前記第1の周波数が約10kHz〜約90kHzの範囲の任意の周波数を含む、態様D8に記載の方法。
11.前記測定する工程が、前記検査シーケンスの開始から開始の少なくとも約10秒後まで連続的に信号出力をサンプリングすることを含む、態様D1又は態様D2に記載の方法。
12.所定の時間における前記出力信号の測定値に基づいて検体濃度を推定することを更に含む、態様D2に記載の方法。
13.前記所定の時間が、前記検査シーケンスの開始から約5秒を含む、態様D12に記載の方法。
14.前記推定する工程が、前記推定された検体濃度及び前記測定された物理的特性を、検体濃度及び試料の物理的特性の異なるそれぞれの範囲が、異なる試料測定時間に対して示されたルックアップテーブルと比較することにより、第2の信号の試料からの出力を測定するための時点を前記計算する工程から得ることを含む、態様D12に記載の方法。
15.前記計算する工程が、以下の形の式:
I T represents a signal (proportional to the analyte concentration) is determined from the sum of the last signal measured in the specified sampling time T,
“Slope” represents the value obtained from a calibration test of a batch of test strips to which this particular strip belongs,
And "section" represents a value obtained from a calibration test of a batch of test strips to which this particular strip belongs.
2. A method for determining an analyte concentration from a physiological sample by a biosensor having at least two electrodes and a reagent disposed on at least one of the electrodes, comprising:
Initiating an analyte test sequence by attaching a physiological sample to the at least two electrodes;
Applying a first electrical signal to the sample to measure physical properties of the sample;
Causing an enzymatic reaction between the analyte and the reagent by passing a second electrical signal through the sample;
Estimating the analyte concentration based on a predetermined sampling time from the start of the test sequence;
Selecting a sampling time point based on both the measured physical property and the estimated analyte concentration;
Measuring the signal output from the sample at the selected sampling time;
Calculating the analyte concentration from the measured output signal sampled at the selected sampling time.
3. The method according to aspect D1 or aspect D2, wherein the step of applying the first signal and the step of flowing the second signal are in a sequential order.
4). The method of aspect D1 or aspect D2, wherein the step of applying the first signal overlaps with the step of flowing the second signal.
5. The method of aspect D1 or aspect D2, wherein applying the first signal comprises determining a physical property of the sample from the output of the alternating signal by applying an alternating signal to the sample.
6). The method of aspect D5, wherein the physical property comprises a hematocrit value and the analyte comprises glucose.
7). The method of any one of aspects D5 or D6, wherein the physical property comprises at least one of viscosity, hematocrit value, and density of the sample.
8). The method of aspect D5, wherein the applying step includes flowing the first and second alternating signals at different respective frequencies where the first frequency is lower than the second frequency.
9. The method of aspect D8, wherein the first frequency is at least an order of magnitude lower than the second frequency.
10. The method of aspect D8, wherein the first frequency comprises any frequency in the range of about 10 kHz to about 90 kHz.
11. The method of aspect D1 or aspect D2, wherein the measuring step comprises sampling the signal output continuously from the start of the test sequence to at least about 10 seconds after the start.
12 The method of aspect D2, further comprising estimating an analyte concentration based on a measurement of the output signal at a predetermined time.
13. The method of aspect D12, wherein the predetermined time includes about 5 seconds from the start of the inspection sequence.
14 The estimating step includes a look-up table in which the estimated analyte concentration and the measured physical property are shown for different sample measurement times in different ranges of the analyte concentration and the physical property of the sample. Obtaining the time point for measuring the output of the second signal from the sample by comparing with the step of calculating.
15. Said calculating step is an equation of the form:
G0は、検体濃度を表し、
ITは、特定されたサンプリング時間Tに測定された最終信号の合計から決定される信号(検体濃度に比例)を表し、
「傾き」は、この特定のストリップが属する検査ストリップのバッチの校正試験より得られる値を表し、
「切片」は、この特定のストリップが属する検査ストリップのバッチの校正試験より得られる値を表す、態様D2に記載の方法。
16.
基板と、
それぞれの電極コネクタに接続された複数の電極とを有する検査ストリップと、
ハウジングと、
該検査ストリップの該それぞれの電極コネクタに接続されるように構成された検査ストリップポートコネクタと、
該複数の電極に電気信号を印加するか又は該複数の電極からの電気信号を検知するように該検査ストリップポートコネクタと電気的に導通したマイクロプロセッサとを有する検体計測器と、を備える検体測定システムであって、該マイクロプロセッサが、(a)該複数の電極に第1の電気信号を印加することにより、生理学的流体試料の物理的特性を決定し、(b)検査シーケンスの間の所定のサンプリング時点に基づいて検体濃度を推定し、(c)該決定された物理的特性により規定される該検査シーケンスの間のサンプリング時点において該複数の電極に第2の電気信号を印加することにより該第2の電気信号から検体濃度を計算するように構成されている検体測定システム。
17.前記複数の電極が、物理的特性を測定するための少なくとも2つの電極、及び検体濃度を測定するための少なくとも2つの他の電極を含む、態様D16に記載のシステム。
18.前記少なくとも2つの電極及び前記少なくとも2つの他の電極が、前記基板上に設けられた同じチャンバ内に配置される、態様D17に記載のシステム。
19.前記少なくとも2つの電極及び前記少なくとも2つの他の電極が、前記基板上に設けられた異なるチャンバ内に配置される、態様D17に記載のシステム。
20.電極のすべてが前記基板によって規定される同じ平面上に配置される、態様D18又は態様D19のいずれか一項に記載のシステム。
21.前記少なくとも2つの他の電極に近接して試薬が配置され、前記少なくとも2つの電極上に試薬が配置されない、態様D18又は態様D19のいずれか一項に記載のシステム。
22.
基板と、
それぞれの電極コネクタに接続された複数の電極とを有する検査ストリップと、
ハウジングと、
該検査ストリップの該それぞれの電極コネクタに接続されるように構成された検査ストリップポートコネクタと、
該複数の電極に電気信号を印加するか又は該複数の電極からの電気信号を検知するように該検査ストリップポートコネクタと電気的に導通したマイクロプロセッサとを有する検体計測器と、を備える検体測定システムであって、該マイクロプロセッサが、(a)該複数の電極に第1の電気信号を印加することにより、検査シーケンスの間に生理学的流体試料の物理的特性を決定し、(b)検査シーケンスの間の所定のサンプリング時点に基づいて検体濃度を推定し、(c)該決定された物理的特性により規定される該検査シーケンスの間のサンプリング時点において該複数の電極に第2の電気信号を印加することにより、該検査シーケンスの開始の約10秒以内に該第2の電気信号から検体濃度を計算するように構成されている検体測定システム。
23.前記複数の電極が、物理的特性を測定するための少なくとも2つの電極、及び検体濃度を測定するための少なくとも2つの他の電極を含む、態様D23に記載のシステム。
24.前記少なくとも2つの電極及び前記少なくとも2つの他の電極が、前記基板上に設けられた同じチャンバ内に配置される、態様D23に記載のシステム。
25.前記少なくとも2つの電極及び前記少なくとも2つの他の電極が、前記基板上に設けられた異なるチャンバ内に配置される、態様D23に記載のシステム。
26.電極のすべてが前記基板によって規定される同じ平面上に配置される、態様D24又は態様D25のいずれか一項に記載のシステム。
27.前記少なくとも2つの他の電極に近接して試薬が配置され、前記少なくとも2つの電極上に試薬が配置されない、態様D24又は態様D25のいずれか一項に記載のシステム。
28.検査ストリップの高い精度を得る方法であって、
検査ストリップのバッチを与える工程と、
基準濃度の検体を含む基準試料を該検査ストリップのバッチのそれぞれに導入することにより検査シーケンスを開始する工程と、
該検体を、該検査ストリップのそれぞれに配置された試薬と反応させて該2つの電極間で検体の物理的変換を引き起こす工程と、
該検査シーケンスの開始から所定の時点において、該試料の測定された信号出力に基づいて検体濃度を推定する工程と、
該基準試料の物理的特性を決定する工程と、
該測定された物理的特性及び該推定された検体濃度により規定される該検査シーケンスの間の規定された時点において基準試料の電気的出力をサンプリングする工程と、
該規定された時点に基づいて検体濃度を計算する工程であって、該検査ストリップのバッチの最終検体濃度の値の少なくとも95%が、約30%〜約55%の試料のヘマトクリット値の範囲において基準検体濃度の±10%以内となるように該検査ストリップのバッチのそれぞれについて最終検体濃度を与える工程とを含む方法。
29.前記第1の信号を印加する工程、及び前記第2の信号を流す工程が連続した順序である、態様D28に記載の方法。
30.前記第1の信号を印加する工程が、前記第2の信号を流す工程と重なり合う、態様D28に記載の方法。
31.前記第1の信号を印加する工程が、前記試料に交流信号を適用することによって該交流信号の出力から該試料の物理的特性を決定することを含む、態様D28に記載の方法。
32.前記第1の信号を印加する工程が、前記試料に電磁信号を適用することによって該電磁信号の出力から該試料の物理的特性を決定することを含む、態様D28に記載の方法。
33.前記物理的特性がヘマトクリット値を含み、前記検体がグルコースを含む、態様D31又は態様D32のいずれか一項に記載の方法。
34.前記物理的特性が、前記試料の粘性、ヘマトクリット値、及び密度の少なくとも1つを含む、態様D31又は態様D32のいずれか一項に記載の方法。
35.前記適用する工程が、第1及び第2の交流信号を、第1の周波数が第2の周波数よりも低い異なるそれぞれの周波数で流すことを含む、態様D30に記載の方法。
36.前記第1の周波数が前記第2の周波数よりも少なくとも1桁低い、態様D35に記載の方法。
37.前記第1の周波数が約10kHz〜約90kHzの範囲の任意の周波数を含む、態様D36に記載の方法。
38.前記測定する工程が、前記検査シーケンスの開始から開始の少なくとも約10秒後まで連続的に信号出力をサンプリングすることを含む、態様D29に記載の方法。
39.所定の時間における前記出力信号の測定値に基づいて検体濃度を推定することを更に含む、態様D29に記載の方法。
40.前記推定する工程が、前記推定された検体濃度及び前記測定された物理的特性を、検体濃度及び試料の物理的特性の異なるそれぞれの範囲が、異なる試料測定時間に対して示されたルックアップテーブルと比較することにより、第2の信号の試料からの出力を測定するための時点を前記計算する工程から得ることを含む、態様D39に記載の方法。
41.生理学的試料から検体濃度を決定する方法であって、
バイオセンサ上に生理学的試料を付着させることにより検査シーケンスを開始する工程と、
該試料中の検体に酵素反応を生じさせる工程と、
該試料中の検体濃度を推定する工程と、
該試料の少なくとも1つの物理的特性を測定する工程と、
該推定された検体濃度及び該測定する工程からの少なくとも1つの物理的特性に基づいて該バイオセンサの出力信号をサンプリングするための該検査シーケンスの開始からの時点を規定する工程と、
該規定された時点において該バイオセンサの出力信号をサンプリングする工程と、
該規定された時点においてサンプリングされた信号から検体濃度を決定する工程と、を含む方法。
42.前記測定する工程が、前記試料に第1の電気信号を印加することにより該試料の物理的特性を測定することを含み、前記生じさせる工程が、該試料に第2の電気信号を流すことを含み、該測定する工程が、前記検査シーケンスの開始後の、少なくとも該測定された物理的特性の関数として設定される時点において少なくとも2つの電極からの出力信号を評価することを含み、前記決定する工程が、前記時点における該測定された出力信号から検体濃度を計算することを含む、態様D41に記載の方法。
43.前記第1の信号を印加する工程、及び前記第2の信号を流す工程が連続した順序である、態様D41に記載の方法。
44.前記第1の信号を印加する工程が、前記第2の信号を流す工程と重なり合う、態様D41に記載の方法。
45.前記第1の信号を印加する工程が、前記試料に交流信号を適用することによって該交流信号の出力から該試料の物理的特性を決定することを含む、態様D41に記載の方法。
46.前記検査シーケンスから所定のサンプリング時点に基づいて検体濃度を推定することを更に含む、態様D41に記載の方法。
47.前記規定する工程が、前記測定された物理的特性及び前記推定された検体濃度の両方に基づいて規定された時点を選択することを含む、D46に記載の方法。
48.前記物理的特性がヘマトクリット値を含み、前記検体がグルコースを含む、態様D45又は態様D46のいずれか一項に記載の方法。
49.前記物理的特性が、前記試料の粘性、ヘマトクリット値、及び密度の少なくとも1つを含む、態様D44又は態様D45のいずれか一項に記載の方法。
50.前記適用する工程が、第1及び第2の交流信号を、第1の周波数が第2の周波数よりも低い異なるそれぞれの周波数で流すことを含む、態様D46に記載の方法。
51.前記第1の周波数が前記第2の周波数よりも少なくとも1桁低い、態様D50に記載の方法。
52.前記第1の周波数が約10kHz〜約90kHzの範囲の任意の周波数を含む、態様D51に記載の方法。
53.前記測定する工程が、前記検査シーケンスの開始から開始の少なくとも約10秒後まで連続的に信号出力をサンプリングすることを含む、態様D41に記載の方法。
54.所定の時間における前記出力信号の測定値に基づいて検体濃度を推定することを更に含む、態様D53に記載の方法。
55.前記推定する工程が、前記推定された検体濃度及び前記測定された物理的特性を、検体濃度及び試料の物理的特性の異なるそれぞれの範囲が、異なる試料測定時間に対して示されたルックアップテーブルと比較することにより、第2の信号の試料からの出力を測定するための時点を前記計算する工程から得ることを含む、態様D54に記載の方法。
56.前記サンプリング時点が、前記推定された検体の異なる定性的カテゴリーが行列の最も左の列に示され、前記測定された物理的特性の異なる定性的カテゴリーが行列の最も上の行に示され、サンプリング時間が行列の残りのセルに示された行列を含むルックアップテーブルから選択される、態様D1〜D55のいずれか一項に記載の方法又はシステム。
G 0 represents the analyte concentration,
I T represents a signal (proportional to the analyte concentration) is determined from the sum of the last signal measured in the specified sampling time T,
“Slope” represents the value obtained from a calibration test of a batch of test strips to which this particular strip belongs,
Method according to aspect D2, wherein “intersection” represents a value obtained from a calibration test of a batch of test strips to which this particular strip belongs.
16.
A substrate,
A test strip having a plurality of electrodes connected to each electrode connector;
A housing;
A test strip port connector configured to be connected to the respective electrode connector of the test strip;
Specimen measurement comprising: a sample measuring instrument having a microprocessor in electrical communication with the test strip port connector to apply an electrical signal to the plurality of electrodes or to detect an electrical signal from the plurality of electrodes A system, wherein the microprocessor (a) determines a physical property of a physiological fluid sample by applying a first electrical signal to the plurality of electrodes, and (b) predetermined during a test sequence. (C) applying a second electrical signal to the plurality of electrodes at a sampling time during the test sequence defined by the determined physical property; An analyte measurement system configured to calculate an analyte concentration from the second electrical signal.
17. The system of aspect D16, wherein the plurality of electrodes includes at least two electrodes for measuring physical properties and at least two other electrodes for measuring analyte concentration.
18. The system of aspect D17, wherein the at least two electrodes and the at least two other electrodes are disposed in the same chamber provided on the substrate.
19. The system of aspect D17, wherein the at least two electrodes and the at least two other electrodes are disposed in different chambers provided on the substrate.
20. The system of any one of aspects D18 or D19, wherein all of the electrodes are disposed on the same plane defined by the substrate.
21. The system of any one of aspects D18 or D19, wherein a reagent is disposed proximate to the at least two other electrodes and no reagent is disposed on the at least two electrodes.
22.
A substrate,
A test strip having a plurality of electrodes connected to each electrode connector;
A housing;
A test strip port connector configured to be connected to the respective electrode connector of the test strip;
Specimen measurement comprising: a sample measuring instrument having a microprocessor in electrical communication with the test strip port connector to apply an electrical signal to the plurality of electrodes or to detect an electrical signal from the plurality of electrodes A system, wherein the microprocessor determines (a) a physical characteristic of a physiological fluid sample during a test sequence by applying a first electrical signal to the plurality of electrodes; Estimating an analyte concentration based on a predetermined sampling time during the sequence; (c) a second electrical signal at the plurality of electrodes at the sampling time during the test sequence defined by the determined physical property Is applied to calculate an analyte concentration from the second electrical signal within about 10 seconds of the start of the test sequence. Beam.
23. The system of aspect D23, wherein the plurality of electrodes includes at least two electrodes for measuring physical properties and at least two other electrodes for measuring analyte concentration.
24. The system of aspect D23, wherein the at least two electrodes and the at least two other electrodes are disposed in the same chamber provided on the substrate.
25. The system of aspect D23, wherein the at least two electrodes and the at least two other electrodes are disposed in different chambers provided on the substrate.
26. The system of any one of aspects D24 or D25, wherein all of the electrodes are disposed on the same plane defined by the substrate.
27. The system of any one of aspects D24 or D25, wherein a reagent is disposed proximate to the at least two other electrodes and no reagent is disposed on the at least two electrodes.
28. A method for obtaining high accuracy of a test strip,
Providing a batch of test strips;
Initiating a test sequence by introducing a reference sample containing a reference concentration of analyte into each of the batches of the test strip;
Reacting the analyte with a reagent disposed on each of the test strips to cause physical conversion of the analyte between the two electrodes;
Estimating the analyte concentration based on the measured signal output of the sample at a predetermined time from the start of the test sequence;
Determining physical properties of the reference sample;
Sampling the electrical output of a reference sample at a defined time during the test sequence defined by the measured physical property and the estimated analyte concentration;
Calculating analyte concentration based on the defined time point, wherein at least 95% of the final analyte concentration value of the batch of test strips is in the range of hematocrit values of the sample from about 30% to about 55%. Providing a final analyte concentration for each of the batches of test strips to be within ± 10% of the reference analyte concentration.
29. The method of aspect D28, wherein the step of applying the first signal and the step of flowing the second signal are in a sequential order.
30. The method of aspect D28, wherein applying the first signal overlaps with flowing the second signal.
31. The method of aspect D28, wherein applying the first signal comprises determining a physical property of the sample from an output of the alternating signal by applying an alternating signal to the sample.
32. The method of aspect D28, wherein applying the first signal comprises determining a physical property of the sample from an output of the electromagnetic signal by applying an electromagnetic signal to the sample.
33. The method of any one of aspects D31 or D32, wherein the physical property comprises a hematocrit value and the analyte comprises glucose.
34. The method of any one of aspects D31 or D32, wherein the physical property comprises at least one of viscosity, hematocrit value, and density of the sample.
35. The method of aspect D30, wherein the applying includes flowing the first and second alternating signals at respective different frequencies where the first frequency is lower than the second frequency.
36. The method of aspect D35, wherein the first frequency is at least an order of magnitude less than the second frequency.
37. The method of aspect D36, wherein the first frequency comprises any frequency in the range of about 10 kHz to about 90 kHz.
38. The method of aspect D29, wherein the measuring step comprises sampling the signal output continuously from the start of the test sequence to at least about 10 seconds after the start.
39. The method of aspect D29, further comprising estimating an analyte concentration based on the measured value of the output signal at a predetermined time.
40. The estimating step includes a look-up table in which the estimated analyte concentration and the measured physical property are shown for different sample measurement times in different ranges of the analyte concentration and the physical property of the sample. The method of aspect D39, comprising: obtaining a time point for measuring the output of the second signal from the sample by comparing to the calculating step.
41. A method for determining an analyte concentration from a physiological sample, comprising:
Initiating a test sequence by depositing a physiological sample on the biosensor;
Producing an enzymatic reaction in the specimen in the sample;
Estimating the analyte concentration in the sample;
Measuring at least one physical property of the sample;
Defining a point in time from the start of the test sequence for sampling the biosensor output signal based on the estimated analyte concentration and at least one physical characteristic from the measuring step;
Sampling the output signal of the biosensor at the defined time;
Determining the analyte concentration from the signal sampled at the defined time.
42. The step of measuring includes measuring a physical property of the sample by applying a first electrical signal to the sample, and the step of causing the second electrical signal to flow through the sample. The measuring step comprises evaluating the output signals from at least two electrodes at a time set as a function of at least the measured physical property after the start of the inspection sequence The method of aspect D41, wherein the step comprises calculating an analyte concentration from the measured output signal at the time point.
43. The method of aspect D41, wherein the step of applying the first signal and the step of flowing the second signal are in a sequential order.
44. The method of aspect D41, wherein applying the first signal overlaps with flowing the second signal.
45. The method of aspect D41, wherein applying the first signal comprises determining a physical property of the sample from the output of the alternating signal by applying an alternating signal to the sample.
46. The method of aspect D41, further comprising estimating an analyte concentration based on a predetermined sampling time from the test sequence.
47. The method of D46, wherein the defining step includes selecting a defined time point based on both the measured physical property and the estimated analyte concentration.
48. The method according to any one of aspects D45 or D46, wherein the physical property comprises a hematocrit value and the analyte comprises glucose.
49. The method of any one of aspects D44 or D45, wherein the physical properties include at least one of viscosity, hematocrit value, and density of the sample.
50. The method of aspect D46, wherein the applying includes flowing the first and second alternating signals at different respective frequencies where the first frequency is lower than the second frequency.
51. The method of aspect D50, wherein the first frequency is at least an order of magnitude less than the second frequency.
52. The method of aspect D51, wherein the first frequency comprises any frequency in the range of about 10 kHz to about 90 kHz.
53. The method of aspect D41, wherein the measuring includes continuously sampling the signal output from the start of the test sequence to at least about 10 seconds after the start.
54. The method of aspect D53, further comprising estimating an analyte concentration based on the measured value of the output signal at a predetermined time.
55. The estimating step includes a look-up table in which the estimated analyte concentration and the measured physical property are shown for different sample measurement times in different ranges of the analyte concentration and the physical property of the sample. The method of aspect D54, comprising: obtaining a time point for measuring the output of the second signal from the sample by comparing to the step of calculating.
56. The sampling time points are shown in the leftmost column of the matrix, where the different qualitative categories of the estimated specimen are shown, and in the top row of the matrix, the different qualitative categories of the measured physical properties are shown in the sampling The method or system according to any one of aspects D1-D55, wherein the time is selected from a look-up table that includes the matrix indicated in the remaining cells of the matrix.
セクション「E」
以下の態様は、米国仮特許出願第61/654,013号(代理人整理番号DDI5228USPSP)に最初に示されたものであり、本開示の一部をなすものである。
1.少なくとも2つの電極及び該電極の少なくとも一方の電極に配置された試薬を有するバイオセンサによって生理学的試料から検体濃度を決定する方法であって、
該少なくとも2つの電極に生理学的試料を付着させることによって検体検査シーケンスを開始する工程と、
第1の電気信号を試料に印加して該試料の物理的特性を導出する工程と、
該試料に、該検査シーケンスと重なり合う第1のサンプリング持続時間にわたって第2の電気信号を流すことにより、該試料から、該第1のサンプリング持続時間における時間及び大きさの両方と相関した第1の過渡信号出力を得る工程と、
該試料の物理的特性に基づいて、該第1のサンプリング持続時間内で検査シーケンスの間の特定のサンプリング時間を抽出する工程と、
該特定のサンプリング時間に基づいて、第2のサンプリング持続時間が該第1のサンプリング持続時間と重なり合うように第2のサンプリング持続時間を規定する工程と、
該第1の過渡信号から、該第2のサンプリング持続時間に対して参照される第2の過渡信号を得る工程と、
該第2の過渡信号を、該第2のサンプリング持続時間に対して別個の時間間隔に分割する工程と、
該第2のサンプリング持続時間内の別個の選択された時間間隔における該第2の過渡信号のそれぞれの大きさを導出する工程と、
該別個の選択された時間間隔における該第2の過渡信号のそれぞれの大きさに基づいて検体濃度を決定する工程と、を含む方法。
2.少なくとも2つの電極及び該電極の少なくとも一方の電極に配置された試薬を有するバイオセンサによって生理学的試料から検体濃度を決定する方法であって、
該少なくとも2つの電極に生理学的試料を付着させることによって検体検査シーケンスを開始する工程と、
第1の電気信号を試料に印加して該試料の物理的特性を導出する工程と、
該試料に、該検査シーケンスと重なり合う第1のサンプリング持続時間にわたって第2の電気信号を流すことにより、該試料から、該第1のサンプリング持続時間における時間及び大きさの両方と相関した第1の過渡信号出力を得る工程と、
該試料の物理的特性に基づいて、該第1のサンプリング持続時間内で検査シーケンスの間の特定のサンプリング時間を抽出する工程と、
第2のサンプリング持続時間にわたって該第1の過渡信号から第2の過渡信号を得る工程と、
該第2のサンプリング持続時間内の選択された時間間隔における該第2の過渡信号のそれぞれの大きさを導出する工程と、
該選択された時間間隔における該第2の過渡信号のそれぞれの大きさに基づいて検体濃度を決定する工程と、を含む方法。
3.少なくとも2つの電極及び該電極の少なくとも一方の電極に配置された試薬を有するバイオセンサによって生理学的試料から検体濃度を決定する方法であって、
該少なくとも2つの電極に生理学的試料を付着させることによって検体検査シーケンスを開始する工程と、
第1の電気信号を試料に印加して該試料の物理的特性を導出する工程と、
第1のサンプリング持続時間内の特定のサンプリング時間を抽出する工程と、
該第1のサンプリング持続時間にわたって該試料に第2の信号を印加するか又は流し、該第1のサンプリング持続時間の持続時間にわたって該試料から第1の過渡信号出力を測定又はサンプリングする工程と、
該第1のサンプリング持続時間内の特定のサンプリング時間を含む特定の時間の範囲を規定する工程と、
該特定の時間の範囲内のそれぞれの別個の時間間隔において複数の該第1の過渡信号の大きさを得る工程と、
該得る工程からの該第1の過渡信号の大きさに基づいて検体濃度を決定する工程と、を含む方法。
4.少なくとも2つの電極及び該電極の少なくとも一方の電極に配置された試薬を有するバイオセンサによって生理学的試料から検体濃度を決定する方法であって、
該少なくとも2つの電極に生理学的試料を付着させることによって検体検査シーケンスを開始する工程と、
第1の電気信号を試料に印加して該試料の物理的特性を導出する工程と、
第1のサンプリング持続時間内の特定のサンプリング時間を抽出する工程と、
該第1のサンプリング持続時間にわたって該試料に第2の信号を印加するか又は流し、該第1のサンプリング持続時間の持続時間にわたって該試料から第1の過渡信号出力を測定又はサンプリングする工程と、
おおよそ該特定のサンプリング時間における以外の時間間隔で複数の該第1の過渡信号出力の大きさを得る工程と、
該得る工程からの該複数の第1の過渡信号の大きさに基づいて検体濃度を決定する工程と、を含む方法。
5.少なくとも2つの電極及び該電極の少なくとも一方の電極に配置された試薬を有するバイオセンサによって生理学的試料から検体濃度を決定する方法であって、
該少なくとも2つの電極に生理学的試料を付着させることによって複数のバイオセンサのそれぞれについて検体検査シーケンスを開始する工程と、
該試料に第1の電気信号を印加することによって該複数のバイオセンサのそれぞれについて該試料の物理的特性を導出する工程と、
該複数のバイオセンサのそれぞれについて第1のサンプリング持続時間内の特定のサンプリング時間を抽出する工程と、
該複数のバイオセンサのそれぞれについて該第1のサンプリング持続時間にわたって該試料に第2の信号を印加するか又は流す工程と、
該複数のバイオセンサのそれぞれについて該第1のサンプリング持続時間の持続時間にわたって該試料から第1の過渡信号出力を測定又はサンプリングする工程と、
該複数のバイオセンサのそれぞれについて該第1のサンプリング持続時間内の該特定のサンプリング時間を含む特定の時間の範囲を規定する工程と、
該複数のバイオセンサのそれぞれについて該特定の時間の範囲内のそれぞれの別個の時間間隔において複数の該第1の過渡信号の大きさを得る工程と、
該複数のバイオセンサのそれぞれについて、該得る工程からの該第1の過渡信号の大きさに基づいて検体濃度を決定する工程であって、該複数のバイオセンサについて該決定する工程により決定される複数の検体濃度間の誤差が、30%、42%、及び55%のヘマトクリット値のそれぞれにおける基準値と比較して±15%未満であるような工程と、を含む方法。
6.前記特定の時間の範囲が、前記特定のサンプリング時間よりも前に測定される第1の過渡信号の大きさを含む、態様E1、E2、又はE3に記載の方法。
7.前記特定のサンプリング時間を抽出する工程が、前記試料の物理的特性に基づいて前記第1のサンプリング持続時間内の規定された特定のサンプリング時間を計算することを含む、態様E1、E2、E3、E4、又はE5のいずれか一項に記載の方法。
8.前記規定された特定のサンプリング時間を計算する工程が、以下の形の式:
特定されたサンプリング時間=x1Hx2+x3
を用いることを含み、式中、「特定されたサンプリング時間」は、前記バイオセンサの出力信号をサンプリングする検査シーケンスの開始からの時点として指定され、
Hは、ヘマトクリット値の形の前記試料の物理的特性を表し、
x1は、約4.3e5であり、
x2は、約(−)3.9であり、
x3は、約4.8である、態様E6に記載の方法。
9.前記第2のサンプリング持続時間を規定する工程が、前記規定された特定のサンプリング時間と所定の時点との間の差の絶対値を得ることによって開始時間(T1)及び前記特定のサンプリング時点に概ね等しい終了時間(T2)を規定することを含み、前記第1のサンプリング持続時間が前記試料を付着させる工程から約10秒以内を含む、態様E8に記載の方法。
10.前記得る工程が、前記第1のサンプリング持続時間と重なり合い、前記第1の過渡信号の一部及び前記第2のサンプリング持続時間の時間に対するその大きさを含む第2のサンプリング持続時間を規定することを更に含み、前記部分が第2の過渡信号として指定される、態様E8に記載の方法。
11.前記第2の過渡信号を得る工程が、前記第2のサンプリング持続時間内である第2の過渡信号として指定される第1の過渡信号の一部分を前記第1の過渡信号から抽出することを含む、態様E9に記載の方法。
12.前記別個の選択された時間間隔で前記第2の過渡信号のそれぞれの大きさを導出する工程が、それぞれの選択された時間間隔の間に第2の過渡信号の大きさを計算することを含む、態様E11に記載の方法。
13.前記分割する工程が、前記第2の過渡信号を、概ね開始時間における時間間隔1から概ね終了時間における時間間隔22までの少なくとも22個の時間間隔に順次分割することを含む、態様E12に記載の方法。
14.検体濃度の決定が、以下の形の式:
Section "E"
The following aspects were first shown in US Provisional Patent Application No. 61 / 654,013 (Attorney Docket No. DDI5228USPSP) and form part of this disclosure.
1. A method for determining an analyte concentration from a physiological sample by a biosensor having at least two electrodes and a reagent disposed on at least one of the electrodes, comprising:
Initiating an analyte test sequence by attaching a physiological sample to the at least two electrodes;
Applying a first electrical signal to the sample to derive physical properties of the sample;
By passing a second electrical signal through the sample over a first sampling duration that overlaps the test sequence, a first correlated with both time and magnitude in the first sampling duration is obtained from the sample. Obtaining a transient signal output;
Extracting a specific sampling time during a test sequence within the first sampling duration based on the physical properties of the sample;
Defining a second sampling duration based on the specific sampling time such that a second sampling duration overlaps the first sampling duration;
Obtaining, from the first transient signal, a second transient signal referenced for the second sampling duration;
Dividing the second transient signal into separate time intervals for the second sampling duration;
Deriving the magnitude of each of the second transient signals in separate selected time intervals within the second sampling duration;
Determining an analyte concentration based on the magnitude of each of the second transient signals in the distinct selected time interval.
2. A method for determining an analyte concentration from a physiological sample by a biosensor having at least two electrodes and a reagent disposed on at least one of the electrodes, comprising:
Initiating an analyte test sequence by attaching a physiological sample to the at least two electrodes;
Applying a first electrical signal to the sample to derive physical properties of the sample;
By passing a second electrical signal through the sample over a first sampling duration that overlaps the test sequence, a first correlated with both time and magnitude in the first sampling duration is obtained from the sample. Obtaining a transient signal output;
Extracting a specific sampling time during a test sequence within the first sampling duration based on the physical properties of the sample;
Obtaining a second transient signal from the first transient signal over a second sampling duration;
Deriving the magnitude of each of the second transient signals at a selected time interval within the second sampling duration;
Determining an analyte concentration based on the magnitude of each of the second transient signals in the selected time interval.
3. A method for determining an analyte concentration from a physiological sample by a biosensor having at least two electrodes and a reagent disposed on at least one of the electrodes, comprising:
Initiating an analyte test sequence by attaching a physiological sample to the at least two electrodes;
Applying a first electrical signal to the sample to derive physical properties of the sample;
Extracting a specific sampling time within a first sampling duration;
Applying or flowing a second signal to the sample for the first sampling duration and measuring or sampling a first transient signal output from the sample for the duration of the first sampling duration;
Defining a specific time range including a specific sampling time within the first sampling duration;
Obtaining a plurality of magnitudes of the first transient signal at each distinct time interval within the particular time range;
Determining an analyte concentration based on the magnitude of the first transient signal from the obtaining step.
4). A method for determining an analyte concentration from a physiological sample by a biosensor having at least two electrodes and a reagent disposed on at least one of the electrodes, comprising:
Initiating an analyte test sequence by attaching a physiological sample to the at least two electrodes;
Applying a first electrical signal to the sample to derive physical properties of the sample;
Extracting a specific sampling time within a first sampling duration;
Applying or flowing a second signal to the sample for the first sampling duration and measuring or sampling a first transient signal output from the sample for the duration of the first sampling duration;
Obtaining a plurality of magnitudes of the first transient signal output at time intervals approximately other than at the particular sampling time;
Determining an analyte concentration based on the magnitude of the plurality of first transient signals from the obtaining step.
5. A method for determining an analyte concentration from a physiological sample by a biosensor having at least two electrodes and a reagent disposed on at least one of the electrodes, comprising:
Initiating an analyte test sequence for each of a plurality of biosensors by attaching a physiological sample to the at least two electrodes;
Deriving physical properties of the sample for each of the plurality of biosensors by applying a first electrical signal to the sample;
Extracting a specific sampling time within a first sampling duration for each of the plurality of biosensors;
Applying or flowing a second signal to the sample for each of the plurality of biosensors for the first sampling duration;
Measuring or sampling a first transient signal output from the sample for a duration of the first sampling duration for each of the plurality of biosensors;
Defining a specific time range including the specific sampling time within the first sampling duration for each of the plurality of biosensors;
Obtaining a plurality of first transient signal magnitudes at each distinct time interval within the particular time range for each of the plurality of biosensors;
Determining an analyte concentration for each of the plurality of biosensors based on the magnitude of the first transient signal from the obtaining step, determined by the determining step for the plurality of biosensors. And wherein the error between the plurality of analyte concentrations is less than ± 15% compared to the reference value at each of the 30%, 42%, and 55% hematocrit values.
6). The method of aspect E1, E2, or E3, wherein the specific time range includes a magnitude of a first transient signal measured before the specific sampling time.
7). Aspects E1, E2, E3, wherein the step of extracting the specific sampling time includes calculating a specified specific sampling time within the first sampling duration based on physical characteristics of the sample. The method according to any one of E4 and E5.
8). The step of calculating the specified specific sampling time is an expression of the form:
Specified sampling time = x 1 H x 2 + x 3
Where the “specified sampling time” is designated as the point in time from the start of the test sequence that samples the biosensor output signal;
H represents the physical properties of the sample in the form of a hematocrit value;
x 1 is about 4.3e5;
x 2 is about (−) 3.9,
The method of embodiment E6, wherein x 3 is about 4.8.
9. Defining the second sampling duration generally includes a start time (T1) and a specific sampling time by obtaining an absolute value of a difference between the specified specific sampling time and a predetermined time. The method of aspect E8, comprising defining an equal end time (T2), wherein the first sampling duration includes within about 10 seconds of depositing the sample.
10. The obtaining step defines a second sampling duration that overlaps with the first sampling duration and includes a portion of the first transient signal and its magnitude relative to a time of the second sampling duration; The method of aspect E8, further comprising: wherein the portion is designated as a second transient signal.
11. Obtaining the second transient signal includes extracting from the first transient signal a portion of the first transient signal that is designated as a second transient signal that is within the second sampling duration. The method of embodiment E9.
12 Deriving the magnitude of each of the second transient signals at the distinct selected time interval includes calculating the magnitude of the second transient signal during each selected time interval. The method of aspect E11.
13. The aspect E12, wherein the step of dividing includes sequentially dividing the second transient signal into at least 22 time intervals from a
14 The determination of the analyte concentration is a formula of the form:
Gは、検体濃度を表し、I1は、時間間隔17における第2の過渡信号の大きさにほぼ等しく、I2は、時間間隔13における第2の過渡信号の大きさにほぼ等しく、I3は、時間間隔5における第2の過渡信号の大きさにほぼ等しく、I4は、時間間隔3における第2の過渡信号の大きさにほぼ等しく、I5は、時間間隔22における第2の過渡信号の大きさにほぼ等しく、x1は、0.75にほぼ等しく、x2は、337.27にほぼ等しく、x3は、(−)16.81にほぼ等しく、x4は、1.41にほぼ等しく、x5は、2.67にほぼ等しい、態様E13に記載の方法。
15.検体濃度の決定が、以下の形の式:
G represents the analyte concentration, I 1 is approximately equal to the magnitude of the second transient signal at
15. The determination of the analyte concentration is a formula of the form:
Gは、検体濃度を表し、I1は、時間間隔11における第2の過渡信号の大きさにほぼ等しく、I2は、時間間隔7における第2の過渡信号の大きさにほぼ等しく、x1は、0.59にほぼ等しく、x2は、2.51にほぼ等しく、x3は、(−)12.74にほぼ等しく、x4は、(−)188.31にほぼ等しく、x5は、9.2にほぼ等しい、態様E10に記載の方法。
16.検体濃度の決定が、以下の形の式:
G represents the analyte concentration, I 1 is approximately equal to the magnitude of the second transient signal at time interval 11, I 2 is approximately equal to the magnitude of the second transient signal at
16. The determination of the analyte concentration is a formula of the form:
17.検体濃度の決定が、以下の形の式:
17. The determination of the analyte concentration is a formula of the form:
I1は、時間間隔5における第2の過渡信号の大きさにほぼ等しく、I2は、時間間隔1における第2の過渡信号の大きさにほぼ等しく、I3は、時間間隔2における第2の過渡信号の大きさにほぼ等しく、I4は、時間間隔10における第2の過渡信号の大きさにほぼ等しく、I5は、時間間隔22における第2の過渡信号の大きさにほぼ等しく、x1は、0.70にほぼ等しく、x2は、0.49にほぼ等しく、x3は、28.59にほぼ等しく、x4は、0.7にほぼ等しく、x5は、15.51にほぼ等しい、態様E13に記載の方法。
18.検体濃度の決定が、以下の形の式:
I 1 is approximately equal to the magnitude of the second transient signal at
18. The determination of the analyte concentration is a formula of the form:
Gは、検体濃度を表し、I1は、時間間隔19における第2の過渡信号の大きさにほぼ等しく、I2は、時間間隔16における第2の過渡信号の大きさにほぼ等しく、I3は、時間間隔11における第2の過渡信号の大きさにほぼ等しく、I4は、時間間隔5における第2の過渡信号の大きさにほぼ等しく、x1は、(−)1.68にほぼ等しく、x2は、0.95にほぼ等しく、x3は、(−)4.97にほぼ等しく、x4は、6.29にほぼ等しく、x5は、3.08にほぼ等しく、x6は、(−)5.84にほぼ等しく、x7は、(−)0.47にほぼ等しく、x8は、0.01にほぼ等しい、態様E10に記載の方法。
19.検体濃度の決定が、以下の形の式:
G represents the analyte concentration, I 1 is approximately equal to the magnitude of the second transient signal at time interval 19, I 2 is approximately equal to the magnitude of the second transient signal at
19. The determination of the analyte concentration is a formula of the form:
Gは、検体濃度を表し、I1は、時間間隔16における第2の過渡信号の大きさにほぼ等しく、I2は、時間間隔5における第2の過渡信号の大きさにほぼ等しく、I3は、時間間隔12における第2の過渡信号の大きさにほぼ等しく、I4は、時間間隔14における第2の過渡信号の大きさにほぼ等しく、x1は、1.18にほぼ等しく、x2は、0.97にほぼ等しく、x3は、(−)11.32にほぼ等しく、x4は、38.76にほぼ等しく、x5は、(−)39.32にほぼ等しく、x6は、0.0928にほぼ等しく、x7は、(−)0.85にほぼ等しく、x8は、1.75にほぼ等しく、x9は、(−)9.38にほぼ等しく、x10は、0.25にほぼ等しい、態様E10に記載の方法。
20.複数の前記別個の時間間隔のそれぞれにおける前記第2の過渡信号の大きさが、それぞれの別個の時間間隔において測定される平均の大きさを含む、態様E14〜E19のいずれか一項に記載の方法。
21.前記第1の信号を印加する工程、及び前記第2の信号を流す工程が連続した順序である、態様E1、態様E2、又は態様E3のいずれか一項に記載の方法。
22.前記第1の信号を印加する工程が、前記第2の信号を流す工程と重なり合う、態様E1、態様E2、又は態様E3のいずれか一項に記載の方法。
23.前記第1の信号を印加する工程が、前記試料に交流信号を適用することによって該交流信号の出力から該試料の物理的特性を決定することを含む、態様E1、態様E2、又は態様E3に記載の方法。
24.前記第1の信号を印加する工程が、前記試料に光学信号を適用することによって該光学信号の出力から該試料の物理的特性を決定することを含む、態様E1、態様E2、又は態様E3に記載の方法。
25.前記物理的特性がヘマトクリット値を含み、前記検体がグルコースを含む、態様E24に記載の方法。
26.前記物理的特性が、前記試料の粘性、ヘマトクリット値、及び密度の少なくとも1つを含む、態様E1、態様E2、又は態様E3のいずれか一項に記載の方法。
27.前記適用する工程が、第1及び第2の交流信号を、第1の周波数が第2の周波数よりも低い異なるそれぞれの周波数で流すことを含む、態様E24に記載の方法。
28.前記第1の周波数が前記第2の周波数よりも少なくとも1桁低い、態様E25に記載の方法。
29.前記第1の周波数が約10kHz〜約90kHzの範囲の任意の周波数を含む、態様E26に記載の方法。
30.前記得る工程が、前記第1の過渡信号から、第2のサンプリング持続時間に対して参照される第2の過渡信号を抽出することを含む、態様E1、態様E2、又は態様E3のいずれか一項に記載の方法。
31.前記得る工程が、第1の過渡信号から、第2のサンプリング持続時間の外側の信号を除去することによって第2のサンプリング持続時間内に第2の過渡信号を残すことを含む、態様E1、態様E2、又は態様E3に記載の方法。
32.前記導出する工程が、前記第2のサンプリング持続時間内のそれぞれの別個の時間間隔について前記第2の過渡信号の大きさを保存することを含む、態様E30又は態様E31のいずれか一項に記載の方法。
33.
基板と、
該基板上に配置され、それぞれの電極コネクタに接続された複数の電極とを有する検査ストリップと、
ハウジングと、
該検査ストリップの該それぞれの電極コネクタに接続されるように構成された検査ストリップポートコネクタと、
該検査シーケンスの間に該複数の電極に電気信号を印加するか又は該複数の電極からの電気信号を検知するように該検査ストリップポートコネクタと電気的に導通したマイクロプロセッサとを有する検体計測器と、を備える検体測定システムであって、該マイクロプロセッサが、(a)該複数の電極に第1の信号を印加することにより、特定のサンプリング時間を与えるための試料の物理的特性を導出し、(b)該複数の電極に第2の電気信号を印加し、(c)該複数の電極からの第1の過渡出力信号を測定し、(d)該第1の出力信号から第2の過渡出力信号を抽出し、(e)少なくとも22個の別個の時間間隔にわたって第2の過渡出力信号の大きさを決定し、(f)該少なくとも22個の別個の時間間隔の選択された時間間隔における該第2の過渡出力信号の大きさから検体濃度を計算するように構成されている検体測定システム。
34.
基板と、
該基板上に配置され、それぞれの電極コネクタに接続された複数の電極とを有する検査ストリップと、
ハウジングと、
該検査ストリップの該それぞれの電極コネクタに接続されるように構成された検査ストリップポートコネクタと、
該検査シーケンスの間に該複数の電極に電気信号を印加するか又は該複数の電極からの電気信号を検知するように該検査ストリップポートコネクタと電気的に導通したマイクロプロセッサとを有する検体計測器と、を備える検体測定システムであって、該マイクロプロセッサが、(a)該複数の電極に第1の信号を印加することにより、特定のサンプリング時間を与えるための試料の物理的特性を導出し、(b)該複数の電極に第2の電気信号を印加し、(c)該複数の電極からの第1の過渡出力信号を測定し、(d)該第1の出力信号から第2の過渡出力信号を抽出し、(e)少なくとも22個の別個の時間間隔にわたって第2の過渡出力信号の大きさを決定し、(f)該少なくとも22個の別個の時間間隔の内の選択された時間間隔において、該第2の過渡出力信号の大きさから検体濃度を計算することにより、検査シーケンスの開始の約10秒以内に検体濃度を告知するように構成されている、検体測定システム。
35.前記複数の電極が、物理的特性を測定するための少なくとも2つの電極、及び検体濃度を測定するための少なくとも2つの他の電極を含む、態様E33又は態様E34のいずれか一項に記載のシステム。
36.前記少なくとも2つの電極及び前記少なくとも2つの他の電極が、前記基板上に設けられた同じチャンバ内に配置される、態様E35に記載のシステム。
37.前記少なくとも2つの電極及び前記少なくとも2つの他の電極が、前記基板上に設けられた異なるチャンバ内に配置される、態様E35に記載のシステム。
38.前記異なるチャンバが、基板の縁部上に互いに隣接して配置される、態様37に記載のシステム。
39.前記少なくとも2つの電極及び前記他の少なくとも2つの電極が、流体試料を受容する共通のチャンバ内に配置される、態様35に記載のシステム。
40.前記少なくとも2つの電極が、物理的特性及び検体濃度を測定するための2つの電極を含む、態様E35に記載のシステム。
41.電極のすべてが前記基板によって規定される同じ平面上に配置される、態様E33〜40のいずれか一項に記載のシステム。
42.前記少なくとも2つの他の電極に近接して試薬が配置され、前記少なくとも2つの電極上に試薬が配置されない、態様E33〜40のいずれか一項に記載のシステム。
43.前記特定されたサンプリング時間が以下の形の式:
特定されたサンプリング時間=x1Hx2+x3
を用いて計算され、式中、「特定されたサンプリング時間」は、前記検査ストリップの出力信号をサンプリングする検査シーケンスの開始からの時点として指定され、
Hは、ヘマトクリット値の形の前記試料の物理的特性を表し、
x1は、約4.3e5を表し、
x2は、約(−)3.9を表し、
x3は、約4.8を表す、態様E33又は態様E34に記載のシステム。
44.前記マイクロプロセッサが、以下の形の式:
G represents the analyte concentration, I 1 is approximately equal to the magnitude of the second transient signal at
20. The method of any one of aspects E14 to E19, wherein the magnitude of the second transient signal in each of the plurality of distinct time intervals includes an average magnitude measured in each distinct time interval. Method.
21. The method according to any one of aspects E1, E2 or E3, wherein the step of applying the first signal and the step of flowing the second signal are in a sequential order.
22. The method of any one of aspects E1, E2, or E3, wherein the step of applying the first signal overlaps with the step of flowing the second signal.
23. In aspect E1, aspect E2, or aspect E3, the step of applying the first signal comprises determining a physical property of the sample from the output of the alternating signal by applying an alternating signal to the sample The method described.
24. In aspect E1, aspect E2, or aspect E3, the step of applying the first signal comprises determining a physical property of the sample from an output of the optical signal by applying an optical signal to the sample The method described.
25. The method of aspect E24, wherein the physical property comprises a hematocrit value and the analyte comprises glucose.
26. The method of any one of aspects E1, E2, or E3, wherein the physical property comprises at least one of viscosity, hematocrit value, and density of the sample.
27. The method of aspect E24, wherein the applying step includes flowing first and second alternating signals at different respective frequencies where the first frequency is lower than the second frequency.
28. The method of aspect E25, wherein the first frequency is at least an order of magnitude lower than the second frequency.
29. The method of aspect E26, wherein the first frequency comprises any frequency in the range of about 10 kHz to about 90 kHz.
30. Any one of aspects E1, E2, or E3, wherein the obtaining step includes extracting from the first transient signal a second transient signal that is referenced for a second sampling duration. The method according to item.
31. Aspect E1, Aspect, wherein the obtaining step comprises leaving a second transient signal within the second sampling duration by removing signals outside the second sampling duration from the first transient signal. The method of E2, or aspect E3.
32. The aspect E30 or the aspect E31, wherein the deriving step includes storing the magnitude of the second transient signal for each distinct time interval within the second sampling duration. the method of.
33.
A substrate,
A test strip having a plurality of electrodes disposed on the substrate and connected to respective electrode connectors;
A housing;
A test strip port connector configured to be connected to the respective electrode connector of the test strip;
An analyte meter having a microprocessor in electrical communication with the test strip port connector to apply an electrical signal to the plurality of electrodes or to detect an electrical signal from the plurality of electrodes during the test sequence And (a) applying a first signal to the plurality of electrodes to derive a physical characteristic of the sample for giving a specific sampling time. , (B) applying a second electrical signal to the plurality of electrodes, (c) measuring a first transient output signal from the plurality of electrodes, and (d) a second from the first output signal Extracting a transient output signal; (e) determining a magnitude of a second transient output signal over at least 22 distinct time intervals; and (f) a selected time interval of the at least 22 distinct time intervals. In Analyte measurement system that is configured to calculate an analyte concentration from the magnitude of the second transient output signal.
34.
A substrate,
A test strip having a plurality of electrodes disposed on the substrate and connected to respective electrode connectors;
A housing;
A test strip port connector configured to be connected to the respective electrode connector of the test strip;
An analyte meter having a microprocessor in electrical communication with the test strip port connector to apply an electrical signal to the plurality of electrodes or to detect an electrical signal from the plurality of electrodes during the test sequence And (a) applying a first signal to the plurality of electrodes to derive a physical characteristic of the sample for giving a specific sampling time. , (B) applying a second electrical signal to the plurality of electrodes, (c) measuring a first transient output signal from the plurality of electrodes, and (d) a second from the first output signal Extracting a transient output signal; (e) determining a magnitude of a second transient output signal over at least 22 distinct time intervals; and (f) selecting the at least 22 distinct time intervals. At time intervals Te by calculating the analyte concentration from the magnitude of the second transient output signal, and is configured to announce analyte concentration within about 10 seconds of the start of the test sequence, the analyte measuring system.
35. The system of any one of aspects E33 or E34, wherein the plurality of electrodes includes at least two electrodes for measuring physical properties and at least two other electrodes for measuring analyte concentration. .
36. The system of aspect E35, wherein the at least two electrodes and the at least two other electrodes are disposed in the same chamber provided on the substrate.
37. The system of aspect E35, wherein the at least two electrodes and the at least two other electrodes are disposed in different chambers provided on the substrate.
38. 38. The system of aspect 37, wherein the different chambers are disposed adjacent to each other on an edge of a substrate.
39. 36. The system of
40. The system of aspect E35, wherein the at least two electrodes comprise two electrodes for measuring physical properties and analyte concentration.
41. The system of any one of aspects E33-40, wherein all of the electrodes are disposed on the same plane defined by the substrate.
42. 41. The system according to any one of aspects E33-40, wherein a reagent is disposed proximate to the at least two other electrodes and no reagent is disposed on the at least two electrodes.
43. The specified sampling time is of the form:
Specified sampling time = x 1 H x 2 + x 3
Where the “specified sampling time” is specified as the point in time from the start of the test sequence that samples the output signal of the test strip;
H represents the physical properties of the sample in the form of a hematocrit value;
x 1 represents approximately 4.3e5;
x 2 represents approximately (−) 3.9,
The system of aspect E33 or aspect E34, wherein x 3 represents about 4.8.
44. The microprocessor has the following formula:
Gは、検体濃度を表し、I1は、時間間隔17における第2の過渡信号の大きさにほぼ等しく、I2は、時間間隔13における第2の過渡信号の大きさにほぼ等しく、I3は、時間間隔5における第2の過渡信号の大きさにほぼ等しく、I4は、時間間隔3における第2の過渡信号の大きさにほぼ等しく、I5は、時間間隔22における第2の過渡信号の大きさにほぼ等しく、x1は、0.75にほぼ等しく、x2は、337.27にほぼ等しく、x3は、(−)16.81にほぼ等しく、x4は、1.41にほぼ等しく、x5は、2.67にほぼ等しい、態様E33、E34、又はE41のいずれか一項に記載のシステム。
45.前記マイクロプロセッサが、以下の形の式:
G represents the analyte concentration, I 1 is approximately equal to the magnitude of the second transient signal at
45. The microprocessor has the following formula:
Gは、検体濃度を表し、I1は、時間間隔11における第2の過渡信号の大きさにほぼ等しく、I2は、時間間隔7における第2の過渡信号の大きさにほぼ等しく、x1は、0.59にほぼ等しく、x2は、2.51にほぼ等しく、x3は、(−)12.74にほぼ等しく、x4は、(−)188.31にほぼ等しく、x5は、9.2にほぼ等しい、態様E33、E34、又はE44のいずれか一項に記載のシステム。
46.前記マイクロプロセッサが、以下の形の式:
G represents the analyte concentration, I 1 is approximately equal to the magnitude of the second transient signal at time interval 11, I 2 is approximately equal to the magnitude of the second transient signal at
46. The microprocessor has the following formula:
47.前記マイクロプロセッサが、以下の形の式:
47. The microprocessor has the following formula:
I1は、時間間隔5における第2の過渡信号の大きさにほぼ等しく、I2は、時間間隔1における第2の過渡信号の大きさにほぼ等しく、I3は、時間間隔2における第2の過渡信号の大きさにほぼ等しく、I4は、時間間隔10における第2の過渡信号の大きさにほぼ等しく、I5は、時間間隔22における第2の過渡信号の大きさにほぼ等しく、x1は、0.70にほぼ等しく、x2は、0.49にほぼ等しく、x3は、28.59にほぼ等しく、x4は、0.7にほぼ等しく、x5は、15.51にほぼ等しい、態様E33、E34、又はE41のいずれか一項に記載のシステム。
48.前記マイクロプロセッサが、以下の形の式:
I 1 is approximately equal to the magnitude of the second transient signal at
48. The microprocessor has the following formula:
Gは、検体濃度を表し、I1は、時間間隔19における第2の過渡信号の大きさにほぼ等しく、I2は、時間間隔16における第2の過渡信号の大きさにほぼ等しく、I3は、時間間隔11における第2の過渡信号の大きさにほぼ等しく、I4は、時間間隔5における第2の過渡信号の大きさにほぼ等しく、x1は、(−)1.68にほぼ等しく、x2は、0.95にほぼ等しく、x3は、(−)4.97にほぼ等しく、x4は、6.29にほぼ等しく、x5は、3.08にほぼ等しく、x6は、(−)5.84にほぼ等しく、x7は、(−)0.47にほぼ等しく、x8は、0.01にほぼ等しい、態様E33、E34、又はE41のいずれか一項に記載のシステム。
49.前記マイクロプロセッサが、以下の形の式:
G represents the analyte concentration, I 1 is approximately equal to the magnitude of the second transient signal at time interval 19, I 2 is approximately equal to the magnitude of the second transient signal at
49. The microprocessor has the following formula:
Gは、グルコース濃度であり、I1は、時間間隔16における第2の過渡信号の大きさにほぼ等しく、I2は、時間間隔5における第2の過渡信号の大きさにほぼ等しく、I3は、時間間隔12における第2の過渡信号の大きさにほぼ等しく、I4は、時間間隔14における第2の過渡信号の大きさにほぼ等しく、x1は、1.18にほぼ等しく、x2は、0.97にほぼ等しく、x3は、(−)11.32にほぼ等しく、x4は、−38.76にほぼ等しく、x5は、(−)39.32にほぼ等しく、x6は、0.0928にほぼ等しく、x7(−)0.85にほぼ等しく、x8は、1.75にほぼ等しく、x9(−)9.38にほぼ等しく、x10は、0.25にほぼ等しい、態様E33、E34、又はE41のいずれか一項に記載のシステム。
50.複数の前記別個の時間間隔のそれぞれにおける前記第2の過渡信号の大きさが、それぞれの時間間隔を通じてサンプリングされる信号の平均の大きさを含む、態様E33、E34、又はE41のいずれか一項に記載のシステム。
51.前記マイクロプロセッサにより計算される複数の検体濃度間の誤差が、30%ヘマトクリット値における基準値と比較して±15%未満である、態様E33、E34、又はE41のいずれか一項に記載のシステム。
52.前記マイクロプロセッサにより計算される複数の検体濃度間の誤差が、42%ヘマトクリット値における基準値と比較して±15%未満である、態様E33、E34、又はE41のいずれか一項に記載のシステム。
53.前記マイクロプロセッサにより計算される複数の検体濃度間の誤差が、55%ヘマトクリット値における基準値と比較して±15%未満である、態様E33、E34、又はE41のいずれか一項に記載のシステム。
G is the glucose concentration, I 1 is approximately equal to the magnitude of the second transient signal in
50. Any one of aspects E33, E34, or E41, wherein the magnitude of the second transient signal in each of the plurality of distinct time intervals includes an average magnitude of the signal sampled over each time interval. The system described in.
51. The system of any one of aspects E33, E34, or E41, wherein an error between a plurality of analyte concentrations calculated by the microprocessor is less than ± 15% compared to a reference value at a 30% hematocrit value. .
52. The system of any one of aspects E33, E34, or E41, wherein an error between a plurality of analyte concentrations calculated by the microprocessor is less than ± 15% compared to a reference value at a 42% hematocrit value. .
53. The system of any one of aspects E33, E34, or E41, wherein an error between a plurality of analyte concentrations calculated by the microprocessor is less than ± 15% compared to a reference value at a 55% hematocrit value. .
セクション「F」
以下の態様は、参照により本明細書に組み込まれる米国特許出願第13/250,525号(代理人整理番号DDI5209USNP)及び国際特許出願第PCT/GB2012/052421号(代理人整理番号DDI5209WOPCT)に最初に示されたものであり、本開示の一部をなすものである。
1.体液試料中の検体の判定において、分析用検査ストリップと使用するための手持ち式検査計測器であって、
ハウジングと、
該ハウジング内に配置されたマイクロコントローラブロックと、
信号生成サブブロックと、
ローパスフィルタサブブロックと、
分析用検査ストリップ試料セルインタフェースサブブロックと、
トランスインピーダンス増幅器サブブロックと、
位相検波器サブブロックとを有する、位相シフト式ヘマトクリット値測定ブロックと、を備え、
該位相シフト式ヘマトクリット値測定ブロック及びマイクロコントローラブロックが、該手持ち式検査計測器に挿入された分析用検査ストリップの試料セル内の体液試料の位相シフトを測定するように構成され、
該マイクロコントローラブロックが、該測定された位相シフトに基づいて体液のヘマトクリット値を計算するように構成された手持ち式検査計測器。
2.前記位相シフト式ヘマトクリット値測定ブロック及びマイクロコントローラブロックが、第1の周波数の信号及び第2の周波数の第2の信号を用いて位相シフトを測定するように構成された、態様F1の手持ち式検査計測器。
3.前記体液試料が全血試料であり、前記第1の周波数が10kHz〜25kHzの範囲であり、前記第2の周波数が250kHz〜500kHzの範囲である、態様F2の手持ち式検査計測器。
4.前記位相検波器サブブロックが、立ち上がりエッジ捕捉位相検波器として構成された、態様F1の手持ち式検査計測器。
5.前記位相検波器サブブロックが、デュアルエッジ捕捉位相検波器として構成された、態様F1の手持ち式検査計測器。
6.前記位相検波器サブブロックが、XOR位相検波器として構成された、態様F1の手持ち式検査計測器。
7.前記位相検波器サブブロックが、同期変調位相検波器として構成された、態様F1の手持ち式検査計測器。
8.前記分析用検査ストリップ試料セルインタフェースサブブロックと並列して構成された校正負荷サブブロックを更に有する、態様F1の手持ち式検査計測器。
9.前記信号生成サブブロックが、少なくとも第1の周波数の第1の電気信号及び第2の周波数の第2の電気信号を生成するように構成された、態様F1の手持ち式検査計測器。
10.前記位相シフト式ヘマトクリット値測定ブロック及びマイクロコントローラブロックが、既知の周波数の信号を体液試料を通じて流し、前記信号の位相シフトを測定することによって、手持ち式検査計測器に挿入された分析用検査ストリップの試料セル内の体液試料の位相シフトを測定するように構成された、態様F1の手持ち式検査計測器。
11.前記第1の周波数が10kHz〜25kHzの範囲であり、前記第2の周波数が250kHz〜500kHzの範囲であり、
前記位相シフト式ヘマトクリット値測定ブロック及びマイクロコントローラブロックが、前記第1の周波数の信号が体液試料の位相シフトの測定において基準信号として用いられるように構成された、態様F9の手持ち式検査計測器。
12.前記信号生成ブロックが前記マイクロコントローラブロックと統合された、態様F9の手持ち式検査計測器。
13.前記分析用検査ストリップ試料セルインタフェースブロックが、第1の電極を介して前記分析用検査ストリップの試料セルと機能的にインタフェースし、前記試料セル内に配置される前記分析用検査ストリップの第2の電極として構成された、態様F1の手持ち式検査計測器。
14.前記分析用検査ストリップが、全血試料中のグルコースを決定するように構成された電気化学式分析用検査ストリップである、態様F1の手持ち式検査計測器。
15.前記位相検波器サブブロックが、Quadratur DEMUX位相検波器として構成された、態様F1の手持ち式検査計測器。
16.手持ち式検査計測器及び分析用検査ストリップを使用するための方法であって、
分析用検査ストリップの試料セル内に全血試料を導入する工程と、
手持ち式検査計測器の位相シフト式測定ブロック及びマイクロコントローラブロックを使用して該試料セル内の体液試料の位相シフトを測定する工程と、
該マイクロコントローラブロックを使用して該測定された位相シフトに基づいて全血試料のヘマトクリット値を計算する工程と、を含む方法。
17.
前記分析用検査ストリップ、手持ち式検査計測器、及び計算されたヘマトクリット値を用いて前記導入された体液試料中の検体を決定する工程を更に含む、態様F16に記載の方法。
18.前記分析用検査ストリップが電気化学式分析用検査ストリップであり、前記検体がグルコースである、態様F17に記載の方法。
19.前記測定する工程が、
信号生成サブブロックと、
ローパスフィルタサブブロックと、
分析用検査ストリップ試料セルインタフェースサブブロックと、
トランスインピーダンス増幅器サブブロックと、
位相検波器サブブロックとを有する位相シフト式測定回路ブロックにより位相シフトを測定することを含む、態様F16に記載の方法。
20.前記位相検波器サブブロックが、立ち上がりエッジ捕捉位相検波器として構成された、態様F19に記載の方法。
21.前記位相検波器サブブロックが、デュアルエッジ捕捉位相検波器として構成された、態様F19に記載の方法。
22.前記位相検波器サブブロックが、XOR位相検波器として構成された、態様F19に記載の方法。
23.前記位相検波器サブブロックが、同期変調位相検波器として構成された、態様F19に記載の方法。
24.前記位相検波器サブブロックが、Quadratur DEMUX位相検波器として構成された、態様F19に記載の方法。
25.前記位相シフト式ヘマトクリット値測定ブロック及びマイクロコントローラブロックが、第1の周波数の信号及び第2の周波数の第2の信号を用いて位相シフトを測定するように構成された、態様F16に記載の方法。
26.前記体液試料が全血試料であり、前記第1の周波数が10kHz〜25kHzの範囲であり、前記第2の周波数が250kHz〜500kHzの範囲である、態様F25に記載の方法。
Section "F"
The following aspects are first presented in US patent application Ser. No. 13 / 250,525 (Attorney Docket No. DDI5209USNP) and International Patent Application No. PCT / GB2012 / 052421 (Attorney Docket No. DDI5209 WOPCT), incorporated herein by reference. And is part of the present disclosure.
1. A hand-held test instrument for use with an analytical test strip in the determination of a specimen in a body fluid sample,
A housing;
A microcontroller block disposed within the housing;
A signal generation sub-block;
A low-pass filter sub-block;
A test strip sample cell interface sub-block for analysis; and
A transimpedance amplifier sub-block;
A phase-shifting hematocrit value measurement block having a phase detector sub-block,
The phase shift hematocrit measurement block and the microcontroller block are configured to measure a phase shift of a body fluid sample in a sample cell of an analytical test strip inserted into the handheld test instrument;
A hand-held test instrument configured such that the microcontroller block is configured to calculate a hematocrit value of a body fluid based on the measured phase shift.
2. The handheld inspection of aspect F1, wherein the phase shift hematocrit measurement block and the microcontroller block are configured to measure a phase shift using a first frequency signal and a second frequency second signal. Measuring instrument.
3. The hand-held test measuring instrument according to aspect F2, wherein the body fluid sample is a whole blood sample, the first frequency is in the range of 10 kHz to 25 kHz, and the second frequency is in the range of 250 kHz to 500 kHz.
4). The handheld test and measurement instrument of aspect F1, wherein the phase detector sub-block is configured as a rising edge capture phase detector.
5. The handheld test and measurement instrument of aspect F1, wherein the phase detector sub-block is configured as a dual edge capture phase detector.
6). The handheld test and measurement instrument of aspect F1, wherein the phase detector sub-block is configured as an XOR phase detector.
7). The hand-held inspection and measurement instrument according to aspect F1, wherein the phase detector sub-block is configured as a synchronous modulation phase detector.
8). The handheld test instrument of aspect F1, further comprising a calibration load sub-block configured in parallel with the analytical test strip sample cell interface sub-block.
9. The handheld test and measurement instrument of aspect F1, wherein the signal generation sub-block is configured to generate at least a first electrical signal at a first frequency and a second electrical signal at a second frequency.
10. The phase-shifting hematocrit value measurement block and the microcontroller block send a signal of a known frequency through the body fluid sample and measure the phase shift of the signal so that the analytical test strip inserted in the handheld test instrument The hand-held inspection instrument of aspect F1, configured to measure a phase shift of a body fluid sample in a sample cell.
11. The first frequency is in the range of 10 kHz to 25 kHz, and the second frequency is in the range of 250 kHz to 500 kHz;
The handheld test and measurement instrument of aspect F9, wherein the phase shift hematocrit value measurement block and the microcontroller block are configured such that the signal of the first frequency is used as a reference signal in the measurement of the phase shift of the body fluid sample.
12 The hand-held inspection instrument of aspect F9, wherein the signal generation block is integrated with the microcontroller block.
13. The analytical test strip sample cell interface block functionally interfaces with a sample cell of the analytical test strip via a first electrode and a second of the analytical test strips disposed in the sample cell. The hand-held inspection and measurement instrument of aspect F1, configured as an electrode.
14 The handheld test instrument of aspect F1, wherein the analytical test strip is an electrochemical analytical test strip configured to determine glucose in a whole blood sample.
15. The handheld test and measurement instrument of aspect F1, wherein the phase detector sub-block is configured as a Quadratur DEMUX phase detector.
16. A method for using a handheld test instrument and an analytical test strip, comprising:
Introducing a whole blood sample into the sample cell of the analytical test strip;
Measuring a phase shift of a body fluid sample in the sample cell using a phase shift measurement block and a microcontroller block of a handheld test instrument; and
Calculating a hematocrit value of the whole blood sample based on the measured phase shift using the microcontroller block.
17.
The method of aspect F16, further comprising determining an analyte in the introduced body fluid sample using the analytical test strip, a handheld test instrument, and the calculated hematocrit value.
18. The method of aspect F17, wherein the analytical test strip is an electrochemical analytical test strip and the analyte is glucose.
19. The step of measuring comprises
A signal generation sub-block;
A low-pass filter sub-block;
A test strip sample cell interface sub-block for analysis; and
A transimpedance amplifier sub-block;
The method of aspect F16, comprising measuring the phase shift with a phase shift measurement circuit block having a phase detector sub-block.
20. The method of aspect F19, wherein the phase detector sub-block is configured as a rising edge capture phase detector.
21. The method of aspect F19, wherein the phase detector sub-block is configured as a dual edge acquisition phase detector.
22. The method of aspect F19, wherein the phase detector sub-block is configured as an XOR phase detector.
23. The method of aspect F19, wherein the phase detector sub-block is configured as a synchronous modulation phase detector.
24. The method of aspect F19, wherein the phase detector sub-block is configured as a Quadratur DEMUX phase detector.
25. The method of aspect F16, wherein the phase-shifting hematocrit measurement block and the microcontroller block are configured to measure a phase shift using a first frequency signal and a second frequency second signal. .
26. The method of aspect F25, wherein the bodily fluid sample is a whole blood sample, the first frequency is in the range of 10 kHz to 25 kHz, and the second frequency is in the range of 250 kHz to 500 kHz.
補遺
以下の補遺は、米国特許出願第13/250,525号(代理人整理番号DDI5209USNP)及び国際特許出願第PCT/GB2012/052421号(代理人整理番号DDI5209WOPCT)において上記の態様Fとともに最初に示され、先にに出願された米国仮特許出願第61/581,087号(代理人整理番号DDI5220USPSP)、同第61/581,089号(代理人整理番号DDI5220USPSP1)、同第61/581,099号(代理人整理番号DDI5220USPSP2)、並びに同第61/581,100号(代理人整理番号DDI5221USPSP)及び同第61/654,013号(代理人整理番号DDI5228USPSP)のそれぞれの一部として参照により組み込まれるものであって、本開示の一部をなすとともに参照によって上記に組み込まれるものである。
以下の開示は、一般的には医療装置に関し、詳細には検査計測器及び関連する方法に関するものである。
Addendum The following addendum is first shown with aspect F above in US Patent Application No. 13 / 250,525 (Attorney Docket No. DDI5209USNP) and International Patent Application No. PCT / GB2012 / 052421 (Attorney Docket No. DDI5209 WOPCT). No. 61 / 581,087 (Attorney Docket No. DDI5220USPSP), 61 / 581,089 (Attorney Docket No. DDI5220USPSP1), 61 / 581,099, previously filed. No. (Attorney Docket Number DDI5220USPSP2) and 61 / 581,100 (Attorney Docket Number DDI5221USPSP) and 61 / 654,013 (Attorney Docket Number DDI5228USPSP) incorporated by reference as part of each Too Which forms part of this disclosure and is incorporated above by reference.
The following disclosure relates generally to medical devices, and more particularly to test instruments and related methods.
流体試料中の検体の決定(例えば、検出及び/又は濃度測定)は医療分野において高い関心が寄せられている。例えば、尿、血液、血漿、若しくは間質液などの体液試料中のグルコース、ケトン体、コレステロール、リポタンパク質、トリグリセリド、アセトアミノフェン、及び/又はHbA1c濃度を決定することが望ましい場合がある。こうした決定は、手持ち式検査計測器を分析用検査ストリップ(例えば、電気化学式分析用検査ストリップ)と組み合わせて使用することで実現可能である。 The determination of an analyte in a fluid sample (eg, detection and / or concentration measurement) is of great interest in the medical field. For example, it may be desirable to determine the glucose, ketone body, cholesterol, lipoprotein, triglyceride, acetaminophen, and / or HbA1c concentration in a body fluid sample such as urine, blood, plasma, or interstitial fluid. Such a determination can be achieved by using a hand-held test instrument in combination with an analytical test strip (eg, an electrochemical analytical test strip).
本開示の新規な特徴を態様Fにおいて詳細に記載する。本開示の特徴及び利点は、本開示の原理を利用した例示的な実施形態を記載した以下の詳細な説明、及び、同様の参照符合が同様の要素を示す添付の図面を参照することによって、より深い理解が得られるであろう。図中、
図9は、本開示の実施形態に基づく手持ち式検査計測器の簡略図である。
図10は、図9の手持ち式検査計測器の様々なブロックの簡略ブロック図である。
図11は、本開示に基づく実施形態において使用することが可能な位相シフト式ヘマトクリット値測定ブロックの簡略ブロック図である。
図12は、本開示に基づく実施形態において使用することが可能なデュアルローパスフィルタサブブロックの簡略化された注釈付きの概略図である。
図13は、本開示に基づく実施形態において使用することが可能なトランスインピーダンス増幅器(TIA)サブブロックの簡略化された注釈付きの概略図である。
図14は、本開示の実施形態の位相シフト式ヘマトクリット値測定ブロックにおいて使用することが可能なデュアルローパスフィルタサブブロック、校正負荷サブブロック、分析用検査ストリップ試料セルインタフェースサブブロック、XOR位相シフト測定サブブロック、及びQuadratur DEMUX位相シフト測定サブブロックを示した簡略化された注釈付きの概略図である。
図15は、本開示の実施形態に基づく手持ち式検査計測器を使用するための方法における各段階を示したフローチャートである。
The novel features of the disclosure are described in detail in aspect F. The features and advantages of the present disclosure will become apparent from the following detailed description, which sets forth illustrative embodiments, in which the principles of the disclosure are utilized, and the accompanying drawings in which like reference numbers indicate like elements, A deeper understanding will be gained. In the figure,
FIG. 9 is a simplified diagram of a hand-held inspection instrument according to an embodiment of the present disclosure.
FIG. 10 is a simplified block diagram of various blocks of the handheld test instrument of FIG.
FIG. 11 is a simplified block diagram of a phase-shifting hematocrit measurement block that can be used in embodiments according to the present disclosure.
FIG. 12 is a simplified annotated schematic diagram of a dual low pass filter sub-block that may be used in embodiments according to the present disclosure.
FIG. 13 is a simplified annotated schematic diagram of a transimpedance amplifier (TIA) sub-block that can be used in embodiments according to the present disclosure.
FIG. 14 shows a dual low-pass filter sub-block, calibration load sub-block, analytical test strip sample cell interface sub-block, XOR phase shift measurement sub-block that can be used in the phase-shifting hematocrit measurement block of the embodiment of the present disclosure. FIG. 6 is a simplified annotated schematic diagram illustrating a block and a Quadratur DEMUX phase shift measurement sub-block.
FIG. 15 is a flowchart illustrating steps in a method for using a handheld test instrument in accordance with an embodiment of the present disclosure.
以下の詳細な説明は、図面を参照しつつ読まれるべきもので、異なる図面中、同様の要素は同様の参照符号にて示してある。図面は必ずしも実寸ではなく、あくまで説明を目的として例示的な実施形態を図示したものであり、本発明の範囲を限定することを目的とするものではない。詳細な説明は本開示の原理を限定するものではなく、あくまでも例として説明するものである。この説明文は、当業者に発明の製造及び使用を明瞭に可能ならしめるものであり、開示内容を実施するための出願時における最良の形態と考えられるものを含む、本開示の複数の実施形態、適応例、変形例、代替例、及び使用例を述べるものである。 The following detailed description should be read with reference to the drawings, in which like elements in different drawings are designated with like reference numerals. The drawings are not necessarily to scale, and are merely illustrative for purposes of illustration and are not intended to limit the scope of the invention. The detailed description is not intended to limit the principles of the present disclosure, but is merely exemplary. This description is intended to enable those skilled in the art to clearly make and use the invention, and includes a number of embodiments of the present disclosure, including what is considered to be the best mode at the time of filing to practice the disclosure. Application examples, modification examples, alternative examples, and usage examples will be described.
本明細書で任意の数値又は数値範囲について用いる「約」又は「およそ」なる用語は、構成要素の部分又は構成要素の集合が、本明細書で述べるその所望の目的に沿って機能することを可能とするような適当な寸法の許容誤差を示すものである。 The term “about” or “approximately” as used herein for any numerical value or range of values means that a component part or set of components functions in accordance with its desired purpose as described herein. It shows the tolerance of suitable dimensions as possible.
一般的に、本開示の実施形態に基づいて体液試料(すなわち全血試料)中の検体(グルコースなど)の決定において分析用検査ストリップとともに使用される手持ち式検査計測器は、ハウジング、ハウジング内に配置されるマイクロコントローラ、及び位相シフト式ヘマトクリット値測定ブロック(位相シフト式ヘマトクリット値回路とも呼ばれる)を有している。このような手持ち式検査計測器では、位相シフト式ヘマトクリット値測定ブロックは、信号生成サブブロック、ローパスフィルタサブブロック、分析用検査ストリップ試料セルインタフェースサブブロック、トランスインピーダンス増幅器サブブロック、及び位相検波器サブブロックを有している。更に、位相シフト式ヘマトクリット値測定ブロック及びマイクロコントローラブロックは、手持ち式検査計測器に挿入された分析用検査ストリップの試料セル内の体液試料の位相シフトを測定するように構成され、マイクロコントローラブロックは、測定された位相シフトに基づいて体液試料のヘマトクリット値を計算するようにも構成されている。 Generally, a hand-held test instrument used with an analytical test strip in the determination of an analyte (such as glucose) in a body fluid sample (ie, a whole blood sample) according to embodiments of the present disclosure is provided within the housing. It has a microcontroller and a phase-shifting hematocrit value measurement block (also called a phase-shifting hematocrit value circuit). In such a hand-held test instrument, the phase-shifting hematocrit measurement block includes a signal generation sub-block, a low-pass filter sub-block, an analytical test strip sample cell interface sub-block, a transimpedance amplifier sub-block, and a phase detector sub-block. Has a block. In addition, the phase shift hematocrit measurement block and the microcontroller block are configured to measure the phase shift of the body fluid sample in the sample cell of the analytical test strip inserted in the handheld test instrument, the microcontroller block The hematocrit value of the body fluid sample is also calculated based on the measured phase shift.
本開示の実施形態に基づく手持ち式検査計測器は、全血試料のヘマトクリット値を測定した後、測定されたヘマトクリット値を検体決定において用いることにより、全血試料中の検体決定(グルコース決定など)の高い精度を与える点で有用である。 A hand-held test measuring instrument based on an embodiment of the present disclosure measures a hematocrit value of a whole blood sample, and then uses the measured hematocrit value in sample determination to determine a sample in the whole blood sample (such as glucose determination). This is useful in that it provides high accuracy.
本開示の知見を得れば、当業者であれば、本開示に基づいた手持ち式検査計測器として容易に改変することが可能な手持ち式検査計測器の1つの例として、LifeScan Inc.(Milpitas,California)より市販されるOneTouch(登録商標)Ultra(登録商標)2グルコース計測器があることは直ちに認識されるであろう。やはり改変可能な手持ち式検査計測器の更なる例が、米国特許出願公開第2007/0084734号(2007年4月19日公開)及び同第2007/0087397号(2007年4月19日公開)、並びに国際特許出願公開第WO2010/049669号(2010年5月6日公開)に見られ、これらは参照により全体が本明細書に組み込まれる。
As one example of a hand-held inspection measuring instrument that can be easily modified as a hand-held inspection measuring instrument based on the present disclosure by those skilled in the art once knowledge of the present disclosure is obtained, LifeScan Inc. It will be readily appreciated that there is a OneTouch
図9は、本開示の一実施形態に基づいた手持ち式検査計測器100の簡略図である。図10は、手持ち式試験計測器100の様々なブロックの簡略ブロック図である。図11は、手持ち式検査計測器100の位相シフト式ヘマトクリット値測定ブロックの簡略化かつ組み合わせられたブロック図である。図12は、手持ち式検査計測器100のデュアルローパスフィルタサブブロックの簡略化された注釈付きの概略図である。図13は、手持ち式検査計測器100のトランスインピーダンス増幅器サブブロックの簡略化された注釈付きの概略図である。図14は、手持ち式検査計測器100の位相シフト式ヘマトクリット値測定ブロックの一部の簡略化された注釈付きの概略図である。
FIG. 9 is a simplified diagram of a hand-held
図9〜14を参照すると、手持ち式試験計測器100は、ディスプレイ102、複数のユーザインタフェースボタン104、ストリップポートコネクタ106、USBインタフェース108、及びハウジング110を有している(図9を参照)。特に図10を参照すると、手持ち式試験計測器100は更に、マイクロコントローラブロック112、位相シフト式ヘマトクリット値測定ブロック114、ディスプレイ制御ブロック116、メモリブロック118、及び、検査電圧を分析用試験ストリップ(図9でTSとして示される)に印加するため、また、電気化学的応答(例えば複数個の検査電流値)を測定し、電気化学的応答に基づいて検体を決定するための他の電子部品(図に示されていない)を有している。この説明を簡略化するため、図は、すべてのこうした電子回路を示してはいない。
9-14, the
ディスプレイ102は、例えば、スクリーン画像を示すように構成された液晶ディスプレイ又は双安定ディスプレイとすることができる。スクリーン画像の例としては、グルコース濃度、日付及び時間、エラーメッセージ、並びにエンドユーザがどのように検査を行うかを指示するためのユーザインタフェースが挙げられる。
ストリップポートコネクタ106は、全血試料中のグルコースを決定するように構成された電気化学式分析用検査ストリップなどの分析用検査ストリップと機能的にインタフェースするように構成されている。したがって、分析用検査ストリップは、ストリップポートコネクタ106に機能的に挿入されて、例えば適当な電気接点を介して位相シフト式ヘマトクリット値測定ブロック114と機能的にインタフェースするように構成されている。
The
USBインタフェース108は、当業者には周知の任意の好適なインタフェースとすることができる。USBインタフェース108は、基本的に、検査ストリップ100に電力を供給し、検査ストリップ100へのデータ線を与えるように構成された受動的要素である。
The
分析用検査ストリップが手持ち式検査計測器100とインタフェースされた後、又はその前に、体液試料(例えば、全血試料)が分析試験ストリップの試料受容チャンバに導入される。分析用検査ストリップは、検体を別の所定の化学的形態に選択的かつ定量的に変換する酵素試薬を含むことができる。例えば分析用検査ストリップは、フェニリシアニド及びグルコースオキシダーゼを含む酵素試薬を含むことにより、グルコースを酸化型に物理的に変換することができる。
After or before the analytical test strip is interfaced with the
手持ち式検査計測器100のメモリブロック118は適合なアルゴリズムを含み、マイクロコントローラブロック112とともに、分析用検査ストリップの電気化学的応答及び導入された試料のヘマトクリット値に基づいて検体を決定するように構成することができる。例えば、検体である血中グルコースの決定において、ヘマトクリット値を使用することによって電気化学的に決定された血中グルコース濃度に対するヘマトクリット値の影響を補償することができる。
The
マイクロコントローラブロック112はハウジング110の内部に配置され、当業者には周知の任意の適当なマイクロコントローラ及び/又はマイクロプロセッサを含むことができる。このような適当なマイクロコントローラの1つに、Texas Instruments(Dallas,TX USA)より市販される、部品番号MSP430F5138のマイクロコントローラがある。このマイクロコントローラは、25〜250kHzの方形波及び同じ周波数の90°位相シフトした波を生成することにより、下記に更に述べる信号生成sブロックとして機能することができる。MSP430F5138はまた、本開示の実施形態で用いられる位相シフト式ヘマトクリット値測定ブロックによって発生される電圧を測定するのに適したアナログデジタル(A/D)処理機能も有している。
特に図11を参照すると、位相シフト式ヘマトクリット値測定ブロック114は、信号生成サブブロック120、ローパスフィルタサブブロック122、分析用検査ストリップ試料セルインタフェースサブブロック124、及び必要に応じて設けられる校正負荷ブロック126(図11の破線の内側)、トランスインピーダンス増幅器サブブロック128、及び位相検波器サブブロック130を有している。
Referring specifically to FIG. 11, the phase-shifting
下記に更に述べるように、位相シフト式ヘマトクリット値測定ブロック114及びマイクロコントローラブロック112は、例えば、体液試料を通じて流される1つ以上の高周波数電気信号の位相シフトを測定することにより、手持ち式検査計測器に挿入された分析用検査ストリップの試料セル内の体液試料の位相シフトを測定するように構成されている。更に、マイクロコントローラブロック112は、測定された位相シフトに基づいて体液のヘマトクリット値を計算するように構成されている。マイクロコントローラ112は、例えば、A/Dコンバータを用いて位相検波器サブブロックから受信した電圧を測定し、この電圧を位相シフトに変換した後、適当なアルゴリズム又はルックアップテーブルを用いて位相シフトをヘマトクリット値に変換することにより、ヘマトクリット値を計算することができる。本開示の知見を得れば、当業者であれば、こうしたアルゴリズム及び/又はルックアップテーブルは、ストリップの幾何学形状(電極領域及び試料チャンバの体積を含む)及び信号周波数などの様々な因子を考慮して構成されることは認識されるであろう。
As described further below, the phase-shifting
全血試料のリアクタンスとその試料のヘマトクリット値との間には一定の関係が存在することが分かっている。体液試料(すなわち全血試料)の並列の容量性及び抵抗性要素としての電気的モデル化は、交流(AC)信号が体液試料を通じて強制的に流される場合、AC信号の位相シフトがAC電圧の周波数及び試料のヘマトクリット値の両方に依存することを示している。更に、このモデル化は、信号の周波数が約10kHz〜25kHzの範囲にある場合にはヘマトクリット値の位相シフトに対する影響は比較的小さく、信号の周波数が約250kHz〜500kHzの範囲にある場合に位相シフトに対する影響が最大となることを示している。したがって、体液試料のヘマトクリット値は、例えば、体液試料を通じて既知の周波数のAC信号を流し、その位相シフトを検出することによって測定することができる。例えば、10kHz〜25kHzの範囲の周波数を有する信号の位相シフトを、このようなヘマトクリット値測定における基準指示値として用いることができるのに対して、250kHz〜500kHzの範囲の周波数を有する信号の位相シフトを一次測定値として用いることができる。 It has been found that a certain relationship exists between the reactance of a whole blood sample and the hematocrit value of that sample. Electrical modeling as a parallel capacitive and resistive element of a bodily fluid sample (ie, a whole blood sample) is such that when an alternating current (AC) signal is forced through the bodily fluid sample, the phase shift of the AC signal is the AC voltage. It shows that it depends on both the frequency and the hematocrit value of the sample. Furthermore, this modeling has a relatively small effect on the phase shift of the hematocrit value when the signal frequency is in the range of about 10 kHz to 25 kHz, and the phase shift when the signal frequency is in the range of about 250 kHz to 500 kHz. It shows that the influence on is maximized. Therefore, the hematocrit value of a body fluid sample can be measured, for example, by flowing an AC signal of a known frequency through the body fluid sample and detecting the phase shift. For example, a phase shift of a signal having a frequency in the range of 10 kHz to 25 kHz can be used as a reference indication value in such hematocrit measurement, whereas a phase shift of a signal having a frequency in the range of 250 kHz to 500 kHz is used. Can be used as the primary measurement.
特に図11〜14を参照すると、信号生成サブブロック120は、任意の適当な信号生成ブロックであってよく、所望の周波数の方形波(0V〜Vref)を生成するように構成される。このような信号生成サブブロックは、必要に応じてマイクロコントローラブロック112に統合することができる。
With particular reference to FIGS. 11-14, the
信号生成サブブロック120により生成された信号は、方形波信号を所定の周波数の正弦波信号に変換するように構成されたデュアルローパスフィルタサブブロック122に伝送される。図12のデュアルLPFは、第1の周波数(10kHz〜25kHzの範囲の周波数など)の信号及び第2の周波数の信号(250kHz〜500kHzの範囲の周波数など)の両方を分析用検査ストリップ試料セルインタフェースサブブロック及び分析用検査ストリップの試料チャンバ(HCT測定セルとも呼ばれる)に供給するように構成されている。第1及び第2の周波数の選択は、図12のスイッチIC7を使用して実現される。図12のデュアルLPFは、高速の電圧フィードバック式CMOSオペアンプである部品番号OPA354としてTexas Instruments(Dallas,Texas,USA)より販売されるオペアンプなどの2つの適当なオペアンプ(IC4及びIC5)を有している。
The signal generated by the
図12を参照すると、F−DRVは、低又は高周波数(例えば25kHz又は250kHz)の方形波入力を表し、IC4及びIC5の両方に接続されている。信号Fi−高/低(マイクロコントローラからの)が、スイッチIC7を介してデュアルローパスフィルタサブブロック122の出力を選択する。図12のC5は、HCT測定セルからのデュアルローパスフィルタサブブロック122の作動電圧を遮断するように構成されている。
Referring to FIG. 12, F-DRV represents a low or high frequency (eg, 25 kHz or 250 kHz) square wave input and is connected to both IC4 and IC5. Signal Fi-high / low (from the microcontroller) selects the output of dual low
図12には、特定のデュアルLPFが示されているが、デュアルローパスフィルタサブブロック122は、例えば任意の適当な多重帰還型ローパスフィルタ又はサレンキー型ローパスフィルタを含む当業者には周知の任意の適当なローパスフィルタサブブロックとすることができる。
Although a particular dual LPF is shown in FIG. 12, the dual low-
ローパスフィルタサブブロック122によって生成される正弦波は分析用検査ストリップ試料セルインタフェースサブブロック124に伝送され、そこで分析用検査ストリップの試料セル(HCT測定セルとも呼ばれる)を通じて流される。分析用検査ストリップ試料セルインタフェースブロック124は、例えば、試料セル内に配置された分析用検査ストリップの第1の電極及び第2の電極を介して分析用検査ストリップの試料セルと機能的にインタフェースするように構成されたインタフェースブロックなどの任意の適当な試料セルインタフェースブロックであってよい。このような構成では、信号は、図14に示されるように、第1の電極を介して試料セルに(ローパスフィルタサブブロックから)流され、第2の電極を介して試料セルから(トランスインピーダンス増幅器サブブロックにより)拾うことができる。
The sine wave generated by the low
試料セルを通じて信号を流す事によって生成される信号は、トランスインピーダンス増幅器サブブロック128によって拾われ、位相検波器サブブロック130に伝送されるために電圧信号に変換される。
The signal generated by flowing the signal through the sample cell is picked up by the
トランスインピーダンスサブブロック128は、当業者には周知の任意の適当なトランスインピーダンスサブブロックであってよい。図13は、1つのこうしたトランスインピーダンス増幅器サブブロック(2つのOPA354オペアンプIC3及びIC9に基づく)の簡略化された注釈付きの概略ブロック図である。TIAサブブロック128の第1の段階は、例えば400mVで動作し、これによりAC振幅は±400mVに制限される。TIAサブブロック128の第2の段階はVref/2で動作するが、これはマイクロコントローラのA/D入力の完全なスパンでの出力の発生を可能とする形態である。TIAサブブロック128のC9は、AC正弦波信号のみの通過を可能とする遮断要素として機能する。
位相検波器サブブロック130は、キャプチャ機能を用いてマイクロコントローラ112によってリードバック可能なデジタル周波数、又はアナログデジタル変換器を用いてマイクロコントローラ112によってリードバック可能なアナログ電圧のいずれかを生成する任意の適当な位相検波器サブブロックであってよい。図14は、2つのこうした位相検波器サブブロック、すなわちXOR検波器サブブロック(図14の上半分にあり、IC22及びIC23を含む)及び直角位相DEMUX検波器サブブロック(図14の下半分にあり、IC12及びIC13を含む)を含む概略図を示している。
The
図14はまた、スイッチ(IC16)並びにダミー負荷R7及びC6を有する校正負荷ブロック126を示している。校正負荷ブロック126は、抵抗器R7によって生じる0°の既知の位相シフトに対する位相オフセットの動的測定を行うように構成されていることにより、校正に用いられる位相オフセットを与えるものである。C6は、例えば試料セルへの信号トレースの寄生容量によって引き起こされる位相遅れ、又は電気回路(LPF及びTIA)の位相遅れを補償するために、所定のわずかな位相シフトを強制的に生じるように構成されている。
FIG. 14 also shows a
図14の直角位相DEMUX位相検波器サブブロックは、入力されるAC信号の抵抗性部分としての1つの部分と、入力されるAC信号の反応性部分としての1つの部分の2つの部分を有している。このような2つの部分の使用により、AC信号の抵抗性及び反応性部分の両方の同時測定、並びに0°〜360°にわたる測定範囲が可能となる。図14の直角位相DEMUX回路は、2つの別々の出力電圧を発生する。これらの出力電圧の一方は「同位相測定」を表し、AC信号の「抵抗性」部分に比例し、他方の出力電圧は「直角位相測定」を表し、信号の「反応性」部分に比例する。位相シフトは下式として計算される。すなわち、
φ=tan−1(V直角位相/V同位相)
The quadrature DEMUX phase detector sub-block of FIG. 14 has two parts, one part as the resistive part of the incoming AC signal and one part as the reactive part of the incoming AC signal. ing. The use of such two parts allows simultaneous measurement of both the resistive and reactive parts of the AC signal and a measurement range ranging from 0 ° to 360 °. The quadrature DEMUX circuit of FIG. 14 generates two separate output voltages. One of these output voltages represents “in-phase measurement” and is proportional to the “resistive” portion of the AC signal, and the other output voltage represents “quadrature measurement” and is proportional to the “reactive” portion of the signal . The phase shift is calculated as: That is,
φ = tan −1 (V quadrature / V in- phase )
このような直角位相DEMUX位相検波器回路は、試料セル内の体液試料のインピーダンスを測定するために使用することもできる。束縛されずに仮説とするならば、インピーダンスを位相シフトとともに用いる又は位相シフトと独立して用いることによって体液試料のヘマトクリット値を決定することができるものと考えられる。試料セルを通じて流される信号の振幅は、以下のようにして直角位相DEMUX回路の2つの電圧出力を用いて計算することができる。すなわち、
振幅=SQR((V直角位相)2+(V同位相)2)
Such a quadrature DEMUX phase detector circuit can also be used to measure the impedance of a body fluid sample in a sample cell. If the hypothesis is not constrained, it is considered that the hematocrit value of the body fluid sample can be determined by using the impedance together with the phase shift or using it independently of the phase shift. The amplitude of the signal flowing through the sample cell can be calculated using the two voltage outputs of the quadrature DEMUX circuit as follows. That is,
Amplitude = SQR ((V quadrature ) 2 + (V in- phase ) 2 )
次いでこの振幅を、校正負荷ブロック126の既知の抵抗器について測定した振幅と比較することによってインピーダンスを求めることができる。
The impedance can then be determined by comparing this amplitude to the amplitude measured for a known resistor in the
「μCからの方形波入力」が正弦波と同位相であるか又は90°の位相シフトに設定されるかに応じてXOR位相検波器部分は、0°〜180°の測定範囲を有するか又は−90°〜+90°の測定範囲を有する。XOR位相検波器は、常に入力周波数の2倍の出力周波数を発生するが、デューティサイクルは異なる。両方の入力が完全に同位相である場合、出力はLOWであり、両方の出力が180°シフトしている場合には出力は常にHIGHである。出力信号を積分することにより(単純なRC素子により)、両方の入力間の位相シフトに正比例する電圧を発生させることができる。 Depending on whether the “square wave input from μC” is in phase with the sine wave or set to a 90 ° phase shift, the XOR phase detector part has a measurement range of 0 ° to 180 ° or It has a measurement range of -90 ° to + 90 °. XOR phase detectors always produce an output frequency that is twice the input frequency, but with a different duty cycle. If both inputs are completely in phase, the output is LOW, and if both outputs are shifted 180 °, the output is always HIGH. By integrating the output signal (with a simple RC element), a voltage can be generated that is directly proportional to the phase shift between both inputs.
本開示の知見を得れば、当業者であれば、本開示の実施形態に用いられる位相検波器サブブロックは任意の適当な形態を取りうるものであり、例えば、立ち上がりエッジ捕捉技術、デュアルエッジ捕捉技術、XOR技術、及び同期復調技術を用いた形態を含みうることは認識されるであろう。 With knowledge of the present disclosure, those skilled in the art can take any suitable form for the phase detector sub-block used in the embodiments of the present disclosure, such as rising edge capture technology, dual edge It will be appreciated that configurations using acquisition techniques, XOR techniques, and synchronous demodulation techniques may be included.
ローパスフィルタサブブロック122、トランスインピーダンス増幅器サブブロック128、及び位相検波器サブブロック130は、位相シフト式ヘマトクリット値測定ブロック114に残留位相シフトを導入しうることから、校正負荷ブロック126を必要に応じて位相シフト式ヘマトクリット値測定ブロックに含めることができる。校正負荷ブロック126は、基本的にその性状が抵抗性(例えば33kΩの負荷)であるように構成されており、したがって、励起電圧と発生される電流との間に位相シフトを導入しない。校正負荷ブロック126は、「ゼロ」校正指示値を与えるように回路上でスイッチが入れられるように構成されている。手持ち式検査計測器は校正された後、体液試料の位相シフトを測定し、「0」指示値を差し引くことによって補正された位相シフトを計算した後、この補正された位相シフトに基づいて体液試料ヘマトクリット値を計算することができる。
Since the low-
図15は、手持ち式検査計測器及び分析用検査ストリップ(例えば電気化学式分析用検査ストリップ)を使用するための方法200の各段階を示したフロー図である。方法200は、工程210において、分析用検査ストリップの試料セル内に全血試料を導入することを含む。
FIG. 15 is a flow diagram illustrating the steps of a
工程220において、試料セル内の全血試料の位相シフトが、手持ち式検査計測器の位相シフト式ヘマトクリット値測定ブロック及びマイクロコントローラブロックを用いて測定される。方法200は更に、マイクロコントローラブロックを用いて測定された位相シフトに基づいて全血試料のヘマトクリット値を計算することを更に含む(図15の工程230を参照)。
In
本開示の知見を得れば、当業者であれば、方法200を含む本開示の実施形態に基づく方法は、本開示の実施形態に基づいた、本明細書に述べられる手持ち式検査計測器の技術、利点、及び特徴のいずれをも取り入れるように容易に改変することが可能であることは認識されるであろう。例えば、必要に応じて、導入された体液試料中の検体を、分析用検査ストリップ、手持ち式検査計測器、及び計算されたヘマトクリット値を用いて決定することができる。
With the knowledge of the present disclosure, one of ordinary skill in the art will be able to use the methods of the hand-held inspection instrument described herein based on the embodiments of the present disclosure, including the
Claims (11)
該少なくとも2つの電極のいずれか1つに生理学的試料を付着させることによって検体検査シーケンスを開始する工程と、
該試料に第1の信号を印加することにより試料のヘマトクリット値を含む物理的特性を導出する工程と、
該試料に、該検査シーケンスと重なり合う第1のサンプリング持続時間にわたって第2の信号を流すことにより、該試料から、該第1のサンプリング持続時間における時間及び大きさの両方と相関した第1の過渡信号出力を得る工程と、
該試料の物理的特性に基づいて、該第1のサンプリング持続時間内で検査シーケンスの間の特定のサンプリング時間を抽出する工程と、
第2のサンプリング持続時間にわたって該第1の過渡信号から第2の過渡信号を得る工程と、
該第2のサンプリング持続時間内の選択された時間間隔における該第2の過渡信号のそれぞれの大きさを導出する工程と、
該選択された時間間隔における該第2の過渡信号のそれぞれの大きさに基づいて検体濃度を決定する工程と、を含み、
前記第2のサンプリング持続時間が前記第1のサンプリング持続時間と重なり合うように前記特定のサンプリング時間に基づいて該第2のサンプリング持続時間を規定する工程と、
前記第2の過渡信号を該第2のサンプリング持続時間に対して別個の時間間隔に分割する工程と、を更に含み、
該第2の過渡信号が該第2のサンプリング持続時間に対して参照され、
前記分割する工程が、前記第2の過渡信号を、概ね開始時間における時間間隔1から概ね終了時間における時間間隔22までの少なくとも22個の時間間隔に順次分割することを含み、
前記検体濃度の決定が、以下の形の式:
Gは、検体濃度を表し、
I 1 は、時間間隔17における第2の過渡信号の大きさにほぼ等しく、
I 2 は、時間間隔13における第2の過渡信号の大きさにほぼ等しく、
I 3 は、時間間隔5における第2の過渡信号の大きさにほぼ等しく、
I 4 は、時間間隔3における第2の過渡信号の大きさにほぼ等しく、
I 5 は、時間間隔22における第2の過渡信号の大きさにほぼ等しく、
x 1 は、0.75にほぼ等しく、
x 2 は、337.27にほぼ等しく、
x 3 は、(−)16.81にほぼ等しく、
x 4 は、1.41にほぼ等しく、
x 5 は、2.67にほぼ等しいか、又は、
検体濃度の決定が、以下の形の式:
Gは、検体濃度を表し、
I 1 は、時間間隔11における第2の過渡信号の大きさにほぼ等しく、
I 2 は、時間間隔7における第2の過渡信号の大きさにほぼ等しく、
x 1 は、0.59にほぼ等しく、
x 2 は、2.51にほぼ等しく、
x 3 は、(−)12.74にほぼ等しく、
x 4 は、(−)188.31にほぼ等しく、
x 5 は、9.2に等しいか、又は、
検体濃度の決定が、以下の形の式:
Gは、検体濃度を表し、
I 1 は、時間間隔20における第2の過渡信号の大きさにほぼ等しく、
I 2 は、時間間隔22における第2の過渡信号の大きさにほぼ等しく、
I 3 は、時間間隔19における第2の過渡信号の大きさにほぼ等しく、
x 1 は、20.15にほぼ等しく、
x 2 は、1.0446にほぼ等しく、
x 3 は、0.95にほぼ等しく、
x 4 は、1.39にほぼ等しく、
x 5 は、(−)0.71にほぼ等しく、
x 6 は、0.11にほぼ等しいか、又は、
検体濃度の決定が、以下の形の式:
Gは、検体濃度を表し、
I 1 は、時間間隔5における第2の過渡信号の大きさにほぼ等しく、
I 2 は、時間間隔1における第2の過渡信号の大きさにほぼ等しく、
I 3 は、時間間隔2における第2の過渡信号の大きさにほぼ等しく、
I 4 は、時間間隔10における第2の過渡信号の大きさにほぼ等しく、
I 5 は、時間間隔22における第2の過渡信号の大きさにほぼ等しく、
x 1 は、0.70にほぼ等しく、
x 2 は、0.49にほぼ等しく、
x 3 は、28.59にほぼ等しく、
x 4 は、0.7にほぼ等しく、
x 5 は、15.51に等しいか、又は、
検体濃度の決定が、以下の形の式:
Gは、検体濃度を表し、
I 1 は、時間間隔19における第2の過渡信号の大きさにほぼ等しく、
I 2 は、時間間隔16における第2の過渡信号の大きさにほぼ等しく、
I 3 は、時間間隔11における第2の過渡信号の大きさにほぼ等しく、
I 4 は、時間間隔5における第2の過渡信号の大きさにほぼ等しく、
x 1 は、(−)1.68にほぼ等しく、
x 2 は、0.95にほぼ等しく、
x 3 は、(−)4.97にほぼ等しく、
x 4 は、6.29にほぼ等しく、
x 5 は、3.08にほぼ等しく、
x 6 は、(−)5.84にほぼ等しく、
x 7 は、(−)0.47にほぼ等しく、
x 8 は、0.01に等しいか、又は、
検体濃度の決定が、以下の形の式:
Gは、検体濃度を表し、
I 1 は、時間間隔16における第2の過渡信号の大きさにほぼ等しく、
I 2 は、時間間隔5における第2の過渡信号の大きさにほぼ等しく、
I 3 は、時間間隔12における第2の過渡信号の大きさにほぼ等しく、
I 4 は、時間間隔14における第2の過渡信号の大きさにほぼ等しく、
x 1 は、1.18にほぼ等しく、
x 2 は、0.97にほぼ等しく、
x 3 は、(−)11.32にほぼ等しく、
x 4 は、38.76にほぼ等しく、
x 5 は、(−)39.32にほぼ等しく、
x 6 は、0.0928にほぼ等しく、
x 7 は、(−)0.85にほぼ等しく、
x 8 は、1.75にほぼ等しく、
x 9 は、(−)9.38にほぼ等しく、
x 10 は、0.25にほぼ等しい、方法。 A method for determining an analyte concentration comprising glucose from a physiological sample by a biosensor having at least two electrodes and a reagent disposed on at least one of the electrodes, comprising:
Initiating an analyte test sequence by attaching a physiological sample to any one of the at least two electrodes;
Deriving a physical characteristic including a hematocrit value of the sample by applying a first signal to the sample;
By passing a second signal through the sample over a first sampling duration that overlaps the test sequence, a first transient correlated from both time and magnitude in the first sampling duration from the sample. Obtaining a signal output;
Extracting a specific sampling time during a test sequence within the first sampling duration based on the physical properties of the sample;
Obtaining a second transient signal from the first transient signal over a second sampling duration;
Deriving the magnitude of each of the second transient signals at a selected time interval within the second sampling duration;
Determining an analyte concentration based on the magnitude of each of the second transient signals in the selected time interval;
Defining the second sampling duration based on the specific sampling time such that the second sampling duration overlaps with the first sampling duration;
Dividing the second transient signal into separate time intervals for the second sampling duration;
The second transient signal is referenced to the second sampling duration ;
The step of dividing comprises sequentially dividing the second transient signal into at least 22 time intervals from a time interval 1 at approximately a start time to a time interval 22 at approximately an end time;
The determination of the analyte concentration is a formula of the form:
G represents the analyte concentration,
I 1 is approximately equal to the magnitude of the second transient signal in time interval 17;
I 2 is approximately equal to the magnitude of the second transient signal in time interval 13;
I 3 is approximately equal to the magnitude of the second transient signal in time interval 5;
I 4 is approximately equal to the magnitude of the second transient signal in time interval 3;
I 5 is approximately equal to the magnitude of the second transient signal in time interval 22;
x 1 is approximately equal to 0.75,
x 2 is approximately equal to 337.27,
x 3 is approximately equal to (−) 16.81,
x 4 is approximately equal to 1.41,
x 5 is approximately equal to 2.67, or
The determination of the analyte concentration is a formula of the form:
G represents the analyte concentration,
I 1 is approximately equal to the magnitude of the second transient signal in time interval 11;
I 2 is approximately equal to the magnitude of the second transient signal in time interval 7;
x 1 is approximately equal to 0.59,
x 2 is approximately equal to 2.51,
x 3 is approximately equal to (−) 12.74,
x 4 is (-) approximately equal to 188.31,
x 5 is equal to 9.2 or
The determination of the analyte concentration is a formula of the form:
G represents the analyte concentration,
I 1 is approximately equal to the magnitude of the second transient signal in time interval 20;
I 2 is approximately equal to the magnitude of the second transient signal in time interval 22;
I 3 is approximately equal to the magnitude of the second transient signal in time interval 19;
x 1 is approximately equal to 20.15,
x 2 is approximately equal to 1.0446,
x 3 is approximately equal to 0.95,
x 4 is approximately equal to 1.39,
x 5 is approximately equal to (−) 0.71;
x 6 is approximately equal to 0.11, or
The determination of the analyte concentration is a formula of the form:
G represents the analyte concentration,
I 1 is approximately equal to the magnitude of the second transient signal in time interval 5;
I 2 is approximately equal to the magnitude of the second transient signal in time interval 1;
I 3 is approximately equal to the magnitude of the second transient signal in time interval 2;
I 4 is approximately equal to the magnitude of the second transient signal in time interval 10;
I 5 is approximately equal to the magnitude of the second transient signal in time interval 22;
x 1 is approximately equal to 0.70,
x 2 is approximately equal to 0.49,
x 3 is approximately equal to 28.59,
x 4 is approximately equal to 0.7,
x 5 is equal to 15.51, or
The determination of the analyte concentration is a formula of the form:
G represents the analyte concentration,
I 1 is approximately equal to the magnitude of the second transient signal in time interval 19;
I 2 is approximately equal to the magnitude of the second transient signal in time interval 16;
I 3 is approximately equal to the magnitude of the second transient signal in time interval 11;
I 4 is approximately equal to the magnitude of the second transient signal in time interval 5;
x 1 is approximately equal to (−) 1.68,
x 2 is approximately equal to 0.95,
x 3 is approximately equal to (−) 4.97,
x 4 is approximately equal to 6.29,
x 5 is approximately equal to 3.08,
x 6 is approximately equal to (−) 5.84,
x 7 is approximately equal to (−) 0.47,
x 8 is equal to 0.01, or
The determination of the analyte concentration is a formula of the form:
G represents the analyte concentration,
I 1 is approximately equal to the magnitude of the second transient signal in time interval 16;
I 2 is approximately equal to the magnitude of the second transient signal in time interval 5;
I 3 is approximately equal to the magnitude of the second transient signal in time interval 12;
I 4 is approximately equal to the magnitude of the second transient signal in time interval 14;
x 1 is approximately equal to 1.18,
x 2 is approximately equal to 0.97,
x 3 is approximately equal to (−) 11.32.
x 4 is approximately equal to 38.76,
x 5 is approximately equal to (−) 39.32;
x 6 is approximately equal to 0.0928,
x 7 is (-) approximately equal to 0.85,
x 8 is approximately equal to 1.75,
x 9 is approximately equal to (−) 9.38,
x 10 is approximately equal to 0.25, method.
特定のサンプリング時間=x1Hx2+x3
を用いることを含み、式中、
「特定のサンプリング時間」は、バイオセンサの出力信号をサンプリングする検査シーケンスの開始からの時点として指定され、
Hは、試料の物理的特性を表し、
x1は、約4.3e5であり、
x2は、約(−)3.9であり、
x3は、約4.8である、請求項3に記載の方法。 The step of calculating the specified specific sampling time is an expression of the form:
Specific sampling time = x 1 H x 2 + x 3
Using the formula:
The “specific sampling time” is designated as the point in time from the start of the test sequence that samples the biosensor output signal,
H represents the physical properties of the sample,
x 1 is about 4.3e5;
x 2 is about (−) 3.9,
x 3 is about 4.8 The method of claim 3.
該第1の周波数が該第2の周波数よりも少なくとも1桁低く、かつ/又は、場合により、
該第1の周波数が約10kHz〜約250kHzの範囲の任意の周波数を含む、請求項8に記載の方法。 The step of applying includes flowing first and second alternating signals at different respective frequencies, wherein the first frequency has a lower frequency than the second frequency;
The first frequency is at least an order of magnitude lower than the second frequency and / or, in some cases,
The method of claim 8 , wherein the first frequency comprises any frequency in the range of about 10 kHz to about 250 kHz.
Applications Claiming Priority (11)
| Application Number | Priority Date | Filing Date | Title |
|---|---|---|---|
| US201161581087P | 2011-12-29 | 2011-12-29 | |
| US201161581099P | 2011-12-29 | 2011-12-29 | |
| US201161581100P | 2011-12-29 | 2011-12-29 | |
| US201161581089P | 2011-12-29 | 2011-12-29 | |
| US61/581,087 | 2011-12-29 | ||
| US61/581,099 | 2011-12-29 | ||
| US61/581,100 | 2011-12-29 | ||
| US61/581,089 | 2011-12-29 | ||
| US201261654013P | 2012-05-31 | 2012-05-31 | |
| US61/654,013 | 2012-05-31 | ||
| PCT/GB2012/053277 WO2013098564A1 (en) | 2011-12-29 | 2012-12-28 | Accurate analyte measurements for electrochemical test strip based on multiple discrete measurements defined by sensed physical characteristic(s) of the sample containing the analyte |
Publications (2)
| Publication Number | Publication Date |
|---|---|
| JP2015503742A JP2015503742A (en) | 2015-02-02 |
| JP6282229B2 true JP6282229B2 (en) | 2018-02-21 |
Family
ID=47505268
Family Applications (3)
| Application Number | Title | Priority Date | Filing Date |
|---|---|---|---|
| JP2014549534A Expired - Fee Related JP6101285B2 (en) | 2011-12-29 | 2012-12-28 | Accurate measurement of an analyte in an electrochemical test strip based on the sensed physical properties of a sample containing the analyte |
| JP2014549535A Expired - Fee Related JP6282229B2 (en) | 2011-12-29 | 2012-12-28 | Accurate analyte measurement of electrochemical test strips based on multiple discrete measurements defined by the sensed physical properties of the sample, including the analyte |
| JP2014549536A Pending JP2015503743A (en) | 2011-12-29 | 2012-12-28 | Accurate analyte measurement in electrochemical test strips based on sensed physical properties of the analyte-containing sample and derived biosensor parameters |
Family Applications Before (1)
| Application Number | Title | Priority Date | Filing Date |
|---|---|---|---|
| JP2014549534A Expired - Fee Related JP6101285B2 (en) | 2011-12-29 | 2012-12-28 | Accurate measurement of an analyte in an electrochemical test strip based on the sensed physical properties of a sample containing the analyte |
Family Applications After (1)
| Application Number | Title | Priority Date | Filing Date |
|---|---|---|---|
| JP2014549536A Pending JP2015503743A (en) | 2011-12-29 | 2012-12-28 | Accurate analyte measurement in electrochemical test strips based on sensed physical properties of the analyte-containing sample and derived biosensor parameters |
Country Status (13)
| Country | Link |
|---|---|
| US (5) | US9903830B2 (en) |
| EP (6) | EP3156787A1 (en) |
| JP (3) | JP6101285B2 (en) |
| KR (2) | KR102031010B1 (en) |
| CN (4) | CN108037165A (en) |
| AU (3) | AU2012327229B2 (en) |
| BR (3) | BR112014016313A8 (en) |
| CA (3) | CA2861752C (en) |
| ES (3) | ES2774444T3 (en) |
| HK (3) | HK1203618A1 (en) |
| RU (3) | RU2632274C2 (en) |
| TW (3) | TWI625521B (en) |
| WO (3) | WO2013098565A1 (en) |
Families Citing this family (34)
| Publication number | Priority date | Publication date | Assignee | Title |
|---|---|---|---|---|
| US9157883B2 (en) | 2013-03-07 | 2015-10-13 | Lifescan Scotland Limited | Methods and systems to determine fill direction and fill error in analyte measurements |
| US9274098B2 (en) | 2013-04-30 | 2016-03-01 | Lifescan Scotland Limited | Analyte meter digital sample detection |
| JP5813171B2 (en) * | 2013-05-02 | 2015-11-17 | アークレイ株式会社 | Analytical tool, manufacturing method thereof, and measuring device using the same |
| US10371660B2 (en) | 2013-05-17 | 2019-08-06 | Lifescan Ip Holdings, Llc | Accurate analyte measurements for electrochemical test strip based on multiple calibration parameters |
| US9435762B2 (en) * | 2013-06-27 | 2016-09-06 | Lifescan Scotland Limited | Fill error trap for an analyte measurement determined from a specified sampling time derived from a sensed physical characteristic of the sample containing the analyte |
| US9710604B2 (en) | 2013-06-27 | 2017-07-18 | Lifescan, Inc. | Analyte meter with operational range configuration technique |
| US9835578B2 (en) | 2013-06-27 | 2017-12-05 | Lifescan Scotland Limited | Temperature compensation for an analyte measurement determined from a specified sampling time derived from a sensed physical characteristic of the sample containing the analyte |
| US9435764B2 (en) * | 2013-06-27 | 2016-09-06 | Lifescan Scotland Limited | Transient signal error trap for an analyte measurement determined from a specified sampling time derived from a sensed physical characteristic of the sample containing the analyte |
| US9243276B2 (en) * | 2013-08-29 | 2016-01-26 | Lifescan Scotland Limited | Method and system to determine hematocrit-insensitive glucose values in a fluid sample |
| US9459231B2 (en) * | 2013-08-29 | 2016-10-04 | Lifescan Scotland Limited | Method and system to determine erroneous measurement signals during a test measurement sequence |
| US9459232B2 (en) * | 2013-09-05 | 2016-10-04 | Lifescan Scotland Limited | Method and system to determine erroneous measurement signals during a test measurement sequence |
| US9828621B2 (en) * | 2013-09-10 | 2017-11-28 | Lifescan Scotland Limited | Anomalous signal error trap for an analyte measurement determined from a specified sampling time derived from a sensed physical characteristic of the sample containing the analyte |
| US20150118689A1 (en) * | 2013-10-24 | 2015-04-30 | Quidel Corporation | Systems and methods for whole blood assays |
| US9442089B2 (en) | 2013-12-23 | 2016-09-13 | Lifescan Scotland Limited | Analyte meter test strip detection |
| US9453812B2 (en) * | 2014-06-24 | 2016-09-27 | Lifescan Scotland Limited | End-fill electrochemical-based analytical test strip with perpendicular intersecting sample-receiving chambers |
| US20160091450A1 (en) * | 2014-09-25 | 2016-03-31 | Lifescan Scotland Limited | Accurate analyte measurements for electrochemical test strip to determine analyte measurement time based on measured temperature, physical characteristic and estimated analyte value and their temperature compensated values |
| US20160091451A1 (en) | 2014-09-25 | 2016-03-31 | Lifescan Scotland Limited | Accurate analyte measurements for electrochemical test strip to determine analyte measurement time based on measured temperature, physical characteristic and estimated analyte value |
| CA3123430A1 (en) | 2014-11-03 | 2016-05-12 | F. Hoffmann-La Roche Ag | Electrode arrangements for electrochemical test elements and methods of use thereof |
| MX2017008652A (en) * | 2014-12-31 | 2018-05-22 | Trividia Health Inc | Glucose test strip with interference correction. |
| US9423374B2 (en) | 2015-01-26 | 2016-08-23 | Lifescan Scotland Limited | Reference electrode error trap determined from a specified sampling time and a pre-determined sampling time |
| US9904890B2 (en) * | 2015-03-13 | 2018-02-27 | Instrumentation Laboratory Company | Detecting a transient error in a body fluid sample |
| CN106370715A (en) * | 2015-07-21 | 2017-02-01 | 天津亿朋医疗器械有限公司 | Blood component analysis method and blood component analysis apparatus |
| CN105259320A (en) * | 2015-11-30 | 2016-01-20 | 中山市捷信科技服务有限公司 | Biosensor dividing device |
| JP6920305B2 (en) * | 2015-12-28 | 2021-08-18 | ライフスキャン・スコットランド・リミテッド | Electrochemical analytical test strips with electrode voltage sensing connections and handheld test meters for use with the strips |
| WO2017187212A1 (en) | 2016-04-28 | 2017-11-02 | 77 Elektronika Müszeripari Kft. | Data processing method for blood glucose measuring, blood glucose meter, blood glucose measurement system, and computer program and data carrier therefor |
| RU2645907C1 (en) * | 2016-09-07 | 2018-02-28 | Общество с ограниченной ответственностью "Рикомед" | Viscosity of environment as tool to control end of immunochromatographic test systems detection |
| TWI696829B (en) * | 2016-10-27 | 2020-06-21 | 財團法人工業技術研究院 | Method of testing blood |
| EP3516557A4 (en) * | 2016-10-28 | 2020-05-27 | Hewlett-Packard Development Company, L.P. | Target class feature model |
| CN109142499B (en) * | 2017-06-16 | 2021-10-08 | 中国石油化工股份有限公司 | In-situ micro-area isotope dating device and method |
| US11237125B2 (en) * | 2017-07-17 | 2022-02-01 | Hewlett-Packard Development Company, L.P. | Determining hematocrit level of a blood sample |
| KR102179203B1 (en) * | 2018-07-09 | 2020-11-16 | 주식회사 필로시스 | Device and method to determine blood glucose sensing data |
| KR102102988B1 (en) * | 2019-03-28 | 2020-04-22 | 주식회사 엘지화학 | Immunoassay device and immunoassay method |
| EP4118439A4 (en) * | 2020-03-10 | 2024-03-13 | Stratuscent Inc | Systems and methods for detecting a sensing event in a stream of chemical sensor measurement data |
| WO2024036405A1 (en) * | 2022-08-18 | 2024-02-22 | Eye3Concepts Inc. | Method of sensing an analyte using machine learning |
Family Cites Families (117)
| Publication number | Priority date | Publication date | Assignee | Title |
|---|---|---|---|---|
| DE3228542A1 (en) | 1982-07-30 | 1984-02-02 | Siemens AG, 1000 Berlin und 8000 München | METHOD FOR DETERMINING THE CONCENTRATION OF ELECTROCHEMICALLY IMPLEMENTABLE SUBSTANCES |
| US5001048A (en) | 1987-06-05 | 1991-03-19 | Aurthur D. Little, Inc. | Electrical biosensor containing a biological receptor immobilized and stabilized in a protein film |
| US5243516A (en) | 1989-12-15 | 1993-09-07 | Boehringer Mannheim Corporation | Biosensing instrument and method |
| US5508203A (en) | 1993-08-06 | 1996-04-16 | Fuller; Milton E. | Apparatus and method for radio frequency spectroscopy using spectral analysis |
| US5792668A (en) | 1993-08-06 | 1998-08-11 | Solid State Farms, Inc. | Radio frequency spectral analysis for in-vitro or in-vivo environments |
| US5437999A (en) | 1994-02-22 | 1995-08-01 | Boehringer Mannheim Corporation | Electrochemical sensor |
| US5536249A (en) | 1994-03-09 | 1996-07-16 | Visionary Medical Products, Inc. | Pen-type injector with a microprocessor and blood characteristic monitor |
| DE4422068A1 (en) | 1994-06-23 | 1996-01-04 | Siemens Ag | Electro-catalytic glucose sensor in catheter form |
| US5429735A (en) | 1994-06-27 | 1995-07-04 | Miles Inc. | Method of making and amperometric electrodes |
| AUPN363995A0 (en) | 1995-06-19 | 1995-07-13 | Memtec Limited | Electrochemical cell |
| US6413410B1 (en) | 1996-06-19 | 2002-07-02 | Lifescan, Inc. | Electrochemical cell |
| US6863801B2 (en) | 1995-11-16 | 2005-03-08 | Lifescan, Inc. | Electrochemical cell |
| AUPN661995A0 (en) | 1995-11-16 | 1995-12-07 | Memtec America Corporation | Electrochemical cell 2 |
| US6241862B1 (en) | 1996-02-14 | 2001-06-05 | Inverness Medical Technology, Inc. | Disposable test strips with integrated reagent/blood separation layer |
| US5708247A (en) | 1996-02-14 | 1998-01-13 | Selfcare, Inc. | Disposable glucose test strips, and methods and compositions for making same |
| US6517482B1 (en) | 1996-04-23 | 2003-02-11 | Dermal Therapy (Barbados) Inc. | Method and apparatus for non-invasive determination of glucose in body fluids |
| AUPO581397A0 (en) | 1997-03-21 | 1997-04-17 | Memtec America Corporation | Sensor connection means |
| US6391645B1 (en) | 1997-05-12 | 2002-05-21 | Bayer Corporation | Method and apparatus for correcting ambient temperature effect in biosensors |
| US6001239A (en) | 1998-09-30 | 1999-12-14 | Mercury Diagnostics, Inc. | Membrane based electrochemical test device and related methods |
| US8071384B2 (en) | 1997-12-22 | 2011-12-06 | Roche Diagnostics Operations, Inc. | Control and calibration solutions and methods for their use |
| US7407811B2 (en) * | 1997-12-22 | 2008-08-05 | Roche Diagnostics Operations, Inc. | System and method for analyte measurement using AC excitation |
| US7494816B2 (en) * | 1997-12-22 | 2009-02-24 | Roche Diagnostic Operations, Inc. | System and method for determining a temperature during analyte measurement |
| JP3260739B2 (en) | 1997-12-22 | 2002-02-25 | ロシュ ダイアグノスティックス コーポレーション | Apparatus and method for determining the concentration of a medically significant component of a biological fluid |
| US7390667B2 (en) | 1997-12-22 | 2008-06-24 | Roche Diagnostics Operations, Inc. | System and method for analyte measurement using AC phase angle measurements |
| US6006119A (en) | 1998-02-04 | 1999-12-21 | Polestar Technologies, Inc. | Non-invasive optical measurement of blood hematocrit |
| DE69920006T2 (en) | 1998-05-20 | 2005-09-15 | Arkray, Inc. | METHOD AND DEVICE FOR ELECTROCHEMICAL MEASUREMENTS USING STATISTICAL METHODS |
| US6475372B1 (en) | 2000-02-02 | 2002-11-05 | Lifescan, Inc. | Electrochemical methods and devices for use in the determination of hematocrit corrected analyte concentrations |
| KR100340174B1 (en) * | 1999-04-06 | 2002-06-12 | 이동준 | Electrochemical Biosensor Test Strip, Fabrication Method Thereof and Electrochemical Biosensor |
| US6287451B1 (en) | 1999-06-02 | 2001-09-11 | Handani Winarta | Disposable sensor and method of making |
| US6193873B1 (en) | 1999-06-15 | 2001-02-27 | Lifescan, Inc. | Sample detection to initiate timing of an electrochemical assay |
| US6264614B1 (en) | 1999-08-31 | 2001-07-24 | Data Critical Corporation | System and method for generating and transferring medical data |
| US6716577B1 (en) | 2000-02-02 | 2004-04-06 | Lifescan, Inc. | Electrochemical test strip for use in analyte determination |
| US6733655B1 (en) | 2000-03-08 | 2004-05-11 | Oliver W. H. Davies | Measurement of substances in liquids |
| RU2267120C2 (en) * | 2000-07-14 | 2005-12-27 | Лайфскен, Инк. | Electrochemical mode of measuring of speed of chemical reactions |
| EP2388586B1 (en) | 2000-11-30 | 2018-01-10 | Panasonic Healthcare Holdings Co., Ltd. | Method of quantifying substrate |
| CN1471373A (en) | 2001-02-05 | 2004-01-28 | ��³��ɭ˹��˾ | Methods of determining concentration of glucose in blood |
| US6767441B1 (en) | 2001-07-31 | 2004-07-27 | Nova Biomedical Corporation | Biosensor with peroxidase enzyme |
| US7277679B1 (en) | 2001-09-28 | 2007-10-02 | Arraycomm, Llc | Method and apparatus to provide multiple-mode spatial processing to a terminal unit |
| US7018843B2 (en) | 2001-11-07 | 2006-03-28 | Roche Diagnostics Operations, Inc. | Instrument |
| US6749887B1 (en) | 2001-11-28 | 2004-06-15 | Lifescan, Inc. | Solution drying system |
| US6872299B2 (en) * | 2001-12-10 | 2005-03-29 | Lifescan, Inc. | Passive sample detection to initiate timing of an assay |
| KR100475634B1 (en) | 2001-12-24 | 2005-03-15 | 주식회사 아이센스 | Biosensor equipped with sample introducing part which enables quick introduction of a small amount of sample |
| JP2005518527A (en) | 2002-02-10 | 2005-06-23 | アガマトリックス, インコーポレイテッド | Methods and apparatus for assays for electrochemical properties |
| US7050847B2 (en) | 2002-03-26 | 2006-05-23 | Stig Ollmar | Non-invasive in vivo determination of body fluid parameter |
| AU2003234944A1 (en) | 2002-08-27 | 2004-03-18 | Bayer Healthcare, Llc | Methods of Determining Glucose Concentration in Whole Blood Samples |
| US7291256B2 (en) | 2002-09-12 | 2007-11-06 | Lifescan, Inc. | Mediator stabilized reagent compositions and methods for their use in electrochemical analyte detection assays |
| EP1447665B1 (en) | 2003-02-11 | 2016-06-29 | Bayer HealthCare LLC | Method for reducing effect of hematocrit on measurement of an analyte in whole blood |
| CN1697970A (en) | 2003-02-21 | 2005-11-16 | 松下电器产业株式会社 | Measuring instrument for biosensor and measuring method using same |
| US7597793B2 (en) | 2003-06-20 | 2009-10-06 | Roche Operations Ltd. | System and method for analyte measurement employing maximum dosing time delay |
| US8148164B2 (en) | 2003-06-20 | 2012-04-03 | Roche Diagnostics Operations, Inc. | System and method for determining the concentration of an analyte in a sample fluid |
| US7645373B2 (en) | 2003-06-20 | 2010-01-12 | Roche Diagnostic Operations, Inc. | System and method for coding information on a biosensor test strip |
| US7645421B2 (en) | 2003-06-20 | 2010-01-12 | Roche Diagnostics Operations, Inc. | System and method for coding information on a biosensor test strip |
| US7452457B2 (en) | 2003-06-20 | 2008-11-18 | Roche Diagnostics Operations, Inc. | System and method for analyte measurement using dose sufficiency electrodes |
| US7488601B2 (en) | 2003-06-20 | 2009-02-10 | Roche Diagnostic Operations, Inc. | System and method for determining an abused sensor during analyte measurement |
| PL1639354T3 (en) | 2003-06-20 | 2018-11-30 | F.Hoffmann-La Roche Ag | Test strip with slot vent opening |
| US7718439B2 (en) | 2003-06-20 | 2010-05-18 | Roche Diagnostics Operations, Inc. | System and method for coding information on a biosensor test strip |
| US7604721B2 (en) | 2003-06-20 | 2009-10-20 | Roche Diagnostics Operations, Inc. | System and method for coding information on a biosensor test strip |
| SE0303249D0 (en) | 2003-12-02 | 2003-12-02 | Inst Polymerutveckling Ab | Hematocrit and analyte concentration determination |
| CN100432663C (en) | 2003-12-04 | 2008-11-12 | 松下电器产业株式会社 | Hematocrit(hct) measuring method, sensor used for same, and measuring instrument |
| JP5011100B2 (en) | 2004-03-31 | 2012-08-29 | バイエル・ヘルスケア・エルエルシー | Method and apparatus for implementing threshold-based correction functions for biosensors |
| EP1742045B1 (en) | 2004-04-19 | 2016-11-02 | Panasonic Healthcare Holdings Co., Ltd. | Method for measuring blood components and biosensor and measuring instrument for use therein |
| WO2005114164A2 (en) | 2004-05-14 | 2005-12-01 | Bayer Healthcare Llc | Voltammetric systems for assaying biological analytes |
| US7972861B2 (en) * | 2004-05-14 | 2011-07-05 | Bayer Healthcare Llc | Methods for performing hematocrit adjustment in glucose assays and devices for same |
| TWI293307B (en) | 2004-09-30 | 2008-02-11 | Ind Tech Res Inst | A liver-specific chimeric regulatory sequence and use thereof |
| JP2008516352A (en) | 2004-10-13 | 2008-05-15 | シーメンス アクチエンゲゼルシヤフト | Apparatus and method for lighting simulation and shadow simulation in augmented reality system |
| US20060113187A1 (en) | 2004-11-22 | 2006-06-01 | Deng David Z | Biosensors comprising semiconducting electrodes or ruthenium containing mediators and method of using the same |
| EP1831685A1 (en) | 2004-12-29 | 2007-09-12 | Lifescan Scotland Ltd | Analyte measurement meter or system incorporating an improved measurement circuit |
| US7964089B2 (en) | 2005-04-15 | 2011-06-21 | Agamatrix, Inc. | Analyte determination method and analyte meter |
| US7645374B2 (en) | 2005-04-15 | 2010-01-12 | Agamatrix, Inc. | Method for determination of analyte concentrations and related apparatus |
| US7468125B2 (en) * | 2005-10-17 | 2008-12-23 | Lifescan, Inc. | System and method of processing a current sample for calculating a glucose concentration |
| US8066866B2 (en) * | 2005-10-17 | 2011-11-29 | Lifescan, Inc. | Methods for measuring physiological fluids |
| DK1804048T3 (en) | 2005-12-30 | 2010-09-06 | Sclumberger Technology B V | Density and viscosity sensor |
| US7462759B2 (en) | 2006-02-03 | 2008-12-09 | Pioneer Hi-Bred International, Inc. | Brittle stalk 2 gene family and related methods and uses |
| JP5039062B2 (en) | 2006-02-27 | 2012-10-03 | バイエル・ヘルスケア・エルエルシー | Temperature-corrected analyte determination in a biosensor system |
| US8163162B2 (en) | 2006-03-31 | 2012-04-24 | Lifescan, Inc. | Methods and apparatus for analyzing a sample in the presence of interferents |
| US20070235346A1 (en) * | 2006-04-11 | 2007-10-11 | Popovich Natasha D | System and methods for providing corrected analyte concentration measurements |
| CA2656952C (en) | 2006-07-05 | 2014-09-23 | Panasonic Corporation | Liquid sample measurement method and apparatus |
| US20080083618A1 (en) * | 2006-09-05 | 2008-04-10 | Neel Gary T | System and Methods for Determining an Analyte Concentration Incorporating a Hematocrit Correction |
| JP5395665B2 (en) | 2006-09-22 | 2014-01-22 | バイエル・ヘルスケア・エルエルシー | Biosensor system with improved stability and hematocrit performance |
| EP2437056B1 (en) | 2006-10-05 | 2013-11-20 | Lifescan Scotland Ltd | Methods for determining the presence of a sufficient quantity of fluid sample on a test strip |
| WO2008049075A2 (en) | 2006-10-18 | 2008-04-24 | Agamatrix, Inc. | Electrochemical determination of analytes |
| WO2008047842A1 (en) | 2006-10-19 | 2008-04-24 | Panasonic Corporation | Method for measuring hematocrit value of blood sample, method for measuring concentration of analyte in blood sample, sensor chip and sensor unit |
| US8409424B2 (en) | 2006-12-19 | 2013-04-02 | Apex Biotechnology Corp. | Electrochemical test strip, electrochemical test system, and measurement method using the same |
| US20090007947A1 (en) * | 2006-12-22 | 2009-01-08 | Angela Spangenberg | Portable weather shielding canopy |
| TW200844436A (en) | 2007-01-23 | 2008-11-16 | Arkray Inc | Method of distinguishing control liquid and analysis device |
| US7751864B2 (en) | 2007-03-01 | 2010-07-06 | Roche Diagnostics Operations, Inc. | System and method for operating an electrochemical analyte sensor |
| US8080153B2 (en) | 2007-05-31 | 2011-12-20 | Abbott Diabetes Care Inc. | Analyte determination methods and devices |
| CN101755043B (en) | 2007-07-23 | 2013-06-19 | 埃葛梅崔克斯股份有限公司 | Electrochemical test strip |
| US7794658B2 (en) * | 2007-07-25 | 2010-09-14 | Lifescan, Inc. | Open circuit delay devices, systems, and methods for analyte measurement |
| US8101062B2 (en) | 2007-07-26 | 2012-01-24 | Nipro Diagnostics, Inc. | System and methods for determination of analyte concentration using time resolved amperometry |
| EP2193367B1 (en) * | 2007-09-27 | 2019-01-23 | Philosys CO., LTD. | Method for correcting erroneous results of measurement in biosensors and apparatus using the same |
| EP3438661B1 (en) | 2007-12-10 | 2022-08-03 | Ascensia Diabetes Care Holdings AG | Slope-based compensation |
| US8603768B2 (en) * | 2008-01-17 | 2013-12-10 | Lifescan, Inc. | System and method for measuring an analyte in a sample |
| WO2009090392A1 (en) * | 2008-01-18 | 2009-07-23 | Lifescan Scotland Limited | Method and system of manufacturing test strip lots having a predetermined calibration characteristic |
| US7678250B2 (en) | 2008-01-22 | 2010-03-16 | Home Diagnostics, Inc. | Reagent compositions for use in electrochemical detection |
| US20090245994A1 (en) | 2008-03-26 | 2009-10-01 | Daniel Ritola | Member tilting method and apparatus |
| US8344733B2 (en) | 2008-03-27 | 2013-01-01 | Panasonic Corporation | Sample measurement device, sample measurement system and sample measurement method |
| US8551320B2 (en) | 2008-06-09 | 2013-10-08 | Lifescan, Inc. | System and method for measuring an analyte in a sample |
| EP3435077A1 (en) | 2008-07-10 | 2019-01-30 | Ascensia Diabetes Care Holdings AG | Systems and methods including amperometric and voltammetric duty cycles |
| JP4555368B2 (en) | 2008-07-10 | 2010-09-29 | 株式会社セコニック | Method for measuring viscoelasticity of liquid |
| KR101392807B1 (en) | 2008-07-25 | 2014-05-09 | 삼성전자주식회사 | Apparatus and method for acquiring timing and detecting cell id in wireless communication systems |
| AU2009309458B2 (en) | 2008-10-27 | 2015-02-26 | Lifescan Scotland Limited | Methods and devices for mitigating ESD events |
| CA2742149C (en) | 2008-11-28 | 2016-07-05 | Panasonic Corporation | Sensor chip, biosensor system, method for measuring temperature of biological sample, method for measuring temperature of blood sample, and method for measuring concentration of analyte in blood sample |
| WO2010077660A1 (en) | 2008-12-08 | 2010-07-08 | Bayer Healthcare Llc | Biosensor system with signal adjustment |
| CN103520806B (en) | 2009-02-27 | 2015-10-21 | 生命扫描有限公司 | Drug delivery management system and method |
| CA2772738C (en) | 2009-09-04 | 2019-01-15 | Lifescan Scotland Limited | Analyte measurement method and system |
| US8545693B2 (en) * | 2009-09-29 | 2013-10-01 | Lifescan Scotland Limited | Analyte measurment method and system |
| US8101065B2 (en) * | 2009-12-30 | 2012-01-24 | Lifescan, Inc. | Systems, devices, and methods for improving accuracy of biosensors using fill time |
| US20110168575A1 (en) | 2010-01-08 | 2011-07-14 | Roche Diaagnostics Operations, Inc. | Sample characterization based on ac measurement methods |
| US8828330B2 (en) | 2010-01-28 | 2014-09-09 | Abbott Diabetes Care Inc. | Universal test strip port |
| US20110208435A1 (en) | 2010-02-25 | 2011-08-25 | Lifescan Scotland Ltd. | Capacitance detection in electrochemical assays |
| RU2573612C2 (en) | 2010-03-31 | 2016-01-20 | Лайфскэн Скотлэнд Лимитед | System and method to detect electrochemical analyte |
| BR112012031166A2 (en) | 2010-06-07 | 2018-02-27 | Bayer Healthcare Llc | slope-based compensation including secondary output signals |
| CN103038636B (en) | 2010-06-07 | 2015-01-14 | 拜尔健康护理有限责任公司 | Underfill management system for a biosensor |
| US8888554B2 (en) | 2010-11-15 | 2014-11-18 | Mattel, Inc. | Toy playset with sockets |
| US8623660B2 (en) | 2011-09-30 | 2014-01-07 | Lifescan Scotland Limited | Hand-held test meter with phase-shift-based hematocrit measurement circuit |
| CN103326182B (en) | 2012-03-23 | 2016-12-14 | 富泰华工业(深圳)有限公司 | Chip card locking mechanism and apply the electronic installation of this chip card locking mechanism |
-
2012
- 2012-12-18 US US14/353,870 patent/US9903830B2/en not_active Expired - Fee Related
- 2012-12-28 TW TW101151340A patent/TWI625521B/en not_active IP Right Cessation
- 2012-12-28 EP EP16189773.1A patent/EP3156787A1/en not_active Withdrawn
- 2012-12-28 WO PCT/GB2012/053279 patent/WO2013098565A1/en active Application Filing
- 2012-12-28 AU AU2012327229A patent/AU2012327229B2/en not_active Ceased
- 2012-12-28 RU RU2014131248A patent/RU2632274C2/en not_active IP Right Cessation
- 2012-12-28 EP EP16189933.1A patent/EP3206022B1/en not_active Not-in-force
- 2012-12-28 TW TW101151343A patent/TWI585402B/en not_active IP Right Cessation
- 2012-12-28 US US14/354,377 patent/US9638656B2/en active Active
- 2012-12-28 EP EP16189622.0A patent/EP3168609B1/en not_active Not-in-force
- 2012-12-28 CN CN201711156196.3A patent/CN108037165A/en active Pending
- 2012-12-28 KR KR1020147021239A patent/KR102031010B1/en active IP Right Grant
- 2012-12-28 ES ES16189622T patent/ES2774444T3/en active Active
- 2012-12-28 WO PCT/GB2012/053276 patent/WO2013098563A1/en active Application Filing
- 2012-12-28 CN CN201280070979.9A patent/CN104136918B/en not_active Expired - Fee Related
- 2012-12-28 CA CA2861752A patent/CA2861752C/en active Active
- 2012-12-28 KR KR1020147021030A patent/KR102035990B1/en active IP Right Grant
- 2012-12-28 RU RU2014131274A patent/RU2626048C2/en not_active IP Right Cessation
- 2012-12-28 JP JP2014549534A patent/JP6101285B2/en not_active Expired - Fee Related
- 2012-12-28 CA CA2862242A patent/CA2862242C/en not_active Expired - Fee Related
- 2012-12-28 ES ES12819126.9T patent/ES2627517T3/en active Active
- 2012-12-28 BR BR112014016313A patent/BR112014016313A8/en not_active Application Discontinuation
- 2012-12-28 JP JP2014549535A patent/JP6282229B2/en not_active Expired - Fee Related
- 2012-12-28 BR BR112014016232A patent/BR112014016232A8/en not_active Application Discontinuation
- 2012-12-28 RU RU2014131243A patent/RU2619830C2/en not_active IP Right Cessation
- 2012-12-28 CN CN201280070976.5A patent/CN104272098B/en not_active Expired - Fee Related
- 2012-12-28 EP EP12810419.7A patent/EP2798340B1/en not_active Not-in-force
- 2012-12-28 CN CN201280070965.7A patent/CN104321644B/en not_active Expired - Fee Related
- 2012-12-28 EP EP12819126.9A patent/EP2798341B1/en not_active Not-in-force
- 2012-12-28 AU AU2012321100A patent/AU2012321100A1/en not_active Abandoned
- 2012-12-28 JP JP2014549536A patent/JP2015503743A/en active Pending
- 2012-12-28 WO PCT/GB2012/053277 patent/WO2013098564A1/en active Application Filing
- 2012-12-28 EP EP12821122.4A patent/EP2798342A1/en not_active Ceased
- 2012-12-28 ES ES12810419.7T patent/ES2673520T3/en active Active
- 2012-12-28 TW TW101151342A patent/TWI615610B/en not_active IP Right Cessation
- 2012-12-28 CA CA2861769A patent/CA2861769C/en active Active
- 2012-12-28 US US14/354,387 patent/US9903831B2/en active Active
- 2012-12-28 BR BR112014016158A patent/BR112014016158A8/en not_active Application Discontinuation
-
2015
- 2015-04-28 HK HK15104076.2A patent/HK1203618A1/en unknown
- 2015-04-28 HK HK15104070.8A patent/HK1203617A1/en not_active IP Right Cessation
- 2015-04-29 HK HK15104123.5A patent/HK1203622A1/en not_active IP Right Cessation
-
2016
- 2016-01-29 AU AU2016200530A patent/AU2016200530B2/en not_active Ceased
-
2018
- 2018-01-29 US US15/881,838 patent/US20180188200A1/en not_active Abandoned
- 2018-01-30 US US15/883,111 patent/US11162916B2/en active Active
Also Published As
Similar Documents
| Publication | Publication Date | Title |
|---|---|---|
| JP6282229B2 (en) | Accurate analyte measurement of electrochemical test strips based on multiple discrete measurements defined by the sensed physical properties of the sample, including the analyte | |
| EP3044573A1 (en) | Anomalous signal error trap for an analyte measurement | |
| EP3014258A1 (en) | Transient signal error trap for an analyte measurement determined from a specified sampling time derived from a sensed physical characteristic of the sample containing the analyte | |
| AU2014301074B2 (en) | Fill error trap for an analyte measurement determined from a specified sampling time derived from a sensed physical characteristic of the sample containing the analyte | |
| KR102035472B1 (en) | Accurate analyte measurements for electrochemical test strip based on sensed physical characteristic(s) of the sample containing the analyte and derived biosensor parameters | |
| AU2012340500B9 (en) | Accurate analyte measurements for electrochemical test strip based on multiple discrete measurements defined by sensed physical characteristic (s) of the sample containing the analyte | |
| AU2015271939B2 (en) | Accurate analyte measurements for electrochemical test strip based on multiple discrete measurements defined by sensed physical characteristic(s) of the sample containing the analyte | |
| AU2012340500A8 (en) | Accurate analyte measurements for electrochemical test strip based on multiple discrete measurements defined by sensed physical characteristic (s) of the sample containing the analyte |
Legal Events
| Date | Code | Title | Description |
|---|---|---|---|
| A621 | Written request for application examination |
Free format text: JAPANESE INTERMEDIATE CODE: A621 Effective date: 20151110 |
|
| A977 | Report on retrieval |
Free format text: JAPANESE INTERMEDIATE CODE: A971007 Effective date: 20160908 |
|
| A131 | Notification of reasons for refusal |
Free format text: JAPANESE INTERMEDIATE CODE: A131 Effective date: 20160920 |
|
| A521 | Request for written amendment filed |
Free format text: JAPANESE INTERMEDIATE CODE: A523 Effective date: 20161219 |
|
| A02 | Decision of refusal |
Free format text: JAPANESE INTERMEDIATE CODE: A02 Effective date: 20170530 |
|
| A521 | Request for written amendment filed |
Free format text: JAPANESE INTERMEDIATE CODE: A523 Effective date: 20170928 |
|
| A911 | Transfer to examiner for re-examination before appeal (zenchi) |
Free format text: JAPANESE INTERMEDIATE CODE: A911 Effective date: 20171006 |
|
| TRDD | Decision of grant or rejection written | ||
| A01 | Written decision to grant a patent or to grant a registration (utility model) |
Free format text: JAPANESE INTERMEDIATE CODE: A01 Effective date: 20180109 |
|
| A61 | First payment of annual fees (during grant procedure) |
Free format text: JAPANESE INTERMEDIATE CODE: A61 Effective date: 20180123 |
|
| R150 | Certificate of patent or registration of utility model |
Ref document number: 6282229 Country of ref document: JP Free format text: JAPANESE INTERMEDIATE CODE: R150 |
|
| R250 | Receipt of annual fees |
Free format text: JAPANESE INTERMEDIATE CODE: R250 |
|
| LAPS | Cancellation because of no payment of annual fees |