JP6224464B2 - Method and apparatus for measuring brown adipose tissue - Google Patents
Method and apparatus for measuring brown adipose tissue Download PDFInfo
- Publication number
- JP6224464B2 JP6224464B2 JP2014006914A JP2014006914A JP6224464B2 JP 6224464 B2 JP6224464 B2 JP 6224464B2 JP 2014006914 A JP2014006914 A JP 2014006914A JP 2014006914 A JP2014006914 A JP 2014006914A JP 6224464 B2 JP6224464 B2 JP 6224464B2
- Authority
- JP
- Japan
- Prior art keywords
- hemoglobin concentration
- light
- bat
- measurement
- body fat
- Prior art date
- Legal status (The legal status is an assumption and is not a legal conclusion. Google has not performed a legal analysis and makes no representation as to the accuracy of the status listed.)
- Active
Links
- 210000003486 adipose tissue brown Anatomy 0.000 title claims description 178
- 238000000034 method Methods 0.000 title claims description 40
- 102000001554 Hemoglobins Human genes 0.000 claims description 196
- 108010054147 Hemoglobins Proteins 0.000 claims description 196
- 238000005259 measurement Methods 0.000 claims description 115
- 210000000577 adipose tissue Anatomy 0.000 claims description 104
- 238000004364 calculation method Methods 0.000 claims description 71
- 238000001514 detection method Methods 0.000 claims description 55
- 238000000691 measurement method Methods 0.000 claims description 33
- 230000035945 sensitivity Effects 0.000 claims description 13
- 238000004497 NIR spectroscopy Methods 0.000 claims description 11
- 230000000644 propagated effect Effects 0.000 claims description 10
- 230000003247 decreasing effect Effects 0.000 claims 2
- 230000000694 effects Effects 0.000 description 61
- 238000010521 absorption reaction Methods 0.000 description 47
- 210000003109 clavicle Anatomy 0.000 description 33
- 210000000852 deltoid muscle Anatomy 0.000 description 25
- 238000012937 correction Methods 0.000 description 20
- 238000002600 positron emission tomography Methods 0.000 description 16
- 230000007423 decrease Effects 0.000 description 15
- 210000000593 adipose tissue white Anatomy 0.000 description 13
- 238000012545 processing Methods 0.000 description 11
- 210000004003 subcutaneous fat Anatomy 0.000 description 10
- AOYNUTHNTBLRMT-SLPGGIOYSA-N 2-deoxy-2-fluoro-aldehydo-D-glucose Chemical compound OC[C@@H](O)[C@@H](O)[C@H](O)[C@@H](F)C=O AOYNUTHNTBLRMT-SLPGGIOYSA-N 0.000 description 9
- 238000010586 diagram Methods 0.000 description 6
- 210000001593 brown adipocyte Anatomy 0.000 description 5
- 210000004027 cell Anatomy 0.000 description 5
- 238000004611 spectroscopical analysis Methods 0.000 description 5
- 208000008589 Obesity Diseases 0.000 description 4
- 230000035508 accumulation Effects 0.000 description 4
- 238000009825 accumulation Methods 0.000 description 4
- QVGXLLKOCUKJST-UHFFFAOYSA-N atomic oxygen Chemical compound [O] QVGXLLKOCUKJST-UHFFFAOYSA-N 0.000 description 4
- 230000008859 change Effects 0.000 description 4
- 230000031700 light absorption Effects 0.000 description 4
- 235000020824 obesity Nutrition 0.000 description 4
- 229910052760 oxygen Inorganic materials 0.000 description 4
- 239000001301 oxygen Substances 0.000 description 4
- 230000005855 radiation Effects 0.000 description 4
- 230000000638 stimulation Effects 0.000 description 4
- 238000007473 univariate analysis Methods 0.000 description 4
- 238000010176 18-FDG-positron emission tomography Methods 0.000 description 3
- ZCXUVYAZINUVJD-AHXZWLDOSA-N 2-deoxy-2-((18)F)fluoro-alpha-D-glucose Chemical compound OC[C@H]1O[C@H](O)[C@H]([18F])[C@@H](O)[C@@H]1O ZCXUVYAZINUVJD-AHXZWLDOSA-N 0.000 description 3
- 238000002835 absorbance Methods 0.000 description 3
- 239000008280 blood Substances 0.000 description 3
- 210000004369 blood Anatomy 0.000 description 3
- 238000009529 body temperature measurement Methods 0.000 description 3
- 238000002474 experimental method Methods 0.000 description 3
- 230000003595 spectral effect Effects 0.000 description 3
- 230000003868 tissue accumulation Effects 0.000 description 3
- 230000000007 visual effect Effects 0.000 description 3
- 241000282412 Homo Species 0.000 description 2
- 102000015494 Mitochondrial Uncoupling Proteins Human genes 0.000 description 2
- 108010050258 Mitochondrial Uncoupling Proteins Proteins 0.000 description 2
- 238000011871 bio-impedance analysis Methods 0.000 description 2
- 230000008033 biological extinction Effects 0.000 description 2
- 238000009547 dual-energy X-ray absorptiometry Methods 0.000 description 2
- 238000005265 energy consumption Methods 0.000 description 2
- 238000011156 evaluation Methods 0.000 description 2
- 238000003384 imaging method Methods 0.000 description 2
- 238000002347 injection Methods 0.000 description 2
- 239000007924 injection Substances 0.000 description 2
- 210000003205 muscle Anatomy 0.000 description 2
- 238000009206 nuclear medicine Methods 0.000 description 2
- 239000013307 optical fiber Substances 0.000 description 2
- 238000012360 testing method Methods 0.000 description 2
- 210000001519 tissue Anatomy 0.000 description 2
- XLYOFNOQVPJJNP-UHFFFAOYSA-N water Substances O XLYOFNOQVPJJNP-UHFFFAOYSA-N 0.000 description 2
- SFLSHLFXELFNJZ-QMMMGPOBSA-N (-)-norepinephrine Chemical compound NC[C@H](O)C1=CC=C(O)C(O)=C1 SFLSHLFXELFNJZ-QMMMGPOBSA-N 0.000 description 1
- 101710088966 Bile acid-CoA:amino acid N-acyltransferase Proteins 0.000 description 1
- 241000288673 Chiroptera Species 0.000 description 1
- 101000697858 Homo sapiens Bile acid-CoA:amino acid N-acyltransferase Proteins 0.000 description 1
- 241001465754 Metazoa Species 0.000 description 1
- 238000000862 absorption spectrum Methods 0.000 description 1
- 230000032683 aging Effects 0.000 description 1
- 238000004458 analytical method Methods 0.000 description 1
- 239000007864 aqueous solution Substances 0.000 description 1
- 230000002238 attenuated effect Effects 0.000 description 1
- 238000011956 best available technology Methods 0.000 description 1
- 230000017531 blood circulation Effects 0.000 description 1
- 230000001413 cellular effect Effects 0.000 description 1
- 238000001816 cooling Methods 0.000 description 1
- 210000004748 cultured cell Anatomy 0.000 description 1
- 238000011161 development Methods 0.000 description 1
- 230000018109 developmental process Effects 0.000 description 1
- 206010012601 diabetes mellitus Diseases 0.000 description 1
- 238000003745 diagnosis Methods 0.000 description 1
- 238000009792 diffusion process Methods 0.000 description 1
- 201000010099 disease Diseases 0.000 description 1
- 208000037265 diseases, disorders, signs and symptoms Diseases 0.000 description 1
- 238000011549 displacement method Methods 0.000 description 1
- 229940079593 drug Drugs 0.000 description 1
- 239000003814 drug Substances 0.000 description 1
- 230000008030 elimination Effects 0.000 description 1
- 238000003379 elimination reaction Methods 0.000 description 1
- 230000006870 function Effects 0.000 description 1
- 238000011835 investigation Methods 0.000 description 1
- 235000012054 meals Nutrition 0.000 description 1
- 210000003470 mitochondria Anatomy 0.000 description 1
- 238000012986 modification Methods 0.000 description 1
- 230000004048 modification Effects 0.000 description 1
- 229960002748 norepinephrine Drugs 0.000 description 1
- SFLSHLFXELFNJZ-UHFFFAOYSA-N norepinephrine Natural products NCC(O)C1=CC=C(O)C(O)=C1 SFLSHLFXELFNJZ-UHFFFAOYSA-N 0.000 description 1
- 230000036284 oxygen consumption Effects 0.000 description 1
- 238000006213 oxygenation reaction Methods 0.000 description 1
- 230000001575 pathological effect Effects 0.000 description 1
- 230000007170 pathology Effects 0.000 description 1
- 230000035479 physiological effects, processes and functions Effects 0.000 description 1
- 230000002265 prevention Effects 0.000 description 1
- 230000001902 propagating effect Effects 0.000 description 1
- 238000011160 research Methods 0.000 description 1
- 230000000284 resting effect Effects 0.000 description 1
- 238000012552 review Methods 0.000 description 1
- 239000000126 substance Substances 0.000 description 1
- 230000002123 temporal effect Effects 0.000 description 1
- 238000005303 weighing Methods 0.000 description 1
Images


Classifications
-
- A—HUMAN NECESSITIES
- A61—MEDICAL OR VETERINARY SCIENCE; HYGIENE
- A61B—DIAGNOSIS; SURGERY; IDENTIFICATION
- A61B5/00—Measuring for diagnostic purposes; Identification of persons
- A61B5/0059—Measuring for diagnostic purposes; Identification of persons using light, e.g. diagnosis by transillumination, diascopy, fluorescence
-
- A—HUMAN NECESSITIES
- A61—MEDICAL OR VETERINARY SCIENCE; HYGIENE
- A61B—DIAGNOSIS; SURGERY; IDENTIFICATION
- A61B5/00—Measuring for diagnostic purposes; Identification of persons
- A61B5/145—Measuring characteristics of blood in vivo, e.g. gas concentration, pH value; Measuring characteristics of body fluids or tissues, e.g. interstitial fluid, cerebral tissue
- A61B5/1455—Measuring characteristics of blood in vivo, e.g. gas concentration, pH value; Measuring characteristics of body fluids or tissues, e.g. interstitial fluid, cerebral tissue using optical sensors, e.g. spectral photometrical oximeters
-
- A—HUMAN NECESSITIES
- A61—MEDICAL OR VETERINARY SCIENCE; HYGIENE
- A61B—DIAGNOSIS; SURGERY; IDENTIFICATION
- A61B5/00—Measuring for diagnostic purposes; Identification of persons
- A61B5/48—Other medical applications
- A61B5/4869—Determining body composition
- A61B5/4872—Body fat
-
- A—HUMAN NECESSITIES
- A61—MEDICAL OR VETERINARY SCIENCE; HYGIENE
- A61B—DIAGNOSIS; SURGERY; IDENTIFICATION
- A61B5/00—Measuring for diagnostic purposes; Identification of persons
- A61B5/02—Detecting, measuring or recording pulse, heart rate, blood pressure or blood flow; Combined pulse/heart-rate/blood pressure determination; Evaluating a cardiovascular condition not otherwise provided for, e.g. using combinations of techniques provided for in this group with electrocardiography or electroauscultation; Heart catheters for measuring blood pressure
- A61B5/026—Measuring blood flow
- A61B5/0261—Measuring blood flow using optical means, e.g. infrared light
-
- A—HUMAN NECESSITIES
- A61—MEDICAL OR VETERINARY SCIENCE; HYGIENE
- A61B—DIAGNOSIS; SURGERY; IDENTIFICATION
- A61B5/00—Measuring for diagnostic purposes; Identification of persons
- A61B5/145—Measuring characteristics of blood in vivo, e.g. gas concentration, pH value; Measuring characteristics of body fluids or tissues, e.g. interstitial fluid, cerebral tissue
- A61B5/14546—Measuring characteristics of blood in vivo, e.g. gas concentration, pH value; Measuring characteristics of body fluids or tissues, e.g. interstitial fluid, cerebral tissue for measuring analytes not otherwise provided for, e.g. ions, cytochromes
-
- A—HUMAN NECESSITIES
- A61—MEDICAL OR VETERINARY SCIENCE; HYGIENE
- A61B—DIAGNOSIS; SURGERY; IDENTIFICATION
- A61B5/00—Measuring for diagnostic purposes; Identification of persons
- A61B5/145—Measuring characteristics of blood in vivo, e.g. gas concentration, pH value; Measuring characteristics of body fluids or tissues, e.g. interstitial fluid, cerebral tissue
- A61B5/1455—Measuring characteristics of blood in vivo, e.g. gas concentration, pH value; Measuring characteristics of body fluids or tissues, e.g. interstitial fluid, cerebral tissue using optical sensors, e.g. spectral photometrical oximeters
- A61B5/14551—Measuring characteristics of blood in vivo, e.g. gas concentration, pH value; Measuring characteristics of body fluids or tissues, e.g. interstitial fluid, cerebral tissue using optical sensors, e.g. spectral photometrical oximeters for measuring blood gases
-
- A—HUMAN NECESSITIES
- A61—MEDICAL OR VETERINARY SCIENCE; HYGIENE
- A61B—DIAGNOSIS; SURGERY; IDENTIFICATION
- A61B5/00—Measuring for diagnostic purposes; Identification of persons
- A61B5/72—Signal processing specially adapted for physiological signals or for diagnostic purposes
- A61B5/7271—Specific aspects of physiological measurement analysis
- A61B5/7275—Determining trends in physiological measurement data; Predicting development of a medical condition based on physiological measurements, e.g. determining a risk factor
-
- G—PHYSICS
- G01—MEASURING; TESTING
- G01N—INVESTIGATING OR ANALYSING MATERIALS BY DETERMINING THEIR CHEMICAL OR PHYSICAL PROPERTIES
- G01N21/00—Investigating or analysing materials by the use of optical means, i.e. using sub-millimetre waves, infrared, visible or ultraviolet light
- G01N21/17—Systems in which incident light is modified in accordance with the properties of the material investigated
- G01N21/25—Colour; Spectral properties, i.e. comparison of effect of material on the light at two or more different wavelengths or wavelength bands
- G01N21/31—Investigating relative effect of material at wavelengths characteristic of specific elements or molecules, e.g. atomic absorption spectrometry
- G01N21/35—Investigating relative effect of material at wavelengths characteristic of specific elements or molecules, e.g. atomic absorption spectrometry using infrared light
- G01N21/359—Investigating relative effect of material at wavelengths characteristic of specific elements or molecules, e.g. atomic absorption spectrometry using infrared light using near infrared light
Description
本発明は、褐色脂肪組織の測定方法及び測定装置に関するものである。 The present invention relates to a brown adipose tissue measurement method and measurement apparatus.
非特許文献1には、微量水溶液を対象とした近赤外分光計測法による非接触式の温度測定方法の応用として、褐色脂肪細胞の温度を測定する方法が記載されている。この文献に記載された方法では、褐色脂肪細胞に赤外光を照射し、その吸光度に基づいて褐色脂肪細胞の温度を測定している。具体的には、水分子の吸収スペクトルが温度によって変化することを利用し、シャーレ上の培養BAT細胞にノルアドレナリンを投与することにより活性化させ、褐色脂肪細胞の温度変化の測定を行っている。
脂肪には、脂肪を溜め込む「白色脂肪組織(White Adipose Tissue;WAT)」と、周囲が低温である場合や食後などに脂肪を燃焼させ、熱を発生させる「褐色脂肪組織(Brown Adipose Tissue;BAT)」との2種類がある。WATは全身にわたって存在するが、BATは鎖骨上窩、傍脊髄、心臓付近などに限定的に存在する。BATは、寒冷下などにおいて、脱共役タンパク質(UCP−1)によりエネルギーを熱として発散させるので、エネルギーを消費しやすく、肥満や生活習慣病の予防に関わっている。 For fat, “White Adipose Tissue (WAT)” that stores fat, and “Brown Adipose Tissue (BAT)” that generates heat by burning fat when the surroundings are cold or after meals. ) ”. WAT is present throughout the body, but BAT is limited to the supraclavicular fossa, paraspinal cord, near the heart, and the like. BAT dissipates energy as heat by uncoupling protein (UCP-1) under cold conditions and the like, so it easily consumes energy and is involved in the prevention of obesity and lifestyle-related diseases.
従来、BATに関する知見としては動物実験による報告が主であった。人間のBATに関しては、新生児に多く存在するが成人になると殆ど消失してしまい、生理学的な意義はないと考えられていたからである。しかしながら、PET(Positron Emission Tomography)装置を用いてフルオロデオキシグルコース(FDG)の組織集積度を計測することにより、BATの活性度を評価でき、活性のあるBATが成人にも存在することが発明者らによって見出されている。 Conventionally, reports on animal experiments have been the main findings concerning BAT. This is because human BAT is abundant in newborns but disappears almost as an adult and is considered to have no physiological significance. However, by measuring the tissue accumulation level of fluorodeoxyglucose (FDG) using a PET (Positron Emission Tomography) apparatus, the activity of BAT can be evaluated, and the inventor has an active BAT even in adults. Have been found.
本発明者らが健康な成人に寒冷刺激(室温19度、足裏を氷嚢で冷やす)を2時間与え、FDG−PET/CTによる計測を行ったところ、鎖骨上部及び胸椎近傍の脂肪組織に明瞭なFDG集積が認められた。そして、同一被験者であっても、寒冷刺激を行わなければFDG集積が確認されないことから、寒冷刺激によって活性化され得るBATが成人にも存在することが判明した。さらに、本発明者等は、加齢に伴う肥満(中年太り)がBATの低下に起因することを突き止め、機能が低下したBATであっても、積極的な寒冷刺激を継続することによって再活性化・増量することが可能であり、それが体脂肪の減少をもたらすことを見出した。 The present inventors gave a healthy adult a cold stimulus (room temperature 19 ° C., cools the sole with an ice bag) for 2 hours and measured by FDG-PET / CT. FDG accumulation was observed. And even if it is the same test subject, since FDG accumulation is not confirmed unless cold stimulation is performed, it turned out that BAT which can be activated by cold stimulation exists also in an adult. Furthermore, the present inventors have found out that obesity (middle-aged fatness) associated with aging is due to a decrease in BAT, and even if BAT has a reduced function, it can be repeated by continuing active cold stimulation. It has been found that it is possible to activate and increase the amount, which leads to a decrease in body fat.
しかしながら、上記のFDG−PET/CTを用いる方法では、長時間の寒冷負荷を被験者に与えてBATを活性化させる必要がある。また、FDGを注射後、撮影までの間に1時間ほど安静にしている必要があり、更には、被験者の放射線被曝を伴う。このように、上記のFDG−PET/CTを用いる方法では、被験者への負担が大きい。本発明は、このような問題点に鑑みてなされたものであり、被験者の負担を軽減できる褐色脂肪組織の測定方法及び測定装置を提供することを目的とする。 However, in the above method using FDG-PET / CT, it is necessary to activate the BAT by applying a long-time cold load to the subject. In addition, it is necessary to be rested for about one hour after the injection of FDG and before imaging, and further, the subject is exposed to radiation. Thus, in the method using the above FDG-PET / CT, the burden on the subject is large. This invention is made | formed in view of such a problem, and it aims at providing the measuring method and measuring apparatus of a brown adipose tissue which can reduce a test subject's burden.
上述した課題を解決するために、本発明による褐色脂肪組織の測定方法は、光入射部から被測定部位に近赤外光を入射する光入射ステップと、光検出部において、被測定部位の内部を伝搬した近赤外光の光強度を検出する光検出ステップと、光検出部での検出結果に基づく近赤外分光計測法によって求められる、被測定部位の酸素化ヘモグロビン濃度、総ヘモグロビン濃度、及び、酸素化ヘモグロビン濃度若しくは総ヘモグロビン濃度に応じて増減する第1のパラメータのうち少なくとも一つの数値からBAT量に関する指標値を算出する演算ステップとを備えることを特徴とする。或いは、本発明による褐色脂肪組織の測定方法は、光入射部から被測定部位に近赤外光を入射する光入射ステップと、光検出部において、被測定部位の内部を伝搬した近赤外光の光強度を検出する光検出ステップと、光検出部での検出結果に基づく近赤外分光計測法によって求められる、被測定部位の散乱係数及び脱酸素化ヘモグロビン濃度のうち少なくとも一方から褐色脂肪組織量に関する指標値を算出する演算ステップとを備えることを特徴とする。 In order to solve the above-described problems, a brown adipose tissue measurement method according to the present invention includes a light incident step of injecting near-infrared light from a light incident portion to a measurement site, A light detection step for detecting the light intensity of near-infrared light propagating through the light, and the oxygenated hemoglobin concentration, total hemoglobin concentration at the measurement site, obtained by a near-infrared spectroscopic measurement method based on the detection result in the light detection unit, And an operation step of calculating an index value related to the BAT amount from at least one numerical value of the first parameter that increases or decreases according to the oxygenated hemoglobin concentration or the total hemoglobin concentration. Alternatively, the method for measuring brown adipose tissue according to the present invention includes a light incident step in which near-infrared light is incident on the measurement site from the light incidence unit, and near-infrared light that has propagated through the measurement site in the light detection unit. Brown adipose tissue from at least one of the scattering coefficient and deoxygenated hemoglobin concentration of the site to be measured, which is obtained by a light detection step for detecting the light intensity of the light and a near-infrared spectroscopy measurement method based on the detection result in the light detection unit And a calculation step of calculating an index value relating to the quantity.
また、褐色脂肪組織の測定装置は、被測定部位に近赤外光を入射する光入射部と、被測定部位の内部を伝搬した近赤外光の光強度を検出する光検出部と、光検出部での検出結果に基づく近赤外分光計測法によって求められる、被測定部位の酸素化ヘモグロビン濃度、総ヘモグロビン濃度、及び、酸素化ヘモグロビン濃度若しくは総ヘモグロビン濃度に応じて増減する第1のパラメータのうち少なくとも一つの数値からBAT量に関する指標値を算出する演算部とを備えることを特徴とする。或いは、褐色脂肪組織の測定装置は、被測定部位に近赤外光を入射する光入射部と、被測定部位の内部を伝搬した近赤外光の光強度を検出する光検出部と、光検出部での検出結果に基づく近赤外分光計測法によって求められる、被測定部位の散乱係数及び脱酸素化ヘモグロビン濃度のうち少なくとも一方から褐色脂肪組織量に関する指標値を算出する演算部とを備えることを特徴とする。 Further, the brown adipose tissue measuring apparatus includes a light incident part that makes near-infrared light incident on a measurement site, a light detection unit that detects the light intensity of near-infrared light that has propagated inside the measurement site, and a light The first parameter that is obtained by the near-infrared spectroscopic measurement method based on the detection result in the detection unit and that increases or decreases according to the oxygenated hemoglobin concentration, total hemoglobin concentration, and oxygenated hemoglobin concentration or total hemoglobin concentration of the measurement site And an arithmetic unit that calculates an index value related to the BAT amount from at least one numerical value. Alternatively, the brown adipose tissue measuring apparatus includes a light incident unit that inputs near-infrared light to a measurement site, a light detection unit that detects the light intensity of near-infrared light that has propagated through the measurement site, and a light A calculation unit that calculates an index value related to the amount of brown adipose tissue from at least one of a scattering coefficient and a deoxygenated hemoglobin concentration of a measurement site, which is obtained by a near-infrared spectroscopy measurement method based on a detection result in the detection unit It is characterized by that.
本発明者らは、研究の末、酸素化ヘモグロビン濃度及び総ヘモグロビン濃度並びに散乱係数及び脱酸素化ヘモグロビン濃度とBAT量との間に有意な相関が存在することを見出した。上記の測定方法及び測定装置では、演算ステップ(演算部)において、近赤外分光計測法によって求められた酸素化ヘモグロビン濃度、総ヘモグロビン濃度、及び、酸素化ヘモグロビン濃度若しくは総ヘモグロビン濃度に応じて増減する第1のパラメータ(例えば吸収係数など)のうち少なくとも一つの数値(以下、ヘモグロビン濃度等という)に基づいて、或いは散乱係数及び脱酸素化ヘモグロビン濃度に基づいて、BAT量に関する指標値を算出している。このように近赤外分光計測法を用いて非侵襲的に測定することにより、寒冷負荷を与える必要がなく、常温下で短時間(例えば5分間)の測定が可能となり、被験者の放射線被曝も伴わない。従って、この方法及び装置によれば、被験者の負担を軽減することができる。 As a result of the study, the present inventors have found that there is a significant correlation between the oxygenated hemoglobin concentration and the total hemoglobin concentration, and the scattering coefficient, the deoxygenated hemoglobin concentration, and the amount of BAT. In the measurement method and the measurement apparatus described above, the calculation step (calculation unit) increases or decreases according to the oxygenated hemoglobin concentration, total hemoglobin concentration, and oxygenated hemoglobin concentration or total hemoglobin concentration obtained by the near infrared spectroscopy measurement method. An index value related to the BAT amount is calculated based on at least one numerical value (hereinafter referred to as hemoglobin concentration or the like) of the first parameter (for example, absorption coefficient) or based on the scattering coefficient and the deoxygenated hemoglobin concentration. ing. Thus, non-invasive measurement using near-infrared spectroscopy does not require the application of a cold load, enables measurement in a short time (for example, 5 minutes) at room temperature, and subjects are exposed to radiation. Not accompanied. Therefore, according to this method and apparatus, the burden on the subject can be reduced.
また、一般的にPET装置は高価且つ大型である。これに対し、近赤外分光計測装置はPET装置と比較して安価且つ小型である。従って、上記の方法及び装置によれば、BATの測定を極めて簡易に行うことができる。 In general, the PET apparatus is expensive and large. On the other hand, the near-infrared spectroscopic measurement device is cheaper and smaller than the PET device. Therefore, according to the above method and apparatus, BAT can be measured very easily.
また、褐色脂肪組織の測定方法は、演算ステップにおいて、体脂肪量に関する第2のパラメータと少なくとも一つの数値若しくは測定感度との相関を表すデータを使用して、少なくとも一つの数値に含まれる体脂肪量による影響が低減するように補正した数値を、褐色脂肪組織量に関する指標値とすることを特徴としてもよい。同様に、褐色脂肪組織の測定装置は、体脂肪量に関する第2のパラメータと少なくとも一つの数値若しくは測定感度との相関を表すデータを記憶しておく記憶部を更に備え、演算部は、データを使用して、少なくとも一つの数値に含まれる体脂肪量による影響が低減するように補正した数値を、BAT量に関する指標値とすることを特徴としてもよい。 In the method for measuring brown adipose tissue, in the calculation step, the body fat contained in at least one numerical value is calculated using data representing the correlation between the second parameter relating to the body fat mass and at least one numerical value or measurement sensitivity. A numerical value corrected so as to reduce the influence of the amount may be used as an index value relating to the amount of brown adipose tissue. Similarly, the brown adipose tissue measurement apparatus further includes a storage unit that stores data representing a correlation between the second parameter relating to the body fat mass and at least one numerical value or measurement sensitivity, and the calculation unit stores the data. The numerical value corrected so as to reduce the influence of the body fat amount contained in at least one numerical value may be used as an index value relating to the BAT amount.
近赤外分光計測法により測定されたヘモグロビン濃度は、WATの影響を受けやすい。WATの吸光度は筋肉と比較して極めて小さく、また、WAT量すなわち体脂肪量の個人差が大きいので、体脂肪が多い人ほどヘモグロビン濃度は低く、体脂肪が少ない人ほどヘモグロビン濃度は高く見積もられてしまう傾向がある。また、BATがエネルギー消費を亢進するので、BATの活性値が高い人ほど体脂肪が少ない傾向がある。上記の方法及び装置では、体脂肪量に関するパラメータとヘモグロビン濃度等若しくは測定感度との相関を表すデータを使用して、ヘモグロビン濃度等に含まれる体脂肪量による影響が低減するように補正した数値をBAT量に関する指標値とするので、BAT量を更に精度良く評価することができる。 The hemoglobin concentration measured by near-infrared spectroscopy is easily affected by WAT. The absorbance of WAT is extremely small compared to muscle, and the individual difference in the amount of WAT, that is, the amount of body fat is large. Therefore, the higher the body fat, the lower the hemoglobin concentration, and the lower the body fat, the higher the estimated hemoglobin concentration. There is a tendency to be taken. Moreover, since BAT promotes energy consumption, people with higher BAT activity values tend to have less body fat. In the above method and apparatus, using the data representing the correlation between the body fat mass parameter and the hemoglobin concentration or the like or the measurement sensitivity, the numerical value corrected so as to reduce the influence of the body fat amount contained in the hemoglobin concentration or the like is obtained. Since the index value is related to the BAT amount, the BAT amount can be evaluated with higher accuracy.
また、褐色脂肪組織の測定方法は、指標値と閾値とを比較することにより、褐色脂肪組織量が陰性及び陽性の何れであるかを判別する判別ステップを更に備えることを特徴としてもよい。同様に、褐色脂肪組織の測定装置は、演算部が、指標値と閾値とを比較することにより、褐色脂肪組織量が陰性及び陽性の何れであるかを判別することを特徴としてもよい。上記の褐色脂肪組織の測定方法及び測定装置では、その評価精度の高さにより、BAT量が陰性か陽性かを簡易に且つ精度良く判別することができる。 The brown adipose tissue measurement method may further include a determination step of determining whether the amount of brown adipose tissue is negative or positive by comparing an index value with a threshold value. Similarly, the brown adipose tissue measuring apparatus may be characterized in that the calculation unit determines whether the amount of brown adipose tissue is negative or positive by comparing the index value with a threshold value. In the brown adipose tissue measurement method and measurement apparatus described above, whether the BAT amount is negative or positive can be easily and accurately determined based on the high evaluation accuracy.
本発明による褐色脂肪組織の測定方法及び測定装置によれば、被験者の負担を軽減することができる。 According to the brown adipose tissue measuring method and measuring apparatus of the present invention, the burden on the subject can be reduced.
以下、添付図面を参照しながら本発明による測定方法及び測定装置の実施の形態を詳細に説明する。なお、図面の説明において同一の要素には同一の符号を付し、重複する説明を省略する。 Hereinafter, embodiments of a measurement method and a measurement apparatus according to the present invention will be described in detail with reference to the accompanying drawings. In the description of the drawings, the same elements are denoted by the same reference numerals, and redundant description is omitted.
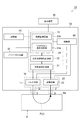
(第1実施形態)
図1は、本発明による測定装置の第1実施形態の構成を概略的に示すブロック図である。この測定装置1Aは、近赤外光を用いた時間分解分光計測法によって求められる生体の被測定部位Bのヘモグロビン濃度に関する数値から、BAT量に関する指標値を算出する装置である。測定装置1Aによる測定は、室温(一定温度)下および安静状態で行われる。
(First embodiment)
FIG. 1 is a block diagram schematically showing the configuration of a first embodiment of a measuring apparatus according to the present invention. This measuring
ここで、ヘモグロビン濃度に関する数値とは、酸素化ヘモグロビン濃度、総ヘモグロビン濃度、及び、酸素化ヘモグロビン濃度若しくは総ヘモグロビン濃度に応じて増減するパラメータのうち少なくとも一つの数値をいう。また、酸素化ヘモグロビン濃度若しくは総ヘモグロビン濃度に応じて増減するパラメータとしては、例えば酸素化ヘモグロビン濃度若しくは総ヘモグロビン濃度が算出される際に用いられるパラメータ(吸収係数など)が挙げられる。また、被測定部位Bとしては、生体の全ての部位が挙げられる。例えば、BATが多く存在する鎖骨上窩、傍脊髄、心臓付近などである。 Here, the numerical value relating to the hemoglobin concentration refers to at least one of oxygenated hemoglobin concentration, total hemoglobin concentration, and parameters that increase or decrease depending on the oxygenated hemoglobin concentration or total hemoglobin concentration. Examples of the parameter that increases or decreases according to the oxygenated hemoglobin concentration or the total hemoglobin concentration include parameters (absorption coefficient, etc.) used when the oxygenated hemoglobin concentration or the total hemoglobin concentration is calculated. Further, as the measurement site B, all the sites of the living body can be mentioned. For example, the supraclavicular fossa with many BATs, the paraspinal cord, and the vicinity of the heart.
図1に示される測定装置1Aは、本体部70及び表示装置80を備えている。本体部70は、光入射部10と、光検出部20と、演算部30と、パラメータ入力部50と、これらの制御を行う制御部60とを備えている。
A measuring
光入射部10は、被測定部位Bの光入射位置Sから、互いに波長が異なる近赤外パルス光P(n)(但し、n=1,2,・・・)を入射する。本実施形態では、被測定部位Bの表面Ba上に一箇所の光入射位置Sが設定されている。光入射部10は、パルス光P(n)を発生させるパルス光源11と、光入射用光ガイド12とを含む。光入射用光ガイド12の入力端はパルス光源11に光学的に接続されている。光入射用光ガイド12の出力端は被測定部位Bの光入射位置Sに配置されている。
The
パルス光源11としては、発光ダイオード、レーザーダイオード、各種パルスレーザ装置など、様々なものが用いられる。パルス光源11において発生するパルス光P(n)としては、被測定部位Bの吸収係数の変化量を測定できる程度にパルスの時間幅が短く、且つ、被測定物質の光吸収特性において光吸収率が高い波長を中心波長とする近赤外パルス光が用いられる。一実施例では、n=3であり、パルス光P(1)〜P(3)の波長はそれぞれ760nm、795nm、830nmである。光入射用光ガイド12としては、例えば光ファイバが用いられる。
Various devices such as a light emitting diode, a laser diode, and various pulse laser devices are used as the
光検出部20は、被測定部位Bの内部を伝搬したパルス光P(n)を検出光として検出する。本実施形態では、被測定部位Bの表面Ba上に一箇所の光検出位置Dが設定されている。光検出部20は、光検出用光ガイド21と、光を検出して電気的な検出信号に変換する光検出器22とを含む。光検出用光ガイド21の入力端は、被測定部位Bの光検出位置Dに配置されている。光検出用光ガイド21の出力端は、光検出器22に光学的に接続されている。
The
光検出用光ガイド21としては、例えば光ファイバが用いられる。光検出器22としては、光電子増倍管、フォトダイオード、アバランシェフォトダイオード、PINフォトダイオードなど、様々なものが用いられる。光検出器22の選択については、パルス光源11から出射されるパルス光P(n)の波長域において光強度を充分に検出できる分光感度特性を有していれば良い。また、検出光が微弱であるときは、高感度あるいは高利得の光検出器を用いてもよい。
For example, an optical fiber is used as the light
図2は、光入射部10から出射されるパルス光P(n)、及び光検出部20において検出される検出光の各光強度の時間変化の一例を示すグラフである。図2において、縦軸は光量(対数目盛)を示し、横軸は時間を示している。グラフG11は、時刻t0に光入射部10から被測定部位Bへ入射されるパルス光強度の時間波形(入射波形)である。グラフG12は、時刻t0に入射されたパルス光に対応する検出光強度の時間波形(検出波形)である。被測定部位Bの内部を伝搬した光が光検出位置Dに達する時間は、その伝搬状況によって一様ではなく、また、被測定部位Bでの散乱や吸収によって減衰を受ける。従って、図2のグラフG12に示されるように、検出波形は或る一定の分布曲線となる。
FIG. 2 is a graph showing an example of temporal changes in the light intensity of the pulsed light P (n) emitted from the
再び図1を参照する。演算部30は、時間波形計測部31、生体光学特性計測部32及び演算処理部33を含む。時間波形計測部31は、光検出器22と電気的に接続されており、光検出器22からの光検出信号に基づいて検出光の光強度についての時間波形を取得する。この時間波形を取得するために、時間波形計測部31には、パルス光P(n)の発光タイミングを示すトリガ信号がパルス光源11から提供される。パルス光P(n)の入射及び検出が複数の測定時刻において行なわれることにより、その各々の測定時刻での時間波形が得られる。生体光学特性計測部32は、時間波形計測部31によって得られた時間波形に基づいて、被測定部位Bの吸光特性を表すパラメータ(例えば吸収係数)を算出する。演算処理部33は、ヘモグロビン濃度演算部33a及び指標値演算部33bを含む。ヘモグロビン濃度演算部33aは、被測定部位Bの吸光特性を表すパラメータを生体光学特性計測部32から取得し、所定の演算を行うことによって、被測定部位Bにおける各種ヘモグロビン濃度(酸素化ヘモグロビン濃度及び総ヘモグロビン濃度のうち少なくとも一方を含む)を算出する。指標値演算部33bは、ヘモグロビン濃度演算部33aにおいて算出された酸素化ヘモグロビン濃度及び総ヘモグロビン濃度、並びに、生体光学特性計測部32において算出された酸素化ヘモグロビン濃度若しくは総ヘモグロビン濃度に応じて増減するパラメータ(例えば吸収係数)のうち少なくとも一つの数値から、BAT量に関する指標値を算出する。
Refer to FIG. 1 again. The
表示装置80は、本体部70に接続されている。表示装置80は、演算処理部33の指標値演算部33bにおいて算出されたBAT量に関する指標値を表示し、測定をする者及び被験者に指標値を提供する。
The
ここで、生体光学特性計測部32及び演算処理部33における演算内容の一例について詳細に説明する。生体光学特性計測部32は、時間波形計測部31から提供される検出光の時間波形(例えば図2を参照)に基づいて、被計測部位Bにおける各波長λ毎の吸収係数μa,λを求める。すなわち、一実施例では、波長760nmにおける吸収係数μa,760、波長795nmにおける吸収係数μa,795、波長830nmにおける吸収係数μa,830をそれぞれ求める。なお、これらの吸収係数μa,λは、例えば拡散方程式を用いて好適に求められる。
Here, an example of calculation contents in the bio-optical
演算処理部33のヘモグロビン濃度演算部33aは、次の数式(1)によって表される吸収係数μa,λに関する連立方程式を解くことによって、被測定部位Bの酸素化ヘモグロビン濃度(CHbO2)及び脱酸素化ヘモグロビン濃度(CHb)を算出する。なお、εHbO2,λは波長λにおける酸素化ヘモグロビンの吸光係数であり、εHb,λは波長λにおける脱酸素化ヘモグロビンの吸光係数であり、共に既知の値である。また、ヘモグロビン濃度演算部33aは、これらのヘモグロビン濃度から、総ヘモグロビン濃度(CtHb)を算出する。ヘモグロビン濃度演算部33aは、必要に応じて、これらのヘモグロビン濃度から酸素飽和度(SO2)を算出することもできる。
![]()
![]()
演算処理部33の指標値演算部33bは、ヘモグロビン濃度演算部33aにおいて算出された酸素化ヘモグロビン濃度及び/または総ヘモグロビン濃度と、被験者の体脂肪量に関するパラメータとに基づいて、BAT量に関する指標値を算出する。ここで、被験者の体脂肪量に関するパラメータとしては、例えば体脂肪率が挙げられる。被験者の体脂肪量に関するパラメータは、パラメータ入力部50から入力され、指標値演算部33bに提供される。本体部70は、例えば不揮発性メモリといった記憶部40を更に備えている。記憶部40は、体脂肪量に関するパラメータと、酸素化ヘモグロビン濃度及び/又は総ヘモグロビン濃度との相関を表すデータを予め記憶しておく。指標値演算部33bは、記憶部40に記憶された相関データを使用して、酸素化ヘモグロビン濃度及び/又は総ヘモグロビン濃度における体脂肪量(主に皮下脂肪)による影響が低減するように補正した数値を、BAT量に関する指標値として算出する。なお、このときの計算方法としては、例えば単変量解析分析法が挙げられる。また、体脂肪率の測定方法としては、例えばキャリパー法、生体電気インピーダンス法(Bioelectrical Impedance Analysis;BIA法)、空気置換法、水中体重秤量法、二重エックス線吸収法(Dual-energyX-ray Absorptiometry;DXA法)などが挙げられる。
The index
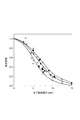
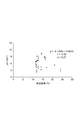
図3は、記憶部40に記憶される相関の例として、鎖骨上窩の酸素化ヘモグロビン濃度(CHbO2)と体脂肪率との相関を表すグラフである。図3において、縦軸は酸素化ヘモグロビン濃度(単位:μM)を示し、横軸は体脂肪率(単位:%)を示している。鎖骨上窩の酸素化ヘモグロビン濃度と体脂肪率との相関データは、例えば図3に示される近似直線L1によって好適に表される。但し、記憶部40に記憶される相関データは一つの近似直線L1に限定されるものではなく、データ数が増すことによって近似直線が変化してもよい。
FIG. 3 is a graph showing the correlation between the oxygenated hemoglobin concentration (C HbO2 ) in the supraclavicular fossa and the body fat percentage as an example of the correlation stored in the
なお、上記の構成では、指標値演算部33bが酸素化ヘモグロビン濃度及び/または総ヘモグロビン濃度からBAT量に関する指標値を算出しているが、指標値演算部33bは、酸素化ヘモグロビン濃度若しくは総ヘモグロビン濃度に応じて増減するパラメータ(例えば吸収係数μa,λなど)からBAT量に関する指標値を算出してもよく、このパラメータと酸素化ヘモグロビン濃度及び/または総ヘモグロビン濃度との双方を用いてBAT量に関する指標値を算出してもよい。その場合、記憶部40は、体脂肪量に関するパラメータと、上記パラメータとの相関を表すデータを予め記憶しておくとよい。
In the above configuration, the index
以上の構成を備える測定装置1Aの動作、および本発明による測定方法の一実施形態について説明する。図4は、本実施形態による測定方法を示すフローチャートである。図4に示されるように、まず、光入射部10から被測定部位Bに近赤外パルス光P(n)を入射する(光入射ステップS11)。次に、光検出部20において、被測定部位Bの内部を伝搬した近赤外パルス光P(n)の光強度を検出する(光検出ステップS12)。
An operation of the
続いて、光検出部20での検出結果に基づく時間分解分光計測法により、演算部30が、被測定部位Bの酸素化ヘモグロビン濃度及び/又は総ヘモグロビン濃度、及び、酸素化ヘモグロビン濃度若しくは総ヘモグロビン濃度に応じて増減するパラメータ(例えば吸収係数μa,λなど)のうち少なくとも一つの数値を求める。そして、演算部30は、この少なくとも一つの数値から、BAT量に関する指標値を算出する(演算ステップS13)。このとき、パラメータ入力部50から入力される体脂肪量に関するパラメータと、記憶部40に記憶されており上記少なくとも一つの数値との相関を表すデータを使用して、体脂肪量による影響が低減するように補正した数値を、BAT量に関する指標値とするとよい。
Subsequently, by the time-resolved spectroscopic measurement method based on the detection result of the
以上の構成を備える本実施形態の測定装置1A及び測定方法によって得られる効果について説明する。前述したように、現在、PET装置を用いてFDGの組織集積度を計測することにより、BATの活性度を評価できることが発明者らによって見出されている。しかしながら、PET装置を用いるこのような方法では、長時間の寒冷負荷を被験者に与えてBATを活性化させる必要があり、また、FDGを注射後、撮影までの間に1時間ほど安静にしている必要があり、被験者が放射線を受ける必要もあるので、被験者への負担が大きい。更には、測定可能な時期が冬期に限定される。
The effects obtained by the measuring
本発明者らは、研究の末、酸素化ヘモグロビン濃度及び総ヘモグロビン濃度とBAT量との間に、後述する実施例に示されるような有意な相関が存在することを見出した。本発明者らの知見によれば、BATには毛細血管が多く存在しており、活性化すると血液量が増し、WATよりも血液量が多くなる。従って、BATの活性値(FDG集積度の最大値、SUVmax)が高いほど血液量が増すと考えられる。また、本実施形態の測定装置1A及び測定方法では、演算部30及び演算ステップS13において、近赤外分光計測法の一種である時間分解分光計測法によって求められた酸素化ヘモグロビン濃度、総ヘモグロビン濃度、及び、これらに応じて増減する吸収係数などのパラメータ(第1のパラメータ)のうち少なくとも一つの数値に基づいて、BAT量に関する指標値を算出している。このように近赤外分光計測法を用いて非侵襲的に測定することにより、寒冷負荷を与える必要がなく、常温下で短時間(例えば5分間)の測定が可能となる。また、被験者が放射線を受ける必要がない。従って、本実施形態の測定装置1A及び測定方法によれば、被験者の負担を格段に軽減することができる。更には、測定可能な時期が限定されない。そして、このような簡便な方法が普及すれば、被験者が負担なくBAT量を測定することができ、成人の肥満解消法の開発や評価など、人体のBATに関する研究を進展させることができる。
As a result of the study, the present inventors have found that there is a significant correlation between the oxygenated hemoglobin concentration, the total hemoglobin concentration, and the BAT amount as shown in Examples described later. According to the knowledge of the present inventors, BAT has many capillaries, and when activated, the blood volume increases and the blood volume increases compared to WAT. Therefore, it is considered that the blood volume increases as the activity value of BAT (maximum value of FDG accumulation, SUV max ) increases. Further, in the
また、一般的にPET装置は高価且つ大型である。これに対し、本実施形態の測定装置1Aのように、近赤外分光計測装置はPET装置と比較して安価且つ小型に構成されることができる。従って、本実施形態の測定装置1A及び測定方法によれば、BATの測定を極めて簡易に行うことができる。
In general, the PET apparatus is expensive and large. On the other hand, like the
なお、非特許文献1においても近赤外分光計測法を用いているが、非特許文献1では培養細胞を測定対象とし、水の温度に着目して細胞の温度計測を行っている。これに対し、本実施形態による測定装置1A及び測定方法は、ヘモグロビン濃度等とBAT量との関係に着目し、BAT量の定量化を目的としている点で、非特許文献1に記載された方法とは異なる。
In addition, although the near-infrared spectroscopy measurement method is used also in the
また、本実施形態のように、演算部30及び演算ステップS13では、体脂肪量に関するパラメータ(第2のパラメータ)とヘモグロビン濃度等との相関を表すデータを使用して、ヘモグロビン濃度等における体脂肪量による影響が低減するように補正した数値を、BAT量に関する指標値としてもよい。
Further, as in the present embodiment, in the
近赤外分光計測法により測定されたヘモグロビン濃度等は、皮下脂肪などの白色脂肪組織(WAT)の影響を受けやすい。すなわち、WATの吸光度は筋肉と比較して極めて小さく、また、WAT量すなわち体脂肪量の個人差が大きいので、体脂肪が多い人ほどヘモグロビン濃度は低く、体脂肪が少ない人ほどヘモグロビン濃度は高く見積もられてしまう傾向がある。また、BATがエネルギー消費を亢進するので、BATの活性値が高い人ほど体脂肪が少ない傾向がある。従って、体脂肪量の個人差が、ヘモグロビン濃度等の値としてそのまま反映されてしまうおそれがある。本実施形態の測定装置1A及び測定方法では、例えば体脂肪率といった体脂肪量に関するパラメータと、ヘモグロビン濃度等との相関を表すデータを使用して、ヘモグロビン濃度等に含まれる体脂肪量による影響が低減するように数値を補正し、その補正後の数値をBAT量に関する指標値とする。これにより、体脂肪量による指標値への影響を抑えて、BAT量を更に精度良く評価することができる。
The hemoglobin concentration measured by the near-infrared spectroscopic method is easily affected by white adipose tissue (WAT) such as subcutaneous fat. That is, the absorbance of WAT is extremely small compared to muscle, and the individual difference in the amount of WAT, that is, the amount of body fat, is large. Therefore, the person with more body fat has a lower hemoglobin concentration, and the person with less body fat has a higher hemoglobin concentration. There is a tendency to be estimated. Moreover, since BAT promotes energy consumption, people with higher BAT activity values tend to have less body fat. Therefore, individual differences in body fat mass may be reflected directly as values such as hemoglobin concentration. In the
(第1実施例)
続いて、本発明者らが、複数の被験者のBAT活性値とヘモグロビン濃度等との相関を調べた結果について説明する。この実験では、被験者15名に対し、寒冷刺激を行わず、常温(27度)の部屋において各5分間安静状態とし、BAT近傍部である左右の鎖骨上窩と、対照部位である左右の鎖骨下部及び三角筋とのそれぞれにおけるヘモグロビン濃度を時間分解分光計測装置を用いて測定した。また、同一被験者に対し、寒冷刺激(2時間19℃の部屋で足裏を氷嚢で冷やす)を与えたのち、PET装置を用いてFDGの組織集積度を計測することにより、鎖骨上窩(BAT近傍)におけるBATの活性度(SUVmax)を求めた。
(First embodiment)
Subsequently, the results of investigation by the present inventors on the correlation between the BAT activity value of a plurality of subjects and the hemoglobin concentration will be described. In this experiment, 15 subjects were not subjected to cold stimulation, and were rested in a room at room temperature (27 degrees) for 5 minutes each, left and right supraclavicular fossae near the BAT, and left and right clavicles as control sites. The hemoglobin concentration in each of the lower part and the deltoid muscle was measured using a time-resolved spectroscopic measurement device. In addition, after giving a cold stimulus (cooling the sole of the foot with an ice bag in a room at 19 ° C. for 2 hours) to the same subject, the tissue accumulation degree of FDG was measured using a PET device, and the supraclavicular fossa (BAT) The activity (SUV max ) of BAT in the vicinity) was determined.
なお、15名の被験者のPET画像をBAT検出者とBAT非検出者とに分けたところ、BAT検出者は6名、BAT非検出者は9名であった。以下の表1は、BAT検出者及びBAT非検出者それぞれの特性を示す表である。

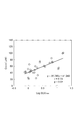
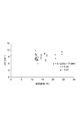
図5〜図7は、酸素化ヘモグロビン濃度CHbO2とBATの活性度SUVmaxとの関係を表すグラフである。図5は鎖骨上窩における関係を示しており、図6は鎖骨下部における関係を示しており、図7は三角筋における関係を示している。縦軸は酸素化ヘモグロビン濃度CHbO2(単位:μM)を表し、横軸は活性度SUVmaxの常用対数値を表している。なお、図5以降の図中において、x及びyを含む関係式は近似直線を表す式であり、Rは近似直線の相関係数である。 5 to 7 are graphs showing the relationship between the oxygenated hemoglobin concentration C HbO2 and the activity SUV max of BAT. FIG. 5 shows the relationship in the supraclavicular fossa, FIG. 6 shows the relationship in the lower clavicle, and FIG. 7 shows the relationship in the deltoid muscle. The vertical axis represents oxygenated hemoglobin concentration C HbO2 (unit: μM), and the horizontal axis represents the common logarithm of activity SUV max . In FIG. 5 and subsequent figures, a relational expression including x and y is an expression representing an approximate line, and R is a correlation coefficient of the approximate line.
図5〜図7に示されるように、何れの被測定部位においても、酸素化ヘモグロビン濃度とBATの活性度SUVmaxとの間に或る程度の相関が見出された。すなわち、BATが存在する鎖骨上窩だけでなく、BATが殆ど存在しない鎖骨下部及び三角筋においても、酸素化ヘモグロビン濃度が大きいほど、活性度SUVmaxも大きくなった。但し、BATが存在する鎖骨上窩においては、その相関が他の被測定部位よりも強く、有意な相関があるといえる。 As shown in FIGS. 5 to 7, a certain degree of correlation was found between the oxygenated hemoglobin concentration and the BAT activity SUV max at any measurement site. That is, not only in the supraclavicular fossa where BAT exists but also in the subclavian and deltoid muscles where BAT hardly exists, the greater the oxygenated hemoglobin concentration, the greater the activity SUV max . However, in the supraclavicular fossa in which BAT is present, the correlation is stronger than that of other measurement sites, and it can be said that there is a significant correlation.
また、本実施例では、酸素化ヘモグロビン濃度CHbO2と体脂肪率との相関を調べるため、各被験者の体脂肪率を計測した。図8〜図10は、酸素化ヘモグロビン濃度CHbO2と体脂肪率との相関を表すグラフである。図8は鎖骨上窩における関係を示しており、図9は鎖骨下部における関係を示しており、図10は三角筋における関係を示している。縦軸は酸素化ヘモグロビン濃度CHbO2(単位:μM)を表し、横軸は体脂肪率(単位:%)を表している。 In this example, the body fat percentage of each subject was measured in order to investigate the correlation between the oxygenated hemoglobin concentration C HbO2 and the body fat percentage. 8 to 10 are graphs showing the correlation between the oxygenated hemoglobin concentration C HbO2 and the body fat percentage. FIG. 8 shows the relationship in the supraclavicular fossa, FIG. 9 shows the relationship in the lower clavicle, and FIG. 10 shows the relationship in the deltoid muscle. The vertical axis represents oxygenated hemoglobin concentration C HbO2 (unit: μM), and the horizontal axis represents body fat percentage (unit:%).
図8〜図10に示されるように、何れの被測定部位においても、算出された酸素化ヘモグロビン濃度CHbO2の値と体脂肪率との間に或る程度の相関が見られた。これは、前述したように、近赤外分光計測法により測定されたヘモグロビン濃度がWATの影響を受けやすいためであると考えられる。そこで、本実施例では、以下に述べる方法(単変量解析)を用いて、酸素化ヘモグロビン濃度CHbO2における体脂肪率による影響が低減されるように補正を行った。 As shown in FIGS. 8 to 10, a certain degree of correlation was found between the calculated oxygenated hemoglobin concentration C HbO2 and the body fat percentage at any measurement site. As described above, this is considered to be because the hemoglobin concentration measured by the near-infrared spectroscopic method is easily influenced by WAT. Therefore, in this example, correction was performed using the method described below (univariate analysis) so that the influence of the body fat percentage on the oxygenated hemoglobin concentration C HbO2 was reduced.
図11は、酸素化ヘモグロビン濃度CHbO2と体脂肪率との典型的な相関を表すグラフである。図11に示されるように、多くの場合、酸素化ヘモグロビン濃度CHbO2と体脂肪率とは線形な関係を有する。いま、被験者全員の体脂肪率x(%)と酸素化ヘモグロビン濃度y(μM)との関係を、
y=ax+b ・・・(2)
とする。例えば、或る被験者の体脂肪率xを15%として上式(2)に代入すると、当該被験者の酸素化ヘモグロビン濃度の理論値C1は
15×a+b=C1 ・・・(3)
となる。当該被験者の酸素化ヘモグロビン濃度の実測値C2から理論値C1を差し引くと、残差Dが生じる。なお、この残差Dは、体脂肪率が0%である場合の酸素化ヘモグロビン濃度に相当する。
C2−C1=D ・・・(4)
ここで、被験者全員の体脂肪率の平均値x0にaを乗じbを加えることにより、酸素化ヘモグロビン濃度の平均値y0が算出される。
y0=ax0+b ・・・(5)
平均値y0に当該被験者の残差Dを加えることにより、補正された酸素化ヘモグロビン濃度値C3が算出される。
C3=D+y0=D+(ax0+b) ・・・(6)
以上の計算によって、体脂肪率による影響が低減されるように補正された酸素化ヘモグロビン濃度CHbO2が得られる。
FIG. 11 is a graph showing a typical correlation between oxygenated hemoglobin concentration C HbO2 and body fat percentage. As shown in FIG. 11, in many cases, the oxygenated hemoglobin concentration C HbO2 and the body fat percentage have a linear relationship. Now, the relationship between the body fat percentage x (%) of all subjects and the oxygenated hemoglobin concentration y (μM),
y = ax + b (2)
And For example, if the body fat percentage x of a subject is 15% and is substituted into the above equation (2), the theoretical value C1 of the oxygenated hemoglobin concentration of the subject is 15 × a + b = C1 (3)
It becomes. When the theoretical value C1 is subtracted from the actual measurement value C2 of the oxygenated hemoglobin concentration of the subject, a residual D is generated. The residual D corresponds to the oxygenated hemoglobin concentration when the body fat percentage is 0%.
C2-C1 = D (4)
Here, the average value y 0 of the oxygenated hemoglobin concentration is calculated by multiplying the average value x 0 of the body fat percentage of all the subjects by a and adding b.
y 0 = ax 0 + b (5)
By the average value y 0 is added a residual D of the subject, corrected oxygenated hemoglobin concentration value C3 is calculated.
C3 = D + y 0 = D + (ax 0 + b) (6)
By the above calculation, the oxygenated hemoglobin concentration C HbO2 corrected to reduce the influence of the body fat percentage is obtained.
なお、ヘモグロビン濃度等の補正方法は上記に限定されない。例えば、体脂肪率に代えて、体脂肪量に関する他のパラメータを用いて補正を行っても良い。他のパラメータとしては、例えば皮下脂肪厚さや分光特性から推定された脂肪量などが挙げられる。図12は、非特許文献6に記載された、皮下脂肪厚さと測定感度との関係の一例を示すグラフである。このような関係を用いて、ヘモグロビン濃度等を補正してもよい。例えば、皮下脂肪厚が5mmであるときの測定感度が0.7である場合、計測されたヘモグロビン濃度等を測定感度0.7で除算することによって、皮下脂肪0mmのときの(すなわち、皮下脂肪厚さの影響が除かれた)ヘモグロビン濃度等を得ることができる。
The correction method for the hemoglobin concentration and the like is not limited to the above. For example, instead of the body fat percentage, correction may be performed using other parameters related to the body fat mass. Examples of other parameters include subcutaneous fat thickness and fat amount estimated from spectral characteristics. FIG. 12 is a graph showing an example of the relationship between subcutaneous fat thickness and measurement sensitivity described in
図13〜図15は、補正後の酸素化ヘモグロビン濃度CHbO2と体脂肪率との関係を表すグラフである。図13は鎖骨上窩における関係を示しており、図14は鎖骨下部における関係を示しており、図15は三角筋における関係を示している。縦軸は補正後の酸素化ヘモグロビン濃度CHbO2(単位:μM)を表し、横軸は体脂肪率(単位:%)を表している。図13〜図15を参照すると、近似直線の傾き及び相関係数Rが極めて小さくなっており、酸素化ヘモグロビン濃度CHbO2が体脂肪率に殆ど影響されていないことがわかる。 FIGS. 13 to 15 are graphs showing the relationship between the corrected oxygenated hemoglobin concentration C HbO2 and the body fat percentage. FIG. 13 shows the relationship in the supraclavicular fossa, FIG. 14 shows the relationship in the lower clavicle, and FIG. 15 shows the relationship in the deltoid muscle. The vertical axis represents the corrected oxygenated hemoglobin concentration C HbO2 (unit: μM), and the horizontal axis represents the body fat percentage (unit:%). Referring to FIGS. 13 to 15, it can be seen that the slope of the approximate line and the correlation coefficient R are extremely small, and the oxygenated hemoglobin concentration C HbO2 is hardly influenced by the body fat percentage.
図16〜図18は、補正後の酸素化ヘモグロビン濃度CHbO2とBATの活性度SUVmaxとの関係を表すグラフである。図16は鎖骨上窩における関係を示しており、図17は鎖骨下部における関係を示しており、図18は三角筋における関係を示している。縦軸は酸素化ヘモグロビン濃度CHbO2(単位:μM)を表し、横軸は活性度SUVmaxの常用対数値を表している。図16〜図18を参照すると、BATが存在する鎖骨上窩のみにおいて、酸素化ヘモグロビン濃度とBATの活性度SUVmaxとの間に強い相関が見出された。従って、補正後の酸素化ヘモグロビン濃度CHbO2に基づいて、BATの活性度SUVmaxを精度良く評価することができる。 16 to 18 are graphs showing the relationship between the corrected oxygenated hemoglobin concentration C HbO2 and the activity SUV max of BAT. FIG. 16 shows the relationship in the supraclavicular fossa, FIG. 17 shows the relationship in the lower clavicle, and FIG. 18 shows the relationship in the deltoid muscle. The vertical axis represents oxygenated hemoglobin concentration C HbO2 (unit: μM), and the horizontal axis represents the common logarithm of activity SUV max . Referring to FIGS. 16 to 18, only in the supraclavicular fossa where BAT exists, a strong correlation was found between the oxygenated hemoglobin concentration and the activity SUV max of BAT. Accordingly, the BAT activity SUV max can be accurately evaluated based on the corrected oxygenated hemoglobin concentration C HbO2 .
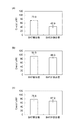
また、前述の表1に示された6名のBAT検出者と9名のBAT非検出者との間で補正後の酸素化ヘモグロビン濃度CHbO2を比較したところ、BATが存在する鎖骨上窩においてのみ、BAT検出者の値が有意に高かった。図19はその比較を示すグラフであり、(a)は鎖骨上窩、(b)は鎖骨下部、(c)は三角筋における補正後の酸素化ヘモグロビン濃度CHbO2(単位:μM)の平均値を表している。図19を参照すると、BATが存在する鎖骨上窩においてのみ、BAT検出者の補正後の酸素化ヘモグロビン濃度CHbO2がBAT非検出者よりも有意に高いことがわかる。また、鎖骨上窩においてのみ、補正後の酸素化ヘモグロビン濃度CHbO2とBATの活性度SUVmaxとの間に強い相関関係が認められた。BATが殆ど存在しない部位(鎖骨下部及び三角筋上)では、このような傾向は認められなかった。 Further, when the corrected oxygenated hemoglobin concentration C HbO2 was compared between the 6 BAT detectors and 9 BAT non-detectors shown in Table 1 above, in the supraclavicular fossa where BAT exists Only the value of the BAT detector was significantly higher. FIG. 19 is a graph showing the comparison, where (a) is the supraclavicular fossa, (b) is the lower clavicle, and (c) is the average value of the corrected oxygenated hemoglobin concentration C HbO2 (unit: μM) in the deltoid muscle. Represents. Referring to FIG. 19, it can be seen that only in the supraclavicular fossa where BAT is present, the corrected oxygenated hemoglobin concentration C HbO2 of the BAT detector is significantly higher than that of the non-BAT detector. Further, only in the supraclavicular fossa, a strong correlation was observed between the corrected oxygenated hemoglobin concentration C HbO2 and the BAT activity SUV max . Such a tendency was not observed at a site where BAT hardly existed (lower clavicle and deltoid muscle).
本実施例では、寒冷刺激を被験者に与えてPETにより測定されたBATの活性値SUVmaxと酸素化ヘモグロビン濃度CHbO2との相関が示されたが、寒冷刺激という一定負荷のもとに生じた活性値SUVmaxは、PETにより定量化されたBAT量と見なすことができる。すなわち、本実施例の結果は、BATが存在する鎖骨上窩において、時間分解分光計測による酸素化ヘモグロビン濃度CHbO2が、BATに存在する多数の毛細血管を反映していることを示すものである。言い換えれば、本実施例の結果は、酸素化ヘモグロビン濃度CHbO2がBATを量的に評価できることを示している。従って、時間分解分光計測による酸素化ヘモグロビン濃度CHbO2を、BAT量に関する指標値とすることができる。また、例えば体脂肪率といった体脂肪量に関するパラメータを用いて補正された酸素化ヘモグロビン濃度CHbO2は、より精度が高い指標値として用いられる。 In this example, a correlation between the BAT activity value SUV max measured by PET with a cold stimulus applied to the subject and the oxygenated hemoglobin concentration C HbO2 was shown, but it occurred under a constant load of cold stimulus. The activity value SUV max can be regarded as the amount of BAT quantified by PET. That is, the result of this example shows that the oxygenated hemoglobin concentration C HbO2 by time-resolved spectroscopic measurement reflects a large number of capillaries existing in BAT in the supraclavicular fossa where BAT exists. . In other words, the result of this example shows that the oxygenated hemoglobin concentration C HbO2 can quantitatively evaluate BAT. Therefore, the oxygenated hemoglobin concentration C HbO2 by time-resolved spectroscopic measurement can be used as an index value for the BAT amount. Further, the oxygenated hemoglobin concentration C HbO2 corrected using a parameter relating to the body fat amount such as the body fat percentage is used as a more accurate index value.
図20〜図22は、体脂肪率により補正された総ヘモグロビン濃度CtHbと、BATの活性度SUVmaxとの関係を表すグラフである。図20は鎖骨上窩における関係を示しており、図21は鎖骨下部における関係を示しており、図22は三角筋における関係を示している。縦軸は総ヘモグロビン濃度CtHb(単位:μM)を表し、横軸は活性度SUVmaxの常用対数値を表している。図20〜図22を参照すると、酸素化ヘモグロビン濃度CHbO2の場合と同様に、BATが存在する鎖骨上窩のみにおいて、総ヘモグロビン濃度CtHbとBATの活性度SUVmaxとの間に強い相関が見出された。従って、総ヘモグロビン濃度CtHbもまた、BAT量に関する指標値として取り扱うことができる。 20 to 22 are graphs showing the relationship between the total hemoglobin concentration C tHb corrected by the body fat percentage and the BAT activity SUV max . FIG. 20 shows the relationship in the supraclavicular fossa, FIG. 21 shows the relationship in the lower clavicle, and FIG. 22 shows the relationship in the deltoid muscle. The vertical axis represents the total hemoglobin concentration C tHb (unit: μM), and the horizontal axis represents the common logarithm of the activity SUV max . Referring to FIGS. 20 to 22, as in the case of the oxygenated hemoglobin concentration C HbO 2 , there is a strong correlation between the total hemoglobin concentration C tHb and the activity SUV max of BAT only in the supraclavicular fossa where BAT exists. It was found. Therefore, the total hemoglobin concentration C tHb can also be handled as an index value related to the BAT amount.
また、酸素化ヘモグロビン濃度CHbO2や総ヘモグロビン濃度CtHbを算出する際に用いられるパラメータ、例えば吸収係数μaもまた、酸素化ヘモグロビン濃度CHbO2や総ヘモグロビン濃度CtHbの増減に応じて増減するので、BATの活性度SUVmaxとの間に強い相関があることは明らかである。従って、このようなパラメータもBAT量に関する指標値として取り扱うことができる。 In addition, parameters used when calculating the oxygenated hemoglobin concentration C HbO2 and the total hemoglobin concentration C tHb , for example, the absorption coefficient μ a also increase or decrease according to the increase or decrease of the oxygenated hemoglobin concentration C HbO2 or the total hemoglobin concentration C tHb. Therefore, it is clear that there is a strong correlation between the BAT activity SUV max . Therefore, such a parameter can also be handled as an index value related to the BAT amount.
図23〜図25は、吸収係数μaとBATの活性度SUVmaxとの関係を表すグラフである。図23は鎖骨上窩における関係を示しており、図24は鎖骨下部における関係を示しており、図25は三角筋における関係を示している。縦軸は吸収係数μa(単位:cm−1)を表し、横軸は活性度SUVmaxの常用対数値を表している。なお、吸収係数μaは、波長800nmでの数値である。 23-25 are graphs showing the relationship between the activity of SUV max of the absorption coefficient mu a and BAT. FIG. 23 shows the relationship in the supraclavicular fossa, FIG. 24 shows the relationship in the lower clavicle, and FIG. 25 shows the relationship in the deltoid muscle. The vertical axis represents the absorption coefficient μ a (unit: cm −1 ), and the horizontal axis represents the common logarithm of the activity SUV max . The absorption coefficient mu a is a numerical value at a wavelength of 800 nm.
図23〜図25に示されるように、何れの被測定部位においても、吸収係数μaとBATの活性度SUVmaxとの間に或る程度の相関が見出された。すなわち、BATが存在する鎖骨上窩だけでなく、BATが殆ど存在しない鎖骨下部及び三角筋においても、吸収係数μaが大きいほど、活性度SUVmaxも大きくなった。但し、BATが存在する鎖骨上窩においては、その相関が他の被測定部位よりも強く、有意な相関があるといえる。 As shown in FIGS. 23 to 25, a certain degree of correlation was found between the absorption coefficient μa and the activity SUV max of the BAT at any measurement site. That, BAT well supraclavicular are present, even in the subclavian and deltoid BAT is hardly present, as the absorption coefficient mu a large, activity SUV max also increased. However, in the supraclavicular fossa in which BAT is present, the correlation is stronger than that of other measurement sites, and it can be said that there is a significant correlation.
また、吸収係数μaと体脂肪率との相関を調べるため、各被験者の体脂肪率を計測した。図26〜図28は、吸収係数μaと体脂肪率との相関を表すグラフである。図26は鎖骨上窩における関係を示しており、図27は鎖骨下部における関係を示しており、図28は三角筋における関係を示している。縦軸は吸収係数μa(単位:cm−1)を表し、横軸は体脂肪率(単位:%)を表している。 Further, in order to examine the correlation between the absorption coefficient mu a body fat percentage was measured body fat percentage of the subject. 26 through 28 are graphs showing the correlation between the absorption coefficient mu a body fat percentage. FIG. 26 shows the relationship in the supraclavicular fossa, FIG. 27 shows the relationship in the lower clavicle, and FIG. 28 shows the relationship in the deltoid muscle. The vertical axis represents the absorption coefficient μ a (unit: cm −1 ), and the horizontal axis represents the body fat percentage (unit:%).
図26〜図28に示されるように、何れの被測定部位においても、算出された吸収係数μaの値と体脂肪率との間に或る程度の相関が見られた。これは、近赤外分光計測法により測定された吸収係数がWATの影響を受けやすいためであると考えられる。そこで、前述した単変量解析を用いて、吸収係数μaにおける体脂肪率による影響が低減されるように補正を行った。 As shown in FIGS. 26 to 28, a certain degree of correlation was found between the calculated value of the absorption coefficient μa and the body fat percentage at any measurement site. This is considered because the absorption coefficient measured by the near-infrared spectroscopy measurement method is easily influenced by WAT. Therefore, correction was performed using the univariate analysis described above so that the influence of the body fat percentage on the absorption coefficient μ a was reduced.
図29〜図31は、補正後の吸収係数μaとBATの活性度SUVmaxとの関係を表すグラフである。図29は鎖骨上窩における関係を示しており、図30は鎖骨下部における関係を示しており、図31は三角筋における関係を示している。縦軸は吸収係数μa(単位:cm−1)を表し、横軸は活性度SUVmaxの常用対数値を表している。図29〜図31を参照すると、BATが存在する鎖骨上窩のみにおいて、吸収係数μaとBATの活性度SUVmaxとの間に強い相関が見出された。従って、補正後の吸収係数μaに基づいて、BATの活性度SUVmaxを精度良く評価できることが示された。なお、吸収係数μaの補正方法は単変量解析に限定されない。例えば、体脂肪率に代えて、体脂肪量に関する他のパラメータを用いて補正を行っても良い。他のパラメータとしては、例えば皮下脂肪厚さや分光特性から推定された脂肪量などが挙げられる。 29 to 31 are graphs showing the relationship between the activity of SUV max of the absorption coefficient mu a and BAT corrected. FIG. 29 shows the relationship in the supraclavicular fossa, FIG. 30 shows the relationship in the lower clavicle, and FIG. 31 shows the relationship in the deltoid muscle. The vertical axis represents the absorption coefficient μ a (unit: cm −1 ), and the horizontal axis represents the common logarithm of the activity SUV max . Referring to FIGS. 29 to 31, only in the supraclavicular fossa BAT is present, a strong correlation was found between the activity of SUV max of the absorption coefficient mu a and BAT. Therefore, based on the absorption coefficient mu a corrected, it has been shown that the activity of SUV max of BAT can be accurately evaluated. The correction method of the absorption coefficient mu a is not limited to univariate analysis. For example, instead of the body fat percentage, correction may be performed using other parameters related to the body fat mass. Examples of other parameters include subcutaneous fat thickness and fat amount estimated from spectral characteristics.
(第2実施形態)
図32は、本発明による測定装置の第2実施形態の構成を概略的に示すブロック図である。本実施形態の測定装置1Bは、第1実施形態の測定装置1Aの演算部30に代えて、演算部30Bを備えている。この演算部30Bは、第1実施形態の演算部30の演算処理部33に代えて、演算処理部35を含む。演算処理部35は、ヘモグロビン濃度演算部35a及び指標値演算部35bを含む。ヘモグロビン濃度演算部35aは、被測定部位Bの吸光特性を表すパラメータを生体光学特性計測部32から取得し、所定の演算を行うことによって、被測定部位Bにおける脱酸素化ヘモグロビン濃度(CHb)を算出する。なお、脱酸素化ヘモグロビン濃度(CHb)を算出方法は第1実施形態と同様である。また、測定装置1Bは、測定装置1Aと異なり、記憶部40及びパラメータ入力部50を備えていない。
(Second Embodiment)
FIG. 32 is a block diagram schematically showing the configuration of the second embodiment of the measuring apparatus according to the present invention. The measuring
本実施形態では、生体光学特性計測部32が、時間波形計測部31によって得られた時間波形に基づいて、被測定部位Bの散乱係数μ’sを算出する。なお、以下の記載において、散乱係数μ’sは換算散乱係数を含む概念である。そして、指標値演算部35bは、被測定部位Bの散乱係数μ’sを生体光学特性計測部32から取得し、ヘモグロビン濃度演算部35aにおいて算出された脱酸素化ヘモグロビン濃度(CHb)、及び、生体光学特性計測部32において算出された散乱係数μ’sのうち少なくとも一方の数値から、BAT量に関する指標値を算出する。
In the present embodiment, the bio-optical
なお、本実施形態の測定装置1Bの動作および測定方法に関するフローチャートは、図4と同様となる。但し、本実施形態では、ステップS13において、散乱係数μ’s及び脱酸素化ヘモグロビン濃度(CHb)のうち少なくとも一方の数値から、BAT量に関する指標値を算出する。
In addition, the flowchart regarding operation | movement and the measuring method of the measuring
以下に示す実施例のように、本発明者らは、研究の末、散乱係数μ’s及び脱酸素化ヘモグロビン濃度(CHb)とBAT量との間に有意な相関が存在することを見出した。従って、以上に説明した本実施形態の測定装置1B及び測定方法によれば、第1実施形態と同様に、被験者の負担を格段に軽減することができ、且つBATの測定を極めて簡易に行うことができる。
As in the examples shown below, the present inventors have found that a significant correlation exists between the scattering coefficient μ ′ s and the deoxygenated hemoglobin concentration (C Hb ) and the amount of BAT after the study. It was. Therefore, according to the
(第2実施例)
続いて、本発明者らが、複数の被験者のBAT活性値と散乱係数μ’s及び脱酸素化ヘモグロビン濃度(CHb)との相関を調べた結果について説明する。この実験は、第1実施例と同様の方法により行われた。図33〜図35は、散乱係数μ’sとBATの活性度SUVmaxとの関係を表すグラフである。図33は鎖骨上窩における関係を示しており、図34は鎖骨下部における関係を示しており、図35は三角筋における関係を示している。縦軸は散乱係数μ’s(単位:cm−1)を表し、横軸は活性度SUVmaxの常用対数値を表している。なお、散乱係数μ’sは、波長760nmでの数値である。
(Second embodiment)
Subsequently, the present inventors will explain the results of examining the correlation between the BAT activity value, scattering coefficient μ ′ s, and deoxygenated hemoglobin concentration (C Hb ) of a plurality of subjects. This experiment was performed by the same method as in the first example. 33 to 35 are graphs showing the relationship between the scattering coefficient μ ′ s and the BAT activity SUV max . FIG. 33 shows the relationship in the supraclavicular fossa, FIG. 34 shows the relationship in the lower clavicle, and FIG. 35 shows the relationship in the deltoid muscle. The vertical axis represents the scattering coefficient μ ′ s (unit: cm −1 ), and the horizontal axis represents the common logarithm of the activity SUV max . The scattering coefficient μ ′ s is a numerical value at a wavelength of 760 nm.
図33〜図35を参照すると、BATが存在する鎖骨上窩のみにおいて、散乱係数μ’sとBATの活性度SUVmaxとの間に強い相関が見出された。従って、散乱係数μ’sに基づいて、BATの活性度SUVmaxを精度良く評価できることが示された。 Referring to FIGS. 33 to 35, only in the supraclavicular fossa where BAT exists, a strong correlation was found between the scattering coefficient μ ′ s and the activity SUV max of BAT. Therefore, it was shown that the activity SUV max of BAT can be evaluated with high accuracy based on the scattering coefficient μ ′ s .
また、散乱係数μ’sと体脂肪率との相関を調べるため、各被験者の体脂肪率を計測した。図36〜図38は、散乱係数μ’sと体脂肪率との相関を表すグラフである。図36は鎖骨上窩における関係を示しており、図37は鎖骨下部における関係を示しており、図38は三角筋における関係を示している。縦軸は散乱係数μ’s(単位:cm−1)を表し、横軸は体脂肪率(単位:%)を表している。 In addition, the body fat percentage of each subject was measured in order to examine the correlation between the scattering coefficient μ ′ s and the body fat percentage. 36 to 38 are graphs showing the correlation between the scattering coefficient μ ′ s and the body fat percentage. FIG. 36 shows the relationship in the supraclavicular fossa, FIG. 37 shows the relationship in the lower clavicle, and FIG. 38 shows the relationship in the deltoid muscle. The vertical axis represents the scattering coefficient μ ′ s (unit: cm −1 ), and the horizontal axis represents the body fat percentage (unit:%).
図36〜図38に示されるように、何れの被測定部位においても、算出された散乱係数μ’sの値と体脂肪率との間には殆ど相関が見られなかった。これは、BAT量と散乱係数μ’sとの間の相関はBAT細胞に含まれるミトコンドリアに起因し、体脂肪率は散乱係数μ’sに影響を及ぼさないからであると考えられる。従って、散乱係数μ’sからBAT量に関する指標値を算出する場合には、体脂肪率による補正を行わなくても精度良く算出することができる。 As shown in FIGS. 36 to 38, almost no correlation was found between the calculated value of the scattering coefficient μ ′ s and the body fat percentage at any measurement site. This is presumably because the correlation between the amount of BAT and the scattering coefficient μ ′ s is caused by mitochondria contained in the BAT cells, and the body fat percentage does not affect the scattering coefficient μ ′ s . Therefore, when calculating the index value related to the BAT amount from the scattering coefficient μ ′ s, it is possible to calculate with high accuracy without performing correction based on the body fat percentage.
図39は、脱酸素化ヘモグロビン濃度(CHb)とBATの活性度SUVmaxとの関係を表すグラフであって、鎖骨上窩における関係を示している。縦軸は脱酸素化ヘモグロビン濃度(CHb)(単位:μM)を表し、横軸は活性度SUVmaxの常用対数値を表している。図39を参照すると、BATが存在する鎖骨上窩において、脱酸素化ヘモグロビン濃度(CHb)とBATの活性度SUVmaxとの間に強い相関が見出された。従って、脱酸素化ヘモグロビン濃度(CHb)に基づいて、BATの活性度SUVmaxを精度良く評価できることが示された。 FIG. 39 is a graph showing the relationship between the deoxygenated hemoglobin concentration (C Hb ) and the BAT activity SUV max , showing the relationship in the supraclavicular fossa. The vertical axis represents the deoxygenated hemoglobin concentration (C Hb ) (unit: μM), and the horizontal axis represents the common logarithm of the activity SUV max . Referring to FIG. 39, a strong correlation was found between deoxygenated hemoglobin concentration (C Hb ) and BAT activity SUV max in the supraclavicular fossa where BAT was present. Therefore, it was shown that the activity SUV max of BAT can be accurately evaluated based on the deoxygenated hemoglobin concentration (C Hb ).
また、脱酸素化ヘモグロビン濃度(CHb)と体脂肪率との相関を調べるため、各被験者の体脂肪率を計測した。図40は、脱酸素化ヘモグロビン濃度(CHb)と体脂肪率との相関を表すグラフであって、鎖骨上窩における関係を示している。縦軸は脱酸素化ヘモグロビン濃度(CHb)(単位:μM)を表し、横軸は体脂肪率(単位:%)を表している。図40に示されるように、算出された脱酸素化ヘモグロビン濃度(CHb)の値と体脂肪率との間には殆ど相関が見られなかった。従って、脱酸素化ヘモグロビン濃度(CHb)からBAT量に関する指標値を算出する場合には、体脂肪率による補正を行わなくても精度良く算出することができる。 Moreover, in order to investigate the correlation between deoxygenated hemoglobin concentration (C Hb ) and body fat percentage, the body fat percentage of each subject was measured. FIG. 40 is a graph showing the correlation between the deoxygenated hemoglobin concentration (C Hb ) and the body fat percentage, and shows the relationship in the supraclavicular fossa. The vertical axis represents deoxygenated hemoglobin concentration (C Hb ) (unit: μM), and the horizontal axis represents body fat percentage (unit:%). As shown in FIG. 40, there was almost no correlation between the calculated deoxygenated hemoglobin concentration (C Hb ) value and body fat percentage. Therefore, when calculating the index value related to the BAT amount from the deoxygenated hemoglobin concentration (C Hb ), it is possible to calculate with high accuracy without performing correction based on the body fat percentage.
(第3実施形態)
図41は、本発明による測定装置の第3実施形態の構成を概略的に示すブロック図である。本実施形態の測定装置1Cは、第1実施形態の測定装置1Aの演算部30に代えて、演算部30Cを備えている。この演算部30Cは、第1実施形態の演算部30の構成に加えて、判別部34を更に有している。なお、判別部34を除く演算部30Cの構成は演算部30と同様なので、詳細な説明を省略する。
(Third embodiment)
FIG. 41 is a block diagram schematically showing the configuration of the third embodiment of the measuring apparatus according to the present invention. The
判別部34は、演算処理部33の指標値演算部33bからBAT量に関する指標値の提供を受ける。判別部34は、この指標値と所定の閾値とを比較することにより、被験者のBAT量が陰性及び陽性の何れであるかを判別する。具体的には、判別部34は、指標値が閾値を超える場合に陽性と判別し、指標値が閾値を超えない場合に陰性と判別する。この判別結果は、例えば表示装置80においてBAT量に関する指標値とともに表示される。
The
図42は、本実施形態による測定装置1Bの動作および測定方法を示すフローチャートである。図42に示されるように、本実施形態では、第1実施形態による測定方法(図4を参照)に加えて、判別ステップS14を備えている。判別ステップS14では、判別部34が、演算ステップS13において算出されたBAT量に関する指標値と所定の閾値とを比較することにより、被験者のBAT量が陰性及び陽性の何れであるかが判別される。
FIG. 42 is a flowchart showing the operation and the measuring method of the measuring
本実施形態の測定装置1C及び測定方法によれば、第1実施形態と同様に、被験者の負担を格段に軽減することができ、且つBATの測定を極めて簡易に行うことができる。また、BAT量の陰性と陽性との境界はSUVmaxで約2.0といわれており、現在、陰性か陽性かの判別は、PET画像に基づく放射線技師の目視によって行われている。本実施形態の測定装置1C及び測定方法によれば、前述した第1実施例において述べたようにBAT量を精度良く評価することができるので、BAT量が陰性か陽性かを簡易に且つ精度良く判別することができる。なお、本実施形態の判別部34は、第2実施形態の演算部30Bに設けられることもできる。
According to the
(第3実施例)
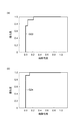
本実施形態による効果を検証するために、判別部34(判別ステップS14)での判別結果と、PET画像に基づく目視での判別結果とを用いて、受信者動作特性(Receiver Operatorating Characteristic Curve;ROC)曲線を作成した。図43〜図46にその結果を示す。図43(a)は、酸素化ヘモグロビン濃度CHbO2から算出された指標値に基づく判別結果のROC曲線である。また、図43(b)は総ヘモグロビン濃度CtHb、図44(a)は吸収係数μa(波長760nm)、図44(b)は吸収係数μa(波長800nm)、図45(a)は散乱係数μ’s(波長760nm)、図45(b)は散乱係数μ’s(波長800nm)、図46(a)は脱酸素化ヘモグロビン濃度CHbからそれぞれ算出された指標値に基づくROC曲線である。なお、比較のため、図46(b)には、酸素飽和度SO2から算出された指標値に基づく判別結果のROC曲線が示されている。なお、図43〜図46において、縦軸は陽性度(感度、陽性的中率ともいう)を表し、横軸は偽陰性度(1から特異度(陰性的中率ともいう)を差し引いた値)を表している。また、いずれのROC曲線においても、体脂肪量に関するパラメータによる補正は施されていない。
(Third embodiment)
In order to verify the effect according to the present embodiment, a receiver operating characteristic (ROC) is obtained by using a discrimination result in the discrimination unit 34 (discrimination step S14) and a visual discrimination result based on the PET image. ) Created a curve. The results are shown in FIGS. FIG. 43A is an ROC curve of a discrimination result based on the index value calculated from the oxygenated hemoglobin concentration C HbO2 . 43B shows the total hemoglobin concentration C tHb , FIG. 44A shows the absorption coefficient μ a (wavelength 760 nm), FIG. 44B shows the absorption coefficient μ a (wavelength 800 nm), and FIG. Scattering coefficient μ ′ s (wavelength 760 nm), FIG. 45B is the scattering coefficient μ ′ s (wavelength 800 nm), and FIG. 46A is the ROC curve based on the index values calculated from the deoxygenated hemoglobin concentration C Hb. It is. For comparison, FIG. 46B shows a ROC curve of a discrimination result based on the index value calculated from the oxygen saturation SO 2 . 43 to 46, the vertical axis represents the positive degree (also referred to as sensitivity and positive predictive value), and the horizontal axis represents the value obtained by subtracting the false negative degree (specificity (also referred to as negative predictive value) from 1). ). Moreover, in any ROC curve, the correction by the parameter regarding the body fat mass is not performed.
図43〜図46に示された各ROC曲線G21〜G28の閾値(カットオフポイント)、感性度(陽性的中率)、特異度(陰性的中率)、および的中率(正診率)は次の表2に示されるものとなった。
表2に示されるように、酸素化ヘモグロビン濃度CHbO2、総ヘモグロビン濃度CtHb、吸収係数μa、散乱係数μ’s、又は脱酸素化ヘモグロビン濃度CHbから算出される指標値を用いた判別結果と、PET画像に基づく目視での判別結果とは、高い確率で一致した。このことから、上記第3実施形態によれば、BAT量が陰性か陽性かを精度良く判別できることがわかる。 As shown in Table 2, discrimination using an index value calculated from oxygenated hemoglobin concentration C HbO2 , total hemoglobin concentration C tHb , absorption coefficient μ a , scattering coefficient μ ′ s , or deoxygenated hemoglobin concentration C Hb The result and the visual discrimination result based on the PET image agreed with high probability. From this, it can be seen that according to the third embodiment, it is possible to accurately determine whether the BAT amount is negative or positive.
本発明によるBATの測定方法及び測定装置は、上述した実施形態に限られるものではなく、他に様々な変形が可能である。例えば、上記実施形態では時間分解分光計測法を用いてヘモグロビン濃度を算出しているが、本発明の演算部及び演算ステップにおいて使用される近赤外分光計測法としては、例えば位相変調分光法、空間分解分光法、Micro-beer lambert法など様々な方法が適用可能である。 The BAT measurement method and measurement apparatus according to the present invention are not limited to the above-described embodiments, and various other modifications are possible. For example, the hemoglobin concentration is calculated using the time-resolved spectroscopic measurement method in the above embodiment, but as the near infrared spectroscopic measurement method used in the calculation unit and the calculation step of the present invention, for example, phase modulation spectroscopy, Various methods such as spatially resolved spectroscopy and micro-beer lambert method can be applied.
1A…測定装置、10…光入射部、11…パルス光源、12…光入射用光ガイド、20…光検出部、21…光検出用光ガイド、22…光検出器、30…演算部、31…時間波形計測部、32…生体光学特性計測部、33…演算処理部、33a…ヘモグロビン濃度演算部、33b…指標値演算部、40…記憶部、50…パラメータ入力部、60…制御部、70…本体部、80…表示装置、B…被測定部位、D…光検出位置、L1…近似直線、P(n)…近赤外パルス光、S…光入射位置。
DESCRIPTION OF
Claims (7)
光検出部において、前記被測定部位の内部を伝搬した前記近赤外光の光強度を検出する光検出ステップと、
前記光検出部での検出結果に基づく近赤外分光計測法によって求められる、前記被測定部位の酸素化ヘモグロビン濃度、総ヘモグロビン濃度、及び、前記酸素化ヘモグロビン濃度若しくは前記総ヘモグロビン濃度に応じて増減する第1のパラメータのうち少なくとも一つの数値から褐色脂肪組織量に関する指標値を算出する演算ステップと
を備えることを特徴とする、褐色脂肪組織の測定方法。 A light incident step for injecting near-infrared light from the light incident portion to the measurement site;
In the light detection unit, a light detection step of detecting the light intensity of the near-infrared light that has propagated through the measurement site;
Increased / decreased according to the oxygenated hemoglobin concentration, total hemoglobin concentration, and oxygenated hemoglobin concentration or total hemoglobin concentration of the measurement site, determined by a near-infrared spectroscopy measurement method based on the detection result of the light detection unit A calculation step of calculating an index value related to the amount of brown adipose tissue from at least one of the first parameters.
光検出部において、前記被測定部位の内部を伝搬した前記近赤外光の光強度を検出する光検出ステップと、
前記光検出部での検出結果に基づく近赤外分光計測法によって求められる、前記被測定部位の散乱係数及び脱酸素化ヘモグロビン濃度のうち少なくとも一方から褐色脂肪組織量に関する指標値を算出する演算ステップと
を備えることを特徴とする、褐色脂肪組織の測定方法。 A light incident step for injecting near-infrared light from the light incident portion to the measurement site;
In the light detection unit, a light detection step of detecting the light intensity of the near-infrared light that has propagated through the measurement site;
Calculation step for calculating an index value related to the amount of brown adipose tissue obtained from at least one of a scattering coefficient and a deoxygenated hemoglobin concentration of the measurement site, which is obtained by a near-infrared spectroscopic measurement method based on a detection result in the light detection unit A method for measuring brown adipose tissue, comprising:
前記被測定部位の内部を伝搬した前記近赤外光の光強度を検出する光検出部と、
前記光検出部での検出結果に基づく近赤外分光計測法によって求められる、前記被測定部位の酸素化ヘモグロビン濃度、総ヘモグロビン濃度、及び、前記酸素化ヘモグロビン濃度若しくは前記総ヘモグロビン濃度に応じて増減する第1のパラメータのうち少なくとも一つの数値から褐色脂肪組織量に関する指標値を算出する演算部と
を備えることを特徴とする、褐色脂肪組織の測定装置。 A light incident part for injecting near-infrared light into the measurement site;
A light detection unit that detects the light intensity of the near-infrared light that has propagated through the measurement site;
Increased / decreased according to the oxygenated hemoglobin concentration, total hemoglobin concentration, and oxygenated hemoglobin concentration or total hemoglobin concentration of the measurement site, determined by a near-infrared spectroscopy measurement method based on the detection result of the light detection unit And a calculation unit that calculates an index value related to the amount of brown adipose tissue from at least one of the first parameters.
前記演算部は、前記データを使用して、前記少なくとも一つの数値に含まれる前記体脂肪量による影響が低減するように補正した数値を、前記褐色脂肪組織量に関する指標値とすることを特徴とする、請求項4に記載の褐色脂肪組織の測定装置。 A storage unit for storing data representing a correlation between the second parameter relating to body fat mass and the at least one numerical value or measurement sensitivity;
The arithmetic unit uses the data to set a numerical value corrected so as to reduce the influence of the body fat amount contained in the at least one numerical value as an index value related to the brown fat tissue amount. The apparatus for measuring brown adipose tissue according to claim 4 .
前記被測定部位の内部を伝搬した前記近赤外光の光強度を検出する光検出部と、
前記光検出部での検出結果に基づく近赤外分光計測法によって求められる、前記被測定部位の散乱係数及び脱酸素化ヘモグロビン濃度のうち少なくとも一方から褐色脂肪組織量に関する指標値を算出する演算部と
を備えることを特徴とする、褐色脂肪組織の測定装置。 A light incident part for injecting near-infrared light into the measurement site;
A light detection unit that detects the light intensity of the near-infrared light that has propagated through the measurement site;
A calculation unit that calculates an index value related to the amount of brown adipose tissue from at least one of a scattering coefficient and a deoxygenated hemoglobin concentration of the measurement site, which is obtained by a near-infrared spectroscopic measurement method based on a detection result in the light detection unit An apparatus for measuring brown adipose tissue, comprising:
Priority Applications (6)
| Application Number | Priority Date | Filing Date | Title |
|---|---|---|---|
| JP2014006914A JP6224464B2 (en) | 2013-09-12 | 2014-01-17 | Method and apparatus for measuring brown adipose tissue |
| US14/917,581 US10478122B2 (en) | 2013-09-12 | 2014-08-27 | Measurement method and measurement device for brown adipose tissue |
| GB1605950.3A GB2534735B (en) | 2013-09-12 | 2014-08-27 | Measurement method and measurement device for brown adipose tissue |
| DE112014004196.3T DE112014004196T5 (en) | 2013-09-12 | 2014-08-27 | Measurement method and measuring device for brown adipose tissue |
| PCT/JP2014/072497 WO2015037446A1 (en) | 2013-09-12 | 2014-08-27 | Measurement method and measurement device for brown adipose tissue |
| GB1805155.7A GB2560268B (en) | 2013-09-12 | 2014-08-27 | Measurement method and measurement device for brown adipose tissue |
Applications Claiming Priority (3)
| Application Number | Priority Date | Filing Date | Title |
|---|---|---|---|
| JP2013189632 | 2013-09-12 | ||
| JP2013189632 | 2013-09-12 | ||
| JP2014006914A JP6224464B2 (en) | 2013-09-12 | 2014-01-17 | Method and apparatus for measuring brown adipose tissue |
Publications (3)
| Publication Number | Publication Date |
|---|---|
| JP2015077387A JP2015077387A (en) | 2015-04-23 |
| JP2015077387A5 JP2015077387A5 (en) | 2017-02-02 |
| JP6224464B2 true JP6224464B2 (en) | 2017-11-01 |
Family
ID=52665559
Family Applications (1)
| Application Number | Title | Priority Date | Filing Date |
|---|---|---|---|
| JP2014006914A Active JP6224464B2 (en) | 2013-09-12 | 2014-01-17 | Method and apparatus for measuring brown adipose tissue |
Country Status (5)
| Country | Link |
|---|---|
| US (1) | US10478122B2 (en) |
| JP (1) | JP6224464B2 (en) |
| DE (1) | DE112014004196T5 (en) |
| GB (2) | GB2534735B (en) |
| WO (1) | WO2015037446A1 (en) |
Cited By (1)
| Publication number | Priority date | Publication date | Assignee | Title |
|---|---|---|---|---|
| DE112021006832T5 (en) | 2021-01-18 | 2023-11-16 | Hamamatsu Photonics K.K. | Analysis device and analysis method |
Families Citing this family (1)
| Publication number | Priority date | Publication date | Assignee | Title |
|---|---|---|---|---|
| US10827974B2 (en) * | 2016-01-22 | 2020-11-10 | The Regents Of The University Of California | Predicting weight loss and fat metabolism using optical signal changes in fat |
Family Cites Families (3)
| Publication number | Priority date | Publication date | Assignee | Title |
|---|---|---|---|---|
| EP1086494A4 (en) * | 1998-05-15 | 2006-09-20 | Glaxo Group Ltd | Infrared thermography |
| AU2001254566A1 (en) * | 2000-04-13 | 2001-10-30 | National Research Council Of Canada Ltd. | Tissue viability/health monitor utilizing near infrared spectroscopy |
| WO2009067501A2 (en) * | 2007-11-19 | 2009-05-28 | Joslin Diabetes Center, Inc. | Infrared thermography for monitoring brown adipose tissue |
-
2014
- 2014-01-17 JP JP2014006914A patent/JP6224464B2/en active Active
- 2014-08-27 US US14/917,581 patent/US10478122B2/en active Active
- 2014-08-27 WO PCT/JP2014/072497 patent/WO2015037446A1/en active Application Filing
- 2014-08-27 GB GB1605950.3A patent/GB2534735B/en active Active
- 2014-08-27 GB GB1805155.7A patent/GB2560268B/en active Active
- 2014-08-27 DE DE112014004196.3T patent/DE112014004196T5/en active Pending
Cited By (1)
| Publication number | Priority date | Publication date | Assignee | Title |
|---|---|---|---|---|
| DE112021006832T5 (en) | 2021-01-18 | 2023-11-16 | Hamamatsu Photonics K.K. | Analysis device and analysis method |
Also Published As
| Publication number | Publication date |
|---|---|
| GB2560268B (en) | 2018-12-05 |
| GB2560268A (en) | 2018-09-05 |
| JP2015077387A (en) | 2015-04-23 |
| US10478122B2 (en) | 2019-11-19 |
| GB2534735B (en) | 2018-08-01 |
| US20160220183A1 (en) | 2016-08-04 |
| DE112014004196T5 (en) | 2016-06-23 |
| WO2015037446A1 (en) | 2015-03-19 |
| GB2534735A (en) | 2016-08-03 |
| GB201805155D0 (en) | 2018-05-16 |
Similar Documents
| Publication | Publication Date | Title |
|---|---|---|
| KR101399907B1 (en) | Measuring tissue oxygenation | |
| US7884933B1 (en) | Apparatus and method for determining analyte concentrations | |
| CN102058393B (en) | Method for measuring kin physiology parameters and optical property parameters based on reflective spectral measurement | |
| US8369914B2 (en) | Optical measuring apparatus, optical measuring method, and storage medium that stores optical measuring program | |
| JP5674093B2 (en) | Concentration determination apparatus, concentration determination method, and program | |
| US9259486B2 (en) | Method and system for calculating a quantification indicator for quantifying a dermal reaction on the skin of a living being | |
| JP5527658B2 (en) | Scattering absorber measurement method and apparatus | |
| Ueda et al. | Time-resolved optical mammography and its preliminary clinical results | |
| EP3315943B1 (en) | Scattering absorber measurement device and scattering absorber measurement method | |
| JP6043276B2 (en) | Scattering absorber measuring apparatus and scattering absorber measuring method | |
| JP6224464B2 (en) | Method and apparatus for measuring brown adipose tissue | |
| JP5521199B2 (en) | Concentration determination apparatus, concentration determination method, and program | |
| Rogatkin et al. | Metrological support of methods and devices for noninvasive medical spectrophotometry | |
| JP2012085877A (en) | Concentration determination apparatus, concentration determination method, and program | |
| Kanishyna et al. | Study of tissue microcirculation disorders after tooth extraction by photoplethysmography in diabetic patients | |
| JP5626880B2 (en) | Concentration determination apparatus, concentration determination method, and program | |
| Shkilniak et al. | Photoplethysmography method for investigation of tissue microcirculation disorders after tooth extraction | |
| US20240099586A1 (en) | Analysis device and analysis method | |
| Huong et al. | Three-wavelength system for practical application in skin oximetry: simultaneous equations with prediction-correction approach | |
| JP5818038B2 (en) | Concentration determination apparatus, concentration determination method, and program | |
| Pereira et al. | Distributed non-invasive system for measuring the arterial input function in PET | |
| Vasudevan et al. | Skin microcirculatory responses: A potential marker for early diabetic neuropathy assessment using a low‐cost portable diffuse optical spectrometry device | |
| Zhao | Noninvasive Multimodal Diffuse Optical Imaging of Vulnerable Tissue Hemodynamics | |
| Wabnitz et al. | Depth-selective analysis of responses to functional stimulation recorded with a time-domain NIR brain imager | |
| Khalid | Development and Validation of a Stand-Alone DCS System for Monitoring Absolute Cerebral Blood Flow |
Legal Events
| Date | Code | Title | Description |
|---|---|---|---|
| A521 | Request for written amendment filed |
Free format text: JAPANESE INTERMEDIATE CODE: A523 Effective date: 20160421 |
|
| A711 | Notification of change in applicant |
Free format text: JAPANESE INTERMEDIATE CODE: A711 Effective date: 20160421 |
|
| A521 | Request for written amendment filed |
Free format text: JAPANESE INTERMEDIATE CODE: A821 Effective date: 20160421 |
|
| A521 | Request for written amendment filed |
Free format text: JAPANESE INTERMEDIATE CODE: A523 Effective date: 20161215 |
|
| A621 | Written request for application examination |
Free format text: JAPANESE INTERMEDIATE CODE: A621 Effective date: 20161215 |
|
| TRDD | Decision of grant or rejection written | ||
| A01 | Written decision to grant a patent or to grant a registration (utility model) |
Free format text: JAPANESE INTERMEDIATE CODE: A01 Effective date: 20170912 |
|
| A61 | First payment of annual fees (during grant procedure) |
Free format text: JAPANESE INTERMEDIATE CODE: A61 Effective date: 20171005 |
|
| R150 | Certificate of patent or registration of utility model |
Ref document number: 6224464 Country of ref document: JP Free format text: JAPANESE INTERMEDIATE CODE: R150 |
|
| R250 | Receipt of annual fees |
Free format text: JAPANESE INTERMEDIATE CODE: R250 |
|
| R250 | Receipt of annual fees |
Free format text: JAPANESE INTERMEDIATE CODE: R250 |
|
| R250 | Receipt of annual fees |
Free format text: JAPANESE INTERMEDIATE CODE: R250 |
|
| R250 | Receipt of annual fees |
Free format text: JAPANESE INTERMEDIATE CODE: R250 |