JP6214563B2 - Automated detection of areas at risk using quantitative T1 mapping - Google Patents
Automated detection of areas at risk using quantitative T1 mapping Download PDFInfo
- Publication number
- JP6214563B2 JP6214563B2 JP2014553834A JP2014553834A JP6214563B2 JP 6214563 B2 JP6214563 B2 JP 6214563B2 JP 2014553834 A JP2014553834 A JP 2014553834A JP 2014553834 A JP2014553834 A JP 2014553834A JP 6214563 B2 JP6214563 B2 JP 6214563B2
- Authority
- JP
- Japan
- Prior art keywords
- image
- contrast
- medical imaging
- imaging system
- tissue type
- Prior art date
- Legal status (The legal status is an assumption and is not a legal conclusion. Google has not performed a legal analysis and makes no representation as to the accuracy of the status listed.)
- Expired - Fee Related
Links
- 238000001514 detection method Methods 0.000 title description 2
- 238000013507 mapping Methods 0.000 title 1
- 206010061216 Infarction Diseases 0.000 claims description 40
- 230000007574 infarction Effects 0.000 claims description 39
- 210000004165 myocardium Anatomy 0.000 claims description 28
- 238000002059 diagnostic imaging Methods 0.000 claims description 27
- 239000008280 blood Substances 0.000 claims description 26
- 210000004369 blood Anatomy 0.000 claims description 25
- 238000003384 imaging method Methods 0.000 claims description 24
- 238000000034 method Methods 0.000 claims description 23
- 238000004458 analytical method Methods 0.000 claims description 16
- 230000011218 segmentation Effects 0.000 claims description 13
- 238000002591 computed tomography Methods 0.000 claims description 6
- 230000008520 organization Effects 0.000 claims description 6
- 238000010586 diagram Methods 0.000 claims description 3
- 238000002600 positron emission tomography Methods 0.000 claims description 3
- 238000002603 single-photon emission computed tomography Methods 0.000 claims description 3
- 210000001519 tissue Anatomy 0.000 claims 18
- 238000004590 computer program Methods 0.000 claims 2
- 239000002872 contrast media Substances 0.000 description 13
- 230000002861 ventricular Effects 0.000 description 10
- 230000006870 function Effects 0.000 description 9
- 230000008901 benefit Effects 0.000 description 8
- 238000005259 measurement Methods 0.000 description 8
- 208000010125 myocardial infarction Diseases 0.000 description 6
- 238000012986 modification Methods 0.000 description 4
- 230000004048 modification Effects 0.000 description 4
- 238000012800 visualization Methods 0.000 description 4
- 230000000747 cardiac effect Effects 0.000 description 3
- 230000033001 locomotion Effects 0.000 description 3
- 238000011002 quantification Methods 0.000 description 3
- 208000032544 Cicatrix Diseases 0.000 description 2
- 206010047281 Ventricular arrhythmia Diseases 0.000 description 2
- 230000001737 promoting effect Effects 0.000 description 2
- 231100000241 scar Toxicity 0.000 description 2
- 230000037387 scars Effects 0.000 description 2
- 230000035945 sensitivity Effects 0.000 description 2
- GYHNNYVSQQEPJS-UHFFFAOYSA-N Gallium Chemical compound [Ga] GYHNNYVSQQEPJS-UHFFFAOYSA-N 0.000 description 1
- 206010022998 Irritability Diseases 0.000 description 1
- 206010049418 Sudden Cardiac Death Diseases 0.000 description 1
- 230000008859 change Effects 0.000 description 1
- 238000012512 characterization method Methods 0.000 description 1
- 239000003086 colorant Substances 0.000 description 1
- 230000000295 complement effect Effects 0.000 description 1
- 230000008602 contraction Effects 0.000 description 1
- 238000013523 data management Methods 0.000 description 1
- 230000003111 delayed effect Effects 0.000 description 1
- 230000004064 dysfunction Effects 0.000 description 1
- 210000001174 endocardium Anatomy 0.000 description 1
- 239000003623 enhancer Substances 0.000 description 1
- 230000007613 environmental effect Effects 0.000 description 1
- 229910052733 gallium Inorganic materials 0.000 description 1
- 238000010191 image analysis Methods 0.000 description 1
- 238000002347 injection Methods 0.000 description 1
- 239000007924 injection Substances 0.000 description 1
- 238000002075 inversion recovery Methods 0.000 description 1
- 238000007726 management method Methods 0.000 description 1
- 239000011159 matrix material Substances 0.000 description 1
- 238000011084 recovery Methods 0.000 description 1
- 230000037390 scarring Effects 0.000 description 1
- 230000000638 stimulation Effects 0.000 description 1
- 238000003325 tomography Methods 0.000 description 1
Images


Classifications
-
- G—PHYSICS
- G06—COMPUTING; CALCULATING OR COUNTING
- G06T—IMAGE DATA PROCESSING OR GENERATION, IN GENERAL
- G06T7/00—Image analysis
- G06T7/0002—Inspection of images, e.g. flaw detection
- G06T7/0012—Biomedical image inspection
-
- G—PHYSICS
- G06—COMPUTING; CALCULATING OR COUNTING
- G06F—ELECTRIC DIGITAL DATA PROCESSING
- G06F18/00—Pattern recognition
- G06F18/20—Analysing
- G06F18/23—Clustering techniques
- G06F18/232—Non-hierarchical techniques
- G06F18/2321—Non-hierarchical techniques using statistics or function optimisation, e.g. modelling of probability density functions
-
- G—PHYSICS
- G06—COMPUTING; CALCULATING OR COUNTING
- G06T—IMAGE DATA PROCESSING OR GENERATION, IN GENERAL
- G06T19/00—Manipulating 3D models or images for computer graphics
- G06T19/20—Editing of 3D images, e.g. changing shapes or colours, aligning objects or positioning parts
-
- G—PHYSICS
- G06—COMPUTING; CALCULATING OR COUNTING
- G06T—IMAGE DATA PROCESSING OR GENERATION, IN GENERAL
- G06T7/00—Image analysis
- G06T7/10—Segmentation; Edge detection
- G06T7/11—Region-based segmentation
-
- G—PHYSICS
- G06—COMPUTING; CALCULATING OR COUNTING
- G06T—IMAGE DATA PROCESSING OR GENERATION, IN GENERAL
- G06T7/00—Image analysis
- G06T7/10—Segmentation; Edge detection
- G06T7/174—Segmentation; Edge detection involving the use of two or more images
-
- G—PHYSICS
- G06—COMPUTING; CALCULATING OR COUNTING
- G06T—IMAGE DATA PROCESSING OR GENERATION, IN GENERAL
- G06T7/00—Image analysis
- G06T7/30—Determination of transform parameters for the alignment of images, i.e. image registration
- G06T7/33—Determination of transform parameters for the alignment of images, i.e. image registration using feature-based methods
-
- G—PHYSICS
- G06—COMPUTING; CALCULATING OR COUNTING
- G06T—IMAGE DATA PROCESSING OR GENERATION, IN GENERAL
- G06T2207/00—Indexing scheme for image analysis or image enhancement
- G06T2207/10—Image acquisition modality
- G06T2207/10024—Color image
-
- G—PHYSICS
- G06—COMPUTING; CALCULATING OR COUNTING
- G06T—IMAGE DATA PROCESSING OR GENERATION, IN GENERAL
- G06T2207/00—Indexing scheme for image analysis or image enhancement
- G06T2207/10—Image acquisition modality
- G06T2207/10072—Tomographic images
-
- G—PHYSICS
- G06—COMPUTING; CALCULATING OR COUNTING
- G06T—IMAGE DATA PROCESSING OR GENERATION, IN GENERAL
- G06T2207/00—Indexing scheme for image analysis or image enhancement
- G06T2207/10—Image acquisition modality
- G06T2207/10072—Tomographic images
- G06T2207/10088—Magnetic resonance imaging [MRI]
- G06T2207/10096—Dynamic contrast-enhanced magnetic resonance imaging [DCE-MRI]
-
- G—PHYSICS
- G06—COMPUTING; CALCULATING OR COUNTING
- G06T—IMAGE DATA PROCESSING OR GENERATION, IN GENERAL
- G06T2207/00—Indexing scheme for image analysis or image enhancement
- G06T2207/20—Special algorithmic details
- G06T2207/20076—Probabilistic image processing
-
- G—PHYSICS
- G06—COMPUTING; CALCULATING OR COUNTING
- G06T—IMAGE DATA PROCESSING OR GENERATION, IN GENERAL
- G06T2207/00—Indexing scheme for image analysis or image enhancement
- G06T2207/30—Subject of image; Context of image processing
- G06T2207/30004—Biomedical image processing
- G06T2207/30048—Heart; Cardiac
-
- G—PHYSICS
- G06—COMPUTING; CALCULATING OR COUNTING
- G06T—IMAGE DATA PROCESSING OR GENERATION, IN GENERAL
- G06T2207/00—Indexing scheme for image analysis or image enhancement
- G06T2207/30—Subject of image; Context of image processing
- G06T2207/30004—Biomedical image processing
- G06T2207/30101—Blood vessel; Artery; Vein; Vascular
-
- G—PHYSICS
- G06—COMPUTING; CALCULATING OR COUNTING
- G06T—IMAGE DATA PROCESSING OR GENERATION, IN GENERAL
- G06T2210/00—Indexing scheme for image generation or computer graphics
- G06T2210/41—Medical
-
- G—PHYSICS
- G06—COMPUTING; CALCULATING OR COUNTING
- G06T—IMAGE DATA PROCESSING OR GENERATION, IN GENERAL
- G06T2219/00—Indexing scheme for manipulating 3D models or images for computer graphics
- G06T2219/20—Indexing scheme for editing of 3D models
- G06T2219/2012—Colour editing, changing, or manipulating; Use of colour codes
Landscapes
- Engineering & Computer Science (AREA)
- Physics & Mathematics (AREA)
- Theoretical Computer Science (AREA)
- General Physics & Mathematics (AREA)
- Computer Vision & Pattern Recognition (AREA)
- Data Mining & Analysis (AREA)
- General Engineering & Computer Science (AREA)
- Medical Informatics (AREA)
- Health & Medical Sciences (AREA)
- Radiology & Medical Imaging (AREA)
- Quality & Reliability (AREA)
- General Health & Medical Sciences (AREA)
- Nuclear Medicine, Radiotherapy & Molecular Imaging (AREA)
- Architecture (AREA)
- Computer Graphics (AREA)
- Computer Hardware Design (AREA)
- Software Systems (AREA)
- Life Sciences & Earth Sciences (AREA)
- Probability & Statistics with Applications (AREA)
- Artificial Intelligence (AREA)
- Bioinformatics & Cheminformatics (AREA)
- Bioinformatics & Computational Biology (AREA)
- Evolutionary Biology (AREA)
- Evolutionary Computation (AREA)
- Magnetic Resonance Imaging Apparatus (AREA)
- Apparatus For Radiation Diagnosis (AREA)
- Measuring And Recording Apparatus For Diagnosis (AREA)
- Image Analysis (AREA)
Description
本願は、概して、医用イメージングに関する。本願は、特定の身体組織を識別することに関連して特に応用され、特定の身体組織を識別することを特に参照して説明されるものである。しかしながら、本願は、他の利用シナリオにも応用され、必ずしも前述された応用に限定されないことが理解されるであろう。 The present application relates generally to medical imaging. The present application has particular application in connection with identifying specific body tissues and will be described with particular reference to identifying specific body tissues. However, it will be appreciated that the present application applies to other usage scenarios and is not necessarily limited to the applications described above.
グレーゾーン定量化が、いくつかの臨床的な応用において重要である。梗塞及びグレーゾーンなどの不健康な組織タイプの大きさが心筋梗塞(MI)の予知因子であることを、近年の医学文献が報告している。例えば、「過去にMIを患った患者において、心臓磁気共鳴(CMR)により特徴付けられる梗塞周囲ゾーンの規模は、左心室収縮容積指標又は左心室駆出分画率を超えて徐々に増加する予後値を提供する。CMRによる梗塞特徴付けは、一意的で価値のある非侵襲的な、MI後死亡率の予知因子であることを証明することができる」(サーキュレーション2006;114:32−29)。グレーゾーンには、梗塞の周囲と不均一の梗塞とを含む。さらに、「組織不均一性は、人間の梗塞の中に存在し、定量化できる。より広範囲に及ぶ組織不均一性が、プログラムされた電気刺激によって、増加される心室の被刺激性と相互に関連する。こうした研究結果は、解剖学的組織不均一性が、過去に心筋梗塞及び左心室(LV)機能障害を患った患者における心室性不整脈に対する感受性を増加させるという仮説を支持している」(サーキュレーション2007;115:2006−2014)。最後に、「以前に心筋梗塞を患った患者において、造影MRIにおける梗塞組織不均一性は、それに続く植え込み型除細動器(ICD)治療を(突然心臓死の代理として)伴って、他の臨床の及びMRIの変数、すなわち、合計の梗塞サイズと左心室機能及び容積との中でも、自然発生する心室性不整脈の最も強い予知因子である」(サーキュレーション2009.2:183−190)。 Gray zone quantification is important in some clinical applications. Recent medical literature reports that unhealthy tissue type sizes such as infarctions and gray zones are predictors of myocardial infarction (MI). For example, “In patients with MI in the past, the size of the peri-infarct zone characterized by cardiac magnetic resonance (CMR) gradually increases beyond the left ventricular contraction volume index or the left ventricular ejection fraction. Provides values: Infarct characterization by CMR can prove to be a unique and valuable non-invasive predictor of post-MI mortality "(circulation 2006; 114: 32-29. ). The gray zone includes the periphery of the infarct and a non-uniform infarct. Furthermore, “tissue heterogeneity exists in human infarcts and can be quantified. A wider range of tissue heterogeneity correlates with increased ventricular irritability by programmed electrical stimulation. These findings support the hypothesis that anatomical tissue heterogeneity increases susceptibility to ventricular arrhythmias in patients with previous myocardial infarction and left ventricular (LV) dysfunction. '' (Circulation 2007; 115: 2006-2014). Finally, “In patients previously suffering from myocardial infarction, infarct tissue heterogeneity in contrast-enhanced MRI is accompanied by subsequent implantable cardioverter defibrillator (ICD) treatment (as a surrogate for sudden cardiac death) Among the clinical and MRI variables, ie total infarct size and left ventricular function and volume, is the strongest predictor of naturally occurring ventricular arrhythmias ”(Circulation 2009.2: 183-190).
以前の試みは、画像内の不健康な組織のコントラストを促進することと、ボリュームを測定するために手動の描写によって又は単一画像の信号強度に基づいた半自動的なセグメント化によってエリアをセグメント化することとに、焦点を当てていた。コントラスト促進は、複数の組織タイプが取り込まれ、健康な組織と梗塞及びグレーゾーンなどの不健康な組織とのタイプのコントラストにおいて重複が存在するため、正確さに欠ける。複数のコントラスト設定が必要であり、このことが、不健康な組織をセグメント化又は識別して測定結果に対する特定の組織タイプを手動でアウトライン化するというタスクを長々しくしている。 Previous attempts to segment the area by promoting unhealthy tissue contrast in the image and by manual delineation to measure volume or by semi-automatic segmentation based on the signal strength of a single image And focused on that. Contrast enhancement lacks accuracy because multiple tissue types are captured and there is an overlap in the type of contrast between healthy tissue and unhealthy tissue such as infarcts and gray zones. Multiple contrast settings are required, which lengthens the task of segmenting or identifying unhealthy tissue and manually outlining specific tissue types for the measurement results.
加えて、複数の画像には、複数のモダリティ、マシン、コイル較正、設定などを含む。1つ1つの画像において異なる技法を使用してエリアのコントラストを促進することは、コイル較正、特定の設定などの差異からの誤りをもたらす。例えば、1つの方法が、信号強度画像とT1マップとに基づいた定量化を使用する。この方法における画像は、コイル感度による影響を受け、T1マップに対する補色コントラストを示さない。 In addition, the plurality of images includes a plurality of modalities, machines, coil calibrations, settings, and the like. Promoting area contrast using different techniques in each image results in errors from differences such as coil calibration, specific settings, and the like. For example, one method uses quantification based on signal intensity images and T1 maps. Images in this method are affected by coil sensitivity and do not show complementary color contrast to the T1 map.
通常の磁気共鳴技法は、反転回復グラディエントエコー(IR−GE)などの従来のMR遅延促進スキャンシーケンスを用いてエリアを評価する。このシーケンスは、心臓の動きの影響を受けやすく、瘢痕又は梗塞とグレーゾーンと健康な心筋とを別々に識別するために、正確な反転時間(TI)を必要とする。種々の組織タイプの正確な識別には、時間がかかる。最適なTIは、患者ごとに変化し、さらに、造影剤の注入と画像取得との間の経過時間によって変化する。最適な反転時間は、健康な心筋からの信号がヌルになり、黒く見え、梗塞エリアが明るくなり(白く見え)、グレーゾーンがその中間であるときに生じる。心内膜及び血液は、瘢痕が心内膜‐血液境界において生じるところで不明確となる可能性があり、手動で描写される。信号強度に基づいたセグメント化のための画像解析は、グレーゾーンを、瘢痕と健康な心筋とに分類する。血液プールからの信号強度は、造影剤の分布に起因して、梗塞組織に非常に近くなる。心筋内のノイズは、セグメント化に対して大きな影響を与える可能性があり、グレーゾーンと混同される可能性がある。 Conventional magnetic resonance techniques evaluate the area using a conventional MR delay-enhanced scan sequence such as inversion recovery gradient echo (IR-GE). This sequence is sensitive to heart motion and requires an accurate inversion time (TI) to separately distinguish scars or infarcts from gray zones and healthy myocardium. Accurate identification of various tissue types takes time. The optimal TI varies from patient to patient and further varies with the elapsed time between contrast agent injection and image acquisition. The optimal inversion time occurs when the signal from a healthy myocardium is null, looks black, the infarct area is bright (looks white), and the gray zone is in between. Endocardium and blood can be ambiguous where scarring occurs at the endocardium-blood boundary and is manually depicted. Image analysis for segmentation based on signal intensity classifies gray zones into scars and healthy myocardium. The signal intensity from the blood pool is very close to the infarct tissue due to the distribution of contrast agent. Noise in the myocardium can have a significant impact on segmentation and can be confused with the gray zone.
本願は、上記で参照された事項及びその他に対処する、新しい、改良された、リスクのあるエリアの自動化された検出を開示する。 The present application discloses a new, improved, risky area automated detection that addresses the issues referenced above and others.
1つの態様に従い、医用イメージング装置が、データストア、クラスタリングモジュール及び表示装置を含む。データストアは、第1のイメージングデータセットと第2のイメージングデータセットとを含み、各々のデータセットは、同一のイメージング装置と同一の測定された値とを用いて作成される。第1及び第2の組織タイプの測定された値は、第1のイメージングデータセットにおいて重複する。第2及び第3の組織タイプの測定された値は、第2のデータセットにおいて重複する。データセットは相互位置合わせされ、外部的事象が、第2のデータセットの測定された値を変化させる。クラスタリングモジュールは、各位置について、第1のデータセットの測定された値と第2のデータセットの測定された値とのファジィクラスタリングに基づいて、組織タイプを分類する。表示装置は、各々の分類された組織タイプを対比する医用画像を表示する。 According to one aspect, a medical imaging device includes a data store, a clustering module, and a display device. The data store includes a first imaging data set and a second imaging data set, each data set being created using the same imaging device and the same measured value. The measured values of the first and second tissue types overlap in the first imaging data set. The measured values for the second and third tissue types overlap in the second data set. The data set is inter-aligned and an external event changes the measured value of the second data set. The clustering module classifies the tissue type for each location based on fuzzy clustering of the measured values of the first data set and the measured values of the second data set. The display device displays a medical image that compares each classified tissue type.
別の態様に従い、医用イメージングの方法が、第1の医用画像を取得するステップと、外部的事象の後、第1の医用画像と同一の医用イメージング装置から、同一の測定された値を含む第2の医用画像を取得するステップと、を含む。外部的な事象が、測定される値を変化させる。これら画像は、相互位置合わせされる。組織タイプは、各位置において、第1の医用画像の測定された値と第2の医用画像の測定された値とに基づいて、ファジィクラスタリングを用いて分類される。診断的医用画像が、分類された組織タイプを表すコントラストを用いて表示される。 In accordance with another aspect, a method of medical imaging includes obtaining a first medical image and, after an external event, a first measured value including the same measured value from the same medical imaging device as the first medical image. Obtaining two medical images. External events change the measured value. These images are aligned with each other . The tissue type is classified at each position using fuzzy clustering based on the measured value of the first medical image and the measured value of the second medical image. A diagnostic medical image is displayed with a contrast representing the classified tissue type.
別の態様に従い、医用イメージングシステムが、データストア、クラスタリングモジュール及びセグメント化部を含む。データストアには、第1のイメージングデータセットと第2のイメージングデータセットとを含み、各々のデータセットは、同一の装置と同一の測定された値とを用いて作成される。データセットは相互位置合わせされ、外部的事象が、第2のデータセットの測定された値を変化させる。クラスタリングモジュールは、各位置について、第1のデータセットの測定された値と第2のデータセットの測定された値とのファジィクラスタリングに基づいて、組織タイプを分類する。セグメント化部は、各々の分類された、リスクに晒された組織について、ボリューム測定結果を算出する。 According to another aspect, a medical imaging system includes a data store, a clustering module, and a segmentation unit. The data store includes a first imaging data set and a second imaging data set, each data set being created using the same device and the same measured value. The data set is inter-aligned and an external event changes the measured value of the second data set. The clustering module classifies the tissue type for each location based on fuzzy clustering of the measured values of the first data set and the measured values of the second data set. The segmentation unit calculates a volume measurement result for each classified, risk-exposed organization.
1つの利点には、グレーゾーン組織の識別と測定結果とが含まれる。 One advantage includes gray zone tissue identification and measurement results.
別の利点には、コイル感度からの独立性が含まれる。 Another advantage includes independence from coil sensitivity.
別の利点は、造影剤投与の正確なタイミングへの依存の低減にある。 Another advantage resides in reducing dependence on the exact timing of contrast agent administration.
別の利点は、自動化された、組織タイプの分類にある。 Another advantage resides in automated, tissue type classification.
別の利点には、組織タイプが分類され、ボリュームが算出されることの容易さと速さとが含まれる。 Another advantage includes the ease and speed with which tissue types are classified and volumes are calculated.
当業者が下記の詳細な説明を読み、理解した当業者において、本願のさらに別の利点が十分理解されるであろう。 Still further advantages of the present application will be appreciated by those skilled in the art upon reading and understanding the following detailed description.
本発明は、種々のコンポーネント及びコンポーネントの構成と種々のステップ及びステップの構成との形態をとることができる。図面は、好適な実施形態を単に解説する目的のものであり、本発明を限定するものと見なされるべきではない。
図1を参照し、医用イメージングシステムの一実施形態を概略的に示す。磁気共鳴(MR)、X線コンピュータ断層撮影(CT)、ポジトロン放出型断層撮影(PET)、単光子放出型コンピュータ断層撮影(SPECT)、組み合わせ又は掛け合わせなどの医用イメージング装置10が、データストア12に記憶される医用イメージングデータセットを作成する。データストアは、サーバ内のローカルメモリ、ローカルディスク上の記憶装置、ネットワーク接続された記憶装置上の記憶装置などとすることができる。データストア又はメモリ装置12には、第1のコントラストで画像を生成する技法を用いて取得された第1のイメージングデータ14と、第2のコントラストを生成する技法を用いて取得された第2のイメージングデータ16とを含む。1つの実施形態において、コントラストにおける差分は、造影剤の投与に基づく。MRにおいて測定される値の一例には、T1強調画像、T2強調画像などを含む。測定された値には、測定されたT1値などの直接的な測定結果、又はグレースケールに正規化されたT1値などの間接的な測定結果などを含むことができる。測定された画像は、血液、健康な心筋、梗塞及びグレーゾーンなどの少なくとも3つの異なる組織タイプの各々について、異なる相対的なコントラストを有する。他の実施形態において、3つ以上のイメージングデータセットがさらに考えられ、ここで、追加のイメージングデータセットには、造影剤の投与後の種々の時間間隔を含む。
Referring to FIG. 1, one embodiment of a medical imaging system is schematically shown. A
位置合わせ部18は、第1及び第2のイメージングデータを、すでに又は生得的に(inherently)相互位置合わせされていない場合に、相互位置合わせする(co-register)。位置合わせ部18は、任意の動きに対して、第1及び第2のイメージングデータを補正する。位置合わせ部は、ネットワーク20を介して、データストア12及び/又は医用イメージング装置に接続する。ネットワークは、有線若しくは無線、内部若しくは外部、プライベート若しくはインターネットなどのパブリック、又は任意の組み合わせとすることができる。
Positioning
分類モジュール22は、第1及び第2のイメージングデータの対応するボクセルから、測定された値ペアを生成する。生成された、測定された値ペアは、第1及び第2の画像の対応するボクセル、画素又は他のエリア(以降、総称的に「ボクセル」)の測定されたコントラスト値のペアを含む。例えば、T1強調画像において、あるボクセルが第1又は第2の画像内で高信号である場合、測定された値ペアが含まれる。ボクセルがいずれの画像内でも目立たない(not contrasted)場合、測定された値ペアは除外されることができる。測定された値ペアは、対応するボクセル位置における2つの測定された値を含む値の、散布グリッド(scatter grid)、配列又はリストとして表されることができる。分類モジュールは、測定された値ペアをクラスタ又はグループにクラスタ化し、各クラスタを組織タイプに分類する。分類モジュール22は、ネットワーク20を介して、位置合わせ部18及び/又はデータストア12に接続する。分類モジュール22は、1又は複数のプロセッサを位置合わせ部18と共有することができ、あるいは別個のものとすることができる。他の実施形態において、n個のイメージングデータセットからのn組(n-tuple)の測定された値が考えられ、ここで、nは複数の値である。クラスタ化すべきn個の対応する測定された値は、各n組から選択されることができ、各n組はコントラストの区別を提供する。n個のイメージングデータセットが、ある時間間隔にわたって撮られ、これは、正確な較正を必要としない。
The
1つの実施形態において、ユーザインタフェース23は、散布図又は等高線図などの図を用いて、クラスタ化された測定された値ペアを視覚化することができる。各軸は、一方の画像の測定された値を表す。各々の測定された値ペアが点でプロットされ、これにおいて、上記点は、分類された組織タイプで表される。例えば、散布図において、各点が、クラスタリングアルゴリズムによって、プロットされ、クラスタメンバシップを表す記号及び/又は色を割り当てられる。クラスタは、分類された組織タイプで、凡例内にラベル付けされる。等高線図の例において、等高線の高さは発生の頻度を表す。
In one embodiment, the
セグメント化アルゴリズムを実施するプロセッサなどの、セグメント化部24は、クラスタアルゴリズムを用いて、測定された値ペアの対応するボクセルに基づいて、分類された組織タイプをセグメント化又はクラスタ化する。例えば、測定された値ペアがクラスタメンバシップに基づいて梗塞と分類された場合、測定された値ペアの対応するボクセルが梗塞と分類される。対応するボリューム又は第1若しくは第2の画像を使用して、組織タイプ分類をボクセルに割り当てることができる。
A
分析ユニット25は、ボリューメトリック測定結果などの分析を、セグメント化された組織タイプ又は分類された領域に適用する。例えば、グレーゾーンのボリュームと梗塞のボリュームとが、それぞれ、グレーゾーンと梗塞として分類された領域に基づいて算出される。セグメント化部24及び分析ユニット25は、ネットワーク20に接続し、1又は複数のプロセッサを位置合わせ部18及び/又は分類モジュール22と共有することができ、あるいは別個とすることができる。
The
ワークステーション26は、1又は複数の入力装置28、1又は複数のプロセッサ30、及び表示装置32を含む。ワークステーション28には、デスクトップコンピュータ、ラップトップコンピュータ、タブレット型コンピュータ、スマートフォンなどを含む。1又は複数の入力装置28は、医療関係者からのコマンドを入力し、画像を選択するなどする。表示装置32は、画像、メニュー、フォーム、パネル、図、プロットなどを表示する。表示装置32には、セグメント化部によって算出された分析などのデータの表示を含む。表示装置は、各々の分類された組織タイプについて、種々の色又はコントラストを含む診断画像を表示する。診断画像は、PACS、RISなどの記憶管理システム34に記憶することができる。
The
図2は、測定されたT1値を用いた心臓解析の磁気共鳴プロットにおいて予期される組織クラスタリングの一例を図で示す。遅延ガリウム促進剤などの造影剤の投与の前に測定されるT1値は、血液に関してより高く、しかしながら、梗塞、グレーゾーン及び健康な心筋に関して重複する。造影剤の投与の後に測定されるT1値は、健康な心筋に関してより高く、しかしながら、血液、梗塞及びグレーゾーンに関して重複する。健康な組織には、血液及び健康な心筋を含む。リスクに晒されている組織タイプには、グレーゾーン及び梗塞を含む。このプロットは、各位置について、対応するボクセルについての座標ペアとして、Y軸上に、プレコントラスト〔造影前〕の(pre-contrast)画像又はマップからのボクセルペアの測定されたT1値を、X軸上に、ポストコントラスト〔造影後〕の(post-contrast)画像からの測定されたT1値をプロットする。 FIG. 2 graphically illustrates an example of tissue clustering expected in a magnetic resonance plot of cardiac analysis using measured T1 values. T1 values measured prior to administration of contrast agents such as delayed gallium enhancers are higher for blood, but overlap for infarcts, gray zones and healthy myocardium. T1 values measured after administration of contrast agent are higher for healthy myocardium, but overlap for blood, infarct and gray zone. Healthy tissues include blood and healthy myocardium. Tissue types at risk include gray zones and infarctions. This plot, for each position, as a coordinate pair for the corresponding voxel, on the Y axis, the pre-contrast [precontrast] the measured T1 value of Bokuserupea from (pre-contrast) image or map, X-axis above, plotting the measured T1 value from the post contrast [post contrast] (post-contrast) image.
2つの画像又はマップは、グレースケール値又はコントラスト値を、対応する共通のボクセルにマップ付けする。一例において、T1は、標準の反転回復グラディエントエコーなどの同一のシーケンスが双方の画像について使用されるため、較正される必要がない。測定された値が同一較正、同一患者、同一パラメータ、同一アルゴリズムなどを用いて測定されるため、クラスタリングモジュールは、マシン差分、シーケンス差分、患者差分などについて責任を負う必要がなくなる。多くの潜在的誤りのもとが取り除かれる。 Two images or maps map grayscale values or contrast values to corresponding common voxels. In one example, T1 does not need to be calibrated because the same sequence, such as a standard inverted recovery gradient echo, is used for both images. Since the measured values are measured using the same calibration, the same patient, the same parameter, the same algorithm, etc., the clustering module need not be responsible for machine differences, sequence differences, patient differences, etc. Many potential sources of error are removed.
クラスタリングは、造影剤又は他のコントラスト変更の有無にかかわらず、対応するボクセルのグレースケール又はコントラストの値ペアをグループ化することによって、組織タイプを分類する。一方の画像内で測定された値は、ある健康な組織タイプとリスクに晒された組織タイプとについて重複し、他方の画像内で測定された値は、別の健康な組織タイプとリスクに晒された組織タイプとについて重複する。例えば、プレコントラストのT1において、健康な組織は、健康な心筋を含み、しかし血液を含まず、梗塞及びグレーゾーンを含むリスクのエリアと重複する。ポストコントラストのT1において、健康な組織は、血液を含み、しかし健康な心筋を含まず、上記リスクのエリアと重複する。各造影剤は、ある時点において値の最適な区別を提供し、しかしその時間は対象者によって変化し、さらに潜在的に環境及び他の要因に起因して対象者の内部で変化する。測定されるものは、造影剤の定量化ではなく、投与された造影剤によって影響される位置の分類であるため、最適な時間は、最良の差分を提供し、しかしながら正確に測定される必要はない。予め定義された測定点に依存するのではなく、患者に対して最適なコントラストの時点を選択するように、複数のイメージングデータセットを撮ることができる。 Clustering classifies tissue types by grouping corresponding voxel grayscale or contrast value pairs with or without contrast agents or other contrast changes. The values measured in one image overlap for one healthy tissue type and the tissue type at risk, while the values measured in the other image are exposed to another healthy tissue type and risk. Overlaps with selected organization type For example, at pre- contrast T1, healthy tissue contains healthy myocardium but no blood and overlaps with areas of risk including infarctions and gray zones. At post- contrast T1, healthy tissue contains blood but no healthy myocardium and overlaps with the area of risk. Each contrast agent provides an optimal distinction of values at a certain point in time, but the time varies from subject to subject and further varies within the subject due to potential environmental and other factors. Since what is measured is not the contrast agent quantification, but the classification of the location affected by the administered contrast agent, the optimal time provides the best difference, but does not need to be measured accurately Absent. Rather than relying on pre-defined measurement points, multiple imaging data sets can be taken to select the optimal contrast time point for the patient.
1つの実施形態におけるセグメント化モジュール24は、ファジィc‐平均法(fuzzy c-means)アルゴリズムを使用し、例えば、グスタフソン‐ケッセル(Gustafson-Kessel)(FCGK)の改良法などを使用する。FCGKは、関数

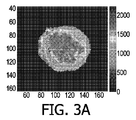
図3A〜3Dに、ある患者の左心室(LV)心臓解析を行ったシステムの一例を示す。図3Aにおいて、LV領域の、コントラスト促進なしのT1マップ又は画像を、短軸ビュー内に示す。血液が、重複する健康な心筋、梗塞及びグレーゾーンと対比される。この血液が、画像を特色付ける。 3A-3D show an example of a system that performed a left ventricular (LV) heart analysis of a patient. In FIG. 3A, a T1 map or image of the LV region without contrast enhancement is shown in the short axis view. Blood is contrasted with overlapping healthy myocardium, infarctions and gray zones. This blood characterizes the image.
図3Bにおいて、造影剤の投与の後の、相互位置合わせされたLVのT1マップを示す。健康な心筋が、重複する血液、梗塞及びグレーゾーンと対比される。健康な心筋が、環状エリアを形成する。 In FIG. 3B, a T1 map of the inter-aligned LV after administration of contrast agent is shown. Healthy myocardium is contrasted with overlapping blood, infarctions and gray zones. Healthy myocardium forms an annular area.
図3Cは、図3A及び図3Bの中の各々の対応するボクセルのグレースケール値又はコントラスト値の散布プロットを用いたクラスタリングの視覚化を示す。クラスタリングアルゴリズムを用いて、点の、クラスタ中心からの距離が識別され、この距離はコスト関数などを用いて最小化されて各組織タイプに対応するクラスタを生成する。この事例において、FCGK改良法を用いたFCMアルゴリズムは、図3A及び図3BからT1値のペアのメンバシップを割り振る。他の実施形態において、他のFCM技法が、図3Cの点をクラスタに分割する。 FIG. 3C shows a visualization of clustering using a scatter plot of grayscale or contrast values for each corresponding voxel in FIGS. 3A and 3B. A clustering algorithm is used to identify the distance of the point from the cluster center, and this distance is minimized using a cost function or the like to generate a cluster corresponding to each tissue type. In this case, the FCM algorithm using the FCGK refinement assigns T1 value pair membership from FIGS. 3A and 3B. In other embodiments, other FCM techniques divide the points of FIG. 3C into clusters.
血液クラスタ内にある図3Cの点は、小さい四角形によって表される(左上)。健康な心筋にクラスタ化されている点は、小さいプラス符号によって表される(右下)。梗塞クラスタ内の点は、小さい“X”によって表される(血液クラスタの下方で、健康な心筋の左側)。グレーゾーンクラスタ内の点は、小さい円形によって表される(梗塞の右側で、血液の下方)。クラスタは、図2において図で表されている。 The points in FIG. 3C that are in the blood cluster are represented by a small square (upper left). The points clustered in healthy myocardium are represented by a small plus sign (bottom right). A point in the infarct cluster is represented by a small “X” (below the blood cluster, to the left of the healthy myocardium). The points in the gray zone cluster are represented by small circles (on the right side of the infarct, below the blood). Clusters are represented graphically in FIG.
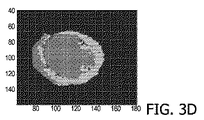
図3Dは、分類された組織タイプによって対比された位置を有するLV画像を示す。表される組織タイプには、血液、健康な心筋、梗塞及びグレーゾーンを含む。図3A及び図3Bの対応するボクセルからの測定された値ペアの位置をセグメント化部が使用して、各ボクセルの組織タイプを決定する。各ボクセルは、決定された組織タイプに割り当てられたコントラスト又は色を付与されて、図3DのLV画像が生成される。この例において、セグメント化部によってセグメント化され、分析ユニットによって測定されたボリュームは、85mm2のグレーゾーンと154mm2の梗塞とを含む。梗塞は、健康な心筋の大きい環状エリアの端において識別されることができる。他の方法を用いて梗塞とグレーゾーンとを手動で測定する困難さは、図3Dの画像と図3A及び/又は図3Bの画像とを比較すると分かるであろう。 FIG. 3D shows an LV image with locations contrasted by the classified tissue type. Tissue types represented include blood, healthy myocardium, infarctions and gray zones. The segmentation unit uses the position of the measured value pair from the corresponding voxel of FIGS. 3A and 3B to determine the tissue type of each voxel. Each voxel is given the contrast or color assigned to the determined tissue type to generate the LV image of FIG. 3D. In this example, the volume segmented by the segmentation unit and measured by the analysis unit includes an 85 mm 2 gray zone and a 154 mm 2 infarct. Infarctions can be identified at the end of a large annular area of healthy myocardium. The difficulty of manually measuring infarct and gray zone using other methods will be seen by comparing the image of FIG. 3D with the images of FIGS. 3A and / or 3B.
図4Aにおいて、医用イメージングの方法の一実施形態がフローチャートで示される。ステップ40において、第1の画像が取得され、データストアに記憶される。画像は、イメージング装置から直接的に、あるいはディスク記憶装置などの記憶装置メモリからの読み出しによって間接的に、取得することができる。ステップ42において、造影剤の投与の後、第2の画像が取得される。他の実施形態において、繰り返される取得が種々の時間間隔で行われて最適なコントラストを確かにする。ステップ44において、画像が、位置合わせ部によって、相互位置合わせされ、かつ/あるいは動きについて補正される。
In FIG. 4A, one embodiment of a method for medical imaging is shown in a flowchart. In
ステップ46において、分類モジュールが、測定された値ペアを作成又は生成する。測定された値ペアには、第1及び第2の画像の対応するボクセルからの測定された値を含み、測定された値ペアにおいて、少なくとも1つの測定された値が、対比された組織タイプを表す測定された値の閾値又は範囲を超える。測定された値ペアと関連するボクセル位置とは、(測定された値1,測定された値2,ボクセル位置)などの値のマトリクスとして表すことができる。
In
ステップ48において、分類モジュールは、測定された値ペアのメンバシップをクラスタに割り振る。各クラスタは、組織タイプで分類される。メンバシップの割り振りは、ファジィc‐平均法(FCM)アルゴリズムに基づき、例えばFCGK改良法を用いたFCMなどに基づく。
In
ステップ50において、セグメント化部は、各々の測定された値ペアの分類された組織タイプを、第1及び第2の画像に対応するボリュームに割り当てる。別法として、第1及び第2の画像のうち1つを使用して、ボクセルの強度及び/又は色を、分類された組織タイプを表す値に設定するなどの、分類された組織タイプを表示することができる。
In
ステップ52において、ユーザインタフェースは、測定された値ペアと分布図又は等高線図などのクラスタメンバシップとの視覚化を構築する。視覚化は、種々の時間間隔及び/又は種々のクラスタリングアルゴリズム若しくはパラメータにおいて撮られた画像間でクラスタリングを比較することに対して有用となり得る。
In
ステップ54において、診断画像が構築される。診断画像には、各々の分類された組織タイプを表すようにマーク付けされた、画像化された領域の表示を含む。1つの例において、診断画像には、組織タイプを指定するように色付けされた、他の解剖学的基準又は空間的関係を示す第1又は第2の画像を含むことができる。
In
ステップ56において、分析ユニットが、セグメント化された組織タイプのボリューム測定結果を算出するなどして、診断画像を分析する。リスクに晒された組織タイプと、場合により、健康な組織タイプとが、算出される。適用される他の分析には、セグメント化されたボリュームにおける比率などの比較、種々の患者集団との比較などを含むことができる。分析にはさらに、長さ、平均密度、最大深さなどの他の統計を含むことができる。
In
ステップ58において、表示装置が、種々の組織タイプを対比し、かつ/あるいは梗塞及びグレーゾーンなどのリスクに晒された組織タイプのボリュームを測定する、診断画像を表示する。場合により、ステップ60において、診断画像、分析及び/又はクラスタ視覚化を、患者データ管理システムに記憶することができる。
In
本明細書において提示された特定の例示的な実施形態に関連して、特定の構造及び/又は機能の特徴が、定められた要素及び/又はコンポーネントに組み込まれるものとして説明されていることを、十分理解されたい。しかしながら、こうした特徴は、同一の又は類似の便益に対して、適切な場合に他の要素及び/又はコンポーネントにも同様に組み込むことができると考えられる。さらに、別の例示的な実施形態の態様を必要に応じて選択的に採用して、所望される用途に適した他の代替の実施形態を達成することができ、他の代替の実施形態は、それにより、該実施形態に組み込まれた態様のそれぞれの利点を実現することができることを、十分理解されたい。 That in connection with the specific exemplary embodiments presented herein, specific structural and / or functional features are described as being incorporated into defined elements and / or components; I want to be fully understood. However, it is contemplated that such features can be incorporated into other elements and / or components as well for the same or similar benefits where appropriate. Furthermore, aspects of other exemplary embodiments can be selectively employed as needed to achieve other alternative embodiments suitable for the desired application, where other alternative embodiments are It should be appreciated that the respective advantages of the aspects incorporated into the embodiments can thereby be realized.
さらに、本明細書において説明された特定の要素又はコンポーネントは、ハードウェア、ソフトウェア、ファームウェア又はそれらの組み合わせを用いて適切に実施される機能性を有することができることを、十分理解されたい。加えて、本明細書において一緒に組み込まれるものとして説明された特定の要素は、適切な環境下で、独立型の要素となり、あるいはその他の方法で分割されることができることを、十分理解されたい。同様にして、1つの特定の要素によって実行されるものとして説明された複数の特定の機能は、個々の機能を実行するように独立して動作する複数の違った要素によって実行されることができ、あるいは、特定の個々の機能は、分解され、複数の違った要素によって協力して実行されることができる。別法として、本明細書において互いに違うものとして他の方法で説明され、かつ/あるいは示されたいくつかの要素又はコンポーネントは、適切である場合に、物理的又は機能的に組み合わせられることができる。 Further, it should be appreciated that certain elements or components described herein may have functionality that is suitably implemented using hardware, software, firmware, or combinations thereof. In addition, it should be appreciated that certain elements described herein as being incorporated together may be stand-alone elements or otherwise divided under appropriate circumstances. . Similarly, a plurality of specific functions described as being performed by one specific element may be performed by a plurality of different elements that operate independently to perform the individual functions. Alternatively, specific individual functions can be decomposed and performed in concert by multiple different elements. Alternatively, some elements or components described and / or illustrated otherwise as different from one another herein may be physically or functionally combined where appropriate. .
要するに、本明細書は、好適な実施形態を参照して説明されている。明らかに、本明細書を読み、理解した他者において、変更及び変形が生じることになる。本発明は、こうした変更及び変形が添付された請求項又はその均等物の範囲内に入る限り、すべてのそうした変更及び変形を含むと見なされるべきものである。すなわち、様々な上記で開示された特徴及び機能並びに他の特徴及び機能、又はそれらの代替案が、多くの他の種々のシステム又はアプリケーションに望ましく組み合わせられることができ、さらに、上記特徴及び機能において、様々な現在予見されない又は予期されない代替案、変更、変形又は改良を当業者が後に行う可能性があり、これらは同様にして別記の請求項に包含されるものであることを、十分理解されたい。 In short, the specification has been described with reference to the preferred embodiments. Obviously, changes and modifications will occur to others who have read and understood this specification. The present invention should be construed as including all such modifications and variations as long as such modifications and variations fall within the scope of the appended claims or their equivalents. That is, the various above-disclosed features and functions as well as other features and functions, or alternatives thereof, can be desirably combined into many other various systems or applications, and further in the above features and functions It is well understood that various presently foreseeable or unexpected alternatives, modifications, variations or improvements may be made later by those skilled in the art, which are likewise encompassed by the appended claims. I want.
Claims (18)
前記第1の画像及び第2の画像の対応するボクセルのコントラスト値ペアのクラスタリングに基づいて組織タイプを分類する分類モジュールであり、前記コントラスト値ペアは、対応するボクセルについて、前記第1の画像からの1つの値と前記第2の画像からの1つの値とを各々含む、分類モジュールと、
前記の分類されたコントラスト値ペアに基づいて、前記第1の画像及び第2の画像について対応するイメージング領域の診断画像の各ボクセルに、組織タイプを割り当てるセグメント化部と、
分類された組織タイプのボリュームを含む診断画像を表示する表示装置であり、各々の分類された組織タイプは異なるコントラスト色で表される、表示装置と、
を含む医用イメージングシステム。 A data store for holding a first image and a second image, wherein each image is mutually aligned, the first image is a pre-contrast image, and the second image is a post-contrast image The first image contrasts blood with an infarction, gray zone, healthy myocardium, and the second image contrasts a healthy myocardium with infarction, gray zone, blood, A data store,
A classification module for classifying a tissue type based on a clustering of contrast value pairs of corresponding voxels of the first image and the second image, wherein the contrast value pairs are derived from the first image for the corresponding voxels. A classification module each including one value of and a value from the second image;
A segmentation unit that assigns a tissue type to each voxel of a diagnostic image in a corresponding imaging region for the first image and the second image based on the classified contrast value pairs;
A display device for displaying a diagnostic image including a volume of classified tissue types, each classified tissue type represented by a different contrast color; and
Including medical imaging system.
ファジィc‐平均法(FCM)アルゴリズムに基づいて、クラスタに、各々のコントラスト値ペアのメンバシップを割り振るステップであり、各クラスタは、前記組織タイプの1つに対応する、ステップ
をなすようにプログラムされたプロセッサを含む、請求項1に記載の医用イメージングシステム。 The classification module
Assigning each contrast value pair membership to a cluster based on a fuzzy c-means (FCM) algorithm, each cluster being programmed to take steps corresponding to one of said tissue types The medical imaging system of claim 1, comprising a modified processor.
をさらに含み、
前記表示装置は、該分類された組織タイプについて算出されたボリュームを表示する、
請求項1乃至6のうちいずれか1項に記載の医用イメージングシステム。 An analysis unit for calculating a volume of at least one classified tissue type;
The display device displays a volume calculated for the classified tissue type;
The medical imaging system according to any one of claims 1 to 6.
造影後に、健康な心筋と、梗塞、グレーゾーン、血液とを対比する第2の画像を取得するステップと、
前記第1の画像及び第2の画像を相互位置合わせするステップと、
前記第1の画像及び第2の画像から、対応するボクセルの測定されたコントラスト値ペアを作成するステップであり、前記コントラスト値ペアは、対応するボクセルについて、前記第1の画像からの1つの値と前記第2の画像からの1つの値とを各々含む、ステップと、
組織タイプを各々分類するクラスタに、コントラスト値ペアのメンバシップを割り振るステップと、
各々のクラスタ化されたコントラスト値ペアの、前記の分類された組織タイプに基づいて、前記第1の画像及び第2の画像について対応する画像化された領域の診断画像の各ボクセルに、前記の分類された組織タイプを割り当てるステップと、
前記診断画像を表示するステップであり、前記診断画像において各々の分類された組織タイプが異なるコントラスト又は色で表される、ステップと、
を含む、医用イメージングシステムの作動方法。 Obtaining a first image contrasting blood with an infarct, gray zone, healthy myocardium prior to imaging;
After imaging, obtaining a second image comparing healthy myocardium with infarct, gray zone, blood;
Mutually aligning the first image and the second image;
Creating a measured contrast value pair of corresponding voxels from the first image and the second image, wherein the contrast value pair is a value from the first image for the corresponding voxel; And a value from said second image, respectively,
Assigning contrast value pair memberships to clusters that classify each tissue type;
Based on the classified tissue type of each clustered contrast value pair, for each voxel of the diagnostic image of the corresponding imaged region for the first image and the second image, Assigning the classified organization type,
Displaying the diagnostic image, wherein each classified tissue type in the diagnostic image is represented by a different contrast or color; and
A method of operating a medical imaging system , comprising:
をさらに含む請求項9乃至12のうちいずれか1項に記載の医用イメージングシステムの作動方法。 13. The method further comprising: displaying the clustered contrast value pairs in a distribution diagram of contrast value pairs, wherein each contrast value pair is contrasted by cluster membership. A method for operating a medical imaging system according to any one of the preceding claims.
をさらに含み、前記表示するステップは、
前記選択された分類された組織タイプの前記の算出されたボリュームを表示するステップ
をさらに含む、請求項9乃至14のうちいずれか1項に記載の医用イメージングシステムの作動方法。 Calculating the volume of the selected classified tissue type in the diagnostic image, the displaying step comprising:
The method of operating a medical imaging system according to any one of claims 9 to 14, further comprising displaying the calculated volume of the selected classified tissue type.
を含むシステム。 A system comprising one or more processors programmed to perform the method of any one of claims 9-15.
前記コントラスト値ペアを、複数の組織タイプの各々に対応するクラスタにグループ化するステップと、
前記コントラスト値ペアがグループ化されたクラスタに基づいて、各ボクセルの組織タイプを決定するステップと、
をなすようにプログラムされたプロセッサ
を含む画像処理システム。 Generating a contrast value pair from corresponding voxels of a first image and a second image having different contrast characteristics, wherein the first image is a pre-contrast image and the second image is a post-contrast image The first image contrasts blood with infarction, gray zone, and healthy myocardium, and the second image contrasts healthy heart muscle with infarction, gray zone, and blood. The contrast value pair includes a value from the first image and a value from the second image, respectively, for the corresponding voxel;
Grouping the contrast value pairs into clusters corresponding to each of a plurality of tissue types;
Determining the tissue type of each voxel based on the cluster in which the contrast value pairs are grouped;
An image processing system including a processor programmed to form a computer program.
Applications Claiming Priority (3)
| Application Number | Priority Date | Filing Date | Title |
|---|---|---|---|
| US201261591412P | 2012-01-27 | 2012-01-27 | |
| US61/591,412 | 2012-01-27 | ||
| PCT/IB2013/050543 WO2013111051A1 (en) | 2012-01-27 | 2013-01-22 | Automated detection of area at risk using quantitative t1 mapping |
Publications (2)
| Publication Number | Publication Date |
|---|---|
| JP2015510412A JP2015510412A (en) | 2015-04-09 |
| JP6214563B2 true JP6214563B2 (en) | 2017-10-18 |
Family
ID=47747731
Family Applications (1)
| Application Number | Title | Priority Date | Filing Date |
|---|---|---|---|
| JP2014553834A Expired - Fee Related JP6214563B2 (en) | 2012-01-27 | 2013-01-22 | Automated detection of areas at risk using quantitative T1 mapping |
Country Status (7)
| Country | Link |
|---|---|
| US (1) | US9547942B2 (en) |
| EP (1) | EP2807633B1 (en) |
| JP (1) | JP6214563B2 (en) |
| CN (1) | CN104094314B (en) |
| BR (1) | BR112014018076A8 (en) |
| RU (1) | RU2626869C2 (en) |
| WO (1) | WO2013111051A1 (en) |
Families Citing this family (14)
| Publication number | Priority date | Publication date | Assignee | Title |
|---|---|---|---|---|
| JP6132653B2 (en) * | 2013-05-08 | 2017-05-24 | 東芝メディカルシステムズ株式会社 | Image processing apparatus and magnetic resonance imaging apparatus |
| WO2015069824A2 (en) * | 2013-11-06 | 2015-05-14 | Lehigh University | Diagnostic system and method for biological tissue analysis |
| CN104881865B (en) * | 2015-04-29 | 2017-11-24 | 北京林业大学 | Forest pest and disease monitoring method for early warning and its system based on unmanned plane graphical analysis |
| WO2016187052A1 (en) * | 2015-05-15 | 2016-11-24 | Stc.Unm | Quantitative [fe]-mri (femri) of anti-psma-conjugated spions based on psma expression levels |
| US10685210B2 (en) * | 2015-08-25 | 2020-06-16 | Koninklijke Philips N.V. | Tissue microarray registration and analysis |
| JP6326034B2 (en) * | 2015-12-11 | 2018-05-16 | 安西メディカル株式会社 | Xenon CT system |
| WO2017134830A1 (en) * | 2016-02-05 | 2017-08-10 | 株式会社日立製作所 | Medical image diagnostic assistance device and magnetic resonance imaging device |
| US10695134B2 (en) * | 2016-08-25 | 2020-06-30 | Verily Life Sciences Llc | Motion execution of a robotic system |
| EP3373247A1 (en) * | 2017-03-09 | 2018-09-12 | Koninklijke Philips N.V. | Image segmentation and prediction of segmentation |
| EP3379281A1 (en) * | 2017-03-20 | 2018-09-26 | Koninklijke Philips N.V. | Image segmentation using reference gray scale values |
| EP3477324A1 (en) * | 2017-10-31 | 2019-05-01 | Pie Medical Imaging BV | Improving left ventricle segmentation in contrast-enhanced cine mri datasets |
| US11344374B2 (en) * | 2018-08-13 | 2022-05-31 | Verily Life Sciences Llc | Detection of unintentional movement of a user interface device |
| TWI758950B (en) * | 2020-11-13 | 2022-03-21 | 大陸商昆山瑞創芯電子有限公司 | Calibration method and calibration apparatus applied to display panel |
| CN118022200A (en) * | 2022-11-11 | 2024-05-14 | 中硼(厦门)医疗器械有限公司 | Treatment planning system, overlapping automatic checking method and treatment planning making method |
Family Cites Families (12)
| Publication number | Priority date | Publication date | Assignee | Title |
|---|---|---|---|---|
| JPS60165945A (en) * | 1984-02-10 | 1985-08-29 | 株式会社日立製作所 | Image processing system |
| EP0984722A4 (en) * | 1997-05-23 | 2004-04-14 | Carolinas Heart Inst | Electromagnetical imaging and therapeutic (emit) systems |
| US6205349B1 (en) | 1998-09-29 | 2001-03-20 | Siemens Medical Systems, Inc. | Differentiating normal living myocardial tissue, injured living myocardial tissue, and infarcted myocardial tissue in vivo using magnetic resonance imaging |
| US6842638B1 (en) * | 2001-11-13 | 2005-01-11 | Koninklijke Philips Electronics N.V. | Angiography method and apparatus |
| US20040218794A1 (en) * | 2003-05-01 | 2004-11-04 | Yi-Hsuan Kao | Method for processing perfusion images |
| US7480412B2 (en) * | 2003-12-16 | 2009-01-20 | Siemens Medical Solutions Usa, Inc. | Toboggan-based shape characterization |
| EP2008239A2 (en) | 2006-03-17 | 2008-12-31 | Koninklijke Philips Electronics N.V. | Combining magnetic resonance images |
| US10098563B2 (en) | 2006-11-22 | 2018-10-16 | Toshiba Medical Systems Corporation | Magnetic resonance imaging apparatus |
| US8086297B2 (en) | 2007-01-31 | 2011-12-27 | Duke University | Dark blood delayed enhancement magnetic resonance viability imaging techniques for assessing subendocardial infarcts |
| US9395431B2 (en) * | 2008-05-01 | 2016-07-19 | Sunnybrook Health Sciences Center | Multi-contrast delayed enhancement cardiac magnetic resonance imaging |
| CN101916443B (en) * | 2010-08-19 | 2012-10-17 | 中国科学院深圳先进技术研究院 | Processing method and system of CT image |
| CN102004917B (en) * | 2010-12-17 | 2012-04-18 | 南方医科大学 | Method for extracting image edge neighbor description feature operator |
-
2013
- 2013-01-22 BR BR112014018076A patent/BR112014018076A8/en not_active Application Discontinuation
- 2013-01-22 RU RU2014134899A patent/RU2626869C2/en not_active IP Right Cessation
- 2013-01-22 JP JP2014553834A patent/JP6214563B2/en not_active Expired - Fee Related
- 2013-01-22 US US14/374,731 patent/US9547942B2/en active Active
- 2013-01-22 CN CN201380006573.9A patent/CN104094314B/en active Active
- 2013-01-22 EP EP13705596.8A patent/EP2807633B1/en active Active
- 2013-01-22 WO PCT/IB2013/050543 patent/WO2013111051A1/en active Application Filing
Also Published As
| Publication number | Publication date |
|---|---|
| US20150213652A1 (en) | 2015-07-30 |
| CN104094314B (en) | 2018-06-08 |
| JP2015510412A (en) | 2015-04-09 |
| EP2807633A1 (en) | 2014-12-03 |
| BR112014018076A2 (en) | 2017-06-20 |
| EP2807633B1 (en) | 2018-08-22 |
| US9547942B2 (en) | 2017-01-17 |
| BR112014018076A8 (en) | 2017-07-11 |
| RU2626869C2 (en) | 2017-08-02 |
| RU2014134899A (en) | 2016-03-20 |
| WO2013111051A1 (en) | 2013-08-01 |
| CN104094314A (en) | 2014-10-08 |
Similar Documents
| Publication | Publication Date | Title |
|---|---|---|
| JP6214563B2 (en) | Automated detection of areas at risk using quantitative T1 mapping | |
| US9424644B2 (en) | Methods and systems for evaluating bone lesions | |
| Militello et al. | A semi-automatic approach for epicardial adipose tissue segmentation and quantification on cardiac CT scans | |
| Yu et al. | Automated radiation targeting in head-and-neck cancer using region-based texture analysis of PET and CT images | |
| Kim et al. | Automatic hippocampal segmentation in temporal lobe epilepsy: impact of developmental abnormalities | |
| US20170236283A1 (en) | Image analysis method supporting illness development prediction for a neoplasm in a human or animal body | |
| EP2407927B1 (en) | A method and device for evaluating evolution of tumoral lesions | |
| WO2013078370A1 (en) | Voxel-based approach for disease detection and evolution | |
| JP2017520305A (en) | Tissue region segmentation and prediction methods in patients with acute cerebral ischemia | |
| CN109416835B (en) | Change detection in medical images | |
| US9147242B2 (en) | Processing system for medical scan images | |
| WO2019007952A1 (en) | Method for assessing a likelihood that an ischemia in a brain tissue area results in an infarction of this brain tissue area by image analysis | |
| Yang et al. | Delineation of FDG-PET tumors from heterogeneous background using spectral clustering | |
| Sun et al. | Automated template-based PET region of interest analyses in the aging brain | |
| US20110194741A1 (en) | Brain ventricle analysis | |
| Shen et al. | An improved lesion detection approach based on similarity measurement between fuzzy intensity segmentation and spatial probability maps | |
| JP2020505092A (en) | Cortical malformation identification | |
| GB2515634A (en) | System and methods for efficient assessment of lesion development | |
| Johnstone et al. | Assessment of tissue edema in patients with acute myocardial infarction by computer‐assisted quantification of triple inversion recovery prepared MRI of the myocardium | |
| Slomka et al. | Quantification of myocardial perfusion | |
| WO2017198518A1 (en) | Image data processing device | |
| Wesarg | AHA conform analysis of myocardial function using and extending the toolkits ITK and VTK | |
| O'Brien et al. | Machine Learning Based Cardiac Scar Detection in Computed Tomography | |
| Madhav et al. | An Automated Segmentation Method for Assesing Myocardial Infarct Size Using K-Means Algorithm | |
| Tamburo | Feature-Based Correspondences to Infer the Location of Anatomical Landmarks |
Legal Events
| Date | Code | Title | Description |
|---|---|---|---|
| A621 | Written request for application examination |
Free format text: JAPANESE INTERMEDIATE CODE: A621 Effective date: 20160119 |
|
| A977 | Report on retrieval |
Free format text: JAPANESE INTERMEDIATE CODE: A971007 Effective date: 20161117 |
|
| A131 | Notification of reasons for refusal |
Free format text: JAPANESE INTERMEDIATE CODE: A131 Effective date: 20170104 |
|
| A601 | Written request for extension of time |
Free format text: JAPANESE INTERMEDIATE CODE: A601 Effective date: 20170328 |
|
| A521 | Request for written amendment filed |
Free format text: JAPANESE INTERMEDIATE CODE: A523 Effective date: 20170424 |
|
| A131 | Notification of reasons for refusal |
Free format text: JAPANESE INTERMEDIATE CODE: A131 Effective date: 20170516 |
|
| A521 | Request for written amendment filed |
Free format text: JAPANESE INTERMEDIATE CODE: A523 Effective date: 20170803 |
|
| TRDD | Decision of grant or rejection written | ||
| A01 | Written decision to grant a patent or to grant a registration (utility model) |
Free format text: JAPANESE INTERMEDIATE CODE: A01 Effective date: 20170822 |
|
| A61 | First payment of annual fees (during grant procedure) |
Free format text: JAPANESE INTERMEDIATE CODE: A61 Effective date: 20170919 |
|
| R150 | Certificate of patent or registration of utility model |
Ref document number: 6214563 Country of ref document: JP Free format text: JAPANESE INTERMEDIATE CODE: R150 |
|
| R250 | Receipt of annual fees |
Free format text: JAPANESE INTERMEDIATE CODE: R250 |
|
| R250 | Receipt of annual fees |
Free format text: JAPANESE INTERMEDIATE CODE: R250 |
|
| R250 | Receipt of annual fees |
Free format text: JAPANESE INTERMEDIATE CODE: R250 |
|
| LAPS | Cancellation because of no payment of annual fees |