JP6160445B2 - Analysis apparatus, analysis method, and analysis program - Google Patents
Analysis apparatus, analysis method, and analysis program Download PDFInfo
- Publication number
- JP6160445B2 JP6160445B2 JP2013226058A JP2013226058A JP6160445B2 JP 6160445 B2 JP6160445 B2 JP 6160445B2 JP 2013226058 A JP2013226058 A JP 2013226058A JP 2013226058 A JP2013226058 A JP 2013226058A JP 6160445 B2 JP6160445 B2 JP 6160445B2
- Authority
- JP
- Japan
- Prior art keywords
- data
- cluster
- sampling
- prediction
- analysis
- Prior art date
- Legal status (The legal status is an assumption and is not a legal conclusion. Google has not performed a legal analysis and makes no representation as to the accuracy of the status listed.)
- Active
Links
Images


Description
本発明は、分析装置等に関する。 The present invention relates to an analyzer and the like.
クラスタ分析は、データの集まりをデータ間の類似度に基づいて複数のクラスタに分類する処理である。例えば、クラスタ分析には、階層的クラスタ分析や非階層的クラスタ分析がある。 Cluster analysis is a process of classifying a collection of data into a plurality of clusters based on the similarity between the data. For example, cluster analysis includes hierarchical cluster analysis and non-hierarchical cluster analysis.
階層的クラスタ分析は、例えば、個々のデータを1つのクラスタとして設定し、クラスタ間の類似度を計算し、最も類似している各クラスタを併合する処理を繰り返し実行するものである。 In the hierarchical cluster analysis, for example, individual data is set as one cluster, the similarity between the clusters is calculated, and the process of merging the most similar clusters is repeatedly executed.
非階層的クラスタ分析は、分類の状態を表す関数を使い、関数の値が最適解となるように探索を行うものである。 Non-hierarchical cluster analysis uses a function representing a classification state and performs a search so that the value of the function becomes an optimal solution.
しかしながら、上述した従来技術では、大規模データについてクラスタ分析を実行すると時間を要するという問題がある。 However, the above-described conventional technique has a problem that it takes time to perform cluster analysis on large-scale data.
例えば、階層的クラスタ分析および非階層的クラスタ分析はそれぞれ、小規模データ、中規模データに対してクラスタ分析を実行することを想定している。このため、現実的な計算機環境により、大規模データに対して階層的クラスタ分析や非階層的クラスタ分析を実行すると、現実的な計算時間内で計算できないことがある。 For example, hierarchical cluster analysis and non-hierarchical cluster analysis assume that cluster analysis is performed on small-scale data and medium-scale data, respectively. For this reason, if hierarchical cluster analysis or non-hierarchical cluster analysis is performed on large-scale data in a realistic computer environment, calculation may not be possible within realistic calculation time.
1つの側面では、クラスタ分析に要する時間を削減することができる分析装置、分析方法および分析プログラムを提供することを目的とする。 An object of one aspect is to provide an analysis apparatus, an analysis method, and an analysis program that can reduce the time required for cluster analysis.
第1の案では、分析装置は、サンプリング実行部、クラスタ分析部、クラスタ予測部、判定部、最終クラスタ計算部を有する。サンプリング実行部は、入力データに対してサンプリングを実行し前記入力データから一部のデータを抽出する処理を繰り返し実行して複数のサンプリングデータを生成する。クラスタ分析部は、複数のサンプリングデータについてクラスタ分析を実行し、サンプリングデータ毎に、サンプリングデータに含まれるデータを異なるクラスタに分類する。クラスタ予測部は、複数のサンプリングデータに対するクラスタ分析部の複数の分類結果と入力データとを基にして、入力データに含まれるデータの所属するクラスタを予測したデータを示す予測データを複数生成する。判定部は、予測データのクラスタ間距離およびクラスタ内距離を基にして、予測データ毎に評価値を算出し、パレート解となる評価値に対応する予測データを判定する。最終クラスタ計算部は、パレート解となる評価値に対応する予測データを基にして、前記入力データに含まれるデータをクラスタに分類する。なお、パレート解となる予測データは、例えば、評価値が他の予測データと比較して優越するものである。 In the first plan, the analysis apparatus includes a sampling execution unit, a cluster analysis unit, a cluster prediction unit, a determination unit, and a final cluster calculation unit. The sampling execution unit generates a plurality of sampling data by repeatedly performing a process of sampling the input data and extracting a part of the data from the input data. The cluster analysis unit performs cluster analysis on a plurality of sampling data, and classifies data included in the sampling data into different clusters for each sampling data. The cluster prediction unit generates a plurality of prediction data indicating data obtained by predicting a cluster to which the data included in the input data belongs, based on the plurality of classification results of the cluster analysis unit for the plurality of sampling data and the input data. The determination unit calculates an evaluation value for each prediction data based on the inter-cluster distance and the intra-cluster distance of the prediction data, and determines prediction data corresponding to the evaluation value that is a Pareto solution. The final cluster calculation unit classifies the data included in the input data into clusters based on the prediction data corresponding to the evaluation value that is the Pareto solution. Note that the prediction data that is the Pareto solution has, for example, an evaluation value that is superior to other prediction data.
本発明の1実施態様によれば、クラスタ分析に要する時間を削減することができるという効果を奏する。 According to one embodiment of the present invention, it is possible to reduce the time required for cluster analysis.
以下に、本願の開示する分析装置、分析方法および分析プログラムの実施例を図面に基づいて詳細に説明する。なお、この実施例によりこの発明が限定されるものではない。 Hereinafter, embodiments of an analysis apparatus, an analysis method, and an analysis program disclosed in the present application will be described in detail with reference to the drawings. Note that the present invention is not limited to the embodiments.
図1は、本実施例1に係る分析装置の構成を示す機能ブロック図である。図1に示すように、この分析装置100は、通信部110、入力部120、出力部130、記憶部140、制御部150を有する。
FIG. 1 is a functional block diagram illustrating the configuration of the analyzer according to the first embodiment. As illustrated in FIG. 1, the
通信部110は、無線または有線によってネットワークに接続し、ネットワークを介して、他の装置とデータ通信を行う処理部である。通信部110は、通信装置に対応する。
The
入力部120は、各種の情報を入力する入力装置である。入力部120は、例えば、キーボードやマウス、タッチパネル等に対応する。
The
出力部130は、制御部150から出力される情報を表示する表示装置である。例えば、出力部130は、モニタ、液晶ディスプレイ、タッチパネル等に対応する。
The output unit 130 is a display device that displays information output from the
記憶部140は、分析対象データ141、サンプリングデータテーブル142、予測データテーブル143、評価値テーブル144、中間データテーブル145、最終データ146を有する。記憶部140は、例えば、RAM(Random Access Memory)、ROM(Read Only Memory)、フラッシュメモリ(Flash Memory)などの半導体メモリ素子や、HDD(Hard Disk Drive)などの記憶装置に対応する。
The
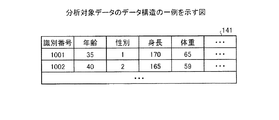
分析対象データ141は、クラスタ分析の対象となるデータである。図2は、分析対象データのデータ構造の一例を示す図である。図2に示すように、分析対象データ141は、識別番号、年齢、性別、身長、体重等を有する。識別番号は、各レコードを一意に識別する情報である。年齢、性別、身長、体重は、特定の人物の年齢、性別、身長、体重をそれぞれ示す情報である。なお、図2に示す例では、性別を1または2で表す。例えば、性別「1」は、性別が男性であることを示し、性別「2」は、性別が女性であることを示す。
The
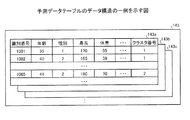
サンプリングデータテーブル142は、複数のサンプリングデータを有するテーブルである。各サンプリングデータは、後述するサンプリング実行部151によって生成される。サンプリング実行部151が分析対象データ141をサンプリングすることで、各サンプリングデータが生成される。図3は、サンプリングデータテーブルのデータ構造の一例を示す図である。図3に示すように、サンプリングデータテーブル142は、サンプリングデータ142a,142b,142cを有する。図3では一例として、サンプリングデータ142a,142b,142cを示すが、その他のサンプリングデータを含んでも良い。
The sampling data table 142 is a table having a plurality of sampling data. Each sampling data is generated by a
図3において、例えば、サンプリングデータ142aは、識別番号、年齢、性別、身長、体重、クラスタ番号を有する。識別番号、年齢、性別、身長、体重に関する説明は、図2で説明した、年齢、性別、身長、体重の説明と同様である。
In FIG. 3, for example, the
予測データテーブル143は、複数の予測データを有するテーブルである。各予測データは、後述するクラスタ予測部153によって生成される。クラスタ予測部153が、サンプリングデータを基にして、分析対象データ141の各レコードのクラスタ番号を予測することで、予測データを生成する。サンプリングデータ毎に予測データが生成される。図4は、予測データテーブルのデータ構造の一例を示す図である。図4に示すように、予測データテーブル143は、予測データ143a,143b,143cを有する。図4では一例として、予測データ143a,143b,143cを示すが、その他の予測データを含んでも良い。
The prediction data table 143 is a table having a plurality of prediction data. Each prediction data is generated by a
評価値データテーブル144は、各予測データの評価値をそれぞれ保持するテーブルである。図5は、評価値データテーブルのデータ構造の一例を示す図である。図5に示すように、この評価値データテーブル144は、予測データ識別情報と、評価値とを対応付ける。予測データ識別情報は、予測データを一意に識別する情報である。 The evaluation value data table 144 is a table that holds the evaluation value of each prediction data. FIG. 5 is a diagram illustrating an example of a data structure of the evaluation value data table. As shown in FIG. 5, this evaluation value data table 144 associates predicted data identification information with evaluation values. The prediction data identification information is information that uniquely identifies the prediction data.
図5において、評価値は、クラスタ間距離と、クラスタ内距離とを含む。クラスタ間距離は、異なるクラスタ間の距離を示すものである。一般的に、クラスタ間距離が大きいほど、クラスタ分析結果に対する評価が高くなる。クラスタ内距離は、クラスタの直径を示すものである。一般的に、クラスタ内距離が小さいほど、クラスタ分析結果に対する評価が高くなる。即ち、クラスタ間距離が大きいほど、また、クラスタ内距離が小さいほど、クラスタ分析結果が優れている。 In FIG. 5, the evaluation value includes an inter-cluster distance and an intra-cluster distance. The inter-cluster distance indicates the distance between different clusters. In general, the larger the inter-cluster distance, the higher the evaluation for the cluster analysis result. The intra-cluster distance indicates the diameter of the cluster. In general, the smaller the intra-cluster distance, the higher the evaluation for the cluster analysis result. That is, the larger the inter-cluster distance and the smaller the intra-cluster distance, the better the cluster analysis result.
中間データテーブル145は、複数の中間データを有するテーブルである。各中間データは、評価値の良い予測データに対応して作成される。図6は、中間データテーブルのデータ構造の一例を示す図である。図6に示すように、この中間データテーブル145は、中間データ145a,145g,145zを有する。図6では一例として、中間データ145a,145g,145zを示すが、その他の中間データを含んでも良い。
The intermediate data table 145 is a table having a plurality of intermediate data. Each intermediate data is created corresponding to prediction data having a good evaluation value. FIG. 6 is a diagram illustrating an example of the data structure of the intermediate data table. As shown in FIG. 6, the intermediate data table 145 includes
図6において、中間データは、識別番号と、各クラスタ番号とを対応付ける。識別番号は、分析対象データ141の識別番号に対応する。例えば、中間データ145aの1段目では、識別番号1001に対応するレコードが、クラスタ番号「1」に分類されることを示す。ここで、識別番号「1001」に対応するレコードは、図2に示した分析対象データ141の識別番号「1001」に対応するレコードに対応する。従って、図2に示した分析対象データ141の識別番号「1001」に対応するレコードが、クラスタ番号「1」のクラスタに属していることを示す。
In FIG. 6, the intermediate data associates an identification number with each cluster number. The identification number corresponds to the identification number of the
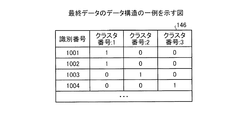
最終データ146は、分析対象データ141の最終的なクラスタ分析結果を示す。図7は、最終データのデータ構造の一例を示す図である。図7に示すように、この最終データ146は、識別番号と、各クラスタ番号とを対応付ける。識別番号は、分析対象データ141の識別番号に対応する。例えば、最終データ146の1段目では、識別番号1001に対応するレコードが、クラスタ番号「1」に分類されることを示す。
The
図1の説明に戻る。制御部150は、サンプリング実行部151、クラスタ分析部152、クラスタ予測部153、判定部154、最終クラスタ計算部155を有する。制御部150は、例えば、ASIC(Application Specific Integrated Circuit)や、FPGA(Field Programmable Gate Array)などの集積装置に対応する。また、制御部150は、例えば、CPU(Central Processing Unit)やMPU(Micro Processing Unit)等の電子回路に対応する。
Returning to the description of FIG. The
サンプリング実行部151は、分析対象データ141に対してサンプリングを複数回繰り返し実行することで、複数のサンプリングデータを生成する処理部である。サンプリング実行部151は、生成した各サンプリングデータを、サンプリングデータテーブル142に格納する。
The
例えば、サンプリング実行部151は、入力部120を介して、計算回数およびサンプリング件数を取得し、取得した計算回数だけ、サンプリングを行う。また、サンプリング実行部151は、サンプリングを実行する度に、サンプリング間隔を変更しても良い。また、ランダムサンプリングを行っても良い。
For example, the
サンプリング実行部151は、サンプリングデータのレコードの件数を、入力部120から取得したサンプリング件数に合わせる。例えば、指定されたサンプリング件数がN2件の場合には、各サンプリングデータの件数をそれぞれN2件とする。例えば、分析対象データのレコードの件数をN1件とすると、N1とN2との大小関係は「N1>N2」となる。
The
クラスタ分析部152は、サンプリングデータテーブル142に格納された各サンプリングデータを取得し、各サンプリングデータをクラスタ分析する処理部である。クラスタ分析部152は、クラスタ分析結果に応じて、サンプリングデータの各レコードについてクラスタ番号を割り当てる。
The
図3に示したサンプリングデータテーブル142を例にして説明を行う。クラスタ分析部152は、まず、サンプリングデータ142aに対してクラスタ分析を行い、サンプリングデータ142aの各レコードを複数のクラスタに分類し、分類結果に応じて、クラスタ番号を割り振る。クラスタ分析部152は、サンプリングデータ142b,142cについても同様に、クラスタ分析を行って、各レコードを、複数のクラスタに分類し、分類結果に応じて、クラスタ番号を割り振る。クラスタ分析部152が分類するクラスタの数は、予め設定されているものとする。
The sampling data table 142 shown in FIG. 3 will be described as an example. The
クラスタ分析部152が行うクラスタ分析は、階層的クラスタ分析でも良いし、非階層的クラスタ分析でもよい。ここでは一例として、クラスタ分析部152が、階層的クラスタ分析を実行する場合について説明する。
The cluster analysis performed by the
クラスタ分析部152が、階層的クラスタ分析を行う場合には、まず、個々のデータを1つのクラスタとして設定し、クラスタ間の類似度を計算する。クラスタ分析部152は、最も類似しているクラスタを併合する。クラスタ分析部152は、予め設定されたクラスタの数と同数になるまで、上記処理を繰り返し実行する。
When the
例えば、クラスタ分析部152は、各クラスタの組み合わせについて、クラスタ間のユークリッド距離を算出し、ユークリッド距離が最小となる各クラスタの組みを、合併する。この場合には、クラスタ間のユークリッド距離が上記クラスタ間の類似度に対応し、ユークリッド距離が短いほど、類似度が高い。
For example, the
クラスタ予測部153は、サンプリングデータテーブル142のサンプリングデータのクラスタ分析結果に基づいて、分析対象データ141の各レコードのクラスタ番号を予測し、予測データテーブル143を生成する処理部である。クラスタ予測部153は、サンプリングデータテーブル142に含まれるサンプリングデータの数だけ、予測データを生成し、生成した予測データを予測データテーブル143に登録する。
The
例えば、クラスタ予測部153は、サンプリングデータテーブル142のサンプリングデータ142aを基にして、予測データ143aを生成する。クラスタ予測部153は、サンプリングデータ142bを基にして、予測データ143bを生成する。クラスタ予測部153は、サンプリングデータ142cを基にして、予測データ143cを生成する。クラスタ予測部153は、サンプリングデータがN個存在する場合には、予測データをN個作成する。
For example, the
ここで、クラスタ予測部153が、サンプリングデータ142aを基にして、予測データ143aを生成する場合の処理の一例について説明する。まず、クラスタ予測部153は、サンプリングデータ142含まれる識別番号と、クラスタ番号との関係を、そのまま、予測データ143aに設定する。
Here, an example of processing when the
例えば、クラスタ予測部153は、サンプリングデータ142aに識別番号「1001」のレコードのクラスタ番号が「1」の場合には、予測データ143aの識別番号「1001」のクラスタ番号を「1」に設定する。同様に、クラスタ予測部153は、サンプリングデータ142aに存在する全ての識別番号とクラスタ番号との関係を、予測データ143aに設定する。
For example, if the cluster number of the record with the identification number “1001” in the
続いて、クラスタ予測部153は、上記処理を行った結果、クラスタ番号が未設定となるレコードについて下記の処理を行う。まず、クラスタ予測部153は、各クラスタに分類されたレコードから、代表レコードを検出する。例えば、クラスタ番号「1」のレコードのうち、平均的な数値を有するレコードを代表レコードとして検出する。クラスタ予測部153は、他のクラスタ番号に対応する代表レコードも同様にして検出する。
Subsequently, the
クラスタ予測部153は、クラスタ番号が未設定のレコードと、各代表レコードとのユークリッド距離を計算し、ユークリッド距離が最小となる組み合わせを特定する。クラスタ予測部153は、特定した組の代表レコードのクラスタ番号を、該当するレコードのクラスタ番号に設定する。
The
例えば、クラスタ番号が未設定のレコードと、各代表レコードとのユークリッド距離を算出し、未設定のレコードと、クラスタ番号「1」の代表レコードとのユーグリッド距離が最小の場合には、該当するレコードのクラスタ番号を「1」に設定する。クラスタ予測部153は、未設定のレコードについて、上記処理を繰り返し実行することで、予測データテーブル143を生成する。
For example, when the Euclidean distance between the record in which the cluster number is not set and each representative record is calculated, and the Eugrid distance between the record that has not been set and the representative record with the cluster number “1” is the minimum, this is applicable. Set the cluster number of the record to “1”. The
判定部154は、予測データテーブル143を基にして、評価値データテーブル144を生成する処理部である。評価部154は、予測データテーブル143に含まれる予測データ毎に評価値を算出する。
The
判定部154は、予測データ毎にクラスタ間距離およびクラスタ内距離を算出し、クラスタ間距離およびクラスタ内距離を予測データの評価値とする。予測データのクラスタ間距離を算出する処理の一例について説明する。ここでは、クラスタ番号「1〜3」のクラスタが存在するものとする。判定部154は、クラスタ番号「1」に属する第1代表レコードと、クラスタ番号「2」に属する第2代表レコードと、クラスタ番号「3」に属する第3代表レコードとを検出する。代表レコードを検出する処理の一例は、例えば、同一のクラスタ番号に属するレコードのうち、平均的な数値を有するレコードを代表レコードとして検出する。
The
判定部154は、第1代表レコードと、第2代表レコードとのユークリッド距離を算出し、第1代表レコードと第3代表レコードとのユークリッド距離を算出する。判定部154は、算出した各ユークリッド距離を平均したユークリッド距離を、予測データのクラスタ間距離とする。
The
例えば、第1代表レコードの年齢、性別、身長、体重の値をそれぞれ、a1、a2、a3、a4とする。第2代表レコードの年齢、性別、身長、体重の値をそれぞれ、b1、b2、b3、b4とする。第3代表レコードの年齢、性別、身長、体重の値をそれぞれ、c1、c2、c3、c4とする。この場合には、第1代表レコードと、第2代表レコードとのユークリッド距離X1は、式(1)で計算され、第1代表レコードと、第3代表レコードとのユークリッド距離X2は、式(2)で計算される。この場合には、予測データのクラスタ間距離は式(3)に示すものとなる。 For example, the values of age, sex, height, and weight of the first representative record are a1, a2, a3, and a4, respectively. The values of age, sex, height, and weight of the second representative record are b1, b2, b3, and b4, respectively. Assume that the values of the age, sex, height, and weight of the third representative record are c1, c2, c3, and c4, respectively. In this case, the Euclidean distance X1 between the first representative record and the second representative record is calculated by Expression (1), and the Euclidean distance X2 between the first representative record and the third representative record is calculated by Expression (2). ). In this case, the inter-cluster distance of the prediction data is as shown in Expression (3).
ユーグリット距離X1=((a1−b1)2+(a2−b2)2+(a3−b3)2+(a4−b4)2)1/2・・・(1) Eugrit distance X1 = ((a1-b1) 2 + (a2-b2) 2 + (a3-b3) 2 + (a4-b4) 2 ) 1/2 (1)
ユーグリット距離X2=((a1−c1)2+(a2−c2)2+(a3−c3)2+(a4−c4)2)1/2・・・(2) Eugrid distance X2 = ((a1-c1) 2 + (a2-c2) 2 + (a3-c3) 2 + (a4-c4) 2 ) 1/2 (2)
クラスタ間距離=(X1+X2)/2・・・(3) Distance between clusters = (X1 + X2) / 2 (3)
続いて、クラスタ内距離を算出する処理について説明する。まず、判定部154は、同一のクラスタ番号に属する各レコード間のユークリッド距離をそれぞれ算出する。そして、判定部154は、算出したユークリッド距離を平均したユークリッド距離を、予測データのクラスタ内距離とする。判定部154は、各クラスタ番号のクラスタに対応するクラスタ内距離を平均することで、予測データのクラスタ内距離を算出する。
Next, a process for calculating the intra-cluster distance will be described. First, the
例えば、クラスタ番号「1〜3」のクラスタが存在する場合には、判定部154は、各クラスタ番号「1〜3」のクラスタ内距離をそれぞれ算出する。判定部154は、各クラスタ番号「1〜3」のクラスタ内距離を平均することで、予測データのクラスタ内距離を算出する。
For example, when there is a cluster with the cluster number “1-3”, the
例えば、クラスタ番号「1」のクラスタ内距離を算出する例について説明する。クラスタ内に3つの第1レコード、第2レコード、第3レコードが存在するものとする。例えば、第1レコードの年齢、性別、身長、体重の値をそれぞれ、d1、d2、d3、d4とする。第2レコードの年齢、性別、身長、体重の値をそれぞれ、e1、e2、e3、e4とする。第3代表レコードの年齢、性別、身長、体重の値をそれぞれ、f1、f2、f3、f4とする。この場合には、第1レコードと、第2レコードとのユークリッド距離Y1は、式(4)で計算され、第1レコードと、第3レコードとのユークリッド距離Y2は、式(5)で計算される。この場合には、クラスタ番号「1」のクラスタのクラスタ内距離は式(6)に示すものとなる。 For example, an example of calculating the intra-cluster distance of the cluster number “1” will be described. Assume that there are three first records, second record, and third record in the cluster. For example, assume that the values of age, sex, height, and weight of the first record are d1, d2, d3, and d4, respectively. Assume that the values of age, sex, height, and weight of the second record are e1, e2, e3, and e4, respectively. The values of the age, sex, height, and weight of the third representative record are f1, f2, f3, and f4, respectively. In this case, the Euclidean distance Y1 between the first record and the second record is calculated by Expression (4), and the Euclidean distance Y2 between the first record and the third record is calculated by Expression (5). The In this case, the intra-cluster distance of the cluster with the cluster number “1” is as shown in Expression (6).
ユーグリット距離Y1=((d1−e1)2+(d2−e2)2+(d3−e3)2+(d4−e4)2)1/2・・・(4) Eugrid distance Y1 = ((d1−e1) 2 + (d2−e2) 2 + (d3−e3) 2 + (d4−e4) 2 ) 1/2 (4)
ユーグリット距離Y2=((d1−f1)2+(d2−f2)2+(d3−f3)2+(d4−f4)2)1/2・・・(5) Eugrid distance Y2 = ((d1-f1) 2 + (d2-f2) 2 + (d3-f3) 2 + (d4-f4) 2 ) 1/2 (5)
クラスタ内距離=(Y1+Y2)/2・・・(6) Distance within cluster = (Y1 + Y2) / 2 (6)
判定部154は、他のクラスタについても同様にクラスタ内距離を算出し、各クラスタのクラスタ内距離を平均することで、予測データのクラスタ内距離を算出する。
The
判定部154は、予測データテーブル143に含まれる予測データ毎に上記処理を実行することで、各予測データの評価値を算出し、評価値データテーブル144を生成する。
The
最終クラスタ計算部155は、分析対象データ141の最終的なクラスタ分析結果となる最終データ146を生成する処理部である。最終クラスタ計算部155は、評価値データテーブル144から中間データテーブル145を生成する処理を行った後に、中間データテーブル145を基にして、最終データ146を生成する。
The final
最終クラスタ計算部155が、評価値データテーブル144から中間データテーブル145を生成する処理の一例について説明する。最終クラスタ計算部155は、評価値データテーブル144の予測データ毎の評価値を比較して、パレート解となる予測データを特定し、特定したパレート解となる予測データを、中間データテーブル145に設定する。例えば、パレート解となる予測データは、一つ以上の項目について他の予測データよりも優れているものとなる。
An example of processing in which the final
図8は、各予測データのクラスタ内距離とクラスタ間距離との関係を示す図(1)である。図8において、縦軸はクラスタ内距離を示し、横軸はクラスタ間距離を示す。一般的に、クラスタ間距離が大きいほど、また、クラスタ内距離が小さいほど、予測データは、良い予測データであると言える。このため、図8に示す例では、最終クラスタ計算部155は、予測データ143a,143g,143zを、パレート解として特定する。
FIG. 8 is a diagram (1) showing the relationship between the intra-cluster distance and the inter-cluster distance of each prediction data. In FIG. 8, the vertical axis represents the intra-cluster distance, and the horizontal axis represents the inter-cluster distance. In general, it can be said that the prediction data is better prediction data as the inter-cluster distance is larger and the intra-cluster distance is smaller. Therefore, in the example illustrated in FIG. 8, the final
続いて、最終クラスタ計算部155が、中間データテーブル145から最終データ146を生成する処理について説明する。まず、最終クラスタ計算部155は、最終データ候補テーブルを生成する。図9は、最終データ候補テーブルの一例を示す図である。図9に示すように、この最終データ候補テーブル10は、最終データ候補10a,10b,10cを有する。ここでは一例として、最終データ候補10a,10b,10cを示すが、これ以外に、最終データ候補を含んでいても良い。
Subsequently, a process in which the final
最終クラスタ計算部155は、最終データ候補10a,10b,10cの各クラスタ番号を0の初期値に設定する。そして、最終クラスタ計算部155は、各識別番号の各クラスタ番号の値のいずれか一つが「1」となるように、ランダムに「1」を割り振る。例えば、図9に示す例では、最終データ候補10aの識別番号「1001」に対してランダムに「1」を割り振ることで、クラスタ番号「1」に対応するものが「1」に設定され、その他のクラスタ番号については「0」が設定される。
The final
最終クラスタ計算部155は、最終データ候補テーブル10の各最終データ候補10a,10b,10cと、中間データテーブル145の各中間データとの類似度を計算し、最も類似度の高い最終データ候補を、最終データ146として特定する。
The
最終クラスタ計算部155は、中間データの識別番号および識別番号に対応するクラスタ番号と、最終データ候補の識別番号および識別番号に対応するクラスタ番号とを比較し、一致する数を計数する。最終クラスタ計算部155は、一致する数を、全レコード数で除算することで、類似度を算出する。以下の説明では、一致する数を、一致数と表記する。
The
例えば、最終クラスタ計算部155が、最終データ候補10aの類似度を算出する場合について説明する。最終クラスタ計算部155は、最終データ候補10aと中間データ145aとを比較し、一致数が「L1」であり、最終データ候補10aの全レコード数が「M1」の場合には、最終データ候補10aと中間データ145aとの類似度は「L1/M1」となる。最終クラスタ計算部155は、最終データ候補10aと中間データ145gとを比較し、一致数が「L2」であり、最終データ候補10aの全レコード数が「M2」の場合には、最終データ候補10aと中間データ145aとの類似度は「L2/M2」となる。最終クラスタ計算部155は、最終データ候補10aと中間データ145zとを比較し、一致数が「L3」であり、最終データ候補10aの全レコード数が「M3」の場合には、最終データ候補10aと中間データ145zとの類似度は「L3/M3」となる。この場合には、最終クラスタ計算部155は、最終データ候補10aの類似度を「L1/M1+L2/M2+L3/M3」と特定する。
For example, a case where the final
最終クラスタ計算部155は、最終データ候補10b,10cに関しても、最終データ候補10aと同様にして、類似度を算出する。最終クラスタ計算部155は、最終データ候補10aの類似度、最終データ候補10bの類似度、最終データ候補10cの類似度を比較し、類似度が最大となる最終データ候補を特定する。最終クラスタ計算部155は、特定した最終データ候補を、最終データ146として設定する。最終クラスタ計算部155は、最終データ146を、出力部130に出力しても良い。
The final
次に、本実施例1にかかる分析装置100の処理手順について説明する。図10は、本実施例1にかかる分析装置の処理手順を示すフローチャートである。図10に示すように、分析装置100は、分析対象データ141を受け付ける(ステップS101)。また、分析装置100は、繰り返し計算回数を受け付け(ステップS102)、サンプリング件数を受け付ける。また、カウント値を初期化する(ステップS103)。分析装置100は、カウント値に1を加算する(ステップS104)。カウント値の初期値を0とする。
Next, a processing procedure of the
分析装置100は、分析対象データ141をサンプリングし、サンプリングデータを生成する(ステップS105)。各サンプリングデータは、サンプリングデータテーブル142に格納される。分析装置100は、サンプリングデータに対してクラスタ分析処理を実行し、各々のレコードに対してクラスタ番号を割り振る(ステップS106)。
The
分析装置100は、クラスタ番号を割り振ったサンプリングデータと分析対象データ141とを比較して、分析対象データ141に含まれる各々のレコードに対してクラスタ番号を割り振ることで予測データを生成する(ステップS107)。各予測データは、予測データテーブル143に格納される。
The
分析装置100は、予測データを基にして、クラスタ内距離およびクラスタ間距離を算出し、評価値データテーブル144を生成する(ステップS108)。分析装置100は、繰り返しの計算回数がカウント値未満であるか否かを判定する(ステップS109)。分析装置100は、繰り返しの計算回数がカウント値未満の場合には(ステップS1090,Yes)、ステップS104に移行する。
The
一方、分析装置100は、繰り返しの計算回数がカウント値以上である場合には(ステップS109,No)、パレート解に対応する予測データを選択して、中間データテーブル145を作成する(ステップS110)。
On the other hand, when the number of repeated calculations is equal to or greater than the count value (No at Step S109), the
分析装置100は、ランダムにクラスタ番号を割り振った複数の最終データ候補を生成する(ステップS111)。ステップS111において、分析装置100は、類似度が大きくなるようにクラスタ番号を割り振る。例えば、分析装置100は、ランダムにクラスタ番号を割り振り、類似度を計算する。そして、分析装置100は、類似度が大きい、クラスタ番号の割り振りを少し変更して、類似度が大きくなるか、試行する処理を利用者が設定した回数繰り返す。
The
分析装置100は、中間データと各最終データ候補とを比較して、類似度が最大となる最終データ候補を判定する(ステップS112)。ステップS112で判定した類似度が最大となる最終データ候補が、最終データ146となる。分析装置100は、判定結果を出力する(ステップS113)。
The
次に、本実施例1にかかる分析装置100の効果について説明する。分析装置100は分析対象データ141から抽出したサンプリングデータをクラスタ分析し、サンプリングデータのクラスタ分析結果を基にして、分析対象データの各データが属するクラスタを予測した複数の予測データを生成する。そして、分析装置100は、複数の予測データのうち、評価値のよい予測データのクラスタ分類結果を用いて、分析対象データ141の最終的なクラスタ分類結果を特定する。これにより、分析装置100によれば、クラスタ分析に要する時間を削減することができる。
Next, effects of the
また、現実的な計算機で、現実的な時間内に計算できない、大規模なデータに対して、現実的な計算機で、現実的な時間内に、クラスタ分析を実行することができる。 In addition, it is possible to perform cluster analysis within a realistic time with a realistic computer for large-scale data that cannot be calculated within a realistic time with a realistic computer.
図11は、本実施例2にかかる分析装置の構成を示す機能ブロック図である。図11に示すように、この分析装置200は、通信部210、入力部220、出力部230、記憶部240、制御部250を有する。
FIG. 11 is a functional block diagram of the configuration of the analyzer according to the second embodiment. As illustrated in FIG. 11, the
通信部210、入力部220、出力部230に関する説明は、図1に示した、通信部110、入力部120、出力部130に関する説明と同様である。
The description regarding the
記憶部240は、分析対象データ241、サンプリングデータテーブル242、予測データテーブル243、評価値データテーブル244、中間データテーブル245、最終データ246を有する。記憶部240は、例えば、RAM、ROM、フラッシュメモリなどの半導体メモリ素子や、HDDなどの記憶装置に対応する。
The
分析対象データ241は、クラスタ分析の対象となるデータである。分析対象データ241のデータ構造は、図2に示した分析対象データ141のデータ構造と同様である。
The
サンプリングデータテーブル242は、複数のサンプリングデータを有するテーブルである。各サンプリングデータは、後述するサンプリング実行部251によって生成される。サンプリング実行部251が分析対象データ241をサンプリングすることで、各サンプリングデータが生成される。サンプリングデータテーブル242のデータ構造は、図3に示したサンプリングデータテーブル142のデータ構造と同様である。
The sampling data table 242 is a table having a plurality of sampling data. Each sampling data is generated by a
予測データテーブル243は、複数の予測データを有するテーブルである。各予測データは、後述するクラスタ予測部253によって生成される。クラスタ予測部253が、サンプリングデータを基にして、分析対象データ241の各レコードのクラスタ番号を予測することで、予測データを生成する。サンプリングデータ毎に予測データが生成される。予測データテーブル243のデータ構造は、図4に示した予測データテーブル143のデータ構造と同様である。
The prediction data table 243 is a table having a plurality of prediction data. Each prediction data is generated by a
評価値データテーブル244は、各予測データの評価値をそれぞれ保持するテーブルである。評価値データテーブル244のデータ構造は、図5に示した評価値データテーブル144のデータ構造と同様である。 The evaluation value data table 244 is a table that holds the evaluation value of each prediction data. The data structure of the evaluation value data table 244 is the same as the data structure of the evaluation value data table 144 shown in FIG.
中間データテーブル245は、複数の中間データを有するテーブルである。各中間データは、評価値の良い予測データに対応して作成される。中間データテーブル245のデータ構造は、図6に示した中間データテーブル145のデータ構造と同様である。 The intermediate data table 245 is a table having a plurality of intermediate data. Each intermediate data is created corresponding to prediction data having a good evaluation value. The data structure of the intermediate data table 245 is the same as the data structure of the intermediate data table 145 shown in FIG.
最終データ246a,246b,246cは、分析対象データ241の最終的なクラスタ分析結果を示す。各最終データ246a,246b,246cのデータ構造は、図7に示した最終データ146のデータ構造と同様である。
The
図11の説明に戻る。制御部250は、サンプリング実行部251、クラスタ分析部252、クラスタ予測部253、判定部254、最終クラスタ計算部255を有する。制御部250は、例えば、ASICや、FPGAなどの集積装置に対応する。また、制御部250は、例えば、CPUやMPU等の電子回路に対応する。
Returning to the description of FIG. The
サンプリング実行部251は、分析対象データ241に対してサンプリングを複数回繰り返し実行することで、複数のサンプリングデータを生成する処理部である。サンプリング実行部251は、生成した各サンプリングデータを、サンプリングデータテーブル242に格納する。サンプリング実行部251の具体的な処理は、図1に示したサンプリング実行部151と同様である。
The
クラスタ分析部252は、サンプリングデータテーブル242に格納された各サンプリングデータを取得し、各サンプリングデータをクラスタ分析する処理部である。クラスタ分析部252は、クラスタ分析結果に応じて、サンプリングデータの各レコードについてクラスタ番号を割り当てる。クラスタ分析部252の具体的な処理は、図1に示したクラスタ分析部152と同様である。
The
クラスタ予測部253は、サンプリングデータテーブル242のサンプリングデータのクラスタ分析結果に基づいて、分析対象データ241の各レコードのクラスタ番号を予測し、予測データテーブル243を生成する処理部である。クラスタ予測部253の具体的な処理は、図1に示したクラスタ予測部153と同様である。
The
判定部254は、予測データテーブル243を基にして、評価値データテーブル244を生成する処理部である。判定部254は、予測データテーブル243に含まれる予測データ毎に評価値を算出する。例えば、判定部254は、予測データ毎にクラスタ間距離およびクラスタ内距離を算出し、クラスタ間距離およびクラスタ内距離を予測データの評価値とする。
The
最終クラスタ計算部255は、分析対象データ241の最終的なクラスタ分析結果となる最終データ246を生成する処理部である。最終クラスタ計算部255は、評価値データテーブル244から中間データテーブル245を生成する処理を行った後に、中間データテーブル245を基にして、最終データ246a,246b,246cを生成する。
The final
最終クラスタ計算部255が、評価値データテーブル244から中間データテーブル245を生成する処理について説明する。最終クラスタ計算部255は、評価データテーブル244の予測データ毎の評価値を比較し、パレート解となる予測データを特定し、特定したパレート解となる予測データを、中間データテーブル245に設定する。
A process in which the final
図12は、各予測データのクラスタ内距離とクラスタ間距離との関係を示す図(2)である。図12において、縦軸はクラスタ内距離を示し、横軸はクラスタ間距離を示す。一般的に、クラスタ間距離が大きいほど、また、クラスタ内距離が小さいほど、中間データは、良い予測データであると言える。このため、図12に示す例では、最終クラスタ計算部255は、中間データ243a,243c,243f,243g,243zを、パレート解として特定する。
FIG. 12 is a diagram (2) illustrating the relationship between the intra-cluster distance and the inter-cluster distance of each prediction data. In FIG. 12, the vertical axis represents the intra-cluster distance, and the horizontal axis represents the inter-cluster distance. In general, it can be said that the intermediate data is better prediction data as the inter-cluster distance is larger and the intra-cluster distance is smaller. Therefore, in the example illustrated in FIG. 12, the final
続いて、最終クラスタ計算部255が、中間データテーブル245から最終データ246を生成する処理について説明する。最終クラスタ計算部255は、中間データテーブル245の各予測データの評価値を比較して、類似する予測データ同士を同一グループに分類する処理を行う。例えば、最終クラスタ計算部255は、各予測データのクラスタ間距離の差分が閾値未満となり、かつ、各予測データのクラスタ内距離の差分が閾値未満となる予測データを、同一のグループに分類する。
Next, a process in which the final
図12に示す例では、最終クラスタ計算部255は、予測データ243a,243cをグループ50aに分類し、予測データ243f,243gをグループ50bに分類し、予測データ243i,243zをグループ50cに分類する。最終クラスタ計算部255は、分類したグループ毎に、最終データ246を生成する。
In the example illustrated in FIG. 12, the final
例えば、最終クラスタ計算部255は、グループ50aに含まれる予測データ243a,243cを基にして、最終データ246aを生成する。最終クラスタ計算部255は、グループ50bに含まれる予測データ243f,243gを基にして、最終データ246bを生成する。最終クラスタ計算部255は、グループ50cに含まれる予測データ243i,243zを基にして、最終データ246cを生成する。
For example, the final
最終クラスタ計算部255が、予測データを基にして、最終データを特定する処理は、図1の最終クラスタ計算部155が、中間データテーブル145の予測データを基にして、最終データを特定する処理と同様である。図12に示す例では、グループ50a,50b,50cについて、最終データが特定され、最終データ246a,246b,246cが生成される。
The final
次に、本実施例2に係る分析装置200の処理手順について説明する。図13および図14は、実施例2にかかる分析装置の処理手順を示すフローチャートである。図13に示すように、分析装置200は、分析対象データ241を受け付ける(ステップS201)。また、分析装置200は、繰り返し計算回数を受け付け(ステップS202)、サンプリング件数を受け付ける。また、カウント値を初期化する(ステップS203)。分析装置200は、カウント値に1を加算する(ステップS204)。カウント値の初期値を0とする。
Next, a processing procedure of the
分析装置200は、分析対象データ241をサンプリングし、サンプリングデータを生成する(ステップS205)。各サンプリングデータは、サンプリングデータテーブル242に格納される。分析装置200は、サンプリングデータに対してクラスタ分析処理を実行し、各々のレコードに対してクラスタ番号を割り振る(ステップS206)。
The
分析装置200は、クラスタ番号を割り振ったサンプリングデータと分析対象データ241とを比較して、分析対象データ241に含まれる各々のレコードに対してクラスタ番号を割り振ることで予測データを生成する(ステップS207)。各予測データは、予測データテーブル243に格納される。
The
分析装置200は、予測データを基にして、クラスタ内距離およびクラスタ間距離を算出し、評価値データテーブル244を生成する(ステップS208)。分析装置200は、繰り返しの計算回数がカウント値未満であるか否かを判定する(ステップS209)。分析装置2100は、繰り返しの計算回数がカウント値未満の場合には(ステップS2090,Yes)、ステップS204に移行する。
The
一方、分析装置200は、繰り返しの計算回数がカウント値以上である場合には(ステップS209,No)、図14のステップS210に移行する。
On the other hand, when the number of repeated calculations is equal to or greater than the count value (No at Step S209), the
図14の説明に移行する。分析装置200は、パレート解に対応する予測データを選択して、中間データテーブル245を作成する(ステップS210)。分析装置200は、パレート解に対応する各予測データの類似度を算出する(ステップS211)。分析装置200は、類似する各予測データを、グループに分類する(ステップS212)。
The description shifts to the description of FIG. The
分析装置200は、未選択のグループを選択し(ステップS213)、ランダムにクラスタ番号を割り振った複数の最終データ候補を生成する(ステップS214)。ステップS214において、分析装置200は、類似度が大きくなるようにクラスタ番号を割り振る。例えば、分析装置200は、ランダムにクラスタ番号を割り振り、類似度を計算する。そして、分析装置200は、類似度が大きい、クラスタ番号の割り振りを少し変更して、類似度が大きくなるか、試行する処理を利用者が設定した回数繰り返す。
The
分析装置200は、グループに含まれる予測データと各最終データ候補とを比較して、類似度が最大となる最終データ候補を判定する(ステップS215)。
The
分析装置200は、未選択のグループが存在するか否かを判定する(ステップS216)。分析装置200は、未選択のグループが存在する場合には(ステップS216,Yes)、ステップS213に移行する。一方、分析装置200は、未選択のグループが存在しない場合には(ステップS216,No)、各グループの判定結果を出力する(ステップS217)。
The
次に、本実施例2に係る分析装置200の効果について説明する。分析装置200は、複数の予測データのうち、評価値のよい予測データを類似する予測データ同士でグルーピングし、グループ毎に、最終データ246を生成する。このため、分析装置200によれば、クラスタ分析に要する時間を削減することができる。また、類似する予測データに応じた最終データの候補を複数得ることが出来る。
Next, the effect of the
次に、上記実施例に示した分析装置100,200と同様の機能を実現する分析プログラムを実行するコンピュータの一例について説明する。図15は、分析プログラムを実行するコンピュータの一例を示す図である。
Next, an example of a computer that executes an analysis program that realizes the same function as the
図15に示すように、コンピュータ300は、各種演算処理を実行するCPU301と、ユーザからのデータの入力を受け付ける入力装置302と、ディスプレイ303を有する。また、コンピュータ300は、記憶媒体からプログラム等を読取る読み取り装置304と、ネットワークを介して他のコンピュータとの間でデータの授受を行うインターフェース装置305とを有する。また、コンピュータ300は、各種情報を一時記憶するRAM306と、ハードディスク装置307を有する。そして、各装置301〜307は、バス308に接続される。
As illustrated in FIG. 15, the
ハードディスク装置307は、サンプリングプログラム307a、クラスタ分析プログラム307b、クラスタ予測プログラム307c、判定プログラム307d、最終クラスタ計算プログラム307eを有する。CPU301は、各プログラム307a〜307eを読み出してRAM306に展開する。
The
サンプリングプログラム307aは、サンプリングプロセス306aとして機能する。クラスタ分析プログラム307bは、クラスタ分析プロセス306bとして機能する。クラスタ予測プログラム307cは、クラスタ予測プロセス306cとして機能する。判定プログラム307dは、判定プロセス306dとして機能する。最終クラスタ計算プログラム307eは、最終クラスタ計算プロセス306eとして機能する。
The sampling program 307a functions as a
例えば、サンプリングプロセス306aは、サンプリング実行部151,251に対応する。クラスタ分析プロセス306bは、クラスタ分析部152,252に対応する。クラスタ予測プロセス306cは、クラスタ予測部153,253に対応する。判定プロセス306dは、判定部154,254に対応する。最終クラスタ計算プロセス306eは、最終クラスタ計算部155,255に対応する。
For example, the
なお、各プログラム307a〜307eについては、必ずしも最初からハードディスク装置307に記憶させておかなくても良い。例えば、コンピュータ300に挿入されるフレキシブルディスク(FD)、CD−ROM、DVDディスク、光磁気ディスク、ICカードなどの「可搬用の物理媒体」に各プログラムを記憶させておく。そして、コンピュータ500がこれらから各プログラム307a〜307eを読み出して実行するようにしてもよい。
Note that the programs 307a to 307e are not necessarily stored in the
以上の各実施例を含む実施形態に関し、さらに以下の付記を開示する。 The following supplementary notes are further disclosed with respect to the embodiments including the above examples.
(付記1)入力データに対してサンプリングを実行し前記入力データから一部のデータを抽出する処理を繰り返し実行して複数のサンプリングデータを生成するサンプリング実行部と、
前記複数のサンプリングデータについてクラスタ分析を実行し、前記サンプリングデータ毎に、前記サンプリングデータに含まれるデータを異なるクラスタに分類するクラスタ分析部と、
前記複数のサンプリングデータに対する前記クラスタ分析部の複数の分類結果と前記入力データとを基にして、前記入力データに含まれるデータの所属するクラスタを予測したデータを示す予測データを複数生成するクラスタ予測部と、
前記予測データのクラスタ間距離およびクラスタ内距離を基にして、予測データ毎に評価値を算出し、パレート解となる評価値に対応する予測データを判定する判定部と、
前記パレート解となる評価値に対応する予測データを基にして、前記入力データに含まれるデータをクラスタに分類する最終クラスタ計算部と
を有することを特徴とする分析装置。
(Supplementary Note 1) A sampling execution unit that performs sampling on input data and repeatedly executes a process of extracting some data from the input data to generate a plurality of sampling data;
A cluster analysis unit that performs cluster analysis on the plurality of sampling data, and classifies the data included in the sampling data into different clusters for each sampling data;
Cluster prediction for generating a plurality of prediction data indicating data obtained by predicting a cluster to which data included in the input data belongs based on a plurality of classification results of the cluster analysis unit and the input data for the plurality of sampling data And
A determination unit that calculates an evaluation value for each prediction data based on the inter-cluster distance and the intra-cluster distance of the prediction data, and determines prediction data corresponding to the evaluation value that is a Pareto solution;
An analysis device comprising: a final cluster calculation unit that classifies data included in the input data into clusters based on prediction data corresponding to the evaluation value that is the Pareto solution.
(付記2)前記最終クラスタ計算部は、パレート解となる評価値に対応する類似の予測データをグループ化し、同一グループに含まれる予測データを基にして、前記入力データに含まれるデータを異なるクラスタに分類する処理を、グループ毎に実行することを特徴とする付記1に記載の分析装置。
(Supplementary Note 2) The final cluster calculation unit groups similar prediction data corresponding to the evaluation value that is a Pareto solution, and sets the data included in the input data to different clusters based on the prediction data included in the same group. The analysis apparatus according to
(付記3)前記最終クラスタ計算部は、前記入力データに対して、ランダムにクラスタを割り当てた複数の最終クラスタデータを生成し、各最終クラスタデータと予測データとの類似度を基にして、特定の最終クラスタデータを選択することを特徴とする付記1または2に記載の分析装置。
(Supplementary Note 3) The final cluster calculation unit generates a plurality of final cluster data in which clusters are randomly assigned to the input data, and specifies based on the similarity between each final cluster data and predicted data The analyzer according to
(付記4)コンピュータが実行する分析方法であって、
入力データに対してサンプリングを実行し前記入力データから一部のデータを抽出する処理を繰り返し実行して複数のサンプリングデータを生成し、
前記複数のサンプリングデータについてクラスタ分析を実行し、前記サンプリングデータ毎に、前記サンプリングデータに含まれるデータを異なるクラスタに分類し、
前記複数のサンプリングデータに対する前記クラスタ分析部の複数の分類結果と前記入力データとを基にして、前記入力データに含まれるデータの所属するクラスタを予測したデータを示す予測データを複数生成し、
前記予測データのクラスタ間距離およびクラスタ内距離を基にして、予測データ毎に評価値を算出し、パレート解となる評価値に対応する予測データを判定し、
前記パレート解となる評価値に対応する予測データを基にして、前記入力データに含まれるデータをクラスタに分類する
各処理を実行することを特徴とする分析方法。
(Supplementary Note 4) An analysis method executed by a computer,
Sampling the input data and repeatedly executing a process of extracting a part of the data from the input data to generate a plurality of sampling data,
Cluster analysis is performed on the plurality of sampling data, and the data included in the sampling data is classified into different clusters for each sampling data,
Based on a plurality of classification results of the cluster analysis unit for the plurality of sampling data and the input data, to generate a plurality of prediction data indicating data predicted clusters to which the data included in the input data belongs,
Based on the inter-cluster distance and intra-cluster distance of the prediction data, calculate an evaluation value for each prediction data, determine the prediction data corresponding to the evaluation value to be a Pareto solution,
An analysis method comprising: performing each process of classifying data included in the input data into clusters based on prediction data corresponding to the evaluation value serving as the Pareto solution.
(付記5)前記入力データに含まれるデータをクラスタに分類する処理は、パレート解となる評価値に対応する類似の予測データをグループ化し、同一グループに含まれる予測データを基にして、前記入力データに含まれるデータを異なるクラスタに分類する処理を、グループ毎に実行することを特徴とする付記4に記載の分析方法。 (Additional remark 5) The process which classifies the data contained in the said input data into a cluster groups the similar prediction data corresponding to the evaluation value used as a Pareto solution, and performs said input based on the prediction data contained in the same group The analysis method according to appendix 4, wherein the process of classifying the data included in the data into different clusters is executed for each group.
(付記6)前記入力データに含まれるデータをクラスタに分類する処理は、前記入力データに対して、ランダムにクラスタを割り当てた複数の最終クラスタデータを生成し、各最終クラスタデータと予測データとの類似度を基にして、特定の最終クラスタデータを選択することを特徴とする付記4または5に記載の分析方法。
(Additional remark 6) The process which classifies the data contained in the said input data into a cluster produces | generates several final cluster data which allocated the cluster at random with respect to the said input data, and each final cluster data and prediction data 6. The analysis method according to
(付記7)コンピュータに、
入力データに対してサンプリングを実行し前記入力データから一部のデータを抽出する処理を繰り返し実行して複数のサンプリングデータを生成し、
前記複数のサンプリングデータについてクラスタ分析を実行し、前記サンプリングデータ毎に、前記サンプリングデータに含まれるデータを異なるクラスタに分類し、
前記複数のサンプリングデータに対する前記クラスタ分析部の複数の分類結果と前記入力データとを基にして、前記入力データに含まれるデータの所属するクラスタを予測したデータを示す予測データを複数生成し、
前記予測データのクラスタ間距離およびクラスタ内距離を基にして、予測データ毎に評価値を算出し、パレート解となる評価値に対応する予測データを判定し、
前記パレート解となる評価値に対応する予測データを基にして、前記入力データに含まれるデータをクラスタに分類する
各処理を実行させることを特徴とする分析プログラム。
(Appendix 7)
Sampling the input data and repeatedly executing a process of extracting a part of the data from the input data to generate a plurality of sampling data,
Cluster analysis is performed on the plurality of sampling data, and the data included in the sampling data is classified into different clusters for each sampling data,
Based on a plurality of classification results of the cluster analysis unit for the plurality of sampling data and the input data, to generate a plurality of prediction data indicating data predicted clusters to which the data included in the input data belongs,
Based on the inter-cluster distance and intra-cluster distance of the prediction data, calculate an evaluation value for each prediction data, determine the prediction data corresponding to the evaluation value to be a Pareto solution,
An analysis program for executing each process for classifying data included in the input data into clusters based on prediction data corresponding to an evaluation value serving as the Pareto solution.
(付記8)前記入力データに含まれるデータをクラスタに分類する処理は、パレート解となる評価値に対応する類似の予測データをグループ化し、同一グループに含まれる予測データを基にして、前記入力データに含まれるデータを異なるクラスタに分類する処理を、グループ毎に実行することを特徴とする付記7に記載の分析プログラム。 (Additional remark 8) The process which classifies the data contained in the said input data into a cluster groups the similar prediction data corresponding to the evaluation value used as a Pareto solution, and performs said input based on the prediction data contained in the same group The analysis program according to appendix 7, wherein the process of classifying the data included in the data into different clusters is executed for each group.
(付記9)前記入力データに含まれるデータをクラスタに分類する処理は、前記入力データに対して、ランダムにクラスタを割り当てた複数の最終クラスタデータを生成し、各最終クラスタデータと予測データとの類似度を基にして、特定の最終クラスタデータを選択することを特徴とする付記4または5に記載の分析方法。
(Additional remark 9) The process which classifies the data contained in the said input data into a cluster produces | generates several final cluster data which allocated the cluster at random with respect to the said input data, and each final cluster data and prediction data 6. The analysis method according to
100,200 分析装置
151,251 サンプリング実行部
152,252 クラスタ分析部
153,253 クラスタ予測部
154,254 判定部
155,255 最終クラスタ計算部
100,200 Analysis device 151,251 Sampling execution unit 152,252 Cluster analysis unit 153,253 Cluster prediction unit 154,254 Determination unit 155,255 Final cluster calculation unit
Claims (5)
前記複数のサンプリングデータについてクラスタ分析を実行し、前記サンプリングデータ毎に、前記サンプリングデータに含まれるデータを異なるクラスタに分類するクラスタ分析部と、
前記複数のサンプリングデータに対する前記クラスタ分析部の複数の分類結果と前記入力データとを基にして、前記入力データに含まれるデータの所属するクラスタを予測したデータを示す予測データを複数生成するクラスタ予測部と、
前記予測データのクラスタ間距離およびクラスタ内距離を基にして、予測データ毎に評価値を算出し、パレート解となる評価値に対応する予測データを判定する判定部と、
前記パレート解となる評価値に対応する予測データを基にして、前記入力データに含まれるデータをクラスタに分類する最終クラスタ計算部と
を有することを特徴とする分析装置。 A sampling execution unit that performs sampling on input data and repeatedly executes a process of extracting some data from the input data to generate a plurality of sampling data;
A cluster analysis unit that performs cluster analysis on the plurality of sampling data, and classifies the data included in the sampling data into different clusters for each sampling data;
Cluster prediction for generating a plurality of prediction data indicating data obtained by predicting a cluster to which data included in the input data belongs based on a plurality of classification results of the cluster analysis unit and the input data for the plurality of sampling data And
A determination unit that calculates an evaluation value for each prediction data based on the inter-cluster distance and the intra-cluster distance of the prediction data, and determines prediction data corresponding to the evaluation value that is a Pareto solution;
An analysis device comprising: a final cluster calculation unit that classifies data included in the input data into clusters based on prediction data corresponding to the evaluation value that is the Pareto solution.
入力データに対してサンプリングを実行し前記入力データから一部のデータを抽出する処理を繰り返し実行して複数のサンプリングデータを生成し、
前記複数のサンプリングデータについてクラスタ分析を実行し、前記サンプリングデータ毎に、前記サンプリングデータに含まれるデータを異なるクラスタに分類し、
前記複数のサンプリングデータに対する前記クラスタ分析部の複数の分類結果と前記入力データとを基にして、前記入力データに含まれるデータの所属するクラスタを予測したデータを示す予測データを複数生成し、
前記予測データのクラスタ間距離およびクラスタ内距離を基にして、予測データ毎に評価値を算出し、パレート解となる評価値に対応する予測データを判定し、
前記パレート解となる評価値に対応する予測データを基にして、前記入力データに含まれるデータをクラスタに分類する
各処理を実行することを特徴とする分析方法。 An analysis method performed by a computer,
Sampling the input data and repeatedly executing a process of extracting a part of the data from the input data to generate a plurality of sampling data,
Cluster analysis is performed on the plurality of sampling data, and the data included in the sampling data is classified into different clusters for each sampling data,
Based on a plurality of classification results of the cluster analysis unit for the plurality of sampling data and the input data, to generate a plurality of prediction data indicating data predicted clusters to which the data included in the input data belongs,
Based on the inter-cluster distance and intra-cluster distance of the prediction data, calculate an evaluation value for each prediction data, determine the prediction data corresponding to the evaluation value to be a Pareto solution,
An analysis method comprising: performing each process of classifying data included in the input data into clusters based on prediction data corresponding to the evaluation value serving as the Pareto solution.
入力データに対してサンプリングを実行し前記入力データから一部のデータを抽出する処理を繰り返し実行して複数のサンプリングデータを生成し、
前記複数のサンプリングデータについてクラスタ分析を実行し、前記サンプリングデータ毎に、前記サンプリングデータに含まれるデータを異なるクラスタに分類し、
前記複数のサンプリングデータに対する前記クラスタ分析部の複数の分類結果と前記入力データとを基にして、前記入力データに含まれるデータの所属するクラスタを予測したデータを示す予測データを複数生成し、
前記予測データのクラスタ間距離およびクラスタ内距離を基にして、予測データ毎に評価値を算出し、パレート解となる評価値に対応する予測データを判定し、
前記パレート解となる評価値に対応する予測データを基にして、前記入力データに含まれるデータをクラスタに分類する
各処理を実行させることを特徴とする分析プログラム。 On the computer,
Sampling the input data and repeatedly executing a process of extracting a part of the data from the input data to generate a plurality of sampling data,
Cluster analysis is performed on the plurality of sampling data, and the data included in the sampling data is classified into different clusters for each sampling data,
Based on a plurality of classification results of the cluster analysis unit for the plurality of sampling data and the input data, to generate a plurality of prediction data indicating data predicted clusters to which the data included in the input data belongs,
Based on the inter-cluster distance and intra-cluster distance of the prediction data, calculate an evaluation value for each prediction data, determine the prediction data corresponding to the evaluation value to be a Pareto solution,
An analysis program for executing each process for classifying data included in the input data into clusters based on prediction data corresponding to an evaluation value serving as the Pareto solution.
Priority Applications (1)
| Application Number | Priority Date | Filing Date | Title |
|---|---|---|---|
| JP2013226058A JP6160445B2 (en) | 2013-10-30 | 2013-10-30 | Analysis apparatus, analysis method, and analysis program |
Applications Claiming Priority (1)
| Application Number | Priority Date | Filing Date | Title |
|---|---|---|---|
| JP2013226058A JP6160445B2 (en) | 2013-10-30 | 2013-10-30 | Analysis apparatus, analysis method, and analysis program |
Publications (2)
| Publication Number | Publication Date |
|---|---|
| JP2015087966A JP2015087966A (en) | 2015-05-07 |
| JP6160445B2 true JP6160445B2 (en) | 2017-07-12 |
Family
ID=53050691
Family Applications (1)
| Application Number | Title | Priority Date | Filing Date |
|---|---|---|---|
| JP2013226058A Active JP6160445B2 (en) | 2013-10-30 | 2013-10-30 | Analysis apparatus, analysis method, and analysis program |
Country Status (1)
| Country | Link |
|---|---|
| JP (1) | JP6160445B2 (en) |
Families Citing this family (1)
| Publication number | Priority date | Publication date | Assignee | Title |
|---|---|---|---|---|
| JP6962316B2 (en) * | 2016-03-29 | 2021-11-05 | ソニーグループ株式会社 | Information processing equipment, information processing methods, programs, and systems |
Family Cites Families (5)
| Publication number | Priority date | Publication date | Assignee | Title |
|---|---|---|---|---|
| JP3478967B2 (en) * | 1998-03-04 | 2003-12-15 | 日本電信電話株式会社 | Two-phase data cluster method and apparatus and recording medium recording two-phase data cluster program |
| US7162413B1 (en) * | 1999-07-09 | 2007-01-09 | International Business Machines Corporation | Rule induction for summarizing documents in a classified document collection |
| JP4867332B2 (en) * | 2005-12-26 | 2012-02-01 | 日産自動車株式会社 | Pareto new area search device, medium on which Pareto new area search program is recorded, Pareto new area search display device, and Pareto new area search method |
| JP4867334B2 (en) * | 2005-12-27 | 2012-02-01 | 日産自動車株式会社 | Pareto new area search device, medium on which Pareto new area search program is recorded, Pareto new area search display device, and Pareto new area search method |
| JP4997761B2 (en) * | 2005-12-28 | 2012-08-08 | 日産自動車株式会社 | Pareto new area search device, Pareto new area search program, Pareto new area search and display apparatus, and Pareto new area search method |
-
2013
- 2013-10-30 JP JP2013226058A patent/JP6160445B2/en active Active
Also Published As
| Publication number | Publication date |
|---|---|
| JP2015087966A (en) | 2015-05-07 |
Similar Documents
| Publication | Publication Date | Title |
|---|---|---|
| CN106650780B (en) | Data processing method and device, classifier training method and system | |
| Hopfensitz et al. | Multiscale binarization of gene expression data for reconstructing Boolean networks | |
| CN110826648B (en) | Method for realizing fault detection by utilizing time sequence clustering algorithm | |
| JP5674679B2 (en) | Evolutionary clustering algorithm | |
| JP4934058B2 (en) | Co-clustering apparatus, co-clustering method, co-clustering program, and recording medium recording the program | |
| JP6099234B2 (en) | Parallel touchpoint detection using processor graphics | |
| Ayadi et al. | BicFinder: a biclustering algorithm for microarray data analysis | |
| JP2018045559A (en) | Information processing device, information processing method, and program | |
| Kumar et al. | Fuzzy-rough discriminative feature selection and classification algorithm, with application to microarray and image datasets | |
| KR102351306B1 (en) | risk SNPs information generating apparatus for each disease based on disease-related SNPs analysis and method therefor | |
| Sebastiani et al. | Detection of significant groups in hierarchical clustering by resampling | |
| Madkour et al. | Hotspot detection using machine learning | |
| JP7434073B2 (en) | Model operation support system and method | |
| Ji et al. | A novel cluster center initialization method for the k-prototypes algorithms using centrality and distance | |
| Kim et al. | A method to identify differential expression profiles of time-course gene data with Fourier transformation | |
| JP5873764B2 (en) | Defect image presentation method | |
| Patowary et al. | Developing an effective biclustering technique using an enhanced proximity measure | |
| Wang et al. | Automatic cluster number selection by finding density peaks | |
| JP6160445B2 (en) | Analysis apparatus, analysis method, and analysis program | |
| US20220156519A1 (en) | Methods and systems for efficient batch active learning of a deep neural network | |
| Corral-Corral et al. | Machine learnable fold space representation based on residue cluster classes | |
| Cao et al. | A novel filter feature selection method for paired microarray expression data analysis | |
| Sylligardos et al. | Choose wisely: An extensive evaluation of model selection for anomaly detection in time series | |
| Liu et al. | An improved method for multi-objective clustering ensemble algorithm | |
| JP6233432B2 (en) | Method and apparatus for selecting mixed model |
Legal Events
| Date | Code | Title | Description |
|---|---|---|---|
| A621 | Written request for application examination |
Free format text: JAPANESE INTERMEDIATE CODE: A621 Effective date: 20160705 |
|
| A977 | Report on retrieval |
Free format text: JAPANESE INTERMEDIATE CODE: A971007 Effective date: 20170427 |
|
| TRDD | Decision of grant or rejection written | ||
| A01 | Written decision to grant a patent or to grant a registration (utility model) |
Free format text: JAPANESE INTERMEDIATE CODE: A01 Effective date: 20170516 |
|
| A61 | First payment of annual fees (during grant procedure) |
Free format text: JAPANESE INTERMEDIATE CODE: A61 Effective date: 20170529 |
|
| R150 | Certificate of patent or registration of utility model |
Ref document number: 6160445 Country of ref document: JP Free format text: JAPANESE INTERMEDIATE CODE: R150 |