JP6021187B2 - Metabolic biomarkers of autism - Google Patents
Metabolic biomarkers of autism Download PDFInfo
- Publication number
- JP6021187B2 JP6021187B2 JP2013508294A JP2013508294A JP6021187B2 JP 6021187 B2 JP6021187 B2 JP 6021187B2 JP 2013508294 A JP2013508294 A JP 2013508294A JP 2013508294 A JP2013508294 A JP 2013508294A JP 6021187 B2 JP6021187 B2 JP 6021187B2
- Authority
- JP
- Japan
- Prior art keywords
- autism
- metabolites
- brain
- autistic
- cellular
- Prior art date
- Legal status (The legal status is an assumption and is not a legal conclusion. Google has not performed a legal analysis and makes no representation as to the accuracy of the status listed.)
- Active
Links
Images


Classifications
-
- G—PHYSICS
- G01—MEASURING; TESTING
- G01N—INVESTIGATING OR ANALYSING MATERIALS BY DETERMINING THEIR CHEMICAL OR PHYSICAL PROPERTIES
- G01N33/00—Investigating or analysing materials by specific methods not covered by groups G01N1/00 - G01N31/00
- G01N33/48—Biological material, e.g. blood, urine; Haemocytometers
- G01N33/50—Chemical analysis of biological material, e.g. blood, urine; Testing involving biospecific ligand binding methods; Immunological testing
- G01N33/68—Chemical analysis of biological material, e.g. blood, urine; Testing involving biospecific ligand binding methods; Immunological testing involving proteins, peptides or amino acids
- G01N33/6893—Chemical analysis of biological material, e.g. blood, urine; Testing involving biospecific ligand binding methods; Immunological testing involving proteins, peptides or amino acids related to diseases not provided for elsewhere
- G01N33/6896—Neurological disorders, e.g. Alzheimer's disease
-
- G—PHYSICS
- G01—MEASURING; TESTING
- G01N—INVESTIGATING OR ANALYSING MATERIALS BY DETERMINING THEIR CHEMICAL OR PHYSICAL PROPERTIES
- G01N33/00—Investigating or analysing materials by specific methods not covered by groups G01N1/00 - G01N31/00
- G01N33/48—Biological material, e.g. blood, urine; Haemocytometers
- G01N33/50—Chemical analysis of biological material, e.g. blood, urine; Testing involving biospecific ligand binding methods; Immunological testing
- G01N33/92—Chemical analysis of biological material, e.g. blood, urine; Testing involving biospecific ligand binding methods; Immunological testing involving lipids, e.g. cholesterol, lipoproteins, or their receptors
-
- G—PHYSICS
- G01—MEASURING; TESTING
- G01N—INVESTIGATING OR ANALYSING MATERIALS BY DETERMINING THEIR CHEMICAL OR PHYSICAL PROPERTIES
- G01N33/00—Investigating or analysing materials by specific methods not covered by groups G01N1/00 - G01N31/00
- G01N33/48—Biological material, e.g. blood, urine; Haemocytometers
- G01N33/50—Chemical analysis of biological material, e.g. blood, urine; Testing involving biospecific ligand binding methods; Immunological testing
- G01N33/94—Chemical analysis of biological material, e.g. blood, urine; Testing involving biospecific ligand binding methods; Immunological testing involving narcotics or drugs or pharmaceuticals, neurotransmitters or associated receptors
- G01N33/9406—Neurotransmitters
- G01N33/9426—GABA, i.e. gamma-amino-butyrate
-
- G—PHYSICS
- G01—MEASURING; TESTING
- G01N—INVESTIGATING OR ANALYSING MATERIALS BY DETERMINING THEIR CHEMICAL OR PHYSICAL PROPERTIES
- G01N2800/00—Detection or diagnosis of diseases
- G01N2800/28—Neurological disorders
Landscapes
- Health & Medical Sciences (AREA)
- Life Sciences & Earth Sciences (AREA)
- Engineering & Computer Science (AREA)
- Molecular Biology (AREA)
- Biomedical Technology (AREA)
- Hematology (AREA)
- Chemical & Material Sciences (AREA)
- Urology & Nephrology (AREA)
- Immunology (AREA)
- Food Science & Technology (AREA)
- General Physics & Mathematics (AREA)
- Microbiology (AREA)
- Biotechnology (AREA)
- Pathology (AREA)
- Cell Biology (AREA)
- Medicinal Chemistry (AREA)
- Physics & Mathematics (AREA)
- Analytical Chemistry (AREA)
- Biochemistry (AREA)
- General Health & Medical Sciences (AREA)
- Bioinformatics & Cheminformatics (AREA)
- Pharmacology & Pharmacy (AREA)
- Neurology (AREA)
- Neurosurgery (AREA)
- Proteomics, Peptides & Aminoacids (AREA)
- Biophysics (AREA)
- Endocrinology (AREA)
- Other Investigation Or Analysis Of Materials By Electrical Means (AREA)
- Investigating Or Analysing Biological Materials (AREA)
- Measuring Or Testing Involving Enzymes Or Micro-Organisms (AREA)
- Peptides Or Proteins (AREA)
Description
発明の分野
本発明は、自閉症ならびに自閉症および自閉症圏障害の診断に関する。具体的には、本発明は自閉症および自閉症圏障害を有する個体、特に小児を同定するための方法およびバイオマーカーを提供する。さらに具体的には、本発明は、自閉症に罹った個体の脳組織により分泌されて生体液に入る代謝産物を同定するための方法であって、そのような代謝産物が約10ダルトンから約1500ダルトンまでの分子量を有する方法を提供する。本発明は、自閉症の個体に存在し、非自閉症の個体に見出されるレベルとは診断的に著しく異なる1つまたは複数のそのような代謝産物を含む複数の収集物またはスペクトルを提供する。本明細書に提供される1つまたは複数の識別的に(differentially)分泌される代謝産物の収集物は、自閉症について診断する代謝シグネチャを含む。さらに、自閉症に特異的なバイオマーカーが本明細書において同定される。
The present invention relates to autism and the diagnosis of autism and autism zone disorders. Specifically, the present invention provides methods and biomarkers for identifying individuals with autism and autism zone disorders, particularly children. More specifically, the present invention is a method for identifying a metabolite secreted by brain tissue of an individual suffering from autism and entering a biological fluid, wherein such metabolite is from about 10 daltons. A method is provided having a molecular weight of up to about 1500 daltons. The present invention provides multiple collections or spectra comprising one or more such metabolites that are present in autistic individuals and are diagnostically significantly different from the levels found in non-autistic individuals To do. The collection of one or more differentially secreted metabolites provided herein includes a metabolic signature that diagnoses for autism. In addition, biomarkers specific for autism are identified herein.
発明の背景
自閉症は、社会的相互行為、言語発達、反復運動および行動様式の変化に特徴付けられる神経障害である。その有病率は、1980年代より前の2,325出生中1から現在では驚くべき101出生中1にまで増加している(非特許文献1)。自閉症は、厳密な遺伝的または決定論的病因に従わない極めて複雑な神経障害である(非特許文献2;非特許文献3;非特許文献4)。したがって、自閉症の発病における代謝の役割を定義することは前記障害の理解を発展させ前記疾患の正確な診断および患者管理を提供するのに重要であるが、これは、厳密に遺伝的原因は自閉症患者のほぼ10%しか占めていないからである。セロトニントランスポーター遺伝子(5HTT)、GABA受容体βサブユニット(GABRB3)、ユビキチンリガーゼ3(UBE3A)、ウィングレス型MMTV組込み部位ファミリーメンバー2(WNT2)、およびリーリン(RELN)などの複数の候補感受性遺伝子が同定されている(非特許文献5;非特許文献6;非特許文献7)。変異および患者症状の根底にある遺伝的多様性にもかかわらず(非特許文献8;非特許文献9;非特許文献10)、症例全体で集束性代謝性機能障害があるように思われる(非特許文献11;非特許文献12;非特許文献9)。代謝および代謝性変化は、神経発生および自閉症発病中に重大な役割を果たすことがある(非特許文献13)。したがって、自閉症脳と非自閉症脳間の網羅的な生化学的差異を調べる比較研究により、自閉症発病および進行の一因となる特定の代謝経路を同定することが可能である(非特許文献9;非特許文献14)。
BACKGROUND OF THE INVENTION Autism is a neurological disorder characterized by social interaction, language development, repetitive movements and behavioral changes. The prevalence has increased from 1 out of 2,325 births before the 1980s to 1 out of 101 surprising births (Non-Patent Document 1). Autism is a very complex neurological disorder that does not follow strict genetic or deterministic etiology (Non-Patent
発明の概要
本発明は、自閉症患者において識別的に産生される複数の代謝化合物を同定するための試薬および方法、ならびに自閉症または自閉症圏障害の診断を提供するための1つまたは複数のそのような同定された代謝化合物を使用するための方法を提供する。患者の組織または生体液、特に脳脊髄液などの脳関連生体液において識別的に分泌される前記代謝産物は、本明細書に記載される方法を使用して見出される。これらの代謝産物は、非自閉症個体と比べた場合自閉症個体のほうが多い量でまたは少ない量で見出される。さらに、本発明は、自閉症個体、特に小児から生体液において識別的に検出される代謝産物を含むバイオマーカーを、個別にまたは複数の前記バイオマーカーのスペクトルの収集物で提供する。前記収集物またはスペクトルは、自閉症を診断するための本発明の方法の実行に有用である。
SUMMARY OF THE INVENTION The present invention provides reagents and methods for identifying a plurality of metabolic compounds that are differentially produced in an autistic patient, and one for providing a diagnosis of autism or an autistic sphere disorder. Alternatively, a method for using a plurality of such identified metabolic compounds is provided. Said metabolites that are differentially secreted in patient tissues or biological fluids, particularly brain related biological fluids such as cerebrospinal fluid, are found using the methods described herein. These metabolites are found in greater or lesser amounts in autistic individuals when compared to non-autistic individuals. Furthermore, the present invention provides biomarkers comprising metabolites that are differentially detected in biological fluids from autistic individuals, particularly children, individually or in a collection of spectra of said biomarkers. Said collection or spectrum is useful for carrying out the method of the invention for diagnosing autism.
本明細書に記載されるように、自閉症を含む複数の神経発生障害は、一般の代謝経路における変化を生じることがある。対照に対して自閉症試料に存在する代謝産物(たとえば、約10ダルトンから約1500ダルトンまでの小分子)は変動する相対レベルで検出することが可能であり、これにより患部組織にも健康な組織にも存在する化合物の生化学的スペクトルに関する情報が提供されることは当業者により理解されるであろう。そのようなスペクトルは、合わせると自閉症の特異的な指標として働くことができる変化を有する代謝産物の組合せを含む「生化学的指紋」を提供する。本明細書に示されるように、グルタメート、システイン、メチオニン、およびγアミノ酪酸(GABA)代謝に関与する代謝産物を含むある種の代謝産物は、自閉症の小脳発病に相乗的役割を果たすことができる。さらに、注釈なしのまたは未報告の代謝産物が、自閉症脳において統計的に有意な形態で存在することが見出され、自閉症および自閉症圏障害の有用な候補バイオマーカーも提供する。本明細書において同定される代謝産物は、前記障害の診断バイオマーカーとして有用である、自閉症の感度が良く特有の生化学的シグネチャを提供する。 As described herein, multiple neurogenesis disorders, including autism, can result in changes in common metabolic pathways. Metabolites present in autistic samples relative to controls (eg, small molecules from about 10 daltons to about 1500 daltons) can be detected at varying relative levels, which is also healthy for affected tissues. It will be appreciated by those skilled in the art that information regarding the biochemical spectrum of a compound that is also present in tissue is provided. Such a spectrum provides a “biochemical fingerprint” that includes a combination of metabolites with changes that together can serve as a specific indicator of autism. As shown herein, certain metabolites, including metabolites involved in glutamate, cysteine, methionine, and gamma aminobutyric acid (GABA) metabolism, play a synergistic role in cerebellar pathogenesis of autism Can do. In addition, unannotated or unreported metabolites have been found to be present in a statistically significant form in the autistic brain and also provide useful candidate biomarkers for autism and autism zone disorders To do. The metabolites identified herein provide a sensitive and unique biochemical signature of autism that is useful as a diagnostic biomarker for the disorder.
自閉症および自閉症圏障害のこれらの代謝シグネチャについての本明細書での本開示は、死後自閉症脳に対しメタボロミクスを初めて適用し、自閉症個体と非自閉症個体間の代謝産物の指紋およびその変化を提供するものである。本明細書に提供される研究により、非自閉症対照と比べた場合、自閉症対象の脳において著しく変化する代謝産物が同定された。さらに、自閉症組織において一般的に変化する代謝産物のサブセットが同定された。下にさらに詳細に説明されているように、約10ダルトンから約1500ダルトンまでの分子量を有する識別的に分泌される代謝産物が、液体クロマトグラフィーエレクトロスプレー−イオン化飛行時間型質量分析(LC−ESI−TOF−MS)および/または親水性相互作用クロマトグラフィー(HILIC)により同定されたが、熟練した研究者であれば、これらの方法が非限定的であり、自閉症患者由来の生体液において代謝産物を検出するための他の方法を本発明の方法の実行において利用することが可能であることを認識するであろう。しかし、熟練した研究者であれば、新鮮な凍結脳組織のメタボロミクス解析に適用される質量分析のこの様式は、高度に感度が良く(たとえば、3ppmの分解能)代謝産物を極めて低量で(たとえば、マイクロモルからピコモル濃度まで)検出することができることも認識するであろう。さらに、核磁気共鳴(NMR)などの、メタボロミクス方法を実行するための当技術分野で公知の他の分析化学プラットフォームは、質量分析ほど感度が良くなく、著しく高い濃度で代謝産物を検出するにはさらに大量の生体試料が必要となる(Glishら、2003年、Nat. Rev. Drug Discov.2巻:140〜150頁に概説されている)が、にもかかわらず、本発明は、適切な状況下でそのような方法および当技術分野で公知の他の方法を使用することをはっきりと描いている。 The disclosure herein about these metabolic signatures of autism and autism zone disorder is the first application of metabolomics to postmortem autistic brains, between autistic and non-autistic individuals. It provides the fingerprint of the metabolite and its changes. The studies provided herein have identified metabolites that significantly change in the brain of autistic subjects when compared to non-autistic controls. In addition, a subset of metabolites that are commonly altered in autistic tissues have been identified. As described in more detail below, a differentially secreted metabolite having a molecular weight of from about 10 daltons to about 1500 daltons can be detected by liquid chromatography electrospray-ionization time-of-flight mass spectrometry (LC-ESI). -TOF-MS) and / or hydrophilic interaction chromatography (HILIC), but if you are an experienced researcher, these methods are non-limiting and in biological fluids from autistic patients It will be appreciated that other methods for detecting metabolites can be utilized in the practice of the methods of the invention. However, for experienced researchers, this mode of mass spectrometry applied to the metabolomic analysis of fresh frozen brain tissue is highly sensitive (eg, 3 ppm resolution) with very low amounts of metabolites (eg, It will also be appreciated that it can be detected (from micromolar to picomolar concentrations). In addition, other analytical chemistry platforms known in the art for performing metabolomic methods, such as nuclear magnetic resonance (NMR), are not as sensitive as mass spectrometry and are capable of detecting metabolites at significantly higher concentrations. Despite the need for larger biological samples (reviewed in Glish et al., 2003, Nat. Rev. Drug Discov. 2: 140-150), the present invention is nevertheless suitable Below is clearly depicted the use of such methods and other methods known in the art.
本発明の特定の実施形態は、以下のある種の好ましい実施形態のより詳細な説明および特許請求の範囲から明らかになる。
特定の実施形態では、例えば以下が提供される:
(項目1)
ヒトにおける自閉症に特徴的なメタボロミクスシグネチャを同定するための方法であって、
a.約10ダルトンから約1500ダルトンまでの分子量を有する1つまたは複数の細胞代謝産物について自閉症患者から単離された生体試料をアッセイするステップと、
b.約10ダルトンから約1500ダルトンまでの分子量を有する1つまたは複数の細胞代謝産物について非自閉症患者から単離された生体試料をアッセイするステップであって、ステップaおよびbが、該生体試料中に存在する細胞代謝産物の集団のメンバーを分離すること、および約10から約1500ダルトンまでの分子量を有する1つまたは複数の識別的に産生された細胞代謝産物を検出することをさらに含む、ステップと、
c.自閉症患者において識別的に産生される、約10ダルトンから約1500ダルトンまでの分子量を有する1つまたは複数の代謝産物を選択するステップであって、該1つまたは複数の識別的に産生された代謝産物が自閉症についてのメタボロミクスシグネチャを含む、ステップと
を含む方法。
(項目2)
前記細胞代謝産物が物理的分離法を使用してアッセイされる、項目1に記載の方法。
(項目3)
前記物理的分離法が液体クロマトグラフィーエレクトロスプレー−イオン化飛行時間型質量分析法である、項目2に記載の方法。
(項目4)
1つまたは複数の前記細胞代謝産物について化学的特定名を決定するステップをさらに含む、項目1に記載の方法。
(項目5)
1つまたは複数の前記細胞代謝産物の前記化学的特定名が、前記代謝産物の分子精密質量または前記代謝産物の質量分析断片化パターンを使用して決定される、項目4に記載の方法。
(項目6)
前記生体試料が脳脊髄液、脳組織、羊水、または血漿である、項目1に記載の方法。
(項目7)
前記細胞代謝産物が、セロトニン、システイン、メチオニン、グルタメート、ホモシステイン、トリプトファン、またはγアミノ酪酸(GABA)についての細胞代謝経路由来の化合物を含む、項目1に記載の方法。
(項目8)
前記細胞代謝産物が、N−アセチルアスパルチルグルタミン酸、L−シスタチオニン、2−アミノオクタン酸、5−ヒドロキシリジン、ビニルアセチルグリシン、プロリンベタイン、カフェイン、3−カルボキシ−1−ヒドロキシプロピルチアミンジホスフェート、3’−シアリルラクトサミン、3,4−ジヒドロキシベンジルアミン、ジパルミトイル−ホスファチジルコリン、またはSAICAR((S)−2−[5−アミノ−1−(5−ホスホ−D−リボシル)イミダゾール−4−カルボキサミド]サクシネート)である、項目1に記載の方法。
(項目9)
項目1に記載の方法に従って作製される自閉症についてのメタボロミクスシグネチャ。
(項目10)
前記細胞代謝産物が、N−アセチルアスパルチルグルタミン酸、L−シスタチオニン、2−アミノオクタン酸、5−ヒドロキシリジン、ビニルアセチルグリシン、プロリンベタイン、カフェイン、3−カルボキシ−1−ヒドロキシプロピルチアミンジホスフェート、3’−シアリルラクトサミン、3,4−ジヒドロキシベンジルアミン、ジパルミトイル−ホスファチジルコリン、またはSAICAR((S)−2−[5−アミノ−1−(5−ホスホ−D−リボシル)イミダゾール−4−カルボキサミド]サクシネート)である、項目9に記載のメタボロミクスシグネチャ。
(項目11)
ヒト試験対象における自閉症を診断するための方法であって、
a.約10ダルトンから約1500ダルトンまでの分子量を有する1つまたは複数の細胞代謝産物についてその個体由来の患者試料をアッセイするステップと、
b.患者試料において対照と比べて識別的に産生される、自閉症についてのメタボロミクスシグネチャを含む1つまたは複数の細胞代謝産物を検出するステップと
を含む方法。
(項目12)
前記細胞代謝産物が物理的分離法を使用してアッセイされる、項目11に記載の方法。
(項目13)
前記物理的分離法が液体クロマトグラフィーエレクトロスプレー−イオン化飛行時間型質量分析である、項目12に記載の方法。
(項目14)
前記患者試料が脳脊髄液、脳組織、または血漿である、項目11に記載の方法。
(項目15)
前記細胞代謝産物が、セロトニン、システイン、メチオニン、ホモシステイン、トリプトファン、グルタメート、またはGABAについての細胞代謝経路由来の化合物を含む、項目11に記載の方法。
(項目16)
前記細胞代謝産物が、N−アセチルアスパルチルグルタミン酸、L−シスタチオニン、2−アミノオクタン酸、5−ヒドロキシリジン、ビニルアセチルグリシン、プロリンベタイン、カフェイン、3−カルボキシ−1−ヒドロキシプロピルチアミンジホスフェート、3’−シアリルラクトサミン、3,4−ジヒドロキシベンジルアミン、ジパルミトイル−ホスファチジルコリン、またはSAICAR((S)−2−[5−アミノ−1−(5−ホスホ−D−リボシル)イミダゾール−4−カルボキサミド]サクシネート)である、項目11に記載の方法。
(項目17)
子宮内のヒト胎児における自閉症を診断するための方法であって、
a.メタボロミクスシグネチャを含む1つまたは複数の細胞代謝産物について胎児試料をアッセイするステップと、
b.自閉症に罹った胎児を診断するステップであって、該試料が、自閉症メタボロミクスシグネチャを含む1つまたは複数の該細胞代謝産物を識別的に産生するステップと
を含む、方法。
(項目18)
前記メタボロミクスシグネチャが、セロトニン、システイン、メチオニン、ホモシステイン、トリプトファン、グルタメート、またはGABAの代謝経路由来の1つまたは複数の細胞代謝産物を含む、項目17に記載の方法。
(項目19)
前記代謝シグネチャが、N−アセチルアスパルチルグルタミン酸、L−シスタチオニン、2−アミノオクタン酸、5−ヒドロキシリジン、ビニルアセチルグリシン、プロリンベタイン、カフェイン、3−カルボキシ−1−ヒドロキシプロピルチアミンジホスフェート、3’−シアリルラクトサミン、3,4−ジヒドロキシベンジルアミン、ジパルミトイル−ホスファチジルコリン、またはSAICAR((S)−2−[5−アミノ−1−(5−ホスホ−D−リボシル)イミダゾール−4−カルボキサミド]サクシネート)のうちの1つまたは複数を含む、項目17に記載の方法。
(項目20)
自閉症についての代謝シグネチャであって、該自閉症代謝シグネチャが、自閉症において識別的に産生される、約10から約1500ダルトンまでの分子量を有する1つまたは複数の細胞代謝産物を含み、該複数の細胞代謝産物が、セロトニン、システイン、メチオニン、ホモシステイン、トリプトファン、グルタメート、またはGABAの代謝経路由来の代謝産物を含む、代謝シグネチャ。
(項目21)
N−アセチルアスパルチルグルタミン酸、L−シスタチオニン、2−アミノオクタン酸、5−ヒドロキシリジン、ビニルアセチルグリシン、プロリンベタイン、カフェイン、3−カルボキシ−1−ヒドロキシプロピルチアミンジホスフェート、3’−シアリルラクトサミン、3,4−ジヒドロキシベンジルアミン、ジパルミトイル−ホスファチジルコリン、またはSAICAR((S)−2−[5−アミノ−1−(5−ホスホ−D−リボシル)イミダゾール−4−カルボキサミド]サクシネート)のうちの1つまたは複数を含む、項目20に記載の代謝シグネチャ。
(項目22)
自閉症に罹っているヒトを同定するための方法であって、
ヒト患者から単離された生体試料を、該生体試料から細胞代謝産物の集団のメンバーを分離することにより、約10ダルトンから約1500ダルトンまでの分子量を有する1つまたは複数の細胞代謝産物についてアッセイするステップ
を含み、自閉症患者において識別的に産生される、約10ダルトンから約1500ダルトンまでの分子量を有する該1つまたは複数の代謝産物の検出により、該ヒトが自閉症に罹っていると同定される、方法。
Particular embodiments of the present invention will become apparent from the following more detailed description of certain preferred embodiments and from the claims.
In certain embodiments, for example, the following are provided:
(Item 1)
A method for identifying a metabolomic signature characteristic of autism in humans, comprising:
a. Assaying a biological sample isolated from an autistic patient for one or more cellular metabolites having a molecular weight of from about 10 daltons to about 1500 daltons;
b. Assaying a biological sample isolated from an autistic patient for one or more cellular metabolites having a molecular weight of from about 10 daltons to about 1500 daltons, wherein steps a and b include the biological sample Isolating members of a population of cellular metabolites present therein, and detecting one or more differentially produced cellular metabolites having a molecular weight of from about 10 to about 1500 daltons. Steps,
c. Selecting one or more metabolites having a molecular weight of from about 10 daltons to about 1500 daltons that are differentially produced in an autistic patient, the one or more differentially produced A metabolite containing a metabolomics signature for autism, and
Including methods.
(Item 2)
The method of
(Item 3)
Item 3. The method according to
(Item 4)
2. The method of
(Item 5)
5. The method of item 4, wherein the chemical specific name of one or more of the cellular metabolites is determined using a molecular exact mass of the metabolite or a mass spectrometric fragmentation pattern of the metabolite.
(Item 6)
(Item 7)
2. The method of
(Item 8)
The cell metabolite is N-acetylaspartylglutamic acid, L-cystathionine, 2-aminooctanoic acid, 5-hydroxylysine, vinylacetylglycine, proline betaine, caffeine, 3-carboxy-1-hydroxypropylthiamin diphosphate, 3'-sialyllactosamine, 3,4-dihydroxybenzylamine, dipalmitoyl-phosphatidylcholine, or SAICAR ((S) -2- [5-amino-1- (5-phospho-D-ribosyl) imidazole-4-carboxamide ] The method of
(Item 9)
A metabolomics signature for autism produced according to the method of
(Item 10)
The cell metabolite is N-acetylaspartylglutamic acid, L-cystathionine, 2-aminooctanoic acid, 5-hydroxylysine, vinylacetylglycine, proline betaine, caffeine, 3-carboxy-1-hydroxypropylthiamin diphosphate, 3'-sialyllactosamine, 3,4-dihydroxybenzylamine, dipalmitoyl-phosphatidylcholine, or SAICAR ((S) -2- [5-amino-1- (5-phospho-D-ribosyl) imidazole-4-carboxamide ] The metabolomics signature of
(Item 11)
A method for diagnosing autism in a human test subject comprising:
a. Assaying a patient sample from the individual for one or more cellular metabolites having a molecular weight of from about 10 daltons to about 1500 daltons;
b. Detecting one or more cellular metabolites comprising a metabolomic signature for autism produced differentially in a patient sample relative to a control;
Including methods.
(Item 12)
12. A method according to item 11, wherein the cellular metabolites are assayed using physical separation methods.
(Item 13)
(Item 14)
(Item 15)
12. The method of item 11, wherein the cellular metabolite comprises a compound derived from a cellular metabolic pathway for serotonin, cysteine, methionine, homocysteine, tryptophan, glutamate, or GABA.
(Item 16)
The cell metabolite is N-acetylaspartylglutamic acid, L-cystathionine, 2-aminooctanoic acid, 5-hydroxylysine, vinylacetylglycine, proline betaine, caffeine, 3-carboxy-1-hydroxypropylthiamin diphosphate, 3'-sialyllactosamine, 3,4-dihydroxybenzylamine, dipalmitoyl-phosphatidylcholine, or SAICAR ((S) -2- [5-amino-1- (5-phospho-D-ribosyl) imidazole-4-carboxamide ] The method according to item 11, wherein the succinate is).
(Item 17)
A method for diagnosing autism in a human fetus in a uterus, comprising:
a. Assaying the fetal sample for one or more cellular metabolites comprising a metabolomic signature;
b. Diagnosing a fetus suffering from autism, wherein the sample differentially produces one or more of the cellular metabolites comprising an autism metabolomics signature;
Including a method.
(Item 18)
18. The method of item 17, wherein the metabolomics signature comprises one or more cellular metabolites from serotonin, cysteine, methionine, homocysteine, tryptophan, glutamate, or GABA metabolic pathways.
(Item 19)
The metabolic signature is N-acetylaspartylglutamic acid, L-cystathionine, 2-aminooctanoic acid, 5-hydroxylysine, vinylacetylglycine, proline betaine, caffeine, 3-carboxy-1-hydroxypropylthiamin diphosphate, 3 '-Sialyllactosamine, 3,4-dihydroxybenzylamine, dipalmitoyl-phosphatidylcholine, or SAICAR ((S) -2- [5-amino-1- (5-phospho-D-ribosyl) imidazole-4-carboxamide] 18. The method of item 17, comprising one or more of (succinate).
(Item 20)
A metabolic signature for autism, wherein the autism metabolic signature is one or more cellular metabolites having a molecular weight of about 10 to about 1500 Daltons that are produced differentially in autism. A metabolic signature comprising, wherein the plurality of cellular metabolites includes a metabolite from a serotonin, cysteine, methionine, homocysteine, tryptophan, glutamate, or GABA metabolic pathway.
(Item 21)
N-acetylaspartylglutamic acid, L-cystathionine, 2-aminooctanoic acid, 5-hydroxylysine, vinylacetylglycine, proline betaine, caffeine, 3-carboxy-1-hydroxypropylthiamin diphosphate, 3'-sialyllactosamine , 3,4-dihydroxybenzylamine, dipalmitoyl-phosphatidylcholine, or SAICAR ((S) -2- [5-amino-1- (5-phospho-D-ribosyl) imidazole-4-carboxamide] succinate) 21. The metabolic signature of
(Item 22)
A method for identifying a person suffering from autism, comprising:
A biological sample isolated from a human patient is assayed for one or more cellular metabolites having a molecular weight of from about 10 daltons to about 1500 daltons by separating members of the population of cellular metabolites from the biological sample. Step to do
The human is suffering from autism by detection of the one or more metabolites having a molecular weight of from about 10 daltons to about 1500 daltons produced differentially in an autistic patient The method identified.
本発明のこれらのおよび他の目的および特長は、図面と併せて採用される以下の詳細な説明からさらによく理解されるであろう。 These and other objects and features of the invention will be better understood from the following detailed description taken in conjunction with the drawings.
好ましい実施形態の詳細な説明
本発明は下にさらに具体的に説明されており、その数多くの改変および変化が当業者には明らかになるので、本明細書に記載される実施例は説明的なものとしてのみ意図されている。本明細書の記載においておよびそれに続く特許請求の範囲全体において使用されているように、「1つ(「a」および「an」)」ならびに「その(「the」)」の意味は、文脈が他の方法で明確に指示していなければ、複数の参照物を含む。明細書において使用される用語は一般に、本発明の文脈内において、および各用語が使用される特定の文脈において、当技術分野でのその通常の意味を有する。一部の用語は、本発明の記載に関して実行者に追加の指示を与えるために下においてより具体的に定義されている。
Detailed Description of the Preferred Embodiments The invention is described in more detail below, and numerous modifications and variations thereof will become apparent to those skilled in the art, so the examples described herein are illustrative. It is intended only as a thing. As used in the description herein and throughout the claims that follow, the meaning of "one (" a "and" an ")" and "the"("the") is contextual Multiple references are included unless explicitly indicated otherwise. The terms used in the specification generally have their ordinary meanings in the art, within the context of this invention and in the specific context where each term is used. Some terms are more specifically defined below to give additional instructions to the practitioner regarding the description of the invention.
自閉症は、特にその病因およびその病因にとっての脳化学の任意の検出可能な変化の意味に関して、依然として十分に理解されていない疾患である。脳化学の多数の変化が自閉症脳(すべて死後脳)において検出されてきたが、そのような変化が前記疾患の発生もしくは進行と基本的に関連しているのかどうかまたはその結果として生じるのかどうかについて一貫して理解されてはいない。一方、本明細書に提供されるメタボロミクスシグネチャ(metabolomic signature)は、調査された自閉症脳における一貫した違いを反映しており、前記疾患に一貫して関連している特定の代謝経路を同定している。 Autism is a disease that is still not fully understood, especially with regard to its etiology and the meaning of any detectable change in brain chemistry for that etiology. Numerous changes in brain chemistry have been detected in the autistic brain (all postmortem brains), but whether such changes are fundamentally related to, or result from, the development or progression of the disease There is no consistent understanding. On the other hand, the metabolomic signature provided herein reflects a consistent difference in the investigated autistic brain and identifies specific metabolic pathways that are consistently associated with the disease doing.
メタボロームは、細胞またはその周囲のマトリックスに存在する細胞代謝産物の全動的セットとして定義されるが、健康または疾患/傷害状態の産物である。メタボロミクスは、ゲノミクスおよびプロテオミクスなどの他の「オミック(omic)」研究領域と比べて特に環境効果に影響されやすい。細胞代謝産物には、糖、有機酸、アミノ酸および脂肪酸、特に、細胞から分泌される、排泄されるまたは他の方法で放出され(たとえば、とりわけ化学的もしくは物理的外傷の結果として)、病理学的または化学的傷害に対する細胞応答の機能的機序に関与する化学種が含まれるが、これらに限定されない。そのような細胞代謝産物は、正しく評価されたら、疾病または毒性応答のバイオマーカーとしての働きをすることが可能であり、生物体液中で検出することができる(Sogaら、2006年、J Biol Chem 281巻:16768〜78頁;Zhaoら、2006年、Birth Defects Res A Clin Mol Teratol 76巻:230〜6頁)。「オミクス(omics)」科学内では、メタボロミクスは、代謝の最終産物を測定するために、他の「オミクス(omics)」と比べて表現型にもっとも近いプラットフォームであると想定されている(Dettmerら、2007年、Mass Spectrom. Rev.26巻:51〜78頁)。 A metabolome is defined as the total dynamic set of cellular metabolites present in a cell or surrounding matrix, but is a product of a health or disease / injury state. Metabolomics is particularly susceptible to environmental effects compared to other “omic” research areas such as genomics and proteomics. Cellular metabolites include sugars, organic acids, amino acids and fatty acids, especially secreted, excreted or otherwise released from the cell (eg, especially as a result of chemical or physical trauma) and pathology Including, but not limited to, chemical species involved in the functional mechanism of cellular responses to chemical or chemical injury. Such cellular metabolites, when properly evaluated, can serve as biomarkers of disease or toxic response and can be detected in biological fluids (Soga et al., 2006, J Biol Chem 281: 16768-78; Zhao et al., 2006, Birth Defects Res A Clin Mol Teratol 76: 230-6). Within “omics” science, metabolomics is assumed to be the closest platform to phenotype compared to other “omics” to measure end products of metabolism (Dettmer et al. 2007, Mass Spectrom. Rev. 26: 51-78).
自閉症患者生体液により識別的に産生されるメタボロミクスシグネチャ(すなわち、細胞代謝産物の集団)は、自閉症を検出するための信頼できる診断マーカーを提供する。本発明のある種の態様は、たとえば、液体クロマトグラフィーエレクトロスプレー−イオン化飛行時間型質量分析(ESI−TOF)を含むがこれに限定されない、物理的分離法を使用する細胞代謝産物のアッセイを提供する。代謝産物は、その精密な分子質量、ならびに代謝産物の質量分析断片化パターンを使用して同定することが可能である。自閉症患者により産生される細胞代謝産物を検出することにそのような方法を適用する感度により、代謝生化学よりはむしろ生理学的、発生的および行動的評価に焦点を合わせてきた当技術分野のそれほど頑強ではない方法と比べて自閉症障害の改良された同定が提供される。遺伝子転写の変化すべてが表現型と相関しているわけではないという事実を考慮すると、メタボロミクス診断アプローチを使用することは、遺伝子特異的診断に対する自閉症表現型のより信頼できる指標となる。 Metabolomic signatures (ie, populations of cellular metabolites) that are produced differentially by autistic patient biological fluids provide a reliable diagnostic marker for detecting autism. Certain aspects of the invention provide cellular metabolite assays using physical separation methods including, but not limited to, liquid chromatography electrospray-ionization time-of-flight mass spectrometry (ESI-TOF), for example. To do. A metabolite can be identified using its precise molecular mass, as well as the mass spectrometric fragmentation pattern of the metabolite. The art has focused on physiological, developmental and behavioral assessment rather than metabolic biochemistry due to the sensitivity of applying such methods to detecting cellular metabolites produced by patients with autism An improved identification of autistic disorders is provided compared to that less robust method. Considering the fact that not all gene transcription changes are correlated with phenotype, using a metabolomic diagnostic approach is a more reliable indicator of an autistic phenotype for gene-specific diagnosis.
本発明の追加の実施形態には、自閉症に特有のメタボロミクスシグネチャが含まれる。一実施形態では、1つまたは複数の細胞代謝産物を含む代謝シグネチャが、および特定の実施形態では、セロトニン、システイン、トリプトファン、メチオニン、グルタメートまたはGABA代謝経路の1つまたは複数の細胞代謝産物が本明細書において提供される。ある種の実施形態では、本明細書に記載されるメタボロミクスシグネチャを含む代謝産物は、N−アセチルアスパルチルグルタミン酸、L−シスタチオニン、2−アミノオクタン酸、5−ヒドロキシリジン、ビニルアセチルグリシン、プロリンベタイン、カフェイン、3−カルボキシ−1−ヒドロキシプロピルチアミン二リン酸、3’−シアリルラクトサミン、3,4−ジヒドロキシベンジルアミン、ジパルミトイル−ホスファチジルコリン、SAICAR((S)−2−[5−アミノ−1−(5−ホスホ−D−リボシル)イミダゾール−4−カルボキサミド]サクシネート)、グルタメート、またはGABA中間体(たとえば、L−グルタミン、L−グルタメート、αケトグルタレート(ketogluratate)、コハク酸セミアルデヒド、4−アミノブチルアルデヒド、4−グアニジノブタノエート、もしくはL−オルニチンなど、GABAの同化または異化に関与する代謝産物)のうちの1つまたは複数を含む。 Additional embodiments of the invention include a metabolomic signature specific to autism. In one embodiment, a metabolic signature comprising one or more cellular metabolites is present, and in certain embodiments, one or more cellular metabolites of a serotonin, cysteine, tryptophan, methionine, glutamate or GABA metabolic pathway are present. Provided in the specification. In certain embodiments, a metabolite comprising a metabolomics signature described herein is N-acetylaspartylglutamic acid, L-cystathionine, 2-aminooctanoic acid, 5-hydroxylysine, vinylacetylglycine, proline betaine , Caffeine, 3-carboxy-1-hydroxypropylthiamine diphosphate, 3′-sialyllactosamine, 3,4-dihydroxybenzylamine, dipalmitoyl-phosphatidylcholine, SAICAR ((S) -2- [5-amino- 1- (5-phospho-D-ribosyl) imidazole-4-carboxamide] succinate), glutamate, or GABA intermediates (eg, L-glutamine, L-glutamate, alpha ketoglutarate, succinic semialdehyde, 4-amino Including Chill aldehyde, 4-guanidino butanoate, or the like L- ornithine, one or more of the metabolites) involved in the assimilation or catabolism of GABA.
自閉症を診断するための方法を含む、自閉症の細胞効果および特に生化学的効果を同定し測定するための方法および試薬が提供される。本明細書で使用される用語「代謝産物」、「細胞代謝産物」または複数形の「細胞代謝産物」とは、細胞により分泌され、組織試料または生体液中に存在する約10ダルトンから約1500ダルトンまでの範囲の任意の分子または質量フィーチャーのことである。細胞代謝産物は、以下の種類の分子:酸、塩基、脂質、糖、グリコシド、アミン、有機酸、脂質、アミノ酸、オキシム、エステル、ジペプチド、トリペプチド、脂肪酸、コレステロール、オキシステロール、グリセロール、ステロイド、および/またはホルモンを含むことができるが、これらに限定されない。一実施形態では、細胞代謝産物は、N−アセチルアスパルチルグルタミン酸、L−シスタチオニン、2−アミノオクタン酸、5−ヒドロキシリジン、ビニルアセチルグリシン、プロリンベタイン、カフェイン、3−カルボキシ−1−ヒドロキシプロピルチアミン二リン酸、3’−シアリルラクトサミン、3,4−ジヒドロキシベンジルアミン、ジパルミトイル−ホスファチジルコリン、SAICAR((S)−2−[5−アミノ−1−(5−ホスホ−D−リボシル)イミダゾール−4−カルボキサミド]サクシネート)、グルタメート、またはGABA中間体を含むことができるが、これらに限定されない。 Methods and reagents for identifying and measuring autistic cellular effects and in particular biochemical effects are provided, including methods for diagnosing autism. As used herein, the term “metabolite”, “cell metabolite” or plural “cell metabolite” is secreted by a cell and is present in a tissue sample or biological fluid from about 10 Daltons to about 1500. Any molecular or mass feature ranging up to daltons. Cell metabolites are the following types of molecules: acids, bases, lipids, sugars, glycosides, amines, organic acids, lipids, amino acids, oximes, esters, dipeptides, tripeptides, fatty acids, cholesterol, oxysterols, glycerol, steroids, And / or can include, but are not limited to, hormones. In one embodiment, the cellular metabolite is N-acetylaspartylglutamic acid, L-cystathionine, 2-aminooctanoic acid, 5-hydroxylysine, vinylacetylglycine, proline betaine, caffeine, 3-carboxy-1-hydroxypropyl Thiamine diphosphate, 3'-sialyllactosamine, 3,4-dihydroxybenzylamine, dipalmitoyl-phosphatidylcholine, SAICAR ((S) -2- [5-amino-1- (5-phospho-D-ribosyl) imidazole -4-carboxamide] succinate), glutamate, or GABA intermediates, but is not limited to these.
本明細書で使用される語句「識別的に産生される...1つまたは複数の細胞代謝産物を同定する」および「識別的に産生する」は、自閉症ヒト由来の細胞または組織と非自閉症ヒト由来の細胞または組織との比較を含むが、これに限定されない。自閉症と非自閉症対照試料間の代謝産物集団または質量フィーチャーの変動の検出または測定は、この定義に含まれる。好ましい実施形態では、様々な代謝産物の産生の変化は、対照試料に対する自閉症試料における代謝産物分子の変化のプロファイルを決定することにより測定される。 As used herein, the phrases “distinguishably produced ... identify one or more cellular metabolites” and “discriminately produce” refer to cells or tissues derived from autistic humans. This includes, but is not limited to, comparison with cells or tissues from non-autistic humans. Detection or measurement of changes in metabolite populations or mass features between autistic and non-autistic control samples is included in this definition. In a preferred embodiment, changes in the production of various metabolites are measured by determining a profile of changes in metabolite molecules in an autism sample relative to a control sample.
本明細書で使用される用語「物理的分離法」とは、本発明の方法に従って自閉症ヒトの組織または生体液(たとえば、外側半球、および後小脳虫部脳、脳脊髄液、血液、または血漿)において産生される代謝産物の変化および差異のプロファイルを検出するのに十分な、当業者に公知の任意の方法のことである。好ましい実施形態では、物理的分離法は、糖、有機酸、アミノ酸、脂肪酸、ホルモン、ビタミン、およびペプチド、ならびにそのイオン断片および他の細胞代謝産物(好ましくは、3000ダルトン未満、さらに具体的には10から1500ダルトンまで、さらに具体的には100から1000ダルトンまでの分子量を有する)を含むが、これらに限定されない細胞代謝産物の検出を可能にする。ある種の実施形態では、物理的分離法は、液体クロマトグラフィー/エレクトロスプレー−イオン化飛行時間型質量分析(LC/ESI−TOF−MS)および/または親水性相互作用クロマトグラフィー(HILIC)であるが、本明細書に記載される細胞代謝産物は、代替の分光測定法またはこのサイズ範囲のこれらの種類の細胞化合物を分析するための当技術分野で公知の他の方法を使用して検出することが可能であることは理解されるであろう。 As used herein, the term “physical separation method” refers to an autistic human tissue or biological fluid (eg, outer hemisphere, and posterior cerebellar cerebrum, cerebrospinal fluid, blood, Or any method known to those skilled in the art that is sufficient to detect a profile of changes and differences in metabolites produced in plasma. In preferred embodiments, physical separation methods include sugars, organic acids, amino acids, fatty acids, hormones, vitamins, and peptides, and ionic fragments and other cellular metabolites thereof (preferably less than 3000 Daltons, more specifically Enabling detection of cellular metabolites including, but not limited to, having a molecular weight of 10 to 1500 daltons, and more specifically 100 to 1000 daltons). In certain embodiments, the physical separation method is liquid chromatography / electrospray-ionization time-of-flight mass spectrometry (LC / ESI-TOF-MS) and / or hydrophilic interaction chromatography (HILIC). The cellular metabolites described herein can be detected using alternative spectroscopic methods or other methods known in the art for analyzing these types of cellular compounds in this size range It will be understood that is possible.
統計解析のためのデータは、Agilent Mass Hunterソフトウェア(製品番号G3297AA、Agilent Technologies,Inc.Santa Clara、CA)などの統計解析パッケージを使用してクロマトグラム(すなわち、質量シグナルのスペクトル)から抽出することができるが、代わりに代替の統計解析法を使用することができることは理解されるであろう。質量は、それが10ppm内であり2分の保持時間枠内で溶出されたら、一緒にビニングするのが都合がよい。ビニングされた質量(本明細書では「精密質量」と呼ばれる)は、検出された質量が±10ppm内であれば、異なるLC/ESI−TOF−MS解析にわたり同一分子と見なすことが可能である。データのビニングは、統計解析および実験全体の質量比較のために必要である。たとえば、Mass Hunterにより1個の試料内の同一保持時間で同一質量を有する複数のピークが検出された場合は、そのピークを平均化してデータ解析を支援することが可能である。天然の同位体分布を欠くまたは3未満のシグナル−ノイズ比を有する質量は、解析に先立ってデータから除かれる。これらのアッセイから得られる結果は、20ppm以内の注釈付きの値に従って評価される相対値を提供し、化学データベースに従って検出される分子量には推定同一性を与えた。したがって、20ppm内の質量変化は、イオン源および計測手段の差異(たとえば、異なる実験間または異なる計測手段を使用する)による当技術分野で公知の特定の注釈付き細胞代謝産物の同一性を決定することと一致すると見なされた。 Data for statistical analysis should be extracted from chromatograms (ie, mass signal spectra) using statistical analysis packages such as Agilent Mass Hunter software (Product Number G3297AA, Agilent Technologies, Inc. Santa Clara, CA). It will be appreciated that alternative statistical analysis methods can be used instead. The mass is conveniently binned together once it is within 10 ppm and eluted within a 2 minute hold time frame. Binned mass (referred to herein as “exact mass”) can be considered the same molecule across different LC / ESI-TOF-MS analyzes provided the detected mass is within ± 10 ppm. Data binning is necessary for statistical analysis and mass comparison of the entire experiment. For example, when Mass Hunter detects a plurality of peaks having the same mass within the same retention time in one sample, the peaks can be averaged to support data analysis. Masses that lack a natural isotope distribution or have a signal-to-noise ratio of less than 3 are removed from the data prior to analysis. The results obtained from these assays provided relative values that were evaluated according to annotated values within 20 ppm, and gave an estimated identity to the molecular weight detected according to the chemical database. Thus, mass changes within 20 ppm determine the identity of certain annotated cell metabolites known in the art due to differences in ion sources and instrumentation (eg, between different experiments or using different instrumentation). Was considered consistent with that.
本明細書で使用されるように、質量は、先ずデータを質量および保持時間により分類するアルゴリズムを使用して別々のLC/ESI−TOF−MS注入物にわたって同一であると見なすことができる。分類後、化合物は、それが3分未満または3分に等しい保持時間差および加重式(0.00002×質量)未満または加重式に等しい質量差を有する場合には唯一であると見なすことができる。異なる分離物由来の一連の測定値がこの定義に一致する場合には、前記測定値は同一化合物の分離から生じると見なされる。質量または保持時間のどちらかが上に挙げられる限度以上に変動することが見出される場合には、その質量は異なる化合物であると見なされ、それ独自の命名が与えられる。 As used herein, mass can be considered identical across different LC / ESI-TOF-MS injections using an algorithm that first sorts the data by mass and retention time. After classification, a compound can be considered unique if it has a retention time difference of less than or equal to 3 minutes and a mass difference of less than or equal to the weighted formula (0.00002 × mass). If a series of measurements from different isolates meets this definition, the measurement is considered to result from the separation of the same compound. If either mass or retention time is found to vary beyond the limits listed above, the mass is considered to be a different compound and is given its own name.
対数底2に基づくANOVAなどの有意性検定を使用して、各時点での非自閉症試料に対する自閉症試料に存在する特有の化合物の存在量値を変換することができる。診断、実験、および余剰項を含むANOVAモデルを使用する無作為完備型ブロック計画は、以下の式:
Log2(存在量tb)=診断t+セクションb+エラーtb
を使用して表現することができる。
Significance tests such as ANOVA based on
Log 2 (abundance tb ) = diagnosis t + section b + error tb
Can be used to express.
欠陥データは試験から除かれ、自由度を変える(欠陥データは非存在であったと仮定するのではない)。Mass Hunterソフトウェアにより実施される広範なフィルタリングは、ある種のピークをそれが一定存在量閾値より下でありゼロではないという理由で見逃すまたは濾過することがあるために、この仮定が設けられた。ANOVA F検定は、そのp値が0.05未満である場合には、有意であると見なされた。倍変化は、所与の時間および処置についての最小二乗平均を使用して計算された。 The defect data is removed from the test and the degree of freedom is changed (not assuming that the defect data was absent). This assumption was made because extensive filtering performed by Mass Hunter software may miss or filter certain peaks because they are below a certain abundance threshold and not zero. The ANOVA F test was considered significant if its p-value was less than 0.05. Fold change was calculated using the least mean square for a given time and treatment.
本明細書で使用される用語「代謝シグネチャ」および「バイオマーカープロファイル」とは、本発明の方法により同定される1つまたは複数の代謝産物のことである。本発明に従った代謝シグネチャおよびバイオマーカープロファイルは、自閉症圏障害の分子「指紋」を提供し、自閉症圏障害に罹っている個体において著しく変化した細胞代謝産物の1つまたは好ましくは集団を同定することができる。好ましい実施形態では、代謝シグネチャまたはバイオマーカープロファイルを使用して、個体における自閉症を診断することができる。 The terms “metabolic signature” and “biomarker profile” as used herein refer to one or more metabolites identified by the methods of the present invention. Metabolic signatures and biomarker profiles according to the present invention provide a molecular “fingerprint” of an autism zone disorder, preferably one or preferably one of the cellular metabolites that have been significantly altered in an individual suffering from an autism zone disorder A population can be identified. In preferred embodiments, metabolic signatures or biomarker profiles can be used to diagnose autism in an individual.
本明細書で使用される用語「バイオマーカー」とは、患部と対照の間で著しい変化を示す細胞代謝産物のことである。好ましい実施形態では、バイオマーカーは、LC/ESI−TOF−MSを含む方法により、上に記載される通りに同定される。メタボロミクスバイオマーカーは、その特有の分子質量および一貫性により同定され、したがって、バイオマーカーに一致する根底にある化合物の実際の同一性は本発明の実行のためには必要ではない。代わりに、ある種のバイオマーカーは、たとえば、リアルタイムPCR、RT−PCR、ノーザン解析、およびインサイツハイブリダイゼーションを含む遺伝子発現解析により同定することができるが、これらは、一般には本明細書に記載される用語「細胞代謝産物」の定義内には含まれない。 The term “biomarker” as used herein refers to a cellular metabolite that exhibits a significant change between the affected area and the control. In preferred embodiments, biomarkers are identified as described above by methods including LC / ESI-TOF-MS. A metabolomic biomarker is identified by its unique molecular mass and consistency, and thus the actual identity of the underlying compound consistent with the biomarker is not necessary for the practice of the invention. Alternatively, certain biomarkers can be identified by gene expression analysis including, for example, real-time PCR, RT-PCR, Northern analysis, and in situ hybridization, which are generally described herein. It is not included within the definition of the term “cell metabolite”.
本明細書に記載される代謝産物プロファイリングは、生きた患者から収集される試料とは対照的に死後組織で行われた。最終的に、インビボで発見されたバイオマーカーは、たとえば、脳脊髄液、血液、血漿、羊水および尿、すなわち細胞外生体分子の複雑な混合物を含む生体液などの試料を分析するのに有用であると予想される。本発明の方法は、生体液中の代謝産物は(細胞内化合物と対照的に)非侵襲的に検出することができるために、組織生検などの侵襲的手技よりも有利である。さらに、質量分析のために細胞上清を処理することは細胞抽出物よりも頑強であり面倒が少ない。しかし、たとえば、組織生検または溶解された細胞由来の細胞抽出物は本発明の方法に包含される。用語「試料」または「生体試料」または「患者試料」は、脳脊髄液、脳組織、羊水、血液、または血漿を含むが、これらに限定されない。 Metabolite profiling described herein was performed on post-mortem tissue as opposed to samples collected from living patients. Finally, biomarkers discovered in vivo are useful, for example, for analyzing samples such as cerebrospinal fluid, blood, plasma, amniotic fluid and urine, ie biological fluids that contain complex mixtures of extracellular biomolecules. Expected to be. The method of the present invention is advantageous over invasive procedures such as tissue biopsy because metabolites in biological fluids can be detected non-invasively (as opposed to intracellular compounds). Furthermore, processing cell supernatants for mass spectrometry is more robust and less cumbersome than cell extracts. However, for example, tissue extracts from cell biopsies or lysed cells are encompassed by the methods of the invention. The term “sample” or “biological sample” or “patient sample” includes, but is not limited to, cerebrospinal fluid, brain tissue, amniotic fluid, blood, or plasma.
生体液解析に先立つ、自閉症(脳)において主に冒される器官中の差次的代謝産物の同定は、新規の診断学の発展に向けての目標を定めたアプローチを提供する。限定された組の候補なしで、脳脊髄液、尿または血漿などの生体液中の自閉症に特異的なバイオマーカーを同定するのは特に困難であると考えられる。生体液は、内在性と外来性要因の両方(遺伝学、食餌、環境)により影響を受ける全身的副産物の複雑な混合物である。本発明の方法を使用すれば、特定の分析化学プロトコールを、特定の候補バイオマーカーの限定された精密質量および保持時間について生体液を評価するために使用することが可能である。 Identification of differential metabolites in organs primarily affected in autism (brain) prior to biological fluid analysis provides a targeted approach towards the development of new diagnostics. Without a limited set of candidates, it would be particularly difficult to identify biomarkers specific for autism in biological fluids such as cerebrospinal fluid, urine or plasma. Biological fluids are complex mixtures of systemic by-products that are affected by both endogenous and exogenous factors (genetics, diet, environment). Using the methods of the present invention, specific analytical chemistry protocols can be used to evaluate biological fluids for the limited exact mass and retention time of specific candidate biomarkers.
下の実施例においてより詳細に記載されるように、本明細書に記載される方法を使用する自閉症組織プログラム(Autism Tissue Program(ATP))からの15件の新鮮な凍結試料(6件の自閉症および9件の対照)の解析により、死後自閉症と非自閉症脳試料間の複数の代謝産物の存在量に統計的有意差が検出された。親水性相互作用クロマトグラフィー(HILIC)とそれに続いてポジティブモードESI−TOFイオン化を使用する予備実験では、自閉症と非自閉症脳間で識別的に産生された合計で98の代謝産物が同定された。たとえば、5−ヒドロキシリジン(精密質量162.0981)は有意な変化を示した(p<0.05)。C18クロマトグラフィーとそれに続いてポジティブモードESI−TOFイオン化を使用する並列予備実験では、47の統計的に有意な代謝産物を生じた(p<0.05)。これらの代謝産物の化学的特定名は、タンデム質量分析(MS−MS)により決定的に確証することが可能である。 As described in more detail in the examples below, 15 fresh frozen samples (6) from the Autism Tissue Program (ATP) using the methods described herein. Analysis of 9 autism and 9 controls) detected statistically significant differences in the abundance of multiple metabolites between postmortem autism and non-autistic brain samples. In a preliminary experiment using hydrophilic interaction chromatography (HILIC) followed by positive mode ESI-TOF ionization, a total of 98 metabolites produced differentially between autistic and non-autistic brains were obtained. Identified. For example, 5-hydroxylysine (exact mass 162.9881) showed a significant change (p <0.05). Parallel preliminary experiments using C18 chromatography followed by positive mode ESI-TOF ionization yielded 47 statistically significant metabolites (p <0.05). The chemical names of these metabolites can be definitively confirmed by tandem mass spectrometry (MS-MS).
新鮮な凍結死後脳由来の代謝産物は、最初、液体クロマトグラフィー(LC)により分離され、その後イオン化されて、エレクトロスプレー−イオン化飛行時間型質量分析(ESI−TOF−MS)により検出された。この質量分析の様式は、新鮮な凍結脳組織のメタボロミクスに特に適しているために選択された。すなわち、この様式は高度に感度が良く、小分子代謝産物を極めて低い存在量で検出し(たとえば、マイクロモルからピコモル濃度まで)、代謝産物の精密質量の高度に正確な測定値を3ppmの分解能で提供する。NMR(核磁気共鳴)などの、メタボロミクスに用いられる他の分析化学プラットフォームは、質量分析ほど感度が良くなく、代謝産物を著しくより高い濃度で検出するためにはさらに大量の生体試料を必要とする(Glishら、2003年、Nat. Rev. Drug Discov.2巻:140〜150頁に概説されている)。本明細書に記載されるように、死後脳試料のメタボロミクス解析により、自閉症と非自閉症脳間に複数の生化学的差異が明らかにされた。自閉症脳により識別的に分泌される細胞代謝産物の同定により、本明細書に特に記載されているように、自閉症を診断するためのバイオマーカーが提供される。 Metabolites from fresh frozen post-mortem brain were first separated by liquid chromatography (LC), then ionized and detected by electrospray-ionization time-of-flight mass spectrometry (ESI-TOF-MS). This mode of mass spectrometry was chosen because it is particularly suitable for metabolomics of fresh frozen brain tissue. That is, this mode is highly sensitive, detects small molecule metabolites in very low abundance (eg, from micromolar to picomolar concentrations), and provides a highly accurate measurement of the exact mass of the metabolite with a resolution of 3 ppm. Provide in. Other analytical chemistry platforms used for metabolomics, such as NMR (Nuclear Magnetic Resonance), are not as sensitive as mass spectrometry and require more biological samples to detect metabolites at significantly higher concentrations (Reviewed in Glish et al., 2003, Nat. Rev. Drug Discov. 2: 140-150). As described herein, metabolomic analysis of postmortem brain samples revealed multiple biochemical differences between autistic and non-autistic brains. Identification of cellular metabolites that are differentially secreted by the autistic brain provides a biomarker for diagnosing autism, as specifically described herein.
ある種の実施形態では、本発明は、自閉症のバイオマーカーとして単独で、集団として、または任意の情報価値のある組合せで採られる、以下の代謝産物:N−アセチルアスパルチルグルタミン酸、L−シスタチオニン、2−アミノオクタン酸、5−ヒドロキシリジン、ビニルアセチルグリシン、プロリンベタイン、カフェイン、3−カルボキシ−1−ヒドロキシプロピルチアミン二リン酸、3’−シアリルラクトサミン、3,4−ジヒドロキシベンジルアミン、ジパルミトイル−ホスファチジルコリン、SAICAR((S)−2−[5−アミノ−1−(5−ホスホ−D−リボシル)イミダゾール−4−カルボキサミド]サクシネート)、グルタメート、またはGABA中間体を提供する。 In certain embodiments, the invention is directed to the following metabolites taken as a biomarker of autism alone, as a population, or in any informative combination: N-acetylaspartyl glutamic acid, L- Cystathionine, 2-aminooctanoic acid, 5-hydroxylysine, vinylacetylglycine, proline betaine, caffeine, 3-carboxy-1-hydroxypropylthiamine diphosphate, 3'-sialyllactosamine, 3,4-dihydroxybenzylamine , Dipalmitoyl-phosphatidylcholine, SAICAR ((S) -2- [5-amino-1- (5-phospho-D-ribosyl) imidazole-4-carboxamide] succinate), glutamate, or GABA intermediate.
神経化学経路の異常は、自閉症の発病および/または臨床症状の潜在的基盤と仮定されてきた。セロトニン、キヌレニン、グルタメート、システイン、およびメチオニン代謝に対する攪乱が自閉症においてある役割を果たしている可能性があることが、様々な量の支持的な一般的事例証拠をもって推測されてきた。これとは対照的に、本明細書で提供される方法およびこれらの方法の実行に従って提供されるバイオマーカーは、1つまたは複数の前記バイオマーカーの検出を個体における自閉症または自閉症圏障害の存在と結び付けることに実験的な証拠に基づく基礎を提供する。 Abnormalities in neurochemical pathways have been postulated as a potential basis for the development of autism and / or clinical symptoms. It has been speculated with varying amounts of supporting general case evidence that perturbations to serotonin, kynurenine, glutamate, cysteine, and methionine metabolism may play a role in autism. In contrast, the methods provided herein and the biomarkers provided in accordance with the performance of these methods provide for detection of one or more of the biomarkers in an autism or autism zone in an individual. Provide a basis based on experimental evidence to connect with the presence of disability.
以下に続く実施例は本発明の特定の実施形態およびその様々な使用を説明するものである。これらの実施例は説明目的のためだけに記載されており、本発明を限定するものと解釈されるべきではない。 The following examples illustrate specific embodiments of the invention and their various uses. These examples are described for illustrative purposes only and should not be construed as limiting the invention.
(実施例1)
死後脳組織の調製
自閉症患者および同年齢の対照由来の死後脳組織は自閉症組織プログラム(ATP)から入手した。全部で、メリーランド大学の発達障害のための脳および組織バンク(the University of Maryland Brain and Tissue Bank for Developmental Disorders)からの6件の自閉症および9件の非自閉症死後脳試料が調査された(表1参照)。上記試料由来の外側半球および後小脳虫部の新鮮な凍結切片を用いてメタボロミクスは実施された。小脳は、それが自閉症患者においてもっとも一貫性のある異常な神経解剖学的所見が局在している領域であるために選択された(Kemperら、1998年、J. Neuropathol. Exp. Neurol.57巻:645〜652頁)。年齢、PMI(死後の間隔)および臨床症状の程度の違いは、メタボロミクスにより測定される代謝産物の存在量および性質の変動原因であると認められた。
Example 1
Postmortem Brain Tissue Preparation Postmortem brain tissue from autistic patients and age-matched controls was obtained from the Autism Tissue Program (ATP). In total, 6 autism and 9 non-autistic postmortem brain samples from the University of Maryland Brain and Tissue Bank for Development Disorders for Developmental Disorders (See Table 1). Metabolomics was performed using fresh frozen sections of the outer hemisphere and posterior cerebellar worms from the above samples. The cerebellum was chosen because it is the area where the most consistent and abnormal neuroanatomical findings are localized in autistic patients (Kemper et al., 1998, J. Neuropathol. Exp. Neurol .57: 645-652). Differences in age, PMI (post-mortem interval), and degree of clinical symptoms were found to be responsible for variations in the abundance and nature of metabolites as measured by metabolomics.
メタボロミクスに先立って、凍結脳検体は、30%ショ糖を使用するLeica SM200Rミクロトームの前冷却されたステージ上に載せられ、薄片にされて重量約50mgの均一な試料を作製した。代謝産物は、円錐形グラスホモジナイザーにおいて試料をホモジナイズすることにより湿組織重量比あたりの容積に基づいて80%メタノール/20% 0.5%ギ酸に抽出された。次に、試料は−20℃で30分間保管されて、タンパク質および不溶性物質を沈殿させた。その後、冷却インキュベーション試料は、16,000×g、4℃で25分間遠心分離され、細胞片、タンパク質、および他の不溶性物質をペレット状にした。次に、上清は新しいチューブに移され、300μlの抽出バッファーを用いて再抽出された。試料は、乾燥して抽出バッファーを取り除くまで6〜7時間回転式エバポレーターにおいて乾燥された。次に、抽出物は500μlの20%アセトニトリル/80% 0.1%ギ酸に溶解され、13,000×gで3時間Millipore 3kDa Microconカラム(Millipore)中で遠心分離されて、大きな分子量(>3kDa)の生体分子を取り除いた。フロースルーは回転式エバポレーターにおいて乾燥され、2μl/mgの95% 0.1%ギ酸/5%アセトニトリルに溶解され、LC−MSによる分析に先立って−80℃で保管された。
Prior to metabolomics, frozen brain specimens were placed on a pre-cooled stage of a Leica SM200R microtome using 30% sucrose and sliced to create a uniform sample weighing approximately 50 mg. Metabolites were extracted into 80% methanol / 20% 0.5% formic acid based on the volume per wet tissue weight ratio by homogenizing the sample in a conical glass homogenizer. The sample was then stored at -20 ° C for 30 minutes to precipitate proteins and insoluble material. The chilled incubation sample was then centrifuged at 16,000 × g for 25 minutes at 4 ° C. to pellet cell debris, proteins, and other insoluble materials. The supernatant was then transferred to a new tube and re-extracted with 300 μl extraction buffer. Samples were dried on a rotary evaporator for 6-7 hours until dried to remove the extraction buffer. The extract was then dissolved in 500
液体クロマトグラフィーエレクトロスプレー−イオン化飛行時間型質量分析(LC−ESI−TOF−MS)は、精密質量MSおよびMS/MSイオン断片化が可能なG6520AA QTOF高分解能質量分析計からなるAgilent QTOF LC/MSシステムを使用して、これらの抽出物で実施された。各試料の極性代謝産物画分は、最大分離および小分子分解能のために2つの異なるクロマトグラフィー法、すなわちa)3×100mm Phenomenex 3μm Luna親水性相互作用クロマトグラフィー(HILIC)およびb)2.1×50mm Zorbax 1.8μm C18−SBカラム(C18)を使用して解析された。このアプローチは、分離されそれに続いてイオン化され測定される代謝産物の数を最大にした。超高圧液体クロマトグラフィー(UPLC)解析は、5%アセトニトリル/95%水/0.1%ギ酸から100%アセトニトリル/0.1%ギ酸までの15分勾配を流速400μl/分で使用してZorbax C18カラムを用いて実施された。HILIC HPLC法は、95%アセトニトリル/5%水/0.1%ギ酸から60%アセトニトリル/40%水/0.1%ギ酸までの16分勾配を500μl/分の流速で使用して実施された。エレクトロスプレー−イオン化は、Agilent均一濃度ポンプが内部質量基準溶液をほぼ0.01ml/分でソース内に絶えず送る二重ESIソースを使用して用いられた。機器の質量範囲は75〜1500Daに設定され、データはダイナミックレンジを最大にするために2GHzモードで得られた。データ取得は、高分解能精密質量条件を使用するAgilent MassHunter B.02.00バージョンを用いて実施された。 Liquid chromatography electrospray-ionization time-of-flight mass spectrometry (LC-ESI-TOF-MS) is an Agilent QTOF LC / MS consisting of a G6520AA QTOF high resolution mass spectrometer capable of accurate mass MS and MS / MS ion fragmentation. A system was used to perform these extracts. The polar metabolite fraction of each sample was analyzed for two different chromatographic methods for maximum separation and small molecule resolution: a) 3 × 100 mm Phenomenex 3 μm Luna hydrophilic interaction chromatography (HILIC) and b) 2.1. The analysis was performed using a x50 mm Zorbax 1.8 μm C18-SB column (C18). This approach maximized the number of metabolites that were separated and subsequently ionized and measured. Ultra High Pressure Liquid Chromatography (UPLC) analysis was performed using a Zorbax C18 using a 15 minute gradient from 5% acetonitrile / 95% water / 0.1% formic acid to 100% acetonitrile / 0.1% formic acid at a flow rate of 400 μl / min. Performed with a column. The HILIC HPLC method was performed using a 16 minute gradient from 95% acetonitrile / 5% water / 0.1% formic acid to 60% acetonitrile / 40% water / 0.1% formic acid at a flow rate of 500 μl / min. . Electrospray-ionization was used using a dual ESI source where an Agilent homogeneous pump constantly sends an internal mass reference solution into the source at approximately 0.01 ml / min. The mass range of the instrument was set to 75-1500 Da and data was acquired in 2 GHz mode to maximize the dynamic range. Data acquisition was performed using Agilent MassHunter B. using high resolution accurate mass conditions. Performed using version 02.00.
(実施例2)
自閉症脳において識別的に産生される代謝産物の同定
データ解析に先立って、各試料の全イオンクロマトグラム(TIC)は、MSシグナルの質および再現性について慎重に検査された。TIC存在量がLC−MS勾配全体の中央値から25%を超えて逸脱した試料では、LC−MS解析が繰り返された(図1)。データは、脱同位体化(deisotoped)され、次にオープンソースmzDataフォーマットに変換された。
(Example 2)
Identification of metabolites produced differentially in the autistic brain Prior to data analysis, the total ion chromatogram (TIC) of each sample was carefully examined for MS signal quality and reproducibility. For samples where the TIC abundance deviated more than 25% from the median of the overall LC-MS gradient, LC-MS analysis was repeated (FIG. 1). The data was deisotoped and then converted to the open source mzData format.
データ解析は、オープンソース統計プログラミングおよび解析ソフトウェアRを使用して実施された。XCMSパッケージ(Smithら、2006年、Anal., Chem.78巻:779〜787頁)を使用し、ピークピッキングのCentwaveアルゴリズムを使用してLC−ESI−TOF−MSから得られるファイルを解析した(Tautenhahnら、2008年、BMC Bioinf.9巻:504頁)。LC−MS試料全体の保持時間偏差は、すべてのLC−MS試料に共通のフィーチャーのレクター(保持時間補正)ロエス(loess)回帰を使用して補正され、そのフィーチャーはXCMSにおける密度ベースの関数を使用してグループ化された。HILICクロマトグラフィーの最大観察偏差は15秒であり、C18クロマトグラフィーでは4秒であった。グルーピング関数を実施した後、LC−MS試料において失われたフィーチャーは、フィーチャーグループの範囲に基づくm/zおよび保持時間枠を使用して反復的に積分された。ピーク強度表は、単変量と多変量統計解析の両方を使用して評価された。汚染物イオンは、脳組織抽出物と偽抽出ブランクを比較することにより取り除かれた。脳組織抽出物と偽抽出ブランクの両方に存在するフィーチャーは、その存在量が抽出ブランクの5倍未満の場合にはデータセットから取り除かれた。個々の質量フィーチャーの統計的有意性は、対照脳と自閉症死後脳との間にはその存在量の差はないという帰無仮説の下で実施された。差次的代謝産物、またはフィーチャーは、複合脳領域に関するモデルlog2(存在量)からセクション+診断を用いる不完備型ブロック計画ANOVAを使用して決定された。フィーチャーは、それがANOVAモデルの診断要因において25%を超える倍変化および0.05未満のp値を示す場合は統計的に有意と見なされた。各統計的に有意なフィーチャーの抽出されたイオンクロマトグラムはさらに評価されて、偽の結果の包含を減らすために自閉症と正常な抽出物間の観察可能な差を確認した。 Data analysis was performed using open source statistical programming and analysis software R. The XCMS package (Smith et al., 2006, Anal., Chem. 78: 779-787) was used to analyze files obtained from LC-ESI-TOF-MS using the peak picking Centwave algorithm ( Tautenhahn et al., 2008, BMC Bioinf. 9: 504). The retention time deviation of the entire LC-MS sample is corrected using the feature's common (retention time correction) loess regression for all LC-MS samples, which features a density-based function in XCMS. Use grouped. The maximum observed deviation for HILIC chromatography was 15 seconds and for C18 chromatography was 4 seconds. After performing the grouping function, the features lost in the LC-MS sample were iteratively integrated using m / z and retention time frame based on the feature group range. The peak intensity table was evaluated using both univariate and multivariate statistical analysis. Contaminant ions were removed by comparing the brain tissue extract with the pseudo-extraction blank. Features present in both brain tissue extracts and mock extraction blanks were removed from the data set if their abundance was less than 5 times that of the extraction blank. Statistical significance of individual mass features was performed under the null hypothesis that there is no difference in abundance between control and postmortem brains. Differential metabolites, or features, were determined using the incomplete block design ANOVA with section + diagnosis from model log2 (abundance) for complex brain regions. A feature was considered statistically significant if it showed a fold change of more than 25% and a p-value of less than 0.05 in the diagnostic factors of the ANOVA model. The extracted ion chromatogram of each statistically significant feature was further evaluated to confirm observable differences between autism and normal extracts to reduce the inclusion of false results.
直接注入物は、XCMSにおける連続ウェーブレット変換(Continuous Wavelet Transform)(Duら、2006年、Bioinformatics、22巻:2059〜2065頁)ピークピッキングアルゴリズムを使用して解析された。Agilent質量定性分析(Mass Qualitative Analysis)ソフトウェアバージョン2.00Bを使用して、ベンダー特有の生データファイルをオープンソースmzDataファイルに変換した。1000に等しいまたはそれより大きい高さを有するフィーチャーは解析に含まれ、次に、質量フィーチャーを同定することに先立って脱同位体化された。質量フィーチャー(推定代謝産物)の作製は、R/Bioconductor由来のXCMS(Smithら、2006年、Anal., Chem.78巻:779〜787頁)ライブラリー中に存在する方法を使用して実行された。各ESI極性は個別に処理された。高分解能高質量精度データにおけるピークの検出を目的とするcentwaveアルゴリズム(Tautenhahnら、2008年、BMC Bioinf.9巻:504頁)はピークピッキングのために利用された。centwaveアルゴリズムのための入力変数は、QTOF設定およびクロマトグラフィー法に基づいていた。ピークピッキングに続いて、保持時間における偏差はロエス回帰を使用して補正された。質量フィーチャービンまたはグループは、LC−MS勾配に最適化されたパラメータを使用する密度ベースのグループ化アルゴリズムを使用して作製された。データを質量フィーチャーにグループ化した後、失われたフィーチャーは、XCMSにおける反復ピークフィリング法を使用して、フィーチャーの保持時間および質量範囲に基づいて積分された。 Direct injections were analyzed using a continuous wavelet transform in XCMS (Du et al., 2006, Bioinformatics, 22: 2059-2065) peak picking algorithm. Vendor-specific raw data files were converted to open source mzData files using Agilent Qualitative Analysis software version 2.00B. Features with a height equal to or greater than 1000 were included in the analysis and were then deisolated prior to identifying mass features. The generation of mass features (putative metabolites) was performed using the methods present in the XCMS (Smith et al., 2006, Anal., Chem. 78: 779-787) library from R / Bioconductor. It was. Each ESI polarity was processed separately. The centwave algorithm (Tautenhahn et al., 2008, BMC Bioinf. 9: 504), which aims to detect peaks in high resolution, high mass accuracy data, was used for peak picking. The input variables for the centwave algorithm were based on QTOF settings and chromatographic methods. Following peak picking, deviations in retention time were corrected using Loess regression. Mass feature bins or groups were created using a density-based grouping algorithm using parameters optimized for LC-MS gradients. After grouping the data into mass features, the missing features were integrated based on feature retention time and mass range using an iterative peak filling method in XCMS.
個々のLC−MSにおいて検出される質量フィーチャーのビニングを使用して、注入物にわたって同一保持時間に存在しているフィーチャーを同定した。精密質量と保持時間の両方に基づくビニングアルゴリズムを使用して、質量フィーチャーは異なるLC/ESI−MS−QTOF実験を通じて同一であると見なした。ビニング基準は、より低い分子量でより大きな質量差を可能にするスライディング質量差スケールとクロマトグラフィーの再現性に基づく一定の保持時間枠の両方に基づいていた。 Binning of mass features detected in individual LC-MS was used to identify features that were present at the same retention time across the injection. Using a binning algorithm based on both accurate mass and retention time, mass features were considered identical throughout different LC / ESI-MS-QTOF experiments. The binning criteria were based on both a sliding mass difference scale that allows for greater mass differences at lower molecular weights and a constant retention time frame based on chromatographic reproducibility.
個々の質量フィーチャーの統計的有意性試験は、順列ベースの検定統計量を使用して、対照と自閉症小脳虫部試料間にはその存在量の差はないという帰無仮説の下で実施された。この解析は、RにおけるpcaMethodsライブラリーを使用するローディングおよびスコアプロットにおけるメタデータの異なる組合せを探索することにより実施された(Stackliesら、2007年、PcaMethods: A collection of PCA methods. R package version 1.12.0.、CRAN.R-project.org/から利用可能)。対照と自閉症死後脳試料間の一般差はウェルチt検定を使用して評価された。ベイジアン主成分分析は、代謝の全体的変化が対照と自閉症脳組織間に存在するかどうかを決定する場合にこの方法が失われたデータを許容することができるために(Obaら、2003年、Bioinformatics、19巻:2088〜2096頁)、実施された。この解析は、RにおけるpcaMethodsライブラリーを使用するローディングおよびスコアプロットにおけるメタデータの異なる組合せを探索することにより実施された(Stackliesら、2007年、Pca Methods: A collection of PCA methods. R package version 1.12.0.、CRAN.R-project.org/から利用可能)。 Statistical significance testing of individual mass features is performed under the null hypothesis that there is no difference in abundance between control and autism cerebellar worm samples using permutation-based test statistics. It was done. This analysis was performed by exploring different combinations of metadata in loading and score plots using the pcaMethods library in R (Stacklies et al., 2007, PcaMethods: A collection of PCA methods. R package version 1.12. 0, available from CRAN.R-project.org/). General differences between control and postmortem brain samples were assessed using the Welch t test. Bayesian principal component analysis allows this method to tolerate lost data when determining whether an overall change in metabolism exists between the control and autistic brain tissue (Oba et al., 2003). Year, Bioinformatics, 19: 2088-2096). This analysis was performed by exploring different combinations of metadata in loading and score plots using the pcaMethods library in R (Stacklies et al., 2007, Pca Methods: A collection of PCA methods. R package version 1.12). .0., Available from CRAN.R-project.org/).
統計的に有意なフィーチャーは、試料を教師なしの形態で分類するその能力を調べるために、主要クラスター分析(Principal Cluster Analysis(PCA))ベースの方法および階層的クラスタリングを使用してモデル化もされた。その結果、死後自閉症脳と非自閉症対照間の統計的に有意差のある低代謝産物の包括的リストが、実験あたり平均で6,000フィーチャーの統計的解析に続いて同定された。質量分析ベースのメタボロミクスプロファイリングまたはメタボロミクスにより、HILICを使用して98件の代謝産物およびC18クロマトグラフィーを使用して47件の代謝産物において自閉症脳に有意な変化(p値<0.05)が明らかにされた。 Statistically significant features are also modeled using Principal Cluster Analysis (PCA) based methods and hierarchical clustering to examine their ability to classify samples in an unsupervised form. It was. As a result, a comprehensive list of hypometabolites with statistically significant differences between postmortem autistic brain and non-autistic controls was identified following statistical analysis of an average of 6,000 features per experiment. . Mass spectrometry-based metabolomic profiling or metabolomics significantly altered autistic brain in 98 metabolites using HILIC and 47 metabolites using C18 chromatography (p-value <0.05) Was revealed.

(実施例3)
自閉症特異的代謝産物の化学的アノテーション
実施例2に記載される自閉症小脳において識別的に分泌される代謝産物の同定に続いて、これらの分子の化学的アノテーションは、イオン断片化パターン解析(MS−MS)によりさらに精密にされた。具体的には、上で同定された各小分子の断片化パターンおよび保持時間は、分析用化学標準物質と比較された。各小分子の化学的特定名の確認は自閉症バイオマーカー決定には必要ではないが、注釈付きの同一性は、それが小分子バイオマーカーごとにより均一な命名法を与えるという点で都合がよい。識別的に産生される代謝産物のそれに続く化学的同定により、バイオインフォマティクス(GeneGoソフトウェア)による特定の経路上への代謝産物のインシリコマッピングも可能になる。したがって、この情報により、自閉症の死後脳と非自閉症年齢適合対照間の生化学的差異の根底にある全身的代謝経路および/またはネットワークが明らかにされた。
(Example 3)
Chemical annotation of autism-specific metabolites Following identification of metabolites that are differentially secreted in the autism cerebellum as described in Example 2, chemical annotation of these molecules can be performed using ion fragmentation patterns. Further refined by analysis (MS-MS). Specifically, the fragmentation pattern and retention time of each small molecule identified above was compared to analytical chemical standards. Confirmation of the chemical specific name of each small molecule is not necessary for autism biomarker determination, but annotated identity is advantageous in that it gives a more uniform nomenclature for each small molecule biomarker. Good. Subsequent chemical identification of differentially produced metabolites also allows in silico mapping of metabolites onto specific pathways by bioinformatics (GeneGo software). Thus, this information revealed the systemic metabolic pathways and / or networks that underlie biochemical differences between autistic postmortem brain and non-autistic age-matched controls.
各化合物のニュートラル精密質量は、候補同一性については、公開の検索可能なデータベースMETLIN(metlin.scripps.edu)、ヒトメタボロームデータベース(www.hmdb.ca)、および遺伝子とゲノムの京都エンサイクロペディア(www.genome.jp/kegg/)、または生物学磁気共鳴バンク(www.bmrb.wisc.edu/metabolomics/)に対して照合された。測定された質量フィーチャーは、その精密質量が注釈付きのデータベース分子の百万分の20(0.00002×質量)以内である場合は、データベースに存在する代謝産物と適合すると見なされる。バイオマーカー候補の化学的特定名は、以下の3種類の基準:(1)分子精密質量、(2)MS/MS断片化パターンおよび(3)クロマトグラフィー保持時間のうちの1つまたはそれよりも多くを使用して確認された。エレクトロスプレー−イオン化飛行時間型質量分析(LC−ESI−TOF−MS/MS)(すなわち、タンデム質量分析)データの解釈により決定される、各候補バイオマーカーの精密質量(すなわち、質量フィーチャー)は、推定分子同一性について上に記載される様々な公開の検索可能なデータベースに対して照合された。次に、注釈付きの候補は、候補分子イオンについてのMS/MSプロダクトイオンスペクトルを獲得し、次に公知の分析用標準的基準化合物について得られるプロダクトイオンスペクトルに対してMS/MS断片化パターンを適合させることにより検証された(Cummingsら、2009年、J Chromatogr B Analyt Technol Biomed Life Sci.、877巻:1221頁)。 The neutral exact mass of each compound is determined for the candidate identity by using the public searchable database METLIN (metlin.scripps.edu), the human metabolome database (www.hmdb.ca), and the Kyoto Encyclopedia of Genes and Genomes ( against www.genome.jp/kegg/) or biological magnetic resonance bank (www.bmrb.wisc.edu/metabolomics/). A measured mass feature is considered compatible with a metabolite present in the database if its exact mass is within 20 millions of annotated database molecules (0.00002 × mass). The chemical specific name of a biomarker candidate is one or more of the following three criteria: (1) molecular accurate mass, (2) MS / MS fragmentation pattern, and (3) chromatographic retention time. Confirmed using many. The exact mass (ie mass feature) of each candidate biomarker, as determined by interpretation of electrospray-ionization time-of-flight mass spectrometry (LC-ESI-TOF-MS / MS) (ie tandem mass spectrometry) data, is It was checked against the various public searchable databases described above for putative molecular identity. The annotated candidate then obtains an MS / MS product ion spectrum for the candidate molecular ion, and then applies an MS / MS fragmentation pattern to the product ion spectrum obtained for a known analytical standard reference compound. (Cummings et al., 2009, J Chromatogr B Analyt Technol Biomed Life Sci., 877: 1221).
L−シスタチオニン、2−アミノオクタン酸およびN−アセチルアスパルチルグルタミン酸の分析用化学標準物質は、比較質量分析のためにSigma Chemical Co.、St.Louis、MOから購入された。化学基準物質は、原試料のメタボロミクス解析において使用される同一クロマトグラフィー法を使用して評価された。さらに、7つの原試料(4つの自閉症および3つの対照)は、保持時間およびイオン断片化適合を保証するために、化学標準物質との比較のため再解析された。化学基準物質は適切なバッファーに溶解され、100μM標準物質は、95% 0.1%ギ酸/5%アセトニトリルに希釈することにより調製された。実験試料および化学標準物質は、衝突エネルギーを決定するための以下の式:衝突エネルギー=(前駆体のm/z−100)/100*3V+10Vを使用して断片化された。推定アノテーションは、原試料における保持時間および断片化パターンが化学基準と適合する場合は、正しいと見なされた。推定代謝産物が、断片化される試料抽出物において存在量が不十分である場合には、保持時間だけがアノテーションを確認するために使用された。 Chemical standards for analysis of L-cystathionine, 2-aminooctanoic acid and N-acetylaspartyl glutamic acid are available from Sigma Chemical Co. for comparative mass spectrometry. , St. Purchased from Louis, MO. The chemical reference material was evaluated using the same chromatographic method used in metabolomic analysis of the original sample. In addition, 7 original samples (4 autism and 3 controls) were reanalyzed for comparison with chemical standards to ensure retention time and ion fragmentation fit. Chemical standards were dissolved in the appropriate buffer and 100 μM standards were prepared by diluting in 95% 0.1% formic acid / 5% acetonitrile. Experimental samples and chemical standards were fragmented using the following formula to determine the collision energy: collision energy = (precursor m / z-100) / 100 * 3V + 10V. The putative annotation was considered correct if the retention time and fragmentation pattern in the original sample met the chemical criteria. If the putative metabolite was insufficient in the sample extract to be fragmented, only the retention time was used to confirm the annotation.
第三の確認基準は、化学標準物質のクロマトグラフィー保持時間およびイオン化断片化パターン(図2)がバイオマーカー候補の保持時間と適合するかどうかを決定するために、内在性代謝産物を公知の基準化合物と一緒に同時注入する(すなわち、スパイクする)ことにより確立された。タンデム質量分析、またはMS−MSを使用して、これらの実験における内在性代謝産物の同一性を確認した。データ解析が完了した後、統計的に有意な代謝産物のサブセットを公知の化学標準物質に対して確認するために選択した。 A third validation criterion is that the endogenous metabolites are known to determine whether the chromatographic retention time and ionization fragmentation pattern of the chemical standard (FIG. 2) matches the retention time of the biomarker candidate. Established by co-injection (ie, spike) with the compound. Tandem mass spectrometry, or MS-MS was used to confirm the identity of the endogenous metabolites in these experiments. After data analysis was completed, a statistically significant subset of metabolites was selected to confirm against known chemical standards.
これらのアッセイでは、上記の質量フィーチャーを同定するために使用される新鮮な凍結脳抽出物は1mMの化学標準物質でスパイクされ、次にMS−MSにより解析された。残りの未使用の試料またはスパイクされた試料はLC−ESI−MS/MSにより処理されて、推定的に同定された化合物のイオンの構造および存在量を確認した。これらの実験で対照として使用された標準物質は公知の保持時間を有していた。スパイクされた試料において観察された並行保持時間により、代謝産物同一性がさらに確認された。候補バイオマーカーの化学的特定名の最終確認は、断片イオンの検出(図2、A)と保持時間(図2、B)の両方に基づいて行われた。ヒットの分類は、分析(新鮮な凍結脳抽出物)と化学基準MS/MSスペクトル間で共有される断片イオンの質量を同定する「共有ピークカウント」法に基づいていた。 In these assays, fresh frozen brain extracts used to identify the mass features described above were spiked with 1 mM chemical standards and then analyzed by MS-MS. The remaining unused or spiked samples were processed by LC-ESI-MS / MS to confirm the ion structure and abundance of the putatively identified compound. The standard used as a control in these experiments had a known retention time. Metabolite identity was further confirmed by the parallel retention times observed in the spiked samples. Final confirmation of the chemical names of candidate biomarkers was based on both fragment ion detection (FIG. 2, A) and retention time (FIG. 2, B). The hit classification was based on a “shared peak count” method that identifies the mass of fragment ions shared between the analysis (fresh frozen brain extract) and chemical reference MS / MS spectra.
統計的な有意差は、死後自閉症と非自閉症脳試料間の複数の代謝産物の存在量において検出された(表2)。有意である高い可能性のある代謝産物に焦点を合わせ、潜在的な誤った人為的結果を排除するために、各データセット(HILICおよびC18クロマトグラフィー)は、対照と自閉症脳試料間の存在量の25%倍変化の中等度フィルターを使用してフィルターされた。HILICクロマトグラフィーとそれに続くポジティブモードESI−QTOFイオン化により25%を超える倍変化を示す988件の質量フィーチャーが同定され、そのうちの98件の代謝産物が自閉症と非自閉症脳間で統計的に有意差があった(p<0.05)。さらに、C18クロマトグラフィーとそれに続くポジティブモードESI−QTOFイオン化により、少なくとも25%の倍変化を有する938件の質量フィーチャーが測定され、47件の統計的に有意な代謝産物が生じた(p<0.05)。表2は、自閉症と対照死後脳試料間で存在量に少なくとも25%の変化を有する測定された有意な代謝産物のサブセットを示しており、対応する抽出されたイオンクロマトグラム(EIC)は自閉症と対照脳試料間で際立った差を示している。メタボロミクス研究のもっとも厄介な面の1つは測定された小分子の多くが公開されたデータベースではまだ注釈が付いていないことである。現在の方法は、特有の質量による小分子代謝産物の同定を可能にしているが、化合物名による同定はさらに厄介である。同定された代謝産物は新規のバイオマーカーを表しており、重要なことに、自閉症の病因の一因となる追加の経路を指摘している。 A statistically significant difference was detected in the abundance of multiple metabolites between postmortem autism and non-autistic brain samples (Table 2). Each data set (HILIC and C18 chromatography) is between the control and autistic brain samples to focus on the likely metabolites that are significant and eliminate potential false artifacts. Filtered using a moderate filter with a 25% fold change in abundance. HILIC chromatography followed by positive mode ESI-QTOF ionization identified 988 mass features that showed a fold change of more than 25%, of which 98 metabolites were statistically observed between autistic and non-autistic brains There was a significant difference (p <0.05). In addition, C18 chromatography followed by positive mode ESI-QTOF ionization measured 938 mass features with a fold change of at least 25%, yielding 47 statistically significant metabolites (p <0). .05). Table 2 shows a measured subset of significant metabolites with at least a 25% change in abundance between brain samples after autism and control death, and the corresponding extracted ion chromatogram (EIC) is It shows a striking difference between autism and control brain samples. One of the most troublesome aspects of metabolomics research is that many of the measured small molecules are not yet annotated in public databases. Although current methods allow for identification of small molecule metabolites by unique mass, identification by compound name is even more cumbersome. The identified metabolites represent novel biomarkers, and importantly point out additional pathways that contribute to the pathogenesis of autism.
識別的に分泌された代謝産物の化学的アノテーション
化学的アノテーションは、識別的に分泌された代謝産物の以下のサブセットについて確認された。
Chemical annotation of differentially secreted metabolites Chemical annotation was confirmed for the following subset of differentially secreted metabolites.
L−シスタチオニン
システインおよびメチオニン代謝経路におけるいくつかの代謝産物は、対照と比べて自閉症脳において著しく増加していた。HILICクロマトグラフィーを使用して、自閉症脳試料の後小脳虫部でも外側半球でもL−シスタチオニン(精密質量222.067)では統計的有意差が検出された(p=0.019、図3(A)および3(D))。L−シスタチオニンの化学的特定名は、死後脳試料(図4(A))と化学標準物質(図4(B))間の保持時間(図3(B)および3(C))ならびにイオン断片化パターンの比較により二次的に確認された。
L-cystathionine Some metabolites in the cysteine and methionine metabolic pathways were significantly increased in the autistic brain compared to controls. Using HILIC chromatography, a statistically significant difference was detected in L-cystathionine (exact mass 222.067) in both the posterior cerebellar and lateral hemispheres of autistic brain samples (p = 0.199, FIG. 3). (A) and 3 (D)). The chemical specific name of L-cystathionine is the retention time (FIGS. 3 (B) and 3 (C)) between the postmortem brain sample (FIG. 4 (A)) and the chemical standard (FIG. 4 (B)) and the ion fragment. Secondarily confirmed by comparison of the conversion patterns.
2−アミノオクタン酸
L−シスタチオニンとは対照的に、代謝産物2−アミノオクタン酸(精密質量159.125)の存在量は、自閉症患者の後小脳虫部でも外側半球でも著しく減少していた(p=0.027、図5(A)および5(D))。2−アミノオクタン酸の全体脳減少は、自閉症と対照試料間で144%であった。2−アミノオクタン酸はこれまで脳試料において調べられたことがなく、したがって、2−アミノオクタン酸濃度の変化が自閉症と関係している初めての証拠が本明細書で提供される。以前の研究では尿中でのこの化合物が報告され測定されているだけである(Parryら、1957年、Clinica Chimica Acta、2巻:115〜125頁)。化学標準物質(図5(B))と死後脳試料(図5(C))間の比較質量分析により、代謝産物保持時間の適合が実証された。死後脳試料における2−アミノオクタン酸の低い存在量範囲は、本研究における他の代謝産物について用いられた標準MS−MS法に従ってそのイオン断片化を得る障害となっていた。
2-Aminooctanoic acid In contrast to L-cystathionine, the abundance of the metabolite 2-aminooctanoic acid (exact mass 159.125) is markedly decreased in both the posterior cerebellar and lateral hemispheres of autistic patients. (P = 0.027, FIGS. 5 (A) and 5 (D)). The total brain reduction of 2-aminooctanoic acid was 144% between autism and control samples. 2-Aminooctanoic acid has never been examined in brain samples so far and thus the first evidence that changes in 2-aminooctanoic acid concentration are associated with autism is provided herein. Previous studies have only reported and measured this compound in urine (Parry et al., 1957, Clinica Chimica Acta, 2: 115-125). Comparative mass spectrometry between chemical standards (FIG. 5 (B)) and postmortem brain samples (FIG. 5 (C)) demonstrated the suitability of metabolite retention times. The low abundance range of 2-aminooctanoic acid in postmortem brain samples has been an obstacle to obtaining its ion fragmentation according to the standard MS-MS method used for other metabolites in this study.
N−アセチルアスパルチルグルタミン酸(NAAG)
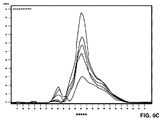
N−アセチルアスパルチルグルタミン酸(精密質量304.091)の存在量は、正常な対照と比べて死後自閉症脳において増加していた。これらの結果は、自閉症のヒトインビトロモデルについて以前報告されたグルタメート経路の攪乱(Cezarら、2007年、Stem Cells Dev.16巻:869〜882頁)、ならびに他の臨床研究(Blaylockら、2009年、Curr. Med. Chem.16巻:157〜170頁;Friedmanら、2006年、Arch. Gen. Psychiatry、63巻:786〜794頁;Kleinhansら、2007年、Brain Res.1162巻、85〜97頁;Pardoら、2007年、Brain Pathol.17巻:434〜447頁;Shinoheら、2006年、Prog. Neuro-Psychopharmacol. Biol. Psychiatry、30巻:1472〜1477頁)と一致している。しかし、以前の報告と違って、本明細書に記載される結果は、グルタメート代謝中間体であるN−アセチルアスパルチルグルタミン酸に対する以前は認識されていなかった直接的攪乱を示している。統計的有意性を示して(p=0.054、図6(A)および6(D))、N−アセチルアスパルチルグルタミン酸の化学的特定名は、死後脳試料(図4(C))と化学標準物質(図4(D))間の保持時間(図6(B)および6(C))とイオン断片化パターンの両方を明らかにしている比較質量分析により確かめられた。
N-acetylaspartyl glutamic acid (NAAG)
The abundance of N-acetylaspartylglutamic acid (exact mass 304.091) was increased in postmortem autistic brain compared to normal controls. These results indicate that perturbation of the glutamate pathway previously reported for human in vitro models of autism (Cezar et al., 2007, Stem Cells Dev. 16: 869-882), as well as other clinical studies (Blaylock et al., 2009, Curr. Med. Chem. 16: 157-170; Friedman et al., 2006, Arch. Gen. Psychiatry, 63: 786-794; Kleinhans et al., 2007, Brain Res. 1162, 85. -97; Pardo et al., 2007, Brain Pathol. 17: 434-447; Shinohe et al., 2006, Prog. Neuro-Psychopharmacol. Biol. Psychiatry, 30: 1472-1477) . However, unlike previous reports, the results described herein show a previously unrecognized direct disturbance to the glutamate metabolic intermediate N-acetylaspartylglutamate. Showing statistical significance (p = 0.054, FIGS. 6 (A) and 6 (D)), the chemical specific name of N-acetylaspartyl glutamic acid is the postmortem brain sample (FIG. 4 (C)). This was confirmed by comparative mass spectrometry revealing both the retention time (Figure 6 (B) and 6 (C)) and the ion fragmentation pattern between the chemical standards (Figure 4 (D)).
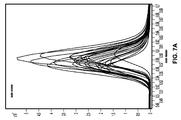
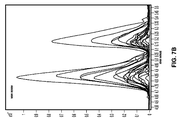
不特定化合物
上に記載される代謝産物に加えて、本明細書に記載されるメタボロミクス解析により、複数の注釈なしの代謝産物(すなわち、公開されたデータベースでは注釈が付いていない)の変化が同定された。これらの代謝産物の存在量は、対照と比べた場合、自閉症脳試料において有意に増加しているまたは減少していた(p<0.05)。2つのそのような不特定小分子代謝産物の抽出されたイオンクロマトグラムは図7(A)および7(B)に示されている(それぞれ、精密質量366.1426および422.2482)。これらの注釈なしの内在性代謝産物の両方とも自閉症脳領域において著しく増加していた。フィーチャーA(精密質量366.1426)は自閉症と対照脳試料間で存在量が42%増加していた。フィーチャーB(精密質量422.2482)の存在量は自閉症脳試料において181%増加していた。公開されているデータベースにこれらの代謝産物のアノテーションが現在ないからといって、自閉症についての候補診断バイオマーカーとしてこれらの代謝産物が排除されることはない。本明細書で用いられる分析化学検出システムの高度に感度が良く定量的性質は、測定可能なエンドポイント(すなわち、精密質量)を提供し、このエンドポイントは自閉症患者由来の患者試料(たとえば、組織または生体液)において測定することが可能である。さらに、NMRなどの他の分析プラットフォームを使用して、これらの化合物の化学式を確認することができる。化学的アノテーションがないと特定の生化学経路上へのその分子のマッピングが妨げられるだけである。
Unspecified compounds In addition to the metabolites listed above, the metabolomic analysis described here identifies multiple unannotated metabolite changes (ie, unannotated in public databases) It was done. The abundance of these metabolites was significantly increased or decreased (p <0.05) in autistic brain samples when compared to controls. Extracted ion chromatograms of two such unspecified small molecule metabolites are shown in FIGS. 7 (A) and 7 (B) (exact mass 366.1426 and 422.2482, respectively). Both of these unannotated endogenous metabolites were markedly increased in the autistic brain region. Feature A (exact mass 366.1426) had a 42% increase in abundance between autism and control brain samples. The abundance of feature B (exact mass 422.2482) was increased by 181% in the autistic brain sample. The absence of annotations of these metabolites in the public database does not exclude these metabolites as candidate diagnostic biomarkers for autism. The highly sensitive and quantitative nature of the analytical chemistry detection system used herein provides a measurable endpoint (ie, accurate mass), which is a patient sample from an autistic patient (eg, , Tissue or biological fluid). In addition, other analytical platforms such as NMR can be used to confirm the chemical formulas of these compounds. The absence of chemical annotations only prevents the mapping of the molecule onto a specific biochemical pathway.
要約すると、死後自閉症と非自閉症脳試料間で約10から約1500ダルトンまでサイズに幅がある複数の代謝産物の存在量において統計的有意差が検出された(表2)。HILICクロマトグラフィーとそれに続くポジティブモードESI−QTOFイオン化により、自閉症脳と非自閉症対照間で統計的な有意差(p<0.05)のある合計で98件の代謝産物が同定された。さらに、C18クロマトグラフィーとそれに続くポジティブモードESI−QTOFイオン化により、47件の統計的に有意な代謝産物(p<0.05)が生じた。この包括的シグネチャは、これらの内在性化学物質に対する攪乱を生体液においても定量的な形態で測定されるかどうかを調べるトランスレーショナルアプローチに即時的手段を提供する。 In summary, statistically significant differences were detected in the abundance of metabolites ranging in size from about 10 to about 1500 daltons between postmortem autism and non-autistic brain samples (Table 2). HILIC chromatography followed by positive mode ESI-QTOF ionization identified a total of 98 metabolites with statistically significant differences (p <0.05) between autistic brain and non-autistic controls. It was. In addition, C18 chromatography followed by positive mode ESI-QTOF ionization yielded 47 statistically significant metabolites (p <0.05). This comprehensive signature provides an immediate means for a translational approach to determine whether disturbances to these endogenous chemicals are measured in biological fluids in quantitative form.
(実施例4)
患者生体液において分泌される代謝産物の同定および評価
自閉症により主に冒される器官である脳組織を評価すれば本明細書に記載される自閉症バイオマーカーの同定が可能であるが、本発明の方法は脳組織の検査に限定されない。たとえば、脳脊髄液、血液、血漿、羊水および尿を含む生体液、すなわち、細胞外生体分子の複雑な混合物などの患者試料を分析すれば、識別的に分泌される代謝産物の同定および評価も可能になる。この方法は、生体液中に存在する小分子を非侵襲的に(細胞内化合物とは対照的に)検出することができるために、組織生検などの侵襲的手法よりも都合がよい。さらに、質量分析のために細胞上清を処理するのは細胞抽出物よりも頑強であり手間がかからない。たとえば、組織生検または溶解された細胞由来の細胞抽出物は本発明の方法に包含されている。
Example 4
Identification and evaluation of metabolites secreted in patient biological fluids The evaluation of brain tissue, an organ primarily affected by autism, can identify the autism biomarkers described herein. The method of the present invention is not limited to the examination of brain tissue. Analyzing patient samples such as biological fluids, including cerebrospinal fluid, blood, plasma, amniotic fluid, and urine, that is, complex mixtures of extracellular biomolecules, can also identify and evaluate metabolites that are differentially secreted. It becomes possible. This method is more advantageous than invasive techniques such as tissue biopsy because small molecules present in biological fluids can be detected non-invasively (as opposed to intracellular compounds). Furthermore, processing cell supernatants for mass spectrometry is more robust and less time consuming than cell extracts. For example, tissue biopsies or cell extracts derived from lysed cells are encompassed by the methods of the invention.
さらに、当業者であれば、脳代謝産物の周囲の脳脊髄液への分泌を認識しているであろう。今度は、記載された方法(すなわち、メタボロミクス解析)による脳脊髄液の収集および評価により、識別的に発現される代謝産物の解析および同定が可能になる。本発明の方法を使用すれば、特定の候補バイオマーカーの定義された精密質量および保持時間について脳脊髄液および他の生体液を評価するために特定の分析化学プロトコールを使用することが可能である。 Furthermore, those skilled in the art will recognize the secretion of brain metabolites into the surrounding cerebrospinal fluid. In turn, collection and evaluation of cerebrospinal fluid by the described method (ie, metabolomic analysis) allows analysis and identification of differentially expressed metabolites. Using the method of the present invention, it is possible to use a specific analytical chemistry protocol to evaluate cerebrospinal fluid and other biological fluids for a defined exact mass and retention time of a particular candidate biomarker .
したがって、本発明の方法のこれらの態様では、従来の技法(たとえば、腰椎穿刺)を使用して脳脊髄液などの生体液が得られ、その生体液は本明細書に記載される通りに処理されて、タンパク質および約3000ダルトンを超える分子量を有する他の生体物質を取り除く。分離法、たとえば、LC−TOF質量分析は、処理された生体液およびそこで検出された代謝産物に適用される。自閉症に特徴的な1つまたは複数の識別的に産生される代謝産物の検出を使用して、自閉症に罹っているまたは自閉症になるリスクのある対象を同定し、追加の行動学的方法および他の診断法が指示される必要を示す。 Thus, in these aspects of the methods of the present invention, conventional techniques (eg, lumbar puncture) are used to obtain a biological fluid, such as cerebrospinal fluid, that is processed as described herein. To remove proteins and other biological material having a molecular weight above about 3000 Daltons. Separation methods such as LC-TOF mass spectrometry are applied to the treated biological fluid and the metabolites detected there. The detection of one or more differentially produced metabolites characteristic of autism is used to identify subjects suffering from or at risk of becoming autistic Indicates that behavioral methods and other diagnostic methods need to be indicated.
同様に、当業者であれば、脳小代謝産物の血液脳関門を越える分泌を認識しているであろう。血漿のメタボロミクス解析は、記載されている通りに哺乳動物から得られる血液試料で実施されてきた。すなわち、血漿を解凍し、450μlの氷冷MeOH対H2O(8対1 v/v)を添加し、2〜8℃で10分間攪拌する。次に、試料を18,400×g、4℃で20分間遠心分離し、上清をチューブに移し、ペレットが観察されなくなるまでステップ3および4を繰り返す。試料を乾燥させ、次に50μlの50対50のACN対0.1%ギ酸に再溶解し、続いて代謝解析をする。要約すると、本発明の方法は、2つの例として脳脊髄液および血漿を含む生体液に適用される。 Similarly, those skilled in the art will recognize the secretion of small brain metabolites across the blood brain barrier. Plasma metabolomics analysis has been performed on blood samples obtained from mammals as described. Briefly, plasma is thawed and 450 μl ice-cold MeOH to H 2 O (8 to 1 v / v) is added and stirred at 2-8 ° C. for 10 minutes. The sample is then centrifuged at 18,400 × g for 20 minutes at 4 ° C., the supernatant is transferred to a tube and steps 3 and 4 are repeated until no pellet is observed. Samples are dried and then redissolved in 50 μl of 50:50 ACN vs. 0.1% formic acid, followed by metabolic analysis. In summary, the method of the invention applies to biological fluids including cerebrospinal fluid and plasma as two examples.
(実施例5)
自閉症脳において変化した生化学および代謝経路の同定
その化学的特定名が上記の通りに確認された統計的に有意な代謝産物は、遺伝子とゲノムの京都エンサイクロペディア(KEGG)経路データベースと比較されインシリコでマッピングされた。フィッシャー直接検定を使用して、統計的に大きな比率を占める生化学経路を見つけた。試料全体で共通の傾向を示すフィーチャーのグループ化も、カノニカルKEGG経路上に表されていない分子間に何か生化学的相互作用が存在するかどうかを決定するためにKEGGデータベースを使用して評価された。このアプローチにより、インビボで観察される代謝変化の根底にある機構的経路を同定することができた。差次的メタボロミクスプロファイルを、遺伝子とゲノムの京都エンサイクロペディア(KEGG、release 41.1, www.genome.jp/kegg)に概要が述べられているそのそれぞれの生化学経路にマッピングすることにより、非自閉症対照と比べて自閉症対象の小脳において上方調節されているまたは下方調節されている特定の代謝経路が明らかになった。非自閉症対照と比べて自閉症脳において、グルタメート、システイン、メチオニン、トリプトファンおよびGABA代謝経路への著しい変化が検出された。
(Example 5)
Identification of biochemical and metabolic pathways altered in the autistic brain Statistically significant metabolites whose chemical names were confirmed as described above are the gene and genome Kyoto Encyclopedia (KEGG) pathway database and Compared and mapped in silico. A Fisher direct test was used to find biochemical pathways that accounted for a statistically large proportion. Grouping of features that show common trends across samples is also evaluated using the KEGG database to determine if there are any biochemical interactions between molecules not represented on the canonical KEGG pathway It was done. This approach allowed us to identify the mechanistic pathway underlying the metabolic changes observed in vivo. By mapping differential metabolomic profiles to their respective biochemical pathways outlined in the Kyoto Encyclopedia of Genes and Genomes (KEGG, release 41.1, www.genome.jp/kegg) Specific metabolic pathways that were up- or down-regulated in the cerebellum of autistic subjects as compared to autistic controls were revealed. Significant changes to glutamate, cysteine, methionine, tryptophan and GABA metabolic pathways were detected in the autistic brain compared to non-autistic controls.
本明細書に記載されるメタボロミクス法の結果は、複数の生化学経路およびネットワークにおける同時変化を測定しており、特定の自閉症脳領域の定量的事実上の生化学シグネチャを提供している。自閉症患者の死後脳と非自閉症対照間の比較メタボロミクスにより、頑強なバイオマーカー、ならびに自閉症の初期診断のための手段を提供する生化学変化が明らかにされた。本明細書に提供される識別的に分泌される代謝産物は、自閉症についてのいくつかの候補診断バイオマーカーを含む。 The results of the metabolomics methods described herein measure simultaneous changes in multiple biochemical pathways and networks, providing a quantitative virtual biochemical signature of specific autistic brain regions . A comparative metabolomics between the postmortem brain of autistic patients and non-autistic controls revealed biochemical changes that provide a robust biomarker, as well as a means for early diagnosis of autism. The differentially secreted metabolites provided herein include a number of candidate diagnostic biomarkers for autism.
本発明は、本発明の開示された実施形態に限定されることを意図していない。前述の開示は本発明のある種の特定の実施形態を強調しており、あらゆる改変またはそれと同等の代替手段は、添付される特許請求の範囲に記載されている本発明の精神および範囲内であることは理解されるべきである。 The present invention is not intended to be limited to the disclosed embodiments of the present invention. The foregoing disclosure highlights certain specific embodiments of the invention, and all modifications or equivalent alternatives are within the spirit and scope of the invention as set forth in the appended claims. It should be understood that there is.
Claims (8)
a.請求項1に記載の1つまたは複数の細胞代謝産物についてその個体由来の患者試料をアッセイするステップと、
b.該患者試料において対照と比べて識別的に産生される、該1つまたは複数の細胞代謝産物を検出するステップと
を含む方法。 A method of using the metabolic signature for autism according to claim 1 as an index of autism in a human test subject,
a. Assaying a patient sample from the individual for one or more cellular metabolites of claim 1 ;
b. It is produced identified to produce compared to controls in the patient sample, the method comprising the step of detecting the one or more cellular metabolites.
Applications Claiming Priority (3)
| Application Number | Priority Date | Filing Date | Title |
|---|---|---|---|
| US32951510P | 2010-04-29 | 2010-04-29 | |
| US61/329,515 | 2010-04-29 | ||
| PCT/US2011/034654 WO2011139914A1 (en) | 2010-04-29 | 2011-04-29 | Metabolic biomarkers of autism |
Related Child Applications (1)
| Application Number | Title | Priority Date | Filing Date |
|---|---|---|---|
| JP2015189529A Division JP2015231392A (en) | 2010-04-29 | 2015-09-28 | Metabolic biomarkers for autism |
Publications (3)
| Publication Number | Publication Date |
|---|---|
| JP2013525801A JP2013525801A (en) | 2013-06-20 |
| JP2013525801A5 JP2013525801A5 (en) | 2014-05-22 |
| JP6021187B2 true JP6021187B2 (en) | 2016-11-09 |
Family
ID=44533446
Family Applications (2)
| Application Number | Title | Priority Date | Filing Date |
|---|---|---|---|
| JP2013508294A Active JP6021187B2 (en) | 2010-04-29 | 2011-04-29 | Metabolic biomarkers of autism |
| JP2015189529A Pending JP2015231392A (en) | 2010-04-29 | 2015-09-28 | Metabolic biomarkers for autism |
Family Applications After (1)
| Application Number | Title | Priority Date | Filing Date |
|---|---|---|---|
| JP2015189529A Pending JP2015231392A (en) | 2010-04-29 | 2015-09-28 | Metabolic biomarkers for autism |
Country Status (6)
| Country | Link |
|---|---|
| US (2) | US9547013B2 (en) |
| EP (1) | EP2564194B1 (en) |
| JP (2) | JP6021187B2 (en) |
| AU (2) | AU2011248464B2 (en) |
| CA (1) | CA2797787C (en) |
| WO (1) | WO2011139914A1 (en) |
Families Citing this family (25)
| Publication number | Priority date | Publication date | Assignee | Title |
|---|---|---|---|---|
| KR101322695B1 (en) * | 2010-08-25 | 2013-10-25 | 주식회사 엘지화학 | Cable-Type Secondary Battery |
| PL3072524T3 (en) | 2010-10-07 | 2018-06-29 | California Institute Of Technology | Probiotic therapies for autism |
| CA2881656C (en) | 2012-08-29 | 2023-07-11 | California Institute Of Technology | Diagnosis and treatment of autism spectrum disorder |
| CA2917483A1 (en) * | 2013-07-09 | 2015-01-15 | Stemina Biomarker Discovery, Inc. | Biomarkers of autism spectrum disorder |
| US20160209428A1 (en) * | 2013-08-21 | 2016-07-21 | The Regents Of The University Of California | Diagnostic and predictive metabolite patterns for disorders affecting the brain and nervous system |
| CN106537145B (en) * | 2014-04-08 | 2020-08-25 | 麦特博隆股份有限公司 | Small molecule biochemical profiling of individual subjects for disease diagnosis and health assessment |
| US9176113B1 (en) | 2014-04-11 | 2015-11-03 | Synapdx Corporation | Methods and systems for determining autism spectrum disorder risk |
| US20150294081A1 (en) | 2014-04-11 | 2015-10-15 | Synapdx Corporation | Methods and systems for determining autism spectrum disorder risk |
| KR20170086492A (en) | 2014-10-30 | 2017-07-26 | 캘리포니아 인스티튜트 오브 테크놀로지 | Compositions and methods comprising bacteria for improving behavior in neurodevelopmental disorders |
| AU2015339290B8 (en) | 2014-10-30 | 2021-08-26 | California Institute Of Technology | Compositions and methods comprising bacteria for improving behavior in neurodevelopmental disorders |
| EP3264989B1 (en) * | 2015-03-06 | 2023-12-20 | Micromass UK Limited | Spectrometric analysis |
| GB2554206B (en) | 2015-03-06 | 2021-03-24 | Micromass Ltd | Spectrometric analysis of microbes |
| WO2016142674A1 (en) | 2015-03-06 | 2016-09-15 | Micromass Uk Limited | Cell population analysis |
| JP6421742B2 (en) | 2015-11-27 | 2018-11-14 | 株式会社デンソー | Vehicle control device |
| US11454611B2 (en) | 2016-04-14 | 2022-09-27 | Micromass Uk Limited | Spectrometric analysis of plants |
| CN109642904A (en) | 2016-05-23 | 2019-04-16 | 加州理工学院 | Intestines micropopulation is adjusted to treat Neurodegenerative conditions |
| CN107064340A (en) * | 2017-03-13 | 2017-08-18 | 瀚盟测试科技(天津)有限公司 | A kind of method of GABA content in detection tealeaves |
| US11147792B2 (en) | 2017-05-15 | 2021-10-19 | Axial Therapeutics, Inc. | Inhibitors of microbially induced amyloid |
| GB201802116D0 (en) | 2018-02-09 | 2018-03-28 | Univ Warwick | Methods for diagnosing an autistic spectrum disorder |
| CN109030665A (en) * | 2018-10-08 | 2018-12-18 | 黑龙江大学 | The detection method of beet alkali content in hydrophilic liquid phase chromatographic tandem mass spectrometric determination red beet |
| US20220003753A1 (en) | 2018-11-06 | 2022-01-06 | Stalicla Sa | Metabolic profiling for the diagnosis of a subset of idiopathic autism spectrum disorder patients, ads phenotype 1 |
| EP4012414A1 (en) | 2020-12-11 | 2022-06-15 | Stalicla S.A. | Diagnosis of autism spectrum disorder phenotype 1 |
| CN113960200B (en) * | 2021-10-19 | 2023-06-20 | 首都医科大学附属北京儿童医院 | Use of metabolic markers for diagnosing ADHD combined tic disorders in children |
| CN114705775B (en) * | 2022-03-31 | 2023-09-12 | 广东省结核病控制中心 | Serum metabolism marker for pulmonary tuberculosis evaluation and application thereof |
| CN115326953A (en) * | 2022-08-02 | 2022-11-11 | 云谱康(大连)生物科技有限公司 | Metabolite combination and application, detection kit and application |
Family Cites Families (10)
| Publication number | Priority date | Publication date | Assignee | Title |
|---|---|---|---|---|
| US5686311A (en) * | 1995-06-23 | 1997-11-11 | The Children's Mercy Hospital | Diagnosis of autism and treatment therefor |
| CA2273683A1 (en) * | 1998-06-15 | 1999-12-15 | Ortho-Clinical Diagnostics, Inc. | Diagnostic markers for human disorders |
| JP2006526140A (en) | 2002-12-24 | 2006-11-16 | バイオサイト インコーポレイテッド | Marker for differential diagnosis and method of using the same |
| GB0504096D0 (en) * | 2005-02-28 | 2005-04-06 | Tipogen As | Method |
| US7604948B2 (en) | 2005-05-05 | 2009-10-20 | The Regents Of The University Of California | Biomarkers for diagnosing an autism spectrum disorder |
| WO2007120699A2 (en) * | 2006-04-10 | 2007-10-25 | Wisconsin Alumni Research Foundation | Reagents and methods for using human embryonic stem cells to evaluate toxicity of pharmaceutical compounds & other chemicals |
| WO2008021515A2 (en) | 2006-08-18 | 2008-02-21 | Huntington Medical Research Institutes | Methods of determining levels of free amino acids and dipeptides and diagnosing alzheimer's diseases |
| WO2009012595A1 (en) * | 2007-07-26 | 2009-01-29 | Phenomenome Discoveries Inc. | Methods for the diagnosis, risk assessment, and monitoring of autism spectrum disorders |
| WO2009043178A1 (en) * | 2007-10-04 | 2009-04-09 | The Hospital For Sick Children | Biomarkers for autism spectrum disorders |
| EP2279417B1 (en) | 2008-05-28 | 2016-07-20 | Georgia Tech Research Corporation | Metabolic biomarkers for ovarian cancer and methods of use thereof |
-
2011
- 2011-04-29 WO PCT/US2011/034654 patent/WO2011139914A1/en active Application Filing
- 2011-04-29 JP JP2013508294A patent/JP6021187B2/en active Active
- 2011-04-29 AU AU2011248464A patent/AU2011248464B2/en active Active
- 2011-04-29 EP EP11721395.9A patent/EP2564194B1/en active Active
- 2011-04-29 CA CA2797787A patent/CA2797787C/en active Active
- 2011-04-29 US US13/098,249 patent/US9547013B2/en active Active
-
2015
- 2015-09-28 JP JP2015189529A patent/JP2015231392A/en active Pending
-
2016
- 2016-07-15 AU AU2016204969A patent/AU2016204969B2/en active Active
- 2016-12-07 US US15/371,692 patent/US10330688B2/en active Active
Also Published As
| Publication number | Publication date |
|---|---|
| US10330688B2 (en) | 2019-06-25 |
| JP2015231392A (en) | 2015-12-24 |
| CA2797787C (en) | 2019-07-09 |
| US9547013B2 (en) | 2017-01-17 |
| WO2011139914A1 (en) | 2011-11-10 |
| AU2011248464B2 (en) | 2016-08-11 |
| JP2013525801A (en) | 2013-06-20 |
| US20170192019A1 (en) | 2017-07-06 |
| EP2564194A1 (en) | 2013-03-06 |
| EP2564194B1 (en) | 2019-07-10 |
| CA2797787A1 (en) | 2011-11-10 |
| AU2011248464A1 (en) | 2012-11-22 |
| US20120190055A1 (en) | 2012-07-26 |
| AU2016204969B2 (en) | 2018-05-17 |
| AU2016204969A1 (en) | 2016-08-04 |
Similar Documents
| Publication | Publication Date | Title |
|---|---|---|
| JP6021187B2 (en) | Metabolic biomarkers of autism | |
| Roede et al. | Serum metabolomics of slow vs. rapid motor progression Parkinson’s disease: a pilot study | |
| Zhao | Metabolomics in chronic kidney disease | |
| Czech et al. | Metabolite profiling of Alzheimer's disease cerebrospinal fluid | |
| CN105209909B (en) | Biomarker relevant to renal function and its application method | |
| JP6873490B2 (en) | Treatment of diabetes-related biomarkers and diabetes-related conditions | |
| JP6763770B2 (en) | Biomarker for autism spectrum disorders | |
| Taylor et al. | A metabolomics approach using juvenile cystic mice to identify urinary biomarkers and altered pathways in polycystic kidney disease | |
| German et al. | Serum biomarkers for Alzheimer's disease: proteomic discovery | |
| US20140165700A1 (en) | Method of diagnosing on increased risk of alzheimer's disease | |
| US20210325409A1 (en) | Biomarkers and uses thereof for diagnosing the silent phase of alzheimer's disease | |
| US20150212098A1 (en) | Diagnostic assay for alzheimer's disease | |
| JP2019168319A (en) | Marker for metabolite in urine for inspecting childhood cancer | |
| Cui et al. | Salivary metabolomics reveals that metabolic alterations precede the onset of schizophrenia | |
| Yang et al. | Serum metabolic profiling study of endometriosis by using wooden-tip electrospray ionization mass spectrometry | |
| EP3401683A1 (en) | Diagnosing metabolic disease by the use of a biomarker | |
| Troisi et al. | Metabolomics in Parkinson's disease | |
| LeWitt et al. | Diagnostic metabolomic profiling of Parkinson's disease biospecimens | |
| CN109946411B (en) | Biomarker for diagnosis of ossification of yellow ligament of thoracic vertebra and screening method thereof | |
| WO2016187317A1 (en) | Metabolic biomarkers for memory loss | |
| CN109946467B (en) | Biomarker for ossification diagnosis of thoracic vertebra ligamentum flavum | |
| EP3149473A2 (en) | Metabolic biomarkers for memory loss | |
| CN115754260A (en) | Alzheimer's disease fecal metabolism marker and screening method and application thereof | |
| WO2024189238A1 (en) | Biomarkers discriminating phenotypes of x-adrenoleukodystrophy | |
| CA2875331A1 (en) | Methods for diagnosing chronic valvular disease |
Legal Events
| Date | Code | Title | Description |
|---|---|---|---|
| A521 | Request for written amendment filed |
Free format text: JAPANESE INTERMEDIATE CODE: A523 Effective date: 20140403 |
|
| A621 | Written request for application examination |
Free format text: JAPANESE INTERMEDIATE CODE: A621 Effective date: 20140403 |
|
| A131 | Notification of reasons for refusal |
Free format text: JAPANESE INTERMEDIATE CODE: A131 Effective date: 20150327 |
|
| A601 | Written request for extension of time |
Free format text: JAPANESE INTERMEDIATE CODE: A601 Effective date: 20150626 |
|
| A601 | Written request for extension of time |
Free format text: JAPANESE INTERMEDIATE CODE: A601 Effective date: 20150724 |
|
| A601 | Written request for extension of time |
Free format text: JAPANESE INTERMEDIATE CODE: A601 Effective date: 20150826 |
|
| A521 | Request for written amendment filed |
Free format text: JAPANESE INTERMEDIATE CODE: A523 Effective date: 20150928 |
|
| A131 | Notification of reasons for refusal |
Free format text: JAPANESE INTERMEDIATE CODE: A131 Effective date: 20160224 |
|
| A601 | Written request for extension of time |
Free format text: JAPANESE INTERMEDIATE CODE: A601 Effective date: 20160523 |
|
| A601 | Written request for extension of time |
Free format text: JAPANESE INTERMEDIATE CODE: A601 Effective date: 20160720 |
|
| A521 | Request for written amendment filed |
Free format text: JAPANESE INTERMEDIATE CODE: A523 Effective date: 20160810 |
|
| TRDD | Decision of grant or rejection written | ||
| A01 | Written decision to grant a patent or to grant a registration (utility model) |
Free format text: JAPANESE INTERMEDIATE CODE: A01 Effective date: 20160928 |
|
| A61 | First payment of annual fees (during grant procedure) |
Free format text: JAPANESE INTERMEDIATE CODE: A61 Effective date: 20160929 |
|
| R150 | Certificate of patent or registration of utility model |
Ref document number: 6021187 Country of ref document: JP Free format text: JAPANESE INTERMEDIATE CODE: R150 |
|
| R250 | Receipt of annual fees |
Free format text: JAPANESE INTERMEDIATE CODE: R250 |
|
| R250 | Receipt of annual fees |
Free format text: JAPANESE INTERMEDIATE CODE: R250 |
|
| R250 | Receipt of annual fees |
Free format text: JAPANESE INTERMEDIATE CODE: R250 |
|
| R250 | Receipt of annual fees |
Free format text: JAPANESE INTERMEDIATE CODE: R250 |
|
| R250 | Receipt of annual fees |
Free format text: JAPANESE INTERMEDIATE CODE: R250 |