JP5810717B2 - Graph function display device and program - Google Patents
Graph function display device and program Download PDFInfo
- Publication number
- JP5810717B2 JP5810717B2 JP2011167658A JP2011167658A JP5810717B2 JP 5810717 B2 JP5810717 B2 JP 5810717B2 JP 2011167658 A JP2011167658 A JP 2011167658A JP 2011167658 A JP2011167658 A JP 2011167658A JP 5810717 B2 JP5810717 B2 JP 5810717B2
- Authority
- JP
- Japan
- Prior art keywords
- graph
- image
- displayed
- coordinate
- composite image
- Prior art date
- Legal status (The legal status is an assumption and is not a legal conclusion. Google has not performed a legal analysis and makes no representation as to the accuracy of the status listed.)
- Active
Links
Images


Landscapes
- Image Generation (AREA)
- Calculators And Similar Devices (AREA)
- Processing Or Creating Images (AREA)
Description
本発明は、例えば撮影画像に含まれる動体の軌跡をグラフに表して学習するためのグラフ関数表示装置およびその制御プログラムに関する。 The present invention relates to, for example, a graph function display device for learning by representing a trajectory of a moving object included in a photographed image in a graph and a control program thereof.
任意の関数式をグラフ化して表示するグラフ関数電卓なる電子式計算機が広く実用されている。 2. Description of the Related Art Electronic calculators, which are graph scientific calculators that display arbitrary function expressions in a graph, are widely used.
従来のグラフ関数電卓において、動体の画像データおよび当該動体の軌跡の測定データを入力すると、測定データに対応したグラフを描画するのと共に、描画されたグラフに対応した測定データと画像データとを並べて表示させることで、グラフと実際の現象とをより関連付けて視覚化するものが考えられている(例えば、特許文献1参照。)。 In a conventional graph scientific calculator, when image data of a moving object and measurement data of the trajectory of the moving object are input, a graph corresponding to the measurement data is drawn and the measurement data and image data corresponding to the drawn graph are arranged side by side. By displaying the graph, it is conceivable to visualize the graph in association with the actual phenomenon (see, for example, Patent Document 1).
従来のグラフ関数電卓によれば、動体の軌跡の画像データに当該動体軌跡に対応したグラフを重ねて表示させることが考えられる。 According to the conventional graph scientific calculator, it is conceivable to display a graph corresponding to the moving object trajectory on the image data of the moving object trajectory.
この場合、グラフを重ねた画像データについて、適当な値の一定間隔の仮想目盛を付加し、概念的なグラフの学習をすることはできるものの、実測値等に基づく現実の座標も容易に連携させてグラフの学習をすることはできない。 In this case, although it is possible to learn a conceptual graph by adding virtual scales of appropriate values at regular intervals to the image data on which the graphs are superimposed, the actual coordinates based on the actual measurement values etc. can be easily linked. You cannot learn graphs.
本発明は、このような課題に鑑みなされたもので、動体の画像に対応したグラフを重ねて表示した際に、概念的な目盛に応じたグラフと現実的な目盛に応じたグラフとを容易に連携させて学習することが可能になるグラフ関数表示装置およびその制御プログラムを提供することを目的とする。 The present invention has been made in view of such problems. When a graph corresponding to an image of a moving object is displayed in an overlapping manner, a graph corresponding to a conceptual scale and a graph corresponding to a realistic scale can be easily obtained. An object of the present invention is to provide a graph function display device and a control program for the same that can be learned in cooperation with each other.
本発明に係るグラフ関数表示装置は、連続撮影した複数の画像の合成画像を対象に前記連続撮影の撮影間隔で含まれる移動物体の位置に対応させて当該移動物体の移動方向の座標軸に対する基準目盛を設定する基準目盛設定手段と、前記撮影間隔に対応した実測値を取得する実測値取得手段と、前記合成画像を表示部に表示させると共に、当該合成画像に重ねて同合成画像に含まれる移動物体の移動の軌跡に応じたグラフを表示させるグラフ画像合成表示手段と、このグラフ画像合成表示手段により表示されたグラフに関する座標値を前記基準目盛設定手段により設定された基準目盛に応じた座標値で表示する基準座標値表示手段と、この基準座標値表示手段により表示された基準目盛に応じた座標値を前記実測値取得手段により取得された実測値に基づき換算した座標値で表示する実測座標値表示手段と、
を備え、前記基準目盛設定手段は、前記移動物体の位置がほぼ等しい間隔であると判定された場合に、当該移動物体の移動方向の座標軸に対する基準目盛を前記間隔に設定する、ことを特徴としている。
The graph function display device according to the present invention relates to a reference scale with respect to a coordinate axis of a moving direction of a moving object corresponding to a position of the moving object included in the continuous shooting interval for a composite image of a plurality of continuously shot images. a reference scale setting means for setting a, the measured value obtaining means for obtaining a measured value corresponding to the shooting distance, the displays the synthesis image on the display unit, included to overlap the composite image in the composite image Graph image composition display means for displaying a graph corresponding to the trajectory of movement of the moving object, and coordinates corresponding to the reference scale set by the reference scale setting means for the coordinate values related to the graph displayed by the graph image composition display means Reference coordinate value display means for displaying values, and coordinate values corresponding to the reference scale displayed by the reference coordinate value display means are acquired by the actual measurement value acquisition means. The measured coordinate value display means for displaying in terms of coordinate values on the basis of the measured values,
The reference scale setting means sets the reference scale for the coordinate axis in the moving direction of the moving object to the interval when it is determined that the positions of the moving objects are substantially equal intervals. Yes.
本発明によれば、動体の画像に対応したグラフを重ねて表示した際に、概念的な目盛に応じたグラフと現実的な目盛に応じたグラフとを容易に連携させて学習することが可能になるグラフ関数表示装置およびその制御プログラムを提供できる。 According to the present invention, when a graph corresponding to an image of a moving object is overlaid and displayed, a graph corresponding to a conceptual scale and a graph corresponding to a realistic scale can be easily linked and learned. The graph function display device and its control program can be provided.
以下図面により本発明の実施の形態について説明する。 Embodiments of the present invention will be described below with reference to the drawings.
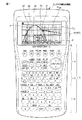
図1は、本発明のグラフ関数表示装置の実施形態に係るグラフ関数電卓10の外観構成を示す平面図である。
FIG. 1 is a plan view showing an external configuration of a graph
このグラフ関数電卓10は、その携帯性の必要からユーザが片手で十分把持し片手で操作可能な小型サイズからなり、このグラフ関数電卓10の本体正面にはキー入力部11およびカラー表示部16が設けられる。
The graph
キー入力部11には、数字や数式を入力したり計算の実行を指示したりするための数字・演算記号キー群12、各種の関数を入力するための関数機能キー群13、各種動作モードのメニュー画面を表示させたり動作モードの設定を指示したりするためのモード設定キー群14、カラー表示部16に表示されたカーソルの移動操作やデータ項目の選択操作などを行うためのカーソルキー15、キーパネル上にプリントされているかカラー表示部16の下端に沿ってメニュー表示される各種の機能を選択的に指定するためのファンクションキー「F1」〜「F6」が備えられる。
The
前記数字・演算記号キー群12としては、「0」〜「9」(数字)キーおよび「+」「−」「×」「÷」(演算記号)キー12a、「EXE」(実行)キー12b、「AC」(クリア)キー12cなどが配列される。
The numeric / arithmetic
前記関数機能キー群13としては、「log」(対数)キー、「sin」(サイン)キー、「ab/c」(分数)キーなどが配列される。
As the function
前記モード設定キー群14としては、「MENU」(メニュー)キー、「SHIFT」(シフト)キー、「OPTN」(オプション)キー、「EXIT」(終了)キーなどが配列される。
As the mode setting
なお、前記各キーの上縁に沿ったキーパネル上には、入力可能な文字、記号、関数、機能がプリントされており、モード設定キー群14にある「SHIFT」(シフト)キーと該当する各キーとの組合せにより入力できる。
Note that characters, symbols, functions, and functions that can be entered are printed on the key panel along the upper edge of each key, which corresponds to the “SHIFT” key in the mode
例えば「F6」(ファンクション)キーは、「SHIFT」(シフト)キーとの組合せにより「G←→T」キーとして機能し、グラフ式一覧画面Gt(図9(F)参照)とグラフ画像合成画面Gy1/Gbas(図9(G)参照)との切り替えを指示できる。 For example, the “F6” (function) key functions as a “G ← → T” key in combination with the “SHIFT” key, and displays a graph list screen Gt (see FIG. 9F) and a graph image composition screen. Switching to Gy1 / Gbas (see FIG. 9G) can be instructed.
また、「MENU」(メニュー)キーは、「SHIFT」(シフト)キーとの組合せにより「SET UP」キーとして機能し、グラフ表示設定画面Gset(図8(A)参照)への切り替えを指示できる。 The “MENU” key functions as a “SET UP” key in combination with the “SHIFT” key, and can be switched to the graph display setting screen Gset (see FIG. 8A). .
前記カラー表示部16は、ドットマトリクス型のカラー液晶表示ユニットからなり、その表示画面上には、当該画面のタッチ位置を検出するための透明タブレットのタッチパネル16Tが重ねて設けられる。
The
このグラフ関数電卓10は、移動体の連続撮影により取得された合成画像を背景にその撮影間隔に基づき設定された座標レンジに従った移動体軌跡に対応するグラフを重ねてなるグラフ画像合成画面Gy1/Gbasをカラー表示部16に表示させる機能を有する。そして、前記グラフ画像合成画面Gy1/Gbasに対して、前記連続撮影間隔に基づき設定された基準の座標レンジと実測値に基づき換算された実座標レンジとを、それぞれ異なる表示色で識別表示させる機能を有する。
The graph
図2は、前記グラフ関数電卓10の電子回路の構成を示すブロック図である。
FIG. 2 is a block diagram showing the configuration of the electronic circuit of the graph
このグラフ関数電卓10は、コンピュータであるプロセッサ(CPU)21を備えている。
The graph
プロセッサ(CPU)21は、記憶部(フラッシュROM)22に予め記憶されているグラフ関数表示処理プログラム22a、あるいはメモリカードなどの外部記録媒体23から記録媒体読取部24を介して記憶部22に読み込まれたグラフ関数表示処理プログラム22a、あるいはインターネットなど、通信ネットワーク上のWebサーバ(プログラムサーバ)から外部PC30を経由してPC通信部25によりダウンロードされ前記記憶部22に読み込まれたグラフ関数表示処理プログラム22aに従い回路各部の動作を制御する。そして、前記記憶部22に記憶されたグラフ関数表示処理プログラム22aは、キー入力部11からのキー入力信号やタッチパネル16Tからのタッチ位置検出信号に応じて起動される。
The processor (CPU) 21 reads the graph function
前記プロセッサ(CPU)21には、前記記憶部22、記録媒体読取部24、PC通信部25、キー入力部11、カラー表示部(LCD)16、タッチパネル16Tが接続される。
The processor (CPU) 21 is connected to the
前記記憶部(フラッシュROM)22に記憶されるグラフ関数表示処理プログラム22aとしては、キー入力部11によりユーザ入力される任意の演算式に応じた演算処理を実行するための演算処理プログラム、同ユーザ入力される任意の関数式に応じたグラフ描画処理を実行するためのグラフ描画処理プログラム、連続撮影された合成画像内の移動体軌跡と連続撮影間隔に基づき設定された基準の座標レンジに従ったグラフとの関係を基準座標値や実測座標値にして表示させるための移動体解析グラフ表示処理プログラムなどが記憶される。
The graph function
そして、前記記憶部22には、さらに、グラフ式データ記憶部22b、V-Window設定値記憶部22c、画像&座標範囲ファイル記憶部22d、およびワークエリア22eが備えられる。
The
グラフ式データ記憶部22bには、ユーザ操作に応じて入力されたグラフ式や画像解析に基づき計算されたグラフ式Y1,Y2,…のデータが記憶される。
The graph formula
V-Window設定値記憶部22cには、カラー表示部16にグラフを表示する際の座標レンジ(Xmin〜Xmax,Ymin〜Ymax)およびそのスケール値が記憶される。
The V-Window set
画像&座標範囲ファイル記憶部22dには、後述の外部PC30により生成された画像&座標範囲ファイルが受信されて記憶される。
The image & coordinate range
図3は、前記グラフ関数電卓10の画像&座標範囲ファイル記憶部22dに記憶される画像&座標範囲ファイルの内容を示す図である。
FIG. 3 is a diagram showing the contents of the image & coordinate range file stored in the image & coordinate range
この画像&座標範囲ファイルには、連写撮影または単撮影された画像データ(連写画像の場合はその合成画像)、連写撮影時間間隔Δt、画像データに含まれる移動体画像に基づいた一定間隔のXY座標に対応した基準のX座標レンジXSmin〜XSmaxとY座標レンジYSmin〜YSmax、前記基準のXY座標レンジに付加されたXスケール値とYスケール値、1スケールあたりの実測値、前記基準のXY座標レンジに従い解析された前記移動体画像の位置に対応する座標リストが、ファイル名に対応付けられて格納される。 In this image & coordinate range file, continuous shooting or single shooting image data (a combined image in the case of continuous shooting images), continuous shooting time interval Δt, and a fixed object based on a moving body image included in the image data. Reference X coordinate range XSmin to XSmax and Y coordinate range YSmin to YSmax corresponding to the XY coordinate of the interval, X scale value and Y scale value added to the reference XY coordinate range, measured value per scale, reference A coordinate list corresponding to the position of the moving object image analyzed according to the XY coordinate range is stored in association with the file name.
このように構成されたグラフ関数電卓10は、プロセッサ(CPU)21が前記グラフ関数表示処理プログラム22aに記述された命令に従い回路各部の動作を制御し、ソフトウエアとハードウエアとが協働して動作することにより、後述の動作説明で述べる機能を実現する。
In the graph
本実施形態において、前記画像&座標範囲ファイル記憶部22dに記憶される画像&座標範囲ファイルは、図示しないデジタルカメラにより撮影した画像データを外部PC30により解析して生成した後に、このグラフ関数電卓10に取り込んで記憶するが、後述する外部PC30での画像座標範囲設定処理(図5参照)を本グラフ関数電卓10により実行することで、同画像&座標範囲ファイルを当該電卓10にて生成し記憶してもよい。
In the present embodiment, the image & coordinate range file stored in the image & coordinate range
また、外部PC30に本グラフ関数電卓10のエミュレータを搭載して、外部PC30で生成した画像&座標範囲ファイルを外部PC30上のエミュレータに取り込んで実行するようにしても良い。これによって外部PCで最終的に本グラフ関数電卓で表示されるグラフ画像を外部PC30上でただちに確認できるようになる。
Alternatively, the emulator of the graph
図4は、前記グラフ関数電卓10の画像&座標範囲ファイル記憶部22dに記憶される画像&座標範囲ファイルの生成機能を有する外部PC30の電子回路の構成を示すブロック図である。
FIG. 4 is a block diagram showing a configuration of an electronic circuit of the
この外部PC30は、コンピュータであるプロセッサ(CPU)31を備えている。
The
プロセッサ(CPU)31は、記憶部(フラッシュROM)32に予め記憶されているPC制御プログラム、あるいはCD−ROMなどの外部記録媒体33から記録媒体読取部34を介して記憶部32に読み込まれたPC制御プログラム、あるいはインターネットなど、通信ネットワーク上のWebサーバ(プログラムサーバ)から外部機器通信部35によりダウンロードされ前記記憶部32に読み込まれたPC制御プログラムに従い回路各部の動作を制御する。そして、前記記憶部32に記憶されたPC制御プログラムは、キー入力部36からのキー入力信号に応じて起動される。
The processor (CPU) 31 is read into the
前記プロセッサ(CPU)31には、前記記憶部32、記録媒体読取部34、外部機器通信部35、キー入力部36、カラー表示部(LCD)37が接続される。
The processor (CPU) 31 is connected to the
前記記憶部(フラッシュROM)32に記憶されるPC制御プログラムとしては、Webブラウザプログラムや画像処理プログラムなどの各種アプリケーションプログラムの他、例えば連写撮影された画像データの合成画像を基にして前記画像&座標範囲ファイル(22d)(図3参照)を生成するための画像座標範囲設定処理プログラム32aなどが記憶される。
As the PC control program stored in the storage unit (flash ROM) 32, in addition to various application programs such as a Web browser program and an image processing program, for example, the image is based on a composite image of continuously shot image data. The image coordinate range
そして、前記記憶部32には、さらに、表示データ記憶部32b、画像ファイル記憶部32c、移動物体座標リスト記憶部32d、座標範囲基準値記憶部32e、画像&座標範囲ファイル記憶部32f、およびワークエリア32gが備えられる。
The
表示データ記憶部32bには、カラー表示部37に表示すべき被表示データがビットマップ形式のデータとして記憶される。
In the display
画像ファイル記憶部32cには、図示しないデジタルカメラにより例えば移動物体を連写撮影した画像データがそのファイル名A,B,…に対応付けられて複数組記憶される。 In the image file storage unit 32c, for example, a plurality of sets of image data obtained by continuously shooting moving objects with a digital camera (not shown) are stored in association with the file names A, B,.
移動物体座標リスト記憶部32dには、前記画像ファイル記憶部32cから選択的に読み出された連写撮影画像の合成画像を基にして、基準のXY座標レンジに従い解析された前記移動物体に対応するxy座標リストが生成されて記憶される。
The moving object coordinate
座標範囲基準値記憶部32eには、前記画像ファイル記憶部32cから選択的に読み出された連写撮影画像の合成画像において、当該合成画像に含まれる移動体画像に基づき生成された一定間隔の基準座標に応じたX座標レンジとY座標レンジとが記憶される。
The coordinate range reference
画像&座標範囲ファイル記憶部32fには、前記画像ファイル記憶部32cから選択的に読み出された連写撮影画像の合成画像を基にして生成された画像&座標範囲ファイル(22d)(図3参照)が記憶される。
In the image & coordinate range
このように構成された外部PC30は、プロセッサ(CPU)31が前記画像座標範囲設定処理プログラム32aに記述された命令に従い回路各部の動作を制御し、ソフトウエアとハードウエアとが協働して動作することにより、以下の動作説明で述べる機能を実現する。
In the
次に、前記構成のグラフ関数電卓10および外部PC30の動作について説明する。
Next, operations of the graph
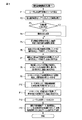
図5は、前記外部PC30による画像座標範囲設定処理を示すフローチャートである。
FIG. 5 is a flowchart showing image coordinate range setting processing by the
図6は、前記外部PC30の画像座標範囲設定処理に伴う表示動作の具体例を示す図である。
FIG. 6 is a diagram showing a specific example of the display operation associated with the image coordinate range setting process of the
外部PC30の画像ファイル記憶部32cには、図示しないデジタルカメラにより例えば移動物体を被写体として連写撮影された複数組の画像ファイルA,B,…が記憶されている。各画像ファイルA,B,…には、当該画像ファイルと共にその連写撮影の時間間隔Δtがデジタルカメラから取り込まれて対応付けられている。
The image file storage unit 32c of the
先ず、画像座標範囲設定処理プログラム32aが起動されると、前記画像ファイル記憶部32cに記憶されている各画像ファイルのファイル名を一覧にしたファイル選択画面が表示部37に表示される。
First, when the image coordinate range
このファイル選択画面において、ユーザ任意の画像ファイルが指定されると(ステップP1)、例えば図6(A)に示すように、指定された画像ファイルに含まれる連写画像Pict1,2,3,…,nがレイヤ合成された合成画像Gbasがカラー表示部37に表示される(ステップP2)。 When an arbitrary image file is designated on the file selection screen (step P1), for example, as shown in FIG. 6A, continuous shot images Pict1, 2, 3,... Included in the designated image file. , n are combined in layers, and the combined image Gbas is displayed on the color display unit 37 (step P2).
本実施形態では、バスケットボールのフリーシュートに伴いそのボールの移動軌跡b1〜b7を連写撮影した合成画像Gbasが生成されて表示される。この際、前記合成画像Gbasの下の空きエリアには、該当の画像ファイルに対応付けられた連写間隔Δt=0.2sが表示されると共に、実測値入力エリアΔx=[ ]が表示される。 In the present embodiment, a composite image Gbas obtained by continuously shooting the movement trajectories b1 to b7 of the ball is generated and displayed with the free shot of the basketball. At this time, the continuous shooting interval Δt = 0.2 s associated with the corresponding image file is displayed in the empty area below the composite image Gbas, and the actual measurement value input area Δx = [] is displayed. .
ここで、カラー表示部37に表示された合成画像Gbasについて、所望の画像範囲を切り出したい場合には(ステップP3(Yes))、ユーザ操作に応じた任意の矩形範囲の画像が切り出されて再表示される(ステップP4)。
Here, with respect to the composite image Gbas displayed on the
すると、表示中の画像ファイルに対応付けられた連写間隔Δt=0.2sとその連写された移動物体(ボール:b1,b2,…,b7)の各認識位置を基に、当該各移動物体(ボール:b1,b2,…,b7)の位置が略等間隔であると判定し、合成画像Gbas上に横方向(物体移動方向)の目盛を等間隔に設定するための補助線h1〜h7が赤色で描画される(ステップP5)。 Then, based on the continuous shooting interval Δt = 0.2 s associated with the image file being displayed and the respective recognized positions of the continuously shot moving objects (balls: b1, b2,..., B7), It is determined that the positions of the objects (balls: b1, b2,..., B7) are substantially equidistant, and auxiliary lines h1 to h1 for setting the scales in the horizontal direction (object moving direction) at equal intervals on the composite image Gbas. h7 is drawn in red (step P5).
また、表示中の合成画像Gbasに含まれる地面や床面等の水平線が認識され、この認識された水平線をY=0とするX軸が青色で表示される(ステップP6)。なお、このX軸の設定位置(Y=0)は、ユーザ操作に応じて上下の任意の位置に移動して修正可能である。 Further, a horizontal line such as a ground surface or a floor surface included in the displayed composite image Gbas is recognized, and an X axis in which the recognized horizontal line is Y = 0 is displayed in blue (step P6). Note that the X-axis setting position (Y = 0) can be corrected by moving to an arbitrary vertical position in accordance with a user operation.
さらに、表示中の合成画像Gbasに含まれる各移動物体(ボール:b1,b2,…,b7)のうち最も左の移動物体b1が認識され、この認識された移動物体b1の位置をX=0とするY軸が青色で表示される(ステップP7)。なお、このY軸の設定位置(X=0)は、ユーザ操作に応じて左右の任意の位置に移動して修正可能である。 Furthermore, among the moving objects (balls: b1, b2,..., B7) included in the displayed composite image Gbas, the leftmost moving object b1 is recognized, and the position of the recognized moving object b1 is set to X = 0. Is displayed in blue (step P7). Note that the Y-axis setting position (X = 0) can be corrected by moving to an arbitrary position on the left and right in accordance with a user operation.
すると、前記X軸を分割する前記補助線h1〜h7の各位置を当該X軸の基準の目盛0〜6とし、この基準の目盛0〜6に基づき換算されたX座標レンジ(XSmin=−3.6666〜XSmax=17.3328)とY座標レンジ(YSmin=−0.4722〜YSmax=4.694)とが赤色で表示される(ステップP8)。 Then, the positions of the auxiliary lines h1 to h7 that divide the X axis are set as the reference scales 0 to 6 of the X axis, and the X coordinate range (XSmin = −3) converted based on the reference scales 0 to 6 is used. .6666 to XSmax = 17.3328) and the Y coordinate range (YSmin = −0.4722 to YSmax = 4.694) are displayed in red (step P8).
ここで、前記表示中の合成画像Gbasにおける基準のXY座標レンジに基づいて、各移動物体b1〜b7のxy座標(x1,y1)(x2,y2)…(x7,y7)が検出されてリスト化され、移動物体座標リスト記憶部32dに記憶される(ステップP9)。
Here, the xy coordinates (x1, y1) (x2, y2)... (X7, y7) of the respective moving objects b1 to b7 are detected based on the reference XY coordinate range in the displayed composite image Gbas. And stored in the moving object coordinate
そして、図6(B)に示すように、合成画像Gbasの下の空きエリアに表示された実測値入力エリアΔx=[ ]に対して、ユーザ操作に応じて前記補助線h1〜h7の1間隔に相当するX軸1目盛あたりの実測長さ[0.55m]入力される(ステップP10)。 Then, as shown in FIG. 6B, with respect to the measured value input area Δx = [] displayed in the empty area below the composite image Gbas, one interval between the auxiliary lines h1 to h7 according to the user operation. Is measured length [0.55 m] per one X-axis scale corresponding to (step P10).
すると、入力されたX軸1目盛あたりの実測値Δx=0.55mに基づき換算された実測X座標レンジ(XRmin=−2.02m〜XRmax=9.54m)と実測Y座標レンジ(YRmin=−0.26m〜YRmax=2.58m)とが青色で表示される(ステップP11)。 Then, the measured X-coordinate range (XRmin = −2.02 m to XRmax = 9.54 m) and the measured Y-coordinate range (YRmin = −Y) converted based on the inputted measured value Δx = 0.55 m per X axis scale. 0.26 m to YRmax = 2.58 m) is displayed in blue (step P11).
こうして、移動物体b1〜b7を連写撮影した画像ファイルの合成画像Gbasが表示されると共に、当該移動物体b1〜b7の一定連写間隔Δtに従い描画された補助線h1〜h7および補助線間実測長さΔxを基にして、基準XY座標レンジ(XSmin〜max,YSmin〜max)、実測XY座標レンジ(XRmin〜max,YRmin〜max)が換算表示された状態で、図6(C)に示すように、ファイル保存操作に応じてウインドウ表示される保存ファイル名入力エリアFに対して任意のファイル名「BASKET.g3m」が入力される(ステップP12)。 In this way, the composite image Gbas of the image file obtained by continuously shooting the moving objects b1 to b7 is displayed, and the auxiliary lines h1 to h7 drawn according to the constant continuous shooting interval Δt of the moving objects b1 to b7 and the measurement between the auxiliary lines. Based on the length Δx, the reference XY coordinate range (XSmin to max, YSmin to max) and the measured XY coordinate range (XRmin to max, YRmin to max) are converted and displayed as shown in FIG. As described above, an arbitrary file name “BASKET.g3m” is input to the saved file name input area F displayed in the window according to the file saving operation (step P12).
すると、表示中の合成画像Gbasに対して、前記連写時間間隔Δt=0.2s、前記基準XY座標レンジ(XSmin〜max,YSmin〜max)、前記実測XY座標レンジ(XRmin〜max,YRmin〜max)、前記基準目盛のスケール値“1”、前記実測値Δx=0.55mが付加され、該当する移動物体座標リスト(32d)と共に、前記入力されたファイル名「BASKET.g3m」に対応付けられて画像&座標範囲ファイル記憶部32f(図3参照)に保存される(ステップP13)。
Then, with respect to the composite image Gbas being displayed, the continuous shooting time interval Δt = 0.2 s, the reference XY coordinate range (XSmin to max, YSmin to max), and the actually measured XY coordinate range (XRmin to max, YRmin to max), the scale value “1” of the reference scale, and the actual measurement value Δx = 0.55 m are added and associated with the input file name “BASKET.g3m” together with the corresponding moving object coordinate list (32d). And stored in the image & coordinate range
こうして、外部PC30の画像&座標範囲ファイル記憶部32fに記憶された画像&座標範囲ファイルのデータは、外部機器通信部35を介してグラフ関数電卓10に転送され、当該グラフ関数電卓10の画像&座標範囲ファイル記憶部22d(図3参照)に記憶される。
Thus, the image & coordinate range file data stored in the image & coordinate range
図7は、前記グラフ関数電卓10によるグラフ関数表示処理を示すフローチャートである。
FIG. 7 is a flowchart showing graph function display processing by the graph
図8は、前記グラフ関数電卓10によるグラフ関数表示処理に伴う表示動作の具体例(その1)を示す図である。
FIG. 8 is a diagram showing a specific example (part 1) of the display operation associated with the graph function display process by the graph
図9は、前記グラフ関数電卓10によるグラフ関数表示処理に伴う表示動作の具体例(その2)を示す図である。
FIG. 9 is a diagram showing a specific example (part 2) of the display operation accompanying the graph function display process by the graph
図10は、前記グラフ関数電卓10によるグラフ関数表示処理に伴う表示動作の具体例(その3)を示す図である。
FIG. 10 is a diagram showing a specific example (part 3) of the display operation associated with the graph function display process by the graph
「Menu」キーの操作に応じてカラー表示部16に表示される動作モードの選択画面に従いグラフモードが選択されて設定される。さらに、「SHIFT」キー+「MENU」(SET UP)キーの操作に応じて、図8(A)に示すように、グラフモードの表示設定画面Gsetが表示された状態で、カーソルキー15の操作に応じて反転カーソルCuが移動され、背景画像の設定項目「Background」が選択されると共に「F3」キーの操作により[OPEN](背景画像開く)が指定される。すると、図8(B)に示すように、画像&座標範囲ファイル記憶部22d(図3参照)に記憶されているファイル名を一覧にした画像ファイル選択画面Gmが表示される。(ステップS1)。
The graph mode is selected and set according to the operation mode selection screen displayed on the
この画像ファイル選択画面Gmにおいて、例えばファイル名「BASKET.g3m」が反転カーソルCuにより指定され「EXE」キーが操作されると、当該指定のファイル名「BASKET.g3m」に対応付けられて画像&座標範囲ファイル記憶部22d(図3参照)に記憶成されている合成画像Gbasが読み出され、図8(C)に示すように、前記表示設定画面Gsetの背景画像として合成されて確認表示される(ステップS2)。
In this image file selection screen Gm, for example, when the file name “BASKET.g3m” is designated by the reverse cursor Cu and the “EXE” key is operated, an image & image associated with the designated file name “BASKET.g3m” is displayed. The composite image Gbas stored in the coordinate range
なお、図8(C)において、表示設定画面Gsetの背景画像として合成画像Gbasが実際に重なった表示画面Gset/Gbasは、図示すると複雑になり見難くなるため、ここでは同設定画面Gsetと同合成画像Gbasとを別々に図示している。以下同様である。 In FIG. 8C, the display screen Gset / Gbas in which the composite image Gbas is actually overlapped as the background image of the display setting screen Gset is complicated and difficult to see in the figure, so here it is the same as the setting screen Gset. The composite image Gbas is illustrated separately. The same applies hereinafter.
ここで、前記選択ファイル名「BASKET.g3m」に応じて確認表示された画像ファイルに対応付けられている座標範囲[基準XY座標レンジ(XSmin=−3.6666〜max=17.3328,YSmin=−0.4722〜max=4.694)]と基準目盛のスケール値“1”について、本電卓10本体のグラフ表示用に設定するか否かをユーザに促すメッセージが表示され、本体設定が指定されると(ステップS3(Yes))、当該画像ファイルの座標範囲とスケール値がV-Window設定値記憶部22cに記憶されて設定される(ステップS4)。
Here, the coordinate range [reference XY coordinate range (XSmin = −3.6666 to max = 17.3328, YSmin =) associated with the image file confirmed and displayed according to the selected file name “BASKET.g3m”. −0.4722−max = 4.694)] and the scale value “1” of the reference scale, a message prompting the user whether to set for the graph display of the main body of the
そして、「SHIFT」キー+「F3」(V-Window)キーの操作に応じてV-Window設定値の確認が指示されると(ステップS3a(Yes))、図8(D)(E)に示すように、前記V-Window設定値記憶部22cに記憶設定された座標範囲とスケール値が読み出され、V-Window設定画面Gv−wとして確認表示される(ステップS5)。
When the confirmation of the V-Window setting value is instructed in accordance with the operation of the “SHIFT” key + “F3” (V-Window) key (step S3a (Yes)), FIG. As shown, the coordinate range and scale value stored and set in the V-Window setting
この後、図9(F)に示すように、「EXIT」キーの操作に応じてV-Window設定画面Gv-wの確認表示状態が終了されると、前記選択された合成画像Gbasに対応付けられて画像&座標範囲ファイル記憶部22dに記憶されている当該合成画像Gbas内の移動物体b1〜b7に対応した座標リスト[(x1,y1)(x2,y2)…(x7,y7)]が読み出され、これに応じたグラフ式[Y1=−0.12(X−3)2+4.5]が算出されて式入力画面Gtに表示される(ステップS6)。なお、このグラフ式Y1は、前記合成画像Gbas内の移動物体b1〜b7の軌跡を参照し、ユーザ自身により入力してもよい。
Thereafter, as shown in FIG. 9F, when the confirmation display state of the V-Window setting screen Gv-w is ended according to the operation of the “EXIT” key, it is associated with the selected composite image Gbas. And a coordinate list [(x1, y1) (x2, y2)... (X7, y7)] corresponding to the moving objects b1 to b7 in the composite image Gbas stored in the image & coordinate range
そして、「SHIFT」キー+「F6」(G-T)キーの操作に応じて、前記グラフ式Y1に対応したグラフの描画表示が指示されると、前記V-Window設定値記憶部22cに記憶設定された座標範囲[基準XY座標レンジ(XSmin=−3.6666〜max=17.3328,YSmin=−0.4722〜max=4.694)]と基準目盛のスケール値“1”およびXY軸の有無、目盛数値の有無、グリッド線の有無の設定内容に従い、図9(G)に示すように、グラフY1を描画したグラフ画面Gy1が表示されると共に、前記合成画像Gbasが当該グラフ画面Gy1の背景に合成されて表示される(ステップS7)。
When the drawing display of the graph corresponding to the graph expression Y1 is instructed in accordance with the operation of the “SHIFT” key + “F6” (GT) key, the setting is stored in the V-Window setting
これにより、ユーザ所望の移動物体b1〜b7を連写撮影した合成画像Gbasと、その移動物体b1〜b7の軌跡に対応したグラフY1とを、当該移動物体b1〜b7の移動間隔(一定連写間隔)に応じた基準目盛値のXY座標上に重ねて表示することができる。 As a result, the composite image Gbas obtained by continuously shooting the user-desired moving objects b1 to b7 and the graph Y1 corresponding to the trajectory of the moving objects b1 to b7 are displayed as the movement interval (constant continuous shooting) of the moving objects b1 to b7. The reference scale value corresponding to the (interval) can be displayed on the XY coordinates.
なお、図9(G)において、グラフ画面Gy1の背景画像として合成画像Gbasが実際に重なったグラフ画像合成画面Gy1/Gbasは、図示すると複雑になり見難くなるため、ここでは同グラフ画面Gy1と同合成画像Gbasとを別々に図示している。以下同様である。 In FIG. 9G, the graph image composition screen Gy1 / Gbas in which the composite image Gbas is actually overlapped as the background image of the graph screen Gy1 is complicated and difficult to see. The composite image Gbas is separately illustrated. The same applies hereinafter.
このように、ユーザ所望の移動物体b1〜b7を連写撮影した合成画像Gbasと当該移動物体b1〜b7の軌跡に対応したグラフY1とが、基準のXY座標からなるグラフ画面Gy1上に重ね合わせ表示された状態で、図9(H)に示すように、「SHIFT」キー+「F1」(Trace)キーの操作に応じて、前記グラフY1に対するグラフトレースが指示されると(ステップS8(Yes))、トレースポインタPのX値が初期値(この場合はX=0)に設定される(ステップS9)。 In this manner, the composite image Gbas obtained by continuously shooting the moving objects b1 to b7 desired by the user and the graph Y1 corresponding to the trajectory of the moving objects b1 to b7 are superimposed on the graph screen Gy1 including the reference XY coordinates. In the displayed state, as shown in FIG. 9H, in response to the operation of the “SHIFT” key + “F1” (Trace) key, a graph trace for the graph Y1 is instructed (step S8 (Yes) )), The X value of the trace pointer P is set to an initial value (in this case, X = 0) (step S9).
すると、グラフY1上に前記X値の初期値X=0に対応したトレースポインタPが表示され、グラフ式[Y1=−0.12(X−3)2+4.5]がグラフ画面Gy1の上部に表示されると共に、当該トレースポインタPの初期のXY座標値(X=0,Y=3.42)および前記合成画像Gbasに対応付けられて画像&座標範囲ファイル記憶部22dに記憶されている実測長さΔx=0.55mに基づき換算された実測座標値(XR=0m.YR=1.881m)が同グラフ画面Gy1の下部に表示される(ステップS10)。
Then, the trace pointer P corresponding to the initial value X = 0 of the X value is displayed on the graph Y1, and the graph formula [Y1 = −0.12 (X−3) 2 +4.5] is displayed at the top of the graph screen Gy1. And is stored in the image & coordinate range
そして、図10(I)に示すように、カーソルキー15の操作により前記トレースポインタPの左「←」または右「→」への移動が指示されると(ステップS11(Yes))、当該ポインタ移動の指示毎に、トレースポインタPのX値がX方向所定ドット間隔Δx(=1〜3dot)分増減変更される(ステップS12)。
Then, as shown in FIG. 10I, when the
これにより、グラフY1上にX値変更後のトレースポインタPが表示されると共に、当該トレースポインタPの基準目盛に応じたXY座標値(X=3,Y=4.5)および前記実測長さΔx=0.55mに基づき換算された実測座標値(XR=1.65m.YR=2.475m)が更新されて表示される(ステップS10)。 Thereby, the trace pointer P after the X value change is displayed on the graph Y1, and the XY coordinate values (X = 3, Y = 4.5) corresponding to the reference scale of the trace pointer P and the actually measured length. The actually measured coordinate value (XR = 1.65 m. YR = 2.475 m) converted based on Δx = 0.55 m is updated and displayed (step S10).
また、例えば図10(J)に示すように、グラフY1上のトレースポインタPがXY座標値(X=0,Y=3.42)に位置する状態で、[傾き]を求める操作指示がされると(ステップS13(Yes))、現在のポインタPの座標位置(X=0,Y=3.42)でのグラフY1の傾きK[dx/dy=0.72]が計算されて表示されると共に、前記実測長さΔx=0.55mに基づき換算された傾き実測値[V=0.396m/s]も計算されて表示される(ステップS14)。 Also, for example, as shown in FIG. 10J, an operation instruction for obtaining [tilt] is made in a state where the trace pointer P on the graph Y1 is positioned at the XY coordinate values (X = 0, Y = 3.42). Then (step S13 (Yes)), the slope K [dx / dy = 0.72] of the graph Y1 at the current coordinate position of the pointer P (X = 0, Y = 3.42) is calculated and displayed. In addition, an actually measured inclination value [V = 0.396 m / s] converted based on the actually measured length Δx = 0.55 m is also calculated and displayed (step S14).
ここで、「EXIT」キーの操作に応じて処理の戻りが指示されると(ステップS15(Yes))、前記図9(G)で示したように、初期のグラフ画面Gy1の背景に合成画像Gbasが合成されて表示された状態に戻る(ステップS7)。 Here, when the return of processing is instructed according to the operation of the “EXIT” key (step S15 (Yes)), as shown in FIG. 9G, the composite image is displayed on the background of the initial graph screen Gy1. It returns to the state where Gbas is synthesized and displayed (step S7).
このグラフ画面Gy1の背景に合成画像Gbasを重ねたグラフ画像合成画面Gy1/Gbasの表示状態で、ユーザ操作に応じてX−YグラフとT−Yグラフとの同時表示が指示されると(ステップS17(Yes))、図10(K)に示すように、XY座標目盛が基準値であるX−YグラフY1のグラフ画面Gy1を重ねた同グラフ画像合成画面Gy1/Gbasの左半分がカラー表示部16の左側に表示されると共に(ステップS18)、そのX座標を連写間隔Δt=0.2sのT座標に変換したT−YグラフY1のグラフ画面Gy1′を重ねた合成画面Gy1′/Gbasの左半分が同カラー表示部16の右側に並べて表示される(ステップS19)。 In the display state of the graph image composition screen Gy1 / Gbas in which the composite image Gbas is superimposed on the background of the graph screen Gy1, when the simultaneous display of the XY graph and the TY graph is instructed in accordance with a user operation (step) S17 (Yes)), as shown in FIG. 10K, the left half of the graph image composition screen Gy1 / Gbas in which the graph screen Gy1 of the XY graph Y1 whose XY coordinate scale is the reference value is overlaid is displayed in color. The composite screen Gy1 ′ / on which the graph screen Gy1 ′ of the TY graph Y1 obtained by converting the X coordinate into the T coordinate of the continuous shooting interval Δt = 0.2 s is displayed. The left half of Gbas is displayed side by side on the right side of the color display section 16 (step S19).
ここで、「EXIT」キーの操作に応じて処理の戻りが指示されると(ステップS20(Yes))、前記図9(G)で示したように、初期のグラフ画面Gy1の背景に合成画像Gbasが合成されて表示された状態に戻る(ステップS7)。 Here, when a return of processing is instructed according to the operation of the “EXIT” key (step S20 (Yes)), as shown in FIG. 9G, the composite image is displayed on the background of the initial graph screen Gy1. It returns to the state where Gbas is synthesized and displayed (step S7).
そして、「AC」キーの操作により終了が指示されると(ステップS16(Yes))、前記一連のグラフ関数表示処理は終了される。 Then, when the end is instructed by operating the “AC” key (step S16 (Yes)), the series of graph function display processing is ended.
なお、前述した通り、前記外部PC30により実行した画像座標範囲設定処理も含めた全ての処理を本グラフ関数電卓10により実行してもよく、この場合には、図示しないデジタルカメラにより連写撮影した各種の画像ファイルを直接グラフ関数電卓10に取り込んで処理すればよい。
As described above, all processing including the image coordinate range setting processing executed by the
したがって、前記構成の外部PC30による移動物体の連写合成画像を対象にした画像座標範囲設定機能およびグラフ関数電卓10による前記連写合成画像に重ねた移動体軌跡のグラフ関数表示機能によれば、グラフ表示の横軸の座標目盛が連写間隔に相当する移動物体の各位置に合わせて描画される補助線h1,h2,…に基づき設定され、当該座標目盛を単純な整数値0,1,2,…として表示する基準目盛と、移動物体の連写間隔に相当する実測値(連写時間間隔Δtまたは移動距離Δx)に換算して表示する実測目盛とで表示する。
Therefore, according to the image coordinate range setting function for the continuous shot composite image of the moving object by the
これにより、動体の画像に対応したグラフを重ねて表示した際に、概念的な目盛に応じたグラフと現実的な目盛に応じたグラフとを容易に連携させて学習することができる。 Thereby, when the graph corresponding to the image of the moving object is displayed in an overlapping manner, the graph corresponding to the conceptual scale and the graph corresponding to the realistic scale can be easily linked and learned.
なお、前記実施形態のグラフ関数電卓10のグラフ関数表示処理(図7参照)では、基準のXY座標レンジに応じて検出された移動物体b1〜b7の各xy座標からグラフ式[Y1=−0.12(X−3)2+4.5]を計算して表示する構成(図9参照)としたが、ユーザ入力された実測長さΔx=0.55mに応じて変換した実測グラフ式[Y1(m)=−0.066(X−1.65)2+2.475]を表示する構成としてもよい。
In the graph function display process (see FIG. 7) of the graph
また、前記実施形態では、外部PC30の画像座標範囲設定処理(図5,図6参照)において、カラー表示部37に表示された合成画像Gbasから任意の矩形範囲の画像の切り出し処理をしない場合(ステップP3(No))のグラフ関数電卓10によるグラフ関数表示処理(図7参照)での表示動作の具体例(図8〜図10参照)について説明した。
Further, in the embodiment, in the image coordinate range setting process (see FIGS. 5 and 6) of the
これに対し、前記外部PC30の画像座標範囲設定処理(図5参照)において、カラー表示部37に表示された合成画像Gbasから任意の矩形範囲の画像の切り出し処理をした場合(ステップP3(Yes)→P4)のグラフ関数電卓10によるグラフ関数表示処理での表示動作の具体例(図11参照)について以下に説明する。
On the other hand, in the image coordinate range setting process of the external PC 30 (see FIG. 5), an image of an arbitrary rectangular range is cut out from the composite image Gbas displayed on the color display unit 37 (step P3 (Yes)). A specific example (see FIG. 11) of the display operation in the graph function display process by the graph
図11は、前記画像座標範囲設定処理での移動物体合成画像Gbasに対する矩形切り出し領域CPのパターンと、これに応じたグラフ関数表示処理でのX−Yグラフ対T−Xグラフの並列表示動作と、X−Yグラフ対T−Yグラフの並列表示動作との具体例を示す図である。 FIG. 11 shows the pattern of the rectangular cutout region CP for the moving object composite image Gbas in the image coordinate range setting process, and the parallel display operation of the XY graph versus the TX graph in the graph function display process corresponding thereto. It is a figure which shows the specific example with the parallel display operation | movement of XY graph vs. TY graph.
移動物体b1,b2,…,bnを連写撮影した合成画像Gbasに対して、図11(A)に示すような矩形切り出し領域CPにより部分的な切り出しをした場合には、図11(A1)(A2)に示すように、その切り出し範囲(CP)の合成画像Gbasを背景にしたX−Yグラフ画面Gy1、およびT−Yグラフ画面Gy1′の各グラフY1は共に前記矩形切り出し領域CPに含まれる移動物体bn…の軌跡に対応した曲線となって表示される。 When the segmented image CPas shown in FIG. 11A is partially cut out from the synthesized image Gbas obtained by continuously shooting the moving objects b1, b2,. As shown in (A2), both the XY graph screen Gy1 and the TY graph screen Gy1 ′ with the composite image Gbas in the cutout range (CP) as the background are both included in the rectangular cutout region CP. Is displayed as a curve corresponding to the trajectory of the moving object bn.
また、移動物体b1,b2,…,bnを連写撮影した合成画像Gbasに対して、図11(B)に示すような矩形切り出し領域CPによりX方向に長くY方向に短い切り出しをした場合には、図11(B1)(B2)に示すように、その切り出し範囲(CP)の合成画像Gbasを背景にしたX−Yグラフ画面Gy1、およびT−Yグラフ画面Gy1′の各グラフY1は共に前記矩形切り出し領域CPに含まれる合成画像Gbasおよび移動物体bn…の軌跡がX方向に圧縮された曲線となって表示される。 Further, when a combined image Gbas obtained by continuously shooting moving objects b1, b2,..., Bn is cut out in the X direction and in the Y direction by a rectangular cutout region CP as shown in FIG. As shown in FIGS. 11 (B1) and 11 (B2), each graph Y1 of the XY graph screen Gy1 and the TY graph screen Gy1 ′ with the synthetic image Gbas in the cutout range (CP) as a background is The trajectory of the composite image Gbas and the moving object bn... Included in the rectangular cutout region CP is displayed as a curve compressed in the X direction.
さらに、移動物体b1,b2,…,bnを連写撮影した合成画像Gbasに対して、図11(C)に示すような矩形切り出し領域CPにより切り出しをした場合には、図11(C1)(C2)に示すように、その切り出し範囲(CP)の合成画像Gbasを背景にしたX−Yグラフ画面Gy1、およびT−Yグラフ画面Gy1′の各グラフY1は共に前記矩形切り出し領域CPに含まれる合成画像Gbasおよび移動物体bn…の軌跡がXY両方向に圧縮された曲線となって表示される。 Further, when the synthesized image Gbas obtained by continuously shooting the moving objects b1, b2,..., Bn is cut out by a rectangular cutout region CP as shown in FIG. As shown in C2), each of the graphs Y1 of the XY graph screen Gy1 and the TY graph screen Gy1 ′ against the background of the composite image Gbas of the cutout range (CP) is included in the rectangular cutout region CP. The trajectory of the composite image Gbas and the moving object bn... Is displayed as a curve compressed in both XY directions.
なお、図11(A1)(B1)(C1)に示すように、T−Xグラフ画面GtxのグラフYtxは、移動物体b1,b2,…の連写時間間隔Δtとその移動間隔(長さ)Δxとが比例して増加するため、常に一次直線となって表示される。 As shown in FIGS. 11 (A1), (B1), and (C1), the graph Ytx on the TX graph screen Gtx is the continuous shooting time interval Δt of the moving objects b1, b2,... And its moving interval (length). Since Δx increases in proportion, it is always displayed as a linear straight line.
なお、前記各実施形態において記載したグラフ関数電卓10および外部PC30による動作手法、すなわち、図5のフローチャートに示す画像座標範囲設定処理、図7のフローチャートに示すグラフ関数表示処理などの各手法は、コンピュータに実行させることができるプログラムとして、メモリカード(ROMカード、RAMカード等)、磁気ディスク(フロッピディスク、ハードディスク等)、光ディスク(CD−ROM、DVD等)、半導体メモリ等の外部記録媒体23(33)に格納して配布することができる。そして、電子式計算機10(30)のコンピュータ21(31)は、この外部記録媒体23(33)に記憶されたプログラムを記憶装置22(32)に読み込み、この読み込んだプログラムによって動作が制御されることにより、前記各実施形態において説明した移動物体連写合成画像Gbasに基づく移動物体軌跡に対応したグラフ画面Gy1での基準値座標および実測値座標の表示機能を実現し、前述した手法による同様の処理を実行することができる。 In addition, each method such as the image coordinate range setting process shown in the flowchart of FIG. 5 and the graph function display process shown in the flowchart of FIG. As programs that can be executed by the computer, an external recording medium 23 (such as a memory card (ROM card, RAM card, etc.), magnetic disk (floppy disk, hard disk, etc.), optical disk (CD-ROM, DVD, etc.), semiconductor memory, etc. 33) and can be distributed. The computer 21 (31) of the electronic calculator 10 (30) reads the program stored in the external recording medium 23 (33) into the storage device 22 (32), and the operation is controlled by the read program. This realizes the display function of the reference value coordinates and the actual measurement value coordinates on the graph screen Gy1 corresponding to the moving object trajectory based on the moving object continuous-shot composite image Gbas described in each of the above embodiments. Processing can be executed.
また、前記各手法を実現するためのプログラムのデータは、プログラムコードの形態として通信ネットワーク(公衆回線)上を伝送させることができ、この通信ネットワークに接続された通信装置25(35)によって前記プログラムデータを電子式計算機10(30)のコンピュータ21(31)に取り込み、前述した移動物体連写合成画像Gbasに基づく移動物体軌跡に対応したグラフ画面Gy1での基準値座標および実測値座標の表示機能を実現することもできる。 Further, program data for realizing each of the above methods can be transmitted as a program code form on a communication network (public line), and the program can be transmitted by the communication device 25 (35) connected to the communication network. The function of displaying the reference value coordinates and the actual value coordinate on the graph screen Gy1 corresponding to the moving object trajectory based on the moving object continuous-shot composite image Gbas described above by taking the data into the computer 21 (31) of the electronic calculator 10 (30) Can also be realized.
なお、本願発明は、前記各実施形態に限定されるものではなく、実施段階ではその要旨を逸脱しない範囲で種々に変形することが可能である。さらに、前記各実施形態には種々の段階の発明が含まれており、開示される複数の構成要件における適宜な組み合わせにより種々の発明が抽出され得る。例えば、各実施形態に示される全構成要件から幾つかの構成要件が削除されたり、幾つかの構成要件が異なる形態にして組み合わされても、発明が解決しようとする課題の欄で述べた課題が解決でき、発明の効果の欄で述べられている効果が得られる場合には、この構成要件が削除されたり組み合わされた構成が発明として抽出され得るものである。 Note that the present invention is not limited to the above-described embodiments, and various modifications can be made without departing from the scope of the invention at the stage of implementation. Further, each of the embodiments includes inventions at various stages, and various inventions can be extracted by appropriately combining a plurality of disclosed constituent elements. For example, even if some constituent elements are deleted from all the constituent elements shown in each embodiment or some constituent elements are combined in different forms, the problems described in the column of the problem to be solved by the invention If the effects described in the column “Effects of the Invention” can be obtained, a configuration in which these constituent requirements are deleted or combined can be extracted as an invention.
以下に、本願出願の当初の特許請求の範囲に記載された発明を付記する。 Hereinafter, the invention described in the scope of claims of the present application will be appended.
[1]
連続撮影した複数の画像の合成画像を取得する合成画像取得手段と、
この合成画像取得手段により取得された合成画像を対象に前記連続撮影の撮影間隔で含まれる移動物体の位置に対応させて当該移動物体の移動方向の座標軸に対する基準目盛を設定する基準目盛設定手段と、
前記撮影間隔に対応した実測値を取得する実測値取得手段と、
前記合成画像取得手段により取得された合成画像を表示部に表示させると共に、当該合成画像に重ねて同合成画像に含まれる移動物体の移動の軌跡に応じたグラフを表示させるグラフ画像合成表示手段と、
このグラフ画像合成表示手段により表示されたグラフに関する座標値を前記基準目盛設定手段により設定された基準目盛に応じた座標値で表示する基準座標値表示手段と、
この基準座標値表示手段により表示された基準目盛に応じた座標値を前記実測値取得手段により取得された実測値に基づき換算した座標値で表示する実測座標値表示手段と、
を備えたことを特徴とするグラフ関数表示装置。
[1]
Composite image acquisition means for acquiring a composite image of a plurality of images taken continuously;
Reference scale setting means for setting a reference scale with respect to the coordinate axis of the moving direction of the moving object in correspondence with the position of the moving object included in the continuous shooting interval for the composite image acquired by the composite image acquiring means; ,
Actual value acquisition means for acquiring an actual value corresponding to the photographing interval;
Graph image composition display means for displaying the composite image acquired by the composite image acquisition means on the display unit and displaying a graph corresponding to the movement trajectory of the moving object included in the composite image superimposed on the composite image; ,
Reference coordinate value display means for displaying the coordinate value related to the graph displayed by the graph image composition display means at a coordinate value corresponding to the reference scale set by the reference scale setting means;
Actual coordinate value display means for displaying the coordinate value corresponding to the reference scale displayed by the reference coordinate value display means as coordinate values converted based on the actual measurement value acquired by the actual measurement value acquisition means;
A graph function display device comprising:
[2]
前記合成画像取得手段は、連続撮影した複数の画像の合成画像と共に当該連続撮影の時間間隔を取得し、
前記実測値取得手段は、前記合成画像取得手段により取得された連続撮影の時間間隔を実測値として取得する、
ことを特徴とする[1]に記載のグラフ関数表示装置。
[2]
The composite image acquisition means acquires a time interval of the continuous shooting together with a composite image of a plurality of images shot continuously,
The actual measurement value acquisition unit acquires a continuous shooting time interval acquired by the composite image acquisition unit as an actual measurement value.
The graph function display device according to [1], wherein
[3]
前記実測値取得手段は、ユーザ操作に応じて前記連続撮影の撮影間隔に対応した移動物体の移動距離を実測値として取得する、
ことを特徴とする[1]に記載のグラフ関数表示装置。
[3]
The actual measurement value acquisition unit acquires, as an actual measurement value, a moving distance of a moving object corresponding to the shooting interval of the continuous shooting according to a user operation.
The graph function display device according to [1], wherein
[4]
前記グラフ画像合成表示手段により表示されたグラフ上にユーザ操作に応じてポインタを表示させ当該グラフ上の任意の位置に移動させるグラフトレース手段を備え、
前記基準座標値表示手段は、前記グラフトレース手段によりグラフ上に表示されたポインタの位置に対応する座標値を前記基準目盛設定手段により設定された基準目盛に応じた座標値で表示する、
ことを特徴とする[1]ないし[3]の何れかに記載のグラフ関数表示装置。
[4]
A graph tracing unit that displays a pointer according to a user operation on the graph displayed by the graph image composition display unit and moves the pointer to an arbitrary position on the graph;
The reference coordinate value display means displays the coordinate value corresponding to the position of the pointer displayed on the graph by the graph trace means as a coordinate value corresponding to the reference scale set by the reference scale setting means.
The graph function display device according to any one of [1] to [3].
[5]
前記合成画像取得手段により取得された合成画像に含まれる移動物体の軌跡に応じたグラフ式を取得するグラフ式取得手段と、
このグラフ式取得手段により取得されたグラフ式を、前記グラフ画像合成表示手段により表示部に表示されたグラフと共に表示させるグラフ式表示手段と、
このグラフ式表示手段により表示されたグラフ式を前記実測値取得手段により取得された実測値に応じて変換したグラフ式にして表示する実測グラフ式表示手段と、
を備えたことを特徴とする[1]ないし[4]の何れかに記載のグラフ関数表示装置。
[5]
A graph expression acquisition means for acquiring a graph expression corresponding to the trajectory of the moving object included in the composite image acquired by the composite image acquisition means;
Graph expression display means for displaying the graph expression acquired by the graph expression acquisition means together with the graph displayed on the display unit by the graph image composition display means;
An actual graph expression display means for displaying the graph expression displayed by the graph expression display means as a graph expression converted according to the actual measurement value acquired by the actual measurement value acquisition means;
The graph function display device according to any one of [1] to [4], comprising:
[6]
前記合成画像取得手段は、連続撮影した複数の画像の合成画像からユーザ操作に応じた任意の範囲の合成画像を切り出して取得する、
ことを特徴とする[1]ないし[5]の何れかに記載のグラフ関数表示装置。
[6]
The composite image acquisition means cuts out and acquires a composite image in an arbitrary range according to a user operation from a composite image of a plurality of images taken continuously.
The graph function display device according to any one of [1] to [5].
[7]
表示部を備えた電子式計算機のコンピュータを制御するためのプログラムであって、
前記コンピュータを、
連続撮影した複数の画像の合成画像を取得する合成画像取得手段、
この合成画像取得手段により取得された合成画像を対象に前記連続撮影の撮影間隔で含まれる移動物体の位置に対応させて当該移動物体の移動方向の座標軸に対する基準目盛を設定する基準目盛設定手段、
前記撮影間隔に対応した実測値を取得する実測値取得手段、
前記合成画像取得手段により取得された合成画像を前記表示部に表示させると共に、当該合成画像に重ねて同合成画像に含まれる移動物体の移動の軌跡に応じたグラフを表示させるグラフ画像合成表示手段、
このグラフ画像合成表示手段により表示されたグラフに関する座標値を前記基準目盛設定手段により設定された基準目盛に応じた座標値で表示する基準座標値表示手段、
この基準座標値表示手段により表示された基準目盛に応じた座標値を前記実測値取得手段により取得された実測値に基づき換算した座標値で表示する実測座標値表示手段、
として機能させるためのプログラム。
[7]
A program for controlling a computer of an electronic computer having a display unit,
The computer,
Composite image acquisition means for acquiring a composite image of a plurality of images taken continuously;
Reference scale setting means for setting a reference scale for the coordinate axis of the moving direction of the moving object in correspondence with the position of the moving object included in the shooting interval of the continuous shooting with respect to the composite image acquired by the composite image acquiring means,
Actual value acquisition means for acquiring an actual value corresponding to the photographing interval,
Graph image composition display means for displaying the composite image acquired by the composite image acquisition means on the display unit and displaying a graph corresponding to the movement trajectory of the moving object included in the composite image, superimposed on the composite image. ,
Reference coordinate value display means for displaying the coordinate value related to the graph displayed by the graph image composition display means at a coordinate value corresponding to the reference scale set by the reference scale setting means;
An actual coordinate value display means for displaying a coordinate value corresponding to the reference scale displayed by the reference coordinate value display means as a coordinate value converted based on the actual value acquired by the actual value acquisition means;
Program to function as.
10 …グラフ関数電卓
11 …キー入力部
12 …数字・演算記号キー群
13 …関数機能キー群
14 …モード設定キー群
15 …カーソルキー
16 …カラー表示部
16T…タッチパネル
21 …電卓プロセッサ(CPU)
22 …電卓記憶部
22a…グラフ関数表示処理プログラム
22b…グラフ式データ記憶部
22c…V-Window設定値記憶部
22d…画像&座標範囲ファイル記憶部(電卓)
22e…電卓ワークエリア
23 …外部記録媒体(電卓)
24 …記録媒体読取部(電卓)
25 …PC通信部
30 …外部PC
31 …PCプロセッサ(CPU)
32 …PC記憶部
32a…画像座標範囲設定処理プログラム
32b…表示データ記憶部
32c…画像ファイル記憶部
32d…移動物体座標リスト記憶部
32e…座標範囲基準値記憶部
32f…画像&座標範囲ファイル記憶部(PC)
32g…PCワークエリア
33 …外部記録媒体(PC)
34 …記録媒体読取部(PC)
35 …外部機器通信部
36 …キー入力部(PC)
37 …カラー表示部
b1〜bn…移動物体(ボール)
Gbus…移動物体連写合成画像
h1〜hn…補助線(基準目盛)
XSmin〜XSmax…基準X座標レンジ
YSmin〜YSmax…基準Y座標レンジ
XRmin〜XRmax…実測X座標レンジ
YRmin〜YRmax…実測Y座標レンジ
Gset…グラフ表示設定画面
Gm …画像ファイル選択画面
Gv−w…V-Window設定画面
Gt …グラフ式一覧画面
GY1…X−Yグラフ画面
GY1′…T−Yグラフ画面
Y1 …X−Y(T−Y)グラフ
P …トレースポインタ
K …グラフの傾き
CP …矩形切り出し領域
Gtx…T−Xグラフ画面
Ytx…T−Xグラフ
DESCRIPTION OF
22 ...
22e: Calculator work area 23: External recording medium (calculator)
24 ... Recording medium reader (calculator)
25 ...
31 ... PC processor (CPU)
32 ...
32 g ...
34. Recording medium reading unit (PC)
35 ... External
37 ... color display part b1 to bn ... moving object (ball)
Gbus ... Moving object continuous shot composite image h1-hn ... Auxiliary line (reference scale)
XSmin to XSmax ... Reference X coordinate range YSmin to YSmax ... Reference Y coordinate range XRmin to XRmax ... Measured X coordinate range YRmin to YRmax ... Measured Y coordinate range Gset ... Graph display setting screen Gm ... Image file selection screen Gv-w ... V- Window setting screen Gt ... Graph type list screen GY1 ... XY graph screen GY1 '... TY graph screen Y1 ... XY (TY) graph P ... Trace pointer K ... Graph inclination CP ... Rectangular cutout region Gtx ... TX graph screen Ytx ... TX graph
Claims (7)
前記撮影間隔に対応した実測値を取得する実測値取得手段と、
前記合成画像を表示部に表示させると共に、当該合成画像に重ねて同合成画像に含まれる移動物体の移動の軌跡に応じたグラフを表示させるグラフ画像合成表示手段と、
このグラフ画像合成表示手段により表示されたグラフに関する座標値を前記基準目盛設定手段により設定された基準目盛に応じた座標値で表示する基準座標値表示手段と、
この基準座標値表示手段により表示された基準目盛に応じた座標値を前記実測値取得手段により取得された実測値に基づき換算した座標値で表示する実測座標値表示手段と、
を備え、
前記基準目盛設定手段は、前記移動物体の位置がほぼ等しい間隔であると判定された場合に、当該移動物体の移動方向の座標軸に対する基準目盛を前記間隔に設定する、
ことを特徴とするグラフ関数表示装置。 Reference scale setting means for setting a reference scale for the coordinate axis of the moving direction of the moving object corresponding to the position of the moving object included in the continuous shooting shooting interval for a composite image of a plurality of continuously shot images;
Actual value acquisition means for acquiring an actual value corresponding to the photographing interval;
Together to display the synthetic image on the display unit, and a graph image synthesizing display unit for displaying a graph in accordance with the locus of movement of the moving object included in the overlaid the composite image to the composite image,
Reference coordinate value display means for displaying the coordinate value related to the graph displayed by the graph image composition display means at a coordinate value corresponding to the reference scale set by the reference scale setting means;
Actual coordinate value display means for displaying the coordinate value corresponding to the reference scale displayed by the reference coordinate value display means as coordinate values converted based on the actual measurement value acquired by the actual measurement value acquisition means;
Equipped with a,
The reference scale setting means, when it is determined that the positions of the moving objects are substantially equal intervals, sets the reference scale for the coordinate axis in the moving direction of the moving objects to the intervals.
A graph function display device.
前記実測値取得手段は、前記連続撮影の時間間隔を実測値として取得する、
ことを特徴とする請求項1に記載のグラフ関数表示装置。 Storing the time interval of the continuous shooting with the composite image of the plurality of images the continuous shooting,
The measured value obtaining means obtains a time interval before Symbol continuous shooting as measured values,
The graph function display device according to claim 1 .
ことを特徴とする請求項1に記載のグラフ関数表示装置。 The actual measurement value acquisition unit acquires, as an actual measurement value, a moving distance of a moving object corresponding to the shooting interval of the continuous shooting according to a user operation.
The graph function display device according to claim 1 .
前記基準座標値表示手段は、前記グラフトレース手段によりグラフ上に表示されたポインタの位置に対応する座標値を前記基準目盛設定手段により設定された基準目盛に応じた座標値で表示する、
ことを特徴とする請求項1ないし請求項3の何れか1項に記載のグラフ関数表示装置。 A graph tracing unit that displays a pointer according to a user operation on the graph displayed by the graph image composition display unit and moves the pointer to an arbitrary position on the graph;
The reference coordinate value display means displays the coordinate value corresponding to the position of the pointer displayed on the graph by the graph trace means as a coordinate value corresponding to the reference scale set by the reference scale setting means.
It graph function display device according to any one of claims 1 to 3, characterized in.
このグラフ式取得手段により取得されたグラフ式を、前記グラフ画像合成表示手段により表示部に表示されたグラフと共に表示させるグラフ式表示手段と、
このグラフ式表示手段により表示されたグラフ式を前記実測値取得手段により取得された実測値に応じて変換したグラフ式にして表示する実測グラフ式表示手段と、
を備えたことを特徴とする請求項1ないし請求項4の何れか1項に記載のグラフ関数表示装置。 A graph formula obtaining means for obtaining the graph formula in accordance with the trajectory of the moving object contained in the synthesis image,
Graph expression display means for displaying the graph expression acquired by the graph expression acquisition means together with the graph displayed on the display unit by the graph image composition display means;
An actual graph expression display means for displaying the graph expression displayed by the graph expression display means as a graph expression converted according to the actual measurement value acquired by the actual measurement value acquisition means;
Graph function display device according to any one of claims 1 to 4, characterized in that with a.
ことを特徴とする請求項1ないし請求項5の何れか1項に記載のグラフ関数表示装置。 A unit that cuts out and acquires a composite image of an arbitrary range according to a user operation from a composite image of the plurality of continuously shot images ;
It graph function display device according to any one of claims 1 to 5, characterized in.
前記コンピュータを、
連続撮影した複数の画像の合成画像を対象に前記連続撮影の撮影間隔で含まれる移動物体の位置に対応させて当該移動物体の移動方向の座標軸に対する基準目盛を設定する基準目盛設定手段、
前記撮影間隔に対応した実測値を取得する実測値取得手段、
前記合成画像を前記表示部に表示させると共に、当該合成画像に重ねて同合成画像に含まれる移動物体の移動の軌跡に応じたグラフを表示させるグラフ画像合成表示手段、
このグラフ画像合成表示手段により表示されたグラフに関する座標値を前記基準目盛設定手段により設定された基準目盛に応じた座標値で表示する基準座標値表示手段、
この基準座標値表示手段により表示された基準目盛に応じた座標値を前記実測値取得手段により取得された実測値に基づき換算した座標値で表示する実測座標値表示手段、
として機能させ、
前記基準目盛設定手段は、前記移動物体の位置がほぼ等しい間隔であると判定された場合に、当該移動物体の移動方向の座標軸に対する基準目盛を前記間隔に設定することを特徴とする、
プログラム。 A program for controlling a computer of an electronic computer having a display unit,
The computer,
Reference scale setting means for setting a reference scale for the coordinate axis of the moving direction of the moving object in correspondence with the position of the moving object included in the shooting interval of the continuous shooting for a composite image of a plurality of continuously shot images;
Actual value acquisition means for acquiring an actual value corresponding to the photographing interval,
Wherein the synthetic image together to be displayed on the display unit, a graph image synthesizing display unit for displaying a graph in accordance with the locus of movement of the moving object included to overlap the composite image in the composite image,
Reference coordinate value display means for displaying the coordinate value related to the graph displayed by the graph image composition display means at a coordinate value corresponding to the reference scale set by the reference scale setting means;
An actual coordinate value display means for displaying a coordinate value corresponding to the reference scale displayed by the reference coordinate value display means as a coordinate value converted based on the actual value acquired by the actual value acquisition means;
To function as,
The reference scale setting means, when it is determined that the positions of the moving objects are substantially equal intervals, the reference scale for the coordinate axis of the moving direction of the moving object is set to the intervals,
program.
Priority Applications (1)
| Application Number | Priority Date | Filing Date | Title |
|---|---|---|---|
| JP2011167658A JP5810717B2 (en) | 2011-07-29 | 2011-07-29 | Graph function display device and program |
Applications Claiming Priority (1)
| Application Number | Priority Date | Filing Date | Title |
|---|---|---|---|
| JP2011167658A JP5810717B2 (en) | 2011-07-29 | 2011-07-29 | Graph function display device and program |
Publications (3)
| Publication Number | Publication Date |
|---|---|
| JP2013030136A JP2013030136A (en) | 2013-02-07 |
| JP2013030136A5 JP2013030136A5 (en) | 2014-09-04 |
| JP5810717B2 true JP5810717B2 (en) | 2015-11-11 |
Family
ID=47787083
Family Applications (1)
| Application Number | Title | Priority Date | Filing Date |
|---|---|---|---|
| JP2011167658A Active JP5810717B2 (en) | 2011-07-29 | 2011-07-29 | Graph function display device and program |
Country Status (1)
| Country | Link |
|---|---|
| JP (1) | JP5810717B2 (en) |
Families Citing this family (1)
| Publication number | Priority date | Publication date | Assignee | Title |
|---|---|---|---|---|
| US9986113B2 (en) * | 2016-05-06 | 2018-05-29 | Fuji Xerox Co., Ltd. | Information processing apparatus and nontransitory computer readable medium |
Family Cites Families (5)
| Publication number | Priority date | Publication date | Assignee | Title |
|---|---|---|---|---|
| JP2003131655A (en) * | 2001-10-26 | 2003-05-09 | Casio Comput Co Ltd | Graph display device and program |
| EP1543405B1 (en) * | 2002-09-27 | 2007-12-05 | Casio Computer Co., Ltd. | Graphic display control device for displaying graphs |
| JP2004206437A (en) * | 2002-12-25 | 2004-07-22 | Casio Comput Co Ltd | Graphic display controller and program |
| JP2005010850A (en) * | 2003-06-16 | 2005-01-13 | Casio Comput Co Ltd | Learning support device and program |
| JP4877186B2 (en) * | 2007-10-16 | 2012-02-15 | カシオ計算機株式会社 | Image processing apparatus, image processing method, and program |
-
2011
- 2011-07-29 JP JP2011167658A patent/JP5810717B2/en active Active
Also Published As
| Publication number | Publication date |
|---|---|
| JP2013030136A (en) | 2013-02-07 |
Similar Documents
| Publication | Publication Date | Title |
|---|---|---|
| JP4853578B2 (en) | Graph display device and program | |
| JP6252414B2 (en) | Graphic display device, graphic display method, and program | |
| JP5821625B2 (en) | Image editing apparatus and program | |
| US9805484B2 (en) | Graph display control device, electronic device, graph display method and storage medium recording graph display control processing program | |
| US20040104942A1 (en) | Display and operating device, in particular a touch panel | |
| JP6394163B2 (en) | Graph display device, graph display method and program | |
| AU2015201336B2 (en) | Graphic drawing device and recording medium storing graphic drawing program | |
| JP5593879B2 (en) | Graphic display device and program | |
| JP2010211281A (en) | Graph display control apparatus and program | |
| JP5810717B2 (en) | Graph function display device and program | |
| JP4876699B2 (en) | Display control apparatus and display control program | |
| JP2014164652A (en) | Image edit device, image edit method and image edit program | |
| JP5454277B2 (en) | Graphic display device and program | |
| USRE46215E1 (en) | Computing machine with an inequality computation function | |
| JP5786542B2 (en) | Formula input device and program | |
| JP5416252B2 (en) | Input display program, method and portable information terminal | |
| JP6547862B2 (en) | Graphic drawing apparatus, graphic drawing method and program | |
| JP2018081699A (en) | Graphic display device, graphic display method, and program | |
| JP6782016B2 (en) | Input support device and input support program | |
| JP5532890B2 (en) | Display device and program | |
| JP2011043917A (en) | Mathematical expression display arithmetic unit and program | |
| JP5585243B2 (en) | Graphic display device and program | |
| JPH0934989A (en) | Format parameter generating method for ocr | |
| JPS635472A (en) | Interactive cad input/output device | |
| JP2010072940A (en) | Electronic computer |
Legal Events
| Date | Code | Title | Description |
|---|---|---|---|
| A521 | Written amendment |
Free format text: JAPANESE INTERMEDIATE CODE: A523 Effective date: 20140716 |
|
| A621 | Written request for application examination |
Free format text: JAPANESE INTERMEDIATE CODE: A621 Effective date: 20140716 |
|
| A977 | Report on retrieval |
Free format text: JAPANESE INTERMEDIATE CODE: A971007 Effective date: 20150428 |
|
| A131 | Notification of reasons for refusal |
Free format text: JAPANESE INTERMEDIATE CODE: A131 Effective date: 20150519 |
|
| A521 | Written amendment |
Free format text: JAPANESE INTERMEDIATE CODE: A523 Effective date: 20150721 |
|
| TRDD | Decision of grant or rejection written | ||
| A01 | Written decision to grant a patent or to grant a registration (utility model) |
Free format text: JAPANESE INTERMEDIATE CODE: A01 Effective date: 20150818 |
|
| A61 | First payment of annual fees (during grant procedure) |
Free format text: JAPANESE INTERMEDIATE CODE: A61 Effective date: 20150831 |
|
| R150 | Certificate of patent (=grant) or registration of utility model |
Ref document number: 5810717 Country of ref document: JP Free format text: JAPANESE INTERMEDIATE CODE: R150 |