JP5375773B2 - Position calculation method and position calculation apparatus - Google Patents
Position calculation method and position calculation apparatus Download PDFInfo
- Publication number
- JP5375773B2 JP5375773B2 JP2010192236A JP2010192236A JP5375773B2 JP 5375773 B2 JP5375773 B2 JP 5375773B2 JP 2010192236 A JP2010192236 A JP 2010192236A JP 2010192236 A JP2010192236 A JP 2010192236A JP 5375773 B2 JP5375773 B2 JP 5375773B2
- Authority
- JP
- Japan
- Prior art keywords
- measurement
- value
- error
- observation
- position calculation
- Prior art date
- Legal status (The legal status is an assumption and is not a legal conclusion. Google has not performed a legal analysis and makes no representation as to the accuracy of the status listed.)
- Active
Links
Images


Abstract
Description
本発明は、位置算出方法及び位置算出装置に関する。 The present invention relates to a position calculation method and a position calculation apparatus.
測位用信号を利用した測位システムとしては、GPS(Global Positioning System)が広く知られており、携帯型電話機やカーナビゲーション装置等に内蔵された位置算出装置に利用されている。GPSでは、複数のGPS衛星の位置や各GPS衛星から自機までの擬似距離等の情報に基づいて自機の位置を求める位置算出計算を行う。 A GPS (Global Positioning System) is widely known as a positioning system using positioning signals, and is used in a position calculation device built in a mobile phone or a car navigation device. In GPS, position calculation is performed to determine the position of the own device based on information such as the positions of a plurality of GPS satellites and pseudo distances from each GPS satellite to the own device.
従来より、位置算出計算としては、最小二乗法を利用した計算が広く用いられている。また、別の手法として、カルマンフィルターを利用した位置算出計算を行って位置を算出する技術も考案されている(例えば特許文献1)。 Conventionally, calculation using the least square method has been widely used as position calculation calculation. As another method, a technique for calculating a position by performing position calculation using a Kalman filter has been devised (for example, Patent Document 1).
カルマンフィルターは、誤差を含む観測値を利用して、時々刻々と変化する状態量を推定する確率理論に基づく推定方法である。カルマンフィルターでは、対象とする系の状態量を予測する予測処理と、予測処理で予測された状態量を補正する補正処理とを行って、状態量を推定する。補正処理では、所定の外部観測量を観測値として与えて状態量の補正・更新を行うが、この際、想定される観測値の誤差を観測誤差として与えて演算を行う。観測誤差は、一般にR値として知られるものである。 The Kalman filter is an estimation method based on a probability theory that estimates an amount of state that changes every moment by using an observed value including an error. In the Kalman filter, the state quantity is estimated by performing a prediction process for predicting the state quantity of the target system and a correction process for correcting the state quantity predicted by the prediction process. In the correction process, a predetermined external observation amount is given as an observed value to correct / update the state quantity. At this time, an operation is performed by giving an expected observation value error as an observation error. The observation error is generally known as an R value.
カルマンフィルターを利用した位置算出処理では、位置算出装置の位置や移動速度を状態量とし、位置算出装置が受信したGPS衛星信号の位相や周波数といった外部観測量を観測値として用いて、カルマンフィルターの理論に基づく位置算出計算を行う方法が一般的である。但し、観測値に実際に含まれる誤差の大きさは不明であるため、観測誤差に固定値を設定して計算を行う場合が多い。 In the position calculation process using the Kalman filter, the position and moving speed of the position calculation device are used as state quantities, and external observation quantities such as the phase and frequency of the GPS satellite signal received by the position calculation apparatus are used as observation values. A method of performing position calculation calculation based on theory is common. However, since the magnitude of the error actually included in the observed value is unknown, the calculation is often performed by setting a fixed value for the observed error.
しかしながら、観測値に実際に含まれる誤差よりも大きな値を観測誤差に設定して位置算出計算を行うと、フィルターが強く作用してしまい、算出位置が実際の位置よりも時間的に遅れる“位置遅れ”や、カーブや曲がり角において算出位置の追従性が悪化する“ショートカット”といった事象が発生し、位置算出の正確性が低下するという問題があった。 However, if position calculation calculation is performed with an observation error set to a value larger than the error actually included in the observed value, the filter acts strongly, and the calculated position is delayed in time from the actual position. There are problems such as “delay” and “shortcut” in which the followability of the calculated position deteriorates at a curve or a corner, resulting in a decrease in the accuracy of position calculation.
本発明は上述した課題に鑑みて為されたものであり、その目的とするところは、位置算出の正確性を向上させることのできる観測誤差の新たな設定方法を提案することにある。 The present invention has been made in view of the above-described problems, and an object of the present invention is to propose a new method for setting an observation error that can improve the accuracy of position calculation.
以上の課題を解決するための第1の形態は、測位用衛星からの測位用信号の受信に係る少なくとも受信周波数及びコード位相を含む予測メジャメントを予測することと、前記測位用衛星から受信した前記測位用信号に基づいて、少なくとも受信周波数及びコード位相を含む観測メジャメントを取得することと、前記観測メジャメントと前記予測メジャメントとの差に基づいて、カルマンフィルターを利用した位置算出処理で用いる誤差パラメーターの値を設定することと、前記誤差パラメーターの値を用いて前記位置算出処理を行って位置を算出することと、を含む位置算出方法である。 A first mode for solving the above problems is to predict a prediction measurement including at least a reception frequency and a code phase related to reception of a positioning signal from a positioning satellite, and to receive the prediction received from the positioning satellite. Based on the positioning signal, obtain an observation measurement including at least the reception frequency and the code phase, and based on the difference between the observation measurement and the prediction measurement, an error parameter used in the position calculation process using the Kalman filter A position calculation method including setting a value and calculating the position by performing the position calculation process using the value of the error parameter.
また、他の形態として、測位用衛星からの測位用信号の受信に係る少なくとも受信周波数及びコード位相を含む予測メジャメントを予測する予測部と、前記測位用衛星から受信した前記測位用信号に基づいて、少なくとも受信周波数及びコード位相を含む観測メジャメントを取得する観測部と、前記観測メジャメントと前記予測メジャメントとの差に基づいて、カルマンフィルターを利用した位置算出処理で用いる誤差パラメーターの値を設定する設定部と、前記誤差パラメーターの値を用いて前記位置算出処理を行って位置を算出する位置算出部と、を備えた位置算出装置を構成してもよい。 Further, as another form, based on the prediction signal that predicts a prediction measurement including at least the reception frequency and code phase related to the reception of the positioning signal from the positioning satellite, and the positioning signal received from the positioning satellite A setting for setting an error parameter value used in a position calculation process using a Kalman filter, based on a difference between an observation unit that obtains at least an observation measurement including a reception frequency and a code phase, and the observation measurement and the prediction measurement And a position calculation unit that calculates the position by performing the position calculation process using the value of the error parameter.
この第1の形態等によれば、測位用信号の受信に係る少なくとも受信周波数及びコード位相を含む予測メジャメントを予測する。また、測位用衛星から受信した測位用信号に基づいて、少なくとも受信周波数及びコード位相を含む観測メジャメントを取得する。そして、観測メジャメントと予測メジャメントとの差に基づいて、カルマンフィルターを利用した位置算出処理で用いる誤差パラメーターの値を設定する。そして、誤差パラメーターの値を用いて位置算出処理を行って位置を算出する。 According to the first embodiment and the like, a prediction measurement including at least the reception frequency and code phase related to the reception of the positioning signal is predicted. Further, based on the positioning signal received from the positioning satellite, an observation measurement including at least the reception frequency and the code phase is acquired. Based on the difference between the observed measurement and the predicted measurement, the value of the error parameter used in the position calculation process using the Kalman filter is set. Then, the position is calculated by performing position calculation using the value of the error parameter.
測位用信号の受信に係るメジャメントには、少なくとも測位用信号の受信周波数及びコード位相が含まれ、誤差パラメーターには、想定されるメジャメントの誤差の大きさを示すパラメーターが含まれる。詳細は後述するが、本願発明者は、メジャメントの実誤差との間で強い相関を示すパラメーターの値を用いて誤差パラメーターの値を設定し、当該誤差パラメーターの値を用いて位置算出計算を行うことで、算出位置の誤差が小さくなることを発見した。また、観測メジャメントと予測メジャメントとの差で表されるパラメーターは、メジャメントの実誤差との関係で線形的な特性を示し、相関が強いことが明らかとなった。従って、観測メジャメントと予測メジャメントとの差に基づいて誤差パラメーターの値を設定することで、観測値の実誤差に近似した観測誤差を設定することが可能となり、位置算出の正確性が向上する。 The measurement related to the reception of the positioning signal includes at least the reception frequency and code phase of the positioning signal, and the error parameter includes a parameter indicating the magnitude of the expected measurement error. Although details will be described later, the inventor sets an error parameter value using a parameter value showing a strong correlation with the actual measurement error, and performs position calculation calculation using the error parameter value. As a result, it was found that the error of the calculated position is reduced. In addition, the parameter expressed by the difference between the observed measurement and the predicted measurement showed a linear characteristic in relation to the actual error of the measurement, and it became clear that the correlation was strong. Therefore, by setting the error parameter value based on the difference between the observation measurement and the prediction measurement, it is possible to set an observation error that approximates the actual error of the observation value, and the accuracy of position calculation is improved.
また、第2の形態として、第1の形態の位置算出方法であって、前記位置算出処理で用いる状態ベクトルの予測を行うことと、前記予測された状態ベクトルの補正を行うことと、を更に含み、前記予測メジャメントを予測することは、前記予測された状態ベクトルに基づいて第1の予測メジャメントを予測する第1の予測処理を含み、前記位置を算出することは、前記補正された状態ベクトルに基づいて位置を算出することを含む位置算出方法を構成してもよい。 Further, as a second form, the position calculation method according to the first form, further comprising: predicting a state vector used in the position calculation process; and correcting the predicted state vector. Predicting the prediction measurement includes a first prediction process for predicting a first prediction measurement based on the predicted state vector, and calculating the position includes the corrected state vector. You may comprise the position calculation method including calculating a position based on.
この第2の形態によれば、位置算出処理で用いる状態ベクトルの予測と、予測された状態ベクトルの補正とを行う。そして、予測された状態ベクトルに基づいて第1の予測メジャメントを予測するとともに、補正された状態ベクトルに基づいて位置を算出する。 According to the second embodiment, the state vector used in the position calculation process is predicted and the predicted state vector is corrected. Then, the first prediction measurement is predicted based on the predicted state vector, and the position is calculated based on the corrected state vector.
また、第3の形態として、第2の形態の位置算出方法であって、前記予測メジャメントを予測することは、前記測位用信号を受信した際に取得された過去の観測メジャメントと当該過去の観測メジャメントを観測した時からの経過時間とに基づいて、位置算出処理を行う時の第2の予測メジャメントを予測する第2の予測処理を含む位置算出方法を構成してもよい。 Further, as a third form, the position calculation method according to the second form, wherein the prediction measurement is predicted by the past observation measurement acquired when the positioning signal is received and the past observation. You may comprise the position calculation method including the 2nd prediction process which estimates the 2nd prediction measurement at the time of performing a position calculation process based on the elapsed time from the time of observing a measurement.
この第3の形態によれば、測位用信号を受信した際に取得された過去の観測メジャメントと当該過去の観測メジャメントを観測した時からの経過時間とに基づいて、位置算出処理を行う時の第2の予測メジャメントを予測する。この予測は、過去に観測されたメジャメントに基づく予測であるため、位置算出時点のメジャメントを適切に予測することができ、観測誤差の設定が適切に行われるようになる。 According to the third embodiment, when the position calculation process is performed based on the past observation measurement acquired when the positioning signal is received and the elapsed time since the past observation measurement was observed. Predict the second prediction measurement. Since this prediction is based on the measurement observed in the past, the measurement at the time of position calculation can be predicted appropriately, and the setting of the observation error can be performed appropriately.
また、第4の形態として、第3の形態の位置算出方法であって、第1の予測メジャメント及び第2の予測メジャメントの信頼性を判定することを更に含むとともに、前記誤差パラメーターの値を設定することは、前記信頼性の判定結果に応じて、前記第1の予測メジャメント及び前記第2の予測メジャメントの少なくとも何れかを用いて前記誤差パラメーターの値を設定することを含む位置算出方法を構成してもよい。 Further, as a fourth mode, the position calculation method according to the third mode further includes determining reliability of the first prediction measurement and the second prediction measurement, and sets the value of the error parameter. And configuring a position calculation method including setting a value of the error parameter using at least one of the first prediction measurement and the second prediction measurement according to the reliability determination result. May be.
この第4の形態によれば、第1の予測メジャメント及び第2の予測メジャメントの信頼性を判定し、その判定結果に応じて、第1の予測メジャメント及び第2の予測メジャメントの少なくとも何れかを用いて誤差パラメーターの値を設定する。これにより、例えば、第1の予測メジャメントの信頼性が低い場合は、第2の予測メジャメントを用いて誤差パラメーターの値を設定するといったことや、第1の予測メジャメントの信頼性と第2の予測メジャメントの信頼性とが共に高い場合は、第1の予測メジャメントと第2の予測メジャメントとの両方を用いて誤差パラメーターの値を設定するといったことが可能となる。 According to the fourth aspect, the reliability of the first prediction measurement and the second prediction measurement is determined, and at least one of the first prediction measurement and the second prediction measurement is determined according to the determination result. To set the value of the error parameter. Thereby, for example, when the reliability of the first prediction measurement is low, the value of the error parameter is set using the second prediction measurement, the reliability of the first prediction measurement, and the second prediction. When both the reliability of the measurement is high, it is possible to set the error parameter value by using both the first prediction measurement and the second prediction measurement.
また、第5の形態として、第4の形態の位置算出方法であって、前記判定により前記信頼性が所定の低信頼性条件を満たすと判定された場合に、前記設定された誤差パラメーターの値を過去の値に基づいて調整することを更に含むとともに、前記位置を算出することは、前記調整された誤差パラメーターの値を用いて前記位置算出処理を行って位置を算出することを含む位置算出方法を構成してもよい。 Further, as a fifth mode, in the position calculation method according to the fourth mode, when the determination determines that the reliability satisfies a predetermined low reliability condition, the value of the set error parameter Adjusting the position based on the past value, and calculating the position includes calculating the position by performing the position calculation process using the adjusted error parameter value. A method may be configured.
この第5の形態によれば、予測メジャメントの信頼性が所定の低信頼性条件を満たすと判定した場合は、設定された誤差パラメーターの値を過去の値に基づいて調整する。そして、調整された誤差パラメーターの値を用いて位置算出処理を行って位置を算出する。例えば、第1の予測メジャメントの信頼性が低い場合は、誤差パラメーターの過去の値のうちの信頼性の高い誤差パラメーターの値を用いて、設定した誤差パラメーターの値を調整する。これにより、より適切な誤差パラメーターの値を用いて位置算出処理を行うことが可能となり、位置算出の正確性が一層向上する。 According to the fifth embodiment, when it is determined that the reliability of the prediction measurement satisfies the predetermined low reliability condition, the value of the set error parameter is adjusted based on the past value. Then, a position calculation process is performed using the adjusted error parameter value to calculate a position. For example, when the reliability of the first prediction measurement is low, the set error parameter value is adjusted using a highly reliable error parameter value among past error parameter values. As a result, the position calculation process can be performed using a more appropriate error parameter value, and the accuracy of position calculation is further improved.
また、第6の形態として、第1〜第5の何れかの形態の位置算出方法であって、前記測位用信号の信号強度と、前記観測メジャメント及び前記予測メジャメントの差と、前記観測メジャメントの想定誤差との対応関係が予め定められており、受信した前記測位用信号の信号強度を測定することを更に含み、前記誤差パラメーターの値を設定することは、前記測定された信号強度、及び、前記観測メジャメントと前記予測メジャメントとの差を用いて前記想定誤差を求めることと、前記想定誤差に基づいて前記誤差パラメーターの値を設定することと、を含む位置算出方法を構成してもよい。 Further, as a sixth embodiment, the position calculation method according to any one of the first to fifth embodiments, wherein the signal strength of the positioning signal, the difference between the observation measurement and the prediction measurement, and the observation measurement Correspondence with an assumed error is predetermined, and further includes measuring the signal strength of the received positioning signal, and setting the error parameter value includes the measured signal strength, and You may comprise the position calculation method including calculating | requiring the said assumption error using the difference of the said observation measurement and the said prediction measurement, and setting the value of the said error parameter based on the said assumption error.
この第6の形態によれば、受信した測位用信号の信号強度を測定し、測定された信号強度、及び、観測メジャメントと予測メジャメントとの差を用いて、予め定められた対応関係に従って想定誤差を求める。そして、求めた想定誤差に基づいて誤差パラメーターの値を設定する。 According to the sixth embodiment, the signal strength of the received positioning signal is measured, and the estimated error is measured according to a predetermined correspondence relationship using the measured signal strength and the difference between the observation measurement and the prediction measurement. Ask for. Then, an error parameter value is set based on the calculated assumed error.
観測メジャメントと予測メジャメントとの差と、メジャメントの想定誤差との対応関係を予め定めておき、当該対応関係に従って想定誤差を求めることで、誤差パラメーターの値の設定を簡易に行うことが可能となる。また、測位用信号の信号強度別に対応関係を定めておくことで、受信した測位用信号の信号強度に応じて誤差パラメーターの値を適切に設定することができる。 It is possible to easily set error parameter values by predetermining the correspondence between the difference between the observed measurement and the predicted measurement and the expected error of the measurement and obtaining the expected error according to the corresponding relationship. . In addition, by defining a correspondence relationship for each signal strength of the positioning signal, the value of the error parameter can be appropriately set according to the signal strength of the received positioning signal.
また、第7の形態として、第1の形態の位置算出方法であって、前記測位用信号の信号強度と、前記測位用信号の信号品質の評価指標値である信号品質評価指標値と、前記観測メジャメントの想定誤差との対応関係が予め定められており、受信した前記測位用信号の信号強度を測定することと、受信した前記測位用信号の前記信号品質評価指標値を算出することと、を更に含み、前記誤差パラメーターの値を設定することは、前記測定された信号強度と前記算出された信号品質評価指標値とを用いて前記想定誤差を求めることと、前記想定誤差に基づいて前記誤差パラメーターの値を設定することと、を含む位置算出方法を構成してもよい。 Further, as a seventh form, the position calculation method of the first form, the signal strength of the positioning signal, the signal quality evaluation index value that is an evaluation index value of the signal quality of the positioning signal, Correspondence with an assumed error of observation measurement is predetermined, measuring the signal strength of the received positioning signal, calculating the signal quality evaluation index value of the received positioning signal, And setting the value of the error parameter includes obtaining the assumed error using the measured signal strength and the calculated signal quality evaluation index value, and based on the assumed error A position calculation method including setting an error parameter value may be configured.
この第7の形態によれば、受信した測位用信号の信号強度を測定するとともに、受信した測位用信号の信号品質評価指標値を算出する。そして、測定された信号強度と算出された信号品質評価指標値とを用いて、予め定められた対応関係に従って想定誤差を求め、当該想定誤差に基づいて誤差パラメーターの値を設定する。 According to the seventh embodiment, the signal strength of the received positioning signal is measured, and the signal quality evaluation index value of the received positioning signal is calculated. Then, using the measured signal strength and the calculated signal quality evaluation index value, an assumed error is obtained according to a predetermined correspondence relationship, and an error parameter value is set based on the assumed error.
信号品質評価指標値は、測位用信号の信号品質を評価するためのパラメーターであり、例えば信頼度指標XPRがこれに相当する。測位用信号の信号強度と、信号品質評価指標値と、メジャメントの想定誤差との対応関係を予め定めておき、当該対応関係に従って想定誤差を求めることで、誤差パラメーターの値の設定を簡易且つ適切に行うことが可能となる。 The signal quality evaluation index value is a parameter for evaluating the signal quality of the positioning signal. For example, the reliability index XPR corresponds to this parameter quality evaluation index value. The correspondence between the signal strength of the positioning signal, the signal quality evaluation index value, and the expected error in the measurement is determined in advance, and the error is determined according to the corresponding relationship, so that the error parameter value can be set easily and appropriately. Can be performed.
以下、図面を参照して、位置算出装置を備えた電子機器の一種である携帯型電話機に本発明を適用した場合の実施形態について説明する。尚、本発明を適用可能な実施形態が以下説明する実施形態に限定されるわけではない。 Hereinafter, with reference to the drawings, an embodiment in which the present invention is applied to a mobile phone which is a kind of electronic apparatus including a position calculation device will be described. Note that embodiments to which the present invention is applicable are not limited to the embodiments described below.
1.機能構成
図1は、本実施形態における携帯型電話機1の機能構成を示すブロック図である。携帯型電話機1は、GPSアンテナ10と、GPS受信部20と、ホストCPU(Central Processing Unit)40と、操作部50と、表示部60と、携帯電話用アンテナ65と、携帯電話用無線通信回路部70と、ROM(Read Only Memory)80と、RAM(Random Access Memory)90とを備えて構成される。
1. Functional Configuration FIG. 1 is a block diagram showing a functional configuration of a
GPSアンテナ10は、GPS衛星から発信されているGPS衛星信号を含むRF(Radio Frequency)信号を受信するアンテナであり、受信した信号をGPS受信部20に出力する。尚、GPS衛星信号は、衛星毎に異なる拡散符号の一種であるPRN(Pseudo Random Noise)コードで直接スペクトラム拡散方式により変調された1.57542[GHz]の通信信号である。PRNコードは、コード長1023チップを1PNフレームとする繰返し周期1msの擬似ランダム雑音符号である。
The
GPS受信部20は、GPSアンテナ10から出力された信号に基づいて携帯型電話機1の位置を計測する位置算出回路であり、いわゆるGPS受信機に相当する機能ブロックである。GPS受信部20は、RF(Radio Frequency)受信回路部21と、ベースバンド処理回路部30とを備えて構成される。尚、RF受信回路部21と、ベースバンド処理回路部30とは、それぞれ別のLSI(Large Scale Integration)として製造することも、1チップとして製造することも可能である。
The
RF受信回路部21は、RF信号の処理回路ブロックであり、所定の発振信号を分周或いは逓倍することで、RF信号乗算用の発振信号を生成する。そして、生成した発振信号を、GPSアンテナ10から出力されたRF信号に乗算することで、RF信号を中間周波数の信号(以下、「IF(Intermediate Frequency)信号」と称す。)にダウンコンバートし、IF信号を増幅等した後、A/D変換器でデジタル信号に変換して、ベースバンド処理回路部30に出力する。
The RF
ベースバンド処理回路部30は、RF受信回路部21から出力されたIF信号に対して相関処理等を行ってGPS衛星信号を捕捉・抽出し、データを復号して航法メッセージや時刻情報等を取り出す回路部である。ベースバンド処理回路部30は、演算制御部31と、ROM35と、RAM37とを備えて構成される。また、演算制御部31は、メジャメント取得演算部33を備えて構成される。
The baseband
メジャメント取得演算部33は、RF受信回路部21から出力された受信信号(IF信号)から、GPS衛星信号の捕捉を行う回路部であり、相関演算部331を備えて構成されている。メジャメント取得演算部33は、GPS衛星信号の受信周波数やコード位相等の情報を取得し、メジャメント観測値としてホストCPU40に出力する。また、メジャメント取得演算部33は、捕捉したGPS衛星信号の信号強度を測定し、測定した信号強度をホストCPU40に出力する。
The measurement
相関演算部331は、受信信号に含まれるPRNコードと、装置内部で発生させたレプリカコードとの相関を、例えばFFT(Fast Fourier transform)演算を用いて算出し積算する相関演算処理を行うことで、受信信号からGPS衛星信号を捕捉する。レプリカコードとは、擬似的に発生させた捕捉しようとするGPS衛星信号に含まれるPRNコードを模擬した信号である。
The
捕捉しようとするGPS衛星信号が間違いなければ、そのGPS衛星信号に含まれるPRNコードとレプリカコードとは一致し(捕捉成功)、間違っていれば一致しない(捕捉失敗)。そのため、算出された相関値のピークを判定することによってGPS衛星信号の捕捉が成功したか否かを判定でき、レプリカコードを次々に変更して、同じ受信信号との相関演算を行うことで、GPS衛星信号を捕捉することが可能となる。 If the GPS satellite signal to be captured is correct, the PRN code and replica code included in the GPS satellite signal match (capture success), and if they are incorrect, they do not match (capture failure). Therefore, by determining the peak of the calculated correlation value, it can be determined whether the acquisition of the GPS satellite signal was successful, by changing the replica code one after another, and performing the correlation operation with the same received signal, GPS satellite signals can be captured.
また、相関演算部331は、上述した相関演算処理を、レプリカコードの発生信号の周波数及び位相を変更しつつ行っている。レプリカコードの発生信号の周波数と受信信号の周波数とが一致し、且つ、PRNコードとレプリカコードとの位相が一致した場合に、相関値が最大となる。
In addition, the
より具体的には、捕捉対象のGPS衛星信号に応じた所定の周波数及び位相の範囲をサーチ範囲として設定する。そして、このサーチ範囲内で、PRNコードの開始位置(コード位相)を検出するための位相方向の相関演算と、周波数を検出するための周波数方向の相関演算とを行う。サーチ範囲は、例えば、周波数についてはGPS衛星信号の搬送波周波数である1.57542[GHz]を中心とする所定の周波数掃引範囲、位相についてはPRNコードのチップ長である1023チップのコード位相範囲内に定められる。 More specifically, a predetermined frequency and phase range corresponding to the GPS satellite signal to be captured is set as the search range. Then, within this search range, correlation calculation in the phase direction for detecting the start position (code phase) of the PRN code and correlation calculation in the frequency direction for detecting the frequency are performed. The search range is, for example, a predetermined frequency sweep range centered on 1.57542 [GHz] which is the carrier frequency of the GPS satellite signal for the frequency, and within the code phase range of 1023 chips which is the chip length of the PRN code for the phase. Determined.
ホストCPU40は、ROM80に記憶されているシステムプログラム等の各種プログラムに従って携帯型電話機1の各部を統括的に制御するプロセッサーである。また、ホストCPU40は、位置算出処理を行って携帯型電話機1の位置を計測して出力位置を決定し、当該出力位置をプロットした位置表示画面を生成して表示部60に表示させる。
The
操作部50は、例えばタッチパネルやボタンスイッチ等により構成される入力装置であり、押下されたキーやボタンの信号をホストCPU40に出力する。この操作部50の操作により、通話要求やメール送受信要求、位置算出要求等の各種指示操作入力がなされる。
The
表示部60は、LCD(Liquid Crystal Display)等により構成され、ホストCPU40から入力される表示信号に基づいた各種表示を行う表示装置である。表示部60には、位置表示画面や時刻情報等が表示される。
The
携帯電話用アンテナ65は、携帯型電話機1の通信サービス事業者が設置した無線基地局との間で携帯電話用無線信号の送受信を行うアンテナである。
The
携帯電話用無線通信回路部70は、RF変換回路、ベースバンド処理回路等によって構成される携帯電話の通信回路部であり、携帯電話用無線信号の変調・復調等を行うことで、通話やメールの送受信等を実現する。
The cellular phone wireless
ROM80は、読み取り専用の不揮発性の記憶装置であり、ホストCPU40が携帯型電話機1を制御するためのシステムプログラムや、位置算出機能を実現するための各種プログラムやデータ等を記憶している。
The
RAM90は、読み書き可能な揮発性の記憶装置であり、ホストCPU40により実行されるシステムプログラム、各種処理プログラム、各種処理の処理中データ、処理結果などを一時的に記憶するワークエリアを形成している。
The
2.原理
携帯型電話機1は、カルマンフィルター(以下、適宜「KF(Kalman Filter)」と表す。)を利用した位置算出処理(以下、「KF位置算出処理」と称す。)を行って位置を算出する。カルマンフィルターは、誤差を含む観測値を利用して、時々刻々と変化する状態量を推定する確率理論に基づく推定手法である。
2. Principle The
本実施形態では、携帯型電話機1の状態を表す状態量として、状態ベクトル「X」と呼ばれる行列を定義する。状態ベクトル「X」は、例えば、携帯型電話機1の3次元の位置「(x,y,z)」、3次元の移動速度「(u,v,w)」、3次元の加速度「(ax,ay,az)」、クロックのバイアス「b」及びクロックのドリフト「d」を成分とする次式(1)に示すような行列とすることができる。
![]()
![]()
また、携帯型電話機1の状態量に含まれる誤差を表すための行列として、誤差共分散行列「P」を定義する。誤差共分散行列「P」は、状態ベクトル「X」の各成分の誤差の共分散を表す11×11の行列である。
In addition, an error covariance matrix “P” is defined as a matrix for representing an error included in the state quantity of the
KF位置算出処理では、携帯型電話機1は、状態ベクトル「X」及び誤差共分散行列「P」の予測処理と補正処理とを行って、携帯型電話機1の位置を算出する。予測処理では、直前の補正処理において算出された状態ベクトルの補正値「X+」に対して、状態遷移行列「φ」と呼ばれる行列を作用させることで、現在の時刻における状態ベクトルの予測値「X−」を演算する。
In the KF position calculation processing, the
補正処理では、GPS衛星からのGPS衛星信号の受信に係る外部観測量(以下、本実施形態において「メジャメント」と称す。)を観測値として、予測処理により算出された状態ベクトルの予測値「X−」を補正・更新して、現在の時刻における状態ベクトルの補正値「X+」を演算する。具体的には、GPS衛星信号の受信周波数及びコード位相の2つの成分をメジャメントとし、メジャメント取得演算部33により取得・演算されたメジャメント(以下、このメジャメントを受信機が観測したメジャメントという意味で「メジャメント観測値」と称する。)を用いて補正処理を行う。尚、メジャメントはGPS衛星信号の受信周波数及びコード位相に限られず、適宜追加・変更することができる。 In the correction processing, an external observation amount (hereinafter referred to as “measurement” in the present embodiment) related to reception of a GPS satellite signal from a GPS satellite is used as an observation value, and the predicted value “X” of the state vector calculated by the prediction processing is used. − ”Is corrected / updated, and the correction value“ X + ”of the state vector at the current time is calculated. Specifically, two components of the GPS satellite signal reception frequency and code phase are used as measurements, and the measurement acquired and calculated by the measurement acquisition calculation unit 33 (hereinafter, this measurement is a measurement observed by the receiver. The correction processing is performed using “measurement observation value”. The measurement is not limited to the reception frequency and code phase of the GPS satellite signal, and can be added or changed as appropriate.
カルマンフィルターの理論では、観測値には誤差が含まれることを前提とし、この観測値に含まれる誤差を観測誤差(いわゆるR値)として、補正処理に反映させる。本実施形態では、GPS衛星信号のコード位相及び受信周波数の2つの成分であるメジャメントが観測値となるため、この2つの成分に含まれる誤差をそれぞれ設定する必要がある。 In the Kalman filter theory, it is assumed that an observed value includes an error, and the error included in the observed value is reflected in the correction process as an observed error (so-called R value). In the present embodiment, the measurement, which is two components of the code phase and the reception frequency of the GPS satellite signal, becomes an observation value, and it is necessary to set errors included in these two components.
具体的には、コード位相に含まれる誤差をコード位相観測誤差「RCP」、受信周波数に含まれる誤差を受信周波数観測誤差「RF」とした場合に、図2に示すような、コード位相観測誤差「RCP」と受信周波数観測誤差「RF」とを成分とする2×2の観測誤差行列「R」を定義する。本実施形態では観測誤差は行列の形で表されるため、「観測誤差行列」ともいう。 Specifically, when the error included in the code phase is the code phase observation error “R CP ” and the error included in the reception frequency is the reception frequency observation error “R F ”, the code phase as shown in FIG. A 2 × 2 observation error matrix “R” having the observation error “R CP ” and the reception frequency observation error “R F ” as components is defined. In the present embodiment, since the observation error is represented in the form of a matrix, it is also referred to as an “observation error matrix”.
観測値がホワイトノイズの特性を示すとき、観測値の分散「σ2」を観測誤差として設定すると、効果的なフィルターを実現できることが知られている。しかし、観測値がホワイトノイズの特性を示すことは少なく、実際には、携帯型電話機1が備えるクロックのドリフトやバイアスの影響、GPS衛星信号を受信する際のマルチパスの影響等により、ホワイトノイズ以外のノイズ成分が含まれ得る。そのため、観測値の分散「σ2」を単純に観測誤差として設定したのでは、効果的なフィルターを実現できるとは限らない。
It is known that an effective filter can be realized by setting the observed value variance “σ 2 ” as an observation error when the observed value exhibits white noise characteristics. However, the observed values rarely show the characteristics of white noise. Actually, the white noise is caused by the effects of clock drift and bias provided in the
このことを実証するため、本願発明者は次の2つの実験を行った。第1の実験は、メジャメントを取得・収集してメジャメントの分散「σ2」を求め、求めた分散「σ2」を観測誤差として設定して位置算出計算を行う実験である。第2の実験は、メジャメントに実際に含まれている誤差(メジャメントの実誤差)を計測・収集し、このメジャメントの実誤差を観測誤差として設定して位置算出計算を行う実験である。 In order to prove this, the present inventor conducted the following two experiments. The first experiment determined the variance of measurement "sigma 2" to obtain-collecting measurement is calculated variance "sigma 2" the experiments employing the position calculation is set as observation error. The second experiment is an experiment for measuring and collecting errors actually included in the measurement (actual error of the measurement) and setting the actual error of the measurement as an observation error to perform position calculation calculation.
メジャメントの実誤差は、携帯型電話機1が観測したGPS衛星信号のコード位相及び受信周波数(メジャメント観測値)と、数学モデルによって理論的に求められるGPS衛星信号のコード位相及び受信周波数の真値(メジャメント理論値)との差である。メジャメント理論値は、GPS受信機の位置、移動速度及び移動方向の情報(受信機情報)が既知である場合に、当該受信機情報と、衛星軌道モデルを用いて算出したGPS衛星の位置、移動速度及び移動方向の情報(衛星情報)とを用いて、公知の手法に基づいて算出することができる。以下、この2つの実験の実験結果について説明する。
The actual measurement error includes the code phase and reception frequency (measurement observation value) of the GPS satellite signal observed by the
図3は、第1の実験において、観測誤差行列「R」に設定したコード位相観測誤差「RCP」の大きさと、コード位相の実誤差「ECP」の大きさとを2次元的にプロットしたグラフである。同様に、図4は、第1の実験において、受信周波数観測誤差「RF」の大きさと、受信周波数の実誤差「EF」の大きさとを2次元的にプロットしたグラフである。図3において、横軸はコード位相観測誤差「RCP」、縦軸はコード位相の実誤差「ECP」であり、それぞれメートル換算[m]で示している。また、図4において、横軸は受信周波数観測誤差「RF」、縦軸は受信周波数の実誤差「EF」であり、それぞれメートル毎秒換算[m/s]で示している。また、各図において、1つのプロットが、1回の実験で得られた結果を示している。 FIG. 3 is a two-dimensional plot of the magnitude of the code phase observation error “R CP ” set in the observation error matrix “R” and the magnitude of the actual error “E CP ” of the code phase in the first experiment. It is a graph. Similarly, FIG. 4 is a graph in which the magnitude of the reception frequency observation error “R F ” and the magnitude of the actual error “E F ” of the reception frequency are two-dimensionally plotted in the first experiment. In FIG. 3, the horizontal axis represents the code phase observation error “R CP ”, and the vertical axis represents the actual error of the code phase “E CP ”, which is expressed in meters (m). In FIG. 4, the horizontal axis represents the reception frequency observation error “R F ”, and the vertical axis represents the actual error “E F ” of the reception frequency, each expressed in meters per second [m / s]. Moreover, in each figure, one plot has shown the result obtained by one experiment.
図3のコード位相の実験結果を見ると、コード位相観測誤差「RCP」の大きさは、「100m」の近傍のグループと、「1000m」の近傍のグループとの2つのグループに大きく分けられていることがわかる。しかし、コード位相観測誤差「RCP」の大きさが同じであっても、プロットが縦軸方向に広がっており、コード位相の実誤差「ECP」は広範な値となっていることがわかる。 Referring to the experimental results of the code phase in FIG. 3, the magnitude of the code phase observation error “R CP ” is roughly divided into two groups, a group near “100 m” and a group near “1000 m”. You can see that However, even if the code phase observation error “R CP ” has the same magnitude, the plot spreads in the vertical axis direction, and it can be seen that the actual error “E CP ” of the code phase has a wide range of values. .
図4の受信周波数の実験結果についても同様であり、受信周波数観測誤差「RF」の大きさは、「2m/s」の近傍のグループと、「10m/s」の近傍のグループとの2つのグループに大きく分けられていることがわかる。しかし、受信周波数観測誤差「RF」の大きさが同じであっても、受信周波数の実誤差「EF」は広範な値となっている。 The same applies to the experimental result of the reception frequency in FIG. 4, and the magnitude of the reception frequency observation error “R F ” is 2 between the group in the vicinity of “2 m / s” and the group in the vicinity of “10 m / s”. It can be seen that it is divided into two groups. However, even if the magnitude of the reception frequency observation error “R F ” is the same, the actual error “E F ” of the reception frequency has a wide range of values.
図5は、第2の実験において、観測誤差行列「R」に設定したコード位相観測誤差「RCP」の大きさと、コード位相の実誤差「ECP」の大きさとを2次元的にプロットしたグラフであり、横軸がコード位相観測誤差「RCP」、縦軸がコード位相の実誤差「ECP」である。この実験結果を見ると、コード位相の実誤差「ECP」をコード位相観測誤差「RCP」に設定したことで(RCP=ECP)、「RCP」と「ECP」との関係が線形となっていることがわかる。 FIG. 5 is a two-dimensional plot of the magnitude of the code phase observation error “R CP ” set in the observation error matrix “R” and the magnitude of the actual error “E CP ” of the code phase in the second experiment. The horizontal axis represents the code phase observation error “R CP ”, and the vertical axis represents the actual code phase error “E CP ”. From this experimental result, the code phase actual error “E CP ” is set to the code phase observation error “R CP ” (R CP = E CP ), and the relationship between “R CP ” and “E CP ”. It can be seen that is linear.
図6は、第2の実験において、観測誤差行列「R」に設定した受信周波数観測誤差「RF」の大きさと、受信周波数の実誤差「EF」の大きさとを2次元的にプロットしたグラフであり、横軸が受信周波数観測誤差「RF」、縦軸が受信周波数の実誤差「EF」である。この場合も、受信周波数の実誤差「ECP」を受信周波数観測誤差「RF」に設定したことで(RF=EF)、「RF」と「EF」との関係が線形となっている。 FIG. 6 is a two-dimensional plot of the magnitude of the received frequency observation error “R F ” set in the observation error matrix “R” and the magnitude of the actual error “E F ” of the received frequency in the second experiment. The horizontal axis represents the received frequency observation error “R F ”, and the vertical axis represents the actual error “E F ” of the received frequency. Also in this case, since the actual error “E CP ” of the reception frequency is set to the reception frequency observation error “R F ” (R F = E F ), the relationship between “R F ” and “E F ” is linear. It has become.
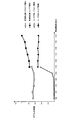
図7〜図9は、第1及び第2の実験それぞれについて、位置算出計算で求められた算出位置に含まれていた誤差(位置誤差)の大きさを示す実験結果である。位置算出計算で求められた算出位置と、携帯型電話機1の真位置との間の距離を計測して位置誤差とした。図7が緯度方向の誤差を、図8が経度方向の誤差を、図9が高度方向の誤差をそれぞれ示しており、各図において、横軸は時間、縦軸は誤差の大きさ[m]を示している。また、第1の実験で求められた誤差を点線で、第2の実験で求められた誤差を実線でそれぞれ示している。
FIGS. 7 to 9 are experimental results showing the magnitudes of errors (position errors) included in the calculated positions obtained by the position calculation calculation for the first and second experiments. The distance between the calculated position obtained by the position calculation and the true position of the
これらの実験結果を見ると、第1の実験では、緯度方向、経度方向、高度方向それぞれについて誤差が上下に大きく揺らいでおり、位置誤差が大きくなっていることがわかる。一方、第2の実験では、緯度方向、経度方向、高度方向のどれを見ても誤差は「0」の近傍の値をとっており、位置誤差が小さくなっていることがわかる。 Looking at these experimental results, in the first experiment, it can be seen that the error fluctuates greatly in the latitude direction, the longitude direction, and the altitude direction, and the position error increases. On the other hand, in the second experiment, it can be seen that the error is a value near “0” in any of the latitude direction, the longitude direction, and the altitude direction, and the position error is small.
図10は、第1及び第2の実験それぞれについて、全ての算出位置の位置誤差を平均することで得られた平均位置誤差の大きさを示す図である。また、第1及び第2の実験では、位置の他に、GPS衛星信号の受信周波数の時間変化に基づいて携帯型電話機1の移動速度も算出したため、全ての移動速度を平均することで得られた平均移動速度誤差の大きさも併せて図示している。
FIG. 10 is a diagram illustrating the magnitude of the average position error obtained by averaging the position errors of all the calculated positions for each of the first and second experiments. In the first and second experiments, since the moving speed of the
この実験結果を見ると、第1の実験では、平均位置誤差が「7.103m」、平均移動速度誤差が「0.3620m/s」であるのに対し、第2の実験では、平均位置誤差が「0.9699m」、平均速度誤差が「0.1897m/s」となっており、どちらも第1の実験結果に比べて誤差が小さくなっていることがわかる。特に、平均位置誤差はその差が顕著であり、第1の実験と比べて平均位置誤差がおよそ1/10となっていることがわかる。 From this experimental result, in the first experiment, the average position error is “7.103 m” and the average moving speed error is “0.3620 m / s”, whereas in the second experiment, the average position error is Is “0.9699 m” and the average speed error is “0.1897 m / s”, and it can be seen that the error is smaller than that of the first experimental result. In particular, the difference is significant in the average position error, and it can be seen that the average position error is about 1/10 compared with the first experiment.
これらの実験結果から、メジャメントの実誤差との間で強い相関を示すパラメーターを見つけることができれば、当該パラメーターの値を用いて適切な観測誤差を設定することが可能となり、位置算出の正確性が向上することがわかる。そこで、本願発明者は、3種類のパラメーターに着目し、これらのパラメーターを第1種〜第3種メジャメントパラメーターとして、メジャメントの実誤差との関係を調べた。 From these experimental results, if a parameter that shows a strong correlation with the actual measurement error can be found, it is possible to set an appropriate observation error using the value of that parameter, and the accuracy of position calculation can be improved. It turns out that it improves. Therefore, the inventor of the present application paid attention to three types of parameters, and examined the relationship with the actual error of the measurement using these parameters as the first to third type measurement parameters.
図11は、メジャメントパラメーターの説明図であり、メジャメントを模式化して概念的に示したものである。図11において、白丸はメジャメント観測値を示している。メジャメント観測値は、GPS衛星信号を受信した際に観測したメジャメントであり、GPS衛星信号のコード位相及び受信周波数の実測値である。 FIG. 11 is an explanatory diagram of measurement parameters, and schematically shows the measurement. In FIG. 11, white circles indicate measurement observation values. The measurement observation value is a measurement observed when the GPS satellite signal is received, and is an actual measurement value of the code phase and the reception frequency of the GPS satellite signal.
メジャメント予測値は、カルマンフィルターの理論を用いて予測されたメジャメントであり、GPS衛星信号のコード位相及び受信周波数の予測値である。本実施形態では、予測処理を行うことで得られた状態ベクトルの予測値「X−」に対して観測行列「H」と呼ばれる行列を作用させることで、メジャメントの予測値「HX−」を算出する。 The measurement prediction value is a measurement predicted using the Kalman filter theory, and is a prediction value of the code phase and reception frequency of the GPS satellite signal. In the present embodiment, the prediction value “HX − ” of the measurement is calculated by applying a matrix called an observation matrix “H” to the predicted value “X − ” of the state vector obtained by performing the prediction process. To do.
観測行列「H」は、状態ベクトルの予測値「X−」の各成分を用いて、メジャメントであるGPS衛星信号のコード位相及び受信周波数を予測するための行列であり、次式(2)に示すような2×11の行列で表される。

ここで、観測行列「H」に含まれる「Dx」、「Dy」及び「Dz」は、次式(3−1)〜(3−3)で表される。
図11の説明に戻って、メジャメント観測値のうち、最新のメジャメント観測値(以下、「最新メジャメント観測値」と称す。)の直前に取得されたメジャメント観測値を「前回メジャメント観測値」とし、前回メジャメント観測値を最新メジャメント観測値の取得時刻までプロパゲートさせた値(以下、「メジャメントのプロパゲート値」と称す。)を求める。ここで、プロパゲートとは、経過時間を用いた値の推定演算処理のことであり、ある時刻において取得・演算されたメジャメント観測値から、当該時刻よりも後の所定時刻(ここでは、最新メジャメント観測値の取得時刻)で取得した場合の値を推定する処理である。 Returning to the explanation of FIG. 11, the measurement observation value acquired immediately before the latest measurement observation value (hereinafter referred to as “latest measurement observation value”) among the measurement observation values is referred to as “previous measurement observation value”. The value obtained by propagating the previous measurement observation value until the acquisition time of the latest measurement observation value (hereinafter referred to as “propagation value of measurement”) is obtained. Here, a propagation is an estimation calculation process of a value using elapsed time. From a measurement observation value acquired and calculated at a certain time, a predetermined time (in this case, the latest measurement). This is a process for estimating a value obtained at the time of acquisition of observation value).
具体的には、受信周波数及びコード位相それぞれについて、次式(4)及び(5)に従って、前回メジャメント観測値のプロパゲート値を求める。
![]()
![]()
![]()
![]()
第1種メジャメントパラメーターは、最新メジャメント観測値と最新メジャメント予測値との差(以下、「最新観測予測差値」と称す。)として表されるパラメーターである。GPS衛星信号のコード位相及び受信周波数それぞれについて、最新観測予測差値を算出する。 The first type measurement parameter is a parameter expressed as a difference between the latest measurement observation value and the latest measurement prediction value (hereinafter referred to as “latest observation prediction difference value”). The latest observation prediction difference value is calculated for each of the code phase and the reception frequency of the GPS satellite signal.
第2種メジャメントパラメーターは、最新メジャメント観測値と、前回メジャメント観測値のプロパゲート値との差(以下、「最新前回観測差値」と称す。)として表されるパラメーターである。GPS衛星信号のコード位相及び受信周波数それぞれについて、最新前回観測差値を算出する。 The second type measurement parameter is a parameter represented as a difference between the latest measurement observation value and the propagation value of the previous measurement observation value (hereinafter referred to as “the latest previous observation difference value”). The latest previous observation difference value is calculated for each of the code phase and the reception frequency of the GPS satellite signal.
第3種メジャメントパラメーターは、GPS衛星信号の信号品質を評価するためのパラメーターの一種である信頼度指標XPR(以下、単に「XPR」と称す。)である。XPRは、相関演算部331がコード位相方向の相関演算を行うことで得られた相関積算値の最大値「P1」と、相関積算値が最大となったコード位相から±1/2チップ以上離れたコード位相における相関積算値のうちの最大の相関積算値「P2」とを用いて、次式(6)に従って算出することができる。
![]()
![]()
これらの3種類のメジャメントパラメーターそれぞれについて、実際に取得・演算されたメジャメント観測値と、予測処理により求めたメジャメント予測値とを用いてメジャメントパラメーターの値を実際に計算し、その計算値と、メジャメントの実誤差との関係を調べる実験を行った。その実験結果を以下に示す。 For each of these three types of measurement parameters, the actual measurement parameter values are calculated using the measurement observation values actually obtained and calculated and the measurement prediction values obtained by the prediction process. An experiment was conducted to investigate the relationship with the actual error. The experimental results are shown below.
図12は、コード位相について、第1種メジャメントパラメーターである最新観測予測差値と、コード位相の実誤差との関係を示すグラフである。1つのプロットが、1回の計測における結果を示している。横軸はコード位相の最新観測予測差値、縦軸はコード位相の実誤差である。このグラフを見ると、プロットが原点近傍から右上方向に向けて広がっており、コード位相の最新観測予測差値と実誤差とはおよそ線形的な関係にあり、強い正の相関を示すことがわかる。 FIG. 12 is a graph showing the relationship between the latest observed prediction difference value, which is the first type measurement parameter, and the actual error of the code phase with respect to the code phase. One plot shows the result of one measurement. The horizontal axis represents the latest observed prediction difference value of the code phase, and the vertical axis represents the actual error of the code phase. Looking at this graph, the plot spreads from the vicinity of the origin to the upper right direction, and it can be seen that the latest observed prediction difference value of the code phase and the actual error are approximately linearly related, indicating a strong positive correlation. .
図13は、コード位相について、第2種メジャメントパラメーターである最新前回観測差値と、コード位相の実誤差との関係を示すグラフである。1つのプロットが、1回の計測における結果を示している。横軸はコード位相の最新前回観測差値、縦軸はコード位相の実誤差である。このグラフを見ると、プロットは縦軸方向にはそれほど広がっていないが、横軸方向には広範に広がっていることがわかる。また、図12の結果ほどではないが、プロットが原点近傍から右上方向に向けて広がっており、弱い正の相関が見られる。 FIG. 13 is a graph showing the relationship between the latest previous observed difference value, which is the second type measurement parameter, and the actual error of the code phase with respect to the code phase. One plot shows the result of one measurement. The horizontal axis represents the latest observed difference value of the code phase, and the vertical axis represents the actual error of the code phase. From this graph, it can be seen that the plot does not spread so much in the vertical axis direction, but spreads widely in the horizontal axis direction. Further, although not as much as the result of FIG. 12, the plot spreads from the vicinity of the origin toward the upper right direction, and a weak positive correlation is seen.
図14は、コード位相について、第3種メジャメントパラメーターであるXPRと、コード位相の実誤差とを2次元的にプロットしたグラフである。1つのプロットが、1回の計測における結果を示している。横軸はコード位相のXPR、縦軸はコード位相の実誤差である。このグラフを見ると、プロットは、原点近傍には存在せず、グラフの中央部に集中していることがわかる。この中央部のプロットを見ると、プロットは左上方向から右下方向に広がっており、XPRとメジャメントの実誤差との間には負の相関が見られる。 FIG. 14 is a graph obtained by two-dimensionally plotting the XPR that is the third type measurement parameter and the actual error of the code phase with respect to the code phase. One plot shows the result of one measurement. The horizontal axis represents the code phase XPR, and the vertical axis represents the actual code phase error. From this graph, it can be seen that the plot does not exist near the origin, but is concentrated in the center of the graph. Looking at the central plot, the plot spreads from the upper left direction to the lower right direction, and a negative correlation is seen between the XPR and the actual measurement error.
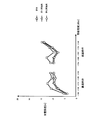
図15〜図17は、受信周波数について同様の実験を行った実験結果である。図15が、第1種メジャメントパラメーターである最新観測予測差値と受信周波数の実誤差との関係を示すグラフであり、図16が、第2種メジャメントパラメーターである最新前回観測差値と受信周波数の実誤差との関係を示すグラフであり、図17が、第3種メジャメントパラメーターであるXPRと受信周波数の実誤差との関係を示すグラフである。これらのグラフを見ると、受信周波数についても、コード位相の場合と同様の相関特性を示していることがわかる。 15 to 17 show experimental results obtained by performing a similar experiment on the reception frequency. FIG. 15 is a graph showing the relationship between the latest observed predicted difference value, which is the first type measurement parameter, and the actual error of the received frequency, and FIG. 16 is the latest previous observed difference value, which is the second type measurement parameter, and the received frequency. FIG. 17 is a graph showing the relationship between the XPR as the third type measurement parameter and the actual error of the reception frequency. As can be seen from these graphs, the reception frequency shows the same correlation characteristics as in the case of the code phase.
以上の実験結果から、第1種メジャメントパラメーターである最新観測予測差値は、メジャメントの実誤差との関係で強い正の相関を示すことがわかった。また、第2種及び第3種メジャメントパラメーターである最新前回観測差値及びXPRについても、第1種メジャメントパラメーターほどではないものの、メジャメントの実誤差との間で相関を示すことがわかった。
From the above experimental results, it was found that the latest observed prediction difference value, which is the first type measurement parameter, shows a strong positive correlation with the actual error of the measurement. It was also found that the latest previous observed difference value and XPR, which are the
この結果に基づき、メジャメントパラメーターの値と、想定されるメジャメント観測値に含まれる誤差の値(以下、「メジャメント想定誤差値」と称す。)との対応関係を定めたモデル式(以下、「メジャメント想定誤差値モデル式」と称す。)を定式化し、このメジャメント想定誤差値モデル式に従って算出したメジャメント想定誤差値を用いて、観測誤差行列「R」に設定する観測誤差の値を決定する実施形態を考案した。 Based on this result, a model formula (hereinafter referred to as “measurement”) that defines the correspondence between the measurement parameter value and the error value included in the expected measurement observation value (hereinafter referred to as “measurement expected error value”). An embodiment that formulates an “assumed error value model equation”) and determines an observation error value to be set in the observation error matrix “R” using the expected measurement error value calculated according to the expected measurement error value model equation. Devised.
具体的には、図12〜図17の実験結果を用いて、全てのプロットとの間の距離が最小となるような近似式を最小二乗法を用いて求め、当該近似式をメジャメント想定誤差モデル式に決定する。例えば、図12に示した第1種メジャメントパラメーターについてのコード位相の実験結果に対して最小二乗法を利用した関数のフィッティングを行うことで、図12に示すような正の一次関数で表される近似式を得ることができる。この近似式を、第1種メジャメントパラメーターの値を用いてコード位相の想定誤差値を算出するためのモデル式とし、以下、第2種及び第3種メジャメントパラメーターに関する近似式も同様のモデル式とする。また、これらのモデル式を包括的に「メジャメント想定誤差値モデル式」と呼ぶ。 Specifically, using the experimental results of FIGS. 12 to 17, an approximate expression that minimizes the distance between all plots is obtained using the least square method, and the approximate expression is calculated as a measurement assumption error model. Decide on a formula. For example, by performing a function fitting using the least squares method on the code phase experimental result for the first type measurement parameter shown in FIG. 12, it is expressed as a positive linear function as shown in FIG. An approximate expression can be obtained. This approximate expression is a model expression for calculating the expected error value of the code phase using the value of the first type measurement parameter. Hereinafter, the approximate expression related to the second type and the third type measurement parameter is also a similar model expression. To do. In addition, these model formulas are collectively referred to as “measurement assumption error value model formulas”.
同様に、図13に示した第2種メジャメントパラメーターについてのコード位相の実験結果に対して関数のフィッティングを行うと、図13に示すような正の一次関数で表される近似式を得ることができ、図14に示した第3種メジャメントパラメーターについてのコード位相の実験結果に対して関数のフィッティングを行うと、図14に示すような2つの負の一次関数を組み合わせた近似式を得ることができる。 Similarly, when function fitting is performed on the code phase experimental result for the second type measurement parameter shown in FIG. 13, an approximate expression represented by a positive linear function as shown in FIG. 13 can be obtained. When the function fitting is performed on the code phase experimental result for the third type measurement parameter shown in FIG. 14, an approximate expression combining two negative linear functions as shown in FIG. 14 can be obtained. it can.
また、本願発明者は、GPS受信機の受信感度によって、得られるメジャメント想定誤差値モデル式が変化することを発見した。具体的には、屋内環境(インドア環境)と屋外環境(アウトドア環境)のそれぞれについて、受信感度を変えながらメジャメントパラメーターの値とメジャメントの実誤差との関係を求め、上述した関数のフィッティングを行ってメジャメント想定誤差値モデル式を決定した。 Further, the inventor of the present application has found that the expected measurement error value model formula varies depending on the reception sensitivity of the GPS receiver. Specifically, for each of the indoor environment (indoor environment) and the outdoor environment (outdoor environment), the relationship between the measurement parameter value and the actual measurement error is obtained while changing the reception sensitivity, and the above-described function fitting is performed. A measurement assumption error value model formula was determined.
図18は、GPS衛星信号の受信感度とメジャメント想定誤差値モデル式の係数(モデル式係数)との関係を示すグラフである。ここで示すモデル式係数は、第1種メジャメントパラメーターについて求めたメジャメント想定誤差値モデル式の一次の係数(一次関数の傾き)である。図18において、横軸は受信感度[dBm]、縦軸はモデル式係数をそれぞれ示している。ダイヤ形は、受信周波数についての実験結果を示しており、白のダイヤ形はアウトドア環境で求めたモデル式係数、黒のダイヤ形はインドア環境で求めたモデル式係数である。また、矩形は、コード位相についての実験結果を示しており、白の矩形はアウトドア環境で求めたモデル式係数、黒の矩形はインドア環境で求めたモデル式係数である。 FIG. 18 is a graph showing the relationship between the reception sensitivity of a GPS satellite signal and the coefficient (model formula coefficient) of a measurement assumed error value model formula. The model formula coefficient shown here is a first-order coefficient (gradient of a linear function) of a measurement assumed error value model formula obtained for the first type measurement parameter. In FIG. 18, the horizontal axis represents reception sensitivity [dBm], and the vertical axis represents model equation coefficients. The diamond shape shows the experimental results for the reception frequency. The white diamond shape is a model equation coefficient obtained in an outdoor environment, and the black diamond shape is a model equation coefficient obtained in an indoor environment. In addition, the rectangle indicates the experimental result of the code phase, the white rectangle is the model equation coefficient obtained in the outdoor environment, and the black rectangle is the model equation coefficient obtained in the indoor environment.
この結果を見ると、受信周波数については、アウトドア環境では、モデル式係数はほぼ横ばいであるが、インドア環境では、受信感度が良くなるにつれて、モデル式係数が漸増していることがわかる。また、コード位相については、アウトドア環境では、受信感度が「−130dBm〜−142dBm」の範囲ではモデル式係数は横ばいであるが、「−142dBm〜−144dBm」の範囲では漸増し、「−144dBm〜−145dBm」の範囲では急増していることがわかる。他方、インドア環境では、モデル式係数はほぼ横ばいである。 From this result, it can be seen that for the reception frequency, the model formula coefficient is almost flat in the outdoor environment, but in the indoor environment, the model formula coefficient gradually increases as the reception sensitivity improves. As for the code phase, in the outdoor environment, the model coefficient is flat in the range of “−130 dBm to −142 dBm”, but gradually increases in the range of “−142 dBm to −144 dBm” and increases from “−144 dBm to It can be seen that there is a rapid increase in the range of −145 dBm. On the other hand, in the indoor environment, the model formula coefficient is almost flat.
この結果からわかることは、GPS受信機の受信感度に応じてモデル式係数が変化するため、1つのモデル式に従ってメジャメント想定誤差値を算出するのは適切ではないということである。すなわち、受信したGPS衛星信号の信号強度を測定し、測定した信号強度に応じたモデル式に従ってメジャメント想定誤差値を算出することが適切であるということである。 As can be seen from this result, the model formula coefficient changes according to the reception sensitivity of the GPS receiver, and therefore, it is not appropriate to calculate the expected measurement error value according to one model formula. That is, it is appropriate to measure the signal strength of the received GPS satellite signal and calculate the expected measurement error value according to the model formula corresponding to the measured signal strength.
ところで、上述した3種類のメジャメントパラメーターの値は、GPS衛星信号の受信環境に応じて、その正確性が変化する。すなわち、GPS衛星信号の受信環境が良ければ、メジャメントパラメーターの値の正確性は高くなり、GPS衛星信号の受信環境が悪ければ、メジャメントパラメーターの値の正確性は低くなる。メジャメント想定誤差値は、メジャメントパラメーターの値をメジャメント想定誤差値モデル式に代入することで算出されるため、メジャメント想定誤差値の正確性は、メジャメントパラメーターの値の正確性に依存する。 By the way, the accuracy of the values of the three types of measurement parameters described above varies depending on the reception environment of the GPS satellite signal. That is, if the GPS satellite signal reception environment is good, the accuracy of the measurement parameter value is high, and if the GPS satellite signal reception environment is bad, the accuracy of the measurement parameter value is low. Since the expected measurement error value is calculated by substituting the measurement parameter value into the measurement expected error value model equation, the accuracy of the expected measurement error value depends on the accuracy of the measurement parameter value.
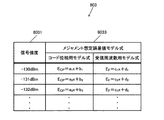
そこで、本実施形態では、メジャメントパラメーターの値に基づいて、算出されたメジャメント想定誤差値の信頼性を判定する。具体的には、メジャメント想定誤差値の信頼性を示す指標値として、「1」〜「3」の3段階で表される信頼度を定義する。信頼度は、数値が低い方が信頼性が高く、「1」が最も信頼性が高いことを意味する。信頼度の判定方法は、メジャメントパラメーターの種類に応じて異なる。 Therefore, in this embodiment, the reliability of the calculated expected error value is determined based on the value of the measurement parameter. Specifically, the reliability expressed in three stages of “1” to “3” is defined as an index value indicating the reliability of the expected measurement error value. The lower the numerical value, the higher the reliability, and “1” means the highest reliability. The method for determining the reliability differs depending on the type of measurement parameter.
図19は、信頼度の判定方法を定めた信頼度判定用データのデータ構成例を示す図である。信頼度判定用データには、「1」〜「3」の信頼度と、メジャメント想定誤差値の種類とが対応付けられている。第1〜第3種メジャメントパラメーターを用いて算出されたメジャメント想定誤差値を、それぞれ「第1種〜第3種メジャメント想定誤差値」と称する。 FIG. 19 is a diagram illustrating a data configuration example of reliability determination data that defines a determination method of reliability. In the reliability determination data, the reliability of “1” to “3” is associated with the type of expected measurement error value. The estimated measurement error values calculated using the first to third type measurement parameters are referred to as “first to third type measurement expected error values”, respectively.
本願発明者が実験を行った結果、携帯型電話機1(GPS受信機)が急加速状態にある場合は、第1種メジャメントパラメーターである最新観測予測差値が極端に大きくなる傾向があることがわかった。これは次の理由によるものである。携帯型電話機1が急加速の状態にある場合には、カルマンフィルターの予測処理において状態ベクトル「X」の予測が正しく行われず、求められる状態ベクトルの予測値「X−」の正確性が低下する。その結果、式(2)及び(3)に従って算出される観測行列「H」が適切なものではなくなり、状態ベクトルの予測値「X−」に観測行列「H」を作用させることで得られるメジャメントの予測値「HX−」の正確性が低下する。最新観測予測差値は、最新メジャメント観測値と最新メジャメント予測値との差であるため、メジャメント予測値の正確性が低くなると、結果的に、最新観測予測差値の正確性も低下する。
As a result of experiments conducted by the inventor of the present application, when the mobile phone 1 (GPS receiver) is in a rapid acceleration state, the latest observation prediction difference value that is the first type measurement parameter tends to become extremely large. all right. This is due to the following reason. When the
そこで、第1種メジャメント想定誤差値の信頼性については、最新観測予測差値に対する閾値判定を行うための所定の閾値(以下、「第1の閾値」として説明する。)を設定しておき、最新観測予測差値が第1の閾値に満たない場合は信頼度「1」、最新観測予測差値が第1の閾値以上である場合は信頼度「2」と判定する。また、初期定点化前(First Fix前)は、状態ベクトル「X」の予測が正確に行われない可能性が高いため、信頼度「3」と判定する。第1種メジャメント想定誤差値の信頼性は、最新観測予測差値の信頼性と等価であり、最新観測予測差値の信頼性はメジャメント予測値の正確性によって決まるため、メジャメント予測値の信頼性とも言える。
Therefore, for the reliability of the first-type measurement expected error value, a predetermined threshold value (hereinafter, referred to as “first threshold value”) for performing threshold determination for the latest observed prediction difference value is set. When the latest observation prediction difference value is less than the first threshold, the reliability is “1”, and when the latest observation prediction difference value is greater than or equal to the first threshold, the reliability is “2”. In addition, before the initial fixed point (before the first fix), there is a high possibility that the state vector “X” is not predicted accurately, so the reliability is determined to be “3”. The reliability of the
次に、第2種メジャメント想定誤差値の信頼性について説明する。図13及び図16のグラフを見ると、最新前回観測差値が小さい領域では、メジャメントの実誤差が縦軸方向に広範に分布しており、実誤差の振れ幅が大きくなっていることがわかる。すなわち、最新前回観測差値が小さい領域では、実誤差の収束性が悪い。このことから、最新前回観測差値が小さい場合には、メジャメント想定誤差値モデル式に従って算出されるメジャメント想定誤差値の正確性が低下するものと考えられる。
Next, the reliability of the
そこで、第2種メジャメントパラメーターについては、最新前回観測差値に対する閾値判定を行うための所定の閾値(以下、「第2の閾値」として説明する。)を設定しておき、算出された最新観測予測差値が第2の閾値以上である場合は信頼度「1」、最新前回観測差値が第2の閾値に満たない場合は信頼度「2」と判定する。また、前回メジャメント観測値が取得できていない場合は、最新前回観測差値を算出することができない。そのため、この場合は、メジャメント想定誤差値の算出が不可であるとして信頼度「3」と判定する。第2種メジャメント想定誤差値の信頼性は、最新前回観測差値の信頼性と等価であり、最新前回観測差値の信頼性はメジャメントのプロパゲート値の正確性によって決まるため、プロパゲート値の信頼性とも言える。
Therefore, for the second type measurement parameter, a predetermined threshold value (hereinafter, referred to as “second threshold value”) for performing threshold determination for the latest previous observation difference value is set, and the calculated latest observation is calculated. When the predicted difference value is greater than or equal to the second threshold, the reliability is determined as “1”, and when the latest previous observed difference value is less than the second threshold, the reliability is determined as “2”. Further, when the previous measurement observation value cannot be acquired, the latest previous observation difference value cannot be calculated. Therefore, in this case, the reliability is determined to be “3” because it is impossible to calculate the expected measurement error value. The reliability of the
第3種メジャメント想定誤差値の信頼性については、XPRが大きいほど、受信したGPS衛星信号に含まれるノイズ成分の割合が低いため信号品質が高く、XPRが小さいほど、受信したGPS衛星信号に含まれるノイズ成分の割合が高いため信号品質は低いと言える。そのため、XPRに対する閾値判定を行うための所定の閾値(以下、「第3の閾値」として説明する。)を設定しておき、算出されたXPRが第3の閾値以上である場合は信頼度「1」、XPRが第3の閾値に満たない場合は信頼度「2」と判定する。第3種メジャメント想定値の信頼性は、XPRの信頼性と等価である。
Regarding the reliability of the
上述した判定方法に従ってメジャメント想定誤差値の信頼性を判定したら、第1種〜第3種メジャメント想定誤差値に優先順位を付ける。詳細は第2実施例で説明するが、基本的には、第1種メジャメント想定誤差値の優先順位を最も高くする。但し、第1種メジャメント想定誤差値の信頼性が低い場合があるため、その場合は第2種メジャメント想定誤差値の優先順位を高くし、第2種メジャメント想定誤差値の信頼性が低い場合は、第3種メジャメント想定誤差値の優先順位を高くする。
When the reliability of the expected measurement error value is determined according to the determination method described above, the first to third type measurement expected error values are prioritized. Although details will be described in the second embodiment, basically, the priority of the first-type measurement assumed error value is made highest. However, since the reliability of the
優先順位が決まれば、優先順位の最も高いメジャメント想定誤差値を用いて観測誤差行列「R」に設定する観測誤差の値を決定する。具体的には、コード位相については、優先順位の最も高いメジャメント想定誤差値の二乗値を算出してコード位相観測誤差「RCF」に設定し、受信周波数については、優先順位の最も高いメジャメント想定誤差値の二乗値を算出して受信周波数観測誤差「RF」に設定する。 When the priority order is determined, an observation error value to be set in the observation error matrix “R” is determined using the measurement assumed error value with the highest priority order. Specifically, for the code phase, the square value of the measurement priority error value with the highest priority is calculated and set to the code phase observation error “R CF ”, and for the reception frequency, the measurement priority with the highest priority is assumed. The square value of the error value is calculated and set to the reception frequency observation error “R F ”.
3.第1実施例
第1実施例は、原理で説明した第1種〜第3種メジャメント想定誤差値のうち、第1種メジャメント想定誤差値のみを用いて観測誤差行列「R」を設定して、カルマンフィルターを利用した位置算出処理を行って位置を算出する実施例である。
3. First Example In the first example, an observation error matrix “R” is set using only the first type expected measurement error value among the first type to third type expected measurement error values described in the principle, It is an Example which calculates a position by performing the position calculation process using a Kalman filter.
3−1.データ構成
図20は、第1実施例において携帯型電話機1のROM80に格納されるデータの一例を示す図である。ROM80には、ホストCPU40により読み出され、メイン処理(図24参照)として実行されるメインプログラム801と、メジャメント想定誤差値モデル式データ803とが記憶されている。また、メインプログラム801には、KF位置算出処理(図25参照)として実行されるKF位置算出プログラム8011と、第1の観測誤差行列設定処理(図26参照)として実行される第1の観測誤差行列設定プログラム8013と、第1のメジャメント想定誤差値調整処理(図27参照)として実行される第1のメジャメント想定誤差値調整プログラム8015とがサブルーチンとして含まれている。
3-1. Data Configuration FIG. 20 is a diagram showing an example of data stored in the
メイン処理とは、ホストCPU40が、通話処理やメール送受信処理といった携帯電話機としての本来の機能を実現するための処理を行う他、KF位置算出処理を行って携帯型電話機1の位置を算出する処理である。
The main process is a process in which the
KF位置算出処理とは、ホストCPU40が、カルマンフィルターの理論に基づいて、携帯型電話機1の位置及び移動速度を含む状態ベクトル「X」に対する予測処理及び補正処理を行って携帯型電話機1の位置を算出し、算出した位置を出力位置として表示部60に表示させる処理である。
In the KF position calculation process, the
第1の観測誤差行列設定処理とは、ホストCPU40が、上述した原理に従って、KF位置算出処理の補正処理で使用するKFパラメーターの一種である観測誤差行列「R」を設定する処理である。
The first observation error matrix setting process is a process in which the
また、第1のメジャメント想定誤差値調整処理とは、ホストCPU40が、第1の観測誤差行列設定処理で算出したメジャメント想定誤差値の信頼性が低いと判定した場合に、過去に位置算出計算に使用されたメジャメント想定誤差値の平均値を用いて、メジャメント想定誤差値を調整する処理である。これらの処理については、フローチャートを用いて詳細に後述する。
The first measurement expected error value adjustment process is a position calculation calculation in the past when the
図22は、メジャメント想定誤差値モデル式データ803のデータ構成の一例を示す図である。メジャメント想定誤差値モデル式データ803には、GPS衛星信号の信号強度8031と対応付けて、メジャメント観測値であるコード位相及び受信周波数それぞれについて、メジャメント想定誤差値を算出するためのメジャメント想定誤差値モデル式8033が記憶されている。
FIG. 22 is a diagram illustrating an example of the data configuration of the measurement expected error value
メジャメント想定誤差値モデル式8033において、「ECP」はコード位相想定誤差値、「EF」は受信周波数想定誤差値を示している。「x」はメジャメントパラメーターを示しており、本実施例では最新観測予測差値がこれに該当する。また、「a(a1,a2,a3,・・・)」及び「b(b1,b2,b3,・・・)」は、それぞれコード位相用のモデル式の1次及び0次の係数、すなわちモデル式の傾き及び切片を示している。同様に、「c(c1,c2,c3,・・・)」及び「d(d1,d2,d3,・・・)」は、それぞれ受信周波数用のモデル式の1次及び0次の係数を示している。
In the measurement expected error
例えば、GPS衛星信号の信号強度が「−132dBm」である場合は、コード位相については「ECP=a3x+b3」という一次のモデル式に従ってコード位相想定誤差値「ECP」を算出し、受信周波数については「EF=c3x+d3」という一次のモデル式に従って受信周波数想定誤差値「EF」を算出する。 For example, when the signal strength of the GPS satellite signal is “−132 dBm”, the code phase assumption error value “E CP ” is calculated according to the first-order model formula “E CP = a 3 x + b 3 ” for the code phase, As for the reception frequency, a reception frequency assumption error value “E F ” is calculated according to a first-order model formula “E F = c 3 x + d 3 ”.
図21は、第1実施例において携帯型電話機1のRAM90に格納されるデータの一例を示す図である。RAM90には、メジャメントデータ901と、衛星軌道データ903と、KFパラメーターデータ905と、最終メジャメント想定誤差値履歴データ907とが記憶される。
FIG. 21 is a diagram showing an example of data stored in the
図23は、メジャメントデータ901のデータ構成の一例を示す図である。メジャメントデータ901には、各捕捉衛星9011について、メジャメント取得演算部33により取得・演算されたGPS衛星信号のコード位相及び受信周波数の観測値であるメジャメント観測値9013と、KF位置算出処理において予測されたGPS衛星信号の受信周波数及びコード位相の予測値であるメジャメント予測値9015とが対応付けて記憶される。
FIG. 23 is a diagram illustrating an example of the data configuration of the
例えば、捕捉衛星9011のうちの衛星「S1」についてメジャメント取得演算部33により取得・演算されたメジャメント観測値9013は、コード位相が「CP11」、受信周波数が「F11」であり、メジャメント予測値9015は、コード位相が「CP21」、受信周波数が「F21」である。
For example, the
衛星軌道データ903は、GPS衛星の衛星軌道情報を記憶したデータであり、各GPS衛星の概略の衛星軌道を示すアルマナックや、各GPS衛星の詳細な衛星軌道を示すエフェメリスがこれに含まれる。衛星軌道データ903は、例えばGPS衛星から受信したGPS衛星信号を復調することで取得したり、基地局のサーバーからサーバーアシストによって取得することができる。
The
KFパラメーターデータ905は、KF位置算出処理において予測処理及び補正処理が行われることで随時更新されるKFパラメーターのデータである。例えば、状態ベクトル「X」や誤差共分散行列「P」の値がこれに含まれ、特に本実施例では、観測誤差行列「R」9051がこれに含まれる。
The
最終メジャメント想定誤差値履歴データ907は、第1のメジャメント想定誤差値調整処理により最終的なメジャメント想定誤差値として求められたメジャメント想定誤差値(以下、「最終メジャメント想定誤差値」と称す。)の履歴のデータである。GPS衛星信号のコード位相及び受信周波数それぞれについて、過去に求められた最終メジャメント想定誤差値が蓄積記憶される。
The final measurement expected error
3−2.処理の流れ
図24は、ホストCPU40によりROM80に記憶されているメインプログラム801が読み出されて実行されることで、携帯型電話機1において実行されるメイン処理の流れを示すフローチャートである。メイン処理は、ホストCPU40が、操作部50を介してユーザーにより携帯型電話機1の電源投入指示操作がなされたことを検出した場合に実行を開始する処理である。
3-2. Processing Flow FIG. 24 is a flowchart showing the flow of main processing executed in the
特に説明しないが、以下のメイン処理の実行中は、GPSアンテナ10によるRF信号の受信や、RF受信回路部21によるIF信号へのダウンコンバート、メジャメント取得演算部33によるGPS衛星信号の受信周波数やコード位相(メジャメント観測値)の取得・演算等が随時行われている状態にあるものとする。
Although not specifically described, during execution of the following main processing, the reception of the RF signal by the
先ず、ホストCPU40は、操作部50を介してなされた指示操作を判定し(ステップA1)、指示操作が通話指示操作であると判定した場合は(ステップA1;通話指示操作)、通話処理を行う(ステップA3)。具体的には、携帯電話用無線通信回路部70に無線基地局との間の基地局通信を行わせ、携帯型電話機1と他機との間の通話を実現する。
First, the
また、ステップA1において指示操作がメール送受信指示操作であると判定した場合は(ステップA1;メール送受信指示操作)、ホストCPU40は、メール送受信処理を行う(ステップA5)。具体的には、携帯電話用無線通信回路部70に基地局通信を行わせ、携帯型電話機1と他機との間のメールの送受信を実現する。
If it is determined in step A1 that the instruction operation is a mail transmission / reception instruction operation (step A1; mail transmission / reception instruction operation), the
また、ステップA1において指示操作が位置算出指示操作であると判定した場合は(ステップA1;位置算出指示操作)、ホストCPU40は、ROM80に記憶されているKF位置算出プログラム8011を読み出して実行することで、KF位置算出処理を行う(ステップA7)。
When it is determined in step A1 that the instruction operation is a position calculation instruction operation (step A1; position calculation instruction operation), the
図25は、KF位置算出処理の流れを示すフローチャートである。
先ず、ホストCPU40は、KF位置算出処理用の状態ベクトル「X」及び誤差共分散行列「P」の初期値を設定する(ステップB1)。状態ベクトル「X」及び誤差共分散行列「P」の初期値は、例えば直前の補正処理で求められた状態ベクトル「X」及び誤差共分散行列「P」の補正値「X+」及び「P+」とすることができる。
FIG. 25 is a flowchart showing the flow of KF position calculation processing.
First, the
次いで、ホストCPU40は、状態ベクトル「X」及び誤差共分散行列「P」について、次式(7)及び(8)に従って予測処理を行い、状態ベクトルの予測値「X−」及び誤差共分散行列の予測値「P−」を算出する(ステップB3)。
![]()
![]()
![]()
![]()
但し、各式における添え字の「−」は予測値、「+」は補正値であることを示しており、「T」は転置行列であることを示している。また、「φ」は、状態遷移行列と呼ばれる状態ベクトル「X」の遷移を表す11×11の行列であり、「Q」は、システムノイズ行列と呼ばれる状態ベクトル「X」に含まれる各成分の変化の許容度を決定付ける11×11の行列である。状態遷移行列「φ」及びシステムノイズ行列「Q」は、例えば固定値として計算することができる。 However, the subscript “−” in each expression indicates a predicted value, “+” indicates a correction value, and “T” indicates a transposed matrix. “Φ” is an 11 × 11 matrix representing a transition of a state vector “X” called a state transition matrix, and “Q” is a component of each component included in the state vector “X” called a system noise matrix. It is an 11 × 11 matrix that determines the tolerance of change. The state transition matrix “φ” and the system noise matrix “Q” can be calculated as fixed values, for example.
次いで、ホストCPU40は、式(2)及び(3)に従って観測行列「H」を設定する(ステップB5)。具体的には、RAM90の衛星軌道データ903と現在の時刻とを用いて、捕捉衛星の衛星位置を算出する。そして、ステップB3の予測処理で求めた携帯型電話機1の予測位置と、捕捉衛星の衛星位置とを用いて、式(3−1)〜(3−3)に従って「Dx」、「Dy」及び「Dz」の値を算出し、これらの値を用いて、式(2)に従って観測行列「H」を設定する。
Next, the
その後、ホストCPU40は、メジャメント取得演算部33から各捕捉衛星からのGPS衛星信号のコード位相及び受信周波数を取得して、メジャメント観測値9013としてRAM90のメジャメントデータ901に記憶させるとともに、当該メジャメント観測値9013を含む2×1の行列を観測ベクトル「Z」として設定する(ステップB7)。
Thereafter, the
次いで、ホストCPU40は、ステップB3で算出した状態ベクトルの予測値「X−」にステップB5で設定した観測行列「H」を乗算することで、予測観測ベクトル「HX−」を算出する。そして、予測観測ベクトル「HX−」の成分であるGPS衛星信号のコード位相及び受信周波数の予測値をメジャメント予測値9015として、メジャメントデータ901に記憶させる(ステップB9)。
Next, the
その後、ホストCPU40は、ROM80に記憶されている第1の観測誤差行列設定プログラム8013を読み出して実行することで、第1の観測誤差行列設定処理を行う(ステップB11)。
Thereafter, the
図26は、第1の観測誤差行列設定処理の流れを示すフローチャートである。
先ず、ホストCPU40は、メジャメント取得演算部33から、捕捉されたGPS衛星信号の信号強度を取得する(ステップC1)。そして、ホストCPU40は、ROM80に記憶されているメジャメント想定誤差値モデル式データ803を参照し、取得した信号強度8031に対応付けられているメジャメント想定誤差値モデル式8033を選択する(ステップC3)。
FIG. 26 is a flowchart showing the flow of the first observation error matrix setting process.
First, the
次いで、ホストCPU40は、コード位相と受信周波数それぞれについて、ループAの処理を実行する(ステップC5〜C15)。ループAの処理では、ホストCPU40は、RAM90のメジャメントデータ901に記憶されている最新のメジャメント観測値9013と、最新のメジャメント予測値9015との差を算出して、最新観測予測差値とする(ステップC7)。そして、ホストCPU40は、算出した最新観測予測差値を用いて、ステップC1で選択したメジャメント想定誤差値モデル式に従ってメジャメント想定誤差値を算出する(ステップC9)。
Next, the
次いで、ホストCPU40は、ステップC9で算出したメジャメント想定誤差値の信頼度を判定する(ステップC11)。具体的には、図19に示した信頼度判定用データに含まれる第1種メジャメントパラメーターの信頼度の判定方法に従い、最新観測予測差値に対する閾値判定を行うことで、算出したメジャメント想定誤差値の信頼度が「1」〜「3」の何れに該当するかを判定する。
Next, the
その後、ホストCPU40は、ROM80に記憶されている第1のメジャメント想定誤差値調整プログラム8015を読み出して実行することで、第1のメジャメント想定誤差値調整処理を行う(ステップC13)。
Thereafter, the
図27は、第1のメジャメント想定誤差値調整処理の流れを示すフローチャートである。
先ず、ホストCPU40は、第1のメジャメント想定誤差値の信頼度が「2」であるか否かを判定し(ステップD1)、「2」であると判定した場合は(ステップD1;Yes)、RAM90に記憶されている最終メジャメント想定誤差値履歴データ907を参照し、過去に求められた最終メジャメント想定誤差値の平均値(以下、「過去平均値」と称す。)を算出する(ステップD3)。
FIG. 27 is a flowchart showing the flow of the first measurement expected error value adjustment process.
First, the
そして、ホストCPU40は、メジャメント想定誤差値と過去平均値とを加重平均計算し、その計算値を最終メジャメント想定誤差値として、最終メジャメント想定誤差値履歴データ907に記憶させる(ステップD5)。メジャメント想定誤差値の信頼度が「2」である場合は、メジャメント想定誤差値の信頼性が低いため、過去に求められた最終メジャメント想定誤差値を用いて、メジャメント想定誤差値を調整することにしている。具体的には、メジャメント想定誤差値の重みを「α」、過去平均値の重みを「1−α」として加重平均計算を行う。重み「α」は「0〜1」までの値で表され、例えば固定値(α=0.5)として計算することができる。
Then, the
一方、ステップD1において第1のメジャメント想定誤差値の信頼度が「2」ではなく「1」又は「3」であると判定した場合は(ステップD1:No)、ホストCPU40は、メジャメント想定誤差値を最終メジャメント想定誤差値として、最終メジャメント想定誤差値履歴データ907に記憶させる(ステップD7)。
On the other hand, if it is determined in step D1 that the reliability of the first measurement expected error value is not “2” but “1” or “3” (step D1: No), the
メジャメント想定誤差値の信頼度が「1」である場合は、メジャメント想定誤差値の信頼性が高いと言えるため、メジャメント想定誤差値の調整を行わずに最終メジャメント想定誤差値とする。また、メジャメント想定誤差値の信頼度が「3」である場合は、初期定点化前(First Fix前)であり、メジャメント想定誤差値の信頼性は低いと言える。しかし、この場合は過去のメジャメント想定誤差値が存在せず、メジャメント想定誤差値の調整を行うことができないため、メジャメント想定誤差値を最終メジャメント想定誤差値としている。 When the reliability of the expected measurement error value is “1”, it can be said that the reliability of the expected measurement error value is high. Therefore, the final expected measurement error value is not adjusted without adjusting the expected measurement error value. In addition, when the reliability of the expected measurement error value is “3”, it can be said that the reliability of the expected measurement error value is low before the initial fixed point (before the first fix). However, in this case, there is no past measurement expected error value, and the measurement expected error value cannot be adjusted, so the measurement expected error value is used as the final measurement expected error value.
ステップD5又はD7の処理を行った後、ホストCPU40は、第1のメジャメント想定誤差値調整処理を終了する。
After performing the processing of step D5 or D7, the
図26の第1の観測誤差行列設定処理に戻って、第1のメジャメント想定誤差値調整処理を行った後、ホストCPU40は、次のメジャメントの種類へと処理を移行する。そして、コード位相及び受信周波数のそれぞれについてステップC7〜C13の処理を行った後、ホストCPU40は、ループAの処理を終了する(ステップC15)。
Returning to the first observation error matrix setting process of FIG. 26, after performing the first measurement expected error value adjustment process, the
ループAの処理を終了すると、ホストCPU40は、コード位相及び受信周波数それぞれについて、ステップC11で得られた最終メジャメント想定誤差値の二乗値を観測誤差とした観測誤差行列「R」を設定する(ステップC17)。具体的には、コード位相について得られた最終メジャメント想定誤差値の二乗値をコード位相観測誤差「RCP」、受信周波数について得られた最終メジャメント想定誤差値の二乗値を受信周波数観測誤差「RF」として、図2に示したような観測誤差行列「R」を設定する。そして、ホストCPU40は、第1の観測誤差行列設定処理を終了する。
When the processing of the loop A is finished, the
図25のKF位置算出処理に戻って、第1の観測誤差行列設定処理を行った後、ホストCPU40は、次式(9)〜(11)に従って補正処理を行い、状態ベクトルの補正値「X+」及び誤差共分散行列の補正値「P+」を算出する(ステップB13)。
![]()
![]()
![]()
![]()
![]()
![]()
次いで、ホストCPU40は、補正処理で求めた状態ベクトルの補正値「X+」に含まれる3次元の位置成分(x,y,z)で表される位置を出力位置に決定する(ステップB15)。そして、ホストCPU40は、出力位置をプロットした位置表示画面を生成して、表示部60に表示させる(ステップB17)。
Next, the
そして、ホストCPU40は、操作部50を介してユーザーにより位置算出終了指示がなされたか否かを判定し(ステップB19)、なされなかったと判定した場合は(ステップB19;No)、ステップB1に戻る。また、位置算出終了指示がなされたと判定した場合は(ステップB19;Yes)、位置算出処理を終了する。
Then, the
図24のメイン処理に戻って、ステップA3〜A7の何れかの処理を行った後、ホストCPU40は、操作部50を介してユーザーにより電源切断指示操作がなされたか否かを判定する(ステップA9)。そして、なされなかったと判定した場合は(ステップA9;No)、ステップA1に戻る。また、電源切断指示操作がなされたと判定した場合は(ステップA9;Yes)、メイン処理を終了する。
Returning to the main process of FIG. 24, after performing any one of steps A3 to A7, the
3−3.作用効果
携帯型電話機1は、GPS衛星から受信したGPS衛星信号の受信周波数及びコード位相をメジャメントとし、このメジャメントを観測値として用いて、カルマンフィルターの理論に基づく位置算出処理を行って位置を算出する。位置算出処理では、最新のメジャメント観測値と最新のメジャメント予測値との差で表される最新観測予測差値(第1のメジャメントパラメーターの値)を算出し、算出した最新観測予測差値を用いて、カルマンフィルターの補正処理に使用する観測誤差行列「R」を設定する。
3-3. The
より具体的には、最新観測予測差値を用いてメジャメントに含まれる想定誤差値を算出するためのモデル式が、GPS衛星信号の信号強度に応じて予め定められている。携帯型電話機1は、受信したGPS衛星信号の信号強度を測定し、測定した信号強度に対応付けられたモデル式を選択する。そして、選択したモデル式に最新観測予測差値を代入することで、メジャメントの想定誤差値を算出する。
More specifically, a model formula for calculating an assumed error value included in the measurement using the latest observed prediction difference value is determined in advance according to the signal strength of the GPS satellite signal. The
最新観測予測差値と、メジャメントに含まれる実誤差とはおよそ線形的な関係にあり、相関性が強い。メジャメントに含まれる実誤差との間で強い相関を示すパラメーターを用いて想定誤差値を算出し、その二乗値を観測誤差行列「R」に設定することで、位置算出処理においてフィルターを効果的に作用させることができる。これにより、算出位置が真位置に対して時間的に遅れる“位置遅れ”や、カーブや曲がり角において算出位置の追従性が悪化する“ショートカット”といった事象が発生することを抑制し、位置算出の正確性を向上させることができる。 The latest observed prediction difference value and the actual error included in the measurement are approximately linearly related and strongly correlated. By calculating the assumed error value using a parameter that shows a strong correlation with the actual error included in the measurement, and setting the square value in the observation error matrix “R”, the filter can be effectively used in the position calculation process. Can act. This suppresses the occurrence of events such as “position delay” in which the calculated position is delayed in time with respect to the true position and “shortcut” in which the followability of the calculated position deteriorates at curves and corners. Can be improved.
また、最新観測予測差値を用いて算出したメジャメント想定誤差値の信頼度が「2」である場合は、過去のメジャメント想定誤差値の平均値を用いて、算出したメジャメント想定誤差値を調整することにしている。具体的には、算出したメジャメント想定誤差値とメジャメント想定誤差値の過去平均値との加重平均計算を行うことにしている。これにより、算出したメジャメント想定誤差値の信頼性がそれほど高くない場合であっても、過去の値に基づいて妥当な値に修正して観測誤差を設定することが可能となる。 When the reliability of the expected measurement error value calculated using the latest observed prediction difference value is “2”, the calculated expected measurement error value is adjusted using the average value of the past expected measurement error values. I have decided. Specifically, a weighted average calculation of the calculated expected measurement error value and the past average value of the expected measurement error value is performed. As a result, even if the reliability of the calculated expected error value is not so high, it is possible to set the observation error by correcting it to an appropriate value based on the past value.
4.第2実施例
第2実施例は、原理で説明した第1種〜第3種メジャメント想定誤差値を切り替えながら観測誤差行列「R」を設定し、カルマンフィルターを利用した位置算出処理を行って位置を算出する実施例である。
4). Second Example In the second example, an observation error matrix “R” is set while switching the first to third type expected measurement error values described in the principle, and a position calculation process using a Kalman filter is performed. It is an Example which calculates.
4−1.データ構成
図28は、第2実施例において携帯型電話機1のROM82に格納されたデータの一例を示す図である。ROM82には、メインプログラム801と、第2のメジャメント想定誤差値モデル式データ823と、信頼度判定用データ825とが記憶されている。また、メインプログラム801には、KF位置算出プログラム8011と、第2の観測誤差行列設定処理(図30及び図31参照)として実行される第2の観測誤差行列設定プログラム8213と、第2のメジャメント想定誤差値調整処理(図32参照)として実行される第2のメジャメント想定誤差値調整プログラム8215とがサブルーチンとして含まれている。
4-1. Data Configuration FIG. 28 is a diagram showing an example of data stored in the
図29は、第2のメジャメント想定誤差値モデル式データ823のデータ構成の一例を示す図である。第2のメジャメント想定誤差値モデル式データ823には、GPS衛星信号の信号強度8231と対応付けて、メジャメント想定誤差値モデル式8233が記憶されている。メジャメント想定誤差値モデル式8233には、第1種〜第3種メジャメントパラメーターそれぞれについて、メジャメント観測値であるコード位相及び受信周波数のメジャメント想定誤差値を算出するためのモデル式が記憶されている。
FIG. 29 is a diagram illustrating an example of a data configuration of second measurement assumed error value
4−2.処理の流れ
図30及び図31は、ホストCPU40が、ROM82に記憶されている第2の観測誤行列設定プログラム8213を読み出して実行することで、携帯型電話機1において実行される第2の観測誤差行列設定処理の流れを示すフローチャートである。
4-2. Process Flow FIGS. 30 and 31 show the second observation error that is executed in the
先ず、ホストCPU40は、メジャメント取得演算部33から、捕捉されたGPS衛星信号の信号強度を取得する(ステップE1)。そして、ホストCPU40は、ROM82に記憶されている第2のメジャメント想定誤差値モデル式データ823を参照し、3種類の各メジャメントパラメーターそれぞれについて、取得した信号強度8231に対応付けられているメジャメント想定誤差値モデル式8233を選択する(ステップE3)。
First, the
次いで、ホストCPU40は、コード位相と受信周波数それぞれについて、ループBの処理を実行する(ステップE5〜E39)。ループBの処理では、ホストCPU40は、RAM90のメジャメントデータ901に記憶されている最新のメジャメント観測値9013と、最新のメジャメント予測値9015との差を算出して、最新観測予測差値とする(ステップE7)。そして、ホストCPU40は、算出した最新観測予測差値を用いて、ステップE3で選択したメジャメント想定誤差値モデル式に従ってメジャメント想定誤差値を算出して、第1種メジャメント想定誤差値とする(ステップE9)。
Next, the
次いで、ホストCPU40は、ステップE9で算出した第1種メジャメント想定誤差値の信頼度を判定する(ステップE11)。具体的には、ROM82に記憶されている信頼度判定用データ823を参照し、第1種メジャメントパラメーターに対応付けられている信頼度の判定方法に従って最新観測予測差値に対する閾値判定を行うことで、第1種メジャメント想定誤差値の信頼度が「1」〜「3」の何れに該当するかを判定する。
Next, the
その後、ホストCPU40は、プロパゲート処理を行って、メジャメントデータ901に記憶されている前回のメジャメント観測値9013を、最新のメジャメント観測値9013の取得時刻までプロパゲートする(ステップE13)。
Thereafter, the
そして、ホストCPU40は、プロパゲート処理で得られた前回のメジャメント観測値9013のプロパゲート値と、最新のメジャメント観測値との差を算出して、最新前回観測差値とする(ステップE15)。また、ホストCPU40は、算出した最新前回観測差値を用いて、ステップE3で選択したメジャメント想定誤差値モデル式に従ってメジャメント想定誤差値を算出して、第2種メジャメント想定誤差値とする(ステップE17)。
Then, the
次いで、ホストCPU40は、ステップE17で算出した第2種メジャメント想定誤差値の信頼度を判定する(ステップE19)。具体的には、ROM82に記憶されている信頼度判定用データ823を参照し、第2種メジャメントパラメーターに対応付けられている信頼度の判定方法に従って最新前回観測差値に対する閾値判定を行うことで、第2種メジャメント想定誤差値の信頼度が「1」〜「3」の何れに該当するかを判定する。
Next, the
その後、ホストCPU40は、捕捉衛星から受信したGPS衛星信号の相関積算値に基づいてXPRを算出する(ステップE21)。そして、ホストCPU40は、算出したXPRを用いて、ステップE3で選択したメジャメント想定誤差値モデル式に従ってメジャメント想定誤差値を算出して、第3種メジャメント想定誤差値とする(ステップE23)。
Thereafter, the
次に、ホストCPU40は、ステップE23で算出した第3種メジャメント想定誤差値の信頼度を判定する(ステップE25)。具体的には、ROM82に記憶されている信頼度判定用データ825を参照し、第3種メジャメントパラメーターに対応付けられている信頼度の判定方法に従ってXPRに対する閾値判定を行うことで、第3種メジャメント想定誤差値の信頼度が「1」と「2」の何れに該当するかを判定する。
Next, the
その後、ホストCPU40は、第1種メジャメント想定誤差値の信頼度が「3」であるか否かを判定し(ステップE27)、「3」ではない、すなわち「1」か「2」であると判定した場合は(ステップE27;No)、第1種メジャメント想定誤差値を暫定メジャメント想定誤差値とする(ステップE29)。
Thereafter, the
一方、ステップE27において第1種メジャメント想定誤差値の信頼度が「3」であると判定した場合は(ステップE27;Yes)、ホストCPU40は、第2種メジャメント想定誤差値の信頼度が、第3種メジャメント想定誤差値の信頼度以下であるか否かを判定する(ステップE31)。すなわち、第2種メジャメント想定誤差値の信頼性が、第3種メジャメント想定誤差値の信頼性と同じかそれよりも高いかどうかを判定する。
On the other hand, when it is determined in step E27 that the reliability of the first-type measurement expected error value is “3” (step E27; Yes), the
そして、上述した条件を満たすと判定した場合は(ステップE31;Yes)、ホストCPU40は、第2種メジャメント想定誤差値を暫定メジャメント想定誤差値とする(ステップE33)。一方、上述した条件を満たさないと判定した場合は(ステップE31;No)、ホストCPU40は、第3種メジャメント想定誤差値を暫定メジャメント想定誤差値とする(ステップE35)。
And when it determines with satisfy | filling the conditions mentioned above (step E31; Yes), the host CPU40 makes a 2nd type measurement assumption error value a provisional measurement assumption error value (step E33). On the other hand, when it is determined that the above-described conditions are not satisfied (step E31; No), the
ステップE29、E33及びE35の何れかの処理を行った後、ホストCPU40は、ROM82に記憶されている第2のメジャメント想定誤差値調整プログラム8215を読み出して実行することで、第2のメジャメント想定誤差値調整処理を行う(ステップE37)。
After performing any of the processes of steps E29, E33, and E35, the
図32は、第2のメジャメント想定誤差値調整処理の流れを示すフローチャートである。
先ず、ホストCPU40は、暫定メジャメント想定誤差値が第1種メジャメント想定誤差値であるか否かを判定し(ステップF1)、第1種メジャメント想定誤差値であると判定した場合は(ステップF1;Yes)、暫定メジャメント想定誤差値である第1種メジャメント想定誤差値の信頼度が「2」であるか否かを判定する(ステップF3)。
FIG. 32 is a flowchart showing the flow of the second measurement expected error value adjustment process.
First, the
そして、信頼度が「2」であると判定した場合は(ステップF3;Yes)、ホストCPU40は、暫定メジャメント想定誤差値の大きさが所定の閾値以下であるか否かを判定する(ステップF5)。そして、閾値以下であると判定した場合は(ステップF5;Yes)、ホストCPU40は、RAM90の最終メジャメント想定誤差値履歴データ907を参照し、過去に求められた最終メジャメント想定誤差値の平均値を算出して過去平均値とする(ステップF7)。
If it is determined that the reliability is “2” (step F3; Yes), the
そして、ホストCPU40は、暫定メジャメント想定誤差値と過去平均値とを加重平均計算し、その計算値を最終メジャメント想定誤差値とし、最終メジャメント想定誤差値履歴データ907に記憶させる(ステップF9)。具体的には、暫定メジャメント想定誤差値の重みを「α」、過去平均値の重みを「1−α」として加重平均計算を行う。
Then, the
一方、ステップF5において暫定メジャメント想定誤差値が閾値を超えていると判定した場合は(ステップF5;No)、ホストCPU40は、第2種メジャメント想定誤差値と第3種メジャメント想定誤差値とのうち、信頼性が高い方のメジャメント想定誤差値を選択して最終メジャメント想定誤差値とし、最終メジャメント想定誤差値履歴データ907に記憶させる(ステップF11)。
On the other hand, when it is determined in step F5 that the provisional measurement expected error value exceeds the threshold value (step F5; No), the
また、ステップF1において暫定メジャメント想定誤差値が第1種メジャメント想定誤差値ではなく第2種又は第3種メジャメント想定誤差値であると判定した場合は(ステップF1;No)、ホストCPU40は、暫定メジャメント想定誤差値を最終メジャメント想定誤差値とし、最終メジャメント想定誤差値履歴データ907に記憶させる(ステップF13)。この場合は、第2種又は第3種メジャメント想定誤差値が最終メジャメント想定誤差値となる。
If it is determined in step F1 that the provisional measurement expected error value is not the first type measurement expected error value but the
また、ステップF3において暫定メジャメント想定誤差値である第1種メジャメント想定誤差値の信頼度が「2」ではなく「1」であると判定した場合にも(ステップF3;No)、ホストCPU40は、暫定メジャメント想定誤差値を最終メジャメント想定誤差値とし、最終メジャメント想定誤差値履歴データ907に記憶させる(ステップF13)。この場合は、第1種メジャメント想定誤差値が最終メジャメント想定誤差値となる。
In addition, when it is determined in step F3 that the reliability of the first type measurement expected error value, which is the provisional measurement expected error value, is “1” instead of “2” (step F3; No), the
尚、図31のステップE27、E29より、第1種メジャメント想定誤差値が暫定メジャメント想定誤差値となるのは、第1種メジャメント想定誤差値の信頼度が「1」か「2」の場合である。従って、図32でステップF1;Yesとなるのは、第1種メジャメント想定誤差値の信頼度が「1」か「2」の場合であり、ステップF3;Noとなるのは、第1種メジャメント想定誤差値の信頼度が「1」の場合に限られる。 From steps E27 and E29 of FIG. 31, the first type measurement expected error value becomes the provisional measurement expected error value when the reliability of the first type measurement expected error value is “1” or “2”. is there. Therefore, Step F1; Yes in FIG. 32 is the case where the reliability of the first type measurement expected error value is “1” or “2”, and Step F3; No is the first type measurement. Only when the reliability of the assumed error value is “1”.
そして、ステップF9〜F13の何れかの処理を行った後、ホストCPU40は、第2のメジャメント想定誤差値調整処理を終了する。
Then, after performing any one of steps F9 to F13, the
図31の第2の観測誤差行列設定処理に戻って、第2のメジャメント想定誤差値調整処理を行った後、ホストCPU40は、次のメジャメントの種類へと処理を移行する。そして、コード位相及び受信周波数のそれぞれについてステップE7〜E37の処理を行った後、ホストCPU40は、ループBの処理を終了する(ステップE39)。
Returning to the second observation error matrix setting process of FIG. 31, after performing the second expected error value adjustment process, the
ループBの処理を終了すると、ホストCPU40は、コード位相及び受信周波数それぞれについて、ステップE37で得られた最終メジャメント想定誤差値の二乗値を観測誤差とした観測誤差行列「R」を設定する(ステップE41)。そして、ホストCPU40は、第2の観測誤差行列設定処理を終了する。
When the processing of loop B is completed, the
4−3.作用効果
第2実施例によれば、第1種〜第3種メジャメントパラメーターそれぞれについて、メジャメント想定誤差値モデル式に従って算出した第1種〜第3種メジャメント想定誤差値の信頼度に基づいて、観測誤差として設定するメジャメント想定誤差値を切り替える。具体的には、第1種メジャメント想定誤差値の信頼度が「1」か「2」であれば、第1種メジャメント想定誤差値を用いて観測誤差を設定するが、第1種メジャメント想定誤差値の信頼度が「3」である場合は、第2種メジャメント想定誤差値の信頼度が第3種メジャメント想定誤差値の信頼度以下であれば、第2種メジャメント想定誤差値を用いて観測誤差を設定する。
4-3. According to the second embodiment, for each of the first type to third type measurement parameters, observation is performed based on the reliability of the first type to third type measurement assumed error value calculated according to the measurement assumed error value model equation. Switch the expected measurement error value to be set as the error. Specifically, if the reliability of the first type measurement expected error value is “1” or “2”, the observation error is set using the first type measurement assumed error value, but the first type measurement expected error is set. When the reliability of the value is “3”, if the reliability of the
第1種メジャメントパラメーターである最新観測予測差値は、メジャメントの実誤差との間で強い正の相関を示し、第1種〜第3種メジャメントパラメーターの中で観測誤差の設定に最も適したパラメーターである。そのため、第1種メジャメントパラメーターの信頼度が「3」となる場合を除いて、第1種メジャメント想定誤差値を用いて観測誤差を設定することにした。 The latest observed prediction difference value, which is the first type measurement parameter, shows a strong positive correlation with the actual measurement error, and is the most suitable parameter for setting the observation error among the first to third type measurement parameters. It is. Therefore, except for the case where the reliability of the first type measurement parameter is “3”, the observation error is set using the first type measurement expected error value.
また、第2種メジャメントパラメーターである最新前回観測差値は、メジャメントの実誤差との相関が第1種メジャメントパラメーターほど強くはないが、ある程度の正の相関を示すことがわかった。そのため、第1種メジャメントパラメーターの信頼性が低い場合は、第2種メジャメントパラメーター想定誤差値を用いて観測誤差を設定することにした。 It was also found that the latest previous observed difference value, which is the second type measurement parameter, shows a certain degree of positive correlation, although the correlation with the actual measurement error is not as strong as the first type measurement parameter. Therefore, when the reliability of the first type measurement parameter is low, the observation error is set using the second type measurement parameter assumed error value.
このように、メジャメント想定誤差値の信頼性に応じて観測誤差の設定に使用するメジャメント想定誤差値を切り替えることで、適切な観測誤差を設定して位置算出計算を行うことが可能となり、位置算出の正確性が一層向上する。 In this way, by switching the expected measurement error value used for setting the observation error according to the reliability of the expected measurement error value, it is possible to set the appropriate observation error and perform position calculation calculation. Accuracy is further improved.
5.実験結果
図33は、第1実施例で説明した手法と、第2実施例で説明した手法と、従来の手法とのそれぞれについて、位置算出計算を行って携帯型電話機1の位置を算出した場合の位置誤差の大きさを示す実験結果である。携帯型電話機1を搭載した自動車を高速走行と低速走行させ、位置算出計算で求められた算出位置と自動車の真位置との間の距離を位置誤差として計測した。
5. Experimental Results FIG. 33 shows the case where the position of the
図33において、横軸はGPS受信機の受信感度[dBm]、縦軸は位置誤差[m]である。また、丸印が第2実施例の手法で位置算出を行った場合の実験結果を、三角形が第1実施例の手法で位置算出を行った場合の実験結果を、矩形が従来の手法で位置算出を行った場合の実験結果をそれぞれ示している。 In FIG. 33, the horizontal axis represents the reception sensitivity [dBm] of the GPS receiver, and the vertical axis represents the position error [m]. In addition, the experimental results when the circles are calculated by the method of the second embodiment, the experimental results when the triangles are calculated by the method of the first embodiment, and the rectangles by the conventional method. The experimental results when the calculation is performed are shown.
この結果を見ると、全ての受信感度において、従来の手法を用いて位置算出計算を行った場合の位置誤差が最大となっていることがわかる。その一方で、第2実施例の手法を用いて位置算出を行った場合の位置誤差が最小となっており、それに次いで、第1実施例の手法を用いて位置算出を行った場合の位置誤差も小さくなっていることがわかる。 From this result, it can be seen that, for all reception sensitivities, the position error when the position calculation calculation is performed using the conventional method is maximized. On the other hand, the position error when the position calculation is performed using the method of the second embodiment is minimized, and then the position error when the position calculation is performed using the method of the first embodiment is performed. It can also be seen that it is getting smaller.
6.変形例
6−1.電子機器
本発明は、携帯型電話機の他にも、位置算出装置を備えた電子機器であれば何れの電子機器にも適用可能である。例えば、ノート型パソコンやPDA(Personal Digital Assistant)、カーナビゲーション装置、携帯型ナビゲーション装置等についても同様に適用可能である。
6). Modification 6-1. Electronic Device The present invention can be applied to any electronic device as long as it is an electronic device provided with a position calculating device in addition to a mobile phone. For example, the present invention can be similarly applied to a notebook personal computer, a PDA (Personal Digital Assistant), a car navigation device, a portable navigation device, and the like.
6−2.衛星位置算出システム
上述した実施形態では、衛星位置算出システムとしてGPSを例に挙げて説明したが、WAAS(Wide Area Augmentation System)、QZSS(Quasi Zenith Satellite System)、GLONASS(GLObal NAvigation Satellite System)、GALILEO等の他の衛星位置算出システムであってもよい。
6-2. In the above-described embodiment, the GPS is described as an example of the satellite position calculation system, but WAAS (Wide Area Augmentation System), QZSS (Quasi Zenith Satellite System), GLONASS (GLObal NAvigation Satellite System), GALILEO Other satellite position calculation systems may be used.
6−3.処理の分化
ホストCPU40が実行する処理の一部又は全部を、ベースバンド処理回路部30の演算制御部31が行う構成としてもよい。例えば、メジャメント取得演算部33により演算されたメジャメント観測値を用いて演算制御部31がKF位置算出処理を行って出力位置を決定し、ホストCPU40に出力することとしてもよい。そして、ホストCPU40は、演算制御部31から入力した出力位置を各種アプリケーションに利用する。
6-3. Differentiation of processing The
6−4.メジャメント想定誤差値の切替
第2実施例では、メジャメント想定誤差値の信頼度に基づいて、暫定メジャメント想定誤差値を第1種〜第3種メジャメント想定誤差値を切り替えて観測誤差の設定に使用するものとして説明したが、第3種メジャメント想定誤差値を用いずに、第1種及び第2種メジャメント想定誤差値の2種類を切り替えて観測誤差の設定に使用してもよい。
6-4. In the second embodiment, based on the reliability of the expected measurement error value, the provisional measurement expected error value is switched between the first type to third type expected measurement error value and used for setting the observation error. However, instead of using the third type expected measurement error value, the first type and second type expected measurement error value may be switched and used for setting the observation error.
具体的には、例えば、第1種メジャメント想定誤差値の信頼度が「3」である場合は、第1種メジャメント想定誤差値は信用できないものとして、第2種メジャメント想定誤差値を暫定メジャメント想定誤差値とする。一方、第1種メジャメント想定誤差値の信頼度が「1」か「2」である場合は、第1種メジャメント想定誤差値を信用して、第1種メジャメント想定誤差値を暫定メジャメント想定誤差値とする。 Specifically, for example, when the reliability of the first type measurement expected error value is “3”, the first type measurement expected error value is assumed to be unreliable, and the second type measurement assumed error value is set as a provisional measurement assumption. Error value. On the other hand, when the reliability of the first type measurement assumed error value is “1” or “2”, the first type measurement assumed error value is trusted and the first type measurement assumed error value is set as the provisional measurement assumed error value. And
また、第1種メジャメント想定誤差値の信頼度と第2種メジャメント想定誤差値の信頼度とがともに「1」か「2」の場合には両方の値を信用して、第1種メジャメント想定誤差値と第2種メジャメント想定誤差値の平均値を暫定メジャメント想定誤差値としてもよい。 In addition, when both the reliability of the first type measurement assumed error value and the reliability of the second type measurement assumed error value are “1” or “2”, both values are trusted and the first type measurement is assumed. An average value of the error value and the second type measurement expected error value may be used as the provisional measurement expected error value.
6−5.メジャメント想定誤差値の調整
上述した実施形態では、メジャメント想定誤差値の調整処理において、メジャメント想定誤差値とメジャメント想定誤差値の過去平均値との加重平均計算を行ってメジャメント想定誤差値を調整するものとして説明した。この際、加重平均計算の重み「α」を固定値とするものとして説明したが、重み「α」を可変に設定することとしてもよい。
6-5. Adjustment of expected measurement error value In the above-described embodiment, in the adjustment process of expected measurement error value, the expected measurement error value is adjusted by performing a weighted average calculation of the expected measurement error value and the past average value of the expected measurement error value. As explained. In this case, the weight “α” of the weighted average calculation is described as a fixed value, but the weight “α” may be set variably.
例えば、過去のメジャメント想定誤差値が信頼性の高いもの(例えば信頼度「1」)を多く含んでいる場合は、過去平均値を重視するように重み「α」に小さな値(例えばα=0.2)を設定することが考えられる。逆に、過去のメジャメント想定誤差値が信頼性の低いもの(例えば信頼度「3」)を多く含んでいる場合は、メジャメント想定誤差値を重視するように重み「α」に大きな値(例えばα=0.8)を設定すればよい。 For example, in the case where past measurement expected error values include many highly reliable values (for example, reliability “1”), a small value (for example, α = 0) is used for the weight “α” so that the past average value is emphasized. .2) may be set. On the other hand, when past estimated error values include many low reliability values (for example, reliability “3”), a large value (for example, α) is used for the weight “α” so that the estimated error value is emphasized. = 0.8) may be set.
また、過去のメジャメント想定誤差値の履歴に基づいて位置算出時刻におけるメジャメント想定誤差値を推定し、その推定値(以下、「メジャメント想定誤差推定値」と称す。)を用いてメジャメント想定誤差値を調整してもよい。例えば、メジャメント想定誤差値をメジャメント想定誤差推定値に修正してもよいし、メジャメント想定誤差値とメジャメント想定誤差推定値との平均値を求めて当該平均値に修正することとしてもよい。 In addition, the estimated measurement error value at the position calculation time is estimated based on the history of the estimated measurement error value in the past, and the estimated measurement error value is calculated using the estimated value (hereinafter referred to as “measurement estimation error estimated value”). You may adjust. For example, a measurement expected error value may be corrected to a measurement expected error estimated value, or an average value of a measurement expected error value and a measurement expected error estimated value may be obtained and corrected to the average value.
6−6.対応関係
上述した実施形態では、GPS衛星信号の信号強度別に、メジャメント想定誤差値を算出するためのモデル式が定められているものとして説明したが、モデル式ではなくテーブルを定めておいてもよい。すなわち、GPS衛星信号の信号強度別に、メジャメントパラメーターの値とメジャメント想定誤差値とが対応付けられたテーブルを用意しておき、当該テーブルからメジャメント想定誤差値を読み出して、観測誤差を設定するようにする。
6-6. Correspondence In the above-described embodiment, it has been described that a model equation for calculating an expected error value for each GPS satellite signal intensity is defined. However, a table may be defined instead of the model equation. . That is, a table in which measurement parameter values and measurement expected error values are associated with each signal strength of a GPS satellite signal is prepared, and an expected error is set by reading a measurement expected error value from the table. To do.
6−7.メジャメント想定誤差値モデル式
上述した実施形態では、第3種メジャメントパラメーターであるXPRを用いてメジャメント想定誤差値を算出するためのモデル式として、2つの一次関数を組み合わせたモデル式を定義するものとして説明したが、例えば双曲線によってモデル式を定義することとしてもよく、モデル式の種類は適宜設定変更可能である。
6-7. Measurement Assumed Error Value Model Equation In the above-described embodiment, a model equation combining two linear functions is defined as a model equation for calculating a measurement assumed error value using the third type measurement parameter XPR. As described above, for example, a model formula may be defined by a hyperbola, and the type of the model formula can be appropriately changed.
1 携帯型電話機、 10 GPSアンテナ、 20 GPS受信部、
21 RF受信回路部、 30 ベースバンド処理回路部、 31 演算制御部、
33 メジャメント取得演算部、 35 ROM、 37 RAM、
40 ホストCPU、 50 操作部、 60 表示部、 65 携帯電話用アンテナ、70 携帯電話用無線通信回路部、 80 ROM、 90 RAM
1 mobile phone, 10 GPS antenna, 20 GPS receiver,
21 RF receiving circuit section, 30 baseband processing circuit section, 31 arithmetic control section,
33 measurement acquisition calculation unit, 35 ROM, 37 RAM,
40 host CPU, 50 operation unit, 60 display unit, 65 antenna for mobile phone, 70 wireless communication circuit unit for mobile phone, 80 ROM, 90 RAM
Claims (6)
前記測位用衛星から受信した前記測位用信号に基づいて、少なくとも受信周波数及びコード位相を含む観測メジャメントを取得することと、
受信した前記測位用信号の信号強度を測定することと、
前記観測メジャメントと前記予測メジャメントとの差に基づいて、カルマンフィルターを利用した位置算出処理で用いる誤差パラメーターの値を設定することと、
前記誤差パラメーターの値を用いて前記位置算出処理を行って位置を算出することと、
を含む位置算出方法であって、
前記測位用信号の信号強度に対応付けて、前記観測メジャメント及び前記予測メジャメントの差に対する線形なメジャメント想定誤差値モデル式が予め定められており、
前記誤差パラメーターの値を設定することは、
前記測定された信号強度に対応する前記メジャメント想定誤差値モデル式に、前記観測メジャメント及び前記予測メジャメントの差を適用することで、前記観測メジャメントの想定誤差を求めることと、
前記想定誤差に基づいて前記誤差パラメーターの値を設定することと、
を含む、
位置算出方法。 Predicting a prediction measurement including at least a reception frequency and a code phase related to reception of a positioning signal from a positioning satellite;
Obtaining an observation measurement including at least a reception frequency and a code phase based on the positioning signal received from the positioning satellite;
Measuring the signal strength of the received positioning signal;
Based on the difference between the observation measurement and the prediction measurement, setting a value of an error parameter used in a position calculation process using a Kalman filter;
Performing the position calculation process using the value of the error parameter to calculate a position;
A position calculation method including:
Corresponding to the signal strength of the positioning signal, a linear measurement assumed error value model formula for a difference between the observation measurement and the prediction measurement is predetermined,
Setting the value of the error parameter is
Obtaining an assumption error of the observation measurement by applying a difference between the observation measurement and the prediction measurement to the measurement assumption error value model equation corresponding to the measured signal strength;
Setting a value of the error parameter based on the assumed error;
including,
Position calculation method.
前記予測された状態ベクトルの補正を行うことと、
を更に含み、
前記予測メジャメントを予測することは、前記予測された状態ベクトルに基づいて第1の予測メジャメントを予測する第1の予測処理を含み、
前記位置を算出することは、前記補正された状態ベクトルに基づいて位置を算出することを含む、
請求項1に記載の位置算出方法。 Predicting a state vector used in the position calculation process;
Correcting the predicted state vector;
Further including
Predicting the prediction measurement includes a first prediction process for predicting a first prediction measurement based on the predicted state vector;
Calculating the position includes calculating a position based on the corrected state vector;
The position calculation method according to claim 1.
請求項2に記載の位置算出方法。 Predicting the prediction measurement performs the position calculation process based on the past observation measurement acquired when the positioning signal is received and the elapsed time from the time when the past observation measurement was observed. Including a second prediction process for predicting a second prediction measurement of time,
The position calculation method according to claim 2.
前記誤差パラメーターの値を設定することは、前記信頼性の判定結果に応じて、前記第1の予測メジャメント及び前記第2の予測メジャメントの少なくとも何れかを用いて前記誤差パラメーターの値を設定することを含む、
請求項3に記載の位置算出方法。 Further comprising determining the reliability of the first prediction measurement and the second prediction measurement;
Setting the error parameter value sets the error parameter value using at least one of the first prediction measurement and the second prediction measurement according to the reliability determination result. including,
The position calculation method according to claim 3.
前記位置を算出することは、前記調整された誤差パラメーターの値を用いて前記位置算出処理を行って位置を算出することを含む、
請求項4に記載の位置算出方法。 When it is determined by the determination that the reliability satisfies a predetermined low reliability condition, the method further includes adjusting the value of the set error parameter based on a past value;
Calculating the position includes calculating the position by performing the position calculation process using the adjusted error parameter value.
The position calculation method according to claim 4.
前記測位用衛星から受信した前記測位用信号に基づいて、少なくとも受信周波数及びコード位相を含む観測メジャメントを取得する観測部と、
受信した前記測位用信号の信号強度を測定する信号強度測定部と、
前記観測メジャメントと前記予測メジャメントとの差に基づいて、カルマンフィルターを利用した位置算出処理で用いる誤差パラメーターの値を設定する設定部と、
前記誤差パラメーターの値を用いて前記位置算出処理を行って位置を算出する位置算出部と、
を備えた位置算出装置であって、
前記測位用信号の信号強度に対応付けて、前記観測メジャメント及び前記予測メジャメントの差に対する線形なメジャメント想定誤差値モデル式が予め定められており、
前記設定部は、前記測定された信号強度に対応する前記メジャメント想定誤差値モデル式に、前記観測メジャメント及び前記予測メジャメントの差を適用することで、前記観測メジャメントの想定誤差を求め、求めた想定誤差に基づいて前記誤差パラメーターの値を設定する、
位置算出装置。 A prediction unit that predicts a prediction measurement including at least a reception frequency and a code phase related to reception of a positioning signal from a positioning satellite;
An observation unit for obtaining an observation measurement including at least a reception frequency and a code phase based on the positioning signal received from the positioning satellite;
A signal strength measuring unit for measuring the signal strength of the received positioning signal;
A setting unit for setting a value of an error parameter used in position calculation processing using a Kalman filter based on a difference between the observation measurement and the prediction measurement;
A position calculation unit that calculates the position by performing the position calculation process using the value of the error parameter;
A position calculation device comprising:
Corresponding to the signal strength of the positioning signal, a linear measurement assumed error value model formula for a difference between the observation measurement and the prediction measurement is predetermined,
The setting unit obtains an assumed error of the observed measurement by applying a difference between the observed measurement and the predicted measurement to the measurement assumed error value model equation corresponding to the measured signal strength , and obtains the assumed assumption Set the value of the error parameter based on the error;
Position calculation device.
Priority Applications (1)
| Application Number | Priority Date | Filing Date | Title |
|---|---|---|---|
| JP2010192236A JP5375773B2 (en) | 2010-08-30 | 2010-08-30 | Position calculation method and position calculation apparatus |
Applications Claiming Priority (1)
| Application Number | Priority Date | Filing Date | Title |
|---|---|---|---|
| JP2010192236A JP5375773B2 (en) | 2010-08-30 | 2010-08-30 | Position calculation method and position calculation apparatus |
Related Parent Applications (1)
| Application Number | Title | Priority Date | Filing Date |
|---|---|---|---|
| JP2009101571A Division JP2010249759A (en) | 2009-04-20 | 2009-04-20 | Position calculating method and position-calculating device |
Publications (3)
| Publication Number | Publication Date |
|---|---|
| JP2010266468A JP2010266468A (en) | 2010-11-25 |
| JP2010266468A5 JP2010266468A5 (en) | 2011-08-18 |
| JP5375773B2 true JP5375773B2 (en) | 2013-12-25 |
Family
ID=43363529
Family Applications (1)
| Application Number | Title | Priority Date | Filing Date |
|---|---|---|---|
| JP2010192236A Active JP5375773B2 (en) | 2010-08-30 | 2010-08-30 | Position calculation method and position calculation apparatus |
Country Status (1)
| Country | Link |
|---|---|
| JP (1) | JP5375773B2 (en) |
Families Citing this family (4)
| Publication number | Priority date | Publication date | Assignee | Title |
|---|---|---|---|---|
| JP5977040B2 (en) * | 2012-02-17 | 2016-08-24 | Necスペーステクノロジー株式会社 | Orbit position estimation method, orbit position estimation apparatus, and orbit position estimation program |
| JP6191103B2 (en) | 2012-09-03 | 2017-09-06 | セイコーエプソン株式会社 | Moving state calculation method and moving state calculation device |
| JP7465105B2 (en) * | 2020-02-14 | 2024-04-10 | 株式会社東海理化電機製作所 | Communication device and program |
| CN114861320B (en) * | 2022-05-19 | 2023-02-10 | 北京航天飞行控制中心 | Spacecraft attitude control thrust modeling and orbit determination resolving method |
Family Cites Families (4)
| Publication number | Priority date | Publication date | Assignee | Title |
|---|---|---|---|---|
| JP3884294B2 (en) * | 2002-01-18 | 2007-02-21 | 株式会社東芝 | Design support apparatus and program |
| JP4656969B2 (en) * | 2005-03-02 | 2011-03-23 | 日本無線株式会社 | Satellite signal receiving system |
| JP4424365B2 (en) * | 2007-03-29 | 2010-03-03 | トヨタ自動車株式会社 | Positioning apparatus for moving body and positioning method for moving body |
| JP5186874B2 (en) * | 2007-10-10 | 2013-04-24 | セイコーエプソン株式会社 | POSITIONING METHOD, PROGRAM, POSITIONING DEVICE, AND ELECTRONIC DEVICE |
-
2010
- 2010-08-30 JP JP2010192236A patent/JP5375773B2/en active Active
Also Published As
| Publication number | Publication date |
|---|---|
| JP2010266468A (en) | 2010-11-25 |
Similar Documents
| Publication | Publication Date | Title |
|---|---|---|
| JP5034935B2 (en) | POSITIONING METHOD, PROGRAM, POSITIONING DEVICE, AND ELECTRONIC DEVICE | |
| JP2010249759A (en) | Position calculating method and position-calculating device | |
| JP5186874B2 (en) | POSITIONING METHOD, PROGRAM, POSITIONING DEVICE, AND ELECTRONIC DEVICE | |
| JP5186873B2 (en) | POSITIONING METHOD, PROGRAM, POSITIONING DEVICE, AND ELECTRONIC DEVICE | |
| US8775076B2 (en) | Position calculating method and position calculating device | |
| JP5423036B2 (en) | Position calculation method and position calculation apparatus | |
| US9253751B2 (en) | Method of calculating movement speed and device for calculating movement speed | |
| US7940209B2 (en) | Pseudorange calculation method, position calculation method, computer-readable recording medium, and position calculation device | |
| US20110291881A1 (en) | Position calculating method and position calculating device | |
| JP2010151459A (en) | Method and device for calculating position | |
| US20120314733A1 (en) | Method of estimating pseudorange, gnss receiving apparatus, and mobile terminal | |
| JP2009133716A (en) | Positioning method, program and positioning apparatus | |
| JP2006189320A (en) | Positioning computation unit, positioning device, and positioning computation method | |
| WO2015145718A1 (en) | Positioning device | |
| JP2010169640A (en) | Method and apparatus for calculating position | |
| JP5375773B2 (en) | Position calculation method and position calculation apparatus | |
| JP5228433B2 (en) | POSITIONING METHOD, PROGRAM, POSITIONING DEVICE, AND ELECTRONIC DEVICE | |
| JP2010175426A (en) | Method and device for calculating out position | |
| JP2012194099A (en) | Pseudo-distance error estimation method, position calculation method and pseudo-distance error estimation apparatus | |
| JP5332333B2 (en) | POSITIONING METHOD, PROGRAM, AND POSITIONING DEVICE | |
| JP2011179894A (en) | Positioning method, positioning program, gnss receiver, and mobile terminal | |
| JP2013068451A (en) | Position calculation method and position calculation device | |
| JP2011164088A (en) | Method for tracking satellite signal, method for calculating position, device for tracking satellite signal and device for calculating position | |
| JP5267478B2 (en) | Satellite signal tracking method and position calculation apparatus | |
| JP2009103489A (en) | Positioning method, program, positioning device, and electronic device |
Legal Events
| Date | Code | Title | Description |
|---|---|---|---|
| A521 | Written amendment |
Free format text: JAPANESE INTERMEDIATE CODE: A523 Effective date: 20110701 |
|
| A621 | Written request for application examination |
Free format text: JAPANESE INTERMEDIATE CODE: A621 Effective date: 20120409 |
|
| A131 | Notification of reasons for refusal |
Free format text: JAPANESE INTERMEDIATE CODE: A131 Effective date: 20120814 |
|
| A521 | Written amendment |
Free format text: JAPANESE INTERMEDIATE CODE: A523 Effective date: 20121012 |
|
| TRDD | Decision of grant or rejection written | ||
| A01 | Written decision to grant a patent or to grant a registration (utility model) |
Free format text: JAPANESE INTERMEDIATE CODE: A01 Effective date: 20130827 |
|
| A61 | First payment of annual fees (during grant procedure) |
Free format text: JAPANESE INTERMEDIATE CODE: A61 Effective date: 20130909 |
|
| R150 | Certificate of patent or registration of utility model |
Ref document number: 5375773 Country of ref document: JP Free format text: JAPANESE INTERMEDIATE CODE: R150 Free format text: JAPANESE INTERMEDIATE CODE: R150 |
|
| S531 | Written request for registration of change of domicile |
Free format text: JAPANESE INTERMEDIATE CODE: R313531 |
|
| R350 | Written notification of registration of transfer |
Free format text: JAPANESE INTERMEDIATE CODE: R350 |