JP4879184B2 - Non-invasive measurement system and method for measuring the concentration of optically active substances - Google Patents
Non-invasive measurement system and method for measuring the concentration of optically active substances Download PDFInfo
- Publication number
- JP4879184B2 JP4879184B2 JP2007540014A JP2007540014A JP4879184B2 JP 4879184 B2 JP4879184 B2 JP 4879184B2 JP 2007540014 A JP2007540014 A JP 2007540014A JP 2007540014 A JP2007540014 A JP 2007540014A JP 4879184 B2 JP4879184 B2 JP 4879184B2
- Authority
- JP
- Japan
- Prior art keywords
- light
- measured
- image
- concentration
- offset error
- Prior art date
- Legal status (The legal status is an assumption and is not a legal conclusion. Google has not performed a legal analysis and makes no representation as to the accuracy of the status listed.)
- Expired - Fee Related
Links
Images


Classifications
-
- A—HUMAN NECESSITIES
- A61—MEDICAL OR VETERINARY SCIENCE; HYGIENE
- A61B—DIAGNOSIS; SURGERY; IDENTIFICATION
- A61B5/00—Measuring for diagnostic purposes; Identification of persons
- A61B5/145—Measuring characteristics of blood in vivo, e.g. gas concentration, pH value; Measuring characteristics of body fluids or tissues, e.g. interstitial fluid, cerebral tissue
- A61B5/1455—Measuring characteristics of blood in vivo, e.g. gas concentration, pH value; Measuring characteristics of body fluids or tissues, e.g. interstitial fluid, cerebral tissue using optical sensors, e.g. spectral photometrical oximeters
- A61B5/14558—Measuring characteristics of blood in vivo, e.g. gas concentration, pH value; Measuring characteristics of body fluids or tissues, e.g. interstitial fluid, cerebral tissue using optical sensors, e.g. spectral photometrical oximeters by polarisation
Description
本発明は、光学活性体の濃度、特に、人間の血流中のブドウ糖の濃度を非侵襲的に測定する方法及びシステムに関する。 The present invention relates to a method and system for non-invasively measuring the concentration of an optically active substance, in particular, the concentration of glucose in the human bloodstream.
或る特定の状況では、人の血流中の特定の物質の濃度を測定することが必要である。かかる濃度を測定するために一般に用いられている試験手技は、侵襲性であって、血液の引き出しを必要とする。これは、頻繁な間隔で濃度測定値を得る必要がある人にとって特に不快な場合がある。例えば、糖尿病患者は、自分の血流中のブドウ糖のレベルをモニタする必要があり、毎日、しばしば1日に数回、かかる侵襲的測定手技を受ける必要がある。典型的には、測定は、血液を引き出すフィンガープリック(finger prick)により行われ、この血液を試験ストリップ上に置き、次にこれをブドウ糖モニタ装置内に挿入する。 In certain situations, it is necessary to measure the concentration of certain substances in a person's bloodstream. Test techniques commonly used to measure such concentrations are invasive and require blood withdrawal. This can be particularly uncomfortable for those who need to obtain concentration measurements at frequent intervals. For example, diabetics need to monitor the level of glucose in their bloodstream and need to undergo such invasive measurement procedures every day, often several times a day. Typically, the measurement is performed by a finger prick that draws blood, which is placed on a test strip, which is then inserted into a glucose monitoring device.
侵襲的試験の問題を回避するため、関心のある血流中の成分、例えばブドウ糖の濃度を測定する非侵襲的方法が開発された。ブドウ糖及び他の或る特定の化合物は、「光学活性」化合物と呼ばれている。本明細書で用いる「光学活性」という用語が指す化合物は、かかる化合物を含む溶液に光を通したときに偏光を回転させる化合物のことである。光学活性は又、化学式及び化学構造が同一の異性体と関連しているが、これらの原子は、対の構成員が互いに鏡像関係をなすように空間向きが異なっている。異性体の光学活性対の両方の員が混合物中に等しい割合で存在している場合、この混合物は、「ラセミ体(racemic)」と呼ばれ、これは、各異性体の回転効果が互いに打ち消し合うので偏光の正味の回転を呈さないであろう。しかしながら、当業者には知られているように、哺乳動物では、ブドウ糖及び他の或る特定の光学活性体は、これらの光学活性異性体のうちの1つの形態でしか存在せず、それにより、ラセミ体混合物により生じる回転の打ち消しが回避される。 To avoid the problems of invasive testing, non-invasive methods have been developed to measure the concentration of components in the bloodstream of interest, such as glucose. Glucose and certain other compounds are called “optically active” compounds. As used herein, the term “optical activity” refers to a compound that rotates polarized light when light passes through a solution containing such a compound. Optical activity is also associated with isomers of the same chemical formula and structure, but these atoms are spatially different so that the members of the pair are mirror images of one another. When both members of an optically active pair of isomers are present in equal proportions in the mixture, the mixture is called a “racemic”, which means that the rotational effects of each isomer cancel each other out. So it will not exhibit a net rotation of polarization. However, as known to those skilled in the art, in mammals, glucose and certain other optically active forms exist only in the form of one of these optically active isomers, thereby Rotation cancellation caused by the racemic mixture is avoided.
光学活性体、例えばブドウ糖の光学活性を人体中のこれらの濃度を非侵襲的に測定する手段として利用することが望ましい。平面偏光の回転は、以下の関係式に従って光の通る溶液中の光学活性体の濃度に比例することが知られている。 It is desirable to use the optical activity of optically active substances such as glucose as a means for noninvasively measuring these concentrations in the human body. It is known that the rotation of plane polarized light is proportional to the concentration of the optically active substance in the solution through which light passes according to the following relational expression.
α=[α]D[C]l
上式において、Cは、光学活性体の濃度、lは、光路長(即ち、平面偏光が通る流体の長さ)、[α]Dは、溶液の温度及び用いられる光の波長で変化する光学活性体に特有なパラメータである比旋光度である。
α = [α] D [C] l
In the above equation, C is the concentration of the optically active substance, l is the optical path length (ie, the length of the fluid through which plane polarized light passes), and [α] D is an optical that varies with the temperature of the solution and the wavelength of light used. It is the specific rotation, which is a parameter specific to the active substance.
非侵襲的ブドウ糖測定を行うのに適した1つの場所は、目の眼房水である。眼房水中のブドウ糖の濃度は、血流中のブドウ糖の濃度に直接関連している。しかしながら、眼房水中のブドウ糖の濃度と眼房水を透過した偏光の回転度との間の関係は、血流中のブドウ糖の濃度を求める目的に用いるには困難である。1つには、この問題は、光路長(l)を正確に測定することが目の幾何学的形状とほぼ同じほど複雑な機械的形状を有する構造では困難であるということに起因している。加うるに、平面偏光の回転角度を測定する公知の技術は、実験室環境、特に、かかる非侵襲的試験が患者又は技術者により行われる環境の外部で信頼性をもって実施するのは困難である。その結果、上述の問題に取り組む方法及びシステムの開発が要望されている。 One suitable location for performing non-invasive glucose measurements is the aqueous humor of the eye. The concentration of glucose in the aqueous humor is directly related to the concentration of glucose in the bloodstream. However, the relationship between the concentration of glucose in aqueous humor and the degree of rotation of polarized light transmitted through the aqueous humor is difficult to use for the purpose of determining the concentration of glucose in the bloodstream. For one thing, this problem stems from the fact that it is difficult to accurately measure the optical path length (l) with a structure having a mechanical shape as complex as the eye geometry. . In addition, known techniques for measuring the angle of rotation of plane-polarized light are difficult to perform reliably outside the laboratory environment, particularly outside such environments where such non-invasive testing is performed by a patient or technician. . As a result, there is a need to develop methods and systems that address the above problems.
本発明の一特徴によれば、光を或る濃度の光学活性体を有する被験者又は物体に向かって送る光源を有する装置が提供される。この装置は、偏光子と、第1の像取込みデバイスと、プロセッサとを更に有する。偏光子は、光源と被験者との間に配置される。第1の像取込みデバイスは、被験者から反射された光を受け取ってこの光から測定画像を生じさせるよう位置決めされている。測定画像は、測定された光強度データを定める。プロセッサは、測定された光強度データの選択部分に基づいて光学活性体の濃度を計算するよう構成されている。 In accordance with one aspect of the present invention, an apparatus is provided having a light source that transmits light toward a subject or object having a concentration of optically active material. The apparatus further includes a polarizer, a first image capture device, and a processor. The polarizer is disposed between the light source and the subject. The first image capture device is positioned to receive light reflected from the subject and produce a measurement image from this light. The measurement image defines measured light intensity data. The processor is configured to calculate a concentration of the optically active substance based on a selected portion of the measured light intensity data.
光学活性体は、好ましくはブドウ糖である。好ましい実施形態では、本装置は、ハウジングを更に有し、光源、偏光子、第1の像取込みデバイス、及びプロセッサは、ハウジング内に収納されている。より好ましくは、この装置は、携帯可能であり、この装置は、手持ち型装置であることが特に好ましい。好ましい実施形態では、物体は、虹彩を備えた人間の目であり、測定画像は、虹彩の測定画像である。 The optically active substance is preferably glucose. In a preferred embodiment, the apparatus further comprises a housing, and the light source, polarizer, first image capture device, and processor are housed within the housing. More preferably, the device is portable and it is particularly preferred that the device is a handheld device. In a preferred embodiment, the object is a human eye with an iris and the measurement image is an iris measurement image.
別の好ましい実施形態によれば、光学活性体に関する所定濃度データ及び所定光強度データを含むデータベースが提供される。プロセッサは、測定光強度データの選択された部分、所定の濃度データの選択された部分、及び所定の光強度データの選択された部分に基づいて光学活性体の濃度を計算するよう構成されている。 According to another preferred embodiment, a database is provided that includes predetermined concentration data and predetermined light intensity data relating to the optically active substance. The processor is configured to calculate a concentration of the optically active material based on the selected portion of the measured light intensity data, the selected portion of the predetermined concentration data, and the selected portion of the predetermined light intensity data. .
他の好ましい実施形態によれば、物体は、虹彩を有する人間の目であり、偏光子は、光源からの光を虹彩に向かって送って送られた光が1つ又は2つ以上の入射角で虹彩に接触し、それにより物体から反射された光の部分が作られるように位置決めされている。入射角のうちの1つ又は2つ以上が偏光を生じさせるのに十分であることが特に好ましい。 According to another preferred embodiment, the object is a human eye having an iris, and the polarizer is one or more incident angles of light transmitted by sending light from the light source towards the iris. Is positioned such that it makes contact with the iris, thereby creating a portion of the light reflected from the object. It is particularly preferred that one or more of the angles of incidence are sufficient to produce polarized light.
本発明の別の特徴によれば、光学活性体の溶液を収容した物体中の光学活性体の濃度を計算する方法が提供される。この方法は、物体の少なくとも1つの測定画像像を提供するステップを有し、各前記測定画像は、物体から反射された光の測定強度のアレイを構成する。この方法は、物体から反射された光の測定強度の少なくとも1つの比を計算するステップと、光強度の少なくとも1つの測定比に基づいて光学活性体の濃度を計算するステップとを更に有する。物体は、好ましくは、虹彩を備えた人間の目である。 According to another feature of the invention, a method is provided for calculating the concentration of optically active material in an object containing a solution of optically active material. The method includes providing at least one measurement image of an object, each measurement image comprising an array of measurement intensities of light reflected from the object. The method further includes calculating at least one ratio of measured intensities of light reflected from the object and calculating a concentration of the optically active material based on the at least one measured ratio of light intensities. The object is preferably a human eye with an iris.
好ましい実施形態では、光学活性体の濃度を計算するステップは、測定画像中に複数の計算空間を定めるステップと、各計算空間中の計算空間比を計算するステップとを有する。計算空間は、好ましくは、第1及び第2の領域から成り、これら領域は、より好ましくは、「L字形」を形成する。 In a preferred embodiment, the step of calculating the concentration of the optically active substance comprises defining a plurality of calculation spaces in the measurement image and calculating a calculation space ratio in each calculation space. The computation space preferably consists of first and second regions, which more preferably form an “L-shape”.
さらに他の好ましい実施形態では、この方法は、各々が光学活性体の既知の濃度に対応した基準物体の複数の所定の画像を提供するステップと、物体から反射された光の所定の強度のアレイを構成するステップと、所定の強度の各アレイ内の強度の少なくとも1つの所定の比を計算するステップとを有する。光学活性体の濃度は、測定強度の少なくとも1つ及び基準物体から反射された光の所定の強度の各アレイ内の強度の所定の比のうちの少なくとも1つの比に基づいて計算される。 In yet another preferred embodiment, the method includes providing a plurality of predetermined images of a reference object, each corresponding to a known concentration of optically active material, and a predetermined intensity array of light reflected from the object. And calculating at least one predetermined ratio of intensities within each array of predetermined intensities. The optically active concentration is calculated based on at least one ratio of at least one of the measured intensities and a predetermined ratio of intensities within each array of predetermined intensities of light reflected from the reference object.
さらに好ましい実施形態では、基準物体から反射された光の所定強度の各アレイ内の少なくとも1つの所定の光強度比を計算するステップは、各所定の画像中の少なくとも1つの所定の計算空間を定めるステップと、各所定の計算空間内の所定の計算空間比を計算するステップとを有し、少なくとも1つの所定の光強度比は、所定の計算空間比のうちの少なくとも1つを含む。 In a further preferred embodiment, the step of calculating at least one predetermined light intensity ratio in each array of predetermined intensities of light reflected from the reference object defines at least one predetermined calculation space in each predetermined image. And calculating a predetermined calculation space ratio within each predetermined calculation space, wherein the at least one predetermined light intensity ratio includes at least one of the predetermined calculation space ratios.
他の好ましい実施形態では、この方法は、オフセット誤差アレイを生成するステップを有する。追加の好ましい実施形態では、この方法は、最小オフセット誤差アレイを生成するステップを有する。 In another preferred embodiment, the method includes generating an offset error array. In additional preferred embodiments, the method includes generating a minimum offset error array.
本発明の別の特徴によれば、光学活性体の溶液を収容した物体中の光学活性体の濃度を計算する方法が提供される。この方法は、物体の測定画像を提供するステップを有する。測定画像は、物体から反射された光の強度のアレイを定める。測定画像を複数の回転位置に回転させ、それにより、物体から反射された光の複数の回転測定強度を生じさせる。光学活性体の濃度は、物体から反射された光の測定強度及び物体から反射された光の回転測定強度に基づいて計算される。 According to another feature of the invention, a method is provided for calculating the concentration of optically active material in an object containing a solution of optically active material. The method includes providing a measured image of the object. The measurement image defines an array of light intensities reflected from the object. The measurement image is rotated to a plurality of rotational positions, thereby producing a plurality of rotational measurement intensities of light reflected from the object. The concentration of the optically active substance is calculated based on the measured intensity of the light reflected from the object and the rotational measured intensity of the light reflected from the object.
本発明の追加の特徴によれば、光学活性体の溶液を収容した物体中の光学活性体の濃度を計算する方法が提供される。この物体は、複数個の物体領域を含む。この方法は、物体から反射された光の複数の測定強度値を提供するステップを有し、各測定強度値は、物体の領域のうちの1つに対応している。光学活性体の溶液を収容した基準物体から反射された光の複数の所定の強度も又提供される。基準物体は、複数の基準物体領域を含み、各所定の光強度は、基準物体の領域のうちの1つ及び光学活性体の既知の濃度に対応している。基準物体から反射された光の複数の所定の強度の一部を選択する。光学活性体の濃度は、物体から反射された光の測定強度のうちの1つ又は2つ以上及び物体から反射された光の複数の所定の強度の選択された部分に基づいて計算される。好ましい実施形態では、基準物体から反射された光の複数の所定の強度の一部を選択するステップは、1つ又は2つ以上の統計学的信頼パラメータに基づいて行われる。 According to an additional feature of the invention, a method is provided for calculating the concentration of an optically active substance in an object containing a solution of the optically active substance. This object includes a plurality of object regions. The method includes providing a plurality of measured intensity values of light reflected from the object, each measured intensity value corresponding to one of the regions of the object. A plurality of predetermined intensities of light reflected from a reference object containing a solution of optically active material is also provided. The reference object includes a plurality of reference object regions, each predetermined light intensity corresponding to one of the regions of the reference object and a known concentration of the optically active material. A portion of a plurality of predetermined intensities of light reflected from the reference object is selected. The optically active concentration is calculated based on one or more of the measured intensities of the light reflected from the object and a selected portion of a plurality of predetermined intensities of the light reflected from the object. In a preferred embodiment, the step of selecting a plurality of predetermined intensities of light reflected from the reference object is performed based on one or more statistical confidence parameters.
本発明の別の特徴によれば、光学活性体の溶液を収容した物体中の光学活性体の濃度を計算する方法が提供される。この方法は、物体の測定画像を提供するステップを有し、測定画像は、測定光強度データを構成する。光学活性体の溶液を収容した基準物体の複数の所定の画像が提供される。各所定の画像は、光学活性体の既知の濃度に対応している。複数の所定の画像は、所定の光強度データのアレイを構成する。複数の所定の光強度データは、所定の光強度データの複数のサブアレイを構成する。この方法は、測定画像を複数の回転位置まで回転させ、それにより回転光強度データを作成するステップと、サブアレイのうちの1つを選択するステップとを有する。物体中の光学活性体の濃度は、測定光強度データ、回転光強度データ、及び所定の光強度データの選択されたサブアレイに基づいて計算される。 According to another feature of the invention, a method is provided for calculating the concentration of optically active material in an object containing a solution of optically active material. The method includes providing a measurement image of the object, the measurement image constituting measurement light intensity data. A plurality of predetermined images of a reference object containing an optically active solution are provided. Each predetermined image corresponds to a known concentration of the optically active substance. The plurality of predetermined images constitute an array of predetermined light intensity data. The plurality of predetermined light intensity data constitute a plurality of subarrays of the predetermined light intensity data. The method includes the steps of rotating the measurement image to a plurality of rotational positions, thereby creating rotated light intensity data, and selecting one of the subarrays. The concentration of the optically active substance in the object is calculated based on the selected subarray of measured light intensity data, rotational light intensity data, and predetermined light intensity data.
本発明の別の特徴によれば、光学活性体の溶液を収容した物体中の光学活性体の濃度を計算する指令を有するコンピュータにより読み取り可能な媒体が提供される。この方法は、測定光強度データを定める物体の測定画像を受け取るステップを有する。 In accordance with another aspect of the present invention, a computer readable medium having instructions for calculating the concentration of optically active material in an object containing a solution of optically active material is provided. The method includes receiving a measurement image of an object defining measurement light intensity data.
光学活性体の溶液を収容した基準物体の複数の所定像を受け取る。これら像は各々、光学活性体の既知の濃度に対応し、複数の所定の像は、所定の光強度データのアレイを構成し、このアレイは、所定の光強度データの複数のサブアレイを更に構成する。測定画像を複数の回転位置まで回転させて回転光強度データを作成する。所定の光強度データのサブアレイのうちの1つを選択し、物体中の光学活性体の濃度は、測定光強度データ、回転光強度光データ、及び所定の光強度データの選択されたサブアレイに基づいて計算される。 A plurality of predetermined images of a reference object containing an optically active solution are received. Each of these images corresponds to a known concentration of the optically active substance, the plurality of predetermined images constitute an array of predetermined light intensity data, which further comprises a plurality of sub-arrays of the predetermined light intensity data To do. Rotating light intensity data is created by rotating the measurement image to a plurality of rotation positions. One of the predetermined light intensity data sub-arrays is selected, and the concentration of the optically active substance in the object is based on the measured light intensity data, the rotational light intensity light data, and the selected sub-array of the predetermined light intensity data. Is calculated.
本発明は、添付の図面を参照することにより容易に理解できる。 The present invention can be easily understood with reference to the accompanying drawings.
本発明は、被験者としての人の血流中のブドウ糖レベルを人の目の虹彩の種々の領域から反射された光の強度の比と相関させることができるという驚くべき発見に関している。これとは対照的に、ブドウ糖濃度の非常に大幅な変化により、偏光をブドウ糖含有溶液、例えば人の目の眼房水に通したときに偏光の比較的僅かな回転度が生じることが判明している。かくして、濃度レベルと偏光回転との間の関係は、特に実験室環境の外部でブドウ糖レベルを確実に(信頼性を持って)予測する上で満足のいくものでないことが判明した。しかしながら、虹彩からの光の強度の比を用いることにより、ここの不感受性の問題が回避されることが発見された。 The present invention relates to the surprising discovery that glucose levels in the blood stream of a human subject can be correlated with the ratio of the intensity of light reflected from various regions of the human eye iris. In contrast, very large changes in glucose concentration have been found to produce a relatively small degree of rotation of polarized light when passed through a glucose-containing solution, such as the aqueous humor of the human eye. ing. Thus, the relationship between concentration level and polarization rotation has proved unsatisfactory in reliably (reliably) predicting glucose levels outside of the laboratory environment. However, it has been discovered that using the ratio of the intensity of light from the iris avoids this insensitivity problem.
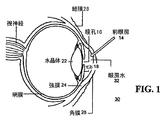
図1は、本発明の種々の実施形態の説明に用いられる被験者の目30の略図である。眼30は、水晶体22と眼房水と呼ばれる流体32で満たされた角膜26により画定された前眼房14を有している。眼は、瞳孔16を構成する中央アパーチュアを備えた虹彩18を更に有している。虹彩18は、強膜24(即ち、眼の「白目」)によって包囲されている。結膜28が、強膜24の上部及び下部を覆っている。
FIG. 1 is a schematic diagram of a subject's
図2を参照すると、光学活性体の濃度を測定するシステムが提供されている。このシステムは、血流中に光学活性体の濃度を有する被験者の目30の虹彩に向かって光15を送るようになった光源10を有している。光源10は、好ましくは、瞳孔16の前に置かれ、この光源は、好ましくは、発光ダイオード(“LED”)又は各々が光を互いに異なる波長で放出する発光ダイオードの組み合わせである。例えば、以下の波長、即ち、470nm(青色)、525nm(緑色)、625nm(赤色)、及び940nm(近赤外)を用いるのがよい。1つの波長だけを用いる場合、近赤外が好ましい。多数の波長を用いる場合、青色、緑色、赤色、及び近赤外が好ましい。
Referring to FIG. 2, a system for measuring the concentration of optically active substances is provided. The system includes a
目30の虹彩18の前には眼房水32が位置しており、この眼房水は、種々のレベルの溶解ブドウ糖を収容している。偏光子20が、好ましくは、光源10及び瞳孔16と一線をなすと共に光源10と目30との間に位置決めされていて、光15が、目30への途中で偏光子20を通過するようになっている。その結果、目30に到達した光は、偏光される。像取込み又は像捕捉デバイス40が、目30から反射された光を受け取るよう位置決めされている。好ましくは、像取込みデバイス40は、電荷結合デバイス(“CCD”)、例えば日本国ジェイエーアイ・コーポレイション(JAI Corporation)により製造されたCV-M50 IR CCD又は目30から反射された光から像を作るようになった別の公知の像取込みデバイスである。CCDは、画素と呼ばれる光強度検出ロケーションのアレイを有している。かくして、光がCCDにより受け取られると、強度測定値のアレイが作られる。CCDのアレイ構造により、CCDは、虹彩から反射された光の強度を測定することにより虹彩の像を得ることができる。
画像化効率を高めるため、好ましくは、レンズ38が設けられ、このレンズは、光源10から約1mm〜約5mmの距離のところに且つ像取込みデバイス40から約15mm〜約30mmの距離のところで光源10と像取込みデバイス40との間に位置決めされている。好ましい実施形態では、レンズ38は、Fが1.4の25mmレンズである。像取込みデバイス40に対するレンズ38の位置は、好ましくは、像のフォーカスを向上させるよう調節できる。
To increase imaging efficiency, a
好ましくは、光源10及び偏光子20は、互いに且つ瞳孔16と一線をなして位置決めされる。これらは、互いに間隔を置いた別個のコンポーネントから成るのがよいが、より好ましくは、偏光子20及び光源10は、一体形ユニットを形成し、別体としない。光源10は、好ましくは、目30から約15mm〜約30mmの距離のところに配置され、20mmという距離は、特に好ましい。
Preferably, the
偏光子20、光源10、像取込みデバイス40、プロセッサ42、及びメモリ44を一体形ハウジング(図示せず)、より好ましくは、携帯用の手持ち型ユニットの形態で提供されるのがよいが、このようにするかどうかは任意である。システム25のコンポーネントは又、一体形ハウジングを用いないで別々に接続できる。また、コンポーネントのうち2つ又は3つ以上を単一のハウジング内に組み合わせ、次に別々に残りのコンポーネントに接続し又は残りのコンポーネントと共に用いてもよい。
The
図2に示す実施形態によれば、光源10及び偏光子20は、光が1又は2以上の入射角で目30の虹彩に当たるよう位置決めされている。光の少なくとも一部は、像取込みデバイス40の方へ反射される光の何割かを偏光するのに十分な角度で虹彩に当たる。本発明の範囲を何ら制限するものではないが、目の曲率により、偏光が多くの種々の入射角で虹彩に当たり、散乱効果を生じさせることが理論化される。当業者には理解されるように、光が表面に当たると、反射係数が入射面に平行な光の成分についてはゼロになるブルースター角と呼ばれる入射角が生じる。その結果、ブルースター角で反射された光は、その振動平面が入射平面に対して直角をなした状態で偏光される。かくして、虹彩に当たった光の少なくとも一部が散乱及び(又は)ブルースターの反射の効果によりもう1度(最初は、偏光子20により行われる)偏光されることが理論化される。
According to the embodiment shown in FIG. 2, the
この場合も又、本発明の範囲を何ら限定するものではなく、上述の2重偏光効果の結果として、虹彩から反射された光の強度を偏光の平面を目の前方部分内に入っているブドウ糖によって回転させる程度の間接的な尺度として使用できることが理論化される。 Again, this does not limit the scope of the invention in any way, and as a result of the double polarization effect described above, the intensity of the light reflected from the iris is changed to glucose that is in the front part of the eye through the plane of polarization. It is theorized that it can be used as an indirect measure of the degree of rotation.
図2に示すように、像取込みデバイス40は、オプションとしてプロセッサ42に接続されており、このプロセッサは、以下に詳細に説明するようにブドウ糖濃度を計算するよう構成されている。
As shown in FIG. 2, the
パターン照合(マッチング)表の作成
図2のシステムは、プロセッサ42に作動的に結合されていて、所定のブドウ糖濃度データ及び所定の光強度データを格納したメモリ44を更に有している。メモリ44は、好ましくは、所定の光強度データと既知のブドウ糖濃度のパターン照合表を有する。一実施形態では、パターン照合表は、これを用いて自分のブドウ糖濃度を予測する被験者の各々について作成される。
Creating the Pattern Matching Table The system of FIG. 2 further includes a
図4は、パターン照合表を作成する方法の好ましい実施形態を示す流れ図である。ステップ410において、ブドウ糖を被験者に供給してその人のブドウ糖濃度を調節する。ブドウ糖を例えば患者に果汁のグルコラ(glucola)を摂取させることにより供給するのがよい。ブドウ糖が血流に入るのに要する時間、例えば10分間待った後、ステップ420において被験者の血流中のブドウ糖の濃度を公知の侵襲法により測定する。
FIG. 4 is a flow diagram illustrating a preferred embodiment of a method for creating a pattern matching table. In
既知の濃度をいったん定めると、光源10からの光を、偏光子20を介して目30に差し向ける。ステップ430において、目30から反射された光を像取込みデバイス40により受け取り、所定の像を取り込む。パターン照合表を作成する一部として得られた画像を、本明細書においては、これら画像を、ブドウ糖又は他の光学活性体の未知の濃度を測定する目的で生成される画像から区別するために「所定(の)画像」と称する。未知の濃度で得られた画像を「測定(された)画像」と称する。
Once the known concentration is determined, light from the
ステップ430において、光源10、偏光子20、及び像取込みデバイス40を、好ましくは、目30の虹彩に当たった光のうちの或る量が二次偏光を生じ、その結果、像取込みデバイス40により検出されるように位置決めする。光源10は、好ましくは、偏光子20と一体であり、この光源を目30から約15mm〜約30mmの距離のところに配置し、20mmという距離が、特に好ましい。光源10及び偏光子20を好ましくは瞳孔16の前に配置する。レンズ38を、好ましくは、光源10から約1mm〜約5mmの距離のところで光源10、偏光子20、及び瞳孔16と一線をなして位置決めする。像取込みデバイス40を、好ましくは、レンズ38から約15mm〜約30mmの距離のところで光源10、偏光子20、レンズ38、及び瞳孔16と一線をなして位置決めする。
In
像取込みデバイス40は、装置内の種々の強度測定ロケーションのところで、例えば、CCD内の画素ロケーションのところで受け取った光の強度を測定することにより目30の虹彩の像を取り込む。その結果、虹彩の画像が作られる。この画像は、像取込みデバイス40により得られた強度測定値のアレイから成る。好ましくは、この画像は、単一波長の光15を用いて作られる。多数の波長の光が用いられる場合、後で説明するように、かかる波長は、好ましくは、各々が単一の波長に基づく一連の互いに異なる画像を生成するために用いられる。
目30の瞳孔16は、虹彩18内に位置しているので、虹彩18の画像は、この中に位置する瞳孔の画像を更に含むことになる。しかしながら、瞳孔は、目の中の構造体ではなく、これとは異なり、虹彩の内周により画定されるアパーチュアである。かくして、瞳孔の画像は、瞳孔領域中に送られてこれから反射される光の量は比較的僅かなので、虹彩画像よりも実質的に暗いであろう。しかしながら、以下に更に説明するように、瞳孔画像は、好ましくは、光学活性体濃度を計算するのに用いられることはない。
Since the pupil 16 of the
図3は、図1の像取込みデバイス40から取り込まれる目50の像の作図である。
FIG. 3 is a plot of an image of the
図3を参照すると、目50の画像は、強膜60、虹彩70、及び瞳孔130を含む。上述したように、画像50は、1組の画素値によって定められる。各画素の強度値は、代表的には、0〜255の考えられる256個の値を持つ8ビットバイトとして表されることになる。好ましくは、図4のステップ440において、まず最初に目に光が差し向けられない場合の目の画像を得ることによりダークフレーム較正法又は手順を実施する。次に、較正画像は、各画素について基準値を生じさせ、この基準値は、後でその画素について測定される強度から差し引かれる。ダークフレーム較正により、各画素は、画像を得る最も暗い条件でゼロ強度を有することになり、それにより、0〜255範囲の有効又は有用部分を拡張する。加うるに、画像引き伸ばしを利用して8ビットバイトの有効範囲を拡張するのがよいが、このようにするかどうかは任意である。画像引き伸ばしは、ダークフレーム較正後に最大強度値及び最小強度値を識別することにより行う。次に、各画素値に255/(最大強度−最小強度)の比を乗算して最も高い測定強度が255の画素値を有し、最も低い画素値が0の画素値を有するようにする。このような画像引き伸ばしは、画像の外観を向上させる上で特に有用である。
Referring to FIG. 3, the image of the
ステップ450において、ボックス80(図3)により表されたデータセットを、虹彩画像70を含むが、強膜画像60を排除するように選択する。好ましい実施形態では、強膜画像60を取り込んだ画像から除外するのに、画像取込みデバイス40の視野を大抵の被験者にとって代表的である虹彩直径よりも小さな又はこれに等しい直径にあらかじめ設定する。しかしながら、他の方法、例えばしきい値検出を用いて強膜画像60の存在場所を突き止め、これをボックス80から排除してもよい。
In
ステップ460によれば、虹彩画像70中に多数の計算空間90,100,110,120を定め、これら計算空間の各々は、虹彩の特定の領域に対応している。図3に示すように、計算空間90は、第1の領域92及び第2の領域94を有している。他の計算空間100,110,120も同様に、これらそれ自体のそれぞれの第1及び第2の領域を有している。第1及び第2の領域は、好ましくは、性質として矩形であり、「L字形」計算空間を形成するよう互いに対して位置決めされている。
Step 460 defines a number of
第1の領域92及び第2の領域94は、好ましくは、長さが画素150個分及び幅が画素20個分である。第1の領域92は、好ましくは、ボックス80の近くのコーナー部の水平方向及び垂直方向内方に配置された17個の画素である。瞳孔130は、虹彩70内に位置し、かくして、虹彩の画像は、瞳孔を含む。しかしながら、瞳孔は、光学活性体の濃度を計算するのには用いられず、計算空間90,100,110又は120内には位置していない。
The first region 92 and the
上述したように、本発明は、被験者から反射された偏光の強度の比を用いると、ブドウ糖濃度を予測できるという発見に関している。しかしながら、かかる比は、ブドウ糖濃度と共に周期的に変わることが判明した。また、光強度測定値は、患者の目30に対する像取込みデバイス40、光源10、及び偏光子20の位置合わせ状態が首尾一貫しないので「ピッチ・アンド・ヨー(pitch and yaw)」誤差を受ける場合があることが判明した。この結果、パターン照合表を作成するために用いられる画像と未知の濃度を測定するために用いられる画像との間に不一致が生じる場合がある。多数の計算空間を用いることにより、少なくとも或る程度は、強度比とブドウ糖及びピッチ・アンド・ヨー誤差との間の関係の周期性がアドレスされることが理論化される。
As described above, the present invention relates to the discovery that glucose concentration can be predicted using the ratio of the intensity of polarized light reflected from a subject. However, such ratios have been found to change periodically with glucose concentration. Also, the light intensity measurement is subject to a “pitch and yaw” error because the alignment of the
ステップ470において、所定の画像を用いて、第1の領域92の画素値の全てを互いに加算して所定の強度の第1の和を得ると共に第2の領域94の画素値の全てを互いに加算して所定の強度の第2の和を得る。ステップ480において、所定の強度の第1の和を所定の強度の第2の和で除算して計算空間90について所定の強度比を得る。次に、同じ手順を残りの計算空間100,110,120について用いてこれらのそれぞれの所定の強度比を生じさせる。
In
ステップ490に示すように、所望の数の既知の濃度の各々に対応した所定の画像を得ることによりこの手順を繰り返し、表1に示すようにパターン照合表を作成する。表1及び本明細書に記載している残りの表のデータは、参考目的で提供されており、これらのデータは、実験結果に基づく実際のデータを反映するものではない。加うるに、表に示された計算空間比値に105を乗算し、それにより、かかる値を整数表記に変換してパターン照合表がコンピュータで実行したときに計算効率を向上させる。
As shown in
表 1
計算空間比
ブドウ糖 計算空間 計算空間 計算空間 計算空間
(mg/dl) 90 100 110 120
1 100 101000 110000 90000 112000
2 200 130000 115000 108000 117500
3 300 145900 120000 136500 127000
4 400 200000 175000 190000 183500
Table 1
Computational space ratio
Glucose calculation space Calculation space Calculation space Calculation space (mg / dl) 90 100 110 120
1 100 101000 110000 90000 112000
2 200 130000 115000 108000 117500
3 300 145900 120000 136500 127000
4 400 200000 175000 190000 183500
好ましくは、被験者の目30の瞳孔の直径は、連続した各々の所定の画像及び既知のブドウ糖濃度について一定の値に保ち、それにより、計算空間が首尾一貫して同一の虹彩位置に位置決めされるように一層よく保証すると共に瞳孔直径のばらつきにより生じる光の反射のばらつきを減少させる。
Preferably, the pupil diameter of the subject's
未知のブドウ糖値の計算
パターン照合表をいったん得ると、未知の濃度値を図2のシステムの使用により求めることができる。目30の測定画像の取り込みに先立って被験者の瞳孔は、好ましくは、パターン照合表の作成と関連して所定の画像を取り込んだ時点でその直径に一致するよう調節される。
Once the unknown glucose value calculation pattern matching table is obtained, the unknown concentration value can be determined by using the system of FIG. Prior to capturing the measurement image of the
図5は、本発明の好ましい実施形態に従って光学活性体の濃度を測定する方法を示す流れ図である。この方法によれば、測定画像、例えば図3に示す測定画像を、パターン照合表を作成するのに所定の画像を得たのと同一の仕方でステップ510において得る。ステップ520では、ダークフレーム較正を上述したように実行する。ステップ530に示すように、ボックス80で表されたデータセットを虹彩画像70を含むが強膜画像60を排除するよう選択する。
FIG. 5 is a flow diagram illustrating a method for measuring the concentration of an optically active substance according to a preferred embodiment of the present invention. According to this method, a measurement image, such as the measurement image shown in FIG. 3, is obtained in
ステップ540において、計算空間90,100,110,120を測定画像中に定めてこれら計算空間が、パターン照合表を作成するために用いられた所定画像中に用いられた計算空間に対応するようにする。
In
ステップ550において、測定画像から、計算空間90の第1の領域92中の画素の全てを合計して測定光強度データの第1の和を得ると共に第2の領域94中の画素の全てを合計して測定光強度データの第2の和を得る。ステップ560において、第1の和を第2の和で除算して計算空間90について測定強度の比を得る。同様な仕方で、測定強度の比を計算空間90,100,110,120について得る。
In
次に、ステップ570,580において、最小オフセット誤差を各計算空間について計算する。本明細書で用いる「オフセット誤差」という用語は、測定光強度の比と所定の光強度の比の差の絶対値を指している。最小オフセット誤差を各計算空間について計算するため、まず最初に、各計算空間に関する測定光強度と同じ計算空間に対応するパターン照合表中の所定の光強度比の各々との差の絶対値を計算することにより各計算空間についてのオフセット誤差を求める。
Next, in
表2は、計算空間90についてのオフセット誤差の計算結果を示している。例えば、表1のデータを用いると、計算空間90の測定光強度比が111000である場合、オフセット誤差は次の通りである。
Table 2 shows the calculation result of the offset error for the
表 2
パターン照合表 既知のブドウ糖値 所定光強度比 計算空間90について
エントリの索引 (mg/dl) のオフセット誤差
1 100 101000 10000
2 200 130000 19000
3 300 145900 34900
4 400 200000 99000
Table 2
Pattern matching table Known glucose value Predetermined light intensity ratio About
Entry index (mg / dl) offset error
1 100 101000 10000
2 200 130000 19000
3 300 145900 34900
4 400 200000 99000
かくして、計算空間90に関し、最小オフセット誤差は、10000であり、これは、100mg/dlの既知のブドウ糖濃度に相当している。注目されるように、オフセット誤差を計算するために用いられた所定光強度比は、表1の「計算空間90」の列からの比である。同様に、オフセット誤差及び最小オフセット誤差を計算空間100,110,120について計算する。最小オフセット誤差は各々、計算空間と既知のブドウ糖濃度の両方に対応している。
Thus, for the
本発明の一実施形態によれば、ステップ590において、一連のクラスタ又はグループを定め、各クラスタ又はグループは、固有の組をなす計算空間又は虹彩領域を有する。クラスタを用いることにより、光学活性体の濃度を互いに最も一致している計算空間に基づかせる手段が得られ、それにより、首尾一貫性の最も低い計算空間が取り除かれる。例えば、クラスタを次のように定めるのがよい。
クラスタ1:計算空間90,100,110
クラスタ2:計算空間100,110,120
クラスタ3:計算空間90,100,120
クラスタ4:計算空間90,110,120
この実施形態によれば、ステップ600において、各クラスタを有する計算空間について最小オフセット誤差を合計し、最小オフセット誤差の合計が最も小さなクラスタを識別する。識別されたクラスタは、各々がパターン照合表中の既知の濃度値に相当する最小オフセット誤差を有する3つの計算空間を有することになる。次に、3つの既知の濃度値をステップ610において平均し、それにより被験者に関する測定濃度値を得る。
According to one embodiment of the invention, in step 590, a series of clusters or groups are defined, each cluster or group having a unique set of computational space or iris regions. Using clusters provides a means to base the optically active concentrations on the computational space that most closely matches one another, thereby eliminating the least coherent computational space. For example, the cluster may be determined as follows.
Cluster 1:
Cluster 2:
Cluster 3:
Cluster 4:
According to this embodiment, in
例えば、計算空間90の測定強度比が、110000であり、計算空間100,110,120の測定強度比がそれぞれ、125000,150000,160000である場合、以下のように表1のデータから以下の最小オフセット誤差及びこれに対応した既知ブドウ糖濃度が得られる。
For example, when the measurement intensity ratio of the
表 3
計算空間 最小オフセット誤差 最小オフセット誤差に相当する
既知のブドウ糖濃度(mg/dl)
90 10000 100
100 5000 300
110 13500 300
120 23500 400
Table 3
Computational space Minimum offset error
Known glucose concentration (mg / dl)
90 10000 100
100 5000 300
110 13500 300
120 23500 400
次に、各クラスタに関する最小オフセット誤差和は、次の通りである。
表 4
クラスタ クラスタを有する計算空間 最小オフセット誤差の和
1 90,100,110 28500
2 100,110,120 42000
3 90,100,120 38500
4 90,110,120 47000
Next, the minimum offset error sum for each cluster is as follows.
Table 4
Cluster Computation space with clusters Sum of minimum offset errors 1 90, 100, 110 28500
2 100, 110, 120 42000
3 90, 100, 120 38500
4 90,110,120 47000
かくして、最小オフセット誤差和を有するクラスタは、クラスタ1である。クラスタ1を有する計算空間は、既知のブドウ糖濃度100,300,300に相当する最小オフセット誤差を有し、これらの平均は、700/3=233mg/dlである。 Thus, the cluster with the minimum offset error sum is cluster 1. The computational space with cluster 1 has a minimum offset error corresponding to a known glucose concentration of 100, 300, 300, the average of which is 700/3 = 233 mg / dl.
画像の回転
本発明の別の特徴は、光学活性体の濃度を計算するために回転画像データの任意的な使用に関している。上述したように、像取込みデバイスを首尾一貫して位置決めする際の問題の結果として、「ピッチ・アンド・ヨー」誤差が生じる場合があり、その結果、パターン照合表を作成するために得られる画像が未知の濃度を測定するために用いられる画像に対して一貫性のない状態で位置決めされるようになる。本発明のこの特徴によれば、複数個の回転画像を得て最も首尾一貫した結果が複数の計算空間の中から得られた回転を識別する。
Image Rotation Another aspect of the invention relates to the optional use of rotated image data to calculate the concentration of optically active material. As noted above, “pitch and yaw” errors may occur as a result of problems in consistently positioning the image capture device, resulting in an image obtained to create a pattern matching table. Will be positioned in an inconsistent state with respect to the image used to measure the unknown density. According to this aspect of the invention, a plurality of rotated images are obtained and the most consistent result identifies the rotation obtained from among the plurality of computational spaces.
好ましくは、画像取込みデバイスにより1つの画像を取り込み、測定光強度データを変換してこれを各所望の回転に対応させることにより回転画像データを作成する。かかる回転変換を行う方法は、当業者には知られており、かかる方法は、市販のソフトウェアパッケージ、例えば、テキサス州オースチン所在のナショナル・インストラメンツ・コーポレイション(National Instruments Corporation)により市場に出されているプログラムであるLABVIEW(登録商標)によって実施できる。回転は、基準座標系に関し約−3°〜約+3°の範囲であることが好ましい。さらに好ましくは、60個の回転画像を約0.1°の間隔で作成する。 Preferably, rotated image data is created by capturing an image with an image capture device, converting the measured light intensity data and corresponding it to each desired rotation. Methods for performing such rotational transformations are known to those skilled in the art, and such methods are marketed by commercially available software packages such as National Instruments Corporation, Austin, Texas. Can be implemented by LABVIEW (registered trademark). The rotation is preferably in the range of about −3 ° to about + 3 ° with respect to the reference coordinate system. More preferably, 60 rotated images are created at intervals of about 0.1 °.
各々が被験者の虹彩の領域に対応した複数の計算空間を基準座標系に関して定める。計算空間は座標系に対して固定されたままなので、画像の回転及び関連のデータ変換は、各計算空間内に位置する測定強度データのシフト又はずれに対応している。その結果、各計算空間についての測定光強度値は、回転位置で変わることになる。 A plurality of calculation spaces each corresponding to the area of the subject's iris are defined with respect to the reference coordinate system. Since the calculation space remains fixed with respect to the coordinate system, image rotation and associated data transformations correspond to shifts or shifts in measured intensity data located within each calculation space. As a result, the measured light intensity value for each calculation space varies with the rotational position.
各回転位置では、最小オフセット誤差を上述した仕方で各計算空間について求める。その結果、多数の最小オフセット誤差が生じるが、これらは各々、回転位置、計算空間及びパターン照合表からの既知の濃度値に対応している。任意的に、データを多数のロケーションを有するアレイとして表すことができ、かかるロケーションは各々、回転位置に対応した行及び計算空間に対応した列によって定められる。表5は、60個の回転画像について作成されたかかるアレイの一部を示している。 At each rotational position, the minimum offset error is determined for each calculation space in the manner described above. The result is a large number of minimum offset errors, each corresponding to a known density value from the rotational position, calculation space and pattern matching table. Optionally, the data can be represented as an array with multiple locations, each such location being defined by a row corresponding to the rotational position and a column corresponding to the computational space. Table 5 shows a portion of such an array created for 60 rotated images.
表 5
最小オフセット誤差
回転位置 計算空間90 計算空間100 計算空間110 計算空間120
-3° 80000 60000 50000 75000
-2.9° 81000 43000 10000 1000
-2.8° 10500 9200 8100 4375
-2.7° 300 2260 40000 55000
… … … … …
0 45000 10000 16000 8200
… … … … …
+2.7° 2268 401 389 16000
+2.8° 600 2970 10000 2200
+2.9° 2600 4500 10500 7890
+3.0° 950 1050 1000 2200
Table 5
Minimum offset error
Rotation
-3 ° 80000 60000 50000 75000
-2.9 ° 81000 43000 10000 1000
-2.8 ° 10500 9200 8100 4375
-2.7 ° 300 2260 40000 55000
……………
0 45000 10000 16000 8200
……………
+ 2.7 ° 2268 401 389 16000
+ 2.8 ° 600 2970 10000 2200
+ 2.9 ° 2600 4500 10500 7890
+ 3.0 ° 950 1050 1000 2200
上記において与えられた例の場合と同様、各最小オフセット誤差は、光強度の測定比とパターン照合表中の光強度の所定比との間の差の絶対値が最小である既知の濃度値に対応している。 As in the example given above, each minimum offset error is a known density value with the smallest absolute value of the difference between the light intensity measurement ratio and the predetermined ratio of light intensity in the pattern matching table. It corresponds.
この実施形態によれば、好ましい回転位置は今や、どの回転位置が最小オフセット誤差和を有するかを求めることにより選択される。表5のアレイ構造を用いて各行を合計して回転画像の個数に対応した列の数を有する最小オフセット誤差和ベクトルを得る。この場合も又、表5の例を用いて、以下の最小オフセット誤差和ベクトルを次のようにして作成することができる。
表 6
回転位置 最小オフセット誤差和
−3° 265000
−2.9° 135000
−2.8° 126675
−2.7° 97560
・・・ ・・・
0 79200
・・・ ・・・
+2.7° 19058
+2.8° 15770
+2.9° 25490
+3.0° 5200
According to this embodiment, the preferred rotational position is now selected by determining which rotational position has the minimum offset error sum. Using the array structure of Table 5, each row is summed to obtain a minimum offset error sum vector having the number of columns corresponding to the number of rotated images. Again, using the example in Table 5, the following minimum offset error sum vector can be generated as follows:
Table 6
Rotation position Minimum offset error sum
-3 ° 265000
-2.9 ° 135000
-2.8 ° 126675
-2.7 ° 97560
...
0 79200
...
+ 2.7 ° 19058
+ 2.8 ° 15770
+ 2.9 ° 25490
+ 3.0 ° 5200
かくして、表6の例によれば、図示のデータについての最小オフセット誤差和は、5200であり、これは、好ましい回転が+3.0°であることを指示している。 Thus, according to the example in Table 6, the minimum offset error sum for the data shown is 5200, which indicates that the preferred rotation is + 3.0 °.
次に、計算空間を各々が計算空間の総数の固有のサブセットを有するクラスタの状態にグループ分けする。この例の目的に関し、クラスタは、この場合も又、次のように定められる。
クラスタ1:計算空間90,100,110
クラスタ2:計算空間100,110,120
クラスタ3:計算空間90,100,120
クラスタ4:計算空間90,110,120
The computation space is then grouped into cluster states, each having a unique subset of the total number of computation spaces. For purposes of this example, the cluster is again defined as follows:
Cluster 1:
Cluster 2:
Cluster 3:
Cluster 4:
好ましい回転(即ち、表5から+3°の行)を用いて、最小オフセット誤差を合計して各々がクラスタを有する計算空間について最小オフセット誤差の和を有するクラスタの和を得る。この場合も又、図2の例を用いると、+3.0°の選択された回転におけるクラスタ和は、次の通りである。
クラスタ1の和=950+1050+1000=3000
クラスタ2の和=1050+1000+2200+=4250
クラスタ3の和=950+1050+2200+=4200
クラスタ4の和=950+1000+2200+=4150
Using the preferred rotation (i.e., + 3 ° rows from Table 5), the minimum offset errors are summed to obtain the sum of clusters with the sum of the minimum offset errors for the computation space with each cluster. Again, using the example of FIG. 2, the cluster sum at the selected rotation of + 3.0 ° is:
Sum of cluster 1 = 950 + 1050 + 1000 = 3000
Sum of cluster 2 = 1050 + 1000 + 2200 + = 4250
Sum of cluster 3 = 950 + 1050 + 2200 + = 4200
Sum of cluster 4 = 950 + 1000 + 2200 + = 4150
かくして、クラスタ1は、最小クラスタ和を有し、このクラスタ1は、ブドウ糖濃度を計算する目的で選択されたクラスタである。上述したように、各最小オフセット誤差は、表1からの所定光強度比及び表1からの既知の濃度値に相当している。かくして、表2に戻ってこれを参照すると、計算空間90,100,110についての950,1050,1000の最小オフセット誤差に相当する既知の濃度をパターン照合表(例えば表1)から検索して取り出し、平均してブドウ糖濃度を得る。
Thus, cluster 1 has a minimum cluster sum, which is the cluster selected for the purpose of calculating the glucose concentration. As described above, each minimum offset error corresponds to a predetermined light intensity ratio from Table 1 and a known density value from Table 1. Thus, referring back to Table 2, referring to this, a known density corresponding to the minimum offset error of 950, 1050, and 1000 for the
パターン照合表内のウィンドウ生成
上述したように、虹彩から反射された光の強度の比がブドウ糖濃度と共に周期的に変化することが発見された。さらに、周期は、用いられた光の波長と共に変化することが発見された。例えば、940nm光源を用いた場合、1サイクル全体が、被験者のブドウ糖レベルが40mg/dlから475mg/dlに変化したときに測定光強度比の変化中に観察される。525nm光源を用いた場合、ほぼ2回のサイクルが、同一のブドウ糖範囲にわたって観察される。本発明の範囲を何ら限定しないで、この周期性は、ブドウ糖レベルが変化すると、虹彩から反射される強度が空間依存的に変化するので生じると理論化される。その結果、互いに異なる虹彩領域が、ブドウ糖レベルが変化するにつれて明るくなり又は薄暗くなるように見えることになる。これら反射強度の変化が、湾曲面、即ち、目の表面で生じるので、周期的関係が観察されると考えられる。
Window Generation in Pattern Matching Table As described above, it has been discovered that the ratio of the intensity of light reflected from the iris varies periodically with glucose concentration. Furthermore, it has been discovered that the period varies with the wavelength of light used. For example, when using a 940 nm light source, an entire cycle is observed during the change in measured light intensity ratio when the subject's glucose level changes from 40 mg / dl to 475 mg / dl. When using a 525 nm light source, approximately two cycles are observed over the same glucose range. Without limiting the scope of the invention in any way, it is theorized that this periodicity occurs because the intensity reflected from the iris changes spatially as glucose levels change. As a result, different iris regions appear to become brighter or dim as the glucose level changes. Since these changes in reflection intensity occur on the curved surface, that is, the surface of the eye, it is considered that a periodic relationship is observed.
被験者のブドウ糖の変化の幅が十分に狭い場合、僅かなグルコース濃度範囲についてパターン照合表を作成することができ、周期性に関する問題を最小限に抑えることができる。しかしながら、被験者のブドウ糖レベルが強度比の周期とブドウ糖濃度の関係よりも広い範囲内で変化する場合、周期性を考慮に入れた技術を採用することが望ましい。 If the subject's glucose change is sufficiently narrow, a pattern matching table can be created for a small glucose concentration range, minimizing periodicity problems. However, if the subject's glucose level changes within a wider range than the relationship between the intensity ratio period and the glucose concentration, it is desirable to employ a technique that takes into account the periodicity.
かくして、本発明の別のオプションとしての特徴は、パターン照合表を副表に細分することに関する。図6は、本発明の好ましい実施形態に従って副表を用いて光学活性体の濃度を計算する方法の好ましい実施形態を示す流れ図である。この図を参照すると、ステップ710〜740において、回転画像データを上述した仕方で作成する。ステップ750において、測定光強度の一連の比を多くの計算空間及び回転位置について作成する。ステップ760において、パターン照合表を互いにオーバラップするウィンドウの状態に細分する。以下に詳細に説明する或る特定の統計学的信頼パラメータを用いてステップ780において、ウィンドウのうちの1つを選択し、ステップ790において、ブドウ糖濃度をパターン照合表全体に基づくのではなく、選択したウィンドウに基づいて予測する。
Thus, another optional feature of the present invention relates to subdividing the pattern matching table into sub-tables. FIG. 6 is a flow diagram illustrating a preferred embodiment of a method for calculating the concentration of an optically active form using a sub-table according to a preferred embodiment of the present invention. Referring to this figure, in steps 710-740, rotated image data is created in the manner described above. In
以下の表7は、本発明のこの特徴を実証するために用いられる例示のパターン照合表である。 Table 7 below is an exemplary pattern matching table used to demonstrate this feature of the present invention.
表 7
計算空間比
索引 ブドウ糖 計算空間 計算空間 計算空間 計算空間
(mg/dl ) 90 100 110 120
1 100 101000 110000 90000 112000
2 200 130000 115000 108000 117500
3 250 145900 120000 136500 12700
4 300 200000 175000 190000 183500
5 350 140000 165000 120000 180000
6 400 138000 130000 115000 170000
7 450 180000 150000 160000 190000
8 500 120000 140000 125000 145000
Table 7
Computational space ratio
Index Glucose Computational space Computational space Computational space Computational space
(Mg / dl) 90 100 110 120
1 100 101000 110000 90000 112000
2 200 130000 115000 108000 117500
3 250 145900 120000 136500 12700
4 300 200000 175000 190000 183500
5 350 140000 165000 120000 180000
6 400 138000 130000 115000 170000
7 450 180000 150000 160000 190000
8 500 120000 140000 125000 145000
この実施形態によれば、一連の副表又は「ウィンドウ」は、パターン照合表から選択される。大きな表に関し、3つの行副表を用い、これに対し、小さな表に関しては、2つの行副表が好ましい。副表は、互いにオーバラップすることが好ましい。互いにオーバラップした副表を用いることは、種々の計算空間とパターン照合表との間のあてはまり又は照合(マッチング)の質の良好な指標を提供すると考えられる。この例の目的に関し、2つの行の互いにオーバラップした副表が用いられる。かくして、第1の副表は、行1,2から成り、第2の副表は、行2,3から成り、第3の副表は、行3,4から成り、第4の副表は、行4,5から成り、第5の副表は、行5,6から成り、第6の副表は、行6,7から成り、第7の副表は、行7,8から成る。 According to this embodiment, a series of sub-tables or “windows” are selected from the pattern matching table. For large tables, three row subtables are used, whereas for small tables, two row subtables are preferred. The sub-tables preferably overlap each other. The use of overlapping sub-tables is thought to provide a good indication of the quality of the fit or matching between the various computation spaces and the pattern matching table. For the purposes of this example, two rows of overlapping subtables are used. Thus, the first subtable consists of rows 1 and 2, the second subtable consists of rows 2 and 3, the third subtable consists of rows 3 and 4, and the fourth subtable is , Rows 4 and 5, the fifth subtable consists of rows 5 and 6, the sixth subtable consists of rows 6 and 7, and the seventh subtable consists of rows 7 and 8.
虹彩の画像を取り込んだ後、画像を回転させて上述したような複数個の回転画像を作る。各回転時に、最小オフセット誤差を各計算空間について計算するが、選択した副表の行のみを用いる。例えば、特定の回転時に、計算空間90が195000の測定強度比を有する場合、種々の副表中のその最小オフセット誤差は、次の通りである。
副表1:195000−130000=65000であり、これは、ブドウ糖の200mg/dlに相当する。
副表2:195000−145900=49100であり、これは、ブドウの250mg/dlに相当する。
副表3:200000−195000=5000であり、これは、ブドウ糖の300mg/dlに相当する。
副表4:200000−1950000=5000であり、これは、ブドウ糖の300mg/dlに相当する。
副表5:195000−140000=55000であり、これは、ブドウ糖の350mg/dlに相当する。
副表6:195000−180000=15000であり、これは、ブドウ糖の450dg/dlに相当する。
副表7:195000−180000=15000であり、これは、ブドウ糖の450mg/dlに相当する。
After capturing the iris image, the image is rotated to create a plurality of rotated images as described above. At each rotation, the minimum offset error is calculated for each calculation space, but only the rows of the selected subtable are used. For example, if the
Subtable 1: 195000-130000 = 65000, which corresponds to 200 mg / dl of glucose.
Subtable 2: 195000-145900 = 49100, which corresponds to 250 mg / dl of grapes.
Subtable 3: 200000-195000 = 5000, which corresponds to 300 mg / dl of glucose.
Subtable 4: 200000-1950000 = 5000, which corresponds to 300 mg / dl of glucose.
Subtable 5: 195000-140000 = 55000, which corresponds to 350 mg / dl of glucose.
Subtable 6: 195,000-180000 = 15000, which corresponds to 450 dg / dl of glucose.
Sub-table 7: 195000-180000 = 15000, which corresponds to 450 mg / dl of glucose.
各副表に関する上述の技術を用いて、数回転好ましくは60回転で各計算空間について最小オフセット誤差を生成する。この操作の結果として、各副表は、これと関連して最小オフセット誤差のアレイを有することになり、各行は、回転に対応し、各列は、計算空間に対応する。この時点において、好ましい回転を上述したのと同一の仕方で識別する。ただし、これを関心のある副表にのみ基づいて識別する場合を除く。かくして、各副表内において、最小オフセット誤差を各回転時における計算空間の全てにわたって合計する。最小オフセット誤差和を有する回転を好ましい回転として識別する。その結果、各副表は、好ましい回転及びこれと関連した最小オフセット誤差和を有することになる。この操作は、表8のデータによって示されている。回転を好ましくは−30°〜+30°の回転指数によって表すことができるが、このようにするかどうかは任意である。 Using the techniques described above for each subtable, a minimum offset error is generated for each computation space in several rotations, preferably 60 rotations. As a result of this operation, each sub-table will have an array of minimum offset errors associated with it, each row corresponding to a rotation and each column corresponding to a computational space. At this point, the preferred rotation is identified in the same manner as described above. However, this is not the case when it is identified based only on the subtable of interest. Thus, within each subtable, the minimum offset error is summed over all of the computational space at each rotation. The rotation with the minimum offset error sum is identified as the preferred rotation. As a result, each sub-table will have a preferred rotation and the associated minimum offset error sum. This operation is illustrated by the data in Table 8. The rotation can preferably be represented by a rotation index of −30 ° to + 30 °, but this is optional.
表 8
副表の番号 開始行 終了行 好ましい回転指数 最小オフセット誤差和
1 1 2 −2 5500
2 2 3 −5 6000
3 3 4 +7 10000
4 4 5 +15 23000
5 5 6 0 15000
6 6 7 −8 2200
7 7 8 −3 4750
Table 8
Sub-table number Start line End line Preferred rotation index Minimum offset error sum 1 1 2 -2 5500
2 2 3-5 6000
3 3 4 +7 10000
4 4 5 +15 23000
5 5 6 0 15000
6 6 7 -8 2200
7 7 8 -3 4750
各好ましい回転指数における各最小オフセット誤差和は、各計算空間について1つずつの1組の最小オフセット誤差に相当している。各計算空間のそれぞれの最小オフセット誤差も又、パターン照合表からの既知の濃度値に対応している。したがって、各副表内において、クラスタ誤差和が最も小さいクラスタを識別し、上述したように識別されたクラスタを含む計算空間について対応の既知のブドウ糖値の平均値を計算することにより好ましい回転時にブドウ糖の数を計算することができる。 Each minimum offset error sum at each preferred rotation index corresponds to a set of minimum offset errors, one for each computation space. Each minimum offset error in each calculation space also corresponds to a known density value from the pattern matching table. Accordingly, in each sub-table, the cluster with the smallest sum of cluster errors is identified, and glucose is calculated at a preferred rotation time by calculating the average value of the corresponding known glucose values for the calculation space including the identified clusters as described above. The number of can be calculated.
統計学的信頼パラメータ
本発明の追加の特徴としては、統計学的信頼パラメータを用いて未知のブドウ糖濃度を計算する目的で幾つかの副表のうちどの副表を選択すべきかを突き止めることが挙げられる。一般的に言って、計算空間の存在場所及び画像回転に対する予測ブドウ糖濃度の感受性を評価する。以下に、幾つかの統計学的信頼パラメータの説明が記載され、かかるパラメータを種々の組み合わせで用いると、ブドウ糖濃度を計算するのに好ましい副表を突き止めることができる。
Statistical confidence parameters An additional feature of the present invention is to identify which sub-table should be selected from among several sub-tables for the purpose of calculating unknown glucose concentrations using statistical confidence parameters. It is done. Generally speaking, evaluate the sensitivity of the predicted glucose concentration to the location of the computational space and image rotation. In the following, a description of some statistical confidence parameters is described, and when such parameters are used in various combinations, a preferred sub-table for calculating glucose concentration can be found.
関心のある第1の統計学的信頼パラメータは、「アレイ偏差」と呼ばれている。本明細書で用いる「アレイ偏差」という用語は、以下のステップに従って各副表について計算されたアレイを指している。
1.各回転時に、全ての計算空間全体にわたって最小オフセット誤差和を計算し、それにより最小オフセット誤差和のベクトルを作成する。ベクトルは、回転の数に等しい多くの値を有し、各最小オフセット誤差和は、回転及び副表に対応する。
2.各ベクトル内において、ベクトル値の標準偏差を計算して選択した副表に対応した標準偏差を得る。
The first statistical confidence parameter of interest is called “array deviation”. As used herein, the term “array deviation” refers to the array calculated for each subtable according to the following steps.
1. At each rotation, a minimum offset error sum is calculated over the entire calculation space, thereby creating a vector of minimum offset error sums. The vector has many values equal to the number of rotations, and each minimum offset error sum corresponds to a rotation and subtable.
2. Within each vector, the standard deviation of the vector value is calculated to obtain the standard deviation corresponding to the selected sub-table.
次に、上述のステップを各副表について繰り返し実施する。ゼロのアレイ偏差が好ましく、このことは、一般に、特定の副表に関する結果が画像回転の変化に対する感受性が比較的低いことを指示している。 Next, the above steps are repeated for each sub-table. An array deviation of zero is preferred, which generally indicates that the results for a particular subtable are relatively insensitive to changes in image rotation.
関心のある第2の統計学的信頼パラメータは、「クラスタ和の偏差」と呼ばれている。本明細書で用いるクラスタ和の偏差という表現は、次のステップに従って各副表について計算された変数を指している。
1.各副表について好ましい回転を識別する。
2.好ましい回転及び選択した副表に対応する回転画像データを用いて、クラスタを含む計算空間について最小オフセット誤差を加えることにより各クラスタについて最小オフセット誤差和を計算する。これにより、1組のクラスタ和の値が生じることになる。
3.クラスタ和の値の標準偏差を計算して各副表について単一の標準偏差を得る。
The second statistical confidence parameter of interest is called the “cluster sum deviation”. As used herein, the expression cluster sum deviation refers to a variable calculated for each sub-table according to the following steps.
1. Identify the preferred rotation for each subtable.
2. Using the preferred rotation and rotated image data corresponding to the selected sub-table, a minimum offset error sum is calculated for each cluster by adding the minimum offset error for the computational space containing the clusters. This produces a set of cluster sum values.
3. Calculate the standard deviation of the cluster sum values to obtain a single standard deviation for each subtable.
好ましくは、クラスタの数は、計算空間の数に等しいであろう。かくして、4つの計算空間が用いられる場合、標準偏差は、4つのクラスタ和を利用した4点標準偏差であろう。 Preferably, the number of clusters will be equal to the number of computational spaces. Thus, if four computational spaces are used, the standard deviation will be a four point standard deviation utilizing four cluster sums.
関心のある第3の統計学的信頼パラメータは、「クラスタ近接度偏差」と呼ばれている。本明細書で用いる「クラスタ近接度偏差」という表現は、次のステップに従って各副表について計算された変数を指している。
1.各回転時に、各計算空間について最小オフセット誤差を計算する(表5の例で示されているように)。
2.各クラスタについて、そのクラスタを有する計算空間について最小オフセット誤差の標準偏差を計算する。これにより、回転位置の数に等しい数の行及びクラスタの数に等しい数の列を有する標準偏差のアレイが得られる。
3.クラスタ近接度偏差は、上述のアレイ中の最も低い標準偏差に等しいであろう。
The third statistical confidence parameter of interest is called “cluster proximity deviation”. As used herein, the expression “cluster proximity deviation” refers to a variable calculated for each sub-table according to the following steps.
1. At each rotation, the minimum offset error is calculated for each calculation space (as shown in the example of Table 5).
2. For each cluster, the standard deviation of the minimum offset error is calculated for the computation space having that cluster. This gives an array of standard deviations with a number of rows equal to the number of rotational positions and a number of columns equal to the number of clusters.
3. The cluster proximity deviation will be equal to the lowest standard deviation in the array described above.
例えば、表5のデータを用いると、−2.8°におけるクラスタ1についての標準偏差は、10500,9200,8100の3点標準偏差、即ち、1201である。この手順を全てのクラスタ及び回転について繰り返し行った後、最も低い標準偏差をクラスタ近接度偏差として選択する。次に、クラスタ近接度偏差を各副表について同一の仕方で計算する。 For example, using the data in Table 5, the standard deviation for cluster 1 at -2.8 ° is a three-point standard deviation of 10500, 9200, 8100, ie 1201. After this procedure is repeated for all clusters and rotations, the lowest standard deviation is selected as the cluster proximity deviation. Next, the cluster proximity deviation is calculated in the same way for each subtable.
関心のある次の統計学的信頼パラメータは、「クラスタ近接度偏差比」である。本明細書で用いる「クラスタ近接度偏差比」という表現は、副表のクラスタ近接度偏差をそのクラスタ和の偏差で除算することにより各副表について計算された数を指している。 The next statistical confidence parameter of interest is the “cluster proximity deviation ratio”. As used herein, the expression “cluster proximity deviation ratio” refers to the number calculated for each sub-table by dividing the cluster proximity deviation of the sub-table by the deviation of its cluster sum.
関心のある次の統計学的信頼パラメータは、「アレイ偏差比」と呼ばれている。本明細書で用いる「アレイ偏差比」という表現は、以下の方法に従って各副表について計算された数を指している。
1.各副表内において、全ての回転位置のところでの各計算空間について最小オフセット誤差を計算して各計算空間について最小オフセット誤差のベクトルを得る。各ベクトルは、回転位置の数に等しい数の要素を有する。
2.各ベクトルにおける値の標準偏差を計算して各計算空間について1つの標準偏差を得る。
3.すると、関心のある副表についてのアレイ標準比は、上述の標準偏差の中で最も大きなものをこれらの中で最も小さなもので除算して得られた値に等しいであろう。
The next statistical confidence parameter of interest is called the “array deviation ratio”. As used herein, the expression “array deviation ratio” refers to the number calculated for each subtable according to the following method.
1. Within each subtable, a minimum offset error is calculated for each calculation space at all rotational positions to obtain a vector of minimum offset errors for each calculation space. Each vector has a number of elements equal to the number of rotational positions.
2. The standard deviation of the values in each vector is calculated to obtain one standard deviation for each calculation space.
3. The array standard ratio for the subtable of interest will then be equal to the value obtained by dividing the largest of the above standard deviations by the smallest of these.
一例として4つの計算空間及び60の回転位置を用いると、ステップ1により、4つの計算空間の各々について1つずつ、最小オフセット誤差について60個の要素から成る4つのベクトルが得られる。ステップ2において、60の要素の標準偏差をベクトルごとの方式で取り、4つの標準偏差値を得る。次に、アレイ偏差を計算するのに4つの標準偏差のうちで最も高い値をこれらのうちで最も低い値で除算する。低いアレイ偏差が一般に好ましい。というのは、これは、種々の計算空間相互間において比較的優れた一致性を指示するからである。 Using four computation spaces and 60 rotational positions as an example, Step 1 yields four vectors of 60 elements, one for each of the four computation spaces and 60 for the minimum offset error. In step 2, the standard deviation of 60 elements is taken on a vector-by-vector basis to obtain four standard deviation values. Next, the highest value of the four standard deviations is divided by the lowest value of these to calculate the array deviation. A low array deviation is generally preferred. This is because it indicates a relatively good match between the various computational spaces.
関心のある次の統計学的信頼パラメータは、「分散」と呼ばれる。本明細書で用いる「分散」という用語は、次の方法に従って各副表について計算された数を指している。
1.上述の方法を用いて関心のある副表について好ましい回転を突き止める。
2.各副表内において、好ましい回転時における各計算空間について最小オフセット誤差を突き止める。各最小オフセット誤差は、パターン照合表中の既知の濃度値に対応し、したがって、表中の行の値に対応する。
3.各計算空間について識別された最小オフセット誤差に対応するパターン照合表中の索引(即ち、行番号)を突き止める。
4.計算空間の各クラスタについて、そのクラスタを含む計算空間について最小オフセット誤差に対応したパターン照合表の索引の標準偏差を計算する。
5.上述の標準偏差のうち最も低いものが、分散である。
The next statistical confidence parameter of interest is called “variance”. As used herein, the term “dispersion” refers to the number calculated for each subtable according to the following method.
1. Use the method described above to locate the preferred rotation for the subtable of interest.
2. Within each subtable, locate the minimum offset error for each computation space at the preferred rotation. Each minimum offset error corresponds to a known density value in the pattern matching table, and thus corresponds to a value in a row in the table.
3. Locate the index (ie, row number) in the pattern matching table that corresponds to the minimum offset error identified for each computation space.
4). For each cluster in the calculation space, the standard deviation of the index of the pattern matching table corresponding to the minimum offset error is calculated for the calculation space including the cluster.
5. The lowest standard deviation is the variance.
例えば、所与の副表中の好ましい回転時に、計算空間90がパターン照合表の行2に対応した最小オフセット誤差を有し、計算空間100が、行3に対応した最小オフセット誤差を有し、計算空間110,120が各々、行6に対応した最小オフセット誤差を有している場合、分散を表9に示すように計算する。
For example, during a preferred rotation in a given subtable,
表 9
クラスタ クラスタを 計算空間について対応の 表索引の標準偏差
含む計算空間 パターン照合表索引
1 90,100,110 2,3,6 2.082
2 100,110,120 3,6,6 1.732
3 90,100,120 2,3,6 2.082
4 90,110,120 2,6,6 2.309
Table 9
Cluster Cluster corresponding to calculation space Standard index of table index
Computation space pattern matching table index
1 90,100,110 2,3,6 2.082
2 100,110,120 3,6,6 1.732
3 90,100,120 2,3,6 2.082
4 90,110,120 2,6,6 2.309
かくして、この例では、分散は、1.732である。低い分散値が好ましい。というのは、このような分散値は、一般に、互いに異なる計算空間相互間の比較的優れた一致度を指示しているからである。 Thus, in this example, the variance is 1.732. A low dispersion value is preferred. This is because such a variance value generally indicates a relatively good degree of coincidence between different calculation spaces.
関心のある次の統計学的信頼パラメータは、「近接度Q係数」であり、これは、2つのパラメータ“Qc”及び“Qv”によって定められる。本明細書で用いられる“Qv”という用語は、以下の方法に従って各副表について計算された数を指す。
1.各回転位置に関し、最小オフセット誤差の最も低い計算空間を突き止める。突き止めた最小オフセット誤差は、パターン照合表中の表索引に対応する。
2.識別した計算空間を含むクラスタのうちの任意の1つを選択する。
3.各回転位置の選択されたクラスタに関し、そのクラスタを含む各計算空間について最小オフセット誤差に対応した既知のブドウ糖濃度を平均することによりブドウ糖濃度を計算する。これにより、回転位置の数に等しい数の要素を有するブドウ糖濃度のベクトルが得られる。
4.上述のベクトルを含むデータ値からヒストグラムを作成し、任意の1つのブドウ糖値に対応したベクトルロケーションの最大数を突き止める。Qvは、ベクトルロケーションの突き止められた最大数である。
The next statistical confidence parameter of interest is the “proximity Q factor”, which is defined by two parameters “Qc” and “Qv”. As used herein, the term “Qv” refers to the number calculated for each subtable according to the following method.
1. For each rotational position, locate the computation space with the lowest minimum offset error. The determined minimum offset error corresponds to the table index in the pattern matching table.
2. Select any one of the clusters containing the identified computational space.
3. For a selected cluster at each rotational position, the glucose concentration is calculated by averaging the known glucose concentration corresponding to the minimum offset error for each calculation space containing that cluster. This provides a vector of glucose concentration having a number of elements equal to the number of rotational positions.
4). A histogram is created from the data values containing the above-described vectors to find the maximum number of vector locations corresponding to any one glucose value. Qv is the maximum number of vector locations found.
高いQv係数値が好ましい。というのは、これらは、回転空間全体を通じ予測ブドウ糖値が一貫することを指示しているからである。最大ピークに加えて、上述のヒストグラム中に他のピークを観察することができ、これらピークを変数Qv1,Qv2等に割り当てることができる。回転向きの最善あてはめにより、0度の回転箇所の近くでヒストグラム中にピークが生じる。これとは対照的に、回転中の多数のピークは、曖昧さを実証しており、オフセンタ状態にある(即ち、0度の箇所から遠くに位置する)ピークは、パターン照合表を作成するために用いられる所定の画像に対する画像向き誤差を指示している。 A high Qv coefficient value is preferred. This is because they indicate that the predicted glucose values are consistent throughout the rotational space. In addition to the maximum peak, other peaks can be observed in the histogram described above, and these peaks can be assigned to variables Qv 1 , Qv 2, etc. The best fit in the rotation direction causes a peak in the histogram near the 0 degree rotation point. In contrast, many rotating peaks have demonstrated ambiguity, and peaks that are off-center (ie, located far from 0 degrees) create a pattern match table. An image orientation error with respect to a predetermined image used in the above is instructed.
上述したように、Qvに加えて、近接度Q係数は、別の変数“Qc”を有する。本明細書で用いる“Qc”は、上述したように作成されたヒストグラムに基づいてQvが生じる回転位置を指している。 As described above, in addition to Qv, the proximity Q coefficient has another variable “Qc”. As used herein, “Qc” refers to the rotational position where Qv is generated based on the histogram created as described above.
図6のステップ780に示すように、上記統計学的パラメータを用いて被験者のブドウ糖濃度を計算する目的でパターン照合表から特定の副表を選択する。パラメータを種々の仕方で用いて副表を選択することができる。しかしながら、パラメータを用いる好ましい実施形態は、以下の方法によって構成される。
1.2つの最も低いアレイ偏差値を有する副表を選択する。
2.以下の基準を表10に特定された順序で適用することによりブドウ糖計算の基礎となる副表を選択する。
As shown in
1. Select the subtable with the lowest array deviation value.
2. Select the sub-table on which the glucose calculation is based by applying the following criteria in the order specified in Table 10.
表 10
基準 重要度 最も好ましい値
クラスタ近接度偏差比 2 1.0
分散 4 0
Qv 3 中心で最大
アレイ偏差 1 最小
アレイ偏差比 5 最小
好ましい回転時における 6 最小
最小オフセット誤差和
Table 10
Criteria Importance Most preferred value Cluster proximity deviation ratio 2 1.0
Variance 4 0
Qv 3 Maximum at center Center deviation 1 Minimum Array deviation ratio 5 Minimum 6 minimum at preferred rotation
Minimum offset error sum
この実施形態による統計学的信頼パラメータの適用例が表11及び表12のデータによって示されている。 Examples of application of statistical confidence parameters according to this embodiment are shown by the data in Tables 11 and 12.
表 11
副表 アレイ偏差 好ましい回転指数 好ましい回転時における クラスタ近接度
(−30〜+30) 最小オフセット誤差和 偏差比
1 23230 3 3662 2.01
2 22294 3 2351 1.57
3 22754 4 8314 7.1
4 23486 6 171 1.87
5 23634 6 3809 2.14
6 24163 -2 4075 1.26
7 21567 4 24618 1.61
Table 11
Sub-table Array deviation Preferred rotation index Cluster proximity during preferred rotation
(-30 to +30) Minimum offset error sum Deviation ratio
1 23230 3 3662 2.01
2 22294 3 2351 1.57
3 22754 4 8314 7.1
4 23486 6 171 1.87
5 23634 6 3809 2.14
6 24163 -2 4075 1.26
7 21567 4 24618 1.61
表 12
副表 アレイ偏差比 分散 近接度Q係数 予測ブドウ糖
(Qv) (mg/dl)
1 3.08 0.43 48 300
2 2.77 0.5 25 317
3 2.81 0.43 21 325
4 2.97 0.5 39 362
5 2.76 0 26 375
6 2.74 0.43 32 404
7 2.92 0.5 44 438
Table 12
Sub-table Array deviation ratio Variance Proximity Q factor Predicted glucose
(Qv) (mg / dl)
1 3.08 0.43 48 300
2 2.77 0.5 25 317
3 2.81 0.43 21 325
4 2.97 0.5 39 362
5 2.76 0 26 375
6 2.74 0.43 32 404
7 2.92 0.5 44 438
この実施形態によると 共に表11及び表12のデータに基づくと、2つの最小アレイ偏差値は、副表2,7で生じる。副表2,7は、それぞれ1.57及び1.61という事実上同一のクラスタ近接度偏差比を有している。かくして、副表を選択するのに追加の基準が必要である。したがって、次に近接度Q係数を比較する。副表7のQvは、44であり、副表2の近接度Qvは、25である。かくして、Qvの値の中心が比較的良好に0度の回転箇所に位置していると仮定すれば、グルコース濃度を計算する目的で副表7を選択する。 According to this embodiment and based on the data in Tables 11 and 12, two minimum array deviation values occur in sub-tables 2 and 7. Subtables 2 and 7 have virtually identical cluster proximity deviation ratios of 1.57 and 1.61, respectively. Thus, additional criteria are needed to select a subtable. Therefore, the proximity Q coefficient is compared next. The sub-table 7 has a Qv of 44, and the sub-table 2 has a proximity Qv of 25. Thus, assuming that the center of the Qv value is located relatively well at the 0 degree rotation point, sub-table 7 is selected for the purpose of calculating the glucose concentration.
副表7を選択すると、次にこれを用いて好ましい回転時(これは、この場合、+0.3°(回転指数3に対応している)である)最も低い最小オフセット誤差を有するクラスタに基づいてブドウ糖濃度を計算する。上述したように、まず最初に各段階について最小オフセット誤差を計算するが、これらは、副表7のデータにのみ基づいている。次に、各クラスタについて最小オフセット誤差を合計し、最小オフセット誤差の和の最も低いクラスタを選択する。次に、選択したクラスタを含む計算空間について最小オフセット誤差に対応した副表7(図示せず)から既知のブドウ糖値を平均して最終のブドウ糖濃度を得るが、これは、表12の例では、438mg/dlである。 Once sub-table 7 is selected, it is then used to base the cluster with the lowest minimum offset error on the preferred rotation (which in this case is + 0.3 ° (corresponding to a rotation index of 3)). Calculate the glucose concentration. As described above, the minimum offset error is first calculated for each stage, but these are based only on the data in sub-table 7. Next, the minimum offset error is summed for each cluster, and the cluster with the lowest sum of the minimum offset errors is selected. The known glucose values are then averaged from sub-table 7 (not shown) corresponding to the minimum offset error for the computation space containing the selected cluster to obtain the final glucose concentration, which in the example of Table 12 438 mg / dl.
多波長光源の使用
本発明の別の好ましい実施形態によれば、多種多様な波長の光により得られる画像を用いてブドウ糖計算を行う。上述したように、虹彩から反射された光の強度の比は、ブドウ糖濃度に従って周期的に変化する。その結果、或る範囲の濃度にわたり、同一の強度比は、多種多様な濃度に対応する場合がある。光の多くの波長により作成される画像を用いると、周期性の問題をアドレスする追加の手段が得られる。
Use of Multiple Wavelength Light Sources According to another preferred embodiment of the present invention, glucose calculations are performed using images obtained with light of a wide variety of wavelengths. As described above, the ratio of the intensity of the light reflected from the iris changes periodically according to the glucose concentration. As a result, over a range of concentrations, the same intensity ratio may correspond to a wide variety of concentrations. Using images created with many wavelengths of light provides an additional means of addressing periodicity problems.
この実施形態によれば、図1の光源10は、光を複数の互いに異なる波長で送るようになっている。変形例として、互いに異なる画像を互いに異なる波長で作成するのに複数の互いに異なる光源を用いてもよい。赤色(625nm)、緑色(525nm)及び近赤外(940nm)を用いて画像を作成することが好ましい。
According to this embodiment, the
反射光強度比の周期とブドウ糖濃度との関係は、光の波長の関数である。光の互いに異なる波長により得られた種々の画像を用いることにより、周期性に関する問題を解決することができる。というのは、実際のブドウ糖の数は、用いられる全ての波長に関して強度比とブドウ糖濃度との間の関係を満足させなければならないからである。かくして、所与の波長で測定された強度比は多種多様なブドウ糖濃度に対応している場合があるが、これら濃度のうちの1つだけが、他の波長について測定された強度に対応することになる。かくして、周期性に関する問題を最小限に抑えることができ、しかも、予測した固有のブドウ糖濃度を得ることができる。 The relationship between the period of the reflected light intensity ratio and the glucose concentration is a function of the wavelength of the light. By using various images obtained with different wavelengths of light, the problem related to periodicity can be solved. This is because the actual number of glucose must satisfy the relationship between intensity ratio and glucose concentration for all wavelengths used. Thus, the intensity ratio measured at a given wavelength may correspond to a wide variety of glucose concentrations, but only one of these concentrations corresponds to the intensity measured for the other wavelengths. become. Thus, problems with periodicity can be minimized, and the predicted unique glucose concentration can be obtained.
この実施形態によれば、パターン照合表を互いに異なる波長の各々で作成した後、対応の波長を用いて測定画像を作成する。対応の測定画像及びパターン照合表を用いて、上述した方法の使用によりブドウ糖濃度を計算する。各波長に基づいてブドウ糖濃度をいったん計算すると、結果を平均して最終の予想ブドウ糖濃度を得る。 According to this embodiment, after the pattern matching table is created at each of different wavelengths, a measurement image is created using the corresponding wavelength. Using the corresponding measurement image and pattern matching table, the glucose concentration is calculated by using the method described above. Once the glucose concentration is calculated based on each wavelength, the results are averaged to obtain the final expected glucose concentration.
上記実施形態は、本発明の単なる例示である。当業者であれば、本発明の精神及び範囲から逸脱することなくかかる実施形態の多くの用途及び変形例を想到できよう。したがって、本発明の範囲は、かかる実施形態によっては何ら限定され又は特定されず、これとは異なり、本発明の範囲は、特許請求の範囲の記載にのみ基づいて定められる。 The above embodiments are merely examples of the present invention. Those skilled in the art will envision many uses and variations of such embodiments without departing from the spirit and scope of the invention. Accordingly, the scope of the present invention is not limited or specified in any way by such embodiments, and the scope of the present invention is defined only based on the description of the claims.
Claims (15)
物体(30)から反射された光を受け取るように配置され、これから測定画像を作るようになった第1の像取込みデバイス(40)を有し、
前記測定画像に基づいて前記光学活性体の濃度を計算するよう構成されたプロセッサ(42)を有し、
偏光子(20)が、前記光源(10)と前記目(30)との間に位置決めされて、前記光源(10)から、前記虹彩(18)に向かって光を送出し、その際、前記送出された光が、或る入射角で虹彩(18)に接触するようにされており、当該入射角が1つ又はそれより多い種類の角度を有し、当該1つ又はそれより多い種類の角度の入射角の少なくとも1つが、前記虹彩(18)から反射された光の一部の偏光を生じさせるために十分なものであり、
前記第1の像取込みデバイス(40)が、前記目(30)から反射された光の一部を受信するように配置され、それに基づいて測定された画像を生成するようにされ、当該測定された画像が、測定された光強度データを規定し、
前記プロセッサ(42)が、当該測定された光強度データの、選択された部分に基づいて、前記光学活性体の濃度を計算するように構成される、
装置。A light source (10) adapted to send light toward an object (30) containing a solution of optically active material, wherein the object (30) is a human eye having an iris (18);
A first image capture device (40) arranged to receive light reflected from the object (30) and adapted to produce a measurement image therefrom;
The have a processor (42) configured to calculate the concentration of the optically active substance based on the measured image,
A polarizer (20) is positioned between the light source (10) and the eye (30) to deliver light from the light source (10) toward the iris (18), wherein the The transmitted light is adapted to contact the iris (18) at an angle of incidence, the angle of incidence having one or more types of angles, the one or more types of At least one of the angles of incidence is sufficient to cause polarization of a portion of the light reflected from the iris (18);
The first image capture device (40) is arranged to receive a portion of the light reflected from the eye (30) and is adapted to generate a measured image based on the measured image. The image defines the measured light intensity data,
The processor (42) is configured to calculate a concentration of the optically active substance based on a selected portion of the measured light intensity data;
apparatus.
前記プロセッサ(42)が、前記測定された光強度データの選択された部分、前記所定の濃度データの選択された部分、及び、前記所定の光強度データの選択された部分、に基づいて、前記光学活性体の濃度を計算するように構成される、 Based on the selected portion of the measured light intensity data, the selected portion of the predetermined density data, and the selected portion of the predetermined light intensity data, the processor (42) Configured to calculate the concentration of the optically active form,
請求項1から4のいずれかに記載の装置。The apparatus according to claim 1.
前記プロセッサ(42)が、前記回転画像データ、及び、測定された光強度データの前記選択された部分に基づいて、前記光学活性体の前記濃度を計算するように構成される、 The processor (42) is configured to calculate the concentration of the optically active material based on the rotated image data and the selected portion of measured light intensity data.
請求項1から6のいずれかに記載の装置。The apparatus according to claim 1.
前記物体から反射した光の前記部分の、1つ又はそれより多い測定された強度を生成し、 Generating one or more measured intensities of the portion of light reflected from the object;
前記プロセッサ(42)が、前記物体(30)から反射された光の前記部分の、前記1つ又はそれより多い測定された強度を受信するようにされ、 The processor (42) is adapted to receive the one or more measured intensities of the portion of light reflected from the object (30);
前記測定された光強度データが、前記物体から反射された、前記1つ又はそれより多い測定された光の強度を含む、 The measured light intensity data includes the one or more measured light intensities reflected from the object;
請求項1から8のいずれかに記載の装置。The device according to claim 1.
前記測定された光強度データの、前記選択された部分が、前記1つ又はそれより多い計算空間(90,100,110,120)の中の、複数の測定された光強度の少なくとも1つを含み、The selected portion of the measured light intensity data represents at least one of a plurality of measured light intensities in the one or more calculation spaces (90, 100, 110, 120). Including
前記プロセッサ(42)が、前記計算空間(90,100,110,120)の各々に対応する計算空間比を計算するように構成され、 The processor (42) is configured to calculate a calculation space ratio corresponding to each of the calculation spaces (90, 100, 110, 120);
前記測定された光強度データの、前記選択された部分が、前記計算空間比の少なくとも1つを含む、 The selected portion of the measured light intensity data includes at least one of the computational spatial ratios;
請求項1から9のいずれかに記載の装置。Apparatus according to any of claims 1 to 9.
前記計算空間比の各々が、前記対応する第1の合計と、前記対応する第2の合計の比を含む(92,94)、 Each of the computational spatial ratios includes a ratio of the corresponding first sum and the corresponding second sum (92, 94);
請求項10に記載の装置。The apparatus according to claim 10.
前記第1の合計の各々が、前記対応する計算空間(90)の、前記対応する第1の領域(92)の各々における、測定された光強度の合計を含み、 Each of the first sums includes a sum of measured light intensities in each of the corresponding first regions (92) of the corresponding computation space (90);
前記第2の合計の各々が、前記対応する計算空間(90)の、前記対応する第2の領域(94)の各々における、前記測定された光強度の合計を含む、 Each of the second sums comprises a sum of the measured light intensities in each of the corresponding second regions (94) of the corresponding computation space (90);
請求項11に記載の装置。The apparatus of claim 11.
請求項1から12のいずれかに記載の装置。Device according to any of the preceding claims.
請求項13に記載の装置。The apparatus of claim 13.
請求項14に記載の装置。The apparatus according to claim 14.
Applications Claiming Priority (3)
| Application Number | Priority Date | Filing Date | Title |
|---|---|---|---|
| US10/981,181 US7167736B2 (en) | 2004-11-04 | 2004-11-04 | Non-invasive measurement system and method for measuring the concentration of an optically-active substance |
| US10/981,181 | 2004-11-04 | ||
| PCT/US2005/039750 WO2006052634A2 (en) | 2004-11-04 | 2005-11-03 | Non-invasive measurement system and method for measuring the concentration of an optically-active substance |
Related Child Applications (1)
| Application Number | Title | Priority Date | Filing Date |
|---|---|---|---|
| JP2011202908A Division JP2012016606A (en) | 2004-11-04 | 2011-09-16 | Non-invasive measurement system and method for measuring concentration of optically-active substance |
Publications (3)
| Publication Number | Publication Date |
|---|---|
| JP2008519281A JP2008519281A (en) | 2008-06-05 |
| JP2008519281A5 JP2008519281A5 (en) | 2011-11-17 |
| JP4879184B2 true JP4879184B2 (en) | 2012-02-22 |
Family
ID=36262982
Family Applications (2)
| Application Number | Title | Priority Date | Filing Date |
|---|---|---|---|
| JP2007540014A Expired - Fee Related JP4879184B2 (en) | 2004-11-04 | 2005-11-03 | Non-invasive measurement system and method for measuring the concentration of optically active substances |
| JP2011202908A Pending JP2012016606A (en) | 2004-11-04 | 2011-09-16 | Non-invasive measurement system and method for measuring concentration of optically-active substance |
Family Applications After (1)
| Application Number | Title | Priority Date | Filing Date |
|---|---|---|---|
| JP2011202908A Pending JP2012016606A (en) | 2004-11-04 | 2011-09-16 | Non-invasive measurement system and method for measuring concentration of optically-active substance |
Country Status (6)
| Country | Link |
|---|---|
| US (1) | US7167736B2 (en) |
| EP (1) | EP1824377A4 (en) |
| JP (2) | JP4879184B2 (en) |
| CN (2) | CN101160089B (en) |
| IL (1) | IL182997A (en) |
| WO (1) | WO2006052634A2 (en) |
Families Citing this family (39)
| Publication number | Priority date | Publication date | Assignee | Title |
|---|---|---|---|---|
| US7139598B2 (en) * | 2002-04-04 | 2006-11-21 | Veralight, Inc. | Determination of a measure of a glycation end-product or disease state using tissue fluorescence |
| US20070276199A1 (en) * | 2002-04-04 | 2007-11-29 | Ediger Marwood N | Determination of a Measure of a Glycation End-Product or Disease State Using Tissue Fluorescence |
| US8131332B2 (en) * | 2002-04-04 | 2012-03-06 | Veralight, Inc. | Determination of a measure of a glycation end-product or disease state using tissue fluorescence of various sites |
| US8140147B2 (en) * | 2002-04-04 | 2012-03-20 | Veralight, Inc. | Determination of a measure of a glycation end-product or disease state using a flexible probe to determine tissue fluorescence of various sites |
| GB2451441B (en) * | 2007-07-30 | 2012-07-11 | Lein Applied Diagnostics Ltd | Optical alignment apparatus and method thereof |
| US8144960B2 (en) * | 2007-10-03 | 2012-03-27 | Winther Dale E | Method for measuring the concentration of a substance using advanced image processing techniques |
| DE102008013821B4 (en) * | 2008-03-10 | 2010-11-18 | Westphal, Peter, Dr. | Method and device for measuring dissolved substances in human or animal ocular aqueous humor |
| US8380270B2 (en) * | 2010-01-26 | 2013-02-19 | Chromologic Llc | Non-invasive ocular monitoring |
| BR112013016975A2 (en) * | 2011-01-04 | 2019-09-24 | Koninklijke Philips Electrnics N. V. | apparatus for optical analysis of an associated tissue, method for optical analysis of an associated tissue and computer program product |
| WO2012109116A2 (en) | 2011-02-07 | 2012-08-16 | Quantum Catch, Llc | Noninvasive eye-property monitoring, including aqueous-humor glucose monitoring as an indication of blood glucose level |
| WO2012118907A2 (en) | 2011-03-02 | 2012-09-07 | Quantum Catch, Llc | Ocular fundus camera system and methodology |
| US9724022B2 (en) | 2011-04-29 | 2017-08-08 | Taiwan Biophotonic Corporation | Apparatus for non-invasive glucose monitoring |
| US9662004B2 (en) | 2011-04-29 | 2017-05-30 | Taiwan Biophotonic Corporation | Apparatus for non-invasive glucose monitoring |
| US9833175B2 (en) | 2011-04-29 | 2017-12-05 | Taiwan Biophotonic Corporation | Apparatus for non-invasive blood glucose monitoring |
| TW201421029A (en) * | 2012-11-30 | 2014-06-01 | Ind Tech Res Inst | System and method for measuring the rotation angle of optical activity |
| JP6364792B2 (en) * | 2014-01-31 | 2018-08-01 | セイコーエプソン株式会社 | Biological information processing method, biological information processing apparatus, computer system, and wearable device |
| JP5800100B1 (en) * | 2014-03-20 | 2015-10-28 | 富士ゼロックス株式会社 | Eyeball optical measuring device |
| WO2016052282A1 (en) * | 2014-10-03 | 2016-04-07 | Advantest Corporation | Non-invasive in situ glucose level sensing using electromagnetic radiation |
| US10092209B2 (en) * | 2014-10-03 | 2018-10-09 | Advantest Corporation | Non-invasive in situ glucose level sensing using electromagnetic radiation |
| EP3214993B1 (en) | 2014-11-07 | 2022-03-30 | Ohio State Innovation Foundation | Methods and apparatus for making a determination about an eye in ambient lighting conditions |
| EP3081163B1 (en) * | 2015-04-12 | 2021-10-20 | Taiwan Biophotonic Corporation | Module, device and method for optical measurement |
| US10750981B2 (en) | 2015-09-25 | 2020-08-25 | Sanmina Corporation | System and method for health monitoring including a remote device |
| US10736580B2 (en) | 2016-09-24 | 2020-08-11 | Sanmina Corporation | System and method of a biosensor for detection of microvascular responses |
| US10888280B2 (en) | 2016-09-24 | 2021-01-12 | Sanmina Corporation | System and method for obtaining health data using a neural network |
| US9636457B2 (en) | 2015-07-19 | 2017-05-02 | Sanmina Corporation | System and method for a drug delivery and biosensor patch |
| US10932727B2 (en) | 2015-09-25 | 2021-03-02 | Sanmina Corporation | System and method for health monitoring including a user device and biosensor |
| US10973470B2 (en) | 2015-07-19 | 2021-04-13 | Sanmina Corporation | System and method for screening and prediction of severity of infection |
| US10744261B2 (en) | 2015-09-25 | 2020-08-18 | Sanmina Corporation | System and method of a biosensor for detection of vasodilation |
| US10194871B2 (en) | 2015-09-25 | 2019-02-05 | Sanmina Corporation | Vehicular health monitoring system and method |
| US9788767B1 (en) | 2015-09-25 | 2017-10-17 | Sanmina Corporation | System and method for monitoring nitric oxide levels using a non-invasive, multi-band biosensor |
| US10321860B2 (en) * | 2015-07-19 | 2019-06-18 | Sanmina Corporation | System and method for glucose monitoring |
| US10952682B2 (en) | 2015-07-19 | 2021-03-23 | Sanmina Corporation | System and method of a biosensor for detection of health parameters |
| US10945676B2 (en) | 2015-09-25 | 2021-03-16 | Sanmina Corporation | System and method for blood typing using PPG technology |
| CN105411524B (en) * | 2015-12-07 | 2020-09-04 | 温州医科大学眼视光器械有限公司 | Pupil detection device |
| CN106596410A (en) * | 2016-11-22 | 2017-04-26 | 西安工程大学 | Method for quickly detecting property of active sludge through light deflection |
| WO2018208233A1 (en) * | 2017-05-12 | 2018-11-15 | National University Of Singapore | Noninvasive optical sensor for analyzing a level of a substance in a subject by illuminating the sclera |
| US10466783B2 (en) | 2018-03-15 | 2019-11-05 | Sanmina Corporation | System and method for motion detection using a PPG sensor |
| WO2021133400A1 (en) * | 2019-12-27 | 2021-07-01 | Ohio State Innovation Foundation | Methods and apparatus for making a determination about an eye using color temperature adjusted ambient lighting |
| US11622682B2 (en) | 2019-12-27 | 2023-04-11 | Ohio State Innovation Foundation | Methods and apparatus for making a determination about an eye using color temperature adjusted ambient lighting |
Citations (4)
| Publication number | Priority date | Publication date | Assignee | Title |
|---|---|---|---|---|
| JPH0743600A (en) * | 1993-07-30 | 1995-02-14 | Canon Inc | Optical device |
| US20030076508A1 (en) * | 2001-09-20 | 2003-04-24 | Cornsweet Tom N. | Non-invasive blood glucose monitoring by interferometry |
| JP2003524153A (en) * | 1999-09-17 | 2003-08-12 | ウォルター ケイ プロニーウィッツ | Noninvasive measurement of blood glucose level |
| US20030233036A1 (en) * | 2001-06-16 | 2003-12-18 | Ansari Rafat R. | Method and apparatus for the non-invasive measurement of blood glucose levels in humans |
Family Cites Families (14)
| Publication number | Priority date | Publication date | Assignee | Title |
|---|---|---|---|---|
| US3533683A (en) * | 1967-06-13 | 1970-10-13 | Whittaker Corp | Dynamic pupillometers using television camera system |
| US3958560A (en) * | 1974-11-25 | 1976-05-25 | Wayne Front March | Non-invasive automatic glucose sensor system |
| US4641349A (en) * | 1985-02-20 | 1987-02-03 | Leonard Flom | Iris recognition system |
| US5291560A (en) * | 1991-07-15 | 1994-03-01 | Iri Scan Incorporated | Biometric personal identification system based on iris analysis |
| JP2500726B2 (en) * | 1992-06-12 | 1996-05-29 | 日本電気株式会社 | Method and apparatus for detecting upper eyelid region, inner corner of eye, outer corner of eye, upper eyelid region and eye structure |
| US5433197A (en) * | 1992-09-04 | 1995-07-18 | Stark; Edward W. | Non-invasive glucose measurement method and apparatus |
| US5791345A (en) * | 1993-09-03 | 1998-08-11 | Toa Medical Electronics Co., Ltd. | Non-invasive blood analyzer |
| US5471542A (en) * | 1993-09-27 | 1995-11-28 | Ragland; Richard R. | Point-of-gaze tracker |
| US5560356A (en) * | 1994-02-23 | 1996-10-01 | Vitrophage, Inc. | Diagnostic system and method using an implanted reflective device |
| US5572596A (en) * | 1994-09-02 | 1996-11-05 | David Sarnoff Research Center, Inc. | Automated, non-invasive iris recognition system and method |
| US5713353A (en) * | 1996-04-19 | 1998-02-03 | Castano; Jaime A. | Optical method and device for determining blood glucose levels |
| JP3604231B2 (en) * | 1996-05-16 | 2004-12-22 | 富士写真フイルム株式会社 | Method and apparatus for measuring glucose concentration |
| US6853854B1 (en) * | 1998-09-18 | 2005-02-08 | Q Step Technologies, Llc | Noninvasive measurement system |
| US6305804B1 (en) * | 1999-03-25 | 2001-10-23 | Fovioptics, Inc. | Non-invasive measurement of blood component using retinal imaging |
-
2004
- 2004-11-04 US US10/981,181 patent/US7167736B2/en not_active Expired - Fee Related
-
2005
- 2005-11-03 CN CN2005800458288A patent/CN101160089B/en not_active Expired - Fee Related
- 2005-11-03 CN CN2011101340098A patent/CN102319074A/en active Pending
- 2005-11-03 JP JP2007540014A patent/JP4879184B2/en not_active Expired - Fee Related
- 2005-11-03 EP EP05818214A patent/EP1824377A4/en not_active Withdrawn
- 2005-11-03 WO PCT/US2005/039750 patent/WO2006052634A2/en active Application Filing
-
2007
- 2007-05-03 IL IL182997A patent/IL182997A/en not_active IP Right Cessation
-
2011
- 2011-09-16 JP JP2011202908A patent/JP2012016606A/en active Pending
Patent Citations (4)
| Publication number | Priority date | Publication date | Assignee | Title |
|---|---|---|---|---|
| JPH0743600A (en) * | 1993-07-30 | 1995-02-14 | Canon Inc | Optical device |
| JP2003524153A (en) * | 1999-09-17 | 2003-08-12 | ウォルター ケイ プロニーウィッツ | Noninvasive measurement of blood glucose level |
| US20030233036A1 (en) * | 2001-06-16 | 2003-12-18 | Ansari Rafat R. | Method and apparatus for the non-invasive measurement of blood glucose levels in humans |
| US20030076508A1 (en) * | 2001-09-20 | 2003-04-24 | Cornsweet Tom N. | Non-invasive blood glucose monitoring by interferometry |
Also Published As
| Publication number | Publication date |
|---|---|
| WO2006052634A3 (en) | 2006-08-17 |
| EP1824377A4 (en) | 2009-09-09 |
| US20060094942A1 (en) | 2006-05-04 |
| CN102319074A (en) | 2012-01-18 |
| US7167736B2 (en) | 2007-01-23 |
| WO2006052634A2 (en) | 2006-05-18 |
| EP1824377A2 (en) | 2007-08-29 |
| CN101160089A (en) | 2008-04-09 |
| CN101160089B (en) | 2011-08-03 |
| IL182997A (en) | 2013-02-28 |
| JP2012016606A (en) | 2012-01-26 |
| JP2008519281A (en) | 2008-06-05 |
| IL182997A0 (en) | 2007-08-19 |
Similar Documents
| Publication | Publication Date | Title |
|---|---|---|
| JP4879184B2 (en) | Non-invasive measurement system and method for measuring the concentration of optically active substances | |
| US10191542B2 (en) | Visual display with illuminators for gaze tracking | |
| Delori et al. | Quantitative measurements of autofluorescence with the scanning laser ophthalmoscope | |
| US8888284B2 (en) | Field of light based device | |
| US7360894B2 (en) | Opthalmological apparatus | |
| JP5618827B2 (en) | Apparatus and method for diagnosing or preparing for inflammatory diseases such as rheumatoid arthritis and / or therapeutic monitoring of inflammatory diseases | |
| JP2013078674A (en) | Correlation of concurrent non-invasively acquired signals | |
| JPH11164816A (en) | Method and device for determining optical features of cornea | |
| CN101730498A (en) | Low coherence dental oct imaging | |
| JP2000504256A (en) | Apparatus and method for examining biological blood vessels | |
| CN1379647A (en) | Iris recognition and tracking for optical treatment | |
| US10307057B2 (en) | Eye imaging apparatus | |
| CN1498090A (en) | Contrast chart apparatus, contrast sensitivity measuring apparatus and contrust sensitivity measuring method | |
| JP4499574B2 (en) | A system for tracking the movement of spherical objects. | |
| JP2021525578A (en) | Devices and methods for in vivo measurement of corneal biomechanical responses | |
| Jansson et al. | First polarimetric investigation of malaria mosquitoes as lidar targets | |
| US20220076417A1 (en) | Vision screening systems and methods | |
| Hasebe et al. | The reliability of a video-enhanced Hirschberg test under clinical conditions. | |
| US9456772B2 (en) | Non-invasive ocular analyte sensing system | |
| Szczepanowska-Nowak et al. | System for measurement of the consensual pupil light reflex | |
| US20210393120A1 (en) | Vision screening systems and methods | |
| US20200281528A1 (en) | Method and system for diagnosing a disease using eye optical data | |
| JP5861170B2 (en) | Shooting system | |
| Winchester et al. | Measurement of retinal blood velocity | |
| McMahon | Early limits on spatial visual processing |
Legal Events
| Date | Code | Title | Description |
|---|---|---|---|
| A521 | Request for written amendment filed |
Free format text: JAPANESE INTERMEDIATE CODE: A523 Effective date: 20081104 |
|
| A621 | Written request for application examination |
Free format text: JAPANESE INTERMEDIATE CODE: A621 Effective date: 20081104 |
|
| A711 | Notification of change in applicant |
Free format text: JAPANESE INTERMEDIATE CODE: A711 Effective date: 20100326 |
|
| A521 | Request for written amendment filed |
Free format text: JAPANESE INTERMEDIATE CODE: A821 Effective date: 20100326 |
|
| A131 | Notification of reasons for refusal |
Free format text: JAPANESE INTERMEDIATE CODE: A131 Effective date: 20110318 |
|
| A601 | Written request for extension of time |
Free format text: JAPANESE INTERMEDIATE CODE: A601 Effective date: 20110620 |
|
| A602 | Written permission of extension of time |
Free format text: JAPANESE INTERMEDIATE CODE: A602 Effective date: 20110627 |
|
| A524 | Written submission of copy of amendment under article 19 pct |
Free format text: JAPANESE INTERMEDIATE CODE: A524 Effective date: 20110916 |
|
| TRDD | Decision of grant or rejection written | ||
| A01 | Written decision to grant a patent or to grant a registration (utility model) |
Free format text: JAPANESE INTERMEDIATE CODE: A01 Effective date: 20111031 |
|
| A01 | Written decision to grant a patent or to grant a registration (utility model) |
Free format text: JAPANESE INTERMEDIATE CODE: A01 |
|
| A61 | First payment of annual fees (during grant procedure) |
Free format text: JAPANESE INTERMEDIATE CODE: A61 Effective date: 20111129 |
|
| R150 | Certificate of patent or registration of utility model |
Free format text: JAPANESE INTERMEDIATE CODE: R150 |
|
| FPAY | Renewal fee payment (event date is renewal date of database) |
Free format text: PAYMENT UNTIL: 20141209 Year of fee payment: 3 |
|
| LAPS | Cancellation because of no payment of annual fees |