JP4876216B2 - Surface position measuring method and surface position measuring apparatus - Google Patents
Surface position measuring method and surface position measuring apparatus Download PDFInfo
- Publication number
- JP4876216B2 JP4876216B2 JP2006550729A JP2006550729A JP4876216B2 JP 4876216 B2 JP4876216 B2 JP 4876216B2 JP 2006550729 A JP2006550729 A JP 2006550729A JP 2006550729 A JP2006550729 A JP 2006550729A JP 4876216 B2 JP4876216 B2 JP 4876216B2
- Authority
- JP
- Japan
- Prior art keywords
- cantilever
- thermal vibration
- probe
- spectrum
- area
- Prior art date
- Legal status (The legal status is an assumption and is not a legal conclusion. Google has not performed a legal analysis and makes no representation as to the accuracy of the status listed.)
- Expired - Lifetime
Links
Images

Classifications
-
- G—PHYSICS
- G01—MEASURING; TESTING
- G01Q—SCANNING-PROBE TECHNIQUES OR APPARATUS; APPLICATIONS OF SCANNING-PROBE TECHNIQUES, e.g. SCANNING PROBE MICROSCOPY [SPM]
- G01Q30/00—Auxiliary means serving to assist or improve the scanning probe techniques or apparatus, e.g. display or data processing devices
- G01Q30/04—Display or data processing devices
-
- B—PERFORMING OPERATIONS; TRANSPORTING
- B82—NANOTECHNOLOGY
- B82Y—SPECIFIC USES OR APPLICATIONS OF NANOSTRUCTURES; MEASUREMENT OR ANALYSIS OF NANOSTRUCTURES; MANUFACTURE OR TREATMENT OF NANOSTRUCTURES
- B82Y35/00—Methods or apparatus for measurement or analysis of nanostructures
-
- G—PHYSICS
- G01—MEASURING; TESTING
- G01Q—SCANNING-PROBE TECHNIQUES OR APPARATUS; APPLICATIONS OF SCANNING-PROBE TECHNIQUES, e.g. SCANNING PROBE MICROSCOPY [SPM]
- G01Q60/00—Particular types of SPM [Scanning Probe Microscopy] or microscopes; Essential components thereof
- G01Q60/24—AFM [Atomic Force Microscopy] or apparatus therefor, e.g. AFM probes
- G01Q60/32—AC mode
Landscapes
- Engineering & Computer Science (AREA)
- Physics & Mathematics (AREA)
- General Health & Medical Sciences (AREA)
- General Physics & Mathematics (AREA)
- Nuclear Medicine, Radiotherapy & Molecular Imaging (AREA)
- Radiology & Medical Imaging (AREA)
- Health & Medical Sciences (AREA)
- Chemical & Material Sciences (AREA)
- Power Engineering (AREA)
- Nanotechnology (AREA)
- Crystallography & Structural Chemistry (AREA)
- Analytical Chemistry (AREA)
- Length Measuring Devices With Unspecified Measuring Means (AREA)
- Investigating Or Analyzing Materials Using Thermal Means (AREA)
Description
本発明は、表面位置計測方法および表面位置計測装置に関し、特に、原子間力顕微鏡を用いた表面位置計測方法および表面位置計測装置に関する。 The present invention relates to a surface position measuring method and a surface position measuring apparatus, and more particularly to a surface position measuring method and a surface position measuring apparatus using an atomic force microscope.
1986年に開発された原子間力顕微鏡(Atomic Force Microscope:AFM)(非特許文献1)は、導体・半導体・絶縁体(高分子・生体材料を含む)の表面形状を高分解能で観察することができる顕微鏡である。原子間力顕微鏡は、カンチレバーと呼ばれる極めて柔らかいレバーの先端に針状の突起(探針)を設け、この探針を試料に近づけたときに試料表面と探針の間に発生する微弱な力をカンチレバーのひずみを介して測定できるようにしたものである。なお、本明細書において、「カンチレバー」という用語は、特に明記しない限り、探針を含む広義の意味で用いる。 Atomic Force Microscope (AFM) developed in 1986 (Non-Patent Document 1) observes the surface shape of conductors, semiconductors, and insulators (including polymers and biomaterials) with high resolution. It is a microscope that can Atomic force microscopes have a needle-like protrusion (probe) at the tip of a very soft lever called a cantilever, and the weak force generated between the sample surface and the probe when the probe is brought close to the sample. It can be measured through strain of the cantilever. In this specification, the term “cantilever” is used in a broad sense including a probe unless otherwise specified.
原子間力顕微鏡のカンチレバーの固さに比べて試料表面が十分柔らかい場合、探針が表面に接触しても、カンチレバーの変位(デフレクション)は小さいため、カンチレバーの静的変位量から表面位置を正確に計測することは難しい。例えば、細胞表面の脂質膜は、非常に柔らかく、数十nm以上の大きな振幅で揺らいでおり、その弾性は通常用いられる柔らかいカンチレバーと比較して十分小さいため、低侵襲で脂質膜のみの弾性応答や表面位置を精密に計測することはAFMでは容易ではない。 If the sample surface is sufficiently soft compared to the cantilever hardness of the atomic force microscope, even if the probe touches the surface, the displacement of the cantilever is small, so the surface position is determined from the static displacement of the cantilever. It is difficult to measure accurately. For example, the lipid membrane on the cell surface is very soft and fluctuates with a large amplitude of several tens of nanometers or more, and its elasticity is sufficiently small compared to a soft cantilever that is usually used. It is not easy with AFM to precisely measure the surface position.
柔らかい表面の位置(接触点)を導出する方法としては、探針を表面に強く押し付けたときのフォースカーブの形状から表面位置を算出する方法がある(非特許文献2)。ここで、フォースカーブとは、横軸を探針と試料表面の距離、縦軸をカンチレバーの変位(通常は静的変位)としてプロットして得られる曲線のことである。 As a method of deriving the position (contact point) of the soft surface, there is a method of calculating the surface position from the shape of the force curve when the probe is strongly pressed against the surface (Non-Patent Document 2). Here, the force curve is a curve obtained by plotting the horizontal axis as the distance between the probe and the sample surface and the vertical axis as the displacement of the cantilever (usually static displacement).
一方で、カンチレバーは熱振動をしており、その振幅は、カンチレバーの固さにもよるが、大体1nm以下の程度である。カンチレバーの熱振動の利用方法としては、熱振動スペクトルの計測からカンチレバーのバネ定数を見積もったり(非特許文献3)、熱振動スペクトルの計測から表面と探針の間の相互作用を非接触領域で計測したりすることが行われている(非特許文献4)。
しかしながら、柔らかい表面の位置(接触点)の導出方法として、探針を表面に強く押し付けたときのフォースカーブの形状から表面位置を算出する方法においては、表面位置の計測の精度には一定の限界がある。なぜなら、細胞膜を例にとって説明すると、細胞膜の裏側には細胞骨格などの様々な物質が存在しており、探針を表面に強く押し付けると細胞膜以外のこれらの弾性特性も測定結果に含まれることが予想されるが、それらの影響を考慮した解析は容易ではないからである。また、接触点を評価するためには、探針を一度表面に強く押し付けた後、その曲線を解析するという手続きを行うため、フォースカーブ測定中は接触した位置を瞬時に(リアルタイムで)判断することができない。 However, as a method for deriving the position (contact point) of a soft surface, in the method of calculating the surface position from the shape of the force curve when the probe is pressed strongly against the surface, there is a certain limit to the accuracy of surface position measurement. There is. This is because, taking the cell membrane as an example, there are various substances such as the cytoskeleton on the back side of the cell membrane, and if the probe is pressed strongly against the surface, these elastic characteristics other than the cell membrane may be included in the measurement results. Although it is expected, it is not easy to analyze in consideration of these effects. In addition, in order to evaluate the contact point, the probe is pressed firmly against the surface once and then the curve is analyzed. Therefore, the position of contact is determined instantaneously (in real time) during the force curve measurement. I can't.
上記のように、例えば、細胞表面の脂質膜は、非常に柔らかく、脂質膜のみの弾性応答を測定することはAFMでは難しいと考えられている。しかし、接触位置を正確に計測することが可能になれば、生体膜そのものの粘弾性をローカルに計測することが可能となり、また、細胞膜上の糖タンパク質の精密な力学計測が可能になることが予想される。また、接触位置をリアルタイムで計測することが可能になれば、さらに、非常に柔らかい表面を短時間に精密に二次元マッピングすることや、表面に存在する分子と探針との間の相互作用を精密に時空間計測することも可能になると期待される。 As described above, for example, the lipid membrane on the cell surface is very soft, and it is considered difficult for AFM to measure the elastic response of only the lipid membrane. However, if it is possible to accurately measure the contact position, the viscoelasticity of the biological membrane itself can be measured locally, and precise mechanical measurement of glycoproteins on the cell membrane can be possible. is expected. In addition, if it is possible to measure the contact position in real time, it will be possible to perform two-dimensional mapping of a very soft surface in a short period of time, and the interaction between molecules on the surface and the probe. It is expected that precise spatio-temporal measurement will be possible.
なお、後述するように、本発明は、従来の静的な力学計測ではなく、カンチレバーの動的挙動(熱振動)から接触位置を計測する手法である。カンチレバーの熱振動は、不可避な振動であり、かつ、最小振動振幅であるため、接触位置を最も高精度に計測できる可能性を有し、かつ、表面に与えるダメージを最小限に抑えることができる可能性を有する。しかし、従来、熱振動スペクトルを接触位置の計測に用いた例はなく、また、探針が非常に柔らかい表面(細胞膜のような表面)と接触した場合に、熱振動スペクトルが敏感に応答するかどうかも全く調べられていなかった。 As will be described later, the present invention is not a conventional static mechanical measurement, but a method of measuring the contact position from the dynamic behavior (thermal vibration) of the cantilever. The thermal vibration of the cantilever is an inevitable vibration and has a minimum vibration amplitude, so it has the possibility of measuring the contact position with the highest accuracy and can minimize damage to the surface. Have potential. However, there has been no example of using the thermal vibration spectrum for the measurement of the contact position, and whether the thermal vibration spectrum responds sensitively when the probe contacts a very soft surface (surface like a cell membrane). It was not investigated at all.
本発明の目的は、柔らかい表面の位置を正確に、低侵襲で、かつ高速(リアルタイム)に計測することができる表面位置計測方法および表面位置計測装置を提供することである。 An object of the present invention is to provide a surface position measurement method and a surface position measurement apparatus that can accurately measure the position of a soft surface with minimal invasiveness and high speed (real time).
本発明は、カンチレバーの熱振動に関する量を検出する検出ステップと、検出したカンチレバーの熱振動に関する量の変化に基づいて、試料表面の位置を評価する評価ステップと、を有するようにした。 The present invention includes a detection step for detecting an amount related to thermal vibration of the cantilever and an evaluation step for evaluating the position of the sample surface based on a change in the detected amount related to thermal vibration of the cantilever.
本発明によれば、柔らかい表面の位置を正確に、低侵襲で、かつ高速(リアルタイム)に計測することができる。 According to the present invention, the position of a soft surface can be measured accurately, minimally invasively, and at high speed (in real time).
以下、本発明の実施の形態について、図面を参照して詳細に説明する。 Hereinafter, embodiments of the present invention will be described in detail with reference to the drawings.
本発明者は、柔らかい表面の位置を正確に計測するためには、従来の静的な力学計測ではなく、カンチレバーの動的挙動(熱振動)に着目する必要があることを見出した。すなわち、本発明者は、カンチレバーの熱振動が、不可避な振動であり、かつ、最小振動振幅であるため、接触位置を最も高精度に計測できる可能性を有することを見出し、実験により、探針が柔らかい表面と接触した場合に、熱振動スペクトルが敏感に応答することを確認した。 The present inventor has found that in order to accurately measure the position of the soft surface, it is necessary to focus on the dynamic behavior (thermal vibration) of the cantilever rather than the conventional static mechanical measurement. That is, the present inventor found that the thermal vibration of the cantilever is an inevitable vibration and has a minimum vibration amplitude, so that the contact position can be measured with the highest accuracy. It has been confirmed that the thermal vibration spectrum responds sensitively when in contact with a soft surface.
本発明は、カンチレバーの熱振動に関する量を検出し、検出したカンチレバーの熱振動に関する量の変化に基づいて、試料表面の位置を評価するものである。 The present invention detects the amount related to the thermal vibration of the cantilever and evaluates the position of the sample surface based on the detected change in the amount related to the thermal vibration of the cantilever.
ここで、本明細書で用いる用語について説明しておく。 Here, terms used in this specification will be described.
「フォースカーブ測定」とは、横軸を探針とサンプルの距離、縦軸をカンチレバーの変位(通常は静的変位)としてプロットする測定のことである。 “Force curve measurement” is a measurement in which the horizontal axis represents the distance between the probe and the sample, and the vertical axis represents the displacement of the cantilever (usually static displacement).
「パワースペクトル」とは、任意の時系列データの振幅の二乗をスペクトルとして表したものであり、特に、時系列データとしてカンチレバーの熱振動変位を用いる場合、この熱振動変位の振幅の二乗を「熱振動スペクトル」と呼ぶ。また、熱振動スペクトルの面積を「スペクトル面積」と呼ぶ。 The “power spectrum” represents the square of the amplitude of arbitrary time series data as a spectrum. In particular, when the thermal vibration displacement of a cantilever is used as the time series data, the square of the amplitude of this thermal vibration displacement is expressed as “ It is called “thermal vibration spectrum”. The area of the thermal vibration spectrum is called “spectrum area”.
まず、本発明の原理を説明する。 First, the principle of the present invention will be described.
カンチレバーは、固有の共振周波数で熱振動している。熱振動しているカンチレバーが柔らかい表面に接触したとき、その表面が粘性的な性質を有すれば、カンチレバーの共振周波数は変化しなくても、他の振動特性(例えば、スペクトルの幅)は変化する。したがって、非接触と接触との違いによってエネルギー散逸が不連続に変化すれば、スペクトルの変化から接触位置を精密に見積もることが可能である。すなわち、非接触と接触とは、その現象自体が不連続なものであるため、非接触から接触の状態に変われば、それに対して物理量も不連続に変化するはずである。実際、後述するように、実験により、非接触と接触とで熱振動スペクトルが不連続に変化することを確認した。したがって、熱振動スペクトルは、接触点を判断する物理量として有用であると言える。なお、熱振動の基本モードのスペクトルの幅は粘性に依存しており、粘性が大きければスペクトルの幅も大きくなるという関係がある。 The cantilever is thermally oscillated at a specific resonance frequency. When a thermally vibrating cantilever comes into contact with a soft surface, if the surface has a viscous nature, other vibration characteristics (eg, spectral width) will change even if the resonant frequency of the cantilever does not change. To do. Therefore, if the energy dissipation changes discontinuously due to the difference between non-contact and contact, the contact position can be accurately estimated from the change in spectrum. That is, the phenomenon of non-contact and contact is a discontinuous phenomenon. Therefore, if the state changes from non-contact to contact, the physical quantity should change discontinuously. In fact, as will be described later, it was confirmed by experiments that the thermal vibration spectrum changes discontinuously between non-contact and contact. Therefore, it can be said that the thermal vibration spectrum is useful as a physical quantity for determining the contact point. Note that the spectrum width of the fundamental mode of thermal vibration depends on the viscosity, and there is a relationship that the spectrum width increases as the viscosity increases.
一方、カンチレバーに外場(力学的、電気的、または磁気的外場)を与えてカンチレバーを強制的に振動させる方法は、従来一般的に使用されている。呼び名としては、ダイナミックモード、タッピングモード、AMモード、FMモード、非接触モードなど色々あるが、基本的には、すべてカンチレバーを強制的に振動させる計測である。これらの方法では、強制振動させている周波数における振幅変化や周波数変化を計測する。このとき、強制振動の振幅は熱振動の振幅よりも大きく、強制振動のエネルギーは熱振動のエネルギーよりも大きい。逆に言えば、熱振動の振幅は強制振動の振幅よりも小さく、熱振動のエネルギーは強制振動のエネルギーよりも小さい。したがって、カンチレバーの熱振動を利用することにより、従来の強制振動を利用する方法に比べて、高感度に(つまり、より正確に)、かつ、試料に対して低侵襲に計測を行うことができる。 On the other hand, a method of forcibly vibrating a cantilever by applying an external field (mechanical, electrical, or magnetic external field) to the cantilever has been generally used. There are various names such as a dynamic mode, a tapping mode, an AM mode, an FM mode, and a non-contact mode, but basically all are measurements for forcibly vibrating the cantilever. In these methods, a change in amplitude or a change in frequency at the frequency of forced vibration is measured. At this time, the amplitude of forced vibration is larger than the amplitude of thermal vibration, and the energy of forced vibration is larger than the energy of thermal vibration. Conversely, the amplitude of thermal vibration is smaller than the amplitude of forced vibration, and the energy of thermal vibration is smaller than the energy of forced vibration. Therefore, by using the thermal vibration of the cantilever, it is possible to perform measurement with higher sensitivity (that is, more accurately) and less invasively with respect to the sample as compared with the method using the conventional forced vibration. .
このように、本発明は、強制振動させずに、カンチレバーの熱振動から、接触と非接触との違いを判断するものである。 Thus, the present invention determines the difference between contact and non-contact from the thermal vibration of the cantilever without forced vibration.
本実施の形態では、熱振動しているカンチレバーのデフレクション信号の時系列データをFFT(Fast Fourier Transform)処理して、パワースペクトルを得る。そして、基本共振モード周辺のパワー(スペクトル面積)を取得する。熱振動による基本共振モードの振幅Aの二乗<A2>は、理論的にkBT/kとなる。ここで、kB、T、kは、それぞれ、ボルツマン定数、温度、バネ定数である。In the present embodiment, time series data of a deflection signal of a cantilever that is thermally vibrating is subjected to FFT (Fast Fourier Transform) processing to obtain a power spectrum. Then, the power (spectral area) around the basic resonance mode is acquired. Square <A 2 of the amplitude A of the fundamental resonance mode due to thermal vibrations> is theoretically k B T / k. Here, k B , T, and k are Boltzmann constant, temperature, and spring constant, respectively.
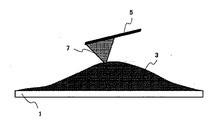
例えば、細胞表面の位置を計測する場合は、図1に示すように、基板1に接着した単一細胞3の上からカンチレバー5を降ろして、フォースカーブ測定を行い、このときの、カンチレバー5のたわみ量と熱振動スペクトルの面積とを測定して、細胞表面の位置を評価する。カンチレバー5のたわみ量は、カンチレバー5の変位信号(デフレクション信号)として測定される。また、熱振動スペクトルの面積(スペクトル面積)は、デフレクション信号(カンチレバー5の変位信号)をFFT処理してパワースペクトル(熱振動スペクトル)を取得し、適当な所定範囲(共振周波数周辺)の面積をとることによって求められる。 For example, when measuring the position of the cell surface, as shown in FIG. 1, the cantilever 5 is lowered from above the single cell 3 adhered to the
図2Aは、探針・細胞表面接触位置近傍の熱振動スペクトルの面積の距離依存性を示すグラフ図であり、図2Bは、図2Aと同時計測したフォースカーブを示すグラフ図である。 2A is a graph showing the distance dependence of the area of the thermal vibration spectrum in the vicinity of the probe / cell surface contact position, and FIG. 2B is a graph showing a force curve measured simultaneously with FIG. 2A.
図2Aおよび図2Bに示すように、熱振動スペクトルの面積(カンチレバー5の共振周波数周辺のスペクトル面積)とカンチレバー5の静的変位(静的な力)とを比較すると、カンチレバー5の静的変位が大きく増加し始める位置よりも約100nm手前から熱振動スペクトルの面積が急激に減少している。これは、細胞3の膜とカンチレバー5の探針7との機械的な接合によりカンチレバー5のエネルギー散逸が起こったために、振動スペクトルが敏感に応答したことを示している。なお、図2Aおよび図2Bでは、便宜上、カンチレバー5の探針7と細胞3の表面との間の距離に関して、熱振動スペクトルの面積が変化し始めた位置を基準位置(0nm)として設定している。 As shown in FIGS. 2A and 2B, when the area of the thermal vibration spectrum (spectrum area around the resonance frequency of the cantilever 5) is compared with the static displacement (static force) of the cantilever 5, the static displacement of the cantilever 5 is compared. The area of the thermal vibration spectrum rapidly decreases from about 100 nm before the position where the value starts to increase greatly. This shows that the vibration spectrum responded sensitively because energy dissipation of the cantilever 5 occurred due to mechanical joining of the membrane of the cell 3 and the
本実施の形態では、上記のように、AFMで広く用いられるフォースカーブ測定を行っている。ただし、通常のフォースカーブ測定では、距離に対してデフレクションまたは加振振幅もしくは加振周波数をプロットするが、本実施の形態では、距離に対して熱振動スペクトル(に関する量)をプロットする、つまり、探針と試料表面間の距離を変化させながら各点におけるパワースペクトルを測定している。スペクトル面積は、図2Aおよび図2Bの実験例では、液中で3kHz程度の基本モードを有するカンチレバーを用いており、数100Hzから10kHzの間の適当な範囲の面積をとっている。ここで、共振周波数が低いカンチレバーを用いているのは、機能的な面で、カンチレバーとしてはできるだけ柔らかいものが良いと考えられるためである(しかし、測定速度の面では、共振周波数の高い方がよい)。 In the present embodiment, force curve measurement widely used in AFM is performed as described above. However, in normal force curve measurement, deflection or excitation amplitude or excitation frequency is plotted against distance, but in this embodiment, a thermal vibration spectrum (a quantity related to) is plotted against distance. The power spectrum at each point is measured while changing the distance between the probe and the sample surface. In the experimental example of FIGS. 2A and 2B, the spectrum area uses a cantilever having a fundamental mode of about 3 kHz in the liquid, and takes an area in an appropriate range between several hundred Hz and 10 kHz. Here, the reason why the cantilever having a low resonance frequency is used is because it is considered functionally preferable to use a cantilever that is as soft as possible (however, in terms of measurement speed, the resonance frequency is higher. Good).
上記のように、探針が試料表面と接触することは、何らかの物理量が変化するものと考えられる。本方法では、パワースペクトルの面積に変化が生じた点を、探針が試料表面に接触し始めた位置であると判断する。図2Aおよび図2Bの横軸は、探針と試料表面間の距離を示し、値が大きくなるほど相互に離れることを示している。図2Aでは、点線よりも右側の領域では熱振動スペクトルの面積はほぼ一定であるが、点線よりも左側の領域に入ると、急激に熱振動スペクトルの面積(共振周波数の周辺)が減少し始める。したがって、点線の位置が、熱振動により見積もられた接触位置である。一方、図2Bでは、カンチレバーの静的変位(デフレクション)について、図2Aにおいて熱振動スペクトルの面積が変化し始めた位置に相当する位置(点線で示す)では変化は起こらず、さらに約100nm押し付けた位置でカンチレバーの静的変位の急激な増加が見られる。これらの結果から、カンチレバーの熱振動を利用した表面位置計測方法(接触位置検出方法)は、カンチレバーの静的変位(デフレクション)を利用した表面位置計測方法よりも高感度であり、高精度であることがわかる。なお、図2Bにおいてデフレクションの急激な増加前にわずかにデフレクションの勾配があるのは、探針7と細胞3の間の遠隔的な相互作用による。 As described above, the contact of the probe with the sample surface is considered to change some physical quantity. In this method, it is determined that the point where the area of the power spectrum has changed is the position where the probe starts to contact the sample surface. The horizontal axis of FIGS. 2A and 2B indicates the distance between the probe and the sample surface, and indicates that the values are separated from each other as the value increases. In FIG. 2A, the area of the thermal vibration spectrum is almost constant in the region on the right side of the dotted line, but when entering the region on the left side of the dotted line, the area of the thermal vibration spectrum (around the resonance frequency) starts to decrease rapidly. . Therefore, the position of the dotted line is the contact position estimated by thermal vibration. On the other hand, in FIG. 2B, the static displacement (deflection) of the cantilever does not change at the position (indicated by the dotted line) corresponding to the position where the area of the thermal vibration spectrum starts to change in FIG. There is a sharp increase in the static displacement of the cantilever at different positions. From these results, the surface position measurement method (contact position detection method) using thermal vibration of the cantilever is more sensitive and accurate than the surface position measurement method using static displacement (deflection) of the cantilever. I know that there is. In FIG. 2B, the slight deflection gradient before the sharp increase in deflection is due to the remote interaction between the
なお、図2Aおよび図2Bでは、熱振動スペクトルの面積が変化し始めた位置、つまり、探針が試料表面と接触し始めた位置を、横軸の原点にしているが、もちろん、これに限定されない。横軸の原点は、探針と試料とが離れた任意の点であってもよい。 In FIGS. 2A and 2B, the position where the area of the thermal vibration spectrum starts to change, that is, the position where the probe starts to contact the sample surface is used as the origin of the horizontal axis. Not. The origin of the horizontal axis may be an arbitrary point where the probe and the sample are separated.
また、本実施の形態では、カンチレバーのデフレクション信号をスペクトルに変換するようにしているが、その理由は次の通りである。 In the present embodiment, the cantilever deflection signal is converted into a spectrum for the following reason.
カンチレバーのデフレクション信号には、カンチレバーの熱振動に関する情報のみならず装置などのノイズ(熱雑音)の情報も含まれるため、デフレクション信号をそのまま制御に用いるとSN比(signal−to−noise ratio)は良くない。そこで、本実施の形態では、デフレクション信号をスペクトルに変換して、カンチレバーの共振モードを抽出することにより、カンチレバーの熱振動の変化を効率的に精度良く計測するようにしている。デフレクション信号をスペクトルに変換すると、広い周波数範囲に対する振幅二乗値(スペクトル)が得られるが、このスペクトルの中から所定範囲の共振モードの周波数部分のみを抽出することにより、SN比が良い信号を得ることができる。 Since the deflection signal of the cantilever includes not only information related to the thermal vibration of the cantilever but also information on noise (thermal noise) of the apparatus and the like, if the deflection signal is used as it is for control, the signal-to-noise ratio is used. ) Is not good. Therefore, in the present embodiment, the change of the thermal vibration of the cantilever is efficiently and accurately measured by converting the deflection signal into a spectrum and extracting the resonance mode of the cantilever. When the deflection signal is converted into a spectrum, an amplitude square value (spectrum) over a wide frequency range is obtained. By extracting only the frequency portion of the resonance mode within a predetermined range from this spectrum, a signal with a good S / N ratio is obtained. Obtainable.
以上のように、本発明は、探針と試料表面間の距離を変化させながら、熱振動スペクトルを高速に計測し、得られた熱振動スペクトルから基本モード成分(スペクトル面積)を抽出して、距離に対するスペクトル面積の変化を高速(リアルタイム)に計測することにより、接触位置を判断するものである。これにより、静的な力学計測と同じ条件である(つまり、強制振動させていない)にもかかわらず、敏感に接触位置を決定することができる。 As described above, the present invention measures the thermal vibration spectrum at high speed while changing the distance between the probe and the sample surface, extracts the fundamental mode component (spectral area) from the obtained thermal vibration spectrum, The contact position is determined by measuring the change in the spectral area with respect to the distance at high speed (in real time). This makes it possible to determine the contact position sensitively despite the same conditions as static mechanical measurement (that is, no forced vibration).
また、基本的には、AFMの通常の計測法(イメージング法)と同じ方法を用いることができるため、リアルタイムに計測を行うことができる。すなわち、本発明では、非接触のときにはスペクトル面積値(X)は一定に保たれるため、例えば、非接触時のスペクトル面積値をX0、所定の変化量をΔXとし、X0−ΔXの値をしきい値として設定しておき、スペクトル面積値がしきい値になった点を判断基準とすることで、接触位置をリアルタイムに判断することができる。In addition, basically, the same method as the normal measurement method (imaging method) of AFM can be used, so that measurement can be performed in real time. That is, in the present invention, the spectrum area value (X) is kept constant when there is no contact. For example, the spectrum area value at the time of non-contact is X 0 , the predetermined change amount is ΔX, and X 0 −ΔX The contact position can be determined in real time by setting the value as a threshold value and using the point at which the spectrum area value becomes the threshold value as a criterion.
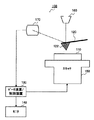
図3は、本発明の一実施の形態に係る表面位置計測装置の構成を示すブロック図である。 FIG. 3 is a block diagram showing the configuration of the surface position measuring apparatus according to the embodiment of the present invention.
この表面位置計測装置100は、上記の計測原理に基づいて、細胞などの柔らかい試料の表面位置をも高精度に計測可能な装置であって、例えば、基板110、カンチレバー120、データ演算/制御装置130、モニタ140、スキャナ150、レーザ装置160、および光検出器170を有する。この表面位置計測装置100は、原子間力顕微鏡を想定している。 The surface
基板110には、試料が載置される(図1参照)。試料は、細胞など非常に柔らかい試料であってもよい。基板110は、例えば、XY軸で規定される平面とする。 A sample is placed on the substrate 110 (see FIG. 1). The sample may be a very soft sample such as a cell. The
カンチレバー120は、先端に、先端が尖った探針122を有する。探針122の先端が、試料表面と接触する接点となる。なお、図3に示す例では、カンチレバー120は固定されている。 The
データ演算/制御装置130は、スキャナ150の駆動を制御する。具体的には、データ演算/制御装置130は、光検出器170が検出した情報を入力し、入力した情報からカンチレバー120のたわみ量(変位量)を読み取り、読み取ったたわみ量(変位量)に基づいてスキャナ150の駆動をフィードバック制御する。データ演算/制御装置130の構成は、後で詳述する。 The data calculation /
モニタ140は、データ演算/制御装置130から送られてくるデータをグラフの形式で画面に表示する。 The
スキャナ150は、基板110を載置し、載置した基板110を精密に三次元走査する(具体的には、X軸、Y軸、Z軸の各方向に移動させる)。スキャナ150は、例えば、ピエゾ素子で構成されている。スキャナ150の駆動は、データ演算/制御装置130によって制御される。これにより、試料表面の走査(XY軸方向)と探針・試料表面間距離の制御(Z軸方向)とが行われる。 The
レーザ装置160は、レーザ光をカンチレバー120の先端背面に照射する。カンチレバー120の先端背面に当たって反射したレーザ光は、光検出器170によって検出される。光検出器170は、検出した情報をデータ演算/制御装置130に出力する。すなわち、カンチレバー120のたわみ(変位)は、レバーの先端背面に当てられたレーザ光の反射角の変化を光検出器170で検出することによって得られる。図3において、レーザ光は、点線で示されている。 The
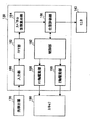
図4は、データ演算/制御装置130の構成の一例を示すブロック図である。 FIG. 4 is a block diagram illustrating an example of the configuration of the data calculation /
このデータ演算/制御装置130は、例えば、コンピュータで構成されており、所定のプログラムに従って、基板110上の試料の表面位置を自動的に計測する機能を有し、例えば、入力部180、FFT部182、スペクトル面積算出部184、位置評価部186、XY軸駆動部188、Z軸駆動部190、および制御部192を有する。 The data calculation /
入力部180は、制御された探針・試料表面間距離(つまり、Z軸方向の位置)ごとに、光検出器170が検出した情報をカンチレバー120の変位信号(デフレクション信号)として入力処理する。入力処理されたデフレクション信号は、FFT部182に出力される。 The
FFT部182は、入力部180からのデフレクション信号をFFT処理してパワースペクトル(熱振動スペクトル)を取得する。得られた熱振動スペクトルのデータは、スペクトル面積算出部184に出力される。 The
スペクトル面積算出部184は、FFT部182から熱振動スペクトルのデータを入力し、入力した熱振動スペクトルの中から所定範囲の共振モードの周波数部分のみを抽出する、つまり、所定範囲の共振周波数周辺の面積をとることにより、カンチレバー120の熱振動スペクトルの面積(スペクトル面積)を算出する。得られたスペクトル面積のデータは、位置評価部186に出力される。 The spectrum
位置評価部186は、スペクトル面積算出部184からのスペクトル面積のデータおよび制御部192からの探針・試料表面間距離のデータならびにこれらの過去のデータの組を用いて、上記の計測原理に基づいて、試料の表面位置を評価する。具体的には、上記のように、熱振動スペクトルの面積が変化し始めた位置(Z軸方向)を、探針122が試料表面と接触し始めた位置、つまり、試料表面の位置であると評価する(図2A参照)。位置評価部186で評価に使用したデータは、グラフ表示可能な形式でモニタ140に出力される。 The
XY軸駆動部188は、スキャナ150のX軸およびY軸を駆動する信号を出力する。この駆動信号を入力したスキャナ150は、試料表面をXY軸方向に走査する。なお、初期位置は、あらかじめ適当な位置に設定されている。 The XY
Z軸駆動部190は、スキャナ150のZ軸を駆動する信号を出力する。この駆動信号を入力したスキャナ150は、試料表面をZ軸方向に走査する。すなわち、この駆動信号によって、カンチレバー120の探針122と基板110上の試料の表面との間の距離が制御される。なぜなら、本実施の形態では、上記のように、カンチレバー120が固定されているため、スキャナ150をZ軸方向に駆動することにより、探針122と試料表面との間の相対距離が変化することになるからである。なお、初期位置は、探針122と試料とが離れた適当な位置に設定されている。 The Z-
制御部192は、スキャナ150の三次元の現在位置(つまり、試料表面のXY軸方向の位置およびZ軸方向の位置)を把握しており、位置評価部186が評価した試料表面の位置情報に基づいて、スキャナ150の駆動をフィードバック制御する。 The
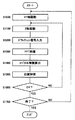
次いで、上記構成を有する表面位置計測装置100の表面位置計測動作について、図5に示すフローチャートを用いて説明する。ここでは、データ演算/制御装置130の動作を中心に説明する。なお、図5に示すフローチャートは、データ演算/制御装置130の記憶装置(ROMなど:図示せず)に制御プログラムとして記憶されており、CPU(図示せず)によって実行される。 Next, the surface position measuring operation of the surface
まず、ステップS1000では、XY軸駆動部188で、スキャナ150をXY軸方向に駆動して、試料表面をXY軸方向に走査する。 First, in step S1000, the XY
そして、ステップS1100では、Z軸駆動部190で、スキャナ150をZ軸方向に駆動して、探針122と試料表面との間の距離を制御する。 In step S1100, the Z-
そして、ステップS1200では、入力部180で、ステップS1100で制御した探針・試料表面間距離に対応して、光検出器170が検出した情報をカンチレバー120の変位信号(デフレクション信号)として入力処理する。 In step S1200, the
そして、ステップS1300では、FFT部182で、ステップS1200で入力処理したデフレクション信号をFFT処理してパワースペクトル(熱振動スペクトル)を取得する。 In step S1300, the
そして、ステップS1400では、スペクトル面積算出部184で、ステップS1300で取得した熱振動スペクトルを入力し、入力した熱振動スペクトルの中から所定範囲の共振モードの周波数部分のみを抽出することにより、カンチレバー120の熱振動スペクトルの面積(スペクトル面積)を算出する。 In step S1400, the spectrum
そして、ステップS1500では、位置評価部186で、ステップS1400で算出したスペクトル面積およびステップS1100で制御した探針・試料表面間距離ならびにこれらの過去のデータの組を用いて、試料の表面位置を評価する。具体的には、熱振動スペクトルの面積が変化し始めた位置(Z軸方向)を、試料表面の位置であると評価する。 In step S1500, the
そして、ステップS1600では、ステップS1500の評価結果がOKであるか否か、つまり、試料表面の位置を検出できたか否かを判断する。この判断の結果として、試料表面の位置を検出できた場合は(S1600:YES)、ステップS1700に進み、試料表面の位置を検出できなかった場合は(S1600:NO)、ステップS1100に戻って、探針122を試料に近づけて同様の測定を行う。 In step S1600, it is determined whether or not the evaluation result in step S1500 is OK, that is, whether or not the position of the sample surface has been detected. As a result of this determination, if the position of the sample surface can be detected (S1600: YES), the process proceeds to step S1700. If the position of the sample surface cannot be detected (S1600: NO), the process returns to step S1100. The same measurement is performed with the
ステップS1700では、試料に対する表面位置の計測が終了したか否かを判断する。具体的には、あらかじめXY軸方向の走査範囲を設定しておき、その走査範囲について走査を完了したか否かを判断する。この判断の結果として、表面位置の計測が終了した場合は(S1700:YES)、一連の処理を終了し、表面位置の計測が終了していない場合は(S1700:NO)、ステップS1000に戻って、試料表面をXY軸方向に走査して次の計測位置で同様の測定を行う。 In step S1700, it is determined whether or not the measurement of the surface position for the sample has been completed. Specifically, a scanning range in the XY axis direction is set in advance, and it is determined whether or not scanning has been completed for the scanning range. As a result of this determination, when the measurement of the surface position is completed (S1700: YES), a series of processing is terminated, and when the measurement of the surface position is not completed (S1700: NO), the process returns to step S1000. The sample surface is scanned in the XY axis direction and the same measurement is performed at the next measurement position.
このように、本実施の形態によれば、カンチレバーの熱振動を利用して試料の表面位置を計測するため、柔らかい表面の位置を正確に、低侵襲で、かつ高速(リアルタイム)に計測することができる。 As described above, according to the present embodiment, the surface position of the sample is measured using the thermal vibration of the cantilever. Therefore, the position of the soft surface can be accurately measured with minimal invasiveness and at high speed (real time). Can do.
したがって、熱振動測定スペクトルの形状が一定になるようにフィードバック信号として用いることにより、試料表面の正確な像を得ることができる(表面イメージング)。 Therefore, an accurate image of the sample surface can be obtained by using it as a feedback signal so that the shape of the thermal vibration measurement spectrum is constant (surface imaging).
また、熱振動スペクトルの形状が一定になるようにフィードバックをかけることにより、探針と表面との間の相互作用を正確に計測することができる。 Further, by applying feedback so that the shape of the thermal vibration spectrum is constant, the interaction between the probe and the surface can be accurately measured.
また、細胞表面の位置を正確に計測することができるため、探針に取り付けた物を細胞などの中に挿入することができる。また、細胞に加える外場を精密に制御することもできる。さらに、細胞表面の揺らぎに関する物性を低侵襲で計測(スペクトル解析)することもできる。 In addition, since the position of the cell surface can be accurately measured, an object attached to the probe can be inserted into a cell or the like. It is also possible to precisely control the external field applied to the cells. Furthermore, physical properties related to cell surface fluctuations can be measured (spectrum analysis) with minimal invasiveness.
なお、本実施の形態では、熱振動スペクトルの面積を求める方法として、熱振動スペクトルを測定し、適当な所定範囲(共振周波数周辺)の面積をとることによって求めるようにしているが、これに限定されるわけではない。例えば、カンチレバーのデフレクション信号にバンドパスフィルタ(共振周波数付近)を施した信号を用いることも可能である。 In the present embodiment, as a method of obtaining the area of the thermal vibration spectrum, the thermal vibration spectrum is measured and obtained by taking an area of an appropriate predetermined range (around the resonance frequency). However, the present invention is not limited to this. It is not done. For example, it is possible to use a signal obtained by applying a band-pass filter (near the resonance frequency) to the cantilever deflection signal.
また、本実施の形態では、熱振動スペクトルの面積を求めるに当たり、基本モードの周波数周辺を抽出するようにしているが、これに限定されるわけではなく、高次の倍波成分を選択しまたは含めることも可能である。高次の倍波成分を選択しまたは含めることにより、さらに高感度な計測を行うことができる。なぜなら、熱振動スペクトルには基本モードや高次のモードが現れているが、高次のモードについても、探針が試料表面と接触することによる変化が現れると考えられるからである。 Further, in the present embodiment, when the area of the thermal vibration spectrum is obtained, the periphery of the fundamental mode frequency is extracted. However, the present invention is not limited to this, and a higher-order harmonic component is selected or It can also be included. By selecting or including higher-order harmonic components, it is possible to perform measurement with higher sensitivity. This is because although the fundamental mode and higher-order mode appear in the thermal vibration spectrum, it is considered that the higher-order mode also changes due to the probe coming into contact with the sample surface.
また、本実施の形態では、熱振動の振幅を測定するようにしているが、これに限定されるわけではなく、熱振動を抑えるようなフィードバック(光圧力などによる方法)を行い、このフィードバック信号を計測する方法も考えられる。具体的には、一般にカンチレバーの変位の測定には光てこ法が用いられるが、光てこ法における光の強度を変化させることにより、カンチレバーに加える光の放射圧を変化させ、それにより、カンチレバーの熱振動の振幅を制御することができる。このとき、カンチレバーの熱振動を完全に静止させることも可能であり、この場合は、光の強度変化がカンチレバーの熱振動に相当することになる。 In this embodiment, the amplitude of thermal vibration is measured. However, the present invention is not limited to this, and feedback (method using optical pressure or the like) that suppresses thermal vibration is performed, and this feedback signal is measured. It is also possible to measure this. Specifically, the optical lever method is generally used for measuring the displacement of the cantilever, but by changing the light intensity in the optical lever method, the radiation pressure of the light applied to the cantilever is changed, and thereby The amplitude of the thermal vibration can be controlled. At this time, it is also possible to completely stop the thermal vibration of the cantilever. In this case, the change in the intensity of light corresponds to the thermal vibration of the cantilever.
また、本実施の形態では、スキャナ150のみをXYZ軸の方向に駆動することにより基板110上の試料を三次元的に移動させるようにしているが、これに限定されるわけではない。例えば、カンチレバーの位置を微調整するXYZ軸をスキャナと共に移動させる構成も可能である。また、スキャナをXY軸方向に移動させ、カンチレバーをZ軸方向に移動させることも可能である。 In the present embodiment, the sample on the
また、本実施の形態では、プログラム(ソフトウエア)制御によって表面位置の計測処理を行う場合を例にとって説明したが、これに限定されるわけではなく、データ演算/制御装置の一部または全部を電子回路などで構成し、計測処理の一部または全部をハードウエア制御によって実現することも可能である。 In the present embodiment, the case where the surface position measurement process is performed by program (software) control has been described as an example. However, the present invention is not limited to this, and part or all of the data calculation / control apparatus may be used. It is also possible to configure an electronic circuit or the like and to realize part or all of the measurement processing by hardware control.
本明細書は、2005年1月6日出願の特願2005−001538に基づく。この内容はすべてここに含めておく。 This specification is based on Japanese Patent Application No. 2005-001538 filed on Jan. 6, 2005. All this content is included here.
本発明に係る表面位置計測方法および表面位置計測装置は、柔らかい表面の位置を正確に、低侵襲で、かつ高速(リアルタイム)に計測することができる表面位置計測方法および表面位置計測装置として有用である。 INDUSTRIAL APPLICABILITY The surface position measurement method and the surface position measurement apparatus according to the present invention are useful as a surface position measurement method and a surface position measurement apparatus that can measure the position of a soft surface accurately, minimally invasively, and at high speed (real time). is there.
特に、本発明は、細胞など非常に柔らかい試料、つまり、壊れやすく、大きく変形する試料に適している。 In particular, the present invention is suitable for very soft samples such as cells, that is, samples that are fragile and greatly deformed.
Claims (4)
検出したカンチレバーの熱振動スペクトルの面積の変化に基づいて計測される前記探針と試料表面との接触位置から、前記試料表面の位置を評価する評価ステップと、
を有する表面位置計測方法。A detecting step for detecting an area of a thermal vibration spectrum of a cantilever having a probe;
An evaluation step for evaluating the position of the sample surface from the contact position between the probe and the sample surface measured based on a change in the area of the thermal vibration spectrum of the detected cantilever;
A surface position measuring method having:
検出したカンチレバーの熱振動スペクトルの面積が変化し始める位置を、前記探針と試料表面との接触位置として計測する、
請求項1記載の表面位置計測方法。The evaluation step includes
The position where the area of the thermal vibration spectrum of the detected cantilever starts to change is measured as the contact position between the probe and the sample surface.
The surface position measuring method according to claim 1.
探針を有するカンチレバーの変位信号を検出するステップと、
検出した変位信号をFFT処理して熱振動スペクトルを取得するステップと、
取得した熱振動スペクトルからカンチレバーの共振モード部分を抽出してカンチレバーの共振周波数周辺における熱振動スペクトルの面積を算出するステップと、を有し、
前記評価ステップは、
算出したカンチレバーの熱振動スペクトルの面積が変化し始める位置を、前記探針と試料表面との接触位置として計測する、
請求項2記載の表面位置計測方法。The detecting step includes
Detecting a displacement signal of a cantilever having a probe;
Obtaining a thermal vibration spectrum by subjecting the detected displacement signal to FFT processing;
Extracting the resonance mode part of the cantilever from the acquired thermal vibration spectrum and calculating the area of the thermal vibration spectrum around the resonance frequency of the cantilever,
The evaluation step includes
Measure the position where the calculated area of the thermal vibration spectrum of the cantilever begins to change as the contact position between the probe and the sample surface,
The surface position measuring method according to claim 2.
前記検出手段によって検出されたカンチレバーの熱振動スペクトルの面積の変化に基づいて計測される前記探針と試料表面との接触位置から、前記試料表面の位置を評価する評価手段と、
を有する表面位置計測装置。Detecting means for detecting an area of a thermal vibration spectrum of a cantilever having a probe;
Evaluation means for evaluating the position of the sample surface from the contact position between the probe and the sample surface measured based on the change in the area of the thermal vibration spectrum of the cantilever detected by the detection means;
A surface position measuring apparatus having
Priority Applications (1)
| Application Number | Priority Date | Filing Date | Title |
|---|---|---|---|
| JP2006550729A JP4876216B2 (en) | 2005-01-06 | 2005-12-22 | Surface position measuring method and surface position measuring apparatus |
Applications Claiming Priority (4)
| Application Number | Priority Date | Filing Date | Title |
|---|---|---|---|
| JP2005001538 | 2005-01-06 | ||
| JP2005001538 | 2005-01-06 | ||
| PCT/JP2005/023633 WO2006073068A1 (en) | 2005-01-06 | 2005-12-22 | Surface position measuring method and surface position measuring device |
| JP2006550729A JP4876216B2 (en) | 2005-01-06 | 2005-12-22 | Surface position measuring method and surface position measuring apparatus |
Publications (2)
| Publication Number | Publication Date |
|---|---|
| JPWO2006073068A1 JPWO2006073068A1 (en) | 2008-06-12 |
| JP4876216B2 true JP4876216B2 (en) | 2012-02-15 |
Family
ID=36647550
Family Applications (1)
| Application Number | Title | Priority Date | Filing Date |
|---|---|---|---|
| JP2006550729A Expired - Lifetime JP4876216B2 (en) | 2005-01-06 | 2005-12-22 | Surface position measuring method and surface position measuring apparatus |
Country Status (4)
| Country | Link |
|---|---|
| US (1) | US7617720B2 (en) |
| EP (1) | EP1845361A4 (en) |
| JP (1) | JP4876216B2 (en) |
| WO (1) | WO2006073068A1 (en) |
Families Citing this family (7)
| Publication number | Priority date | Publication date | Assignee | Title |
|---|---|---|---|---|
| JP4918427B2 (en) * | 2007-08-01 | 2012-04-18 | 株式会社ミツトヨ | Method and apparatus for detecting measurement position of resonance sensor |
| JP5439157B2 (en) * | 2009-12-22 | 2014-03-12 | 三菱重工業株式会社 | Gear measurement method |
| US9739799B2 (en) * | 2014-02-28 | 2017-08-22 | Bruker Nano, Inc. | Method and apparatus to compensate for deflection artifacts in an atomic force microscope |
| US9453857B2 (en) * | 2014-04-23 | 2016-09-27 | Oxford Instruments Asylum Research, Inc | AM/FM measurements using multiple frequency of atomic force microscopy |
| JP6287780B2 (en) * | 2014-11-25 | 2018-03-07 | 株式会社島津製作所 | Scanning probe microscope |
| WO2021020111A1 (en) * | 2019-07-30 | 2021-02-04 | 国立大学法人京都大学 | Measuring device, atomic force microscope, and measurement method |
| WO2022024999A1 (en) * | 2020-07-31 | 2022-02-03 | 学校法人福岡大学 | Atomic force microscope and distance control method |
Citations (1)
| Publication number | Priority date | Publication date | Assignee | Title |
|---|---|---|---|---|
| JPH10282128A (en) * | 1997-04-01 | 1998-10-23 | Shimadzu Corp | Scanning probe microscope |
Family Cites Families (3)
| Publication number | Priority date | Publication date | Assignee | Title |
|---|---|---|---|---|
| EP0754289B1 (en) * | 1995-02-07 | 2001-09-26 | International Business Machines Corporation | Measurement of AFM cantilever deflection with high frequency radiation and dopant profiler |
| US6779387B2 (en) * | 2001-08-21 | 2004-08-24 | Georgia Tech Research Corporation | Method and apparatus for the ultrasonic actuation of the cantilever of a probe-based instrument |
| US6694817B2 (en) * | 2001-08-21 | 2004-02-24 | Georgia Tech Research Corporation | Method and apparatus for the ultrasonic actuation of the cantilever of a probe-based instrument |
-
2005
- 2005-12-22 WO PCT/JP2005/023633 patent/WO2006073068A1/en not_active Ceased
- 2005-12-22 EP EP05819516A patent/EP1845361A4/en not_active Withdrawn
- 2005-12-22 US US11/794,761 patent/US7617720B2/en not_active Expired - Fee Related
- 2005-12-22 JP JP2006550729A patent/JP4876216B2/en not_active Expired - Lifetime
Patent Citations (1)
| Publication number | Priority date | Publication date | Assignee | Title |
|---|---|---|---|---|
| JPH10282128A (en) * | 1997-04-01 | 1998-10-23 | Shimadzu Corp | Scanning probe microscope |
Also Published As
| Publication number | Publication date |
|---|---|
| JPWO2006073068A1 (en) | 2008-06-12 |
| US7617720B2 (en) | 2009-11-17 |
| WO2006073068A1 (en) | 2006-07-13 |
| EP1845361A1 (en) | 2007-10-17 |
| US20080092640A1 (en) | 2008-04-24 |
| EP1845361A4 (en) | 2011-11-30 |
Similar Documents
| Publication | Publication Date | Title |
|---|---|---|
| US10520426B2 (en) | Peakforce photothermal-based detection of IR nanoabsorption | |
| US10444258B2 (en) | AM/FM measurements using multiple frequency atomic force microscopy | |
| US7584653B2 (en) | System for wide frequency dynamic nanomechanical analysis | |
| US6880386B1 (en) | Method and device for simultaneously determining the adhesion, friction, and other material properties of a sample surface | |
| KR102484671B1 (en) | Heterodyne atomic force microscopy apparatus, method and lithography system | |
| US8869311B2 (en) | Displacement detection mechanism and scanning probe microscope using the same | |
| Tararam et al. | Atomic force microscopy: A powerful tool for electrical characterization | |
| JP4876216B2 (en) | Surface position measuring method and surface position measuring apparatus | |
| US9921242B2 (en) | Automated atomic force microscope and the operation thereof | |
| Proksch et al. | Accurate vertical nanoelectromechanical measurements | |
| Georgakaki et al. | Calibration of tapping AFM cantilevers and uncertainty estimation: Comparison between different methods | |
| WO2007072706A1 (en) | Scan type probe microscope | |
| CN104950142A (en) | Method for measuring vibration characteristic of cantilever and device for measuring vibration characteristic of cantilever | |
| US20070012095A1 (en) | Scanning probe microscope | |
| JP7444017B2 (en) | scanning probe microscope | |
| Marinello et al. | Elastic-properties measurement at high temperatures through contact resonance atomic force microscopy | |
| Morris | Atomic force microscopy (AFM) and related tools for the imaging of foods and beverages on the nanoscale | |
| Brito et al. | AFMDAQ Visualizer: Software and guide to reconstruct and analyze images with raw external data acquisition from the atomic force microscopies | |
| Thorén | Calibration of AFM cantilevers of arbitrary shape | |
| JP2001289768A (en) | Method and apparatus for mapping physical property distribution of sample | |
| Palacio et al. | Calibration of Normal and Lateral Forces in Cantilevers Used in Atomic Force Microscopy | |
| JP2005083849A (en) | Optical apparatus and sample measuring method |
Legal Events
| Date | Code | Title | Description |
|---|---|---|---|
| A621 | Written request for application examination |
Free format text: JAPANESE INTERMEDIATE CODE: A621 Effective date: 20081014 |
|
| TRDD | Decision of grant or rejection written | ||
| A01 | Written decision to grant a patent or to grant a registration (utility model) |
Free format text: JAPANESE INTERMEDIATE CODE: A01 Effective date: 20111018 |
|
| A521 | Request for written amendment filed |
Free format text: JAPANESE INTERMEDIATE CODE: A821 Effective date: 20111104 |
|
| A01 | Written decision to grant a patent or to grant a registration (utility model) |
Free format text: JAPANESE INTERMEDIATE CODE: A01 |
|
| R150 | Certificate of patent or registration of utility model |
Free format text: JAPANESE INTERMEDIATE CODE: R150 Ref document number: 4876216 Country of ref document: JP Free format text: JAPANESE INTERMEDIATE CODE: R150 |
|
| EXPY | Cancellation because of completion of term |