JP4800723B2 - Elevator group management system and control method thereof - Google Patents
Elevator group management system and control method thereof Download PDFInfo
- Publication number
- JP4800723B2 JP4800723B2 JP2005280024A JP2005280024A JP4800723B2 JP 4800723 B2 JP4800723 B2 JP 4800723B2 JP 2005280024 A JP2005280024 A JP 2005280024A JP 2005280024 A JP2005280024 A JP 2005280024A JP 4800723 B2 JP4800723 B2 JP 4800723B2
- Authority
- JP
- Japan
- Prior art keywords
- time
- car
- predicted
- value
- floor
- Prior art date
- Legal status (The legal status is an assumption and is not a legal conclusion. Google has not performed a legal analysis and makes no representation as to the accuracy of the status listed.)
- Active
Links
Images


Description
本発明は,エレベータの群管理システム及びその制御方法に係り、特に、システムとしての性能評価や、ホール呼びに対するエレベータの割当て制御を改善したエレベータの群管理システム及びその制御方法に関する。 The present invention relates to an elevator group management system and a control method thereof, and more particularly, to an elevator group management system and a control method therefor in which performance evaluation as a system and elevator assignment control for hall calls are improved.
エレベータ群管理システムは、複数のエレベータかごを1つのグループとして扱うことで、利用者に対して効率的な運行サービスを提供する。具体的には、複数のエレベータかご(通常3台から8台)を1つのグループとして管理し、ある階床に新規のホール呼びが発生した場合に、このグループの中から最適なかごを1つ選択して、そのかごにホール呼びを割当てている。 The elevator group management system provides a user with an efficient operation service by handling a plurality of elevator cars as one group. Specifically, multiple elevator cars (usually 3 to 8) are managed as a group, and when a new hall call occurs on a certain floor, one optimal car is selected from this group. Select and assign a hall call to the car.
現行の群管理システムでは、予測待ち時間に基づいた評価関数による割当て制御を基本にしている。例えば、新たにホール呼びが発生した場合に、各かごが受け持っているホール呼びの予測待ち時間が最小となるかご、最大待ち時間が最小となるかご、又は平均待ち時間が最小となるかごに、そのホール呼びを割当てる。この予測待ち時間による割当て制御は、各エレベータメーカの群管理制御で採用されている基本方式であるが、次の2点の課題がある。 The current group management system is based on allocation control using an evaluation function based on the predicted waiting time. For example, when a new hall call occurs, the car that has the smallest waiting time for the hall call that each car is responsible for, the car that has the smallest maximum waiting time, or the car that has the smallest average waiting time, Assign the hall call. The allocation control based on the predicted waiting time is a basic method adopted in the group management control of each elevator maker, but has the following two problems.
1)発生済みのホール呼びに対しての最適なかご割当てであり、将来発生するホール呼びの影響は、必ずしも十分には考慮されていない。 1) The optimal car allocation for a hall call that has already been generated, and the influence of the hall call that will be generated in the future is not necessarily fully considered.
2)予測待ち時間を指標にして、かごに割当てているため、各かごの位置関係が考慮されていない。 2) Since the estimated waiting time is used as an index and assigned to the car, the positional relationship of each car is not considered.
このような予測待ち時間に基づいた割当て方式の課題を解決するために、これまで様々な制御方式が提案されてきた。その基本的考え方は、各エレベータかごを時間的に等間隔な配置で動かそうという制御に集約できる。仮に、各エレベータかごの配置が均等ではない場合、つまり、ある2つのかご間で時間的間隔が長い場合、そのかご間の階に新たなホール呼びが発生すると、その呼びは待ち時間が長くなる可能性が高い。各かごを時間的に等間隔に配置できれば、長待ちを抑制することが可能になることは古くから知られており、時間的等間隔配置を目的とした従来の制御方式として以下の技術がある。 In order to solve the problem of the allocation method based on the predicted waiting time, various control methods have been proposed so far. The basic idea can be summarized in the control to move each elevator car at regular intervals. If the elevator cars are not evenly arranged, that is, if the time interval between two cars is long, and if a new hall call occurs on the floor between the cars, the call will have a longer waiting time. Probability is high. It has long been known that long waiting can be suppressed if each car can be arranged at regular intervals in time, and there are the following techniques as a conventional control method for the purpose of arranging equal intervals in time. .
特許文献1「時間的等間隔状態を指標に取り込んだ割当て評価制御」には、先の時点での各かごの配置を予測して、その時点での各かごの時間的間隔を予測している。この予測かご間隔から割当て制限評価値を演算して、かごが一部の階床域に偏って割当てられることがないように割当てを制御する。この結果、各かごの間隔が時間的等間隔に近づくことを狙いとしている。
また、非特許文献1「動的計画法を用いた到着予測時間演算法」には、予測待ち時間を正確に求めるため、未サービスの乗り場呼びによるかご呼び発生階を動的計画法を用いて推定する手法を開示している。
Further, in
上記特許文献1では、将来の各かごの配置を予測して、その時点での各かごの時間的間隔から割当てを決めることがポイントとなる。しかし、この方法では、将来のある時点(複数の場合もある)の空間的配置を個々に評価しているに過ぎず、評価の内容を分析するための情報が不足している。具体的には、割当て評価の原因を分析する場合、ある時点でのかごの空間的配置の情報を個別に分析せねばならず、マクロな視点での分析が難しいという課題がある。また、個々に階単位で位置を予測しているため、予測精度が良くないという課題もある。特に、階間の高さが長いビル場合は、その予測精度は制御性能に影響する。
In the above-mentioned
また、非特許文献1は、到着予測時間の推定法を改善し、先に述べた予測待ち時間の適正化を狙いとしているもので、各かごの配置の予測とは関係ない。
一般に、エレベータ群管理システムにおける、システムとしての性能評価は、平均待ち時間が短く、長待ち呼びの発生確率が低いことなどが挙げられる。しかし、ビル内の様々な交通需要の変化の下において、どのような理由によって制御性能に差が生じるのか等、詳しい評価を下すことが難しいことも多い。 In general, performance evaluation as a system in an elevator group management system includes a short average waiting time and a low occurrence probability of long waiting calls. However, it is often difficult to make a detailed evaluation, such as what causes the difference in control performance under various traffic demand changes in the building.
本発明の目的のひとつは、エレベータ群管理システムにおける、システムとしての制御性能の評価を支援するシステムを提供することである。 One of the objects of the present invention is to provide a system that supports evaluation of control performance as a system in an elevator group management system.
本発明の他の目的は、前述した従来技術の問題を解決すべく、各かごを時間的に等間隔な配置に制御する割当て評価において、よりマクロな視点で割当て評価の要因を分析することができるシステムを提供することである。 Another object of the present invention is to analyze the cause of allocation evaluation from a more macro viewpoint in allocation evaluation for controlling each car to be arranged at equal intervals in time in order to solve the above-mentioned problems of the prior art. It is to provide a system that can.
さらに本発明の他の目的は、各かごの配置について、より詳細な情報を分析でき、かつ割当て時にもその情報を活用できるシステムを提供することである。 It is still another object of the present invention to provide a system that can analyze more detailed information about the arrangement of each car and can utilize the information at the time of assignment.
本発明の望ましい一実施態様においては、現時点から近い将来までの所定期間における時間軸上での、各エレベータの予測位置の移動を示す予測軌跡を作成する予測軌跡作成手段を備えたことを特徴としている。 In a preferred embodiment of the present invention, a prediction trajectory creating means for creating a predicted trajectory indicating movement of a predicted position of each elevator on a time axis in a predetermined period from the present time to the near future is provided. Yes.
また、本発明の望ましい一実施態様においては、現時点から近い将来までの所定期間における時間軸上での、各エレベータの予測位置の移動を示す予測軌跡を作成する予測軌跡作成手段と、各エレベータ毎の前記予測軌跡を表示する予測軌跡表示手段を備えたことを特徴としている。 In a preferred embodiment of the present invention, a predicted trajectory creating means for creating a predicted trajectory indicating movement of a predicted position of each elevator on a time axis in a predetermined period from the present time to the near future, and for each elevator The present invention is characterized in that a predicted trajectory display means for displaying the predicted trajectory is provided.
さらに、本発明の望ましい一実施態様においては、将来の所定期間の時間軸に対する各エレベータの予測位置を示す予測軌跡を作成する予測軌跡作成手段と、各エレベータの予測軌跡間の位置関係に関する評価値を算出する評価値算出手段と、この評価値に基づいて、発生したホール呼びにエレベータを割当てる割当て手段を備えたことを特徴としている。 Furthermore, in a preferred embodiment of the present invention, a predicted trajectory creating means for creating a predicted trajectory indicating a predicted position of each elevator with respect to a time axis for a predetermined period in the future, and an evaluation value relating to a positional relationship between the predicted trajectories of each elevator And an assigning means for assigning an elevator to the generated hall call based on the evaluation value.
本発明の望ましい実施態様によるエレベータ群管理システムによれば、時間軸上での各エレベータの予測軌跡から、エレベータ群管理制御の適正な評価が可能となる。また、それにより、必要な改善に対する示唆を与える等、評価や改善に対する技術支援を得ることができる。例えば、予測誤差が大きい場合、それが交通需要の推定の誤りによるものかどうかを予測軌跡の傾きから判定することができる等である。 According to the elevator group management system according to the preferred embodiment of the present invention, it is possible to appropriately evaluate the elevator group management control from the predicted trajectory of each elevator on the time axis. In addition, it is possible to obtain technical support for evaluation and improvement, such as giving suggestions for necessary improvements. For example, if the prediction error is large, it can be determined from the inclination of the prediction trajectory whether it is due to an error in estimating the traffic demand.
本発明によるその他の目的と特徴は、以下に述べる実施例の説明によって明らかにする。 Other objects and features of the present invention will become apparent from the following description of embodiments.
以下、本発明の実施の形態を、図面を参照して説明する。 Hereinafter, embodiments of the present invention will be described with reference to the drawings.
はじめに、本発明におけるエレベータ群管理システムの制御の考え方を、図1を用いて説明する。図1(a)、(b)、(c)は、本発明によるエレベータ群管理システムの制御イメージ図である。まず、図1(a)から説明する。図1(a)は、新規ホール呼びが発生した直後で、これからこのホール呼びに応答するかごを割当てようという状況を表している。この図1(a)は、エレベータの運行線図を表しており、横軸が時間、縦軸がビル上での階床位置を表している。時間軸は、現時点を始点にして、将来の時間を表している。つまり、この図は、将来におけるエレベータの予測運行線図を表している。エレベータは、1号機と2号機の2台のかごで構成される。図1(a)より、現時点で1号機は3階付近にあり、上方向に移動している。2号機は5階付近にあり、上方向に移動している。それぞれのかごの予測軌跡は図上の線で表されるようになる。この2本の予測軌跡は互いに接近しており、だんご運転状態にあることが分かる。このような状況で、8階上方向に新規ホール呼びが発生した場合を考える。
First, the concept of control of the elevator group management system in the present invention will be described with reference to FIG. 1A, 1B, and 1C are control image diagrams of an elevator group management system according to the present invention. First, FIG. 1A will be described. FIG. 1A shows a situation in which a car responding to the hall call is assigned immediately after a new hall call is generated. FIG. 1A shows an elevator operation diagram, where the horizontal axis represents time and the vertical axis represents the floor position on the building. The time axis represents the future time starting from the current point. That is, this figure represents a predicted operation diagram of the elevator in the future. The elevator is composed of two cars,
図1(b)は、新規に発生したホール呼びを1号機に仮に割当てた場合の各かごの予測軌跡を表している。1号機の予測軌跡を見ると、新規ホール呼びにサービスするために、8階上方向で停止している。その結果、その後の1号機と2号機の予測軌跡は、それ以前の図1(a)の状態よりも間隔が広がっている。この予測軌跡の間隔を、現在から所定時間経過後の位置関係評価時刻trefで評価すると、図1(a)に比べて、図1(b)は間隔が延びたことが明確に分かる。各かご間の位置関係の代表例は、間隔であり、以下、前記位置関係評価時刻trefを、単に間隔評価時刻trefと呼ぶ。
FIG. 1B shows the predicted trajectory of each car when a newly generated hall call is temporarily assigned to the first car. Looking at the predicted trajectory of
図1(c)は、新規に発生したホール呼びを2号機に仮に割当てた場合の各かごの予測軌跡を表している。2号機の予測軌跡を見ると、新規ホール呼びにサービスするために、8階上方向で停止している。その結果、その後の1号機と2号機の予測軌跡は、それ以前の図1(a)の状態よりも間隔が縮まっており、完全なだんご運転状態となっている。
FIG. 1C shows a predicted trajectory of each car when a newly generated hall call is temporarily assigned to the second car. Looking at the predicted trajectory of
1号機に仮割当てした場合の図1(b)と2号機に仮割当てした場合の図1(c)について、間隔評価時刻trefにおける各かご間の間隔を比較すると、1号機に割当てた方が等間隔状態に近づくことが分かる。従って、等間隔状態に近づけるためには、1号機に割当てた方が良いと評価できる。このような一連の評価方法が、本発明の一実施例による群管理制御の概要である。このような制御の結果、常に適切な間隔を維持することができ、不要な長待ちを低減することが可能となる。このためには、その時点から所定時間だけ、各エレベータの予測軌跡を求める必要がある。図1は、この必要に応じた横軸の長さで図示しており、所定時間の長さは、その時点のエレベータの平均1周時間より長い時間に設定している。
Comparing the intervals between the cages at the interval evaluation time tref with respect to FIG. 1 (b) when provisionally assigned to
図2は、本発明の一実施例によるエレベータ群管理システム全体の制御ブロック図である。N台のエレベータかご32A、32B、32C、…の運転を各エレベータの号機制御装置31A、31B、31C、…が制御しており、これら各号機制御装置に対して群管理制御部1が統括して制御を行っている。
FIG. 2 is a control block diagram of the entire elevator group management system according to one embodiment of the present invention. The operation of the
群管理制御部1では次のような処理がなされている。まず、各階のホール呼び釦(41A、41B)の情報とN台の各エレベータ号機装置31A、31B、31C、…の情報が入力情報蓄積部1に蓄えられる。ここで新規のホール呼びが発生した場合、入力情報蓄積部1内の情報を用いて、待ち時間評価値演算部3では、既に発生しているホール呼びも含めた各ホール呼びに対する予測待ち時間が計算され、これを基に待ち時間評価値Wが計算される。また、間隔評価値演算部4では、図1で説明したように、各エレベータかごの将来の位置関係が予測され、これを基に間隔評価値Eが計算される。重み係数設定部8ではその時点の状況に対応した重み係数WTが設定される。本実施例での特徴は、この重み係数の設定法にあり、その詳細は後ほど説明する。総合評価値演算部6では、待ち時間評価値、間隔評価値、重み係数より、待ち時間評価値と間隔評価値を重み付け加算した総合評価値Φが計算される。総合評価値Φは例えば次のような式で表される。
The group
Φ=W+WT・E…………(2)
この総合評価値を、各かごを新規ホール呼びに仮割当てした場合に対して計算して、割当てエレベータ決定部7では、待ち時間とかごの等間隔性の点で最も評価の良いエレベータかごが割当てるかごとして決定される。
Φ = W + WT · E ………… (2)
This total evaluation value is calculated for the case where each car is provisionally assigned to a new hall call, and the assigned
ここで、本実施例の特徴である重み係数設定法についてその要点を説明する。本実施例による重み係数の設定は大きく2つの方法で構成される。第1の方法は現在の交通流を判定して、その交通流を基に群管理制御のシミュレーションを繰り返し実行して、最も適切な重み係数の値を探索で求める方法である。第2の方法はホール呼び発生数を予測して、これを基に重み係数の設定範囲と設定の初期値を求める方法である。特に後者(第2の方法)が本実施例のポイントになる。 Here, the main points of the weighting coefficient setting method, which is a feature of the present embodiment, will be described. The setting of the weighting factor according to the present embodiment is mainly constituted by two methods. The first method is a method in which the current traffic flow is determined, a group management control simulation is repeatedly executed based on the traffic flow, and the most appropriate weight coefficient value is obtained by searching. The second method is a method of predicting the number of hall calls and obtaining the setting range of the weighting coefficient and the initial value of the setting based on this. In particular, the latter (second method) is the point of this embodiment.
以下、それぞれを具体的に説明する。まず、第1の方法では、入力情報蓄積部2の情報より、交通流判定部20にて現在の交通流を判定し、その交通流に最も適した重み係数の値を重み係数最適解探索部21にて探索する。ここで、重み係数の最適解探索は、その時の交通流条件で群管理制御のシミュレーションを繰り返し実行することによって実施される。この群管理制御のシミュレーションはシミュレーション部22において実行される。重み係数の最適解探索は、オンラインで実行される場合もあればオフライン(例えば夜間など)で実行される場合もある。オフラインで実行される場合は、あらかじめそのビルの主要な交通流(以下、交通流モードと呼ぶ)が抽出されて、この交通流モードに対しての群管理制御シミュレーションをオフラインで実行する形態になる。
Each will be specifically described below. First, in the first method, the traffic
次に、第2の方法では、入力情報蓄積部2の入力情報を基にホール呼び発生数演算部10において、ホール呼び発生数もしくはホール呼び発生数に関係する量が計算される。そして、このホール呼び発生数を基に重み係数の初期値と範囲(上限値と下限値)が、重み係数初期値演算部12と重み係数範囲演算部11で計算される。
Next, in the second method, the hall call occurrence
算出された重み係数の初期値に対しては、重み係数設定部8に送られる流れと重み係数最適解探索部21に送られる流れの2通りの流れがある。重み係数最適解探索部21に送られた初期値については、探索の初期値(初めての交通流に対して探索する場合の初期値)として使用される。重み係数設定部8に送られた初期値は、その時点で発生している交通流に対して重み係数の最適解探索が収束していない場合やその時点で発生している交通流が全く初めての交通流の場合に、実際に使用する重み係数として設定される。
For the calculated initial value of the weighting factor, there are two types of flows: a flow sent to the weighting
図3は、図2で示した本発明の一実施例によるエレベータ群管理システムの制御処理フロー図である。以下、図3を用いてその流れを説明する。 FIG. 3 is a control processing flowchart of the elevator group management system according to the embodiment of the present invention shown in FIG. Hereinafter, the flow will be described with reference to FIG.
まず、重み係数最適解探索を実行するかどうかを判定する(ST001)。これは、オフラインのシミュレーションで重み係数探索をする場合の処理になる。例えば、マイコンやパソコンのような計算処理装置の負荷の状態、日中か夜間かのような時刻情報を基にして、重み係数最適解探索を実行するかどうかを判定する。実行すると判定された場合には、あらかじめ抽出された交通流モードに対して、重み係数の最適解を探索する(ST002)。この時の探索方法には、重み係数が取り得る全ての値(実際にはある範囲の中にある全ての値)について探索する方法や、分枝限定法、山下り法、ニューラルネットによる探索や遺伝アルゴリズムによる探索を利用する方法などを用いる。重み係数最適解探索の実行後(これは最適解が求まらず途中で中断する場合も含む)や探索を実行しない場合は、入力情報蓄積部(図1の2)より入力情報を入力する(ST003)。入力情報を取得後、かご割当て処理が発生したかどうかをチェックして(ST004)、割当て処理が発生していない場合はST001の処理に戻り、割当て処理が発生した場合はその次の処理へ進む。 First, it is determined whether or not a weight coefficient optimum solution search is executed (ST001). This is a process in the case of performing a weighting factor search in an offline simulation. For example, it is determined whether or not the weighting factor optimum solution search is to be executed based on the load state of a calculation processing device such as a microcomputer or a personal computer and time information such as daytime or nighttime. If it is determined to be executed, the optimum solution of the weighting factor is searched for the previously extracted traffic flow mode (ST002). The search method at this time includes a search method for all possible values of the weighting factor (actually all values within a certain range), a branch and bound method, a hill descending method, a search using a neural network, A method using a search by a genetic algorithm is used. After the execution of the weight coefficient optimum solution search (this includes the case where the optimum solution is not found and is interrupted in the middle) or when the search is not executed, input information is input from the input information storage unit (2 in FIG. 1). (ST003). After obtaining the input information, it is checked whether or not a car assignment process has occurred (ST004). If no assignment process has occurred, the process returns to ST001. If an assignment process has occurred, the process proceeds to the next process. .
かご割当て処理が発生している場合は、割当て対象となっているホール呼び(通常は新規に発生したホール呼び)に対して、各エレベータかごを仮に割当ててその場合の評価値を算出する仮割当てかごループ処理(ST005)を実行する。これは仮割当てかごを Ka号機として、Kaを1から順にN(群管理エレベータの台数をN台とする)まで変える処理を実行する。 When the car assignment process has occurred, the temporary assignment that temporarily assigns each elevator car to the assigned hall call (usually newly generated hall call) and calculates the evaluation value in that case Car cage processing (ST005) is executed. This executes a process of changing the Ka from 1 to N (the number of group management elevators is N) in order from the temporarily assigned car No. Ka.
仮割当てかごKa号機に対して、まず予測軌跡を計算する(ST006)。この仮割当てかごの予測軌跡は前述の図1(b)の1号機の予測軌跡に対応する。次に、仮割当てかご以外のかごK号機(K≠Kaの各号機)に対して予測軌跡を計算する(ST007)。この軌跡は、図1(b)の2号機の予測軌跡に対応する。そして、間隔評価時刻trefを計算して(ST008)(図1(b)にtrefの例が示されている)、tref時点における各かごの予測間隔値Bm(m=1、2、…、N)を計算する(ST009)。予測間隔値の算出法は後述するが、trefによる各かごの予測位置を基に各位置間の時間的距離又は空間的距離から予測間隔を算出できる。各かごの予測間隔値が算出されたならば、これを基に間隔評価値が算出される(ST010)。これは、仮割当てかごをKa号機にした場合の間隔評価値のため、E(Ka)と表すことにする。仮割当てかごループ処理を繰り返すことによって、E(Ka=1)、E(Ka=2)…と計算されていく。
First, a predicted trajectory is calculated for the temporarily assigned car No. Ka (ST006). The predicted trajectory of the temporarily allocated car corresponds to the predicted trajectory of the first car in FIG. Next, a predicted trajectory is calculated for a car K other than the temporarily assigned car (each car with K ≠ Ka) (ST007). This trajectory corresponds to the predicted trajectory of
間隔評価値が算出されると、次に、仮割当てかごがKa号機とした場合の待ち時間評価値W(Ka)が計算される(ST011)。この待ち時間評価値の決定法は、例えば、発生したホール呼びにKa号機を割当てた場合のその呼びに対する待ち時間で設定する方法やKa号機が受け持っているホール呼びの中で最大の待ち時間に設定する方法がある。さらに、Ka号機を含めた全ての号機が受け持っているホール呼びの平均待ち時間に設定する方法、Ka号機を含めた全ての号機が受け持っているホール呼びの待ち時間の2乗和に設定する方法などが挙げられる。 Once the interval evaluation value is calculated, the waiting time evaluation value W (Ka) when the temporary assigned car is Ka No. is then calculated (ST011). The waiting time evaluation value is determined by, for example, a method of setting the waiting time for the call when the assigned hall call is assigned to the generated hall call, or the maximum waiting time among hall calls held by the Ka No. There is a way to set. Furthermore, a method for setting the average waiting time for hall calls held by all units including the Ka unit, and a method for setting a square sum of the waiting times for hall calls held by all units including the Ka unit. Etc.
間隔評価値E(Ka)、待ち時間評価値W(Ka)が算出された後、重み係数WTが算出される(ST012)。重み係数の算出法については概略を図2にて説明しており、詳細については後ほど改めて説明する。 After the interval evaluation value E (Ka) and the waiting time evaluation value W (Ka) are calculated, the weighting coefficient WT is calculated (ST012). The method for calculating the weighting factor is outlined in FIG. 2, and the details will be described later.
さて、間隔評価値、待ち時間評価値、重み係数を基に、割当てを決定する指標となる総合評価値が計算される(ST013)。総合評価値は次式のように表される。 Now, based on the interval evaluation value, the waiting time evaluation value, and the weighting factor, a comprehensive evaluation value serving as an index for determining allocation is calculated (ST013). The overall evaluation value is expressed as follows.
Φ(Ka)=FT(W(Ka)、E(Ka)、WT)………(3)
ここで、FTは関数を表している。より具体的には、例えば次式のような線形和の式で表される。
Φ (Ka) = FT (W (Ka), E (Ka), WT) (3)
Here, FT represents a function. More specifically, it is expressed by a linear sum expression such as the following expression.
Φ(Ka)=W(Ka)+WT・E(Ka)…………(4)
以上に述べたST005からST013までの一連の処理を仮割当てかごループが終了するまで(全てのかごに仮割当て処理を実施するまで)で実行する(ST014)。終了していない場合は、仮割当てかごを次の号機に更新して(ST015)、更新した仮割当てかごKa号機に対してST006からの処理を実行する。仮割当てかごループが終了した場合には、総合評価値Φ(Ka=1)、Φ(Ka=2)、…、Φ(Ka=N)を比較して最も評価値の良いかごに割当てエレベータを決定する(ST016)。割当て決定後は、最初の処理ST001に戻り、前述の処理を繰り返して処理を実行する。
Φ (Ka) = W (Ka) + WT · E (Ka) ………… (4)
The series of processes from ST005 to ST013 described above are executed until the temporary allocation car loop is completed (until the temporary allocation process is performed on all cars) (ST014). If not, the temporary allocation car is updated to the next car (ST015), and the process from ST006 is executed on the updated temporary allocation car Ka. When the temporary assigned car loop is completed, the overall evaluation values Φ (Ka = 1), Φ (Ka = 2),..., Φ (Ka = N) are compared, and the assigned elevator is assigned to the car having the best evaluation value. Determine (ST016). After the assignment is determined, the process returns to the first process ST001, and the above process is repeated to execute the process.
以下、図4を用いて、本発明による重み係数設定法を説明する。 Hereinafter, the weighting coefficient setting method according to the present invention will be described with reference to FIG.
図4は、本発明の一実施例による重み係数設定方法を説明するグラフである。横軸がエレベータ1周当たりのホール呼び発生数を表し、縦軸が重み係数を表したグラフである。ここで、エレベータ1周当たりのホール呼び数とは、群管理されている各エレベータに対して、1周(例えば上方向の最下階から下方向の最下階まで)する間に発生するホール呼び発生数の平均値を表している。混雑時には1周当たりのホール呼び数は大きく、閑散時には小さい値になる。 FIG. 4 is a graph illustrating a weighting factor setting method according to an embodiment of the present invention. The horizontal axis represents the number of hall calls generated per elevator lap, and the vertical axis represents a weighting coefficient. Here, the number of hall calls per elevator lap is the number of halls generated during one lap (for example, from the lowermost floor in the upward direction to the lowermost floor in the downward direction) for each group-managed elevator. Represents the average number of calls. The number of hall calls per lap is large when it is busy, and it is small when it is quiet.
図4のグラフには、3つの関数の入出力特性を表す線を描いているが、それぞれ、線F01が重み係数の適切な初期値WT0を決める関数、線F02が重み係数の適切な上限値WT上限を決める関数、線F03が重み係数の適切な下限値WT下限を決める関数である。重み係数の適切な初期値を決める関数(線F01)は、図2の重み係数初期値演算部12が用いられ、重み係数の適切な上限値を決める関数(線F02)、適切な下限値を決める関数(線F03)は、図2の重み係数範囲演算部11で用いられる。
In the graph of FIG. 4, lines representing the input / output characteristics of the three functions are drawn. The line F01 is a function for determining an appropriate initial value WT 0 of the weighting factor, and the line F02 is an appropriate upper limit for the weighting factor. A function that determines the upper limit of the value WT, and a line F03 is a function that determines an appropriate lower limit WT lower limit of the weighting coefficient. A function (line F01) for determining an appropriate initial value of the weighting coefficient is used by the weighting coefficient initial
これら重み係数を決める3つの関数の大きな特徴は、次のが4つが挙げられる。 The major features of the three functions that determine these weighting factors are as follows.
1)ホール呼び発生数によって適切な重み係数の初期値、上限値、下限値が即座に求められること、
2)入力変数である1周当たりのホール呼び発生数の連続的な変化によって、出力である重み係数も連続的に値が定まること、
3)入力変数がスカラー値(1変数)であること、及び
4)入力変数が実数として連続的に値を取り得ること。
1) The appropriate initial value, upper limit value, and lower limit value of the weighting factor can be obtained immediately according to the number of hall calls.
2) The continuous change in the number of hall calls per lap, which is an input variable, causes the weighting coefficient, which is an output, to be continuously determined.
3) The input variable is a scalar value (one variable), and 4) The input variable can take a continuous value as a real number.
すなわち、重みの値を、入力の変化に対して連続的に出力値が変わる関数に基づいて算出するのである。言い換えると、重みの値を、入力が実数でかつ連続的に値が変わる関数に基づいて算出している。この特徴による効果については、他の設定法(図6、図7)と比較して、図8によって後述する。 That is, the weight value is calculated based on a function whose output value changes continuously with respect to a change in input. In other words, the weight value is calculated based on a function whose input is a real number and whose value changes continuously. The effect of this feature will be described later with reference to FIG. 8 in comparison with other setting methods (FIGS. 6 and 7).
図4のグラフに記されているように、例えば、1周当たりのホール呼び数がNA個の場合、重み係数の初期値はWT0=F0(NA)となり、上限値と下限値はそれぞれWT上限=F上限(NA)、WT下限=F下限(NA)となる。交通需要の変化によってNAがどのように変化しても、即座に、WT0、WT上限、WT下限を求めることができる。これが大きな特徴となる。また、各関数は縦軸のゼロ値と交わる横軸の値から、その横軸より小さい値に対しては、縦軸の値は常にゼロとなっている。 As shown in the graph of FIG. 4, for example, when the number of hall calls per lap is NA, the initial value of the weighting coefficient is WT 0 = F 0 (NA), and the upper limit value and the lower limit value are respectively WT upper limit = F upper limit (NA), WT lower limit = F lower limit (NA). Regardless of how the NA changes due to a change in traffic demand, WT 0 , the WT upper limit , and the WT lower limit can be obtained immediately. This is a major feature. Each function has a value on the vertical axis that is always zero for a value smaller than the horizontal axis from a value on the horizontal axis that intersects the zero value on the vertical axis.
尚、図4のグラフでは、横軸が1周当たりのホール呼び発生数の例を示したが、これに限らずホール呼び数発生数に基づく値(例えば、所定時間でのホール呼び発生数など)でも同様の効果を得ることができる。さらに、ホール呼び発生数に限らず、交通需要に関係するスカラー値の指標でも同様の効果を得ることができる。例えば、利用人数に基づく値、ホール呼び発生数とかご呼び発生数の合計値に基づく値、平均待ち時間等でも同様の効果を得ることができる。 In the graph of FIG. 4, the horizontal axis shows an example of the number of hall calls generated per lap. However, the present invention is not limited to this, and a value based on the number of hall calls generated (for example, the number of hall calls generated in a predetermined time) ) Can achieve the same effect. Furthermore, the same effect can be obtained not only by the number of hall calls generated but also by a scalar value index related to traffic demand. For example, the same effect can be obtained with a value based on the number of users, a value based on the total number of hall calls and car calls, an average waiting time, and the like.
エレベータ1周当たりのホール呼び発生数を入力とするによって、適切な重み係数を図4のような関数によって求めることができる理由を以下に説明する。間隔評価値(図2で既に説明)はかご間の時間的間隔を評価した指標であり、このかご間の時間的間隔は将来発生するホール呼びに対する最大待ち時間に相当している。従って、間隔評価値の重要性は将来発生するホール呼びの数と強い関係があることになる。例えば、将来発生するホール呼びの数が多いほど、できるだけ時間的に等間隔にした方がよく、間隔評価値はより強く作用させる方がよい。ここで、将来発生するホール呼びの数は、その時点もしくはその先の時点における1周当たりのホール呼び発生数と強い相関性があると考えられる。従って、1周当たりのホール呼び発生数と適切な重み係数値との間にはある関係が成り立ち、これを図4のような関数として表すことによって、エレベータ1周当たりのホール呼び発生数で適切な重み係数(実際には適切な初期値や範囲)を定めることができる。 The reason why an appropriate weighting factor can be obtained by a function as shown in FIG. 4 by using the number of hall calls generated per elevator lap as an input will be described below. The interval evaluation value (already described with reference to FIG. 2) is an index for evaluating the time interval between the cars, and the time interval between the cars corresponds to the maximum waiting time for a hall call that will occur in the future. Therefore, the importance of the interval evaluation value has a strong relationship with the number of hall calls to be generated in the future. For example, as the number of hall calls to be generated in the future increases, it is better to make the intervals as equal as possible in time, and it is better to make the interval evaluation value act stronger. Here, the number of hall calls to be generated in the future is considered to have a strong correlation with the number of hall calls generated per round at that time or at a later time. Therefore, there is a relationship between the number of hall calls generated per lap and an appropriate weighting factor value. By expressing this as a function as shown in FIG. 4, the number of hall calls generated per elevator lap is appropriate. Weighting factors (in practice, appropriate initial values and ranges) can be determined.
図5は、本発明の一実施例による重み係数の最適解探索法のイメージ図である。図において、横軸は重み係数の値を表し、縦軸は群管理制御のシミュレーションを実行した結果の平均待ち時間を表している。横軸の重み係数WTの各値に対して、図2に示した本発明の群管理制御をシミュレーションした場合の平均待ち時間の特性が曲線901によって表されている。シミュレーションの繰返しによる重み係数の最適解探索の場合、又は図2に示したシミュレーションによる重み係数最適解探索(図2の符号20、21、22の部分)の場合は、この特性曲線901の任意の場所が初期値(始点)となる。このため、最適解にたどり着くまでに、ある程度の時間を要する。特に、初めて表れた交通流に対しては、初期値(始点)をどこに定めるかによって、初期に表れる性能(平均待ち時間)は大きく変わる可能性がある。また、探索の過渡期においては、シミュレーション回数が少ない(十分でない)ため、かえって悪い方向に探索してしまう可能性もある。そこで、本実施例では、図4で示した連続関数を用いることで、重み係数の適切な初期値902をそのときのホール呼び発生数によって即座に決めることができ、同様に適切な上限値903と下限値904も即座に決めることができる。これらの働きが、図2の符号10、11、12、及び8で示す機能要素によって実現されている。さらに、適切な初期値と範囲を定めた後は、初期値を基に範囲内で最適解探索がされるため、速やかにかつ安定して最適解を求めることができる。
FIG. 5 is an image diagram of an optimum solution search method for weighting factors according to an embodiment of the present invention. In the figure, the horizontal axis represents the value of the weighting coefficient, and the vertical axis represents the average waiting time as a result of executing the group management control simulation. A characteristic of the average waiting time when the group management control of the present invention shown in FIG. 2 is simulated for each value of the weighting coefficient WT on the horizontal axis is represented by a
尚、初期値WT0や上限値WT上限、下限値WT下限は、ホール呼び発生数に対応して値が決まるため、その時点の交通需要状態に応じて、これらの値も可変に調整されるようになっている。 Note that the initial value WT 0 , the upper limit value WT upper limit , and the lower limit value WT lower limit are determined according to the number of hall calls, so these values are also variably adjusted according to the traffic demand state at that time. It is like that.
図4に示したようなホール呼び発生数の関数によって重み係数を設定する方法が何故優れているか、以下、交通流を入力してシミュレーションの繰り返しによって設定する方法との対比で説明する。まず、その前段として、図6により交通流の概要について説明し、図7により入力を交通流で扱う場合の重み係数設定法の例を説明する。 The reason why the method of setting the weighting coefficient by the function of the number of hall calls as shown in FIG. 4 is superior will be described below in comparison with the method of inputting the traffic flow and setting it by repeating the simulation. First, as the previous stage, an outline of the traffic flow will be described with reference to FIG. 6, and an example of a weighting coefficient setting method in the case where the input is handled with the traffic flow will be described with reference to FIG.
図6は、6階床のビルにおける交通流に対する重み付け手法の一例図である。図6の一番左にある表は、交通流を表すOD(Origin-Destination)行列を表している。このOD行列は、列方向(横方向)を乗り階(Origin=出発地の意味)、行方向(縦方向)を降り階(Destination=目的地の意味)で表しており、各行列の要素はその行・列の要素に対応する移動人数(所定時間での移動人数)を表している。例えば、乗り階が2階、降り階が5階の移動人数は、図より3人になる。また、6階床のビルのため、6×6の行列になる。交通流とは各階での移動人数を表した総体であり、このようなOD行列によって表すことができる(OD行列は道路を対象にした交通解析で使用されている)。 FIG. 6 is an example of a weighting method for traffic flow in a 6-floor building. The table on the left side of FIG. 6 represents an OD (Origin-Destination) matrix representing traffic flow. In this OD matrix, the column direction (horizontal direction) is represented by the ride floor (Origin = meaning of the departure place) and the row direction (vertical direction) is represented by the descending floor (Destination = meaning of the destination). It represents the number of people (the number of people who moved in a predetermined time) corresponding to the row / column elements. For example, the number of people on the 2nd floor and the 5th floor is 3 people from the figure. Moreover, since it is a 6th floor building, it becomes a 6x6 matrix. The traffic flow is a total representing the number of people moving on each floor, and can be represented by such an OD matrix (the OD matrix is used in traffic analysis for roads).
各要素の移動人数をtr1、tr2、…と変数で表したのが、図6の左から2番目の表(OD行列)であり、これは30次元のベクトル(tr1、tr2、tr3、…、tr30)となっている。このような交通流をそのまま扱って重み係数を求めようとすると、次式のような30次元の関数を求めなければならない。 The movement number of each element is represented by a variable tr1, tr2,..., Which is the second table (OD matrix) from the left in FIG. 6, which is a 30-dimensional vector (tr1, tr2, tr3,... tr30). If such a traffic flow is handled as it is and the weighting coefficient is obtained, a 30-dimensional function such as the following equation must be obtained.
WT=F(tr1、tr2、tr3、…、tr30)…………(5)
これは非常に複雑な関数であり、解析することは実際的に不可能といえる。そこで、30次元のベクトル空間をそのまま扱うのではなく、いくつかの主要な部分空間に分けることを考える。このようにすると扱う対象が、有限個の部分空間となり、扱いやすくなる。この部分空間が交通流モードに対応する。以下、図7により、これを説明する。
WT = F (tr1, tr2, tr3,..., Tr30) (5)
This is a very complex function and it is practically impossible to analyze. Therefore, instead of handling the 30-dimensional vector space as it is, consider dividing it into several main subspaces. In this way, the object to be handled becomes a finite number of subspaces, which makes it easy to handle. This subspace corresponds to the traffic flow mode. Hereinafter, this will be described with reference to FIG.
図7は、入力を交通流で扱う場合の重み係数設定法の一例説明図である。説明を簡単にするため、ここでは2階床のビルを例にとっている。2階床のビルの場合、OD行列は単純に図7(a)のような2×2の行列となり、図7(b)のように、交通流は(tr1、tr2)の2次元ベクトルで表される。ここで、tr1とtr2をそれぞれ横軸、縦軸にとって、2次元のグラフで表すと、図7(c)のように表される。図7(c)のグラフ上の点が交通流を表しており、例えば、出勤時のように、tr1が大(1階から2階の上りの移動が大)、tr2が小(2階から1階の下りの移動が小)の交通流は、図中の点のように表される。図7(c)のように、単純な2階床のビルの交通流でも、(tr1、tr2)の2次元平面となり、これを式(6)のような2次元変数の関数で扱おうとすると、複雑な関数を扱わねばならなくなる。 FIG. 7 is an explanatory diagram of an example of a weighting factor setting method when the input is handled by a traffic flow. In order to simplify the explanation, a building on the second floor is taken as an example here. In the case of a two-story building, the OD matrix is simply a 2 × 2 matrix as shown in FIG. 7A, and the traffic flow is a two-dimensional vector of (tr1, tr2) as shown in FIG. 7B. expressed. Here, tr1 and tr2 are represented as a two-dimensional graph with the horizontal axis and the vertical axis, respectively, as shown in FIG. The points on the graph in FIG. 7C represent the traffic flow. For example, as in work, tr1 is large (moving up from the first floor to the second floor is large) and tr2 is small (from the second floor). A traffic flow with a small movement on the first floor is represented as a dot in the figure. As shown in FIG. 7C, even a traffic flow of a simple two-story building becomes a two-dimensional plane of (tr1, tr2), and if this is to be handled by a function of a two-dimensional variable such as equation (6), You have to deal with complex functions.
WT=F(tr1、tr2)……………(6)
そこで、図7(c)のtr1、tr2の2次元平面に対して、代表的な交通流を1つの固まりとしてまとめるようにする。図7(d)がその例で、tr1、tr2の2次元平面を4つの領域に分割させている。そして、それぞれの4つの領域に対して代表する交通流ベクトルV1、V2、V3、V4を定めている。V1、V2、V3、V4は、全体を代表する交通流であり、前述の交通流モードに対応している。尚、領域の分け方は1通りではなく、そのビルの交通需要の特性に応じていろいろな分け方が考えられる。
WT = F (tr1, tr2) (6)
Therefore, representative traffic flows are grouped as one lump on the two-dimensional planes tr1 and tr2 in FIG. FIG. 7D shows an example, in which the two-dimensional plane tr1 and tr2 is divided into four regions. Then, representative traffic flow vectors V1, V2, V3, and V4 are defined for each of the four regions. V1, V2, V3, and V4 are traffic flows representing the whole, and correspond to the above-described traffic flow mode. Note that the area is not divided in one way, but various ways can be considered according to the traffic demand characteristics of the building.
交通流モードで表すことによって、図7(e)に示すように、交通流モード1つに対して、それに適した重み係数を定めていけばよい。この最適解は、交通流モードに対して群管理制御のシミュレーションを、重み係数を変えながら繰り返し実行することによって求めることができる。例えば、図7(e)の場合、交通流モードV3に対して、重み係数を変えながらシミュレーションを繰り返し実行することによって、平均待ち時間を下げ得る最適な重み係数はWT=5.6というように値を定めることができる。同様にして、各交通流モードに対して、シミュレーションによって最適な重み係数を定めると、図7(f)のような交通流モードと重み係数の対応関係表が得られる。 By expressing in the traffic flow mode, as shown in FIG. 7E, a weighting factor suitable for the traffic flow mode may be determined. This optimal solution can be obtained by repeatedly executing the simulation of the group management control for the traffic flow mode while changing the weighting factor. For example, in the case of FIG. 7E, for the traffic flow mode V3, the optimum weighting factor that can lower the average waiting time by repeatedly executing the simulation while changing the weighting factor is WT = 5.6. A value can be defined. Similarly, when an optimum weighting coefficient is determined by simulation for each traffic flow mode, a correspondence table between the traffic flow mode and the weighting coefficient as shown in FIG. 7F is obtained.
以上を総括すると、入力を交通流で扱う場合は、そのままでは多次元ベクトルをまともに扱わねばならず複雑なため、主要な交通流モードで代表させて、各モードに対してシミュレーションの繰り返し実行によって重みを設定させる方法を取ることになる。 To summarize the above, when input is handled by traffic flow, it is complicated to handle multi-dimensional vectors as they are, so it is represented by main traffic flow modes, and simulation is repeated for each mode. A method of setting weights will be taken.
図8は、本発明の一実施例と従来の重み係数設定法の比較図であり、項目で比較して整理している。この表は、例えば、特開平1−226676号公報に開示された設定法と本実施例の設定法とを5つの項目について比較している。以下、最初の項目から順に比較する。まず、入力変数について、従来技術では交通流ベクトル又はその主要分を抽出した交通流モードを用いている。これに対して、本実施例ではホール呼び発生数を用いる。それぞれの入力変数の性質は、従来技術では多次元ベクトル、例えば、tr1、tr2、tr3、…のようなベクトルであるのに対して、本実施例では1つの変数、言い換えるとスカラー値となっている。また、出力値である重み係数の決め方は、従来技術が群管理制御のシミュレーションを繰り返し実行して探索によって選定するのに対して、本実施例では、図4で示したような連続関数によって設定している。従って、それぞれの特徴は、従来技術が値の選定までにある程度の時間を要するのに対して、本実施例の方法では瞬時に値を決めることができるという特徴がある。この特徴より、本実施例の方法は、従来技術に対して、交通流の多様な変化に対して、即座に適切な重み係数(より正確には適切な重み係数の初期値)を設定でき、制御性能を安定して発揮できるという効果がある。 FIG. 8 is a comparison diagram of one embodiment of the present invention and a conventional weighting factor setting method, and is compared and organized by item. In this table, for example, the setting method disclosed in Japanese Patent Laid-Open No. 1-2226676 is compared with the setting method of this embodiment for five items. Hereinafter, the first item is compared in order. First, with respect to input variables, the conventional technique uses a traffic flow mode in which a traffic flow vector or its main component is extracted. On the other hand, in this embodiment, the number of hall calls generated is used. The nature of each input variable is a multi-dimensional vector, for example, a vector such as tr1, tr2, tr3,... In the prior art, but in the present embodiment, it is one variable, in other words, a scalar value. Yes. In addition, the method of determining the weighting coefficient, which is the output value, is set by a continuous function as shown in FIG. 4 in the present embodiment, whereas the prior art repeatedly selects a group management control by performing a search. is doing. Therefore, each feature has a feature that a certain amount of time is required until the value is selected in the prior art, whereas the method of this embodiment can determine the value instantaneously. From this feature, the method of the present embodiment can immediately set an appropriate weighting factor (more precisely, an initial value of an appropriate weighting factor) for various changes in traffic flow compared to the prior art, There is an effect that the control performance can be exhibited stably.
図9は、ここまで説明してきた本発明の一実施例による重み係数設定法をまとめた処理フロー図である。この一連の処理は、図2のホール呼び発生数演算部10、重み係数範囲演算部11、重み係数初期値演算部12、交通流判定部20、重み係数最適解探索部21、シミュレーション部22、重み係数設定部8において実行される。以下、順に説明する。まず、入力情報を入力して(ST101)、この入力情報を基に1周当たりのホール呼び発生数NAを計算する(ST102)。この値は例えば次のようにして計算できる。その時点のエレベータの平均1周時間より長い時間に設定した所定時間におけるホール呼び発生総数をNH、方向反転総数をNRとすると、NAは次式によって求められる。
FIG. 9 is a processing flow diagram summarizing the weighting factor setting method according to one embodiment of the present invention described so far. This series of processing includes hall call occurrence
NA=NH/{(NR/2)+1}…………(7)
尚、(7)式の分母{(NR/2)+1}は、全エレベータの所定時間での総周回数に対応している。
NA = NH / {(NR / 2) +1} (7)
Incidentally, the denominator {(NR / 2) +1} in the equation (7) corresponds to the total number of laps in a predetermined time of all elevators.
1周当たりのホール呼び発生数NAが計算されると、これを基に重み係数の初期値WT0が関数WT0=F0(NA)により計算される(ST103)。そして、その時刻で発生している交通流モードが判定され(ST104)、その交通流モードに対して重み係数の最適解探索が既に実行されているかどうかが判定される(ST105)。最適解探索が実行されており、初期値よりも良い結果が出る重み係数の値が探索されている場合は、その値(その時点の最適解)に重み係数を設定する(ST106)。最適解が実行されていない、もしくは初期値よりも良い結果が出る重み係数の値がまだ探索されていない場合は、重み係数の値を初期値WT0に設定する(ST107)。 When the number of hall calls generated per round NA is calculated, based on this, the initial value WT 0 of the weighting coefficient is calculated by the function WT 0 = F 0 (NA) (ST103). Then, the traffic flow mode occurring at that time is determined (ST104), and it is determined whether or not the optimum solution search for the weighting factor has already been executed for the traffic flow mode (ST105). If the optimum solution search has been performed and a weight coefficient value that produces a better result than the initial value is searched, the weight coefficient is set to that value (the optimum solution at that time) (ST106). If the optimal solution has not been executed, or the weighting factor value that produces a better result than the initial value has not yet been searched, the weighting factor value is set to the initial value WT 0 (ST107).
図9のような処理フローによって重み係数を設定するため、そのビルにおいて、初めて発生した交通流であっても、関数で定めた初期値WT0によって即座に適切な重み係数の値を設定することができる。また、ビルの稼動初期であっても、関数で定めた初期値WT0によって即座に適切な重み係数の値を設定することができる。また、最適解探索が収束しておらず、適切な解が見つかっていない場合でも、関数で定めた初期値WT0によって適切な重み係数の値を設定することができる。 Since the weighting factor is set by the processing flow as shown in FIG. 9, even if it is the first traffic flow in the building, the appropriate weighting factor value is immediately set by the initial value WT 0 determined by the function. Can do. Even in the initial operation of the building, an appropriate weight coefficient value can be immediately set by the initial value WT 0 determined by the function. Even when the optimum solution search has not converged and an appropriate solution has not been found, an appropriate weighting factor value can be set by the initial value WT 0 determined by the function.
図10は、本発明の一実施例による重み係数の最適解探索法をまとめた処理フロー図である。この一連の処理は、図2のホール呼び発生数演算部10、重み係数範囲演算部11、重み係数初期値演算部12、交通流判定部20、重み係数最適解探索部21、シミュレーション部22においてなされる。以下、順に説明する。まず、交通流モードデータを入力して(ST201)、その交通流モードに対して最適解探索処理を実行しているか否かを判定する(ST202)。実行済みの場合は、探索の初期値を前回探索時の最適値に設定する(ST208)。実行していない場合は、その交通流モードにおける1周当たりのホール呼び発生数NAを算出し(ST203)、その値を基に、重み係数の初期値WT0を計算し(ST204)、上限値WT上限を計算し(ST205)、下限値WT下限を計算する(ST206)。そして、探索の初期値をWT0に設定する。
FIG. 10 is a processing flow diagram summarizing an optimum solution search method for weighting factors according to an embodiment of the present invention. This series of processing is performed in the hall call occurrence
設定された初期値に対して、判定された交通流モードに対する群管理制御のシミュレーションを実行し、さらに初期値を変更してシミュレーションを繰り返すことによって最適解探索を実行する(ST209)。この最適解探索の実行後(又はその探索途中において)、得られている最適な重み係数が上限値WT上限と下限値WT下限の範囲内にあるかを判定する(ST210)。範囲内にある場合は、その重み係数の値が最適解となる。範囲内にない場合は、重み係数の値を上限値WT上限又は下限値WT下限又は前回探索時の最適解に設定する(ST211)。 A simulation of group management control for the determined traffic flow mode is executed for the set initial value, and the optimum solution search is executed by changing the initial value and repeating the simulation (ST209). After execution of this optimum solution search (or during the search), it is determined whether the obtained optimum weighting factor is within the range between the upper limit value WT upper limit and the lower limit value WT lower limit (ST210). If it is within the range, the value of the weighting coefficient is the optimal solution. If not within the range, the value of the weighting factor is set to the upper limit value WT upper limit or lower limit value WT lower limit or the optimal solution at the previous search (ST211).
図10のような処理フローによって重み係数の最適解探索を実行するため、初めて発生した交通流に対しても、探索の初期値がホール呼び発生数の関数によって適正な値に定めることができる。その結果、最適解探索をより効率良く実施することができる。また、探索の範囲をホール呼び発生数の関数によって適正な範囲に定めているため、探索の初期や過渡状態においても、不適切な領域を探索することなく、より効率良く最適解探索を実施できる。尚、これらの利点は図5において、探索イメージを示して説明した。 Since the search for the optimum solution of the weighting coefficient is executed by the processing flow as shown in FIG. 10, the initial value of the search can be set to an appropriate value by the function of the number of hall calls generated even for the first traffic flow. As a result, the optimum solution search can be performed more efficiently. In addition, since the search range is set to an appropriate range by the function of the number of hall calls, the optimal solution search can be performed more efficiently without searching for an inappropriate area even in the initial stage or transient state of the search. . These advantages have been described with reference to a search image in FIG.
図11は、図2に示した入力情報蓄積部2の詳細を表している。入力情報蓄積部2は、次のようなデータの蓄積から成る。まず、ビルの設備データ201、群管理エレベータの設備データ202、及び現時点における群管理エレベータの状態データ203である。次に、群管理エレベータの状態データ統計204、現時点におけるビルの各ホールの状態データ205、ビルの交通流データ206、並びに時刻情報データ207である。ビルの設備データ201には、ビルの階床数、各階床の階高、群管理のサービス対象となる階床などのデータが蓄積されている。群管理エレベータの設備データ202には、群管理エレベータの台数、各エレベータ号機の定格速度、かご定員、ドアの開閉速度、標準のドア開放時間などのデータが蓄積されている。現時点における群管理エレベータの状態データ203には、かごの位置、方向の情報、速度の情報、かご内荷重の情報、割当てホール呼び情報、かご呼び情報、停止階の情報、各ホール呼びのホール呼び継続時間情報、各かごの1周時間などのデータがある。群管理エレベータの状態データ統計204には、所定時間におけるホール呼びの発生数、かご呼び発生数、利用人数、平均ホール呼び継続時間、方向反転回数、平均荷重、平均1周時間などのデータが蓄積されている。現時点におけるビルの各ホールの状態データ205には、ホール呼び釦41A,41Bの情報、ホールの待ち客のカメラ51A,51B情報などのデータが蓄積されている。ビルの交通流データ206には、図6のOD行列によって示されるようなビルの交通流データが蓄積されている。時刻情報データ207には、時計による情報、年、月、日、曜日、休日、特別なイベントのある日などのカレンダー情報が蓄積されている。入力情報蓄積部2には、以上に記述した全てのデータが蓄積されている。尚、この入力情報蓄積部2は必ずしもこれらのデータを統合したものである必要はなく、上記のデータは分散して蓄積されていてもよい。その場合は、仮想的にこれらのデータを統合したものを入力情報蓄積部2と考えればよい。
FIG. 11 shows details of the input
以上、ここまでは重み係数の設定法について詳細を説明した。次に、図12を用いて、かご間隔評価値の算出法の詳細を説明する。このかご間隔評価値の算出法に当たってのポイントは、間隔を評価する時間の設定法にある。 So far, the details of the method for setting the weighting factor have been described. Next, details of a method of calculating the car interval evaluation value will be described with reference to FIG. The point in the method of calculating the car interval evaluation value is the time setting method for evaluating the interval.
図12は、図2に示したかご間隔評価値演算部4の詳細構成を表している。まず、将来の各かごの予測軌跡を演算する予測軌跡演算部401を備え、この予測軌跡を基に、所定時間後(後述する間隔評価時刻tref)のかご間隔を算出する予測かご間隔演算部402を備えている。次に、予測間隔を基に、かご間隔評価値を算出するかご間隔評価値算出部403と、時間的に最遠方の呼び(ホール呼びとかご呼びを含めた呼び)を検索によって求める最遠方呼び検索部404を備えている。さらに、最遠方の呼びに対する到着予測時間、すなわち、最大到着予測時間に基づいて、間隔評価時刻trefを求める間隔評価時刻設定部405で構成される。
FIG. 12 shows a detailed configuration of the car interval evaluation
以下、先に説明した図1を参照しながら、図12の間隔評価値演算部4のそれぞれの要素の働きを説明する。図1(b)において、1号機及び2号機の予測軌跡(図中で現時点から将来方向への黒線の軌跡)を算出するのが、図12の予測軌跡演算部401であり、図1(b)の間隔評価時刻trefを設定するのが間隔評価時刻設定部405になる。各かごの予測軌跡より間隔評価時刻での予測位置、すなわち、図1(b)で間隔評価時刻上で描かれている1号機、2号機のかご位置を求め、この予測位置より各かごの時間的間隔又は空間的間隔を求めるのが、図12の予測かご間隔演算部402である。このかご間隔の値から、その等間隔性を評価する評価値を計算するのが、かご間隔評価値算出部403である。例えば、図1(b)と(c)を比較すると、(b)の方が等間隔性が高い状態にあり、これを数値化するのが、かご間隔評価値算出部403である。
Hereinafter, the function of each element of the interval evaluation
上述したかご間隔評価値を算出するにあたり、重要な要素の一つは、かご間隔を推定する時間の設定法にある。この設定法も本実施例の特徴であり、以下、図13〜図16により、間隔評価時刻の設定法を説明する。 In calculating the car interval evaluation value described above, one of the important elements is a method of setting a time for estimating the car interval. This setting method is also a feature of the present embodiment, and the method for setting the interval evaluation time will be described below with reference to FIGS.
図13は、間隔評価時刻trefを設定する処理フロー図である。この一連の処理は、図12の最遠方呼び検索部404と間隔評価時刻設定部405において実行される。まず、各かごを順に検索するかごループ処理が実行される(ST501)。ここで、検索対象となるかごはK号機(K=1、2、…、N)となる。また、Kの初期値は1になる。まずK号機に割当てられている全てのホール呼びを検索して、最大の到着予測時間ART_H(K)を選び出す(ST502)。次に、K号機が受け持っている全てのかご呼びを検索して、最大の到着予測時間ART_C(K)を選び出す(ST503)。その後、ART_H(K)とART_C(K)を比較し、大きい方がK号機の最遠方呼びの到着予測時間ART_MAX(K)として求められる(ST504)。これを式で表すと次式のようになる。
FIG. 13 is a processing flowchart for setting the interval evaluation time tref. This series of processing is executed by the farthest
ART_MAX(K)=MAX{ART_H(K)、ART_C(K)}……(8)
全てのエレベータ号機に対して、ここまでの処理を実施したかどうかを、KがNに等しいかどうかで判定して(ST505)、等しくない場合はKの値を1つ加算して(ST506)、始めの処理(ST502)に戻る。全てのエレベータ号機に対して、最遠方呼びの到着予測時間が算出された場合は、全てのエレベータ号機に対する最遠方呼びの到着予測時間の最大値を間隔評価時刻trefに設定する(ST507)。これを式で表すと次式のようになる。
ART_MAX (K) = MAX {ART_H (K), ART_C (K)} (8)
It is determined whether or not the processing up to this point has been performed for all elevators based on whether or not K is equal to N (ST505). If not equal, the value of K is incremented by one (ST506). The process returns to the first process (ST502). If the estimated arrival time of the farthest call is calculated for all elevators, the maximum value of the estimated arrival time of the farthest call for all elevators is set as the interval evaluation time tref (ST507). This is expressed by the following equation.
tref=MAX{ART_MAX(K)}…………(9)
このように、その時点で全てのエレベータ号機が持っているホール呼び、かご呼びに対して、その到着予測時間が最大となる呼び(全号機に対する最遠方呼び)を選び出し、その呼びの到着予測時間を間隔評価時刻としている。このような方法で間隔評価時刻を定める効果については図14により説明する。
tref = MAX {ART_MAX (K)} (9)
In this way, for the hall call and car call that all elevators have at that time, the call with the maximum estimated arrival time (the farthest call for all units) is selected and the estimated arrival time for that call. Is the interval evaluation time. The effect of determining the interval evaluation time by such a method will be described with reference to FIG.
尚、全号機に対する最遠方呼びの到着予測時間は、時間の推移(例えば20秒程度の推移)によって新たな呼びが発生して値が変わるため、割当て処理の度に値は変わっていく。その結果、間隔評価時刻も割当て処理の度に値は変わっていく。これはその時点々々で、発生している呼びの状況(発生している呼び数の状況など)が変わるため、それに対応して間隔評価時刻もその都度調整されていることを表している。 Note that the estimated arrival time of the farthest call for all the units changes due to a change in time (for example, a change of about 20 seconds) and a value changes, so the value changes every time allocation processing is performed. As a result, the value of the interval evaluation time changes with every allocation process. This indicates that the status of the call that is occurring (the status of the number of calls that are being generated, etc.) changes from time to time, and accordingly, the interval evaluation time is adjusted accordingly.
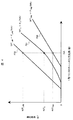
図14は、間隔推定時刻の設定に対する考え方を表している。図14(a)のグラフは横軸が原点を現時点とする時間軸、縦軸が階床位置を表している。図14(a)のグラフにおいて、実線で表された2つの軌跡は、それぞれ1号機と2号機の予測軌跡を表している。F10が1号機の予測軌跡を表しており、F11が2号機の予測軌跡を表している。この2つの予測軌跡に対して、どこの時間における間隔を評価するかが、間隔評価時刻設定のポイントになるが、この間隔評価時刻には次に述べるような性質がある。
FIG. 14 illustrates a concept for setting the estimated interval time. In the graph of FIG. 14A, the horizontal axis represents the time axis with the origin as the current time, and the vertical axis represents the floor position. In the graph of FIG. 14A, the two trajectories represented by solid lines represent the predicted trajectories of
まず、現時点に時間的に近い領域に間隔評価時刻を設定した場合、それより後の時間にある既に受け持っている呼び(ホール呼び又はかご呼び)の影響を考慮できないという問題がある。特にこの影響が大きいのが途中で追い越しが発生する場合であり、例えば図14(a)のグラフにおいて、符号F12で示された時間に間隔評価時刻を設定したと仮定とすると、先行する1号機に対して後続の2号機が接近してだんご状態になっていると判定される。このため、この時間(F12の時間)のかご間隔で評価すると、1号機を進めて(割当てを抑制)、2号機を遅らせる(割当てを促進)制御が良いことになる。しかし、予測軌跡を見ると、その後に2号機が1号機を追い越しており、2号機を遅らせると、逆にだんご状態を長引かせる方向に働かせることなる。このように、現時点に近い領域に間隔評価時刻を設定すると、各エレベータが既に受け持っている呼びを考慮しない影響が大きくなる。
First, when the interval evaluation time is set in a region close in time to the current time, there is a problem that the influence of a call (hall call or car call) that is already handled at a later time cannot be considered. This influence is particularly significant when overtaking occurs in the middle. For example, assuming that the interval evaluation time is set at the time indicated by reference numeral F12 in the graph of FIG. On the other hand, it is determined that the subsequent unit No. 2 is approaching and is in a dumped state. For this reason, if it evaluates by the cage | basket | car space | interval of this time (time of F12), the control which advances 1st machine (suppresses allocation) and delays 2nd machine (promotes allocation) will be good. However, looking at the predicted trajectory,
次に、現時点よりも時間的に遠い領域に間隔評価時刻を設定した場合を考えると、この場合は将来事象のため、その後に新しいホール呼びやかご呼びが発生する可能性が高く、予測軌跡が大きく変わってしまう可能性がある。例えば、図14(a)において、符号F13で示された時間に間隔評価時刻を設定したと仮定とすると、この時間までに新たにホール呼び、かご呼びが発生する可能性は高く、そうなると、ここでのかご間隔は不確定性が大きく、値が大きく変わる可能性がある。 Next, considering the case where the interval evaluation time is set in a region far in time from the current time, this is a future event, so there is a high possibility that a new hall call or car call will occur after that, and the predicted trajectory is It can change a lot. For example, in FIG. 14A, if it is assumed that the interval evaluation time is set at the time indicated by reference numeral F13, there is a high possibility that a new hall call or car call will be generated by this time. The car spacing at is highly uncertain and can change significantly.
以上に述べた間隔評価時刻の特性を表したものが図14(b)のグラフになる。図14(b)のグラフにおいて、横軸は間隔評価時刻を表し、縦軸は対応する間隔評価時刻でかご間隔を推定した場合の予測精度を表している。間隔評価時刻が零(現時点に対応)に近い領域ではかご間隔の予測精度は小さく、そこから間隔評価時刻の値が大きくなるについて予測精度は上がっていく。そして、ある値で最大となり、その後は値が大きくなるほど予測精度は落ちる。この予測精度が最大となる所が、既に述べた全号機に対する最遠方呼びの到着予測時間近傍になると考えられる。その理由は、最遠方呼びに対する到着予測時間までには、既に発生している全てのホール呼びとかご呼びが含まれており、これらを全て考慮できることが挙げられる。この時間より先の時間では既に発生している呼びは無いため、確実な情報はなく、予測精度は単純に下がるだけになる。 FIG. 14B is a graph showing the characteristics of the interval evaluation time described above. In the graph of FIG. 14B, the horizontal axis represents the interval evaluation time, and the vertical axis represents the prediction accuracy when the car interval is estimated at the corresponding interval evaluation time. In the region where the interval evaluation time is close to zero (corresponding to the present time), the prediction accuracy of the car interval is small, and the prediction accuracy increases as the value of the interval evaluation time increases from there. And it becomes the maximum at a certain value, and after that, prediction accuracy falls, so that a value becomes large. The place where the prediction accuracy is maximized is considered to be in the vicinity of the arrival prediction time of the farthest call for all the units already described. The reason is that all the hall calls and car calls that have already occurred are included by the estimated arrival time for the farthest call, and all of them can be considered. Since there is no call that has already occurred before this time, there is no reliable information and the prediction accuracy is simply reduced.
従って、全号機に対する最遠方呼びの到着予測時間又はその近傍に間隔推定時刻を設定することによって、予測精度の高いかご間隔評価を実行することができる。その結果、より確実に等間隔状態へ近づける割当てを実行することができ、長い待ち時間の発生を抑制することができる。 Therefore, by setting the estimated interval time at or near the estimated arrival time of the farthest call for all the cars, it is possible to perform cage interval evaluation with high prediction accuracy. As a result, it is possible to execute the assignment that approaches the equally spaced state more reliably, and to suppress the occurrence of a long waiting time.
図15は、図12とは異なるかご間隔評価値演算部の第2の実施例機能ブロック図である。図15において、図12に示された要素と同じ要素については、同じ符号を割り付けており、説明を省略する。図15が図12と異なる点は、間隔評価時刻をその時点で発生している交通流モードによって設定している点にある。具体的には、交通流モード判定部406にて、その時点で発生している交通流モードをそのビルで過去に発生している交通流ベクトルの中の代表的な交通流ベクトルとして判定する。そして、その交通流モードに適した間隔評価時刻を、交通流モードに対する間隔評価時刻データベース407より参照して、その値を設定する。ここで、交通流モードに対する間隔評価時刻データベース407は、あらかじめ抽出しているビルの交通流モードとそれに対応する間隔評価時刻をテーブル形式で整理したデータベースになる。これを使うことによって、交通流モードが定まれば、それに対応する間隔評価時刻をテーブル参照によって設定することができる。
FIG. 15 is a functional block diagram of a second embodiment of the car interval evaluation value calculation unit different from FIG. In FIG. 15, the same elements as those shown in FIG. 12 are assigned the same reference numerals, and the description thereof is omitted. FIG. 15 differs from FIG. 12 in that the interval evaluation time is set according to the traffic flow mode generated at that time. Specifically, the traffic flow
交通流と呼びの発生には関連性があるため、最遠方呼びの到着予測時間の代わりに交通流モードを用いても適切な間隔評価時刻を定めることができ、同様の効果が期待できる。 Since there is a relationship between the traffic flow and the occurrence of the call, an appropriate interval evaluation time can be determined even if the traffic flow mode is used instead of the predicted arrival time of the farthest call, and the same effect can be expected.
尚、この場合、間隔評価時刻を設定する時間間隔は、交通流変化の時定数とほぼ等しくなる。 In this case, the time interval for setting the interval evaluation time is substantially equal to the time constant of the traffic flow change.
図16は、図12とは異なるかご間隔評価値演算部の第3の実施例機能ブロック図である。図16において、図12に示された要素と同じ要素については、同じ符号を割り付けており、説明を省略する。図16が図12と異なる点は、間隔評価時刻をその時点における平均1周時間に基づいて定めている点にある。具体的には、平均1周時間演算部408において、入力情報(図1の入力情報蓄積部2より入力)を基にその時点における全エレベータに対する平均1周時間Tが求められる。この平均1周時間Tを基に、間隔評価時刻設定部405で次式により間隔評価時刻trefが定められる。
FIG. 16 is a functional block diagram of a third embodiment of a car interval evaluation value calculation unit different from FIG. In FIG. 16, the same elements as those shown in FIG. 12 are assigned the same reference numerals, and the description thereof is omitted. FIG. 16 differs from FIG. 12 in that the interval evaluation time is determined based on the average one round time at that time. Specifically, the average one-round
tref=F(T)…………(10)
ここで、F(T)はTの関数であることを表している。(10)式は、例えば次のように表される。
tref = F (T) ………… (10)
Here, F (T) represents a function of T. The expression (10) is expressed as follows, for example.
tref=α・T……………(11)
ここで、αは定数を表している。
tref = α · T (11)
Here, α represents a constant.
交通流と同様に、平均1周時間も呼びの発生と関連性があるため、最遠方呼びの到着予測時間の代わりに平均1周時間を用いても適切な間隔評価時刻を定めることができ、同様の効果が期待できる。 As with traffic flow, the average round trip time is related to the occurrence of the call, so even if the average round trip time is used instead of the estimated arrival time of the farthest call, an appropriate interval evaluation time can be determined. Similar effects can be expected.
上述の間隔評価時刻の設定法と同じく、間隔評価値を決めるために重要となるのが予測軌跡の作成法である。この予測軌跡の作成は、図12、図15、又は図16の予測軌跡演算部401、又は図17の予測ルート作成部411において実施される。
Similar to the above-described method for setting the interval evaluation time, the method for creating the predicted trajectory is important for determining the interval evaluation value. The creation of the predicted trajectory is performed in the predicted
図17は、図12に代わるかご間隔評価値演算部4に対する第4の実施例機能ブロック図である。ここでは、予測ルートとの表現を用いているが、この予測ルートは、これまで説明した予測軌跡と同じものを意味している。図17の詳細は後述する。以下、本実施例のポイントの一つである予測軌跡の作成法を、図18を用いて説明する。
FIG. 17 is a functional block diagram of a fourth embodiment for a car interval evaluation
図18は、予測軌跡作成方法全体の処理フロー図を表している。以下、その流れを説明する。まずエレベータの号機名を表す変数Kを1に設定する(FA01)。次に、K号機が群管理対象となっているかどうかを判定する(FA08)。専用運転等の理由で群管理から切り離されたエレベータ号機は残りの群管理されているエレベータとは独立して運行させるため、このような処理によって予測軌跡作成の対象から外すようにしている。次に、K号機は有方向かどうかを判定する(FA02)。ここで、K号機が有方向か否かの判定は表現を変えると、K号機がホール呼び又はかご呼びを受け持っているか否かを判定していることと等価になる。従って、K号機がホール呼び又はかご呼びを受け持っている場合(K号機が有方向の場合)は複数周回の到着予測時間表作成処理へ進み(FA03)、どちらの呼びも受け持っていない場合(K号機が無方向の場合)は無方向時の予測軌跡表作成処理に進む(FA05)。 FIG. 18 shows a process flow diagram of the entire predicted trajectory creation method. Hereinafter, the flow will be described. First, a variable K representing the elevator car name is set to 1 (FA01). Next, it is determined whether or not the K machine is a group management target (FA08). Since the elevator car separated from the group management for reasons such as exclusive operation is operated independently of the remaining elevators managed by the group, such processing is excluded from the target for creating the predicted trajectory. Next, it is determined whether the K machine is directional (FA02). Here, the determination as to whether or not the K machine is directional is equivalent to determining whether or not the K machine is in charge of a hall call or a car call. Therefore, if Unit K is in charge of hall call or car call (when Unit K is in a direction), it proceeds to the process of creating a multiple lap predicted arrival time table (FA03), and if neither call is in charge (K03) If the car is in a non-directional direction, the process proceeds to a predicted trajectory table creation process in the non-directional direction (FA05).
複数周回の到着予測時間表作成処理(FA03)では、複数周、例えば3周以上の到着予測時間表を作成する。複数周回の到着予測時間表を、以下ではtar_table(i、j、c、K)という変数で表すことにする。ここで、iは階、jは方向、cは周回数、Kは号機の名前を表している。複数周回の到着予測時間表作成の詳細は、図33により後述する。複数周回の到着予測時間表が作成されると、この表を基に、有方向時の予測軌跡表が作成される(FA04)。有方向時の予測軌跡表を、ここでは、ir(t、K)、jr(t、K)の2つの変数で表すようにする。ir(t、K)は、現時点からt秒後のK号機のかご位置を表し、jr(t、K)は、現時点からt秒後のK号機のかご方向を表している。有方向時の予測軌跡表作成の詳細は、図25、図26を用いて後述する。 In the multiple-round arrival prediction time table creation processing (FA03), an arrival prediction time table for a plurality of rounds, for example, three or more rounds, is created. The multi-round arrival prediction time table is represented by a variable called tar_table (i, j, c, K) below. Here, i is the floor, j is the direction, c is the number of laps, and K is the name of the car. Details of creation of the predicted arrival time table for a plurality of rounds will be described later with reference to FIG. When a predicted arrival time table for multiple rounds is created, a predicted trajectory table for a directional direction is created based on this table (FA04). Here, the predicted trajectory table in the directional direction is represented by two variables ir (t, K) and jr (t, K). ir (t, K) represents the car position of car K after t seconds from the current time, and jr (t, K) represents the car direction of car K after t seconds from the current time. Details of the prediction trajectory table creation in the directional direction will be described later with reference to FIGS. 25 and 26.
処理FA02において、K号機が無方向の場合は、無方向時の予測軌跡表を作成する(FA05)。この場合も予測軌跡表は、ir(t、K)、jr(t、K)の2つの変数で表すようにする。無方向時の予測軌跡表作成の詳細は図27を用いて後述する。 In process FA02, when the K machine is non-directional, a predicted trajectory table for non-directional is created (FA05). Also in this case, the prediction trajectory table is represented by two variables ir (t, K) and jr (t, K). Details of creation of the predicted trajectory table in the non-direction will be described later with reference to FIG.
K号機に対して有方向時又は無方向時の予測軌跡表を作成すると、Kを1つ加算し(FA06)、新たなK号機に対して、処理FA08に戻り上記の処理を繰り返す。これを全ての群管理対象号機に対して実行する(FA07)。 When a prediction trajectory table is generated for directional or non-directional with respect to the K machine, one K is added (FA06), and for the new K machine, the process returns to the process FA08 and the above process is repeated. This is executed for all group management target machines (FA07).
本実施例による予測軌跡作成の大きな特徴は、1)複数周回の到着予測時間表を作成する点と、2)有方向時と無方向時とを区別して予測軌跡を作成する点の2点にある。例えば、1)の場合、周回数に応じて到着予測時間の作成が異なる(詳細は後述する)。また、2)の場合、図30のように、有方向のかごの軌跡(図30の軌跡FJ03)と無方向のかご軌跡(図30の軌跡FJ02)とをそれぞれ異なる形状で作成する(詳細は後述する)。このような結果、その時の各号機の状態、交通需要の状態を考慮したより精度の高い予測軌跡を作成することができる。 The major features of creating a predicted trajectory according to this embodiment are two points: 1) creating a multiple-round arrival prediction time table, and 2) creating a predicted trajectory by distinguishing between directional and non-directional directions. is there. For example, in the case of 1), the creation of the predicted arrival time differs depending on the number of laps (details will be described later). In the case of 2), as shown in FIG. 30, a directional car trajectory (trajectory FJ03 in FIG. 30) and a non-directional car trajectory (trajectory FJ02 in FIG. 30) are created in different shapes (details are given below). Will be described later). As a result, it is possible to create a more accurate predicted trajectory in consideration of the state of each unit and the traffic demand at that time.
図19は、本発明の一実施例による複数周回の到着予測時間表作成処理フロー図である。既に述べたように、到着予測時間表は変数tar_table(i、j、c、K)によって表される。詳細は後述する図21に複数周回の到着予測時間表の作成例を示しており、1周目の到着予測時間表FG02、2周目の到着予測時間表FG03、3周目の到着予測時間表FG04が表されている。図19のフローチャートにより、このような到着予測時間表が作成されることになる。 FIG. 19 is a process flow diagram for creating a predicted arrival time table for multiple laps according to an embodiment of the present invention. As described above, the arrival prediction time table is represented by the variable tar_table (i, j, c, K). The details are shown in FIG. 21, which will be described later, in which an example of the creation of a plurality of rounds of predicted arrival time table is shown. The first round of arrival prediction time table FG02, the second round of arrival prediction time table FG03, and the third round of arrival prediction time table FG04 is represented. According to the flowchart of FIG. 19, such an estimated arrival time table is created.
まず、到着予測時間tar、K号機の階位置を表す変数i、K号機の方向を表す変数jに対して、初期値を設定する(FB01)。具体的には、tarはゼロに設定し、iはK号機の現時点のかご位置、jはK号機の現時点のかご方向に設定する。次に周回数を表す変数cを1に設定する(FB02)。これは1周目の到着予測時間表から作成することを表している。次に、各階を順に走査する際の走査数を表す変数nを零にリセットする。このnは1つずつ加算されて(FB05)、nが2(nmax−1)を超えるまでループで回される(FB06)。ここで、nmaxはK号機が通る総階床素を表している。数式では次のように表される。 First, initial values are set for the predicted arrival time tar, the variable i representing the floor position of the K-th car, and the variable j representing the direction of the K-th car (FB01). Specifically, tar is set to zero, i is set to the current car position of car K, and j is set to the current car direction of car K. Next, a variable c representing the number of laps is set to 1 (FB02). This indicates that it is created from the estimated arrival time table for the first round. Next, a variable n representing the number of scans when scanning each floor in order is reset to zero. This n is added one by one (FB05), and is rotated in a loop until n exceeds 2 (n max −1) (FB06). Here, n max represents the total floor element through which the K machine passes. In the formula, it is expressed as follows.
nmax=K号機のサービスゾーンの最上階−最下階+1…………(12)
2(nmax−1)の値が表す意味について、図22の一番左の図FG01を例に説明する。図22の一番左の図は行方向が階、列方向が上方向、下方向を表しており、エレベータを1周で回るリング(輪)のように表した表示法になっている。この図では、階床は6階あり、最上階である6階の上方向と最下階である1階の下方向は実質的に意味がないため省かれる。その結果、有効な階数は6×6−2=34になる。これは、2(nmax−1)において、nmax=6とした時の値と一致する。つまりnは、エレベータの1周の過程を図22の一番左の図を想定して、1階床ずつ走査する際の走査階を表しており、2(nmax−1)は1周当たりで走査する総階床数を表している。
n max = Top floor of the service zone of Unit K-Bottom floor +1 (12)
The meaning represented by the value of 2 (n max −1) will be described using the leftmost diagram FG01 in FIG. 22 as an example. In the leftmost diagram of FIG. 22, the row direction represents the floor, the column direction represents the upward direction, and the downward direction, and the display method is represented as a ring (wheel) that goes around the elevator in one turn. In this figure, there are 6 floors, and the upward direction of the 6th floor, which is the top floor, and the downward direction of the 1st floor, which is the bottom floor, are substantially meaningless and are omitted. As a result, the effective rank is 6 × 6-2 = 34. This agrees with the value when n max = 6 in 2 (n max −1). In other words, n represents the scanning floor when scanning one floor at a time, assuming the leftmost diagram in FIG. 22 for the process of one round of the elevator, and 2 (n max −1) is per one lap. Represents the total number of floors scanned.
各n毎に、複数周回の到着予測時間表tar_table(i、j、c、K)を計算する(FB04)。これは後述する到着予測時間表計算ルーチンにて実行される(図20により後述)。この処理は、先ほど述べたように2(nmax−1)回実施して(FB06)、それが終わると、次の1周の計算に入るため、周回数を表す変数cが1つ加算される。このようにして、c=1(1周目)の到着予測時間表tar_table(i、j、c=1、K)、c=2(2周目)の到着予測時間表tar_table(i、j、c=2、K)が計算される。さらに、c=3(3周目)の到着予測時間表tar_table(i、j、c=3、K)が計算され、各周における最終の到着階の到着予測時間がtmaxを超えるまで処理を繰り返していく(FB08)。 For each n, an arrival time table tar_table (i, j, c, K) for a plurality of rounds is calculated (FB04). This is executed by an arrival time table calculation routine described later (described later with reference to FIG. 20). This processing is performed 2 (n max −1) times as described above (FB06), and after that, calculation of the next round is started, so one variable c representing the number of rounds is added. The In this way, the arrival prediction time table tar_table (i, j, c = 1, K) for c = 1 (first round), the arrival prediction time table tar_table (i, j, c) for c = 2 (second round). c = 2, K) is calculated. Further, an arrival prediction time table tar_table (i, j, c = 3, K) of c = 3 (third lap) is calculated, and processing is performed until the arrival arrival time of the final arrival floor in each lap exceeds t max. It repeats (FB08).
以上説明した一連の処理によって、図22に示したような複数周回の到着予測時間表を作成することができる。以下では、到着予測時間表計算ルーチン(図19のFB04)の詳細を図20により説明する。 Through the series of processes described above, it is possible to create a predicted arrival time table of a plurality of rounds as shown in FIG. Details of the predicted arrival time table calculation routine (FB04 in FIG. 19) will be described below with reference to FIG.
図20は、到着予測時間表計算ルーチン(図19のFB04)の処理フロー図を表している。まず、大まかな処理の流れを言葉で説明する。1)到着予測時間の変数をtarとする。2)次の移動階を設定する(上方向ならば階を−1、下方向ならば階を+1)。3)周回数が1周目か、2周目以降かを判定する。4)1周目の場合、対象階に呼び停止がある場合はtarに停止時間を加算、呼び停止が無い場合はtarに停止確率を加算する。5)2周目以降の場合は、tarに停止確率を加算する。6)tarに次の移動階への移動時間を加算する。7)対象階の到着予測時間表の値tar_table(i、j、c、K)をtarに設定する。 FIG. 20 shows a process flow diagram of the predicted arrival time table calculation routine (FB04 in FIG. 19). First, I will explain the general processing flow in words. 1) The variable of the estimated arrival time is tar. 2) Set the next moving floor (upward if the floor is -1, if down, the floor is +1). 3) It is determined whether the number of laps is the first lap or after the second lap. 4) In the first round, if there is a call stop on the target floor, the stop time is added to tar, and if there is no call stop, the stop probability is added to tar. 5) In the second and subsequent rounds, the stop probability is added to tar. 6) Add the travel time to the next moving floor to tar. 7) The value tar_table (i, j, c, K) in the predicted arrival time table for the target floor is set to tar.
大まかな処理の流れは上記のようになる図20の詳細を説明する。ここで、K号機に対して走査対象の階をi、方向をjとする。まず対象とするK号機の各走査過程(階をリング状に走査)において、かご方向jが上方向かどうかを判定する(FC01)。上方向の場合は走査時のかご位置を表す変数iを1減算した階が次の移動階i2になる(FC02)。下方向の場合は、iを1加算した階がi2になる(FC03)。次の移動階i2がK号機の方向反転階(例えば、最上階又は最下階)を判定する(FC04)。i2が方向反転階であれば、次の移動階における方向j2をjの反対方向に設定する(FC05)。このように各号機毎に方向反転階を設定していることが本発明の1つのポイントになる。i2が方向反転階でなければ、i2はjと同じ方向に設定する(FC14)。 The rough flow of processing will be described in detail with reference to FIG. Here, the floor to be scanned with respect to the No. K machine is i, and the direction is j. First, in each scanning process of the target K machine (scanning the floor in a ring shape), it is determined whether the car direction j is upward (FC01). In the upward direction, the floor obtained by subtracting 1 from the variable i representing the car position at the time of scanning becomes the next moving floor i2 (FC02). In the downward direction, the floor obtained by adding 1 to i becomes i2 (FC03). The next moving floor i2 determines the direction reversal floor (for example, the top floor or the bottom floor) of the K machine (FC04). If i2 is the direction reversal floor, the direction j2 on the next moving floor is set to the opposite direction of j (FC05). Thus, it is one point of the present invention that the direction reversal floor is set for each unit. If i2 is not the direction inversion floor, i2 is set in the same direction as j (FC14).
走査している階・方向(i、j)について、K号機のサービス階かどうかを判定する(FC06)。階・方向(i、j)がサービス対象階で無い場合は、呼び停止の発生がないため、以下の停止に関係する処理を飛ばして、処理FC11へ飛ぶ。 It is determined whether the floor / direction (i, j) being scanned is the service floor of the K-th unit (FC06). If the floor / direction (i, j) is not the service target floor, there is no call stop, so the processing related to the following stop is skipped and the processing jumps to the processing FC11.
階・方向(i、j)がサービス対象階である場合は、次に到着予測時間表作成の周回数cが2周以上かどうかを判定する(FC07)。cが2周目以降であれば、その周では呼び停止は無いと考え、全てのサービス対象階に対して停止確率により算出した停止時間期待値を用いる(FC10)。これは確率によって予測した予測停止時間に対応している。ここが本実施例の1つのポイントになる。具体的には、到着予測時間を表す変数tarに(i、j)階・方向の停止時間期待値を加算する。 If the floor / direction (i, j) is a service target floor, it is next determined whether or not the number of laps c for creating the predicted arrival time table is two or more (FC07). If c is after the second lap, it is considered that there is no call stop during that lap, and the expected stop time calculated based on the stop probability is used for all service target floors (FC10). This corresponds to the predicted stop time predicted by the probability. This is one point of this embodiment. Specifically, the expected stop time value in the (i, j) floor / direction is added to the variable tar representing the estimated arrival time.
cが1周目の場合は、走査している階・方向(i、j)について、ホール呼び又はかご呼びによる停止があるかどうかを判定して(FC08)、呼び停止がある場合はその階の停止時間をtarに加算する(FC09)。呼び停止が無い場合は、tarに(i、j)階・方向の停止時間期待値を加算する(FC10)。1周目の場合も、呼び停止が無いサービス対象階には停止時間期待値を考慮する点が本発明の1つのポイントになる。尚、各階・方向の停止時間と停止時間期待値は交通流の変化に対応してその都度、値が更新されるようになっている(FC15)。例えば、出勤混雑時は、各階・上方向の停止時間期待値が増加し、昼食前半混雑時は、各階・下方向の停止時間期待値が増加する。 If c is the first lap, determine whether there is a stop due to hall call or car call for the floor / direction (i, j) being scanned (FC08), and if there is a call stop, that floor Is added to tar (FC09). If there is no call stop, the expected stop time value in (i, j) floor / direction is added to tar (FC10). Even in the first round, one of the points of the present invention is that the expected stop time value is taken into consideration for the service target floor where there is no call stop. In addition, the stop time and the expected stop time value of each floor / direction are updated each time corresponding to the change in traffic flow (FC15). For example, the expected stop time for each floor / upward increases when the attendance is busy, and the expected stop time for each floor / downward increases during the first half of lunch.
以上の呼び停止の反映に関係する処理が終了すると、tarに(i、j)階・方向から(i2、j2)階・方向に移動する場合にかかる移動時間tmv(i2、j2)を加算する(FC11)。これによって、停止時間、移動時間が加算されて、移動先の(i2、j2)階・方向への到着予測時間が算出される。iをi2に、jをj2に更新して(FC12)、新たな(i、j)階・方向の到着予測時間表の値tar_table(i、j、c、K)をtarに設定する(FC13)。以上の処理が到着予測時間表計算ルーチンの処理であり、これを図19のループ処理でi、j、c、Kを変えて再帰的に実行することによって、到着予測時間表tar_table(i、j、c、K)が完成する。 When the processing related to reflecting the call stop is completed, the travel time tmv (i2, j2) required for moving from (i, j) floor / direction to (i2, j2) floor / direction is added to tar. (FC11). As a result, the stop time and the travel time are added, and the predicted arrival time in the (i2, j2) floor / direction of the travel destination is calculated. i is updated to i2 and j is updated to j2 (FC12), and the value tar_table (i, j, c, K) of the new (i, j) floor / direction predicted arrival time table is set to tar (FC13). ). The above processing is the processing of the predicted arrival time table calculation routine, and this is recursively executed by changing i, j, c, K in the loop processing of FIG. 19, so that the predicted arrival time table tar_table (i, j , C, K) is completed.
以上の複数周回の到着予測時間表の特徴をまとめると次のようになる。1)各号機毎に方向反転階を設定している。2)1周目の到着予測時間表については発生している呼び(ホール呼び、かご呼び)に対する停止時間と、未発生の呼びに対する停止時間期待値を併用している。3)2周目以降は全て未発生の呼びと考えて停止時間期待値を用いている。4)上記の停止時間及び停止時間期待値は階・方向毎に設定値をもつ。5)上記の停止時間及び停止時間期待値は交通流に対応して値が変化する(更新される)。このような特徴をもつ複数周回の到着予測時間表に基づいて本発明位置実施例における予測軌跡が作成されるため、各号機の特性、呼び停止の状態、交通流状態に応じた緻密でかつ予測精度の高い予測軌跡を作成することができる。その結果、予測軌跡によるかご間隔等の評価を精度良く実施でき、待ち時間を減らすことが可能になる。 The characteristics of the estimated arrival time table for multiple rounds are summarized as follows. 1) A direction reversal floor is set for each unit. 2) For the estimated arrival time table for the first lap, the stop time for a call that has occurred (hall call, car call) and the expected stop time value for a call that has not occurred are used together. 3) For the second and subsequent laps, the expected stop time value is used assuming that all calls have not occurred. 4) The above stop time and expected stop time value have set values for each floor and direction. 5) The above stop time and expected stop time value change (update) according to the traffic flow. Since the predicted trajectory in the position example of the present invention is created based on the predicted arrival time table of multiple laps having such characteristics, it is accurate and predictable according to the characteristics of each unit, call stop status, traffic flow status A highly accurate predicted trajectory can be created. As a result, it is possible to accurately evaluate the car interval or the like based on the predicted trajectory and reduce the waiting time.
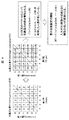
以下では、図21と図22により、複数周回の到着予測時間表の具体例について説明する。まず、図21は、各階・方向における(a)停止時間表、(b)停止確率表、(c)停止時間期待値の表をそれぞれ表している。まず、図21(a)の停止時間表は、各階・方向に対する停止時間を表している。この例では各階・方向共に全て同じ停止時間(8秒)としているが、各階・方向によって異なる停止時間に定めても良い。 Hereinafter, a specific example of the arrival prediction time table for a plurality of rounds will be described with reference to FIGS. 21 and 22. First, FIG. 21 shows a table of (a) stop time table, (b) stop probability table, and (c) expected stop time value for each floor and direction. First, the stop time table of FIG. 21A represents stop times for each floor and direction. In this example, the same stop time (8 seconds) is used for all floors and directions, but different stop times may be set for each floor and direction.
図21(b)の停止確率表は、各階・方向に対する停止確率を表している。例えば、3階上方向の停止確率は0.6となっているが、これはエレベータがリング状に1周回する場合に呼びにより停止する確率が0.6であることを表している。図の例では、上方向と下方向の停止確率が異なるが、これはその時点の交通需要が上方向に止まりやすいことを表している。このように、停止確率はその時点の交通需要(又は交通流)を反映しており、交通需要の変化に応じて、停止確率の各階・方向の値も変わっていく。 The stop probability table in FIG. 21B represents the stop probability for each floor and direction. For example, the probability of stopping in the third floor upward direction is 0.6, which indicates that the probability of stopping by a call when the elevator makes one round in a ring shape is 0.6. In the example in the figure, the probability of stopping in the upward direction is different from that of the downward direction. This indicates that the traffic demand at that time tends to stop in the upward direction. Thus, the stop probability reflects the traffic demand (or traffic flow) at that time, and the value of each floor / direction of the stop probability changes according to the change of the traffic demand.
図21(c)の停止時間期待値表は、各階・方向に対する停止時間期待値を表している。この停止時間期待値は、停止時間に停止確率を乗算することによって算出される。本実施例では、この値をホール呼びやかご呼びが発生していない階に対する予測停止時間(停止時間の期待値)として用いている。 The expected stop time value table in FIG. 21C represents the expected stop time value for each floor and direction. This expected stop time value is calculated by multiplying the stop time by the stop probability. In this embodiment, this value is used as the predicted stop time (expected value of stop time) for the floor where no hall call or car call is generated.
図22は、図21に示した停止時間表、停止確率表、停止時間期待値表を用いて、複数周回の到着予測時間表を計算した具体例を表している。まず、図22の一番左の図(FG01)は、現時点における1号機の状況を表している。1号機(FG05)は2階上方向に位置しており(FG05)、3階に上方向のホール呼び(FG06)、5階にかご呼び(FG07)、5階に下方向のホール呼び(FG08)を受け持っている。従って、1号機は3階上方向、5階上方向、5階方向のそれぞれで停止する。
FIG. 22 shows a specific example in which a predicted arrival time table for a plurality of rounds is calculated using the stop time table, stop probability table, and expected stop time value table shown in FIG. First, the leftmost diagram (FG01) in FIG. 22 shows the situation of the first unit at the present time. Unit 1 (FG05) is located on the second floor (FG05), the third floor is the upward hall call (FG06), the fifth floor is the car call (FG07), and the fifth floor is the downward hall call (FG08). ) Therefore,
この1号機に対する1周目、2周目、3周目の到着予測時間表が、図22のFG02、FG03、FG04の符号で示された表として表されている。まず、1周目の到着予測時間表(FG02)について、現在2階上方向に位置しているため、3階上方向(FG09)から始まり、リング状に1周して2階上方向で終わる形となっている(FG10)。3階上方向の到着予測時間は移動のみのため2秒であり、4階上方向の到着予測時間は3階での停止があるため、8+2=10秒が加算されて12秒となる。5階上方向の到着予測時間は、停止時間期待値によって、4.8+2=6.8秒が加算されて18.8秒になる。6階下方向の到着予測時間は、5階上方向での停止があるため、8+2=10秒が加算されて28.8秒になる。5階下方向の到着予測時間は、停止時間期待値によって、1.6+2=3.6秒が加算されて、32.4秒になる。以下、同様に繰り返すことで、1周目の到着予測時間表を計算できる。この一連の処理は、図20のフローチャートと同じである。2周目の到着予測時間表(FG03)も1周目と同じく、3階上方向(FG11)から始まり、リング状に1周して2階上方向で終わる形となっている(FG12)。この2周目では、全て停止時間期待値を用いて到着予測時間を計算する。例えば、2周目の4階上方向の到着予測時間は、3階上方向の到着予測時間66.8秒に、4.8+2=6.8秒を加算して、73.6秒と算出される。同様にして、3周目の到着予測時間表(FG04)も図のように算出される。 The arrival prediction time table for the first, second, and third laps for the first car is represented as a table indicated by reference numerals FG02, FG03, and FG04 in FIG. First, since the estimated arrival time table (FG02) for the first round is currently located in the second floor upward direction, it starts from the third floor upward direction (FG09), goes around in a ring shape and ends in the second floor upward direction It is shaped (FG10). The predicted arrival time in the third floor upward direction is 2 seconds because of movement only, and the predicted arrival time in the fourth floor upward direction is stopped at the third floor, so that 8 + 2 = 10 seconds is added to become 12 seconds. The estimated arrival time in the upward direction on the fifth floor is 18.8 seconds by adding 4.8 + 2 = 6.8 seconds depending on the expected stop time value. The estimated arrival time in the 6th floor downward is 28.8 seconds, because 8 + 2 = 10 seconds is added because there is a stop in the 5th floor upward. The estimated arrival time in the 5th floor direction is 32.4 seconds by adding 1.6 + 2 = 3.6 seconds depending on the expected stop time value. Thereafter, by repeating the same, the arrival prediction time table for the first round can be calculated. This series of processing is the same as the flowchart of FIG. The second arrival prediction time table (FG03) also starts from the third-floor upward direction (FG11), and goes round in a ring shape and ends in the second-floor upward direction (FG12). In this second round, the estimated arrival time is calculated using all expected stop time values. For example, the predicted arrival time on the fourth floor upward in the second round is calculated as 73.6 seconds by adding 4.8 + 2 = 6.8 seconds to the predicted arrival time 66.8 seconds on the third floor upward. The Similarly, the estimated arrival time table (FG04) for the third round is also calculated as shown in the figure.
次に、図18で説明した有方向時の予測軌跡表作成(図18の処理FA04)の詳細を説明する。この作成処理は後述する図25、図26の処理フローによって表されているが、このフローの詳細を説明する前に、まず、全体の大まかな処理の流れについて、図23と図24を用いて説明する。 Next, details of the predicted trajectory table creation in the directional direction described in FIG. 18 (processing FA04 in FIG. 18) will be described. This creation process is represented by the process flow of FIGS. 25 and 26, which will be described later. Before explaining the details of this flow, first, an overall rough process flow will be described with reference to FIGS. 23 and 24. explain.
まず、図23が最終的に作成される予測軌跡表の例になる。図のように、各号機毎(1号機は符号FH02の欄、2号機は符号FH03の欄)に、各時間(FH01の列)に対する各号機の予測位置(FH04、1号機の場合)、方向(FH05、1号機の場合)のデータが格納されている。このデータを時間軸上でトレースすると、各号機の予測軌跡を作成することができる。
First, FIG. 23 is an example of a predicted trajectory table that is finally created. As shown in the figure, the predicted position of each unit for each time (FH01 column), direction for each unit (unit No. 1 is the field of code FH02,
図23の予測軌跡表は、図22の複数周回の到着予測時間表のデータから作成される。具体的には、隣り合う各階・方向の到着予測時間から内挿によって、各時間における予測位置を算出できる。この算出法をイメージ的に表したものが図24になる。 The predicted trajectory table in FIG. 23 is created from the data of the predicted arrival time table for multiple rounds in FIG. Specifically, the predicted position at each time can be calculated by interpolation from the predicted arrival time of each adjacent floor and direction. FIG. 24 shows an image of this calculation method.
図24において、右側の図は横軸を時間、縦軸を階位置に取ったグラフを表している。このグラフ上の線FF01は、K号機の各階・方向ixとその到着予測時間txとを2次元座標上の点(tx、ix)で表し、この各点を線分でつないだ線になっている。この線FF01が予測軌跡の原形になる。左の図は、現時点のK号機の位置・方向(FF02)を表しており、2階上方向にあることが分かる。従って、右図の線FF01も、時間ゼロ(現時点)では、2階上方向に点FF02がプロットされている。 In FIG. 24, the diagram on the right represents a graph in which the horizontal axis represents time and the vertical axis represents the floor position. A line FF01 on the graph represents each floor / direction ix of the K-unit and its predicted arrival time tx by a point (tx, ix) on a two-dimensional coordinate, and each point is connected by a line segment. Yes. This line FF01 becomes the original shape of the predicted trajectory. The figure on the left shows the current position / direction (FF02) of K-unit, and it can be seen that it is on the second floor. Therefore, the line FF01 in the right diagram also has a point FF02 plotted in the second floor upward direction at time zero (current time).
線FF01において、点FF03は、3階上方向の位置と到着予測時間を表す点であり、点FF04は、その隣の4階上方向の位置と到着予測時間を表す点を示している。点FF03の座標を(tA、iA)、点FF04の座標を(tB、iB)と仮に表すと、この2つの点を結んだ線分上の任意の点(t、ir(t、K))は次式のように表すことができる。 In the line FF01, a point FF03 is a point representing the position in the third floor upward direction and the predicted arrival time, and a point FF04 represents a point representing the position in the next fourth floor upward direction and the predicted arrival time. Assuming that the coordinates of the point FF03 are (tA, iA) and the coordinates of the point FF04 are (tB, iB), an arbitrary point (t, ir (t, K)) on the line segment connecting these two points. Can be expressed as:
ir(t、K)={(iB−iA)/(tB−tA)}(t−tA)+iA…(13)
つまり、tA≦t≦tBという条件において、tが決まれば、その時間tにおけるかごの予測位置ir(t、K)を求めることができる。また、その区間の傾きからかご予測方向jr(t、K)も求めることができる。ここでは、2つの点を3階上方向、4階上方向の位置とその到着予測時間に定めたが、これを1つずつずらしていくと、全ての時間tに対して、対応するかごの予測位置ir(t、K)と方向jr(t、K)を求めることができる。この考え方が、図22にあるような複数周回の到着予測時間表のデータから、図23の予測軌跡表を作成する基本になる。整理すると、図22のような複数周回の到着予測時間表の隣合う2つの階・方向の位置と到着予測時間のデータから、式(13)により、対応する2点間の時間tにおける予測位置ir(t、K)を計算する。これを階・方向を1つずつずらして、複数周回の領域に渡って、tとir(t、K)、jr(t、K)を求めていく。その結果が図23のような予測軌跡表になる。
ir (t, K) = {(iB−iA) / (tB−tA)} (t−tA) + iA (13)
That is, if t is determined under the condition of tA ≦ t ≦ tB, the predicted position ir (t, K) of the car at the time t can be obtained. Further, the predicted car direction jr (t, K) can also be obtained from the slope of the section. Here, the two points are defined as the 3rd floor upward direction, the 4th floor upward position, and the estimated arrival time, but if this is shifted one by one, for all the times t, the corresponding car The predicted position ir (t, K) and the direction jr (t, K) can be obtained. This concept is the basis for creating the predicted trajectory table of FIG. 23 from the data of the predicted arrival time table of multiple rounds as shown in FIG. To summarize, from the data of two adjacent floors / directions and the predicted arrival time in the predicted arrival time table of multiple rounds as shown in FIG. Calculate ir (t, K). The floor and direction are shifted one by one, and t, ir (t, K), and jr (t, K) are obtained over a plurality of circuit areas. The result is a predicted trajectory table as shown in FIG.
以上、予測軌跡表作成の大まかな考え方を説明した。以下、図25、図26により具体的な処理フローについて説明する。図25と図26は予測軌跡表作成のフローを2枚の図に分けて表した図となっている。 In the foregoing, the general idea of creating a prediction trajectory table has been described. Hereinafter, a specific processing flow will be described with reference to FIGS. FIG. 25 and FIG. 26 show the flow of creating the predicted trajectory table divided into two diagrams.
まず、図25について、始めに初期値を設定する(FD01)。ここでは、予測軌跡表の時間変数パラメータtをゼロ、周回数を表す変数パラメータcをゼロに設定する。また、初期階(時間原点を加える特殊処理が必要)の計算を終了したかどうかのフラグ変数zをゼロに設定し、さらに、走査階の位置を表す変数パラメータiを現時点のK号機のかご位置、走査階の方向を表す変数パラメータjを現時点の方向に設定する。次に、走査した階の数を表す変数nをゼロに設定する。このnの意味は、図19で用いたnと同じであり、nの値が2(nmax−1)になると、ちょうど1周分の階を走査したことになる。このnの加算処理は、図26の処理FD24で実行され、1周分に達したかどうか(n=2(nmax−1)になったかどうか)の判定は処理FD13、FD25において実行される。次に、フラグ変数z(がゼロかどうかを判定する(FD03)。フラグ変数zがゼロの場合は最初の階を処理していることになり、この場合のみ異なる処理を実施する。 First, for FIG. 25, initial values are set first (FD01). Here, the time variable parameter t in the prediction trajectory table is set to zero, and the variable parameter c representing the number of laps is set to zero. In addition, the flag variable z indicating whether or not the calculation of the initial floor (requires special processing to add the time origin) is set to zero, and the variable parameter i representing the position of the scanning floor is set to the current car position of the car K The variable parameter j indicating the direction of the scanning floor is set to the current direction. Next, a variable n representing the number of scanned floors is set to zero. The meaning of n is the same as n used in FIG. 19, and when the value of n reaches 2 (n max −1), it means that the floor for one round has been scanned. This addition process of n is executed in process FD24 in FIG. 26, and the determination of whether or not one round has been reached (whether n = 2 (n max −1) has been reached) is executed in processes FD13 and FD25. . Next, it is determined whether the flag variable z (is zero (FD03). If the flag variable z is zero, the first floor is processed, and only in this case, a different process is performed.
フラグ変数zがゼロの場合は、変数iAをi(現在の走査階)、変数jAをj(現在の走査階の方向)の値に設定し(FD04)、さらにtAをゼロに設定する(FD05)。フラグ変数zがゼロでない場合は、変数iAをi、変数jAをjの値に設定し(FD06)、さらにtAを複数周回の到着予測時間表を基に次式のように設定する(FD07)。 When the flag variable z is zero, the variable iA is set to the value of i (current scanning floor), the variable jA is set to the value of j (current scanning floor direction) (FD04), and tA is set to zero (FD05). ). If the flag variable z is not zero, the variable iA is set to i and the variable jA is set to j (FD06), and tA is set as shown in the following equation based on the arrival prediction time table for multiple rounds (FD07). .
tA=tar_table(iA、jA、c、K)…………(14)
つまり、tAをK号機に対する階(iA、jA)のc周目の到着予測時間に設定している。この変数iA、tAは図24に示したiA、tAに対応している(図24の点FF03に対応)。尚、jAはiAに対する方向を表している。つまり2つの点(tA、iA)と(tB、iB)からその間の時間tと到着予測時間ir(t、K)を算出するが、この2点のうちの始点を定めていることになる。
tA = tar_table (iA, jA, c, K) (14)
That is, tA is set to the estimated arrival time of the c-th lap of the floor (iA, jA) with respect to K-unit. These variables iA and tA correspond to iA and tA shown in FIG. 24 (corresponding to point FF03 in FIG. 24). JA represents the direction with respect to iA. That is, the time t and the predicted arrival time ir (t, K) between the two points (tA, iA) and (tB, iB) are calculated, and the starting point of these two points is determined.
次に、現在の走査階の方向jが上方向か否かを判定し(FD08)、上方向であれば変数iBを1減算し(FD09)、下方向ならばiBを1増加させる(FD10)。ここで変数iBは図24に示したiB、に対応している(図24の点FF04)。2つの点のうちの終点の位置を表している。iBがK号機の方向反転階かどうかを判定して(FD11)、方向反転階ならば変数jBをjとは逆の方向に設定し(FD12)、そうでなければ、変数jBをjと同じ方向に設定する(FD27)。さらに、走査した階の数を表す変数nが2(nmax−1)に達したかどうかを判定する(FD13)。この判定は既に述べたように、1周分の階の数の走査を実施しているかどうかの判定になる。走査した階の数が1周未満の場合は、tBをtar_table(iB、jB、c、K)に設定する(FD14)。走査した階の数が1周分の場合は、tBをtar_table(iB、jB、c+1、K)に設定する(FD15)。後者の方は、走査した階の数が1周分となったため、tBをcに1を加えた次の周の到着予測時間テーブルtar_table(iB、jB、c+1、K)より値を参照することを意味している。以降の処理は図26の(イ)へ続く。 Next, it is determined whether or not the current scanning floor direction j is upward (FD08). If it is upward, the variable iB is decremented by 1 (FD09), and if downward, iB is increased by 1 (FD10). . Here, the variable iB corresponds to iB shown in FIG. 24 (point FF04 in FIG. 24). It represents the position of the end point of the two points. It is determined whether iB is the direction reversal floor of K machine (FD11). If it is the direction reversal floor, variable jB is set in the opposite direction to j (FD12). Otherwise, variable jB is the same as j. The direction is set (FD27). Further, it is determined whether or not the variable n representing the number of scanned floors has reached 2 (n max −1) (FD13). As described above, this determination is a determination as to whether or not scanning of the number of floors for one round is being performed. If the number of scanned floors is less than one round, tB is set to tar_table (iB, jB, c, K) (FD14). If the number of scanned floors is one round, tB is set to tar_table (iB, jB, c + 1, K) (FD15). For the latter, since the number of scanned floors is one round, refer to the value from the arrival prediction time table tar_table (iB, jB, c + 1, K) of the next round obtained by adding 1 to tB and c. Means. The subsequent processing continues to (a) of FIG.
図26の(イ)以降の処理を説明する。(tA、iA)、(tB、iB)がそれぞれ設定されたため、式(13)によりir(t、K)の値を算出する(FD16)。これは図24において、線分(tA、iA)−(tB、iB)上の点(t、ir(t、K))の値を式(13)により求めることと同じことを実施している。次に、方向jr(t、K)をjAと同じ方向に定める(FD17)。 The processes after (a) in FIG. 26 will be described. Since (tA, iA) and (tB, iB) have been set, the value of ir (t, K) is calculated by equation (13) (FD16). This is the same as obtaining the value of the point (t, ir (t, K)) on the line segment (tA, iA)-(tB, iB) in FIG. . Next, the direction jr (t, K) is determined in the same direction as jA (FD17).
tに対して、ir(t、K)、jr(t、K)の算出が終わると、tに△tを加算してtを更新し(FD18)、新たなtに対してir(t、K)、jr(t、K)を計算する。ここで、tがtmaxを超えた場合は、予測軌跡表の作成処理を終了する(FD19)。tmaxは予測軌跡の時間幅に対応しており、予め所定値に設定される。tmaxの具体的な値としては、図12で説明した間隔評価時刻trefよりも後が望ましく、従って、最遠方呼びの到着予測時間よりも長いことが望ましい。ある程度、長期的な予測軌跡により制御を実施する場合は少なくともエレベータの1周時間以上(例えば60秒以上)であることが望ましい。 When the calculation of ir (t, K) and jr (t, K) is completed for t, t is updated by adding Δt to t (FD18), and ir (t, K), jr (t, K). Here, when t exceeds tmax , the process of creating the predicted trajectory table is terminated (FD19). t max corresponds to the time width of the predicted trajectory and is set to a predetermined value in advance. The specific value of t max is desirably after the interval evaluation time tref described with reference to FIG. 12, and is therefore preferably longer than the estimated arrival time of the farthest call. In a case where the control is performed with a long-term predicted trajectory to some extent, it is desirable that it is at least one lap time of the elevator (for example, 60 seconds or more).
tがtB以上の場合は(FD20)は、iをiB、jをjBに設定する(FD22)。これは、図24で考えると、tをtAから始めて△tを加算して進めていき、tBを超えた場合に、次の区間へ移る処理を実施することに対応している。またこのとき、フラグ変数zがゼロかどうかを判定して(FD22)、ゼロの場合はzを1にする(FD23)。この処理は時間ゼロを始点する区間を抜けたため、それをフラグ変数zで示す意味がある。区間が変わったということは、到着予測時間表上の走査している階が次の階へ移ったことを意味しており、nを+1加算する(FD24)。さらに、nが2(nmax−1)を超えたかどうかを判定して超えている場合は、周回数を表す変数cを+1加算する。これは、次の周の到着予測時間表に移ることを意味している。 When t is tB or more (FD20), i is set to iB and j is set to jB (FD22). Considering this in FIG. 24, this corresponds to starting t from tA and proceeding by adding Δt, and when tB is exceeded, processing for moving to the next section is performed. At this time, it is determined whether or not the flag variable z is zero (FD22). If it is zero, z is set to 1 (FD23). Since this process has passed through the section starting from time zero, it is meaningful to indicate this by the flag variable z. The fact that the section has changed means that the scanned floor on the estimated arrival time table has moved to the next floor, and n is incremented by 1 (FD24). Further, it is determined whether or not n exceeds 2 (n max −1), and if it exceeds, +1 is added to the variable c representing the number of laps. This means that the next lap estimated arrival time table is entered.
最後に、図18に戻り、図18に示されている無方向時(受持ちホール呼び、かご呼びが共にない場合)の予測軌跡作成処理(図18のFA05)の詳細を説明する。無方向時の予測軌跡作成処理のフロー図は図27に示されている。 Finally, returning to FIG. 18, the details of the predicted trajectory creation process (FA05 in FIG. 18) in the non-direction (when there is no handling hall call or car call) shown in FIG. 18 will be described. FIG. 27 shows a flowchart of the predicted trajectory creation process in the non-direction.
以下、図27の処理を説明する。まず、初期設定として、時間を表す変数パラメータtをゼロに設定する(FE01)。次に、t時間後のK号機のかご位置を表す変数ir(t、K)、かご方向を表す変数jr(t、k)をir(t、K)を現時点のかご位置、jr(t、K)を無方向に設定する(FE02)。tの値に△tを加算して(FE03)、tがtmaxを超えるまで処理FE02、FE03を繰り返す(FE04)。無方向エレは現在の位置に待機を続けることを想定してこのような処理を実施している。 Hereinafter, the process of FIG. 27 will be described. First, as an initial setting, a variable parameter t representing time is set to zero (FE01). Next, a variable ir (t, K) representing the car position of the car K after time t, a variable jr (t, k) representing the car direction, ir (t, K) as the current car position, jr (t, t, k) K) is set to no direction (FE02). Δt is added to the value of t (FE03), and the processes FE02 and FE03 are repeated until t exceeds tmax (FE04). The non-directional electronics carry out such processing on the assumption that the standby at the current position is continued.
以上、図18〜20及び図25〜27に示した一連の処理によって、まず、複数周回の到着予測時間表(図22に一例)のデータが作成され、さらに予測軌跡表(図23に一例)のデータを作成することができる。予測軌跡表のデータは、図23のように、現時点から各時間先の各エレベータ号機の位置と方向を表しており、これが予測軌跡に対応する。本実施例で示した作成方法は、予測精度を上げるためにより実際の状況に即した特徴ある作成法となっており、そのため、予測軌跡も特徴ある形態を示す。以下、図28〜図35により、本実施例により作成できる予測軌跡の特徴について説明する。 As described above, by the series of processes shown in FIGS. 18 to 20 and FIGS. 25 to 27, first, data of a plurality of rounds of arrival prediction time table (an example in FIG. 22) is created, and further a predicted trajectory table (an example in FIG. 23). Data can be created. As shown in FIG. 23, the data of the predicted trajectory table represents the position and direction of each elevator that is ahead of each time from the present time, and this corresponds to the predicted trajectory. The creation method shown in the present embodiment is a characteristic creation method in accordance with the actual situation in order to increase the prediction accuracy, and therefore the prediction trajectory also shows a characteristic form. Hereinafter, the characteristics of the predicted trajectory that can be created according to the present embodiment will be described with reference to FIGS.
図28は、本実施例で示した予測軌跡作成法によって作成した予測軌跡の一例図である。ここでは、右図FI01に、1号機と2号機の2台に対するそれぞれの予測軌跡が示されている。1号機の予測軌跡が実線FI02で表されており、2号機の予測軌跡が破線FI03で表されている。また、現時点の1号機の状態、すなわち、かご位置・方向、ホール呼び、かご呼びの受持ち状況が符号FI04が付けられた最左図で表されており、現時点の2号機の状態が符号FI05が付けられた左図によって表されている。 FIG. 28 is an example of a predicted trajectory created by the predicted trajectory creation method shown in the present embodiment. Here, in the right figure FI01, the respective predicted trajectories for the two cars of the first car and the second car are shown. The predicted trajectory of the first car is represented by a solid line FI02, and the predicted trajectory of the second car is represented by a broken line FI03. In addition, the current state of the first car, that is, the position and direction of the car, the hall call, and the handling status of the car call are shown in the leftmost figure with the reference numeral FI04. The current state of the second car is indicated with the reference numeral FI05. It is represented by the attached left figure.
まず、1号機の予測軌跡FI02を見ると、1周目つまり、2階上方向から1周して1階上方向までの軌跡には、ホール呼び、かご呼びによる停止が、傾斜角度の変化として表れている。しかし、2周目以降は、直線FI106、FI107のように表され、停止確率による停止時間期待値のみで表されている。この結果、図のように、1周目の軌跡に対して、2周目以降の軌跡は、各周で同じ形状となる。また、停止確率を反映しているため、2周目以降の軌跡に対する上方向の傾き(FI06)と、下方向の傾き(FI07)は異なっている。軌跡の傾きは停止確率を反映しており、停止確率は交通流の変化に対応して値が設定され、その傾きは交通流に応じて変わる。停止確率を反映させないと、予測軌跡の傾きはエレベータの速度のみで決まるため、上方向と下方向の軌跡の傾きは同じ又は対称形になる。尚、図28の予測軌跡においては、停止時間、停止確率、停止時間期待値のデータは、図21に示されたデータを用いている。
First, looking at the predicted trajectory FI02 of
また、それぞれの予測軌跡は、各周共に(2週目以降も)、最上階と最下階で方向反転する軌跡を示している。このように端階(最上階又は最下階)で方向反転する軌跡を作成するようにした理由の一つは、各号機の予測軌跡による評価が時間的等間隔状態を狙ったものであり、これは特に混雑時に有効である。混雑時の場合は、ホール呼び、かご呼びが多数発生することが予想され、結果として実際の運行軌跡も図28のような端階で方向反転する軌跡になる。従って、予測軌跡も端階で方向反転する軌跡となるように作成している。 In addition, each predicted trajectory indicates a trajectory whose direction is reversed between the uppermost floor and the lowermost floor for each circumference (after the second week). One of the reasons for creating a trajectory that reverses direction on the end floor (top floor or bottom floor) in this way is that the evaluation based on the predicted trajectory of each unit is aimed at a time-equally spaced state, This is particularly effective during congestion. In the case of congestion, it is expected that many hall calls and car calls will be generated, and as a result, the actual operation trajectory also becomes a trajectory whose direction is reversed at the end floor as shown in FIG. Therefore, the predicted trajectory is created so as to be a trajectory whose direction is reversed at the end floor.
図29は、閑散時に重点を置いた待機するような予測軌跡の説明図である。閑散時には、図28のように常に端階で反転する予測軌跡である必要はなく、図29のように、呼びサービスが終了する階又は時間を予測して、それ以降はその位置で待機するような予測軌跡を作成してもよい。すなわち、予測軌跡作成手段は、割当てられたホール呼び及びかご呼びを持たないエレベータの予測軌跡を、時間軸に対して平行となるように作成するのである。この場合は、その時の交通需要から最終かご呼び階を推定して、それ以降はその位置で待機する予測軌跡を作成する。例えば、図29の場合は、1号機(予測軌跡FQ01)は2階下方向が最終かご呼びになると予測して、それ以降は2階下方向で待機する軌跡(FQ02)となっている。同様に、2号機(予測軌跡FQ03)は5階上方向が最終かご呼びになると予測して、5階上方向で待機する軌跡(FQ04)となっている。 FIG. 29 is an explanatory diagram of a predicted trajectory that waits with an emphasis on a quiet time. When it is quiet, it is not always necessary to have a predicted trajectory that reverses at the end floor as shown in FIG. 28. As shown in FIG. 29, the floor or time at which the call service ends is predicted, and after that, it waits at that position. A predicted trajectory may be created. That is, the predicted trajectory creation means creates a predicted trajectory of an elevator that does not have the assigned hall call and car call so as to be parallel to the time axis. In this case, the final car call floor is estimated from the traffic demand at that time, and after that, a predicted trajectory waiting at that position is created. For example, in the case of FIG. 29, the first car (predicted trajectory FQ01) predicts that the second floor down direction will be the final car call, and thereafter, the trajectory (FQ02) stands by in the second floor down direction. Similarly, the second car (predicted trajectory FQ03) is a trajectory (FQ04) waiting in the upward direction on the fifth floor, predicting that the upward direction on the fifth floor will be the last car call.
図28に戻り、図28の1号機の予測軌跡FI02、2号機の予測軌跡FI03を見ると、現時点では位置的にはほぼ等間隔に離れているが、その後の受持ち状況と停止時間期待値の状況によって、今後、接近していくことが予測されている。このように予測軌跡を描くことによって、各号機の予測軌跡を作成することによって先の時間で発生する状況を事前に予測することができ、この情報をホール呼び割当てに反映させることによって、実際の軌跡を適正に制御することが可能になる。例えば、1号機の予測軌跡FI02と2号機の予測軌跡FI03の軌跡間の間隔(軌跡で挟まれた面積によって定量評価が可能)を各号機の割当て前後で評価することによって、2つの号機の今後の乖離度合いを評価することができる。また、2台の予測軌跡の間隔の傾向(時間的な変化)を見ることによって、軌跡の間隔の時間的変化(例えば、だんご運転状態に近づきつつあるなど)を評価することができる。
Returning to FIG. 28, when looking at the predicted trajectory FI02 of
以上、述べたように、本実施例による予測軌跡は、発生している呼びによる停止と未発生の呼びに対する確率的な停止の2つを考慮して、両者を実際に即した方法で軌跡に反映させているため、予測精度の高い予測軌跡を作成することができる。 As described above, the predicted trajectory according to the present embodiment takes into account the probable stop for a call that has occurred and the probabilistic stop for a call that has not occurred. Since this is reflected, a prediction trajectory with high prediction accuracy can be created.
図30は本実施例で示した作成法による予測軌跡の第2の例を表している。1号機の予測軌跡が実線FJ02で表されており、2号機の予測軌跡が破線FJ03で表されている。また、現時点の1号機の状況−かご位置・方向、ホール呼び、かご呼びの受持ち状況が符号FJ04が付けられた図で表されており、現時点の2号機の状況が符号FJ05が付けられた図によって表されている。
FIG. 30 shows a second example of the predicted trajectory by the creation method shown in this embodiment. The prediction trajectory of
図30の符号FJ04から分かるように、1号機は、現時点では呼びサービスを持たず4階で待機状態にある。従って、1号機の予測軌跡FJ02は、4階で待機状態を続ける軌跡となる。この無方向号機の軌跡は、まず、図18に示した予測軌跡作成の全体処理フローによって無方向号機は無方向時の予測軌跡表作成処理(図18のFA05)に飛ばされて、図27に示した無方向号機の処理フローによって詳細データが作成される。
As can be seen from the code FJ04 in FIG. 30,
図31は本実施例で示した作成法による予測軌跡の第3の例を表している。この例では、停止確率が各階・方向で異なる場合の予測軌跡の例を表している。図31の左側の図(FK04)は、現時点のかご位置と方向を表しており、1号機(FK05)、2号機(FK06)はそれぞれ図に示す位置・方向にある。尚、この図(FK04)では各号機が受け持っている呼びは省略している。 FIG. 31 shows a third example of the predicted trajectory by the creation method shown in this embodiment. This example shows an example of a predicted trajectory when the stop probability is different for each floor and direction. The left side of FIG. 31 (FK04) shows the current car position and direction, and the first car (FK05) and the second car (FK06) are in the positions and directions shown in the figure. In this figure (FK04), the calls handled by each unit are omitted.
図31の右側の図(FK01)が2台のエレベータ号機の予測軌跡を表している。1号機の予測軌跡は実線FK02、2号機の予測軌跡は破線FK03で表されている。図31の予測軌跡が図28の予測軌跡と異なる点は、図31の予測軌跡では各階・方向に対する停止確率が異なるため、各階・方向毎に予測軌跡の傾きが異なる点にある。通常、各階・方向での利用者の動向は異なるため、停止確率も異なる。従って、各階・方向毎にそれぞれの停止確率を反映させた図31の予測軌跡の形状が最も精度の良い軌跡といえる。さらに、各階・方向の停止確率は、交通流が変わればそれぞれも変わるため、交通流の変化を反映して多様な形状の予測軌跡が作成されることになる。 The figure on the right side of FIG. 31 (FK01) represents the predicted trajectories of the two elevators. The predicted trajectory of the first car is represented by a solid line FK02, and the predicted trajectory of the second car is represented by a broken line FK03. The difference between the predicted trajectory of FIG. 31 and the predicted trajectory of FIG. 28 is that the predicted trajectory of FIG. 31 has a different probability of stop for each floor / direction, and therefore the inclination of the predicted trajectory differs for each floor / direction. Usually, the trend of users on each floor and direction is different, so the stop probability is also different. Therefore, it can be said that the shape of the predicted trajectory in FIG. 31 reflecting the respective stop probabilities for each floor and direction is the most accurate trajectory. Furthermore, since the probability of stopping at each floor and direction changes as the traffic flow changes, prediction trajectories of various shapes are created reflecting the change in the traffic flow.
さらに、図31のような階・方向別の停止確率に基づく予測軌跡では、各階・方向毎に正確に予測軌跡の形状が定められるため、各号機の予測軌跡の間隔を評価する場合もより精度の高い評価が可能となる。従って、このような階・方向別の停止確率に基づく予測軌跡を用いることによって、間隔評価の精度が上がり、間隔を制御する上でより適正な割当てが可能になり、長待ちを減少させることができる。 Furthermore, in the predicted trajectory based on the stop probability for each floor / direction as shown in FIG. 31, the shape of the predicted trajectory is accurately determined for each floor / direction, so that it is more accurate when evaluating the predicted trajectory interval of each unit. High evaluation is possible. Therefore, by using such a predicted trajectory based on the stop probability for each floor and direction, the accuracy of interval evaluation is improved, more appropriate allocation is possible in controlling the interval, and long waiting time can be reduced. it can.
図32は本実施例で示した作成法による予測軌跡の第4の例を表している。図32の予測軌跡が、図28の予測軌跡と異なる点は、予測軌跡上の呼び停止及び停止確率で決まる確率的な停止の要素を明示するような形状としている点にある。図32の予測軌跡FL02において、呼び停止の部分は1周目の5階・下方向の軌跡の水平部の要素(FL03)で表されており、確率的な停止の部分は1周目の4階・上方向の軌跡の水平部の要素(FL04)で表されている。斜めの線分で表されている要素(FL05)は下向きの移動状態を表している。 FIG. 32 shows a fourth example of the predicted trajectory by the creation method shown in this embodiment. The difference between the predicted trajectory in FIG. 32 and the predicted trajectory in FIG. 28 is that the probabilistic stop element determined by the call stop and stop probability on the predicted trajectory is shaped. In the predicted trajectory FL02 of FIG. 32, the call stop portion is represented by the horizontal part element (FL03) of the fifth-floor / downward trajectory of the first round, and the stochastic stop portion is 4 in the first round. It is represented by the element (FL04) in the horizontal part of the trajectory in the upper and lower directions. An element (FL05) represented by an oblique line segment represents a downward movement state.
図32に示された予測軌跡の長所は、呼びによる停止、確率的な停止、移動の3つの要素を詳細に分けることでより精度の高い、実際の形状を反映した予測軌跡を作成できる点にある。実際のエレベータの動きは、図28のような時間軸上で斜めの線で表される軌跡ではなく、停止があるため、水平部も含んだ構成となる。従って、図32の予測軌跡の方がより実態を反映した軌跡となる。また、図32の予測軌跡は、呼び停止、確率的な停止、移動の3要素を視覚的に容易に見分けることができる点も長所に挙げられる。このような形状によって、どこで呼び停止が発生しているか、各階・方向の停止確率の状況はどうなっているか、呼び停止や停止確率が軌跡の動向にどう影響しているかが一目で理解できる。例えば、1号機と2号機の予測軌跡が将来的にだんご運転になることが示された場合、それが停止確率の階・方向における偏りが原因なのか、呼び停止の受持ち方が原因なのかを理解することができる。
The advantage of the predicted trajectory shown in FIG. 32 is that it is possible to create a predicted trajectory that reflects the actual shape with higher accuracy by dividing the three elements of stop by call, probabilistic stop, and movement in detail. is there. The actual movement of the elevator is not a trajectory represented by an oblique line on the time axis as shown in FIG. 28, but has a configuration including a horizontal portion because there is a stop. Therefore, the predicted trajectory in FIG. 32 is a trajectory that reflects the actual situation. In addition, the predicted trajectory of FIG. 32 also has an advantage that the three elements of call stop, probabilistic stop, and movement can be easily distinguished visually. With such a shape, it is possible to understand at a glance where the call stop occurs, what the situation of the stop probability of each floor / direction is, and how the call stop and stop probability influence the trend of the trajectory. For example, if the predicted trajectory of
図32のような予測軌跡に対しては、予測軌跡表のデータ作成を停止、確率的停止、移動に分けて作成すればよい。例えば、複数周回の到着予測時間表を作成する過程で、呼び停止時間又は停止時間期待値を加算し、移動時間を加算するというプロセスを通るが、それぞれを分けてデータに記憶させるようにすればよい。 For the predicted trajectory as shown in FIG. 32, the data creation of the predicted trajectory table may be divided into stop, probabilistic stop, and movement. For example, in the process of preparing the arrival time table for multiple laps, it passes through the process of adding the call stop time or the expected stop time and adding the travel time, but if each is stored separately in the data Good.
図33は、本実施例で示した予測軌跡作成法による予測軌跡の第5の例を表している。図33の予測軌跡が、図28の予測軌跡と異なる点は、図33の予測軌跡は上方向、下方向の方向別の大まかな軌跡で表されている点にある。具体的に図33の予測軌跡は、図28の予測軌跡の最上階の点と最下階の点をつなぐことによって作成できる。これは各階・方向の呼び停止、確率的な停止、移動の時間を方向別に積算したデータを基にした予測軌跡に対応している。 FIG. 33 shows a fifth example of the predicted trajectory by the predicted trajectory creation method shown in the present embodiment. The difference between the predicted trajectory in FIG. 33 and the predicted trajectory in FIG. 28 is that the predicted trajectory in FIG. 33 is represented by a rough trajectory for each of the upward and downward directions. Specifically, the predicted trajectory in FIG. 33 can be created by connecting the points on the uppermost floor and the points on the lowermost floor of the predicted trajectory in FIG. This corresponds to a predicted trajectory based on data obtained by integrating call stop, probabilistic stop, and travel time of each floor / direction by direction.
図33の予測軌跡は、形状は大まかであるが、必要なデータは各周回における最上階と最下階の到着予測時間で良いため、必要なデータ数を大幅に圧縮できる利点がある。従って、安価ではあるが処理能力が低いマイコンを使う場合には、このような簡易版の予測軌跡の適用が有効といえる。 The predicted trajectory in FIG. 33 has a rough shape, but the necessary data may be the predicted arrival times of the uppermost floor and the lowermost floor in each lap, so that the number of necessary data can be greatly reduced. Therefore, when using a microcomputer that is inexpensive but has low processing capability, it can be said that the application of such a simplified predicted locus is effective.
また、ホール呼び割当てを実施毎に、割当て制御内容の履歴として、予測軌跡データ(予測軌跡表)を記録して残す場合、例えば、1週間分のデータの履歴を記録しようとすると場合など、その記録量は膨大なものとなる。そのような場合には、図33のような予測軌跡の形でデータを保存しておくと、データ記録量を大幅に圧縮することができる。制御で実際に使う予測軌跡は、図28又は図31のような詳細な形状にして、データの保存用途としてのみ図33の予測軌跡を用いることも考えられる。この場合は、制御においては予測軌跡の精度を落とさずに、保存用の予測軌跡のデータを圧縮することができる。このように保存・記録したデータは後になって割当て評価をチェックする場合に、どのような軌跡を予測したのかをデータを基に分析することができ、有効である。予測軌跡データを記録するための実施例構成については、図47を参照して後述する。 In addition, every time hall call allocation is performed, when the predicted trajectory data (predicted trajectory table) is recorded and left as a history of allocation control contents, for example, when trying to record a history of data for one week, The amount of recording becomes enormous. In such a case, if the data is stored in the form of a predicted locus as shown in FIG. 33, the data recording amount can be greatly reduced. It is also conceivable that the predicted trajectory actually used in the control has a detailed shape as shown in FIG. 28 or 31 and that the predicted trajectory in FIG. 33 is used only for data storage purposes. In this case, the predicted trajectory data for storage can be compressed without reducing the accuracy of the predicted trajectory in the control. The data stored and recorded in this manner is effective because it can be analyzed based on the data of what kind of trajectory is predicted when the allocation evaluation is checked later. An embodiment configuration for recording the predicted trajectory data will be described later with reference to FIG.
図34は、本実施例で示した予測軌跡作成法による予測軌跡の第6の例を表している。図34の予測軌跡が、図28の予測軌跡と異なる点は、図34の予測軌跡は高層ゾーン(途中にある複数階の不停止階のゾーン)に対応した予測軌跡である点にある。 FIG. 34 shows a sixth example of a predicted trajectory by the predicted trajectory creation method shown in the present embodiment. The prediction trajectory of FIG. 34 differs from the prediction trajectory of FIG. 28 in that the prediction trajectory of FIG. 34 is a prediction trajectory corresponding to a high-rise zone (a zone of a plurality of non-stop floors in the middle).
図34(a)は、図28と同じ方法に従って、高層ゾーンでの予測軌跡を作成した例を示している。図34(a)の右側の図は、現在のかご位置・方向を表しており、図の斜線部FN02の領域(2階から10階までの8階床分)が高層ゾーンとなっている。図34(a)の右図のエレベータに対する予測軌跡が図34(a)の左図の予測軌跡FN01になる。高層ゾーンでは、呼び停止が発生しないため、停止確率はゼロであり、予測軌跡の傾きは急でかつ一定の傾きとなっている。この図34(a)に示された予測軌跡は全階床を表示した場合の例になる。 FIG. 34A shows an example in which a predicted trajectory in a high-rise zone is created according to the same method as FIG. The diagram on the right side of FIG. 34 (a) shows the current car position / direction, and the area of the hatched portion FN02 (for the 8th floor from the 2nd floor to the 10th floor) is a high-rise zone. The predicted trajectory for the elevator in the right diagram in FIG. 34A is the predicted trajectory FN01 in the left diagram in FIG. In the high-rise zone, since call stop does not occur, the stop probability is zero, and the inclination of the predicted trajectory is steep and constant. The predicted trajectory shown in FIG. 34 (a) is an example when all floors are displayed.
これに対して、図34(b)は、高層ゾーンの部分を1つの階にまとめて表した場合を示している。具体的には、図34(b)の右図のように、2階から10階までを1つの階FN04によって表している。この場合の予測軌跡は、図34(b)の左図の軌跡FN03のようになる。図のように、高層ゾーンを1つの階で表しても、そのゾーンの通過時間を合わせれば、正確に予測軌跡を表すことができる。ゾーンの通過時間が一致していることは、図34(a)の高層ゾーンの通過時間と図34(b)の高層ゾーンの通過時間が一致していることより確認できる。 On the other hand, FIG. 34 (b) shows a case where the high-rise zone portions are collectively represented on one floor. Specifically, as shown in the right diagram of FIG. 34 (b), the second floor to the tenth floor are represented by one floor FN04. The predicted trajectory in this case is as shown in the trajectory FN03 in the left diagram of FIG. As shown in the figure, even if the high-rise zone is represented by one floor, the predicted trajectory can be accurately represented by matching the passing time of the zone. It can be confirmed that the passage times of the zones match from the fact that the passage times of the high zone in FIG. 34 (a) and the passage times of the high zone in FIG. 34 (b) match.
図34(b)のような予測軌跡の利点は、まず、冗長なデータを削れる点にある。例えば、図の例では、2階から10階は呼びが全く発生しないため、この間の軌跡の情報は冗長である。重要な領域はその上側と下側にある階であり、図34(b)のような軌跡の表し方によって、重要な軌跡の部分をクローズアップして、軌跡を評価することができる。また2階から10階のデータを削れるため、データを圧縮する効果もある。 The advantage of the predicted trajectory as shown in FIG. 34B is that redundant data can be removed first. For example, in the example shown in the figure, since no calls are generated from the second floor to the tenth floor, the trajectory information between them is redundant. The important areas are the floors on the upper and lower sides, and the locus can be evaluated by closing up the important locus portion by the way of representing the locus as shown in FIG. Further, since data from the second floor to the tenth floor can be deleted, there is an effect of compressing the data.
図35は本実施例で示した作成法による予測軌跡の第7の例を表している。図35の予測軌跡が、図28の予測軌跡と異なる点は、図35の予測軌跡が各エレベータ号機のサービス対象階ゾーンが不揃いである場合の予測軌跡である点にある。具体的には、1号機のサービス対象階ゾーンが一番左側の図FP03のように、B1階から14階までの全階床であるのに対して、2号機のサービス対象階ゾーンは左から2番目の図FP04のように、2階から10階までの範囲となっている。このように、各号機のサービス対象階ゾーンが不揃いであっても、右図の予測軌跡のように各号機のサービス対象階ゾーンを反映させた予測軌跡が作成されている。具体的には、1号機の予測軌跡は軌跡FP01であり、2号機の予測軌跡は軌跡FP02となっている。
FIG. 35 shows a seventh example of the predicted trajectory by the creation method shown in this embodiment. The difference between the predicted trajectory in FIG. 35 and the predicted trajectory in FIG. 28 is that the predicted trajectory in FIG. 35 is a predicted trajectory when the service target floor zones of the elevators are uneven. Specifically, the service target floor zone of
このような予測軌跡を作成できる理由は、図20に示された到着予測時間表計算ルーチンのフローチャートにおいて、各号機毎に方向反転階を識別している点にある。図35の例では、1号機の方向反転階はB1階と14階であり、2号機の方向反転階は2階と10階のように、号機毎に方向反転階を識別することによって、不揃い階に対応した予測軌跡を作成することができる。その結果、各号機の特性に応じたより正確な予測軌跡を作成することが可能になる。
The reason why such a predicted trajectory can be created is that the direction inversion floor is identified for each unit in the flowchart of the predicted arrival time table calculation routine shown in FIG. In the example of FIG. 35, the direction reversal floor of
以上、予測軌跡作成法の詳細(図12の予測軌跡演算部で実施)と予測軌跡の作成例を示した。本実施例による予測軌跡作成法は、予測精度を上げるためにより実態に即した(実態を反映させた)作成方法となっており、その結果、図28〜図35に示すような多様でかつ精度の高い予測軌跡を作成することができる。そのため、予測軌跡間の間隔評価などの評価精度が良く、より適切にかご間隔を制御(等間隔性を考慮した制御)した割当てが可能となり、かご間隔が適正に保たれて、長待ちの発生を抑制することができる。 The details of the predicted trajectory creation method (implemented by the predicted trajectory calculation unit in FIG. 12) and an example of creating a predicted trajectory have been described above. The prediction trajectory creation method according to the present embodiment is a creation method that is more realistic (reflects the actual situation) in order to increase the prediction accuracy, and as a result, has a variety of accuracy as shown in FIGS. A high predicted trajectory can be created. Therefore, the evaluation accuracy such as the evaluation of the interval between the predicted trajectories is good, the allocation of the car interval can be controlled more appropriately (control considering the uniform interval), the car interval is kept appropriate, and the long wait occurs. Can be suppressed.
図36〜図38は予測間隔値算出処理についての詳細を表している。以下、図36のフローチャートを基にして、予測間隔値の計算法を説明する。まず、先に作成法を説明した各かごの予測ルートを用いて、間隔評価時刻trefにおける各かごの位相時間値tpを算出する(図36のST801)。ここで、間隔評価時刻trefは、既に述べた設定法により設定されている。各かごの位相的時間値の算出の詳細ついて、図37、図38を用いて説明する。 36 to 38 show details of the prediction interval value calculation process. Hereinafter, the calculation method of the prediction interval value will be described based on the flowchart of FIG. First, the phase time value tp of each car at the interval evaluation time tref is calculated using the predicted route of each car described above for the creation method (ST801 in FIG. 36). Here, the interval evaluation time tref is set by the setting method already described. Details of the calculation of the phase time value of each car will be described with reference to FIGS.
図37は予測ルートから予測間隔値を計算する様子を表している。ここでは、3台のエレベータによる群管理を示しており、図37の左側の図は現時点におけるエレベータかごの位置と方向をリング表現で表している。図37の左側の図より、1号機610は7階と8階の間を上方向に移動しており、2号機611は5階と6階の間を上方向に移動している。また、3号機612は3階から2階へ下方向に移動している。図37の右側の図は横軸を時間、縦軸を位置にとったグラフ上での各かごの予測ルートを表している。時間軸の原点は現時点を表す。現時点での1号機のかご位置600、2号機のかご位置601、3号機のかご位置602がそれぞれ表されており、その位置からの各かごの予測ルートがそれぞれ表されている(1号機の予測ルート603、2号機の予測ルート604、3号機の予測ルート605)。各かごの予測ルートから間隔評価時刻tref(図37の606)におけるかご位置を予測することができる。例えば、1号機の間隔評価時刻trefにおける予測位置・方向は7階上方向となり(図37の607)、2号機の予測位置・方向は4階上方向(図37の609)、3号機の予測位置・方向は6階下方向(図37の608)になる。このような各かごの予測位置・方向から各かご間の予測間隔を求めることができる。
FIG. 37 shows how the prediction interval value is calculated from the prediction route. Here, the group management by three elevators is shown, and the diagram on the left side of FIG. 37 represents the position and direction of the elevator car at the present time in a ring expression. 37, the
図38は、予測間隔を求めるプロセスを表している。図38の左側の図は、図37に示している間隔評価時刻trefにおける3台のかごの予測位置・方向を表している。図38の右側の図は、横軸が位相的時間値、縦軸が位置を表している。ここで、位相的時間値とは、1周の時間(周期と同じ)で正規化した時間の値のことを意味している(位相と同じような意味を持つ時間の値を意味している)。この位相的時間値は、現時点の交通流に対するエレベータかごの平均1周軌跡(図38の右図の703)を基準にして求める。図38の左図にある各かごの予測位置を平均1周軌跡上に写像することにより、位相的時間値に変換できる。例えば、1号機705の時間的位相値は、図38の平均1周軌跡703からtp(k=1)のように求めることができ、同様にして、2号機704の時間的位相値はtp(k=2)、3号機706の時間的位相値はtp(k=3)のように求めることができる。このように、予測位置から時間的位相値に変換する理由は、各かごの間隔を時間を単位にした時間的間隔値で求めることにある。
FIG. 38 shows a process for obtaining the prediction interval. The diagram on the left side of FIG. 38 shows the predicted positions and directions of the three cars at the interval evaluation time tref shown in FIG. In the diagram on the right side of FIG. 38, the horizontal axis represents the phase time value, and the vertical axis represents the position. Here, the phase time value means a time value normalized by the time of one round (same as the period) (meaning a time value having the same meaning as the phase). ). This topological time value is obtained on the basis of an average one-round locus (703 in the right diagram of FIG. 38) of the elevator car with respect to the current traffic flow. By mapping the predicted position of each car shown in the left diagram of FIG. 38 on the average one-round locus, it can be converted into a topological time value. For example, the temporal phase value of the
各かごの予測位置から時間的位相値を求めて(図36のST801)、次に、各かごを位相的時間値の大きさの順に順位付けを行う(図36のST802)。例えば、図38の場合、各かごの位相的時間値の大きさは次のようになっている。 A temporal phase value is obtained from the predicted position of each car (ST801 in FIG. 36), and then each car is ranked in order of the magnitude of the topological time value (ST802 in FIG. 36). For example, in the case of FIG. 38, the magnitude of the topological time value of each car is as follows.
tp(k=2)<tp(k=1)<tp(k=3)………(15)
従って、順位を表すラベル変数をmで表すと、m=1となるかごが2号機、m=2となるかごが1号機、m=3となるかごが3号機になる。
tp (k = 2) <tp (k = 1) <tp (k = 3) (15)
Therefore, when the label variable representing the rank is represented by m, the car with m = 1 is No. 2, the car with m = 2 is No. 1, and the car with m = 3 is No. 3.
この位相的時間値の順位mの順に従って、各かご間の予測間隔値Bmを求める(ST803)。例えば、図38の場合、m=1とm=2のかご間の予測間隔値がBm=1となり(図38の区間707の間隔値に対応)、m=2とm=3のかご間の予測間隔値Bm=2(図38の区間708の間隔値に対応)となる。同様に、m=3とm=1のかご間の予測間隔値がBm=3(図38の区間709の間隔値に対応)となる。数式で表すと、各予測間隔値はそれぞれ次のように表される。
A predicted interval value Bm between the cars is obtained in accordance with the order of the order m of the topological time values (ST803). For example, in the case of FIG. 38, the prediction interval value between the cars of m = 1 and m = 2 is Bm = 1 (corresponding to the interval value of the
Bm=1=tp(k=1)−tp(k=2)………(16)
Bm=2=tp(k=3)−tp(k=1…………(17)
Bm=3={T−tp(k=3)}+tp(k=2)………(18)
ここで、式(18)のTは平均1周軌跡の周期を表している。
Bm = 1 = tp (k = 1) −tp (k = 2) (16)
Bm = 2 = tp (k = 3) -tp (k = 1... (17)
Bm = 3 = {T-tp (k = 3)} + tp (k = 2) (18)
Here, T in Expression (18) represents the period of the average one-round locus.
以上のように、現時点の交通流に対する平均1周軌跡を基にして、位相的時間値によって、各かごの予測間隔を求めているため、その時の交通流に応じたより適正な時間的間隔を求めることができる。例えば、昼食開始時には下方向へ向かうホール呼びが多数発生するため、平均1周軌跡は下方向側の線分の傾きが緩やかな形となり、1階当たりの位相的時間値が上方向側と比べて長くなる。従って、例えば2台のかごが距離的に2階床離れていた場合、それが上方向である場合と下方向である場合とでは間隔値が異なるように評価される。下方向の方が、停止の可能性が高くなるため、同じ2階床でもより離れていると評価される。このように、交通流に応じて適正に時間的間隔の評価ができる。 As described above, since the predicted interval of each car is obtained by the topological time value based on the average one-round locus for the current traffic flow, a more appropriate time interval corresponding to the traffic flow at that time is obtained. be able to. For example, since many hall calls going downward occur at the start of lunch, the average one-round trajectory has a gentle slope in the line segment on the lower side, and the topological time value per floor is higher than that on the upper side. Become longer. Therefore, for example, when two cars are separated by two floors in terms of distance, the interval value is evaluated to be different between the case where it is upward and the case where it is downward. The downward direction has a higher possibility of stopping, so it is evaluated that the same second floor is further away. Thus, the time interval can be evaluated appropriately according to the traffic flow.
図39は、3台群管理の場合のエレベータかごの時間軸上での軌跡を、本実施例による制御実施前の結果と本実施例による制御実施後の結果で比較したものである。図39(a)は、本実施例による制御実施前のエレベータかごの時間軸上での軌跡を表している。この軌跡を見ると、3台の軌跡が所々で重なっており、効率の悪いだんご運転が発生していることが分かる。 FIG. 39 is a comparison of the trajectory on the time axis of the elevator car in the case of three vehicle group management between the result before the control according to this embodiment and the result after the control according to this embodiment. FIG. 39A shows a trajectory on the time axis of the elevator car before the control according to this embodiment. Looking at this trajectory, it can be seen that the three trajectories overlap in some places and inefficient dango driving is occurring.
一方、図39(b)は、本実施例による制御実施後のエレベータかごの時間軸上での軌跡を表している。3台のかごの軌跡は、まるで、3相交流のように等しい位相、即ち時間的等間隔な状態を維持していることが分かる。このように、時間的等間隔な状態を維持できるため、どの階・方向にホール呼びが発生してもすぐにエレベータかごが到着することができ、長い待ち時間の発生を抑えることができる。 On the other hand, FIG. 39B shows a trajectory on the time axis of the elevator car after the control according to the present embodiment. It can be seen that the trajectories of the three cars maintain the same phase as in the three-phase alternating current, that is, the time-equal state. In this way, since the time equidistant state can be maintained, the elevator car can arrive immediately regardless of the floor / direction of the hall call, and the occurrence of a long waiting time can be suppressed.
ここで、図17に戻って、図2に示したかご間隔評価値演算部4に対する別の構成例を説明する。図17の構成は、理想とする時間的等間隔状態のルート(軌跡)である目標ルート(目標軌跡)を基準にして、目標ルートと予測ルート(予測軌跡)とのルート間の偏差によってかご間隔を評価する方法となっている。この目標ルートを用いることが、図17に示された構成の特徴となる。
Here, returning to FIG. 17, another configuration example for the car interval evaluation
目標ルートの詳細は後述するが、図17の構成では、目標ルートが時間的等間隔化への詳細な基準となるため、広い時間領域に対して各かご等間隔性を評価できる。その結果、図12の構成の場合以上の効果を得ることができる。 Although details of the target route will be described later, in the configuration of FIG. 17, the target route becomes a detailed reference for equalization in time, so that each car can be equally spaced over a wide time domain. As a result, the above effects can be obtained with the configuration of FIG.
まず、入力情報(図2の入力情報蓄積部2より入力)を基に、目標ルート作成部410において理想とする時間的等間隔状態のルートが各かごに対して作成され、さらに予測ルート作成部411において各かごに対する予測ルートが作成される。予測ルートの作成法は既に説明した方法と同じであり、目標ルートの作成は、図42〜図44を用いて後述する。ルート偏差演算部414では、各かごに対して、目標ルートと予測ルートのルート同士の偏差が計算される。この偏差は例えば2つのルート間の差の面積によって計算できる。かご間隔評価値算出部415では、算出されたルート間偏差を基に各かごに対するかご間隔評価値(各かごをホール呼びに仮割当てした場合のかご間隔評価値)が計算される。このかご間隔評価値を基に、最も評価値の良いかごに、ホール呼びを割当てる。平均1周時間演算部412では入力情報を基に平均1周時間が算出されて、この平均1周時間Tを基にして、調整基準時間設定部413で調整基準時間の値が定められる。設定された調整基準時間は目標ルート作成時に使用される。この詳細についても、図42〜図44を用いて後述する。
First, based on the input information (input from the input
以下、図17に示した目標ルートによる割当て評価制御(将来呼びに対する評価関数の一つ)の詳細を説明する。図17にて既に説明したように、目標ルートによる割当て評価制御は、目標ルート作成部410、予測ルート作成部411、ルート間偏差算出部412の3つの要素が基本要素になる。
Hereinafter, details of the allocation evaluation control (one of evaluation functions for future calls) based on the target route shown in FIG. 17 will be described. As already described with reference to FIG. 17, the allocation evaluation control based on the target route is based on three elements: the target
まず、目標ルート制御の動作イメージ(制御原理)を、図40、図41を基にして説明する。図40は、目標ルート制御の制御イメージの一例を表した図である。図において、左側の図はビル内の昇降路断面(垂直方向)とその中を動くエレベータかごの状態をイメージ的に表した図である。右側の図は、横軸(A01)が時間軸、縦軸(A02)がビルの階床の軸(ビルの垂直方向の位置の軸)を表した図であり、時間軸上での各エレベータかごの運行の軌跡を表している(一般に運行線図と呼ばれている)。図では、例として2台のエレベータ群管理の状況を表している。左側の図より、1号機(1と記述されたかご)は1階床で反転して上昇運転をしており、2号機(2と記述されたかご)は2階床から下降運転をしている。この様子を、右側の運行線図で見ると、現時点を表す軸(A02)より左方向において、1号機(A03)、2号機(A04)とも下降運転をして、それぞれ1階床、2階床に位置している様子が分かる。つまり、右側の運行線図において、現時点より左側の各エレベータかごの軌跡が実際の軌跡を表している。例えば、1号機の実際の軌跡はA031の軌跡であり、2号機の実際の軌跡はA041の軌跡になる。
First, the operation image (control principle) of the target route control will be described with reference to FIGS. FIG. 40 is a diagram illustrating an example of a control image of target route control. In the figure, the diagram on the left side is a diagram conceptually showing the cross section (vertical direction) of the hoistway in the building and the state of the elevator car moving in the shaft. In the figure on the right side, the horizontal axis (A01) represents the time axis, and the vertical axis (A02) represents the floor axis of the building (the axis of the vertical position of the building), and each elevator on the time axis. It represents the trajectory of the car's operation (generally called an operation diagram). In the figure, the situation of management of two elevator groups is shown as an example. From the figure on the left, Unit 1 (the car described as 1) reverses on the 1st floor and runs upward, and Unit 2 (the car described as 2) descends from the 2nd floor. Yes. When this situation is seen in the operation diagram on the right side, the first unit (A03) and the second unit (A04) are moved down in the left direction from the current axis (A02). You can see how it is located on the floor. That is, in the right travel diagram, the locus of each elevator car on the left side from the present time represents the actual locus. For example, the actual trajectory of
本実施例のポイントは、運行線図において、現時点より右側の将来方向の時間軸上に描かれている軌跡にある。これが各かごが今後通るべき‘目標軌跡’を表している。以下ではこの目標軌跡を‘目標ルート’と呼ぶ。目標ルートによる割当て制御の特徴は、この目標ルートに従うように各エレベータかごの動作(より正確には割当て)を制御する点にある。具体的に各かごの目標ルートは、1号機の場合、A032がその目標ルートであり、2号機の場合、A042がその目標ルートとなっている。この目標ルート、即ち、時間軸上で各号機が通るべき目標(又は基準)となる軌跡を制御に導入したことが、これまでの群管理制御にはない本発明独自の特徴となっている。 The point of a present Example exists in the locus | trajectory drawn on the time axis of the future direction on the right side from the present time in a service diagram. This represents the 'target trajectory' that each car should pass in the future. Hereinafter, this target locus is referred to as a “target route”. The feature of the assignment control by the target route is that the operation (more precisely, the assignment) of each elevator car is controlled to follow the target route. Specifically, the target route of each car is A032 for the first car, and A042 for the second car. The introduction of this target route, that is, the trajectory that is the target (or reference) that each unit should pass on the time axis, is a unique feature of the present invention that is not present in the conventional group management control.
図41は、目標ルートに従って、ホール呼びに対するエレベータかごの割当てを決定する様子を表した図である。図41は、図40と基本的に同じ図であり、左側が昇降路垂直断面上のエレベータの状態を表しており、右側が運行線図を表している。まず、新規のホール呼びが3階の上昇方向に発生したとする。図の左側の図を参照。このホール呼びに対して、群管理制御は、1号機(B03)か2号機(B04)のどちらか適切な号機を割当てる。ここでは、1号機(B03)の動きに注目する。1号機の目標ルートはB032の軌跡である。1号機の予測ルート(現時点から先の時点の予想軌跡、以下この予想軌跡を‘予測ルート’と呼ぶ)は、新規ホール呼びを割当てず通過させる場合はB033のルート(予測ルート1)となる。したがって、新規ホール呼びを割当てた場合はB034のルート(予測ルート2)となる。ここで、本実施例の群管理制御では、各号機の動きを目標ルートに従うように動かすことにある。従って、目標ルートにより近づくのは、B033の予測ルート1、即ち、ホール呼びを割当てず通過させるルートの方であり、1号機にはこのホール呼びを割当てないようにする。この結果、1号機の実際の軌跡は目標ルートに追従するように動作する。
FIG. 41 is a diagram showing a state in which the allocation of elevator cars to hall calls is determined according to the target route. FIG. 41 is basically the same diagram as FIG. 40, the left side shows the state of the elevator on the vertical cross section of the hoistway, and the right side shows the operation diagram. First, suppose that a new hall call occurs in the upward direction on the third floor. See the diagram on the left side of the figure. In response to this hall call, the group management control assigns an appropriate number of either the first car (B03) or the second car (B04). Here, focus on the movement of Unit 1 (B03). The target route of
この目標ルートによる制御によれば、目標ルートを、将来的に各エレベータかごが時間的等間隔状態の軌跡になるように描く。これによって、実際のかごの軌跡がその目標ルートに追従するようになり、その結果、長期的に安定して各かごを時間的等間隔な軌跡を保つように制御することができる。例えば、図41の場合、現時点までの1号機(B03)と2号機(B041)のそれぞれの実際の軌跡:1号機の軌跡(B031)、2号機の軌跡(B041)は接近しておりだんご運転状態にあることが分かる。ここで、3階上昇方向に発生した新たなホール呼びを2号機に割当てると、1号機(B03)と2号機(B04)の距離は依然として近づいたままであり、だんご運転が継続する。しかし、1号機と2号機を引き離して、各かごの軌跡が時間的等間隔になるように設定した目標ルートに沿って制御させるようにすると、1号機(B03)には割当てられず、目標ルートの通り、時間的等間隔の状態に近づいていく。
According to the control by the target route, the target route is drawn so that each elevator car becomes a trajectory in a time equidistant state in the future. As a result, the actual car trajectory follows the target route, and as a result, it is possible to control each car so as to keep the trajectories at regular intervals in a stable manner over the long term. For example, in the case of FIG. 41, the actual trajectories of Unit 1 (B03) and Unit 2 (B041) up to the present time: The trajectory of Unit 1 (B031) and the trajectory of Unit 2 (B041) are approaching and dangling. You can see that it is in a state. Here, when a new hall call generated in the upward direction on the third floor is assigned to the second car, the distance between the first car (B03) and the second car (B04) is still close, and the dango operation continues. However, if
以下、図40と図41を基に、本実施例によるエレベータ群管理システムの制御原理の特徴を整理する。 The features of the control principle of the elevator group management system according to this embodiment will be summarized below based on FIG. 40 and FIG.
1)図40に示すように、各かごに対して、時間軸上で目標となる軌跡、目標ルートを設定する。 1) As shown in FIG. 40, a target locus and target route on the time axis are set for each car.
2)図41に示すように、各かごの軌跡が目標ルートに追従するように、目標ルートと予測ルートを比較して、より目標に近づくようなかごにホール呼びの割当てを決める。 2) As shown in FIG. 41, the target route is compared with the predicted route so that the trajectory of each car follows the target route, and the allocation of hall calls to the car that is closer to the target is determined.
3)その結果として、各かごは目標ルートに追従するように動作する。 3) As a result, each car operates to follow the target route.
4)ここで、目標ルートは、基本的には、各かごの軌跡が時間的に等間隔になるように設定するため、各かごは長期的に安定して、時間的等間隔状態になるように制御される。 4) Here, the target route is basically set so that the trajectories of each car are equally spaced in time, so that each car is stable in the long term and is in a time equally spaced state. Controlled.
図42は、目標ルート作成プロセスの概要を表している。この図では、調整エリア(後述)を利用した目標作成のプロセスを示している。グラフD01は、現時点を時間軸の原点(D03)にして、横軸を時間、縦軸をビルの階床の位置で表したグラフになる。図ではグラフが描かれていないが、この中に例えば、図43のような目標ルートが描かれることになる。 FIG. 42 shows an overview of the target route creation process. This figure shows a target creation process using an adjustment area (described later). The graph D01 is a graph in which the current time is the origin (D03) of the time axis, the horizontal axis is time, and the vertical axis is the position of the floor of the building. Although a graph is not drawn in the figure, for example, a target route as shown in FIG. 43 is drawn therein.
図43は、本発明の一実施例による調整前後の目標ルート形状の一例図である。目標ルートは、将来の所定時間において、時間的等間隔状態になるようなルートを作成するが、この所定時間が調整基準時間軸D04に対応する。目標ルートは、現時点の時間軸D03と調整基準時間軸D04との間(これを調整エリアと呼ぶ)の領域で、時間的に等間隔状態になるまでの過渡状態を表すルートで表され、調整基準時間軸D04以降から時間的等間隔状態になるルートとして表される。 FIG. 43 is an example of target route shapes before and after adjustment according to an embodiment of the present invention. As the target route, a route that is in a temporally equidistant state at a predetermined time in the future is created, and this predetermined time corresponds to the adjustment reference time axis D04. The target route is an area between the current time axis D03 and the adjustment reference time axis D04 (referred to as an adjustment area), and is represented by a route representing a transient state until the time interval becomes equal. It is expressed as a route that is in a time equidistant state from the reference time axis D04 onward.
このような目標作成のプロセスは、次の4つのプロセスからなる。 Such a goal creation process includes the following four processes.
1)現状での予測ルートを描く(図42のST701)、
2)調整基準時間軸における各かごの現状の位相時間値を算出(ST702)、
3)現状の位相時間値を基に、時間的等間隔になるような各かごの調整量を算出(ST703)、
4)調整量に従って調整エリア内にある予測ルートのグリッドを調整、これが目標ルートとなる(ST704)。
1) Draw a current predicted route (ST701 in FIG. 42),
2) Calculate the current phase time value of each car on the adjustment reference time axis (ST702),
3) Based on the current phase time value, calculate the adjustment amount of each car so as to be equally spaced in time (ST703),
4) The grid of the predicted route in the adjustment area is adjusted according to the adjustment amount, and this becomes the target route (ST704).
図44は目標ルート作成部の構成の一例を示した図である。図に示した目標ルート作成部の構成は、大きく次の4つの要素で構成される。 FIG. 44 is a diagram showing an example of the configuration of the target route creation unit. The configuration of the target route creation unit shown in the figure is mainly composed of the following four elements.
1)目標ルート更新判定部103A、
2)現状の位相時間値算出部103B、
3)各かごの位相時間値の調整量算出部103C、及び
4)調整後のルート作成部103D。
1) Target route
2) Current phase time value calculation unit 103B,
3) Adjustment
始めに、制御イメージの説明として、上記4つの要素の働きについて説明する。目標ルート更新部103Aでは現在の目標ルートを更新するか否かを判定する。目標ルート更新と判定された場合は、次段の現状の位相時間値算出部103Bで、その時点の各エレベータかごの予測ルートに対して、各かごのルートの間隔状態を位相時間値という指標で評価する。ここで、‘位相’の考えを用いる理由は、例えば、電気回路理論で正弦波の3相交流の波形を考えた場合、各相の波形が均等化している状態とは、各相の位相が2π/3(rad)ずつの等位相の状態であることに基づいている。つまり、各かごのルートを波形と見なして、その波形に対して‘位相のような指標’を用いれば、各ルートに対する間隔の状態を評価しやすくなる。この‘位相のような指標’が、本実施例で用いる位相時間値という指標に対応する。位相時間値については後述する。現状の位相時間値算出部103Bでその時点での位相時間値を算出した後、その位相時間値を均等にするための各かごの位相時間値調整量を、各かごの位相時間値の調整量算出部103Cにおいて計算する。上記で算出された調整量を基にして、調整後ルート作成部103Dにて、元の各かごの予測ルート103Bの時間位相値を調整する。調整の結果得られたルートが各かごに対する目標ルートとなる。
First, as an explanation of the control image, the operation of the above four elements will be described. The target
上記で説明した概要的な制御構成に対する動作を図43の動作イメージを用いて説明する。図43は、図44に示した目標ルート作成部によって実行される目標ルート作成プロセスの動作イメージ図である。ここでは、まず先に説明した概要的な制御内容に基づいた制御の動作イメージを説明する。まず、図43(A)の図(調整前の目標ルート形状)は、目標ルート作成のベースになる現時点での各かごの予測ルートに対応している。ここでは3台のエレベータ群管理システムを考えている。図43(A)において、1号機のかごC010、2号機のかごC020、3号機のかごC030は、現時点の軸C050上でそれぞれ、8階を下降中、3階を下降中、4階を下降中の状態にある。この3台のかごの現時点以降の予測ルート(予想される軌跡)はそれぞれ、1号機が実線の軌跡C011、2号機が一点鎖線の軌跡C021、3号機が点線の軌跡C031となっている。尚、予測ルート作成法については予測ルート作成部の説明の項で詳しく説明する。これらの軌跡は明らかにそれぞれが接近しており、だんご運転状態に近いことが分かる。図44の目標ルート作成部の制御構成に戻って、まず、目標ルート更新判定部103Aで、目標ルートの更新が判定された場合、現状の位相時間算出部103Bでは、図43(A)の各かごの予測ルートC011、C021、C031に対して、これらを一種の波形と見なして、それぞれの位相時間値を算出する。この位相時間値は、図43(A)のグラフ中の調整基準時間軸C040を各かごの予測ルートが横切る交点で計算される。次に、この位相時間値を基に、それぞれの予測ルートが等間隔状態になるための調整量が、各かごの位相時間値の調整量算出部103Cで計算される。この調整量は図43(A)上では、調整基準時間軸C040上の3つの黒丸の点として表される。例えば1号機の場合は、点C01Aが調整量を反映した点であり、1号機の予測ルートC011はこの点C01Aを通るように次の処理で調整される。同様に、2号機の予測ルートC021は点C02Aを、3号機の予測ルートC032は点C03Aを通るように次の処理で調整される。この調整処理を実施するのが、図44の調整後ルート作成部103Dであり、ここで調整量に基づいて予測ルートが調整されて新たな目標ルートが作成される。その結果が、図43(B)に示された軌跡になる。図43(B)は、同図(A)に示された予測ルートを基にして作成された新たな目標ルートを表した図である。3台の各かごC010、C020、C030に対して、1号機C010の目標ルートは実線の軌跡C011Nであり、2号機C020の目標ルートは1点鎖線の軌跡C021N、3号機C030の目標ルートは点線の軌跡C031Nとなっている。この目標ルートの軌跡の特徴は、図43(B)に示されるように、時間的に等間隔な状態へ導くように各かごのルートが引かれていることにある。具体的には、同図(B)において調整基準軸C040から先の時間では3台のかごの目標ルートはそれぞれ時間的に等間隔状態になっている。現時点を表す軸C050と調整基準時間軸C040との間の時間(図42で調整エリアと書いた時間領域)では、各かごをそのような時間的等間隔状態へと導くように軌跡が引かれている。図43(A)に示した予測ルートを基にして、各ルートが調整量より求めた点、すなわち調整基準軸の点C01A、C02A、C03Aを通るように、それぞれのルートを調整する。これによって、このような図43(B)に示すような目標ルートを作成することができる。
The operation for the schematic control configuration described above will be described using the operation image of FIG. FIG. 43 is an operation image diagram of the target route creation process executed by the target route creation unit shown in FIG. Here, first, an operation image of control based on the general control content described above will be described. First, the diagram of FIG. 43A (target route shape before adjustment) corresponds to the predicted route of each car at the present time as a base for creating the target route. Here, three elevator group management systems are considered. In FIG. 43 (A), the first car C010, the second car C020, and the third car C030 are descending on the 8th floor and descending on the 3rd floor on the current axis C050. It is in the middle state. The predicted routes (predicted trajectories) of the three cars after the present time are a trajectory C011 where the first car is a solid line C011, a trajectory C021 where the first car is a one-dot chain line, and a trajectory C031 where the third car is a dotted line. The predicted route creation method will be described in detail in the description of the predicted route creation unit. These trajectories are clearly close to each other, and it can be seen that they are close to the dango driving state. Returning to the control configuration of the target route creation unit in FIG. 44, first, when the target route
以下、図44に示した目標ルート作成部の中の詳細要素について説明する。現状の位相時間値算出部103Bは、初期状態ルート作成部103B1、調整基準軸設定部103B2、調整基準軸における各かごの位相時間値算出部103B3、位相時間値順のソーティング部103B4からなる。初期状態ルート作成部103B1では、その時点における各かごの予測ルートを作成してこれを初期状態のルートにする。この初期状態のルートは、図43(A)に示されている調整前の目標ルート形状に対応する。調整基準軸設定部103B2では、調整基準時間軸を設定する。調整基準時間軸における各かごの位相時間部算出部103B3では、調整基準時間軸における各かごの位相時間値を算出する。具体的には、各かごの予測ルートと調整基準時間軸との交点(調整基準時間軸における各かごの予測位置に対応)に対する位相時間値を算出する。各かごの位相時間値を、調整基準時間軸における各かごの位相時間値算出部103B3で算出した後、この各かごに対する位相時間値を位相時間値順のソーティング部103B4で位相時間値の順にソーティングする。以下、この順を位相順と呼ぶ。例えば、図43(A)の調整前の目標ルート形状(予測ルートに対応)における3台のかご状態を例に採ると、調整基準軸C040と各かごの予測ルートC011、C021、C031との交点より、各かごの位相時間値の順は、小さい方から3号機、2号機、1号機の位相順になる。位相時間値順のソーティング部103B4では、ソーティングアルゴリズム、例えば、直接選択法やバブルソートなどを用いて、このような位相順を求めている。 Hereinafter, detailed elements in the target route creation unit illustrated in FIG. 44 will be described. The current phase time value calculation unit 103B includes an initial state route creation unit 103B1, an adjustment reference axis setting unit 103B2, a phase time value calculation unit 103B3 of each car on the adjustment reference axis, and a sorting unit 103B4 in order of phase time values. The initial state route creation unit 103B1 creates a predicted route for each car at that time and sets this as the initial route. This route in the initial state corresponds to the target route shape before adjustment shown in FIG. The adjustment reference axis setting unit 103B2 sets the adjustment reference time axis. The phase time portion calculator 103B3 of each car on the adjustment reference time axis calculates the phase time value of each car on the adjustment reference time axis. Specifically, a phase time value is calculated for the intersection of the predicted route of each car and the adjustment reference time axis (corresponding to the predicted position of each car on the adjustment reference time axis). After the phase time value of each car is calculated by the phase time value calculation unit 103B3 of each car on the adjustment reference time axis, the phase time value for each car is sorted in the order of the phase time value by the sorting unit 103B4 in order of the phase time value. To do. Hereinafter, this order is referred to as a phase order. For example, taking the state of three cars in the target route shape before adjustment (corresponding to the predicted route) in FIG. 43A as an example, the intersection of the adjustment reference axis C040 and the predicted routes C011, C021, and C031 of each car Therefore, the order of the phase time values of each car is the phase order of No. 3, No. 2, No. 1 from the smallest. The sorting unit 103B4 in order of phase time values obtains such a phase order using a sorting algorithm such as a direct selection method or bubble sort.
各かごの位相時間値の調整量算出部103Cでは、算出された各かごの位相時間値とその位相順を基に、各かごの間隔を位相時間値で計算して、この値と等間隔になるための基準値とを比較して、その差として表される各かごの位相時間値の調整量を算出する。予測ルートから各かごの間隔(位相時間値で評価)を求めて、これを等間隔になるための基準値と比較して、その差分をこれから調整すべき調整量とするのがここでの考え方になる。以下、図43(A)を例に、各かごの位相時間値の調整量算出部103Cの処理内容を説明する。先に説明したように、図43(A)において、各かごの予測ルートC011、C021、C031の調整基準時間軸C040における位相時間値の位相順は3号機、2号機、1号機の順になっている。予測ルートの1周時間をTとすると(3台とも1周時間は等しい)、k号機の位相時間値tp(k)は、3号機がtp(3)=0.09T、2号機がtp(2)=0.17T、1号機がtp(1)=0.77Tとなる。位相順に各かごの間隔を計算すると、2号機と3号機の間隔はtp(2)−tp(3)=0.08T、1号機と2号機の間隔がtp(1)−tp(2)=0.6T、3号機と1号機の間隔がtp(3)−tp(1)+T=0.32Tとなる。このように、位相時間値により各かごの間隔を定量化することで、各かごの間隔を定量的に評価することができる。例えば、上記の結果から2号機と3号機の間隔が非常に詰まっていることが分かる。位相時間値では1周時間をTとして設定しているため、N台の群管理の場合、目標としている時間的等間隔状態での各かごの間隔はT/Nで表すことができる。図43(A)の例では、3台群管理のため、目標とするかごの間隔はT/3=0.33Tになる。この目標とする間隔と、現状の各かごの間隔との差が、調整すべき間隔になる。例えば、2号機と3号機間では+0.25T(=0.33T−0.08T)が調整すべき間隔値となる。また、1号機と2号機間では−0.27T(=0.33T−0.6T)、3号機と1号機間では、+0.01T(=0.33T−0.32T)がそれぞれ調整すべき間隔値となる。上記において、符号は正の符号が間隔の増大を表しており、目標に対して現状の間隔を広げる必要がある。一方、負の符号が間隔の減少を表しており、目標に対して現状の間隔を縮める必要がある。この調整すべき間隔値を基に、各かごに対する位相時間値の調整量を算出する。これは次のアルゴリズムにより求めることができる。例えば、3台の群管理として、位相順にA号機、B号機、C号機の順に並んでいるとする。一般化するため、ここではアルファベットで号機の名前を表記している。上記より、0≦tp(A)≦tp(B)≦tp(C)<Tが成り立っている。ここで、各かごに対する位相時間値の調整量を△tp(k)(kはかごがk号機であることを表す)で表すことにする。まず調整後の各かごの間隔が目標とする間隔T/3を満たすために以下の各式が成立する必要がある。
Based on the calculated phase time value of each car and its phase order, the adjustment
(tp(B)+△tp(B))−(tp(A)+△tp(A))=T/3……(19)
(tp(C)+△tp(C))−(tp(B)+△tp(B))=T/3……(20)
(tp(A)+△tp(A))−(tp(C)+△tp(C))+T=T/3 …………(21)
例えば(19)式について、現状の位相時間値tp(B)に対して、調整後の位相時間値はtp(B)+△tp(B)で表される。従って、(19)式は、調整後のB号機の位相時間値と調整後のA号機の位相時間値との差、つまり間隔がT/3を満たすことを表している。ここで、上記3つの方程式は互いに独立していないため、この3式のみでは、△tp(A)、△tp(B)、△tp(C)について解くことができない。そこでもう一つの条件として、現状の各かごの位相時間値で見た配置上の重心と、調整後の各かごの位相時間値で見た配置上の重心が一致するという条件を加える。この条件は次式のようになる。
(Tp (B) + Δtp (B)) − (tp (A) + Δtp (A)) = T / 3 (19)
(Tp (C) + Δtp (C)) − (tp (B) + Δtp (B)) = T / 3 (20)
(Tp (A) + Δtp (A)) − (tp (C) + Δtp (C)) + T = T / 3 (21)
For example, in the equation (19), the adjusted phase time value is expressed as tp (B) + Δtp (B) with respect to the current phase time value tp (B). Therefore, the equation (19) represents that the difference between the adjusted phase time value of the machine B and the adjusted phase time value of the machine A, that is, the interval satisfies T / 3. Here, since the above three equations are not independent of each other, Δtp (A), Δtp (B), and Δtp (C) cannot be solved with only these three equations. Therefore, as another condition, a condition is added in which the center of gravity on the arrangement viewed from the phase time value of each current car matches the center of gravity on the arrangement viewed from the phase time value of each adjusted car. This condition is as follows.
(tp(A)+tp(B)+tp(C))/3={(tp(A)+△tp(A))+(tp(B)+△tp(B))+(tp(C)+△tp(C))}/3 …………(22)
(22)式を整理すると(23)式のようになる。
(Tp (A) + tp (B) + tp (C)) / 3 = {(tp (A) + Δtp (A)) + (tp (B) + Δtp (B)) + (tp (C) + Δtp (C))} / 3 (22)
When formula (22) is arranged, formula (23) is obtained.
△tp(A)+△tp(B)+△tp(C)=0 …………(23)
(19)、(20)、(21)、(23)式を、△tp(A)、△tp(B)、△tp(C)について解くと、次式のようになる。
Δtp (A) + Δtp (B) + Δtp (C) = 0 (23)
Solving the equations (19), (20), (21), and (23) with respect to Δtp (A), Δtp (B), and Δtp (C), the following equation is obtained.
△tp(A)=(−2/3)tp(A)+(1/3)tp(B)+(1/3)tp(C)+(−1/3)T …………(24)
△tp(B)=(1/3)tp(A)+(−2/3)tp(B)+(1/3)tp(C) …………(25)
△tp(C)=(1/3)tp(A)+(1/3)tp(B)+(−2/3)tp(C)+(1/3)T …………(26)
まとめると、位相時間値が、0≦tp(A)≦tp(B)≦tp(C)<Tである3台のかごA〜C号機に対し、調整後に等間隔で、3台の配置上の重心が変化しない条件を満たす調整量△tp(A)、△tp(B)、△tp(C)を求めることができる。これら調整量△tp(A)、△tp(B)、△tp(C)は、それぞれ、式(24)、(25)、(26)によって求めることができる。例えば、図43(A)を例に採ると、A、B、C号機は、それぞれ3、2、1号機となる。従って、tp(A)=tp(3)=0.09T、tp(B)=tp(2)=0.17T、tp(C)=tp(1)=0.77Tとなる。そこで、各かごに対する調整量は(24)〜(26)式より、△tp(A)=△tp(3)=−0.081T、△tp(B)=△tp(2)=0.177T、△tp(C)=−0.096Tのように求められる。確認として、調整後のそれぞれの位相時間値を求める。tp(A)+△tp(A)=tp(3)+△tp(3)=0.010T、tp(B)+△tp(B)=tp(2)+△tp(2)=0.343T、tp(C)+△tp(C)=tp(1)+△tp(1)=0.677Tである。すなわち、それぞれのかごの間隔は、全て0.33Tになり等間隔の条件を満足できている。
Δtp (A) = (− 2/3) tp (A) + (1/3) tp (B) + (1/3) tp (C) + (− 1/3) T (24) )
Δtp (B) = (1/3) tp (A) + (− 2/3) tp (B) + (1/3) tp (C) (25)
Δtp (C) = (1/3) tp (A) + (1/3) tp (B) + (− 2/3) tp (C) + (1/3) T (26)
In summary, with respect to the three cars A to C whose phase time values are 0 ≦ tp (A) ≦ tp (B) ≦ tp (C) <T, the three cars are arranged at equal intervals after adjustment. The adjustment amounts Δtp (A), Δtp (B), Δtp (C) satisfying the condition that the center of gravity of the change does not change can be obtained. These adjustment amounts Δtp (A), Δtp (B), and Δtp (C) can be obtained by equations (24), (25), and (26), respectively. For example, taking FIG. 43 (A) as an example, Units A, B, and C become
次に、各かごの位相時間値の調整量算出部103Cで求めた調整量を用いて、調整後ルート作成部103Dにより、調整後のルートを作成する処理の詳細を説明する。調整後ルート作成部では、まず各かごのルート上のグリッドの調整量算出部103D1で、各かごの調整前の目標ルート(予測ルートに対応)上のグリッドの調整量を算出する。グリッドとは、調整エリア内での対象としているルートの方向反転点と定義している。このグリッドの位置を水平方向に調整することによって、対象としているルートの位相時間値を調整できる。各グリッドの調整量は、そのかごの調整量を総量として、現時点に近いグリッドから順にそのグリッドに設定されたリミッタ値を超える値まで割当てる方法で決定される。ここで、各グリッドの調整量のリミッタ値は、グリッドのリミッタ値設定部103D2で設定される。調整後のグリッド位置算出部103D3では、各グリッドに対する調整量△gtp(k、i)と、調整前の当該グリッドの位置gp(k、i)より、調整後のグリッド位置gp_N(k、i)を計算する。例えば、k=2号機で、グリッド数が3個(i=1、2、3)の場合、それぞれのグリッドの計算式は次のようになる。
Next, details of processing for creating an adjusted route by the adjusted route creation unit 103D using the adjustment amount obtained by the adjustment
gp_N(k=2、i=1)=gp(k=2、i=1)+△gtp(k=2、i=1) ………………(27)
gp_N(k=2、i=2)=gp(k=2、i=2)+△gtp(k=2、i=1)
+△gtp(k=2、i=2) ………………(28)
gp_N(k=2、i=3)=gp(k=2、i=3)+△gtp(k=2、i=1)+△gtp(k=2、i=2)+△gtp(k=2、i=3) ………………(29)
グリッドの調整量は、後続のグリッドに引き継がれていくため、最終のグリッドでは、そのかごに対する位相時間値調整量の総量分だけ、位置が調整されるようになる。以上のようにして、調整された各グリッドの位置に対して、これらを結び付けることによって、新たな目標ルートを作成することができる。目標ルートデータ演算部103D4では、この新たな目標ルートデータを演算して更新する。
gp_N (k = 2, i = 1) = gp (k = 2, i = 1) + Δgtp (k = 2, i = 1) (27)
gp_N (k = 2, i = 2) = gp (k = 2, i = 2) + Δgtp (k = 2, i = 1)
+ Δgtp (k = 2, i = 2) (28)
gp_N (k = 2, i = 3) = gp (k = 2, i = 3) + Δgtp (k = 2, i = 1) + Δgtp (k = 2, i = 2) + Δgtp (k = 2, i = 3) ……………… (29)
Since the adjustment amount of the grid is carried over to the succeeding grid, the position of the final grid is adjusted by the total amount of the phase time value adjustment amount for the car. As described above, a new target route can be created by connecting the adjusted grid positions to each other. The target route data calculation unit 103D4 calculates and updates this new target route data.
新たに更新された目標ルート(調整後の目標ルート)は、位相時間値の調整量に設定された調整後の目標点を通過する。各かごのルートが調整後の目標点を通過するように調整されるため、3台を合わせた結果は、図43(B)のようになり、調整基準時間軸C040以降で、3台の目標ルートC011N、C021N、C031Nは時間的等間隔状態になっている様子が分かる。当然、各ルートC011N、C021N、C031Nは、それぞれの調整後の目標点C01A、C02A、C03Aを通過している。また、グリッドによって調整されている調整エリア内の目標ルートは、調整基準時間軸以降で時間的等間隔状態になるための過渡的な案内役の役割を担っていることも分かる。以上が目標ルートの作成処理の詳細である。 The newly updated target route (adjusted target route) passes through the adjusted target point set as the adjustment amount of the phase time value. Since the route of each car is adjusted so as to pass through the adjusted target point, the result of combining the three cars is as shown in FIG. 43 (B), and the three targets after the adjustment reference time axis C040. It can be seen that the routes C011N, C021N, and C031N are in a time equidistant state. Naturally, each of the routes C011N, C021N, and C031N passes through the adjusted target points C01A, C02A, and C03A. It can also be seen that the target route in the adjustment area adjusted by the grid plays a role of a transitional guide for achieving a time equidistant state after the adjustment reference time axis. The above is the details of the target route creation process.
図45は、本発明によるエレベータ群管理システム全体の制御ブロックの図2とは異なる第2の実施例を表している。図45において、図2と同じ要素は同じ符号を割り付けており、ここでは説明を省略する。図1と異なる点は、重み係数をホール呼び発生数によって直接定めている点にある。具体的には、ホール呼び発生数演算部10にてホール呼び発生数を求めて、これを基に重み係数演算部5で直接ホール呼び発生数から重み係数を求めている。
FIG. 45 shows a second embodiment different from FIG. 2 of the control block of the entire elevator group management system according to the present invention. 45, the same elements as those in FIG. 2 are assigned the same reference numerals, and description thereof is omitted here. The difference from FIG. 1 is that the weighting factor is directly determined by the number of hall calls. Specifically, the hall call occurrence
図46は、重み係数演算部5で用いられる重み係数を求めるための関数の例を表している。図46は、横軸が1周当たりのホール呼び発生数、縦軸が重み係数を表している。ここで、エレベータ1周当たりのホール呼び数とは、群管理されている各エレベータに対して、1周(例えば上方向の最下階から下方向の最下階まで)する間に発生するホール呼び発生数の平均値を表している。
FIG. 46 shows an example of a function for obtaining a weighting factor used in the weighting
図46において、重み係数を決める関数は曲線F04によって表されている。この関数の特徴は、次の4点が挙げられる。 In FIG. 46, the function for determining the weighting coefficient is represented by a curve F04. The features of this function include the following four points.
1)ホール呼び発生数によって適切な重み係数の値を即座に求められること、
2)入力変数である1周当たりのホール呼び発生数の連続的な変化によって、出力である重み係数も連続的に値が定まること、
3)入力変数がスカラー値(1変数)であること、及び
4)入力変数が実数として連続的に値を取り得ること。
1) An appropriate weighting factor value can be obtained immediately according to the number of hall calls.
2) The continuous change in the number of hall calls per lap, which is an input variable, causes the weighting coefficient, which is an output, to be continuously determined.
3) The input variable is a scalar value (one variable), and 4) The input variable can take a continuous value as a real number.
図46のグラフより、例えば、1周当たりのホール呼び数がNA個の場合、重み係数の値はWT=F(NA)となる。交通需要の変化によってNAがどのように変化しても、即座に、WTを求めることができる。これが大きな特徴となる。また、各関数は、縦軸のゼロ値と交わる横軸の値以下に対しては、重み係数値は常にゼロとなっている。 From the graph of FIG. 46, for example, when the number of hall calls per round is NA, the value of the weighting coefficient is WT = F (NA). Regardless of how the NA changes due to changes in traffic demand, the WT can be obtained immediately. This is a major feature. In each function, the weighting coefficient value is always zero for a value equal to or less than the value on the horizontal axis that intersects the zero value on the vertical axis.
エレベータ1周当たりのホール呼び発生数を入力とするによって、適切な重み係数を求めることができる理由は、既に説明したように、かご間隔評価値の重要性が将来発生するホール呼びの数と強い関係があることによる。例えば、将来発生するホール呼びの数が多いほど、できるだけ時間的に等間隔にした方がよく、かご間隔評価値はより強く作用させる方がよい。ここで、将来発生するホール呼びの数は、その時点もしくはその先の時点における1周当たりのホール呼び発生数と強い相関性があると考えられる。従って、1周当たりのホール呼び発生数と適切な重み係数値との間にはある関係が成り立ち、これを図10のような関数として表すことによって、エレベータ1周当たりのホール呼び発生数で適切な重み係数を定めることができる。 The reason why an appropriate weighting factor can be obtained by using the number of hall calls generated per elevator lap as input is that the importance of the car interval evaluation value is stronger than the number of hall calls that will be generated in the future. Because of the relationship. For example, as the number of hall calls to be generated in the future increases, it is better to make the intervals equally as much as possible, and it is better to make the car interval evaluation value work more strongly. Here, the number of hall calls to be generated in the future is considered to have a strong correlation with the number of hall calls generated per round at that time or at a later time. Therefore, there is a relationship between the number of hall calls generated per lap and an appropriate weight coefficient value. By expressing this as a function as shown in FIG. 10, the number of hall calls generated per elevator lap is appropriate. Can be determined.
尚、図46のグラフでは、横軸が1周当たりのホール呼び発生数の例を示したが、これに限らずホール呼び数発生数に基づく値、例えば、所定時間でのホール呼び発生数などでもよい。さらに、ホール呼び発生数に限らず、交通需要に関係するスカラー値の指標でもよい。例えば、利用人数やホール呼び発生数とかご呼び発生数の合計値に基づく値でもよい。 In the graph of FIG. 46, the horizontal axis shows an example of the number of hall calls generated per lap. However, the present invention is not limited to this, and a value based on the number of hall calls generated, for example, the number of hall calls generated in a predetermined time, etc. But you can. Furthermore, it is not limited to the number of hall calls, but may be a scalar value index related to traffic demand. For example, it may be a value based on the total number of users or the number of hall calls and the number of car calls.
以上より、図45の構成では、図2の構成に比べて、より簡単な構成によって速やかに適切な重み係数を設定できる効果がある。その結果、安価であるが計算処理量が低いマイコン、演算プロセッサ等を用いても、安定した性能を保つことができる。 As described above, the configuration of FIG. 45 has an effect that an appropriate weighting factor can be quickly set with a simpler configuration than the configuration of FIG. As a result, stable performance can be maintained even if a microcomputer, an arithmetic processor, or the like, which is inexpensive but has a low calculation processing amount, is used.
図47は、本発明によるエレベータ群管理システムの図2及び図45とは異なる第3の実施例を表している。図47において、図2と同じ要素については、同じ符号で表しており、説明は省略する。図2と異なる点は、割当て評価情報表示処理部H01を新規に有している点にある。この割当て評価情報表示処理部H01は、ホール呼びの割当て処理に対して、その割当てを決定した評価値やその中間情報などの内部情報を記録しておき、必要に応じてその内容を表示したり、外部に転送したり、記録媒体に記録することを特徴としている。その目的は、各割当て処理に対して、その割当てがどのような要因で実施されたかを分析することにあり、また例えば長待ちが発生した場合に、どのような状況で長待ち発生に至ったのかの原因を解明するためにある。特に、本発明によるエレベータ群管理システムは、予測軌跡や目標ルートによって、視覚的に群管理制御側の意図を示すことができるため、このような表示処理手段は有効である。 FIG. 47 shows a third embodiment of the elevator group management system according to the present invention, which is different from those shown in FIGS. 47, the same elements as those in FIG. 2 are denoted by the same reference numerals, and description thereof is omitted. A difference from FIG. 2 resides in that an allocation evaluation information display processing unit H01 is newly provided. This allocation evaluation information display processing unit H01 records internal information such as an evaluation value for determining the allocation and intermediate information for the hall call allocation processing, and displays the contents as necessary. It is characterized by being transferred to the outside or recorded on a recording medium. The purpose is to analyze the cause of the allocation for each allocation process. For example, when a long wait occurs, in what situation the long wait occurred. To elucidate the cause. In particular, since the elevator group management system according to the present invention can visually indicate the intention of the group management control side based on the predicted trajectory and the target route, such display processing means is effective.
以下、割当て評価情報表示処理部H01の構成を説明する。割当て評価情報表示処理部H01は、判定部H02、記録部H03、描画処理部H04、記録媒体H05、及び出力部H06で構成される。判定部H02は、評価値情報を記録するかどうかの判定を行う部分で、判定部H02より記録許可の信号が出た場合に記録部H03にて割当て評価の情報を記録させる仕組みになっている。この判定には、例えば、特定の時間帯、特定の交通流、所定値以上の平均待ち時間の発生、並びに所定値以上の平均ホール呼び継続時間の発生などが挙げられる。記録部H03は、群管理制御部1で計算された割当て評価に関わる様々なデータを記録する。例えば、待ち時間評価値3で算出した待ち時間評価値、かご間隔評価値算出部4の出力、重み係数設定部8で設定した重み係数、総合評価値演算部6の出力、及び割当てエレベータ決定部7の出力である割当て決定号機名が記録される。かご間隔評価値演算部4については、図48にその詳細機能を示しており、詳細説明は後述する。描画処理部H04では、記録部H03に記録された割当てに関する情報を画面に描画するための描画データ作成処理が実施される。出力部H06では、描画データが画面上に表示される。記録媒体H05には、記録部H03で記録されたデータが保存される。この記録媒体H05には、フロッピディスクやメモリカード、USBメモリ、ハードディスクなどが用いられる。描画処理部H04で作成された描画データは、通信ネットワークH07を介して外部に転送され、遠隔で描画データを画面に表示出力したり、そのデータを記憶させることもできる。
Hereinafter, the configuration of the allocation evaluation information display processing unit H01 will be described. The allocation evaluation information display processing unit H01 includes a determination unit H02, a recording unit H03, a drawing processing unit H04, a recording medium H05, and an output unit H06. The determination unit H02 is a part that determines whether to record evaluation value information, and has a mechanism for recording allocation evaluation information in the recording unit H03 when a recording permission signal is output from the determination unit H02. . This determination includes, for example, a specific time zone, a specific traffic flow, occurrence of an average waiting time exceeding a predetermined value, generation of an average hall call duration exceeding a predetermined value, and the like. The recording unit H03 records various data related to the allocation evaluation calculated by the group
図48は、間隔評価値演算部4の詳細機能ブロック図であり、記録部H03で記録されるデータ情報の流れを表している。図48の構成は、図12に基づいており、図12と同じ要素は同じ符号で表して、ここでの説明は省略する。記録部H03へ送られるデータは、まず、間隔評価時刻設定部405で算出された間隔評価時刻trefがあり、これは間隔評価時刻データ出力部4Z2より出力される。さらに、予測軌跡演算部401で作成された予測機軌跡データ(具体的には図23の予測軌跡表)があり、予測軌跡データ出力部4Z3より出力される。また、予測軌跡データはそのままではデータ量が大きいため、例えば、図33に示したような簡易版の予測軌跡に変換してデータ量を圧縮すると適切なデータ量に抑えることができる。このような変換処理を実行するのが、予測軌跡データ変換部4Z1になる。この他、予測かご間隔演算部402で算出された予測かご間隔データ(出力部4Z5より出力)、間隔評価値算出部403で算出された間隔評価値データ(出力部4Z6より出力)などのデータが記録部H03へ出力され、記録される。
FIG. 48 is a detailed functional block diagram of the interval evaluation
図49は、図47の描画処理部H04で作成されて出力部H06で表示される画面出力データの一例を表している。図49の画面出力要素は、次の4つのグループに大別することができる。 FIG. 49 shows an example of screen output data created by the drawing processing unit H04 of FIG. 47 and displayed by the output unit H06. 49 can be roughly divided into the following four groups.
1)予測軌跡に関する情報を表示出力するグループL001、
2)割当て対象となるホール呼びに関する情報を表示出力するグループL002、
3)評価値情報を表示出力するグループL003、及び
4)間隔評価値の詳細情報を表示出力するグループL004である。
1) a group L001 for displaying and outputting information on the predicted trajectory,
2) Group L002 for displaying and outputting information related to hall calls to be allocated;
3) a group L003 for displaying and outputting evaluation value information; and 4) a group L004 for displaying detailed information of interval evaluation values.
以下、それぞれの詳細を説明する。 Details of each will be described below.
まず、予測軌跡に関する情報を表示出力するグループL001については、次のようなデータを時間と階位置を2軸に取ったグラフL006に一括して表示する点に特徴がある。グラフに表示されるデータとしては、各号機の予測軌跡(1号機の予測軌跡L010、2号機の予測軌跡L011)、間隔評価時刻L012、及び間隔評価時刻における各号機のかご位置(1号機のかご位置L015、2号機のかご位置L016)がある。このような表示によって、各号機の予測軌跡がどのようになっているか、どの時点において各号機のかご間隔を評価しているか、その時のかごの位置関係はどうなっているかを詳細に示すことができる。その結果、後述するかご間隔評価値と合わせて、かご間隔評価がどのように作用したかを、視覚的にかつ容易に確認することができる。特に、本発明では、間隔評価時刻を呼びの発生状況や交通流の状況によって適応的に調整するため、その割当て時はどの時点を間隔評価時刻にしたのかを明示することは重要である。この他に、割当て時点におけるかご状態、呼び状態を表示した左上の図L005(1号機のかごL007、2号機のかごL008、ホール呼びL009)を表示する。これらは、予測軌跡の情報をサポートする効果がある。例えば、どのような呼びの発生状態から描かれた予測軌跡の根拠を理解することができる。 First, the group L001 that displays and outputs information on the predicted trajectory is characterized in that the following data is collectively displayed on a graph L006 that takes time and floor position as two axes. The data displayed on the graph includes the predicted trajectory of each car (predicted trajectory L010 of No. 1 and the predicted trajectory L011 of No. 2), the interval evaluation time L012, and the car position of each car at the interval evaluation time (the car of No. 1). There is a position L015, a car position L016 of the second car. With such a display, it is possible to show in detail how the predicted trajectory of each unit is, whether the car interval of each unit is being evaluated, and what the positional relationship of the cars at that time is. it can. As a result, it is possible to visually and easily confirm how the car interval evaluation has been performed together with the car interval evaluation value described later. In particular, in the present invention, since the interval evaluation time is adaptively adjusted according to the call generation status and traffic flow status, it is important to clearly indicate which time is set as the interval evaluation time at the time of the allocation. In addition to this, the upper left diagram L005 (the first car L007, the second car L008, and the hall call L009) displaying the car status and call status at the time of allocation is displayed. These have the effect of supporting information on the predicted trajectory. For example, it is possible to understand the basis of the predicted trajectory drawn from any call generation state.
次に、割当て対象となるホール呼びに関する情報を表示出力するグループL002では、ホール呼びが発生した時刻情報L017、発生ホール呼び階情報L018、発生ホール呼びの方向情報L019が表示される。これらの情報によって、割当て対象となるホール呼びの詳細を確認できる。 Next, in the group L002 that displays and outputs information related to hall calls to be allocated, time information L017, generated hall call floor information L018, and generated hall call direction information L019 are displayed. With these pieces of information, the details of the hall call to be assigned can be confirmed.
評価値情報を表示出力するグループL003では、割当て号機名L020、その時の待ち時間評価値L021、かご間隔評価値L022、重み係数値L023、及び総合評価値L024の各情報が表示される。これらの情報は、全てが割当て決定の核となる重要情報であり、これらを並べて表示することによって、どのような要因で割当てが決定されたかを知ることができる。すなわち、評価値情報を表示出力するグループL003で表示された情報によって、割当て決定の要因をおおよそ推測することができる。例えば、長待ち発生を避けるために待ち時間評価値の働きが強かった、かご間隔評価値が悪くなることを避けた、さらに、その時点では重み係数値が大きくかご間隔評価値が重視されていた等、割当て決定要因探索の支援となり得る。また、これらの情報と予測軌跡に関する情報を表示出力するグループL001の情報とを合わせて表示することで、数字だけでは把握しづらい、かご間隔評価値の内容をより直感的に理解させることが可能になる。 In the group L003 that displays and outputs the evaluation value information, the assigned machine name L020, the waiting time evaluation value L021, the car interval evaluation value L022, the weight coefficient value L023, and the overall evaluation value L024 are displayed. All of these pieces of information are important information that is the core of assignment determination, and by displaying them side by side, it is possible to know what factors caused the assignment to be determined. That is, the factor of the allocation decision can be roughly estimated by the information displayed in the group L003 that displays and outputs the evaluation value information. For example, the waiting time evaluation value was strong in order to avoid the occurrence of long waiting time, the car interval evaluation value was avoided from worsening, and at that time, the weighting factor value was large and the car interval evaluation value was emphasized For example, it can be a support for the allocation determining factor search. In addition, by displaying these information together with the information of the group L001 that displays and outputs information related to the predicted trajectory, it is difficult to grasp only by numbers, and the contents of the car interval evaluation value can be understood more intuitively. become.
かご間隔評価値の詳細情報を表示出力するグループL004では、かご間隔評価値を算出するに当たって計算された処理内部の詳細情報が表示される。具体的には、間隔評価時刻の値L025、間隔評価時刻における各号機の予測かご位置L026、さらに予測かご間隔L027の情報が表示される。かご間隔評価値は、全てを集約した情報のため、その評価値となる根拠が定量的に分かりにくい場合がある。その場合には、上記の詳細情報からより詳しい分析が可能になる。 In the group L004 that displays and outputs the detailed information on the car interval evaluation value, the detailed information inside the processing calculated when calculating the car interval evaluation value is displayed. Specifically, information on the interval evaluation time value L025, the predicted car position L026 of each car at the interval evaluation time, and the predicted car interval L027 is displayed. Since the car interval evaluation value is information that aggregates all, the basis of the evaluation value may be difficult to understand quantitatively. In that case, more detailed analysis is possible from the above detailed information.
以上、図49により、図47の描画処理部H04で作成されて出力部H06で表示される画面出力データの例を説明した。この画面出力データの主要な特徴は、各号機の予測軌跡、予測軌跡上でのかご位置を予測する時点である間隔評価時刻、かご間隔評価時刻における各号機の予測かご位置及び方向を1つのグラフ上に一括で表示している点にある。さらに、評価値情報として、割当て評価対象号機の待ち時間評価値、かご間隔評価値、重み係数値、総合評価値を並列して表示している点にある。このような表示の結果、対象としている割当てに対する各号機の予測軌跡、予測軌跡上のかご間隔を予測している時点、その時のかご位置を視覚的に明示することができる。したがって、かご間隔の評価がどのような状況(予測状況)を基になされたかを分かりやすく表示することができる。例えば、ある割当てに対して、その根拠に疑問を持たれた利用者の方にも、予測軌跡、予測の時点(間隔評価時刻)、予測かご位置を視覚的に示すことによって、どのような予測の下にそのような割当てがなされたかを容易に示すことができる。また、評価値の内訳が示されるため、その割当てが待ち時間評価値とかご間隔評価値のどちらが要因で割当て決定に至ったかを容易に知ることができる。待ち時間評価値は既に発生している実呼びの評価値であり、かご間隔評価値は未発生の将来の呼びに対する評価値であることを考えると、実呼びと将来呼びのどちらが要因で割当てがなされたかをこれらの情報は表していると言える。つまり、その割当てに対する基本的な意図を把握することができる。 The example of the screen output data generated by the drawing processing unit H04 of FIG. 47 and displayed by the output unit H06 has been described with reference to FIG. The main features of this screen output data are the prediction trajectory of each car, the interval evaluation time when predicting the car position on the prediction trajectory, and the predicted car position and direction of each car at the car interval evaluation time in one graph. It is in the point that is displayed all over. Further, as evaluation value information, the waiting time evaluation value, the car interval evaluation value, the weight coefficient value, and the comprehensive evaluation value of the allocation evaluation target car are displayed in parallel. As a result of such display, the predicted trajectory of each car for the target assignment, the time point when the car interval on the predicted trajectory is predicted, and the car position at that time can be visually specified. Therefore, it is possible to display in an easy-to-understand manner what situation (predicted situation) the car interval is evaluated. For example, for a user who has doubts about the basis of a certain allocation, what kind of prediction can be made by visually showing the predicted trajectory, the prediction time (interval evaluation time), and the predicted car position It can be easily shown below whether such an assignment has been made. Further, since the breakdown of the evaluation values is shown, it is possible to easily know whether the allocation has been determined due to the waiting time evaluation value or the car interval evaluation value. Considering that the waiting time evaluation value is an evaluation value of an actual call that has already occurred and the cage interval evaluation value is an evaluation value for a future call that has not yet occurred, either the actual call or the future call may cause an allocation. It can be said that this information represents what has been done. That is, the basic intention for the assignment can be grasped.
図50は、図49とは異なる画面出力データの実施例を表している。図50において、図49と同じ要素は同じ符号で表しており、ここでの説明は省略する。図50において、図49と異なる点は、実線で示すホール呼び割当て前の予測軌跡(1号機の予測軌跡L010)と、破線で示すホール呼び割当て後の予測軌跡(同じ1号機の予測軌跡L101)とを重ねて表示している点にある。ホール呼び割当て後の予測軌跡L101にはホール呼び割当てによる停止が軌跡に表れている。すなわち、符号L102で示す水平部の軌跡である。尚、このときのホール呼びL009は、13階・上方向で発生している。 FIG. 50 shows an example of screen output data different from FIG. 50, the same elements as those in FIG. 49 are denoted by the same reference numerals, and description thereof is omitted here. 50 differs from FIG. 49 in that the predicted trajectory before hall call assignment shown by a solid line (predicted trajectory L010 of the first car) and the predicted trajectory after hall call assignment shown by a broken line (predicted trajectory L101 of the same first car). It is in the point that and are displayed. In the predicted trajectory L101 after the hall call assignment, a stop due to the hall call assignment appears in the locus. That is, the locus of the horizontal portion indicated by reference numeral L102. The hall call L009 at this time is generated on the 13th floor / upward.
図50に示すように、ホール呼び割当て前後の予測軌跡を重ねて表示することによって、割当てによって、かごの間隔がどのように変わるかを、より具体的に表示できる。図50の例では、一点鎖線で示す2号機の予測軌跡L011に対して、1号機の割当て後の予測軌跡L101に広がる、つまりかご間隔評価の点では望ましい方に変化している。特に、割当て前後でのかご間隔を比較できるため、割当てによる効果を定量的に分かりやすく表示することができる。これは、割当ての要因を分析したり、割当ての根拠を理解する場合に有効である。 As shown in FIG. 50, by displaying the predicted trajectories before and after hall call allocation in an overlapping manner, it is possible to more specifically display how the car interval changes depending on the allocation. In the example of FIG. 50, the prediction trajectory L011 of the second car indicated by the alternate long and short dash line spreads to the predicted trajectory L101 after the assignment of the first car. In particular, since the car intervals before and after the assignment can be compared, the effect of the assignment can be displayed quantitatively and easily. This is effective for analyzing allocation factors and understanding the basis of allocation.
図51は、図49とは異なる画面出力データの第3の例を表している。図51において、図49と同じ要素は同じ符号で表しており、ここでの説明は省略する。図51において、図49と異なる点は、各号機の予測軌跡と合わせて、割当て実施時点以前の各号機の実際の運行軌跡を並べて表示している点にある。具体的には、図51において、1号機の実際の運行軌跡が実線で示す軌跡L201で表されており、2号機の実際の運行軌跡が一点鎖線L202で表されている。割当て実施時点は軸L203であり、この軸を挟んで左側が実際の運行軌跡、右側が予測軌跡となっている。実際の運行軌跡では、かごの停止は、全て実際に生じた停止であり、1号機の実際の運行軌跡L201の途中に示す符号L204は、1号機が上昇方向で3階に停止した実績を表している。すなわち、確率的な停止は存在しない。これが実際の運行軌跡と予測軌跡の見かけ上の違いになる。
FIG. 51 shows a third example of screen output data different from FIG. 51, the same elements as those in FIG. 49 are denoted by the same reference numerals, and description thereof is omitted here. 51 differs from FIG. 49 in that the actual operation trajectory of each unit before the allocation is displayed side by side with the predicted trajectory of each unit. Specifically, in FIG. 51, the actual operation trajectory of the first car is represented by a trajectory L201 indicated by a solid line, and the actual operation trajectory of the second car is represented by a one-dot chain line L202. The allocation is performed at the axis L203, and the left side of the axis is the actual operation locus and the right side is the predicted locus. In the actual operation trajectory, the car stops are all actually stopped, and the reference L204 shown in the middle of the actual operation trajectory L201 of
図51のように、各号機に対して、予測軌跡と割当て実施時点以前の実際の運行軌跡とを合わせて(つなげて)表示することによって、割当て実施前までの各かごの間隔の推移と今後の予測を対比して見ることができる。その結果、例えば、それまではだんご運転状態であったが、予測軌跡によってだんご運転を回避させようと作用している様子や、逆に、それまでは時間的に等間隔状態であったが、予測軌跡から将来的にだんご運転へと近づきつつあること等も分かる。したがって、これを回避するために、あえて引き離すような割当てを予防的に実施している様子をも確認することができる。 As shown in FIG. 51, for each unit, the predicted trajectory and the actual operation trajectory before the allocation execution time are displayed together (connected), so that the transition of each car interval before the allocation execution and the future You can compare the predictions of As a result, for example, it was a dango driving state until then, but it seems that it is acting to avoid dango driving by the predicted trajectory, and conversely, until that time it was in an equally spaced state in time, It can also be seen from the predicted trajectory that it is approaching dango driving in the future. Therefore, in order to avoid this, it is possible to confirm a state in which assignment that is intentionally separated is carried out preventively.
以上より、図51のように、予測軌跡と実際の運行軌跡とを合わせて(つなげて)表示することによって、時間軸で見たかご間隔の推移をより分かりやすく示すことができる。また、かご間隔の変化の状況、過去の経緯を容易に理解することができ、割当ての要因をより容易に分析することができる。 From the above, as shown in FIG. 51, the predicted trajectory and the actual operation trajectory are displayed together (connected), so that the transition of the car interval viewed on the time axis can be shown in an easy-to-understand manner. In addition, it is possible to easily understand the situation of the change in the car interval and the past history, and it is possible to more easily analyze the factor of allocation.
図52は、予測軌跡表示方法の処理フローの一例を表している。この例では、各仮割当て号機毎に予測軌跡を表示する方法としている。以下、処理の流れを具体的に説明する。
まず、必要なデータを読み込み(L301)、次に、表示形式を選択する(L302)。この表示形式の選択は、例えば、表示項目の選択や表示時間の範囲設定が挙げられる。次に、表示対象のホール呼びを選択する(L303)。次に、仮割当て号機を表す変数Kをまずは、K=1に設定する(L304)。その後、K号機を上記で選択したホール呼びに仮割当てした場合のK号機の予測軌跡の表示データ(A)を作成する(L305)。さらに、K号機以外の各号機の予測軌跡の表示データ(B)を作成する(L306)。次に、間隔評価時刻の表示データ(C)を作成する(L307)。以上の処理が終了後、仮割当てをK号機とした場合の、各号機の予測軌跡の画像データとして、上記の(A)、(B)、(C)を合わせた画面を表示又はデータとして記憶させる(L308)。
FIG. 52 shows an example of the processing flow of the predicted trajectory display method. In this example, a predicted trajectory is displayed for each temporary assigned car. Hereinafter, the flow of processing will be specifically described.
First, necessary data is read (L301), and then a display format is selected (L302). Examples of selection of the display format include selection of display items and display time range setting. Next, the hall call to be displayed is selected (L303). Next, a variable K representing a temporary allocation number is first set to K = 1 (L304). Thereafter, the display data (A) of the predicted trajectory of No. K when the No. K is temporarily assigned to the hall call selected above is created (L305). Further, display data (B) of the predicted trajectory of each unit other than unit K is created (L306). Next, display data (C) of interval evaluation time is created (L307). After the above processing is completed, the screen combining the above (A), (B), and (C) is stored as display or data as the image data of the predicted trajectory of each unit when the temporary allocation is set to unit K. (L308).
次いで、Kに1を加算して(L309)、次の号機に対して上記の処理を繰り返して実行し、全ての号機に対して実行するまで繰り返す(L310)。このような処理を実施することによって、図49〜図51で説明した表示画面データを作成できる。 Next, 1 is added to K (L309), and the above process is repeated for the next unit, and is repeated until it is performed for all units (L310). By executing such processing, the display screen data described with reference to FIGS. 49 to 51 can be created.
図53は、図52とは異なる予測軌跡表示方法の処理フローの一例を表している。この例では、呼びを割当てた号機に対する予測軌跡を表示する方法としたものである。以下、処理の流れを具体的に説明する。 FIG. 53 shows an example of a processing flow of a predicted trajectory display method different from that in FIG. In this example, the predicted trajectory for the unit to which the call is assigned is displayed. Hereinafter, the flow of processing will be specifically described.
まず、必要なデータを読み込み(L401)、次に、表示形式を選択する(L402)。この表示形式の選択は、例えば、表示項目の選択や表示時間の範囲設定が挙げられる。次に、表示対象のホール呼びHを過去に発生したホール呼びを記録したデータベースより検索する(L403)。次に、検索したホール呼びHに対して、実際に割当て決定した号機Kを過去のデータベースより検索する(L404)。その後、K号機に、上記で選択したホール呼びを割当てた場合の、K号機の予測軌跡の表示データ(A)を作成する(L405)。さらに、K号機以外の各号機の予測軌跡の表示データ(B)を作成する(L406)。次に、間隔評価時刻の表示データ(C)を作成する(L407)。以上の処理を終了後、ホール呼びHに対する割当て号機(K)とそれ以外の号機の予測軌跡の画像データとして、上記の(A)、(B)、(C)を合わせた画面を表示又はデータとして記憶させる(L408)。このような処理を実施することによって、図49〜図51のような表示画面データを作成できる。 First, necessary data is read (L401), and then a display format is selected (L402). Examples of selection of the display format include selection of display items and display time range setting. Next, the hall call H to be displayed is searched from a database in which hall calls generated in the past are recorded (L403). Next, for the retrieved hall call H, the machine K that has actually been assigned is searched from the past database (L404). Thereafter, display data (A) of the predicted trajectory of the K machine when the hall call selected above is assigned to the K car is created (L405). Furthermore, the display data (B) of the predicted trajectory of each unit other than the unit K is created (L406). Next, display data (C) of the interval evaluation time is created (L407). After the above processing is completed, a screen that combines the above (A), (B), and (C) is displayed or displayed as the image data of the predicted trajectory of the assigned unit (K) and the other units for the hall call H. (L408). By executing such processing, display screen data as shown in FIGS. 49 to 51 can be created.
1…群管理制御部、2…入力情報蓄積部、3…待ち時間評価値演算部、4…かご間隔評価値演算部、5…重み係数演算部、6…総合評価値演算部、7…割当てエレベータ決定部、8…重み係数設定部、10…ホール呼び発生数演算部、11…重み係数範囲演算部、12…重み係数初期値演算部、20…交通流判定部、21…重み係数最適解探索部、22…シミュレーション部、31A〜31C…A〜C号機制御装置、31A〜31C…A〜C号エレベータかご、41A,41B…ホール呼び釦、H01…割当て評価情報表示処理部、H02…判定部、H03…記録部、H04…描画処理部、H05…記録媒体、H06…出力部(表示部)。
DESCRIPTION OF
Claims (4)
各前記エレベータがホール呼び又はかご呼びを受け持っている有方向か、ホール呼び又はかご呼びを受け持っていない無方向かを判定し、
有方向の前記エレベータに対しては、ホール呼び及びかご呼びが発生していない階に対し、発生しているホール呼び及びかご呼びに対する停止時間と、交通流に対応した未発生のホール呼び及びかご呼びによる前記エレベータの停止確率とに基づいて、現時点から将来の所定時間内の各時間における各前記エレベータの予測階床位置及び方向を示す予測軌跡を作成するとともに、
無方向の前記エレベータに対しては、待機状態を続ける前記予測軌跡を作成し、
前記所定期間は、前記エレベータが複数周回する期間であり、
前記予測軌跡の2周目以降は、全て未発生のホール呼び及びかご呼びによる前記エレベータの停止確率に基づいた予測軌跡であることを特徴とするエレベータの群管理システム。 In an elevator group management system that manages multiple elevators that service multiple floors,
Determine whether each elevator is directional with a hall call or car call or no direction with no hall call or car call,
For a directional of the elevator hall calls and to floor the car call has not occurred, a stop time for a hall call calls and the car has occurred, hall call and car not occurred corresponding to traffic flow wherein based on the elevator stop probability by call, as well as create a predictive trajectory indicating a predicted floor position and direction of each of the elevator at each time within a predetermined future time from the present time,
For non-direction of the elevator, to create the predicted trajectory to continue waiting state,
The predetermined period is a period in which the elevator circulates a plurality of times,
2. The elevator group management system according to claim 2, wherein the second and subsequent rounds of the predicted trajectory are predicted trajectories based on the stop probability of the elevator caused by a hall call and a car call that have not occurred .
Priority Applications (5)
| Application Number | Priority Date | Filing Date | Title |
|---|---|---|---|
| JP2005280024A JP4800723B2 (en) | 2005-09-27 | 2005-09-27 | Elevator group management system and control method thereof |
| TW095132725A TW200722359A (en) | 2005-09-27 | 2006-09-05 | Elevator group management system and control method therefor |
| EP06019811A EP1767484B1 (en) | 2005-09-27 | 2006-09-21 | Elevator group management system and control method therefor |
| DE200660017941 DE602006017941D1 (en) | 2005-09-27 | 2006-09-21 | Control system and procedures for elevator groups |
| CN200610154380XA CN1939830B (en) | 2005-09-27 | 2006-09-26 | Elevator group management system and control method therefor |
Applications Claiming Priority (1)
| Application Number | Priority Date | Filing Date | Title |
|---|---|---|---|
| JP2005280024A JP4800723B2 (en) | 2005-09-27 | 2005-09-27 | Elevator group management system and control method thereof |
Publications (3)
| Publication Number | Publication Date |
|---|---|
| JP2007091378A JP2007091378A (en) | 2007-04-12 |
| JP2007091378A5 JP2007091378A5 (en) | 2007-09-06 |
| JP4800723B2 true JP4800723B2 (en) | 2011-10-26 |
Family
ID=37958414
Family Applications (1)
| Application Number | Title | Priority Date | Filing Date |
|---|---|---|---|
| JP2005280024A Active JP4800723B2 (en) | 2005-09-27 | 2005-09-27 | Elevator group management system and control method thereof |
Country Status (2)
| Country | Link |
|---|---|
| JP (1) | JP4800723B2 (en) |
| CN (1) | CN1939830B (en) |
Families Citing this family (20)
| Publication number | Priority date | Publication date | Assignee | Title |
|---|---|---|---|---|
| JP4434231B2 (en) * | 2007-05-08 | 2010-03-17 | 株式会社日立製作所 | Elevator group management system |
| JP4606475B2 (en) * | 2008-03-12 | 2011-01-05 | 株式会社日立製作所 | Elevator door control system and method |
| EP2261160B1 (en) * | 2008-04-03 | 2018-10-24 | Mitsubishi Electric Corporation | Group management device of elevator |
| CN101717026B (en) * | 2009-12-31 | 2015-07-01 | 上海杰远环保科技有限公司 | Saving type elevator recognition system and implementing method thereof |
| JP5965823B2 (en) * | 2012-11-12 | 2016-08-10 | 株式会社日立製作所 | Elevator group management system |
| JP5977655B2 (en) * | 2012-11-30 | 2016-08-24 | 株式会社日立製作所 | Elevator group management system |
| JP5847224B2 (en) * | 2014-03-14 | 2016-01-20 | 東芝エレベータ株式会社 | Elevator group management system |
| JP5951737B2 (en) * | 2014-11-28 | 2016-07-13 | 東芝エレベータ株式会社 | Elevator group management control device |
| JP6743978B2 (en) * | 2017-08-03 | 2020-08-19 | 三菱電機株式会社 | Elevator system |
| CN111108500B (en) * | 2017-08-08 | 2023-12-05 | 株式会社日立制作所 | Building simulator and building simulation method |
| CN109534118B (en) * | 2018-11-05 | 2020-11-10 | 永大电梯设备(中国)有限公司 | Intelligent control method for elevator running speed |
| CN110143498B (en) * | 2019-03-27 | 2021-03-09 | 浙江新再灵科技股份有限公司 | Target matching method and system for elevator taking travel |
| CN110002295B (en) * | 2019-03-28 | 2021-08-27 | 日立电梯(中国)有限公司 | Elevator operation control method based on probability data characteristics |
| JP7217670B2 (en) * | 2019-06-05 | 2023-02-03 | 株式会社日立ビルシステム | Elevator Operation Information Notification System, Elevator Operation Information Providing Method, and Elevator |
| JP6839259B1 (en) * | 2019-12-09 | 2021-03-03 | 東芝エレベータ株式会社 | Elevator group management control device |
| CN111401583A (en) * | 2020-03-18 | 2020-07-10 | 北京天泽智云科技有限公司 | Escalator full life cycle health management system based on predictive maintenance |
| CN111807171B (en) * | 2020-07-21 | 2022-07-05 | 安徽迅立达电梯有限公司 | Use distribution management system of intelligent elevator |
| CN112551288A (en) * | 2020-12-04 | 2021-03-26 | 深圳市普渡科技有限公司 | Ladder riding control method and device for robot, robot and medium |
| CN113860104B (en) * | 2021-09-18 | 2023-02-03 | 永大电梯设备(中国)有限公司 | Elevator group control performance index calculation system and method based on computer vision |
| CN115009941B (en) * | 2022-06-20 | 2023-09-05 | 浪潮卓数大数据产业发展有限公司 | Method and system for recommending idle elevator stop floors |
Family Cites Families (3)
| Publication number | Priority date | Publication date | Assignee | Title |
|---|---|---|---|---|
| JPH01203186A (en) * | 1988-02-04 | 1989-08-15 | Fujitec Co Ltd | Group control method of elevator |
| JPH04182285A (en) * | 1990-11-16 | 1992-06-29 | Mitsubishi Electric Corp | Transportation measuring device for elevator |
| ATE256625T1 (en) * | 1995-10-17 | 2004-01-15 | Inventio Ag | SAFETY DEVICE FOR MULTIMOBILE ELEVATOR GROUPS |
-
2005
- 2005-09-27 JP JP2005280024A patent/JP4800723B2/en active Active
-
2006
- 2006-09-26 CN CN200610154380XA patent/CN1939830B/en active Active
Also Published As
| Publication number | Publication date |
|---|---|
| CN1939830A (en) | 2007-04-04 |
| JP2007091378A (en) | 2007-04-12 |
| CN1939830B (en) | 2011-06-08 |
Similar Documents
| Publication | Publication Date | Title |
|---|---|---|
| JP4800723B2 (en) | Elevator group management system and control method thereof | |
| JP4139819B2 (en) | Elevator group management system | |
| JP4469897B2 (en) | Elevator group management system and elevator group management control method | |
| US7562746B2 (en) | Method, system, and display for elevator allocation using multi-dimensional coordinates | |
| JP2007284164A (en) | Method and system for controlling elevators in group | |
| JP2005519008A (en) | Passenger allocation method in elevator group | |
| JP4573741B2 (en) | Elevator group management system and control method thereof | |
| Lees-Miller | Minimising average passenger waiting time in personal rapid transit systems | |
| CN102583119A (en) | Elevator Group Management And Control Device | |
| JP2014172718A (en) | Elevator traffic demand predicting system | |
| JP4763403B2 (en) | Elevator group management system and control method thereof | |
| JP2008280093A (en) | Group supervisory operation system of elevator | |
| Sun et al. | Optimization of group elevator scheduling with advance information | |
| WO2023061959A1 (en) | Control of a complex environment | |
| Liu et al. | A pareto-based particle swarm optimization algorithm for multi-objective location routing problem. | |
| Levy et al. | Optimal control of elevators | |
| JP2021004133A (en) | Elevator group management system | |
| EP1767484B1 (en) | Elevator group management system and control method therefor | |
| Zhang et al. | Energy-saving-oriented group-elevator dispatching strategy for multi-traffic patterns | |
| La Rocca et al. | Heuristics for electric taxi fleet management at Teo Taxi | |
| Maleki et al. | A Game-theoretic approach to energy-efficient elevator scheduling in smart buildings | |
| JP2014108854A (en) | Group control system of elevator | |
| JP6503313B2 (en) | Group management control device and group management control system | |
| Huang et al. | Modelling the pedestrian’s willingness to walk on the subway platform: A novel approach to analyze in-vehicle crowd congestion | |
| JP2021179778A (en) | Information processor, solution method, and solution program |
Legal Events
| Date | Code | Title | Description |
|---|---|---|---|
| A521 | Written amendment |
Free format text: JAPANESE INTERMEDIATE CODE: A523 Effective date: 20070719 |
|
| A621 | Written request for application examination |
Free format text: JAPANESE INTERMEDIATE CODE: A621 Effective date: 20070719 |
|
| A977 | Report on retrieval |
Free format text: JAPANESE INTERMEDIATE CODE: A971007 Effective date: 20100416 |
|
| A131 | Notification of reasons for refusal |
Free format text: JAPANESE INTERMEDIATE CODE: A131 Effective date: 20100420 |
|
| A521 | Written amendment |
Free format text: JAPANESE INTERMEDIATE CODE: A523 Effective date: 20100615 |
|
| A131 | Notification of reasons for refusal |
Free format text: JAPANESE INTERMEDIATE CODE: A131 Effective date: 20101214 |
|
| A521 | Written amendment |
Free format text: JAPANESE INTERMEDIATE CODE: A523 Effective date: 20110214 |
|
| TRDD | Decision of grant or rejection written | ||
| A01 | Written decision to grant a patent or to grant a registration (utility model) |
Free format text: JAPANESE INTERMEDIATE CODE: A01 Effective date: 20110802 |
|
| A01 | Written decision to grant a patent or to grant a registration (utility model) |
Free format text: JAPANESE INTERMEDIATE CODE: A01 |
|
| A61 | First payment of annual fees (during grant procedure) |
Free format text: JAPANESE INTERMEDIATE CODE: A61 Effective date: 20110804 |
|
| FPAY | Renewal fee payment (event date is renewal date of database) |
Free format text: PAYMENT UNTIL: 20140812 Year of fee payment: 3 |
|
| R150 | Certificate of patent or registration of utility model |
Ref document number: 4800723 Country of ref document: JP Free format text: JAPANESE INTERMEDIATE CODE: R150 Free format text: JAPANESE INTERMEDIATE CODE: R150 |