JP4542010B2 - Trend graph display method and apparatus - Google Patents
Trend graph display method and apparatus Download PDFInfo
- Publication number
- JP4542010B2 JP4542010B2 JP2005279830A JP2005279830A JP4542010B2 JP 4542010 B2 JP4542010 B2 JP 4542010B2 JP 2005279830 A JP2005279830 A JP 2005279830A JP 2005279830 A JP2005279830 A JP 2005279830A JP 4542010 B2 JP4542010 B2 JP 4542010B2
- Authority
- JP
- Japan
- Prior art keywords
- predetermined time
- time interval
- value
- maximum value
- minimum value
- Prior art date
- Legal status (The legal status is an assumption and is not a legal conclusion. Google has not performed a legal analysis and makes no representation as to the accuracy of the status listed.)
- Active
Links
Images


Classifications
-
- Y—GENERAL TAGGING OF NEW TECHNOLOGICAL DEVELOPMENTS; GENERAL TAGGING OF CROSS-SECTIONAL TECHNOLOGIES SPANNING OVER SEVERAL SECTIONS OF THE IPC; TECHNICAL SUBJECTS COVERED BY FORMER USPC CROSS-REFERENCE ART COLLECTIONS [XRACs] AND DIGESTS
- Y02—TECHNOLOGIES OR APPLICATIONS FOR MITIGATION OR ADAPTATION AGAINST CLIMATE CHANGE
- Y02E—REDUCTION OF GREENHOUSE GAS [GHG] EMISSIONS, RELATED TO ENERGY GENERATION, TRANSMISSION OR DISTRIBUTION
- Y02E30/00—Energy generation of nuclear origin
- Y02E30/30—Nuclear fission reactors
Landscapes
- Monitoring And Testing Of Nuclear Reactors (AREA)
- Testing And Monitoring For Control Systems (AREA)
Description
この発明は、所定周期で収集されたデータの変化をグラフ化して表示するトレンドグラフ表示方法および装置に関するものである。 The present invention relates to a trend graph display method and apparatus for graphing and displaying changes in data collected at a predetermined period.
従来より、プラントや建物などの施設には、設備の状態や室内の状態などを監視する監視システムが設けられている(例えば、特許文献1参照)。この監視システムは、中央監視装置を有し、中央監視装置には通信回線を介してコントローラが接続されている。コントローラは、各機器の制御を担当するとともに、機器の運転状態を示すデータや施設内の温度や湿度など各種のデータを所定周期(例えば、1分周期)で収集し、蓄積する。 Conventionally, facilities such as plants and buildings have been provided with a monitoring system for monitoring the state of equipment, the state of a room, and the like (see, for example, Patent Document 1). This monitoring system has a central monitoring device, and a controller is connected to the central monitoring device via a communication line. The controller is in charge of controlling each device, and collects and stores data indicating the operation state of the device and various data such as temperature and humidity in the facility at a predetermined cycle (for example, one minute cycle).
中央監視装置側にはオペレータがいる。オペレータは、中央監視装置のディスプレイ上に、データを指定してそのトレンドグラフを表示させることができる。例えば、所望の部屋の温度データを指定すると、その温度データが蓄積されているコントローラへデータの送信要求が送られる。コントローラは、中央監視装置からの送信要求を受けて、指定された温度データを中央監視装置へ返送する。例えば、トレンドグラフの表示区間(表示対象期間)を2日とした場合、コントローラに時系列に蓄積されている2日分の温度データ(2日分の全ての時系列データ)を中央監視装置に返送する。中央監視装置は、コントローラから送られてくる温度データの全てを取得した後、その取得した温度データを第1軸(横軸)を時間軸、第2軸(縦軸)をデータ軸としてディスプレイ上にプロットし、折れ線で結び、トレンドグラフとして表示する(特許文献2、特許文献3参照)。
There is an operator on the central monitoring device side. The operator can designate the data and display the trend graph on the display of the central monitoring device. For example, when temperature data of a desired room is specified, a data transmission request is sent to the controller in which the temperature data is stored. In response to the transmission request from the central monitoring device, the controller returns the specified temperature data to the central monitoring device. For example, when the trend graph display section (display target period) is 2 days, the temperature data for 2 days (all time series data for 2 days) stored in the controller in time series is stored in the central monitoring device. Return it. The central monitoring device acquires all the temperature data sent from the controller, and then displays the acquired temperature data on the display with the first axis (horizontal axis) as the time axis and the second axis (vertical axis) as the data axis. Are plotted with a broken line and displayed as a trend graph (see
しかしながら、上述した従来のトレンドグラフの表示方法によると、例えば1分周期のデータを2日分(48時間)グラフ表示するとなると、2880個(60×48=2880)のデータをプロットし、その全てを折れ線で結ばなければならず、トレンドグラフの描画にかなりの時間(10秒程度)を要するという問題があった。 However, according to the conventional trend graph display method described above, for example, if data for a period of one minute is displayed as a graph for two days (48 hours), 2880 (60 × 48 = 2880) data are plotted, all of which are plotted. There is a problem that it takes a considerable time (about 10 seconds) to draw a trend graph.
なお、描画時間を短縮するための1つの方法として、例えば1分周期のデータから10分毎のデータを抽出し、その抽出したデータをプロットし、折れ線で結ぶという方法が考えられる。しかし、このような方法では、時系列に連続する1分周期のデータを単に10個間隔で抽出するのみであるため、トレンドの起伏が消えたり、出現したりするという現象が発生し、データの変化を正確にグラフ化して表示することができない。 As one method for reducing the drawing time, for example, a method of extracting data every 10 minutes from 1-minute data, plotting the extracted data, and connecting them with a broken line is conceivable. However, in such a method, since data having a 1-minute period continuous in time series are simply extracted at intervals of 10 pieces, the phenomenon that the undulation of the trend disappears or appears occurs. The change cannot be accurately graphed and displayed.
本発明は、このような課題を解決するためになされたもので、その目的とするところは、描画時間の短縮と正確なグラフ表示の両立を図ることができるトレンドグラフ表示方法および装置を提供することにある。 The present invention has been made to solve such a problem, and an object of the present invention is to provide a trend graph display method and apparatus capable of reducing both drawing time and accurate graph display. There is.
このような目的を達成するために、本発明に係るトレンドグラフ表示方法は、メモリに格納されているプログラムに従うコンピュータの処理動作によって所定周期で収集されたデータの変化をグラフ化して表示するトレンドグラフ表示方法において、コンピュータに、所定時間間隔毎にその所定時間間隔内の所定周期で収集されたデータの最大値と最小値とを抽出する抽出ステップと、第1軸を時間軸、この第1軸に直交する第2軸をデータ値を示すデータ軸、第1軸における所定時間間隔に相当する長さをそのライン幅として、所定時間間隔毎にその所定時間間隔内の最大値と最小値とを結ぶラインを第2軸に平行に描画する描画ステップとを実行させるようにしたものであり、描画ステップでは、隣接する所定時間間隔の一方を今回の所定時間間隔、他方を前回の所定時間間隔とし、今回の所定時間間隔内の最小値が前回の所定時間間隔内の最大値よりも大きい場合、今回の所定時間間隔内の最小値を前回の所定時間間隔内の最大値からライン幅に相当する値αを減じた値に置き換えて、今回の所定時間間隔内の最大値と最小値とを結ぶラインを描画し、今回の所定時間間隔内の最大値が前回の所定時間間隔内の最小値よりも小さい場合、今回の所定時間間隔内の最大値を前回の所定時間間隔内の最小値にライン幅に相当する値αを増じた値に置き換えて、今回の所定時間間隔内の最大値と最小値とを結ぶラインを描画し、所定時間間隔内の最大値と最小値とが等しく、その状態が連続する場合、第1軸に平行な線を一気に描画することを特徴とする。 In order to achieve such an object, a trend graph display method according to the present invention is a trend graph that displays a graph of changes in data collected at a predetermined period by a processing operation of a computer according to a program stored in a memory. In the display method, an extraction step of extracting a maximum value and a minimum value of data collected at a predetermined period within a predetermined time interval for each predetermined time interval, a first axis as a time axis, and the first axis The second axis orthogonal to the data axis indicating the data value, the length corresponding to the predetermined time interval on the first axis as the line width, and the maximum and minimum values within the predetermined time interval for each predetermined time interval the line connecting is obtained by so as to perform the rendering step in parallel to draw the second axis, the drawing step, one of the adjacent predetermined time interval of the current place If the time interval is the previous predetermined time interval and the minimum value in the current predetermined time interval is greater than the maximum value in the previous predetermined time interval, the minimum value in the current predetermined time interval is set to the previous predetermined time interval. Replace the maximum value in the interval with the value α corresponding to the line width, draw a line connecting the maximum value and the minimum value in the current predetermined time interval, and the maximum value in the current predetermined time interval Is smaller than the minimum value in the previous predetermined time interval, the maximum value in the current predetermined time interval is replaced with the minimum value in the previous predetermined time interval and the value α corresponding to the line width increased. When a line connecting the maximum value and the minimum value within the predetermined time interval is drawn and the maximum value and the minimum value within the predetermined time interval are equal and the state continues, a line parallel to the first axis is drawn. It is characterized by drawing at a stretch.
この発明によれば、例えば、所定周期を1分、所定時間間隔を10分とすると、10分毎に、その10分間内の1分周期のデータの最大値と最小値が抽出され、この最大値と最小値とを結ぶラインが第2軸(データ軸)に平行に描画される。この場合、そのラインの幅は、第1軸(時間軸)における10分間に相当する長さとされる。例えば、第1軸における10分間に相当する長さを1ピクセルとすると、1ピクセル毎に1ピクセルのライン幅でその1ピクセル内のデータの最大値と最小値とを結ぶラインが第2軸に平行に描画される。 According to the present invention, for example, assuming that the predetermined period is 1 minute and the predetermined time interval is 10 minutes, the maximum value and the minimum value of the 1-minute period data within 10 minutes are extracted every 10 minutes. A line connecting the value and the minimum value is drawn parallel to the second axis (data axis). In this case, the width of the line is a length corresponding to 10 minutes on the first axis (time axis). For example, if the length corresponding to 10 minutes in the first axis is 1 pixel, a line connecting the maximum value and the minimum value of the data in that pixel with a line width of 1 pixel per pixel is on the second axis. It is drawn in parallel.
本発明において、今回の所定時間間隔内の最小値が前回の所定時間間隔内の最大値よりも大きく、今回の所定時間間隔に対して描画されるラインと前回の所定時間間隔に対して描画されるラインとが連続しない場合があり得る。このような場合、本発明では、今回の所定時間間隔内の最小値を前回の所定時間間隔内の最大値からライン幅に相当する値αを減じた値に置き換えて、今回の所定時間間隔内の最大値と最小値とを結ぶラインが描画される。例えば、ライン幅を1ピクセルとした場合にはαを1ピクセル、ライン幅を2ピクセルとした場合にはαを2ピクセルとし、今回の所定時間間隔内の最大値と最小値とを結ぶラインと前回の所定時間間隔内の最大値と最小値とを結ぶラインとが同じ線幅でつながるようにされる。In the present invention, the minimum value in the current predetermined time interval is larger than the maximum value in the previous predetermined time interval, and the line drawn for the current predetermined time interval and the previous predetermined time interval are drawn. It is possible that the line is not continuous. In such a case, the present invention replaces the minimum value within the current predetermined time interval with a value obtained by subtracting the value α corresponding to the line width from the maximum value within the previous predetermined time interval, and within the current predetermined time interval. A line connecting the maximum value and the minimum value is drawn. For example, when the line width is 1 pixel, α is 1 pixel, and when the line width is 2 pixels, α is 2 pixels, and the line connecting the maximum value and the minimum value within the predetermined time interval is The line connecting the maximum value and the minimum value within the previous predetermined time interval is connected with the same line width.
本発明において、今回の所定時間間隔内の最大値が前回の所定時間間隔内の最小値よりも小さく、今回の所定時間間隔に対して描画されるラインと前回の所定時間間隔に対して描画されるラインとが連続しない場合があり得る。このような場合、本発明では、今回の所定時間間隔内の最大値を前回の所定時間間隔内の最小値にライン幅に相当する値αを増じた値に置き換えて、今回の所定時間間隔内の最大値と最小値とを結ぶラインが描画される。例えば、ライン幅を1ピクセルとした場合にはαを1ピクセル、ライン幅を2ピクセルとした場合にはαを2ピクセルとし、今回の所定時間間隔内の最大値と最小値とを結ぶラインと前回の所定時間間隔内の最大値と最小値とを結ぶラインとが同じ線幅でつながるようにされる。In the present invention, the maximum value in the current predetermined time interval is smaller than the minimum value in the previous predetermined time interval, and the line drawn for the current predetermined time interval and the previous predetermined time interval are drawn. It is possible that the line is not continuous. In such a case, the present invention replaces the maximum value in the present predetermined time interval with the minimum value in the previous predetermined time interval and a value obtained by adding the value α corresponding to the line width to the present predetermined time interval. A line connecting the maximum value and the minimum value is drawn. For example, when the line width is 1 pixel, α is 1 pixel, and when the line width is 2 pixels, α is 2 pixels, and the line connecting the maximum value and the minimum value within the predetermined time interval is The line connecting the maximum value and the minimum value within the previous predetermined time interval is connected with the same line width.
また、本発明において、所定時間間隔内の最大値と最小値とが等しく、その状態が連続する場合には、縦線を1つずつつなげて行くのではなく、横線(第1軸に平行な線)が一気に描画される。Further, in the present invention, when the maximum value and the minimum value within a predetermined time interval are equal and the state continues, the vertical lines are not connected one by one but instead of the horizontal lines (parallel to the first axis). Line) is drawn at once.
なお、本発明は、トレンドグラフ表示方法としてではなく、トレンドグラフ表示装置としても実現することが可能である。本願の請求項2の発明は、請求項1のトレンドグラフ表示方法を適用したトレンドグラフ表示装置に関するものである。
The present invention can be implemented not as a trend graph display method but also as a trend graph display device. The invention of
本発明によれば、第1軸を時間軸、この第1軸に直交する第2軸をデータ軸、第1軸における所定時間間隔に相当する長さをそのライン幅として、所定時間間隔毎にその所定時間間隔内の所定周期で収集されたデータの最大値と最小値とを結ぶラインを第2軸に平行に描画するようにし、今回の所定時間間隔内の最小値が前回の所定時間間隔内の最大値よりも大きい場合、今回の所定時間間隔内の最小値を前回の所定時間間隔内の最大値からライン幅に相当する値αを減じた値に置き換えて、今回の所定時間間隔内の最大値と最小値とを結ぶラインを描画し、今回の所定時間間隔内の最大値が前回の所定時間間隔内の最小値よりも小さい場合、今回の所定時間間隔内の最大値を前回の所定時間間隔内の最小値にライン幅に相当する値αを増じた値に置き換えて、今回の所定時間間隔内の最大値と最小値とを結ぶラインを描画し、所定時間間隔内の最大値と最小値とが等しく、その状態が連続する場合、第1軸に平行な線を一気に描画するようにしたので、描画するラインの数を削減して描画時間の短縮を図ると共に、所定時間間隔内のデータから最大値と最小値とを取り出して正確なグラフ表示を行うことが可能となる。 According to the present invention, the first axis is the time axis, the second axis orthogonal to the first axis is the data axis, and the length corresponding to the predetermined time interval in the first axis is the line width. A line connecting the maximum value and the minimum value of data collected at a predetermined period within the predetermined time interval is drawn in parallel to the second axis, and the minimum value within the predetermined time interval is the previous predetermined time interval. If the value is larger than the maximum value, the minimum value in the current predetermined time interval is replaced with the value obtained by subtracting the value α corresponding to the line width from the maximum value in the previous predetermined time interval. When a line connecting the maximum value and the minimum value is drawn and the maximum value in the current predetermined time interval is smaller than the minimum value in the previous predetermined time interval, the maximum value in the current predetermined time interval is The value α corresponding to the line width is increased to the minimum value within the predetermined time interval. If the line connecting the maximum value and the minimum value within the predetermined time interval is drawn and the maximum value and the minimum value within the predetermined time interval are equal and the state continues, Since parallel lines are drawn all at once, the number of lines to be drawn is reduced to shorten the drawing time, and the maximum and minimum values are extracted from data within a predetermined time interval for accurate graph display. Can be done.
以下、本発明を図面に基づいて詳細に説明する。図1はこの発明に係るトレンドグラフ表示方法の実施に用いる監視システムの一例の要部を示すブロック構成図である。 Hereinafter, the present invention will be described in detail with reference to the drawings. FIG. 1 is a block diagram showing a main part of an example of a monitoring system used for implementing a trend graph display method according to the present invention.
同図において、1はビルの中央監視室に設けられた中央監視装置、2はビル内に分散して設けられたコントローラ、3は空調設備や熱源設備,照明設備などの設備である。中央監視装置1とコントローラ2とは通信回線4を介して接続されている。
In the figure, 1 is a central monitoring device provided in the central monitoring room of the building, 2 is a controller distributed in the building, and 3 is equipment such as air conditioning equipment, heat source equipment, lighting equipment and the like. The
この例では、コントローラ2−1が空調設備3−1に対して設けられ、コントローラ2−2が熱源設備3−2に対して設けられ、コントローラ2−3が照明設備3−3に対して設けられている。 In this example, the controller 2-1 is provided for the air conditioning equipment 3-1, the controller 2-2 is provided for the heat source equipment 3-2, and the controller 2-3 is provided for the lighting equipment 3-3. It has been.
コントローラ2−1は、空調設備3−1の各機器の制御を担当するとともに、空調設備3−1の各機器の運転状態を示すデータや各部屋の室内温度などの各種のデータを例えば1分周期で収集し、自己のメモリに蓄積する。 The controller 2-1 is in charge of controlling each device of the air conditioning equipment 3-1, and also provides various data such as the data indicating the operation state of each device of the air conditioning equipment 3-1 and the room temperature of each room for 1 minute. Collected in cycles and stored in its own memory.
コントローラ2−2は、熱源設備3−2の各機器の制御を担当するとともに、熱源設備3−2の各機器の運転状態を示すデータや熱源水の温度などの各種のデータを例えば1分周期で収集し、自己のメモリに蓄積する。 The controller 2-2 is in charge of controlling each device of the heat source facility 3-2, and various data such as the data indicating the operation state of each device of the heat source facility 3-2 and the temperature of the heat source water are, for example, 1 minute cycle Collected and stored in its own memory.
コントローラ2−3は、照明設備3−3の各機器の制御を担当するとともに、照明設備3−2の各機器の運転状態を示すデータや電力量などの各種のデータを例えば1分周期で収集し、自己のメモリに蓄積する。 The controller 2-3 is in charge of controlling each device of the lighting equipment 3-3, and collects various data such as data indicating the operation state of each device of the lighting equipment 3-2 and electric energy at a cycle of 1 minute, for example. And store it in its own memory.
図2は、中央監視装置1のハードウエア構成の概略を示す図である。同図において、1−1はCPU、1−2はRAM、1−3はROM、1−4はハードディスクなどの記憶装置、1−5〜1−7はインターフェイス、1−8はディスプレイ、1−9はキーボード、1−10はマウスである。
FIG. 2 is a diagram showing an outline of the hardware configuration of the
CPU1−1は、インターフェイス1−5〜1−7を介して与えられる各種入力情報を得て、RAM1−2にアクセスしながら、ROM1−3や記憶装置1−4に格納されたプログラムに従って動作する。記憶装置1−4には、本実施の形態特有のプログラムとして、トレンドグラフ表示プログラムが格納されている。このトレンドグラフ表示プログラムは、例えばCD−ROMなどの記録媒体に記録された状態で提供され、この記録媒体から読み出されて記憶装置1−4にインストールされている。 The CPU 1-1 obtains various input information given through the interfaces 1-5 to 1-7, and operates according to programs stored in the ROM 1-3 and the storage device 1-4 while accessing the RAM 1-2. . The storage device 1-4 stores a trend graph display program as a program unique to the present embodiment. The trend graph display program is provided in a state of being recorded on a recording medium such as a CD-ROM, for example, and is read from the recording medium and installed in the storage device 1-4.
〔実施の形態1〕
以下、記憶装置1−4に格納されているトレンドグラフ表示プログラムに従うCPU1−1の処理動作について説明する。
[Embodiment 1]
Hereinafter, the processing operation of the CPU 1-1 according to the trend graph display program stored in the storage device 1-4 will be described.
オペレータにより、ディスプレイ1−8上で、トレンドグラフとして例えばアナログデータの計測点としてA0点が選択されると、CPU1−1は、A0点のデータが蓄積されているコントローラ2へデータの送信要求を送る。
When the operator selects, for example, A0 point as a measurement point of analog data as a trend graph on the display 1-8, the CPU 1-1 sends a data transmission request to the
なお、この実施の形態では、例えば、ディスプレイ1−8にビルの各階の平面図が表示され、その平面図内に各種管理ポイントの名称が表示されるものとする。この平面図上で、A0点を選択指定することにより、コントローラ2へデータの送信要求が送られる。また、本実施の形態において、トレンドグラフの表示区間は2日(48時間)と定められているものとする。
In this embodiment, for example, a plan view of each floor of the building is displayed on the display 1-8, and names of various management points are displayed in the plan view. By selecting and specifying the point A0 on this plan view, a data transmission request is sent to the
中央監視装置1からのデータの送信要求を受けて、コントローラ2は、自己のメモリに時系列に蓄積されているA0点の2日分のデータ(1分周期で収集された48時間分のデータ(2880個))を中央監視装置1へ返送する。
Upon receiving a data transmission request from the
CPU1−1は、コントローラ2から返送されてくるA0点の2日分のデータを受信し、この2日分のデータから10分毎にその10分間内の1分周期で収集されたデータの最大値と最小値を抽出する。すなわち、10分を1つのサンプリング期間(所定時間間隔)とし、このサンプリング期間内のデータの最大値と最小値を抽出する。この最大値と最小値の抽出は、10分間内の1分周期のデータを順に大小比較し、その都度、最小と最大を決定して行くことによって行う。
The CPU 1-1 receives the data for 2 days of A0 point returned from the
まず、10分間内の最初のデータD1と次のデータD2とを比較し、D1>D2であれば、最大=D1、最小=D2とする。次に、D3と最大とを比較し、D3>最大であれば、最大=D3とする。そうでなければ、D3と最小とを比較し、D3<最小であれば、最小=D3とする。これを10分間内の1分周期のデータに対して順次行って行くことにより、その10分間内の最大値と最小値を決定する。 First, the first data D1 and the next data D2 within 10 minutes are compared, and if D1> D2, maximum = D1 and minimum = D2. Next, D3 is compared with the maximum, and if D3> maximum, the maximum = D3. Otherwise, D3 is compared with the minimum, and if D3 <minimum, the minimum = D3. This is sequentially performed on data having a 1-minute period within 10 minutes, thereby determining the maximum value and the minimum value within the 10 minutes.
そして、図3に示すように、第1軸(横軸)を時間軸、この第1軸に直交する第2軸(縦軸)をデータ値を示すデータ軸、第1軸における10分間に相当する長さWをそのライン幅として、10分毎にその10分間内の最大値と最小値とを結ぶラインLを第2軸(データ軸)に平行に描画する。図4にこの描画ルールに従って描画されたA0点のデータのトレンドグラフ(表示区間:48時間)を例示する。 As shown in FIG. 3, the first axis (horizontal axis) is the time axis, the second axis (vertical axis) orthogonal to the first axis is the data axis indicating the data value, and the first axis corresponds to 10 minutes. The line L connecting the maximum value and the minimum value within the 10 minutes is drawn in parallel with the second axis (data axis) every 10 minutes with the length W to be processed as the line width. FIG. 4 shows an example of a trend graph (display interval: 48 hours) of data at point A0 drawn according to this drawing rule.
このトレンドグラフでは、1分周期のデータを1つずつ折れ線で結ぶ場合と比較して、描画するラインの数が大幅に削減され、描画時間の大幅な短縮が図られる。例えば、1分周期のデータを1つずつ折れ線で結ぶ場合には10秒程度の描画時間を必要としていたのに対し、本実施の形態では1秒程度の描画時間となる。また、従来のトレンドグラフでは斜めの線の連続であったの対し、本実施の形態では縦の線の連続となり、グラフィックドライバレベルにおいても描画負荷が軽減される。また、10分間内のデータの最大値と最小値とが結ばれるので、10分間内の各データを1つ1つ結んでいた線と同じような結果となり、トレンドの起伏が消えたり、出現したりするという現象が発生しない、正確なグラフ表示が可能となる。 In this trend graph, the number of lines to be drawn is greatly reduced and the drawing time is greatly reduced as compared with the case of connecting one-minute period data one by one with a broken line. For example, when connecting 1-minute data one by one with a broken line, a drawing time of about 10 seconds is required, whereas in the present embodiment, a drawing time of about 1 second is required. Further, in contrast to the conventional trend graph in which the diagonal lines are continuous, in the present embodiment, the vertical lines are continuous, and the drawing load is reduced even at the graphic driver level. In addition, since the maximum and minimum values of the data within 10 minutes are connected, the result is similar to the line connecting each data within 10 minutes one by one, and the trend undulation disappears or appears. This makes it possible to display an accurate graph without causing the phenomenon that
〔実施の形態2〕
上述した実施の形態1において、隣接するサンプリング期間(10分)の一方を今回のサンプリング期間、他方を前回のサンプリング期間とした場合、今回のサンプリング期間内の最小値が前回のサンプリング期間内の最大値よりも大きく、今回のサンプリング期間に対して描画されるラインと前回のサンプリング期間に対して描画されるラインとが連続しない場合があり得る。
[Embodiment 2]
In the first embodiment described above, when one of the adjacent sampling periods (10 minutes) is the current sampling period and the other is the previous sampling period, the minimum value in the current sampling period is the maximum in the previous sampling period. The line drawn for the current sampling period and the line drawn for the previous sampling period may not be continuous.
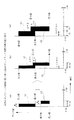
図5(a)にその一例を示す。図5(a)において、S1を前回のサンプリング期間、S2を今回のサンプリング期間とする。この場合、今回のサンプリング期間S2内の最小値が前回のサンプリング期間S1内の最大値よりも大きく、今回のサンプリング期間S2に対して描画されるラインL2と前回のサンプリング期間S1に対して描画されるラインL1とが連続しない。 An example is shown in FIG. In FIG. 5A, S1 is the previous sampling period, and S2 is the current sampling period. In this case, the minimum value in the current sampling period S2 is larger than the maximum value in the previous sampling period S1, and the line L2 drawn for the current sampling period S2 and the previous sampling period S1 are drawn. The line L1 is not continuous.
このような場合を想定し、実施の形態2では、今回のサンプリング期間S2内の最小値が前回のサンプリング期間S1内の最大値よりも大きい場合、今回のサンプリング期間S2内の最小値を前回のサンプリング期間S1内の最大値に置き換えて、今回のサンプリング期間S2の最大値と最小値とを結ぶラインL2を描画するようにする。これにより、図5(b)に示されるように、今回のサンプリング期間S2に対して描画されるラインL2と前回のサンプリング期間S1に対して描画されるラインL1とが連続するようになる。 Assuming such a case, in the second embodiment, when the minimum value in the current sampling period S2 is larger than the maximum value in the previous sampling period S1, the minimum value in the current sampling period S2 is set to the previous value. The line L2 connecting the maximum value and the minimum value of the current sampling period S2 is drawn instead of the maximum value in the sampling period S1. As a result, as shown in FIG. 5B, the line L2 drawn for the current sampling period S2 and the line L1 drawn for the previous sampling period S1 become continuous.
〔実施の形態3〕
上述した実施の形態1において、隣接するサンプリング期間(10分)の一方を今回のサンプリング期間、他方を前回のサンプリング期間とした場合、今回のサンプリング期間内の最大値が前回のサンプリング期間内の最小値よりも小さく、今回のサンプリング期間に対して描画されるラインと前回のサンプリング期間に対して描画されるラインとが連続しない場合があり得る。
[Embodiment 3]
In the first embodiment described above, when one of the adjacent sampling periods (10 minutes) is the current sampling period and the other is the previous sampling period, the maximum value in the current sampling period is the minimum in the previous sampling period. The line drawn for the current sampling period and the line drawn for the previous sampling period may not be continuous.
図6(a)にその一例を示す。図6(a)において、S1を前回のサンプリング期間、S2を今回のサンプリング期間とする。この場合、今回のサンプリング期間S2内の最大値が前回のサンプリング期間S1内の最小値よりも小さく、今回のサンプリング期間S2に対して描画されるラインL2と前回のサンプリング期間S1に対して描画されるラインL1とが連続しない。 An example is shown in FIG. In FIG. 6A, S1 is the previous sampling period, and S2 is the current sampling period. In this case, the maximum value in the current sampling period S2 is smaller than the minimum value in the previous sampling period S1, and the line L2 drawn for the current sampling period S2 and the previous sampling period S1 are drawn. The line L1 is not continuous.
このような場合を想定し、実施の形態3では、今回のサンプリング期間S2内の最大値が前回のサンプリング期間S1内の最小値よりも小さい場合、今回のサンプリング期間S2内の最大値を前回のサンプリング期間S1内の最小値に置き換えて、今回のサンプリング期間S2の最大値と最小値とを結ぶラインL2を描画するようにする。これにより、図6(b)に示されるように、今回のサンプリング期間S2に対して描画されるラインL2と前回のサンプリング期間S1に対して描画されるラインL1とが連続するようになる。 Assuming such a case, in the third embodiment, when the maximum value in the current sampling period S2 is smaller than the minimum value in the previous sampling period S1, the maximum value in the current sampling period S2 is set to the previous value. The line L2 connecting the maximum value and the minimum value of the current sampling period S2 is drawn instead of the minimum value in the sampling period S1. Thereby, as shown in FIG. 6B, the line L2 drawn for the current sampling period S2 and the line L1 drawn for the previous sampling period S1 become continuous.
〔実施の形態4〕
実施の形態2(図5)では、今回のサンプリング期間内の最小値が前回のサンプリング期間内の最大値よりも大きい場合、今回のサンプリング期間内の最小値を前回のサンプリング期間内の最大値に置き換えて、今回のサンプリング期間内の最大値と最小値とを結ぶラインを描画するために、今回のサンプリング期間内の最大値と最小値とを結ぶラインと前回のサンプリング期間内の最大値と最小値とを結ぶラインとがそのラインの角同士でつながることになる(図5(b))。この場合、連続性は維持されるが、そのライン幅が途中で急に細くなり、歪みのある見にくいグラフとなってしまう。
[Embodiment 4]
In the second embodiment (FIG. 5), when the minimum value in the current sampling period is larger than the maximum value in the previous sampling period, the minimum value in the current sampling period is changed to the maximum value in the previous sampling period. In order to draw a line connecting the maximum and minimum values in the current sampling period, the line connecting the maximum and minimum values in the current sampling period, and the maximum and minimum values in the previous sampling period. The line connecting the values is connected at the corners of the line (FIG. 5B). In this case, continuity is maintained, but the line width suddenly narrows in the middle, resulting in a distorted and difficult-to-see graph.
そこで、実施の形態4では、今回のサンプリング期間内の最小値が前回のサンプリング期間内の最大値よりも大きい場合、今回のサンプリング期間内の最小値を前回のサンプリング期間内の最大値からライン幅Wに相当する値αを減じた値に置き換えて、今回のサンプリング期間内の最大値と最小値とを結ぶラインを描画するようにする。 Therefore, in the fourth embodiment, when the minimum value in the current sampling period is larger than the maximum value in the previous sampling period, the line width is changed from the minimum value in the current sampling period to the maximum value in the previous sampling period. The value α corresponding to W is replaced with a value obtained by subtracting the value, and a line connecting the maximum value and the minimum value in the current sampling period is drawn.
図7にその一例を示す。図7(a)に示すように、今回のサンプリング期間S2内の最小値が前回のサンプリング期間S1内の最大値よりも大きい場合、図7(b)に示すように、今回のサンプリング期間S2内の最小値を前回のサンプリング期間S1内の最大値からライン幅Wに相当する値αを減じた値に置き換えて、今回のサンプリング期間S2内の最大値と最小値とを結ぶラインL2を描画する。 An example is shown in FIG. As shown in FIG. 7A, when the minimum value in the current sampling period S2 is larger than the maximum value in the previous sampling period S1, as shown in FIG. 7B, within the current sampling period S2. Is replaced with a value obtained by subtracting the value α corresponding to the line width W from the maximum value in the previous sampling period S1, and the line L2 connecting the maximum value and the minimum value in the current sampling period S2 is drawn. .
例えば、ライン幅Wを1ピクセルとした場合にはαを1ピクセルとし(図7(b))、ライン幅Wを2ピクセルとした場合にはαを2ピクセルとし(図7(c))、今回のサンプリング期間S2内の最大値と最小値とを結ぶラインL2と前回のサンプリング期間S1内の最大値と最小値とを結ぶラインL1とが同じ線幅でつながるようする。これにより、ライン幅が途中で急に細くなることがなくなり、見易いトレンドグラフとなる。 For example, when the line width W is 1 pixel, α is 1 pixel (FIG. 7B), and when the line width W is 2 pixels, α is 2 pixels (FIG. 7C). The line L2 connecting the maximum value and the minimum value in the current sampling period S2 and the line L1 connecting the maximum value and the minimum value in the previous sampling period S1 are connected with the same line width. As a result, the line width is not suddenly reduced in the middle, and the trend graph is easy to see.
〔実施の形態5〕
実施の形態3(図6)では、今回のサンプリング期間内の最大値が前回のサンプリング期間内の最小値よりも小さい場合、今回のサンプリング期間内の最大値を前回のサンプリング期間内の最小値に置き換えて、今回のサンプリング期間内の最大値と最小値とを結ぶラインを描画するために、今回のサンプリング期間内の最大値と最小値とを結ぶラインと前回のサンプリング期間内の最大値と最小値とを結ぶラインとがそのラインの角同士でつながることになる(図6(b))。この場合、連続性は維持されるが、そのライン幅が途中で急に細くなり、歪みのある見にくいグラフとなってしまう。
[Embodiment 5]
In Embodiment 3 (FIG. 6), when the maximum value in the current sampling period is smaller than the minimum value in the previous sampling period, the maximum value in the current sampling period is changed to the minimum value in the previous sampling period. In order to draw a line connecting the maximum and minimum values in the current sampling period, the line connecting the maximum and minimum values in the current sampling period, and the maximum and minimum values in the previous sampling period. The line connecting the values is connected at the corners of the line (FIG. 6B). In this case, continuity is maintained, but the line width suddenly narrows in the middle, resulting in a distorted and difficult-to-see graph.
そこで、実施の形態5では、今回のサンプリング期間内の最大値が前回のサンプリング期間内の最小値よりも小さい場合、今回のサンプリング期間内の最大値を前回のサンプリング期間内の最小値にライン幅Wに相当する値αを増じた値に置き換えて、今回のサンプリング期間内の最大値と最小値とを結ぶラインを描画するようにする。 Therefore, in the fifth embodiment, when the maximum value in the current sampling period is smaller than the minimum value in the previous sampling period, the line width is changed from the maximum value in the current sampling period to the minimum value in the previous sampling period. The value α corresponding to W is replaced with an increased value, and a line connecting the maximum value and the minimum value in the current sampling period is drawn.
図8にその一例を示す。図8(a)に示すように、今回のサンプリング期間S2内の最大値が前回のサンプリング期間S1内の最小値よりも小さい場合、図8(b)に示すように、今回のサンプリング期間S2内の最大値を前回のサンプリング期間S1内の最小値にライン幅Wに相当する値αを増じた値に置き換えて、今回のサンプリング期間S2内の最大値と最小値とを結ぶラインL2を描画する。 An example is shown in FIG. As shown in FIG. 8A, when the maximum value in the current sampling period S2 is smaller than the minimum value in the previous sampling period S1, as shown in FIG. 8B, within the current sampling period S2. Is replaced with a value obtained by adding a value α corresponding to the line width W to a minimum value in the previous sampling period S1, and a line L2 connecting the maximum value and the minimum value in the current sampling period S2 is drawn. To do.
例えば、ライン幅Wを1ピクセルとした場合にはαを1ピクセルとし(図8(b))、ライン幅Wを2ピクセルとした場合にはαを2ピクセルとし(図8(c))、今回のサンプリング期間S2内の最大値と最小値とを結ぶラインL2と前回のサンプリング期間S1内の最大値と最小値とを結ぶラインL1とが同じ線幅でつながるようする。これにより、ライン幅が途中で急に細くなることがなくなり、見易いトレンドグラフとなる。 For example, when the line width W is 1 pixel, α is 1 pixel (FIG. 8B), and when the line width W is 2 pixels, α is 2 pixels (FIG. 8C). The line L2 connecting the maximum value and the minimum value in the current sampling period S2 and the line L1 connecting the maximum value and the minimum value in the previous sampling period S1 are connected with the same line width. As a result, the line width is not suddenly reduced in the middle, and the trend graph is easy to see.
なお、上述した実施の形態では、図5〜図8を用いた説明において、隣接するサンプリング期間の内、現在の時刻に近い方を今回のサンプリング期間S2とし、遠い方を前回のサンプリング期間S1としたが、現在の時刻に近い方を前回のサンプリング期間S1とし、遠い方を今回のサンプリング期間S2としても、全く同じルールでトレンドグラフを短時間で描画することができる。 In the above-described embodiment, in the description using FIGS. 5 to 8, the adjacent sampling period closer to the current time is the current sampling period S <b> 2, and the farther is the previous sampling period S <b> 1. However, even if the closer to the current time is the previous sampling period S1 and the farther is the current sampling period S2, the trend graph can be drawn in a short time with exactly the same rules.
通常は、過去から現在に向かってトレンドグラフを描いて行くので、現在の時刻に近い方を今回のサンプリング期間S2とし、遠い方を前回のサンプリング期間S1とする。特殊なケースとして、現在から過去に向かってトレンドグラフを描いて行くことも考えられ、この場合には、現在の時刻に近い方を前回のサンプリング期間S1とし、遠い方を今回のサンプリング期間S2とする。また、描画した後に一度にトレンドグラフの表示を行うような場合には、今回のサンプリング期間と前回のサンプリング期間の順番はどちらでもよい。 Normally, since a trend graph is drawn from the past to the present, the closer to the current time is the current sampling period S2, and the farther is the previous sampling period S1. As a special case, it may be possible to draw a trend graph from the present to the past. In this case, the one near the current time is the previous sampling period S1, and the far one is the current sampling period S2. To do. In addition, when the trend graph is displayed at once after drawing, the order of the current sampling period and the previous sampling period may be either.
また、上述した実施の形態では、アナログデータを例にとって説明したが、運転状態などを示すデジタルデータでも同様にして、そのトレンドグラフを短時間で表示させるようにすることが可能である。例えば、運転状態を示すデータとして、ONを「1」レベルのデータ、OFFを「0」レベルのデータとした場合、10分間内でON/OFFのレベル変化があれば、その10分間内の最大値(「1」レベル)と最小値(「0」レベル)とを結ぶラインがデータ軸に平行に描画されるものとなる。図9にこのようにして描画された運転状態を示すデジタルデータのトレンドグラフを例示する。 In the above-described embodiment, analog data has been described as an example. However, it is also possible to display the trend graph in a short time in the same manner with digital data indicating an operation state or the like. For example, if the ON state is “1” level data and the OFF is “0” level data, the ON / OFF level change within 10 minutes is the maximum within 10 minutes. A line connecting the value (“1” level) and the minimum value (“0” level) is drawn parallel to the data axis. FIG. 9 exemplifies a trend graph of digital data showing the operation state drawn in this way.
また、特殊ルールとして、サンプリング期間内の最大値と最小値が等しく、その状態が連続する場合は、縦線を1つずつつなげて行くのではなく、横線を一気に描画するようにしてもよい。このような場合、あえて横線を描画することで、さらなる高速化を実現することができる。例えば、48時間、データ値が変化しないような時は、ライン1本で描画が完了する。 Further, as a special rule, when the maximum value and the minimum value in the sampling period are equal and the state continues, the horizontal lines may be drawn at a time instead of connecting the vertical lines one by one. In such a case, further speeding up can be realized by drawing a horizontal line. For example, when the data value does not change for 48 hours, the drawing is completed with one line.
また、上述した実施の形態では、サンプリング期間を10分、データの収集周期を1分としたが、これに限られるものでないことは言うまでもない。また、トレンドグラフの表示区間も48時間に限られるものでもない。 In the embodiment described above, the sampling period is 10 minutes and the data collection period is 1 minute, but it goes without saying that the present invention is not limited to this. Also, the trend graph display section is not limited to 48 hours.
1…中央監視装置、2(2−1〜2−3)…コントローラ、3(3−1〜3−3)…設備、1−1…CPU、1−2…RAM、1−3…ROM、1−4…記憶装置、1−5〜1−7…インターフェイス、1−8…ディスプレイ、1−9…キーボード、1−10…マウス、4…通信回線、L…ライン、W…ライン幅、S1…前回のサンプリング期間(前回の所定時間間隔)、S2…今回のサンプリング期間(今回の所定時間間隔)。
DESCRIPTION OF
Claims (2)
前記コンピュータは、
所定時間間隔毎にその所定時間間隔内の所定周期で収集されたデータの最大値と最小値とを抽出する抽出ステップと、
第1軸を時間軸、この第1軸に直交する第2軸をデータ値を示すデータ軸、前記第1軸における前記所定時間間隔に相当する長さをそのライン幅として、前記所定時間間隔毎にその所定時間間隔内の前記抽出された最大値と最小値とを結ぶラインを前記第2軸に平行に描画する描画ステップとを実行し、
前記描画ステップでは、
隣接する所定時間間隔の一方を今回の所定時間間隔、他方を前回の所定時間間隔とし、
今回の所定時間間隔内の最小値が前回の所定時間間隔内の最大値よりも大きい場合、今回の所定時間間隔内の最小値を前回の所定時間間隔内の最大値から前記ライン幅に相当する値αを減じた値に置き換えて、今回の所定時間間隔内の最大値と最小値とを結ぶ前記ラインを描画し、
今回の所定時間間隔内の最大値が前回の所定時間間隔内の最小値よりも小さい場合、今回の所定時間間隔内の最大値を前回の所定時間間隔内の最小値に前記ライン幅に相当する値αを増じた値に置き換えて、今回の所定時間間隔内の最大値と最小値とを結ぶ前記ラインを描画し、
前記所定時間間隔内の最大値と最小値とが等しく、その状態が連続する場合、前記第1軸に平行な線を一気に描画する
ことを特徴とするトレンドグラフ表示方法。 In a trend graph display method for graphing and displaying changes in data collected at a predetermined cycle by a processing operation of a computer according to a program stored in a memory,
The computer
An extraction step for extracting a maximum value and a minimum value of data collected at a predetermined period within the predetermined time interval for each predetermined time interval;
The first axis is the time axis, the second axis orthogonal to the first axis is the data axis indicating the data value, and the length corresponding to the predetermined time interval in the first axis is the line width. perform a drawing step of parallel drawn on the extracted maximum value and the minimum value and the second axis line connecting in that the predetermined time interval,
In the drawing step,
One of the adjacent predetermined time intervals is the current predetermined time interval, the other is the previous predetermined time interval,
If the minimum value in the current predetermined time interval is greater than the maximum value in the previous predetermined time interval, the minimum value in the current predetermined time interval corresponds to the line width from the maximum value in the previous predetermined time interval. The value α is replaced with a value obtained by subtracting the line connecting the maximum value and the minimum value within the predetermined time interval,
If the maximum value in the current predetermined time interval is smaller than the minimum value in the previous predetermined time interval, the maximum value in the current predetermined time interval corresponds to the minimum value in the previous predetermined time interval and corresponds to the line width. Replace the value α with the value increased, draw the line connecting the maximum value and the minimum value within the predetermined time interval this time,
A trend graph display method, wherein when the maximum value and the minimum value within the predetermined time interval are equal and the state continues, a line parallel to the first axis is drawn all at once.
前記コンピュータは、
所定時間間隔毎にその所定時間間隔内の所定周期で収集されたデータの最大値と最小値とを抽出する抽出手段と、
第1軸を時間軸、この第1軸に直交する第2軸をデータ値を示すデータ軸、前記第1軸における前記所定時間間隔に相当する長さをそのライン幅として、前記所定時間間隔毎にその所定時間間隔内の前記抽出された最大値と最小値とを結ぶラインを前記第2軸に平行に描画する描画手段とを備え、
前記描画手段は、
隣接する所定時間間隔の一方を今回の所定時間間隔、他方を前回の所定時間間隔とし、
今回の所定時間間隔内の最小値が前回の所定時間間隔内の最大値よりも大きい場合、今回の所定時間間隔内の最小値を前回の所定時間間隔内の最大値から前記ライン幅に相当する値αを減じた値に置き換えて、今回の所定時間間隔内の最大値と最小値とを結ぶ前記ラインを描画し、
今回の所定時間間隔内の最大値が前回の所定時間間隔内の最小値よりも小さい場合、今回の所定時間間隔内の最大値を前回の所定時間間隔内の最小値に前記ライン幅に相当する値αを増じた値に置き換えて、今回の所定時間間隔内の最大値と最小値とを結ぶ前記ラインを描画し、
前記所定時間間隔内の最大値と最小値とが等しく、その状態が連続する場合、前記第1軸に平行な線を一気に描画する
ことを特徴とするトレンドグラフ表示装置。 In a trend graph display device that graphs and displays changes in data collected at a predetermined period by processing operations of a computer according to a program stored in a memory,
The computer
Extracting means for extracting the maximum value and the minimum value of data collected at a predetermined period within the predetermined time interval for each predetermined time interval;
The first axis is the time axis, the second axis orthogonal to the first axis is the data axis indicating the data value, and the length corresponding to the predetermined time interval in the first axis is the line width. A drawing means for drawing a line connecting the extracted maximum value and minimum value within the predetermined time interval in parallel to the second axis,
The drawing means includes
One of the adjacent predetermined time intervals is the current predetermined time interval, the other is the previous predetermined time interval,
If the minimum value in the current predetermined time interval is greater than the maximum value in the previous predetermined time interval, the minimum value in the current predetermined time interval corresponds to the line width from the maximum value in the previous predetermined time interval. The value α is replaced with a value obtained by subtracting the line connecting the maximum value and the minimum value within the predetermined time interval,
If the maximum value in the current predetermined time interval is smaller than the minimum value in the previous predetermined time interval, the maximum value in the current predetermined time interval corresponds to the minimum value in the previous predetermined time interval and corresponds to the line width. Replace the value α with the value increased, draw the line connecting the maximum value and the minimum value within the predetermined time interval this time,
When the maximum value and the minimum value within the predetermined time interval are equal and the state continues, a line parallel to the first axis is drawn all at once.
Priority Applications (1)
| Application Number | Priority Date | Filing Date | Title |
|---|---|---|---|
| JP2005279830A JP4542010B2 (en) | 2005-09-27 | 2005-09-27 | Trend graph display method and apparatus |
Applications Claiming Priority (1)
| Application Number | Priority Date | Filing Date | Title |
|---|---|---|---|
| JP2005279830A JP4542010B2 (en) | 2005-09-27 | 2005-09-27 | Trend graph display method and apparatus |
Publications (2)
| Publication Number | Publication Date |
|---|---|
| JP2007094508A JP2007094508A (en) | 2007-04-12 |
| JP4542010B2 true JP4542010B2 (en) | 2010-09-08 |
Family
ID=37980197
Family Applications (1)
| Application Number | Title | Priority Date | Filing Date |
|---|---|---|---|
| JP2005279830A Active JP4542010B2 (en) | 2005-09-27 | 2005-09-27 | Trend graph display method and apparatus |
Country Status (1)
| Country | Link |
|---|---|
| JP (1) | JP4542010B2 (en) |
Families Citing this family (1)
| Publication number | Priority date | Publication date | Assignee | Title |
|---|---|---|---|---|
| US9607416B2 (en) | 2013-06-21 | 2017-03-28 | Yokogawa Electric Corporation | Device for displaying a trend related to a process variable |
Citations (7)
| Publication number | Priority date | Publication date | Assignee | Title |
|---|---|---|---|---|
| JPS50120737A (en) * | 1974-03-08 | 1975-09-22 | ||
| JPS58217989A (en) * | 1982-06-14 | 1983-12-19 | 横河電機株式会社 | Crt display |
| JPS5978390A (en) * | 1982-10-28 | 1984-05-07 | 株式会社メデイコ | Digital tv type display unit |
| JPS63157064A (en) * | 1986-12-22 | 1988-06-30 | Yokogawa Medical Syst Ltd | Waveform display device |
| JPH06131136A (en) * | 1992-10-20 | 1994-05-13 | Hitachi Ltd | Time-changing data display device |
| JPH06162211A (en) * | 1992-11-25 | 1994-06-10 | Pfu Ltd | Device and method for preparing graph |
| JPH08210877A (en) * | 1994-09-15 | 1996-08-20 | Fluke Corp | Method for displaying measured data for user and portable test instrument |
-
2005
- 2005-09-27 JP JP2005279830A patent/JP4542010B2/en active Active
Patent Citations (7)
| Publication number | Priority date | Publication date | Assignee | Title |
|---|---|---|---|---|
| JPS50120737A (en) * | 1974-03-08 | 1975-09-22 | ||
| JPS58217989A (en) * | 1982-06-14 | 1983-12-19 | 横河電機株式会社 | Crt display |
| JPS5978390A (en) * | 1982-10-28 | 1984-05-07 | 株式会社メデイコ | Digital tv type display unit |
| JPS63157064A (en) * | 1986-12-22 | 1988-06-30 | Yokogawa Medical Syst Ltd | Waveform display device |
| JPH06131136A (en) * | 1992-10-20 | 1994-05-13 | Hitachi Ltd | Time-changing data display device |
| JPH06162211A (en) * | 1992-11-25 | 1994-06-10 | Pfu Ltd | Device and method for preparing graph |
| JPH08210877A (en) * | 1994-09-15 | 1996-08-20 | Fluke Corp | Method for displaying measured data for user and portable test instrument |
Also Published As
| Publication number | Publication date |
|---|---|
| JP2007094508A (en) | 2007-04-12 |
Similar Documents
| Publication | Publication Date | Title |
|---|---|---|
| CN103217941B (en) | Graph displaying device | |
| CN104977922A (en) | Equipment monitoring device and method thereof | |
| JP4542010B2 (en) | Trend graph display method and apparatus | |
| JP2011258064A (en) | Data collecting and recording apparatus, and data collecting and recording method | |
| TWI773883B (en) | Factory evaluation device, factory evaluation method, and factory evaluation program | |
| CN108616919A (en) | A kind of public domain stream of people monitoring method and device | |
| JP3852636B2 (en) | Status data collection method and control device | |
| JP2005190107A (en) | Trend graph display method and device | |
| JP2014066707A (en) | Methods and systems for displaying triggered waveform record segments | |
| JP2001272421A (en) | Data storage system | |
| JP5746652B2 (en) | Plant data reproducing device and plant data reproducing method | |
| JP5702269B2 (en) | Parallel video analysis device, parallel video analysis method, and parallel video analysis program | |
| JP5390424B2 (en) | Plant monitoring device | |
| JP5250963B2 (en) | Trend data storage and display methods in supervisory control systems | |
| US20180276180A1 (en) | Electronic apparatus, electronic apparatus system, graphing method, and non-transitory computer-readable recording medium | |
| CN112639409B (en) | Method and system for dynamic signal visualization of real-time signals | |
| CN115437869B (en) | Down-conversion point detection method, device, equipment and storage medium | |
| US20210304707A1 (en) | Display control device and display control method | |
| JP6931615B2 (en) | Sensor selection device and sensor selection method | |
| JP3407667B2 (en) | Data display method and measuring device using the same | |
| JP3348422B2 (en) | Measurement data collection device | |
| JP6957895B2 (en) | Information processing device, judgment terminal device, information processing system, information processing method and program | |
| JP2005215845A (en) | Trend graph display method and device | |
| JP6861070B2 (en) | Graph display device and graph display method | |
| JP2022115058A5 (en) |
Legal Events
| Date | Code | Title | Description |
|---|---|---|---|
| A621 | Written request for application examination |
Free format text: JAPANESE INTERMEDIATE CODE: A621 Effective date: 20080318 |
|
| A977 | Report on retrieval |
Free format text: JAPANESE INTERMEDIATE CODE: A971007 Effective date: 20091118 |
|
| A131 | Notification of reasons for refusal |
Free format text: JAPANESE INTERMEDIATE CODE: A131 Effective date: 20091201 |
|
| A521 | Written amendment |
Free format text: JAPANESE INTERMEDIATE CODE: A523 Effective date: 20100114 |
|
| A131 | Notification of reasons for refusal |
Free format text: JAPANESE INTERMEDIATE CODE: A131 Effective date: 20100223 |
|
| A521 | Written amendment |
Free format text: JAPANESE INTERMEDIATE CODE: A523 Effective date: 20100412 |
|
| TRDD | Decision of grant or rejection written | ||
| A01 | Written decision to grant a patent or to grant a registration (utility model) |
Free format text: JAPANESE INTERMEDIATE CODE: A01 Effective date: 20100622 |
|
| A01 | Written decision to grant a patent or to grant a registration (utility model) |
Free format text: JAPANESE INTERMEDIATE CODE: A01 |
|
| A61 | First payment of annual fees (during grant procedure) |
Free format text: JAPANESE INTERMEDIATE CODE: A61 Effective date: 20100624 |
|
| R150 | Certificate of patent or registration of utility model |
Ref document number: 4542010 Country of ref document: JP Free format text: JAPANESE INTERMEDIATE CODE: R150 Free format text: JAPANESE INTERMEDIATE CODE: R150 |
|
| FPAY | Renewal fee payment (event date is renewal date of database) |
Free format text: PAYMENT UNTIL: 20130702 Year of fee payment: 3 |
|
| FPAY | Renewal fee payment (event date is renewal date of database) |
Free format text: PAYMENT UNTIL: 20130702 Year of fee payment: 3 |
|
| FPAY | Renewal fee payment (event date is renewal date of database) |
Free format text: PAYMENT UNTIL: 20140702 Year of fee payment: 4 |