JP4493892B2 - Measurement and use of molecular interactions - Google Patents
Measurement and use of molecular interactions Download PDFInfo
- Publication number
- JP4493892B2 JP4493892B2 JP2001508053A JP2001508053A JP4493892B2 JP 4493892 B2 JP4493892 B2 JP 4493892B2 JP 2001508053 A JP2001508053 A JP 2001508053A JP 2001508053 A JP2001508053 A JP 2001508053A JP 4493892 B2 JP4493892 B2 JP 4493892B2
- Authority
- JP
- Japan
- Prior art keywords
- frequency
- immobilized
- phage
- binding
- binding partners
- Prior art date
- Legal status (The legal status is an assumption and is not a legal conclusion. Google has not performed a legal analysis and makes no representation as to the accuracy of the status listed.)
- Expired - Lifetime
Links
Images


Classifications
-
- G—PHYSICS
- G01—MEASURING; TESTING
- G01N—INVESTIGATING OR ANALYSING MATERIALS BY DETERMINING THEIR CHEMICAL OR PHYSICAL PROPERTIES
- G01N33/00—Investigating or analysing materials by specific methods not covered by groups G01N1/00 - G01N31/00
- G01N33/48—Biological material, e.g. blood, urine; Haemocytometers
- G01N33/50—Chemical analysis of biological material, e.g. blood, urine; Testing involving biospecific ligand binding methods; Immunological testing
- G01N33/53—Immunoassay; Biospecific binding assay; Materials therefor
- G01N33/543—Immunoassay; Biospecific binding assay; Materials therefor with an insoluble carrier for immobilising immunochemicals
- G01N33/54366—Apparatus specially adapted for solid-phase testing
- G01N33/54373—Apparatus specially adapted for solid-phase testing involving physiochemical end-point determination, e.g. wave-guides, FETS, gratings
- G01N33/5438—Electrodes
-
- Y—GENERAL TAGGING OF NEW TECHNOLOGICAL DEVELOPMENTS; GENERAL TAGGING OF CROSS-SECTIONAL TECHNOLOGIES SPANNING OVER SEVERAL SECTIONS OF THE IPC; TECHNICAL SUBJECTS COVERED BY FORMER USPC CROSS-REFERENCE ART COLLECTIONS [XRACs] AND DIGESTS
- Y10—TECHNICAL SUBJECTS COVERED BY FORMER USPC
- Y10S—TECHNICAL SUBJECTS COVERED BY FORMER USPC CROSS-REFERENCE ART COLLECTIONS [XRACs] AND DIGESTS
- Y10S435/00—Chemistry: molecular biology and microbiology
- Y10S435/808—Optical sensing apparatus
-
- Y—GENERAL TAGGING OF NEW TECHNOLOGICAL DEVELOPMENTS; GENERAL TAGGING OF CROSS-SECTIONAL TECHNOLOGIES SPANNING OVER SEVERAL SECTIONS OF THE IPC; TECHNICAL SUBJECTS COVERED BY FORMER USPC CROSS-REFERENCE ART COLLECTIONS [XRACs] AND DIGESTS
- Y10—TECHNICAL SUBJECTS COVERED BY FORMER USPC
- Y10S—TECHNICAL SUBJECTS COVERED BY FORMER USPC CROSS-REFERENCE ART COLLECTIONS [XRACs] AND DIGESTS
- Y10S436/00—Chemistry: analytical and immunological testing
- Y10S436/805—Optical property
Abstract
Description
【0001】
(技術分野)
本発明は、分子の相互作用を測定しかつ粒子を分離し、選別しかつ大きさに合わせて分類する方法に関する。とくに、本発明は、種々の結合相手間の、例えば抗体−抗原相互作用における親和力の測定に関する。
【0002】
(背景技術)
特別な分子の認知は基本的な過程であり、酵素−リガンド相互作用、抗体−抗原相互作用およびレセプターへの分子の結合の基礎となっている。分子の認知は静電相互作用(水素結合)および疎水性相互作用のごとき非共有相互作用によって達成される。結合定数および自由エネルギ、エンタルピーおよびエントロピー変化の熱力学的測定は、とくにX線回析、かつ可能ならば、サイトに向けられた突然変異生成からの情報と結合されるとき、分子認知の基礎に見通しを付与する。
【0003】
相互作用力の直接の測定は原子力顕微鏡(AFM)ならびに表面力装置によってなされた。AFMが結合破壊力を測定することができる一方、その技術は1つの測定のみが一度になされ得るという欠点を有している。今日まで、AFMは、アビジン−ビオチン相互作用(フローリン他、サイエンス、1995;264:415)、DNA交配(ボーランド他、PNAS、1995;92:5291)、抗体−抗原相互作用(ダマー他、Biophys.J.,1996;70:2437)および付着糖たんぱく質(ダマー他、サイエンス、1995;267:1173)に使用された。
【0004】
リガンド用のそれらの関連の親和力に基づいて生物学上の分子を分離することは十分に認められた技術である。例えば、親和力クロマトグラフィにおいて、分離されるべき成分は特別なリガンドを収容しているコラムの下に通される。関心の有る成分は優先的にかつ強力にコラムに結合し、かつ他の成分が除去されながらコラム上に保持される。結合された材料は後の段階においてコラムから溶出され得る。
【0005】
分離技術は多くの研究実験の重要な部分である。これらの技術の感度または選択性を増加するのが望ましい。
【0006】
コロメンスキ他、J.Appl.Phys.,1998;84(4):2404−10は、レーザ発生の表面音響パルスを使用して行われた表面洗浄および付着の研究を開示している。パルスは低い反復率(20Hz)および一定のエネルギであった。手順は真空中で行われ、かつそれゆえ、商業的な開発には適さない。光学的顕微鏡が粒子の除去を検出するのに使用され、そしてそれは種々の大きさの粒子間で識別することができなかった。
【0007】
WO−A−98/45692は、クラスレート水和物の形成/分離を測定するための圧電結晶センサの使用を開示している。クロサワ他、Chem.Pharm.Bull,1990;38(5):1117−20は、抗体支持ラテックスの粘着作用の検出のためにかかるセンサを使用することを報告している。WO−A−98/40739は、また、媒体中の細胞の存在を指示するのに使用するために、特別な結合物がそれに不動にされるようなプレートを含んでいる、かかるセンサを開示している。これらのセンサは一定の電圧において共振周波数の変化を測定することによって使用される。
【0008】
現在、可能ならば、ほとんどのウイルスは、この方法が時間はかかるけれども高感度であるので、細胞中での標本の培養によって検出される。臨床サンプル中のウイルスDNAまたはRNAの直接検出は、PCRおよび関心のあるウイルスに合わせられた特別なプライマを使用して達成され得る。PCRが増幅段階を伴うので、相互汚染が主要な問題でありかつ信頼し得る定量的な方法を確立するのは難しい。他の直接的な方法は電子顕微鏡、免疫電子顕微鏡、および酵素−結合抗体による抗原検出を基礎にした方法を含んでいる。これらの方法はしばしば比較的無感応であり、かつそれゆえ比較的大量のウイルス粒子を要求している。
【0009】
本発明は、目標分子、または粒子に付着された目標分子と表面との間の結合が増大している振幅において表面を機械的に振動することによって破壊されることが可能で、表面から目標分子または粒子を分離させるという現実に基礎を置いている。必要とされる加速、かつそれゆえ、力は、分子または粒子の質量、表面への結合の性質および目標分子または粒子の幾何学的形状または大きさを含んでいる、種々の要因に依存している。本発明は、それゆえ、種々の目標分子を分離し、またはこれらを大きさにしたがって分類するのに、またはそれらの存在を検出するのに使用され得る。
【0010】
(発明の開示)
本発明の第1の態様によれば、組成物から目標分析物を分離するための方法は、
(i)前記組成物を表面上で不動にされる分析物用の結合相手と接触させる工程と、
(ii)前記表面上から、前記分析物、または前記組成物の他の構成成分を選択的に除去するように、増大する振幅で前記表面を振動させる工程と、を備えてなっている。
【0011】
加えて、本発明は、粒子の存在または大きさ、または結合相手間の親和力を測定するための方法に使用されることが可能である。本発明の第2の態様によれば、かかる方法は、
(i)一方が表面上で不動にされる前記結合相手を接触させる工程と、
(ii)増大する振幅で前記表面を振動させる工程と、
(iii)分離状態を検出する工程と、を備えてなっている。
【0012】
この第2の態様において、本発明は、水素結合のごとき比較的弱い相互作用から共有結合への範囲にある、種々の物理的および化学的結合に適用されることが可能である。
【0013】
本発明における使用に適する装置は、その上で不動にされた一方の結合相手を有している表面と、前記表面を増大している振幅で振動させるための手段と、分離状態を検出するための手段と、を備えてなっている。
【0014】
とくに、本装置は音響変換器装置(ATD)、例えば水晶結晶板マイクロバランス(QCM)または表面音響波装置、または、例えば、交流電圧または磁界を印加することによって振動するように作られ得る圧電材料を備えてなることができる。これらはAFMに比べて安価な装置であり、かつマルチプレックスにされることができる。かかる装置を使用することの他の利点は、結合の大部分が同時に破壊され、特別な加速(ATDに印加された電圧)において検出可能な音響および鋭い雑音ピークを生起するということである。他の利点は、ATDが、分離状態が発生するとき、音響放出を検出するように、高感度マイクロホンとして使用され得るということである。
【0015】
ATDを使用するほとんどの従来技術の実験では、共振周波数または位相の変化が、ATDが一定の電圧で駆動されるとき測定された。これに対して、本発明は駆動電圧かつそれゆえATDの振動の振幅を増大することを伴っている。
【0016】
本発明は分離、選別および大きさにしたがって分類するための広範な用途を有している。これらの例は、空気中において、ストレプトアビジンと呼ばれる球体がビオチニレートされた表面を有しかつ0.1V以上であるが6V以下の駆動電圧を有するQCMを使用して通常のラテックス球体から分離され得ることを示している。通常のラテックス球体は表面から除去されて、表面に付着されたストレプトアビジンと呼ばれる球体のみを残している(より強力なストレプトアビジン−ビオチン結合によって)。これは、例えば、粒子の大きさによる分類および選別、細胞選別、ファージの選別ならびに新たなバイオセンサの設計における用途により、一定の時間長さに印加される可変の力に基づいて分離科学の新たな形態を開いている。かかる分離方法は低コストであり、かつ容易にマルチプレックスされかつ自動化され得る。例えば、同一のマイクロバランス上の種々の位置に種々の目標を堆積しかつ多数の目標に対してリガンドのライブラリーを同時に選別することができる。一定の大きさからなるウイルスの粒子の検出および分析は他の応用範囲である。同様に重要なことは、本発明は、分子認知に伴われる力をプローブするための、新たな、高感度のかつ潜在的に定量的な工具を提供するということである。
【0017】
(発明を実施するための最良の形態)
本発明は振動させられ得るセンサ装置を使用する。センサは多数の方法において、例えば、表面音響波装置、共振水晶結晶板装置、音響板モードおよび薄膜柔軟プレート装置によって、振動するように作られ得る。
【0018】
本発明における使用に適する、多くの種々のセンサは市場の供給源から入手可能である。本発明に使用され得るセンサの説明は、音響波センサ、バランタイン他、(1997)アカデミック・プレスに収録されている。センサは、好ましくは、表面音響波装置、または、より好ましくは、水晶結晶板マイクロバランス(QCM)である。
【0019】
QCMは、典型的には頂部および下方面上に金(ゴールド)電極を備えた水晶結晶からなる円板である。交流電圧が電極に印加されるとき、逆の圧電効果により、剪断振動を受ける。電圧を増加することはQCMの振動の振幅を増大することである。
【0020】
水晶結晶板は、また、高感度のマイクロホンであり、かつ破壊状態による音響放出を検出するのに使用され得る。1つの主要な共振周波数に対応し、かつ他のモード近傍で音響放出を検出する周波数で振動を励起するのは技術的により容易である。一例として、QCMはその共振周波数で駆動され、そして音響放出はその第3高調波において検出される。
【0021】
図示のために、用語「分析物」は表面固定の結合相手と接触される結合相手または成分を説明するのに使用され得る。接触に続いて、分析物は分子の相互作用によりセンサに結合され加速を受け、かつそれゆえ力が分析物に働かされる。振動の振幅が増大するとき、かつ特定のしきい値力において、結合破壊が発生する。先に結合された分析物粒子はかくして表面上で自由に転動する。
【0022】
分析物は分子の相互作用によりセンサ上に維持されることができる微視的なものであってもよい。分析物はたんぱく質、抗体、抗原、酵素、酵素抑制剤またはポリヌクレオチドであってもよい。分析物は、また、バクテリア、細胞、ウイルス、プリオンまたはファージのごとき、大きな粒子であってもよい。本発明における使用にとくに適するさらに他の粒子の例は、あらゆる材料、例えば、シリカ、金またはラテックス、またはプラスミドのごとき大きな高分子の微小球体を包含している。表面固定の結合相手は同一の型のものであることができ、したがって、適切な物理的または化学的結合に依存して選択され得る。
【0023】
より小さな分析物の分離は、好ましくは音響放出によって検出される。より大きな粒子は、また、光学的手段、例えば、顕微鏡によって検出され得る。
【0024】
本発明の第1の態様において、分離は結合相手との相互作用によりセンサ表面に目標分子を不動にすることによって実施される。表面は、次いで、センサの表面上の分子を分離するように振動させられ得る。振動は振幅を安定して増大することにより実施され、そして表面から目標分子を除去するか、または表面から組成物の他の成分を除去するように選択されることができ、表面に結合された目標分子を残している。好適な実施例において、センサ表面は圧電音響波装置、例えば、QCMを使用することによって振動させられる。同様の圧電装置が破壊状態によって発生される音響雑音を検出するためのマイクロホンとして使用されることが可能である。
【0025】
分離技術は特別な結合相手と強く相互作用する分子のための選択に適用され得る。例えば、その技術は細胞表面に現れる特別なレセプター分子で細胞を選択するのに、または特別なリガンドに対する強い親和力で抗体のための選択に適用され得る。
【0026】
種々のリガンドが、例えば、接触印刷またはマスクまたはリソグラフィの使用により表面上の種々の位置において局部化され得る。その場合に、幾つかの異なるリガンドを有する幾つかの強力に結合する相手用の混合物を同時にふるい分けすることができる。とくに、本発明は、その上に不動にされたレセプターのごとき種々の材料を有するチップとともに使用され得る。より一般的には、チップは、例えば、人間および動物臨床試験における種々の感染体、病原菌、プリオン、食物アレルゲン、ウイルス、バクテリア等の、および食物および水の衛生状態の試験を許容する材料を表示することができる。さらに、本発明はライブラリースクリーニング、ファージ表示等に使用され得る。
【0027】
本発明の第2の態様は、粒子の存在または大きさ、または分子間の親和力レベルを測定する方法である。好ましくは、一方の分子がセンサ表面に対して不動にされ、かつ他方の分子が粒子に、例えば、微小球体に対して不動にされる。粒子は次いで関心のある分子の相互作用によりセンサに取着される。機能的なものにされた粒子は次いでセンサに電圧を印加することによって振動させられる。振動の振幅が増大するので、力は結合破壊が生じる臨界値に達する。この時点において、特徴的な雑音は高感度増幅器を使用することによって検出されることができ、かつ粒子の動きは、例えば、光学的顕微鏡により観察されることができる。信号の大きさはセンサ表面に結合された粒子の数に依存している。代表的には、QCMが、例1において、以下で説明されるように、物理的吸収の微小球体とともに使用されるならば、雑音は微小球体の大きさに依存して、0.1〜1Vで検出され、発生は、微小球体が、顕微鏡により、摺動しかつ逃げ去るように観察されるとき生じる。プロットは、破壊力スペクトルとして言及される、発生された雑音対振幅(または印加された電圧)からなされ得る。結合破壊がプロットから明らかとなる点が、そこで、雑音ピークとなる。それゆえ、結合破壊が生じる臨界電圧が決定される。公知の結合密度および強度を有する粒子を使用する、適宜な較正実験は、この方法を定量的にさせる。さらに、音響放出ピークの高さは結合された粒子の数の尺度である。
【0028】
本発明は、分子の相互作用を研究するのに使用されることができるが、とくに、酵素/リガンド相互作用、抗体/抗原相互作用およびレセプター/リガンド相互作用または大きな高分子とその天然の結合相手との間の相互作用の研究に適している。本方法は、また、ポリヌクレオチド間の交配(ハイブリダイゼーション)の状態の研究に応用され得る。かくして、本発明の第1の態様において、リガンドは、例えば、たんぱく質、抗体または抗原、酵素、酵素抑制剤、ポリヌクレチオドまたは大きなプラスミドまたはウイルスのごとき大きな高分子であってもよい。いずれかの材料が、本発明の第2の態様において、表面または粒子に結合され得る。
【0029】
以下の例は本発明を示している。
【0030】
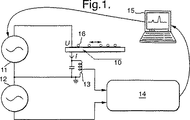
それぞれの例において、破壊力分光が表面と小さい粒子との間の付着力を測定するのに使用される。この作用は、単調に増大する振幅かつそれゆえ増大する加速において、表面上の巨大粒子により、表面を振動させることに基礎を置いている。これは圧電音響波装置、この場合には、水晶結晶板マイクロバランス(QCM)により表面を駆動することによって達成される。振幅が増大すると、加速かつそれゆえ粒子上に作用する力も増大する。表面に粒子を付着させるすべての結合の破壊は音響雑音を結果として生じ、かつ同様の圧電装置が、破壊状態によって発生される、この雑音を検出するための高感度マイクロホンとして使用される。例1〜5に使用される装置の概略図が図1に示され、好適な装置のより一般的な概略図が図8に示されている。
【0031】
より詳しくは、図1は圧電変換器10、純粋な正弦波f発生器11、3f+Δf発生器12、3f+Δfフィルタ13、ロックイン増幅器およびアナログ−デジタル変換器14、および矢印によって示されるデータ入力および制御出力を有しているコンピュータ15を備えている回路を示している。例1〜5において、f=14.2MHz、およびΔf=82kHzである。粒子16は基板の表面上に配置されている。
【0032】
図8は圧電変換器21(QCM,SAW装置等のごとき)、および信号25の制御下で滑らかに上昇している出力振幅を供給することができる入力23および出力24を備えた可変利得増幅器22を示している。回路は、また、帯域受信機26(例えばSSB無線受信機と同様な)、およびリンク28によりデータを供給する1または複数のアナログ−デジタル変換器27を備えている。さらに、回路はコントローラ、記録およびデータ信号処理装置29(例えばコンピュータまたは特殊化されたDSPプロセッサ)を備えている。破線30によって指示された接触はより最適な濾過および結合手段によって置き換えられることができ、例えば、それは受動のL,C,Rネットワークであってもよい。
【0033】
図8に示された回路の使用において、任意の濾過/結合手段30とともに、変換器21を備えた増幅器22は、変換器が有効である周波数で好ましくは振動する、簡単な発振器ネットワークを提供し、QCMに関してそれは基本的な直列共振周波数であってもよい。この発振周波数(F)は、例えば、14MHzである。出力24において駆動電圧の振幅は制御リンク25によってコントローラ29の制御下で滑らかに上昇する。点30において音響放出の出現信号は任意のフィルタ/カプラによって純化され、かつ次いで帯域受信機26の入力に供給されてもよい。作動している受信機の周波数帯は最大の信号対雑音規準、例えば、第3高調波(3*F+ΔF)、例えば、42.082MHzの近傍に置かれた共振モードによって選択され得る。
【0034】
単一のまたは直角位相の出力信号は高いダイナミックレンジの1または複数のアナログ−デジタル変換器27によって変換される。データは、次いで、有用な信号を引き出すために、29でさらにデジタル的に処理され、かつ次いで記録されおよび/または観察者に示される。増幅器22は、加えて、信号対雑音比を改善し、かつまた、発振器が変換器を横切る電流対電圧の正しい周波数および移相下で作動することを保証する、受動的出力および/または入力フィルルタを備えることもできる。
【0035】
図9は本発明における使用に好適なSAWを基礎にしたセンサを示している。このセンサは変換器電極33を駆動する増大している振幅を有する出力32でRF電圧を発生するための手段31を備えている。電極33は圧電基板34において高振幅SAWの発生のために最適化されている。電極構成37は音響放出の電気信号への最良の変換のために最適化されている。パターンは複雑かもしれず、1またはそれ以上の電極対を備えている。装置は、さらに、リンク36によって発生器31を制御するための、かつ発生された信号を1またはそれ以上の入力38において受信しかつデータ信号処理、例えば、相関分析を実施するための制御ユニット35を備えている。
【0036】
SAWを基礎にしたセンサの使用において、発生器31は出力32において有効な変換周波数を供給するのに適するRF電圧を発生し、かつこれは圧電基板34(鎖線)上に置かれた発生している変換器電極33に供給される。RF電圧の振幅は制御リンク36によってコントローラ35の制御下で時間とともに上昇する。受信電極37は能動領域から現れる音響放出を受信機/コントローラ35および入力38に供給される電気信号へ変換する。アナログ−デジタル変換後に得られたデータは次いで有用な信号を引き出すために信号処理を受ける。結果はその場合に最終的に記録されおよび/またはオペレータに示される。
【0037】
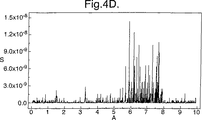
例からの幾つかの結果が図2ないし図7および図10に示されている。図2A,図2B,図3A,図3B,図4A,図4B,図4C,図4D,図6B,図7および図10は信号雑音(S;任意の単位)対振幅(A;ボルト)のプロットである。図5A,図5B,図6Aおよび図6Cは信号雑音(S;任意の単位)対粒子の数(N)のプロットである。
【0038】
以下の略号が使用される。すなわち、
BSA:牛血清アルブミン
LB:ルリア培養液
DIC:塩化ジメチルアミノイソプロピル
DMAP:ジメチルアミノピリジン
EDC:1,3−ジメチルアミノプロピル−3−エチルカルボジイミド
NHS:N−ヒドロキシサクシニイミド
PBS:燐酸塩−緩衝塩水
【0039】
例1
直径5μmのラテックス球体が多数の関心のある結合によりQCMセンサ表面に付着された。使用された球体の被覆はQCMの表面積の1%であった。球体はそれらの直径において1%のみの変化を有した。
【0040】
QCMセンサは35°Cで音響通遮断されかつ直径8.25mmの研磨された水晶結晶板を備えていた。クロム(厚さ20〜30nm)かつ次いで金(ゴールド)(厚さ100〜120nm)の層が堆積された。
【0041】
3つの異なる結合が、空気中で行われた実験において研究された。すなわち、それらは物理的結合(ラテックス−金)、ストレプトアビジン−ビオチン結合および共有結合(アミド連鎖)である。物理的結合はセンサ表面上に直接ラテックス球体を配置し、そして窒素中で乾燥することによってなされた。ストレプトアビジン−ビオチン結合はビオチニレーテッドBSAを表面上に塗布し、そして窒素中で乾燥することによってなされた。化学的結合はエタノール中に溶解されたアシド−終止のチオール(12−メルカプトドデカン酸)を使用してチオール分子膜を形成することによってなされた。これは、次いで、EDC−NHSを使用して活性化され、そしてアミン−終止の球体がアミノ結合を形成するように付加された。
【0042】
実験は2つの光学窓、すなわち、サンプルのレーザ照射を供給するための光学窓、および光学顕微鏡による散乱レーザ光の観察を許容するための光学窓を備えたチャンバ内で実施された。QCMはチャンバ内に配置された。信号発生器、モデルDS345(スタンフォード・リサーチ・システムズ)がQCMを駆動するのに使用された。粒子の運動および分離はCCDパナソニックWL−SL300ビデオカメラを備えたオリンパスBH−2光学顕微鏡を使用して観察された。主要な測定装置はロックイン増幅器、SR844(スタンフォード・リサーチ・システムズ)であった。基準信号は第1の発生器に同期された第2の発生器を使用してロックインに供給された。すべての装置は実験の制御およびデータの収集のためにコンピュータにインターフェイスされた。
【0043】
図2Aはストレプトアビジン−ビオチン(1)および化学的結合(2)用の破壊力スペクトルを示し、図2Bは物理的結合用のスペクトルである。
【0044】
破壊力スペクトルを記録することにより、結合を破壊するための力または電圧を実験的に測定することができる。これは分離に使用され得る。図2Aに示されるように、幾つかが表面上にストレプトアビジンを有しかつ幾つかがそうでない5μmの球体の混合物があるならば、0.1V以上であるが6V以下の、およそ、1Vの電圧を表面上にビオチンを有するQCMに印加することにより、2つの球体のセットを分離して表面上にストレプトアビジンと呼ばれる球体のみを設けることができる。この技術は、また、これらの球体が1Vで振動される場合に表面上に結合するのみであるから、ストレプトアビジンと呼ばれる球体を検出するのに使用され得る。
【0045】
測定を定量的にするため、QCMの振動の振幅が、微小球体上の力の評価を許容している、実験データに基づいて、種々の電圧で計算された。この評価はQCMの電力消費およびそのQ因数(またはメリット因数−往復の相対的な共振帯域幅=f/Δfresonance)を測定することによって行われた。振幅Aは、
A=〔QP/2π3f3M〕1/2
によって付与され、ここで、QはQまたはメリット因数、PはQCMによって消費される電力、fは水晶結晶板の共振周波数およびMは運動に伴われるQCM水晶結晶板の有効質量である。Q因数は6Vでおよそ15000であるように測定され、それは60nmのQCMの振動振幅の評価を付与する。球体上の力はそれゆえ9μNである。これは160pN2の単一のストレプトアビジン−ビオチン結合を破壊するのに必要とされる力と比較されるべきであり、かつほぼ60,000結合が同時に破壊されることを示している。評価は、これが球体と表面との間の最初のストレプトアビジン−ビオチン結合の50%またはそれ以上に対応していることを示している。これは、球体を表面に付着する結合の大部分が同時に破壊されることを意味している。これは破壊力スペクトルおよび結合破壊についての検出可能な雑音に観察される鋭いピークを生じる。
【0046】
例2
この例は、本発明の方法が、また、溶液中で実施され得ることを示している。QCMのQ因数は液体負荷により減少し、かくして空気と比較されるとき特定の電圧において振動の振幅を減少する。微小球体に作用している粘着力がありそしてその有効な質量は、球体上の力を増加する、関連の水の層により、増加する。
【0047】
図3はストレプトアビジン−ビオチン(図3A)および化学的結合(図3B)により表面に付着された5μmのラテックス球体に関する破壊力スペクトルを示している。破壊はそれぞれ1Vおよび10Vにおいて発生する。
【0048】
空気から水へ達するとき6Vから1Vへ、6の因数により、ストレプトアビジン−ビオチン結合、および水中での化学的結合の破壊に関する臨界電圧の減少が、後者の作用が特徴的であることを示している。したがって、この例は、結合破壊、かつそれゆえ分離およびバイオ感知が水液体または他において可能であることを明瞭に示している。
【0049】
物理的、ストレプトアビジン−ビオチンおよび化学的な結合の結合密度が同一であると仮定し、かつ同一の大きさの微小球体がこれらの実験において使用されたので、破壊力の相対的なスケールが得られることができる。これは物理的:ストレプトアビジン−ビオチン:化学結合に関して1:60:600である。このスケーリングは合理的であると思われ、かつこの方法のダイナミックレンジを示している。公知の結合密度を用いて適宜な較正実験を行うことにより、これらの測定を定量的にすることが可能である。
【0050】
例3
例は、ファージおよびマルトース−結合相互作用の両方が良好に特徴付けられかつ容易に利用可能であるので、ウイルス、かつとくに、ファージpIIIコートたんぱく質に溶解されたマルトース結合たんぱく質を表示する遺伝子で変性されたバクテリオファージの検出を示している。ファージは長さ1μmそして直径6nmの柔軟なロッドからなる長く、細い線維状ウイルスである。遺伝子で変性されたファージはファージpIIIコートたんぱく質への溶出としてウイルスの一端において5マルトース−結合たんぱく質まで追加的に表示する;マクカファーティ他、ネイチャー、1990,348:552参照。これらのファージはアミロース樹脂上でとくに純化され得る。
【0051】
インドールグリセロールフォスフェートシンターゼのアミノ末端へのマルトース−結合たんぱく質融合が遺伝子III−記号化されたコートたんぱく質のアミノ末端への融合としてfdファージの表面上に表示された。このために、fdファージベクトル、pJB113が構成された;それはMaIE(E.coli)trpC(E.coli)と遺伝子IIIとの間の遺伝子融合を記号化した。このファージベクトルはテトラサイクリン−抵抗マーカーを運んだ。変性されないコンペティターファージはカナマイシン−抵抗マーカーを支持しているVCSM113K07ヘルパーファージ(ストラトジェーン)であった。
【0052】
1×10¹²cfu/mLのバクテリオファージ濃縮物が10μLのファージストックを有するエシェニチア・コリ・菌株TG1の3mLのミッドログファーゼLB培養を感染させることにより得られた。37°Cで攪拌(250rpm)の2時間後、培養の1mLが100mlLBに接種されかつ1時間、37°Cで、350rpmにおいて攪拌された。テトラサイクリン(10μg/mL)またはカナマイシン(50μg/mL)が、30°C、250rpmで一晩中成長された、それぞれ、pJB113またはVCS培養に付加された。バクテリアは小球形にされ(15分、4.1krpm)そしてファージはそれぞれ0.5Mおよび4%(v/v)の最終濃度にNaClおよびPEG6000の添加により浮遊物から沈殿した。氷上に1時間置いた後、ファージは遠心力(30分、4.1krpm)によって回収され、かつファージペレットが1mlH2O中に再び懸濁されかつ4°Cで貯蔵された。
【0053】
溶融可能な澱粉(500mg,0.01mmol,1eq.)がDMF(10ml)中に溶解されかつ5分間攪拌された(部分的に溶融可能)。DMF(0.5ml)中の11−メルカプトドデカン酸(11.5mg,0.05mmol,5eq.)にDIC(7.8μl,6.3mg,0.05mmol,5eq.)およびDMAP(cat.)が添加され、そしてこの溶液が澱粉溶液に添加された。反応は室温で一晩攪拌して置かれた。反応は、次いで、milliQ水(6倍50mL)を有する溶液で濯ぎかつ濃縮によって、遮断された10000MW薄膜を備えた攪拌されたセルをを使用して純化され、これに減圧凍結乾燥が追随した。
【0054】
表面は、チオールグループが表面に化学的に結合されるようにチオールグループを含有している変性された澱粉を使用して設けられた。QCM(例1におけると同様に設けられた)は12時間メタノール(1μg/mL)中で澱粉の溶液中に置かれた。サンプルは次いで水洗いされ、かつ窒素の蒸気下で乾燥された。ウイルスは溶液から表面上に堆積され、かつ空気中での実験のために室温で乾燥された。種々のウイルス濃度が希釈によって作られた。マルトース−結合たんぱく質を遮断するマルトースにより実験を行うために、100nMマルトースがファージの溶液に添加された。
【0055】
QCMの表面は、かくして、硫黄−金結合により金表面に化学的に取着された、溶融可能なポテト澱粉(マルトースの分岐されたポリマを含有している)からなる層で被覆された。実験は空気中および水中の両方において実施された。
【0056】
図4Aはマルトース−結合ファージ(−)および変性されないファージ(...)の混合物に関して水中で得られた破壊力スペクトルを示しており、走査は500秒にわたって獲得された。金電極の表面上に各型のファージのおよそ500ミリオンが存在している。変性されない、かつそれゆえとくに結合されないファージに関して、破壊ピークは1.2Vで検出された。マルトース−結合ファージの対応する破壊ピークはほぼ9Vで、かつ結合破壊時に実施されるより大きなエネルギによりとくに結合されないファージより強力である。空気中において、とくに結合されたマルトース−結合ファージからのピークは10Vまで観察されなかった;図4Bはとくに結合されないファージに関する空気中のデータを示している。ピークは7.5Vで、水中で認められたピークにわたってほぼ6の増加を発生する。第2の走査(...)はほとんどピークがなく、ファージが表面から除去されたことを示している。このことは、追加の粘性摩擦力および粒子の有効質量の増加が空気中より水中においてファージ粒子と表面との間の結合を破壊し易くさせるということを立証している。
【0057】
破壊力スペクトルのピークの鋭さは、結合破壊がしきい値電圧で発生することの観察に明らかに関連させられており;これは短い時間周期で発生している音響雑音を結果として生じ、かつそれゆえ方法を非常に高感度にさせる。加えて、特別な結合ファージからの信号は特別な結合がないファージからかつより高い振幅において良好に分離され、それは特別でない吸着が特別な吸着の測定に影響を及ぼさないことを意味している。非常に大きい力が、変性されないファージと表面との間の特別でない相互作用を破壊するのに必要とされる力に比べて、ファージに表示されるマルトース−結合たんぱく質と澱粉被覆表面との間の特別な相互作用を破壊するのに必要とされる。
【0058】
図4Cは、その結合場所がマルトースにより遮断され、かつ次いでファージが中心(頂部のプロット)でまたは表面全体(底部のプロット)にわたってQCM上に堆積されるとき、マルトース−結合ファージにより空気中で実施された制御実験の結果を示しており;これは変性されないファージと同様な作動を示し、差異がこれらの特別な相互作用によることを立証している。図4Dは表面上に1000個のファージのみによる水中の破壊力スペクトルを示し、そして破壊の状態が検出可能であることを示している。負荷の変化の結果として、QまたはQCMの品質因数のより小さい変化によるピーク位置の小さな移動が存在する。
【0059】
データは、また、特別に結合されないファージへの結合を破壊するための電圧以上であるがマルトース−結合ファージに関する電圧以下である電圧においてQCMを駆動することによりマルトース−結合ファージから特別に結合されないファージを分離可能にすべきであることを示唆している。このことは、結合のためにファージライブラリーをふるい分けするような代替の方法を示唆し、そのさい表面上に残されたファージの結合親和力は、ファージが実用可能であるならば、印加された電圧の大きさおよび印加される時間を制御することによって制御される。
【0060】
本方法の感度を測定するために、希釈実験が、水中でのマルトース−結合ファージにより、実施された。図5Aは、信号のパワーが少なくとも大きさの5個のオーダーにわたってファージの数と直線であり、かつQCM上のほぼ200個のファージの存在が99%の確立で検出され得ることを示している(9Vに近い最大強度の雑音ピークに関して)。図5Bは、99%の確立による100個のファージの検出感度を示している、空気中での特別な結合のないファージについての同様な曲線を示している。低い希釈において表面上のマルトース−結合ファージの数はAFMを使用する直接作像によって確認された。
【0061】
この例は、QCM表面上のファージの数が検出され得ることを示している。それに対して、PCRを使用すると、ウイルスのDNAのコピーの数が溶液中に検出される。強力なウイルス表面相互作用が存在するかまたは溶液が表面上にウイルスを残して蒸発させられる場合に発生する、溶液サンプル中のすべてのウイルス粒子が表面に結合すると仮定されるならば、その場合に、感度の直接比較が可能である。PCRの感度は、この例(最適化されていない)により、ファージの検出感度に比較し得るウイルスDNA/mLの約100コピーである。エレクトロニクスは改善可能であり、かつ多分、少なくとも大きさのオーダーにより、感度をさらに改善するような余地がある。例えば、これらの実験において、ファージはQCMの表面上に均一に堆積された。しかしながら、QCMの振幅および感度の両方が、支配的な信号がQCMの中心から到来することを意味している空間的な依存を有している(図4Cに示されるように)。これは、より強力なピークがファージがQCMの中心にのみ堆積された場合に記録され得ることを意味し、結果として感度の向上を生じる。
【0062】
この方法は、QCMの表面に付着されたウイルスへの特別な抗体の使用によって人間のウイルスの検出に簡単に拡張され得る。これらの抗体はQCMの表面に付着されたウイルス間の特別な相互作用を形成する。これらの抗体はウイルスと特定の表面加速で破壊され得る表面との間の特別な相互作用を形成する。サンプル中に存在する同様な大きさのまたはより大きい粒子による不特定の吸着は、今示されたように、低い電圧においてピークを結果として生じ、そしてこれは表面上の巨大分子による吸着がウイルスに結合するのに利用し得る抗体の数を減少するかもしれないけれども分析に影響を及ぼすものでない。多くの一般的なウイルスは、表面との特別な相互作用の数および強度が異なるけれども、この例において使用されたファージより大きい有効質量を有している。これは、必要とされる電圧が同様な大きさまたはより小さいものであることを意味している。
【0063】
この例は、破壊力分光が増幅過程を必要とせず、定量的であり、そして直接かつ低コストであるような潜在能力を有していることを示している。これは、臨床環境における患者または農業における植物および動物を包含している多くの状況においてウイルスの感染の迅速な診断を導くことができる。
【0064】
例4
この例はウイルス結合分析を示している。この分析のために、水晶結晶板マイクロバランスチップが35°の角度でATカットの、研磨された水晶結晶板(HyQ,ケンブリッジ、英国)から作られ、そして30nmの厚さのクロムの付着層、次いで較正された電気的コンダクタンスによって決定されるような200nmの金層でエドワーズ蒸気堆積器中において覆われた。これらのチップは、次いで、18時間分光等級のエタノール中でメルカプトドデカン酸の1mM溶液中に浸漬され、エタノールでかつ次いで水で完全に濯がれ、かつ次いで窒素の蒸気により吹き付け乾燥された。これらのチップは、次いで、20分間NHS(100mM)およびEDC(400mM)の混合物中に浸漬された。それらは水で完全に濯がれ、次いでpH7.0で10mMPBSにおいてHSVIグリコプロテインDに対して上昇されたマウスの単クーロン性のIgG抗体の50μg/ml溶液に1時間浸漬された。それらは次いで水で濯がれ、かつpH8.5でエタノールアミンの1M溶液に10分間浸漬された。それらは次いで水で完全に濯がれ、そしてPBSの1ml中に4°Cで貯蔵された。
【0065】
フィコル(Ficoll)の純化されたウイルスストック溶液中のウイルス粒子/mlの数がラテックス球体の内部標準により電子顕微鏡を使用して測定された。5×1010ウイルス粒子/mlの濃度においてHSVgD+ストック溶液のシリアルの10倍希釈がBSA(0.1mg/ml)を含有しているPBS(10mMNa2HPO4/NaH2PO4,2.7mMKCl,120mMNaCl,pH7.4)において行われ、かつ4°Cで貯蔵された。QCMチップは次いで器具内に半田付けなしの接触により取り付けられ、そしてこれらの希釈の各々の1μlまたは40μlがアンチ−gDlgG抗体で覆われたチップ表面上に配置された。40分後、表面は水で全体的に洗浄され、次いで40μlのPBSで被覆され、そしてQCMが0〜10Vで走査した。
【0066】
結果が図6に示されている。図6Aは1μl(○)および40μl(□)のサンプルに関する信号(7.5V近傍での雑音ピーク)対gD+ヘルペスシンプレックスウイルス粒子の数のプロットである。図6BはgD+およびgD-ウイルスに関する雑音対振幅のプロットである。表面上で抗体と特別な相互作用を持たないgD-ウイルスはピークを示しておらず;これに対してgD+ウイルスは7.5V近傍で鋭いピークを示している。
【0067】
例5
このバクテリア結合分析に関して、QCMチップが例4におけると同様に設けられた。E.coliおよびS.aureus(実験室菌株)がブレインハート/0.5%イースト抽出培養液中で培養されかつ37°Cで一晩培養された。各培養の1mlサンプルが光学的密度によって測定されるような1010cfu/mlの濃度に調整され、そして2分間12,000gで遠心分離され;ペレットが無菌のPBSに再び懸濁された。10μlのバクテリア懸濁液が、アンチHSV抗体に関して例4において記載された方法と同様な方法において、アンチE.coliIgG抗体で被覆されたれQCMチップ上に配置された。40分後、表面は水で全体的に洗浄され、40μlのPBSで被覆され、そしてQCMが0〜10Vで走査した。
【0068】
結果が図7に示されている。雑音/振幅プロットはE.coliに関して約6Vで鋭い信号を示し、そしてS.aureusに関しては何もない。
【0069】
例6
この例において、図9に示されるような、SAW装置が使用された。この場合に、単一の器具中に増幅器1および受信機およびコントローラ5を結合している、単一の器具(HP8512a、ヒューレット・パッカード)が使用された。器具は連続波およびパワースイープモードに設定されている。SAW装置はRFモノリティックス社から市場で入手可能なRF1171であった。直径1μmの、約100,00個のラテックス球体がSAWの表面上に堆積された。結果として生じているスペクトルは図10に示されている。多数のピークがクリーンな表面上に存在しないことが観察される。これは、SAW装置が破壊の状態を検出するのに使用され得ることを示している。種々のピークは、多分、種々の大きさの表面上の球体のクラスタに対応し、かつそれゆえピークは種々の位置において観察される。[0001]
(Technical field)
The present invention relates to a method for measuring molecular interactions and separating, sorting and classifying particles according to size. In particular, the present invention relates to the measurement of affinity between various binding partners, for example in antibody-antigen interactions.
[0002]
(Background technology)
Recognition of special molecules is a fundamental process and is the basis for enzyme-ligand interactions, antibody-antigen interactions and the binding of molecules to receptors. Molecular recognition is achieved by non-covalent interactions such as electrostatic interactions (hydrogen bonds) and hydrophobic interactions. Thermodynamic measurements of binding constants and free energy, enthalpy and entropy changes are fundamental to molecular cognition, especially when combined with information from X-ray diffraction and, if possible, site-directed mutagenesis. Give prospects.
[0003]
Direct measurement of the interaction force was made with an atomic force microscope (AFM) as well as a surface force device. While AFM can measure bond breaking force, the technique has the disadvantage that only one measurement can be made at a time. To date, AFM has been used for avidin-biotin interactions (Florin et al., Science, 1995; 264: 415), DNA mating (Boland et al., PNAS, 1995; 92: 5291), antibody-antigen interactions (Dammar et al., Biophys. J., 1996; 70: 2437) and attached glycoproteins (Damar et al., Science, 1995; 267: 1173).
[0004]
It is a well-recognized technique to separate biological molecules based on their associated affinity for ligands. For example, in affinity chromatography, the components to be separated are passed under a column containing a special ligand. The component of interest preferentially and strongly binds to the column and is retained on the column while other components are removed. The bound material can be eluted from the column at a later stage.
[0005]
Separation techniques are an important part of many research experiments. It is desirable to increase the sensitivity or selectivity of these techniques.
[0006]
Kolomenski et al. Appl. Phys. , 1998; 84 (4): 2404-10, disclose surface cleaning and deposition studies performed using laser-generated surface acoustic pulses. The pulses were low repetition rate (20 Hz) and constant energy. The procedure is carried out in a vacuum and is therefore not suitable for commercial development. An optical microscope was used to detect particle removal and it could not discriminate between particles of various sizes.
[0007]
WO-A-98 / 45692 discloses the use of a piezoelectric crystal sensor to measure clathrate hydrate formation / separation. Kurosawa et al., Chem. Pharm. Bull, 1990; 38 (5): 1117-20 report the use of such sensors for the detection of the sticking action of antibody-supported latex. WO-A-98 / 40739 also discloses such a sensor that includes a plate to which a special conjugate is immobilized, for use in indicating the presence of cells in the medium. ing. These sensors are used by measuring the change in resonant frequency at a constant voltage.
[0008]
Currently, if possible, most viruses are detected by culturing specimens in cells because this method is time consuming but sensitive. Direct detection of viral DNA or RNA in a clinical sample can be achieved using PCR and special primers tailored to the virus of interest. Since PCR involves an amplification step, cross-contamination is a major problem and it is difficult to establish a reliable quantitative method. Other direct methods include electron microscopy, immunoelectron microscopy, and methods based on antigen detection with enzyme-conjugated antibodies. These methods are often relatively insensitive and therefore require a relatively large amount of virus particles.
[0009]
The present invention can be broken by mechanically oscillating a surface at an amplitude at which the binding between the target molecule or the target molecule attached to the particle and the surface is increased, and from the surface to the target molecule Or based on the reality of separating particles. The required acceleration, and hence the force, depends on a variety of factors, including the mass of the molecule or particle, the nature of the binding to the surface and the geometry or size of the target molecule or particle. Yes. The present invention can therefore be used to separate various target molecules or to classify them according to size or to detect their presence.
[0010]
(Disclosure of the Invention)
According to a first aspect of the invention, a method for separating a target analyte from a composition comprises:
(I) contacting the composition with a binding partner for an analyte that is immobilized on the surface;
(Ii) oscillating the surface with an increasing amplitude so as to selectively remove the analyte or other components of the composition from the surface.
[0011]
In addition, the present invention can be used in methods for measuring the presence or size of particles or the affinity between binding partners. According to a second aspect of the invention, such a method comprises:
(I) contacting the binding partner, one of which is immobilized on the surface;
(Ii) vibrating the surface with increasing amplitude;
(Iii) a step of detecting the separation state.
[0012]
In this second aspect, the present invention can be applied to a variety of physical and chemical bonds that range from relatively weak interactions such as hydrogen bonds to covalent bonds.
[0013]
A device suitable for use in the present invention is a surface having one binding partner immobilized thereon, means for vibrating said surface with increasing amplitude, and for detecting separation conditions And means.
[0014]
In particular, the device is an acoustic transducer device (ATD), such as a quartz crystal microbalance (QCM) or surface acoustic wave device, or a piezoelectric material that can be made to vibrate, for example by applying an alternating voltage or magnetic field. Can be provided. These are cheaper devices than AFM and can be multiplexed. Another advantage of using such a device is that most of the coupling is broken at the same time, resulting in detectable acoustic and sharp noise peaks at a special acceleration (voltage applied to the ATD). Another advantage is that the ATD can be used as a sensitive microphone to detect acoustic emission when a separation condition occurs.
[0015]
In most prior art experiments using ATD, the change in resonant frequency or phase was measured when ATD was driven with a constant voltage. In contrast, the present invention involves increasing the amplitude of the drive voltage and hence the oscillation of the ATD.
[0016]
The present invention has a wide range of uses for separation, sorting and sorting according to size. In these examples, in air, a sphere called streptavidin can be separated from a normal latex sphere using a QCM with a biotinylated surface and a driving voltage of 0.1V or more but 6V or less. It is shown that. Normal latex spheres have been removed from the surface, leaving only spheres called streptavidin attached to the surface (due to a stronger streptavidin-biotin bond). This is a new approach to separation science based on variable forces applied over a period of time, for example, by sorting and sorting by particle size, cell sorting, phage sorting and new biosensor designs. Open form. Such separation methods are low cost and can be easily multiplexed and automated. For example, different targets can be deposited at different locations on the same microbalance and a library of ligands can be simultaneously screened for multiple targets. Detection and analysis of virus particles of a certain size is another area of application. Equally important is that the present invention provides a new, sensitive and potentially quantitative tool for probing the forces associated with molecular recognition.
[0017]
(Best Mode for Carrying Out the Invention)
The present invention uses a sensor device that can be vibrated. The sensor can be made to vibrate in a number of ways, for example by surface acoustic wave devices, resonant quartz crystal plate devices, acoustic plate modes and thin film flexible plate devices.
[0018]
Many different sensors suitable for use in the present invention are available from commercial sources. A description of sensors that can be used in the present invention is contained in Acoustical Sensors, Ballantyne et al. (1997) Academic Press. The sensor is preferably a surface acoustic wave device, or more preferably a quartz crystal plate microbalance (QCM).
[0019]
A QCM is a disc typically made of a quartz crystal with gold electrodes on the top and lower surfaces. When an alternating voltage is applied to the electrodes, it undergoes shear vibration due to the reverse piezoelectric effect. Increasing the voltage is to increase the amplitude of the QCM oscillation.
[0020]
The quartz crystal plate is also a sensitive microphone and can be used to detect acoustic emission due to a destructive condition. It is technically easier to excite vibrations at frequencies that correspond to one major resonant frequency and detect acoustic emission near other modes. As an example, the QCM is driven at its resonant frequency and acoustic emission is detected at its third harmonic.
[0021]
For illustration purposes, the term “analyte” may be used to describe a binding partner or component that is contacted with a surface-immobilized binding partner. Following contact, the analyte is coupled to the sensor and subjected to acceleration by molecular interaction, and therefore a force is exerted on the analyte. Breakdown occurs when the amplitude of vibration increases and at a certain threshold force. The previously bound analyte particles are thus free to roll on the surface.
[0022]
The analyte may be microscopic that can be maintained on the sensor by molecular interactions. The analyte may be a protein, antibody, antigen, enzyme, enzyme inhibitor or polynucleotide. Analytes can also be large particles such as bacteria, cells, viruses, prions or phages. Still other examples of particles that are particularly suitable for use in the present invention include any material, for example, large polymeric microspheres such as silica, gold or latex, or plasmids. The surface-immobilized binding partners can be of the same type and can therefore be selected depending on the appropriate physical or chemical binding.
[0023]
Smaller analyte separation is preferably detected by acoustic emission. Larger particles can also be detected by optical means, eg, a microscope.
[0024]
In the first aspect of the invention, the separation is performed by immobilizing the target molecule on the sensor surface by interaction with a binding partner. The surface can then be vibrated to separate molecules on the surface of the sensor. The vibration is performed by steadily increasing the amplitude and can be selected to remove the target molecule from the surface or to remove other components of the composition from the surface and bound to the surface The target molecule is left. In a preferred embodiment, the sensor surface is vibrated by using a piezoelectric acoustic wave device, such as a QCM. A similar piezoelectric device can be used as a microphone to detect acoustic noise generated by a destructive condition.
[0025]
Separation techniques can be applied to selection for molecules that interact strongly with a particular binding partner. For example, the technique can be applied to select cells with specific receptor molecules that appear on the cell surface, or to select for antibodies with strong affinity for specific ligands.
[0026]
Different ligands can be localized at different locations on the surface, for example by use of contact printing or mask or lithography. In that case, several strongly binding partner mixtures with several different ligands can be sifted simultaneously. In particular, the present invention can be used with chips having various materials such as receptors immobilized thereon. More generally, the chip displays materials that permit testing of various infectious agents, pathogens, prions, food allergens, viruses, bacteria, etc., and food and water hygiene in human and animal clinical trials, for example can do. Furthermore, the present invention can be used for library screening, phage display, and the like.
[0027]
The second aspect of the present invention is a method for measuring the presence or size of particles or the level of affinity between molecules. Preferably, one molecule is immobilized with respect to the sensor surface and the other molecule is immobilized with respect to the particles, for example with respect to the microspheres. The particles are then attached to the sensor by the interaction of the molecule of interest. The functionalized particles are then vibrated by applying a voltage to the sensor. As the amplitude of vibration increases, the force reaches a critical value where bond breaking occurs. At this point, characteristic noise can be detected by using a sensitive amplifier, and particle movement can be observed, for example, with an optical microscope. The magnitude of the signal depends on the number of particles bound to the sensor surface. Typically, if QCM is used in Example 1 with physically absorbing microspheres, as will be described below, the noise will be 0.1-1V depending on the size of the microspheres. The occurrence occurs when the microspheres are observed by the microscope to slide and escape. The plot can be made from the generated noise versus amplitude (or applied voltage), referred to as the destructive force spectrum. The point at which bond breaking becomes apparent from the plot is then the noise peak. Therefore, the critical voltage at which bond breakdown occurs is determined. Appropriate calibration experiments using particles with known bond density and strength make this method quantitative. Furthermore, the height of the acoustic emission peak is a measure of the number of bound particles.
[0028]
The present invention can be used to study molecular interactions, in particular enzyme / ligand interactions, antibody / antigen interactions and receptor / ligand interactions or large macromolecules and their natural binding partners. Suitable for studying the interaction between The method can also be applied to the study of the state of hybridization (hybridization) between polynucleotides. Thus, in the first aspect of the invention, the ligand may be a large macromolecule such as, for example, a protein, antibody or antigen, enzyme, enzyme inhibitor, polynucleotide or large plasmid or virus. Any material can be bound to the surface or particles in the second aspect of the invention.
[0029]
The following examples illustrate the invention.
[0030]
In each example, destructive force spectroscopy is used to measure the adhesion between the surface and small particles. This action is based on vibrating the surface by giant particles on the surface at monotonically increasing amplitude and hence increasing acceleration. This is accomplished by driving the surface with a piezoelectric acoustic wave device, in this case a quartz crystal plate microbalance (QCM). As the amplitude increases, the acceleration and hence the force acting on the particles also increases. All bond breaks that cause particles to adhere to the surface result in acoustic noise, and a similar piezoelectric device is used as a sensitive microphone to detect this noise generated by the broken state. A schematic of the apparatus used in Examples 1-5 is shown in FIG. 1, and a more general schematic of a suitable apparatus is shown in FIG.
[0031]
More specifically, FIG. 1 shows a
[0032]
FIG. 8 shows a piezoelectric transducer 21 (such as a QCM, SAW device, etc.) and a
[0033]
In the use of the circuit shown in FIG. 8, an
[0034]
The single or quadrature output signal is converted by one or more analog-to-
[0035]
FIG. 9 shows a SAW-based sensor suitable for use in the present invention. This sensor comprises means 31 for generating an RF voltage with an
[0036]
In the use of a SAW-based sensor, the
[0037]
Some results from the examples are shown in FIGS. 2A, 2B, 3A, 3B, 4A, 4B, 4C, 4D, 6B, 7 and 10 show the signal noise (S; arbitrary unit) versus amplitude (A; volts). It is a plot. Figures 5A, 5B, 6A and 6C are plots of signal noise (S; arbitrary units) versus number of particles (N).
[0038]
The following abbreviations are used: That is,
BSA: Bovine serum albumin
LB: Luria broth
DIC: Dimethylaminoisopropyl chloride
DMAP: Dimethylaminopyridine
EDC: 1,3-dimethylaminopropyl-3-ethylcarbodiimide
NHS: N-hydroxysuccinimide
PBS: phosphate-buffered saline
[0039]
Example 1
Latex spheres with a diameter of 5 μm were attached to the QCM sensor surface by a number of bonds of interest. The spherical coating used was 1% of the surface area of the QCM. The spheres had only a 1% change in their diameter.
[0040]
The QCM sensor was equipped with a polished quartz crystal plate that was acoustically cut off at 35 ° C. and that had a diameter of 8.25 mm. A layer of chromium (20-30 nm thick) and then gold (100-120 nm thick) was deposited.
[0041]
Three different bonds were studied in experiments conducted in air. That is, they are physical bonds (latex-gold), streptavidin-biotin bonds and covalent bonds (amide linkages). Physical bonding was done by placing latex spheres directly on the sensor surface and drying in nitrogen. Streptavidin-biotin conjugation was done by applying biotinylated BSA onto the surface and drying in nitrogen. The chemical linkage was made by forming an thiol molecular film using acid-terminated thiol (12-mercaptododecanoic acid) dissolved in ethanol. This was then activated using EDC-NHS and an amine-terminated sphere was added to form an amino bond.
[0042]
The experiment was carried out in a chamber with two optical windows: an optical window for supplying laser irradiation of the sample and an optical window for allowing observation of scattered laser light with an optical microscope. The QCM was placed in the chamber. A signal generator, model DS345 (Stanford Research Systems) was used to drive the QCM. Particle movement and separation were observed using an Olympus BH-2 optical microscope equipped with a CCD Panasonic WL-SL300 video camera. The main measuring device was a lock-in amplifier, SR844 (Stanford Research Systems). The reference signal was supplied to lock-in using a second generator synchronized to the first generator. All devices were interfaced to a computer for experiment control and data collection.
[0043]
FIG. 2A shows the destructive force spectrum for streptavidin-biotin (1) and chemical bond (2), and FIG. 2B is the spectrum for physical bond.
[0044]
By recording the breaking force spectrum, the force or voltage to break the bond can be measured experimentally. This can be used for separation. As shown in FIG. 2A, if there is a mixture of 5 μm spheres, some with streptavidin on the surface and some not, 0.1V or more but 6V or less, approximately 1V By applying a voltage to the QCM with biotin on the surface, it is possible to separate two sets of spheres and provide only a sphere called streptavidin on the surface. This technique can also be used to detect spheres called streptavidin because these spheres only bind on the surface when vibrated at 1V.
[0045]
In order to make the measurements quantitative, the amplitude of the vibration of the QCM was calculated at various voltages based on experimental data allowing the evaluation of forces on the microspheres. This evaluation is based on the power consumption of the QCM and its Q factor (or merit factor—reciprocal relative resonant bandwidth = f / Δfresonance) Was made by measuring. Amplitude A is
A = [QP / 2πThreefThreeM]1/2
Where Q is the Q or merit factor, P is the power consumed by the QCM, f is the resonant frequency of the quartz crystal plate, and M is the effective mass of the QCM quartz crystal plate that accompanies the motion. The Q factor is measured to be approximately 15000 at 6V, which gives an estimate of the vibration amplitude of a 60 nm QCM. The force on the sphere is therefore 9 μN. This is 160pN2Should be compared to the force required to break the single streptavidin-biotin bond and show that nearly 60,000 bonds are broken simultaneously. The evaluation shows that this corresponds to 50% or more of the initial streptavidin-biotin binding between the sphere and the surface. This means that most of the bonds that attach the sphere to the surface are broken at the same time. This results in a sharp peak observed in the destructive force spectrum and detectable noise for bond breaking.
[0046]
Example 2
This example shows that the method of the invention can also be carried out in solution. The QCM Q factor decreases with liquid loading, thus reducing the amplitude of vibration at a particular voltage when compared to air. There is an adhesive force acting on the microsphere and its effective mass is increased by the associated water layer, which increases the force on the sphere.
[0047]
FIG. 3 shows the destructive force spectrum for 5 μm latex spheres attached to the surface by streptavidin-biotin (FIG. 3A) and chemical bonds (FIG. 3B). Breakdown occurs at 1V and 10V, respectively.
[0048]
From 6V to 1V when reaching air to water, a factor of 6 indicates that the reduction of the critical voltage for streptavidin-biotin binding and chemical bond breakage in water indicates that the latter action is characteristic. Yes. This example thus clearly shows that bond breaking and hence separation and biosensing is possible in water liquids or otherwise.
[0049]
Assuming that the binding density of physical, streptavidin-biotin and chemical bonds is the same and the same size microspheres were used in these experiments, a relative scale of destructive force was obtained. Can be done. This is 1: 60: 600 for physical: streptavidin-biotin: chemical linkage. This scaling seems reasonable and shows the dynamic range of this method. These measurements can be made quantitative by performing appropriate calibration experiments using known bond densities.
[0050]
Example 3
Examples are modified with genes that display viruses and, in particular, maltose binding proteins dissolved in phage pIII coat proteins, since both phage and maltose-binding interactions are well characterized and readily available. Shows the detection of bacteriophages. A phage is a long, thin filamentous virus consisting of a
[0051]
A maltose-binding protein fusion to the amino terminus of indole glycerol phosphate synthase was displayed on the surface of the fd phage as a fusion to the amino terminus of the gene III-encoded coat protein. To this end, the fd phage vector, pJB113, was constructed; it encoded a gene fusion between MaIE (E. coli) trpC (E. coli) and gene III. This phage vector carried a tetracycline-resistance marker. The non-denatured competitor phage was the VCSM113K07 helper phage (Stratogene) supporting the kanamycin-resistance marker.
[0052]
1 × 10¹²A cfu / mL bacteriophage concentrate was obtained by infecting 3 mL of Midlophase LB culture of Escherichia coli strain TG1 with 10 μL of phage stock. After 2 hours of stirring (250 rpm) at 37 ° C., 1 mL of culture was inoculated into 100 ml LB and stirred for 1 hour at 37 ° C. and 350 rpm. Tetracycline (10 μg / mL) or kanamycin (50 μg / mL) was added to pJB113 or VCS cultures grown overnight at 30 ° C. and 250 rpm, respectively. Bacteria were pelleted (15 min, 4.1 krpm) and phages were precipitated from the suspension by addition of NaCl and
[0053]
Meltable starch (500 mg, 0.01 mmol, 1 eq.) Was dissolved in DMF (10 ml) and stirred for 5 minutes (partially meltable). 11-mercaptododecanoic acid (11.5 mg, 0.05 mmol, 5 eq.) In DMF (0.5 ml) was replaced with DIC (7.8 μl, 6.3 mg, 0.05 mmol, 5 eq.) And DMAP (cat.). And this solution was added to the starch solution. The reaction was left stirring overnight at room temperature. The reaction was then purified by rinsing with a solution with milliQ water (6 × 50 mL) and concentrating using a stirred cell with a blocked 10000 MW film, followed by vacuum lyophilization.
[0054]
The surface was provided using a modified starch containing a thiol group so that the thiol group was chemically bonded to the surface. QCM (provided as in Example 1) was placed in a solution of starch in methanol (1 μg / mL) for 12 hours. The sample was then washed with water and dried under nitrogen vapor. The virus was deposited on the surface from solution and dried at room temperature for experiments in air. Various virus concentrations were made by dilution. To perform the experiment with maltose that blocks maltose-binding protein, 100 nM maltose was added to the phage solution.
[0055]
The surface of the QCM was thus coated with a layer of meltable potato starch (containing a maltose branched polymer) that was chemically attached to the gold surface by sulfur-gold bonds. Experiments were performed both in air and in water.
[0056]
FIG. 4A shows the destructive force spectrum obtained in water for a mixture of maltose-bound phage (−) and undenatured phage (...), the scan being acquired over 500 seconds. There are approximately 500 million of each type of phage on the surface of the gold electrode. For phage that was not denatured and therefore not specifically bound, a break peak was detected at 1.2V. The corresponding disruption peak of maltose-bound phage is approximately 9V and is stronger than the phage that is not specifically bound by the greater energy performed at the time of disruption. In air, no peaks were observed from specifically bound maltose-bound phage up to 10 V; FIG. 4B shows air data for unbound phage. The peak is 7.5V, generating an increase of approximately 6 over the peak observed in water. The second scan (...) has few peaks, indicating that the phage has been removed from the surface. This demonstrates that the additional viscous frictional force and the increase in the effective mass of the particles make it easier to break the bond between the phage particles and the surface in water than in the air.
[0057]
The sharpness of the peak of the destructive force spectrum is clearly associated with the observation that bond breaking occurs at the threshold voltage; this results in acoustic noise occurring in short time periods and Therefore, the method is very sensitive. In addition, the signal from special binding phage is well separated from phage without special binding and at higher amplitudes, meaning that non-specific adsorption does not affect the measurement of special adsorption. A very large force is present between the maltose-binding protein displayed on the phage and the starch-coated surface compared to the force required to break the extraordinary interaction between the undenatured phage and the surface. Required to break special interactions.
[0058]
FIG. 4C shows that the binding site is blocked by maltose and then performed in air by maltose-binding phage when the phage is deposited on the QCM at the center (top plot) or across the entire surface (bottom plot). The results of the control experiments performed are shown; this behaves similarly to the undenatured phage, demonstrating that the differences are due to these special interactions. FIG. 4D shows a destructive force spectrum in water with only 1000 phages on the surface and shows that the state of destruction is detectable. As a result of the change in load, there is a small shift in peak position due to a smaller change in the quality factor of Q or QCM.
[0059]
The data also shows that phage that are not specifically bound from maltose-bound phage by driving QCM at a voltage that is above the voltage to break binding to the unbound phage but below that for maltose-bound phage. Suggest that it should be separable. This suggests an alternative method, such as sieving the phage library for binding, where the binding affinity of the phage left on the surface is determined by the applied voltage if the phage is practicable. Is controlled by controlling the magnitude of and the time applied.
[0060]
To measure the sensitivity of the method, dilution experiments were performed with maltose-bound phage in water. FIG. 5A shows that the signal power is linear with the number of phage over at least 5 orders of magnitude, and the presence of nearly 200 phage on the QCM can be detected with 99% probability. (For a maximum intensity noise peak near 9V). FIG. 5B shows a similar curve for phage without special binding in air showing the detection sensitivity of 100 phage with 99% probability. The number of maltose-bound phage on the surface at low dilution was confirmed by direct imaging using AFM.
[0061]
This example shows that the number of phage on the QCM surface can be detected. In contrast, using PCR, the number of copies of the viral DNA is detected in solution. If a strong virus surface interaction exists or if it is assumed that all virus particles in the solution sample bind to the surface, which occurs when the solution is allowed to evaporate leaving the virus on the surface, then A direct comparison of sensitivity is possible. The sensitivity of the PCR is approximately 100 copies of viral DNA / mL that can be compared to the detection sensitivity of the phage according to this example (not optimized). Electronics can be improved and there is room to further improve sensitivity, perhaps at least on the order of size. For example, in these experiments, the phage was uniformly deposited on the surface of the QCM. However, both the amplitude and sensitivity of the QCM have a spatial dependence that means that the dominant signal comes from the center of the QCM (as shown in FIG. 4C). This means that a stronger peak can be recorded if the phage are only deposited in the center of the QCM, resulting in an increase in sensitivity.
[0062]
This method can be easily extended to the detection of human viruses by the use of special antibodies to viruses attached to the surface of the QCM. These antibodies form a special interaction between viruses attached to the surface of the QCM. These antibodies form a special interaction between the virus and the surface that can be destroyed at certain surface accelerations. Unspecified adsorption by similar sized or larger particles present in the sample results in a peak at low voltage, as shown now, and this is caused by adsorption by macromolecules on the surface to the virus. It may reduce the number of antibodies available to bind but does not affect the analysis. Many common viruses have an effective mass greater than the phage used in this example, although the number and strength of special interactions with the surface differ. This means that the required voltage is of similar magnitude or smaller.
[0063]
This example shows that destructive force spectroscopy does not require an amplification process, is quantitative, and has the potential to be direct and low cost. This can lead to rapid diagnosis of viral infections in many situations involving patients in clinical settings or plants and animals in agriculture.
[0064]
Example 4
This example shows a virus binding analysis. For this analysis, a quartz crystal microbalance chip is made from a polished quartz crystal plate (HyQ, Cambridge, UK), AT cut at a 35 ° angle, and a 30 nm thick chromium adhesion layer, It was then covered in an Edwards vapor depositor with a 200 nm gold layer as determined by calibrated electrical conductance. The chips were then immersed in a 1 mM solution of mercaptododecanoic acid in spectroscopic grade ethanol for 18 hours, rinsed thoroughly with ethanol and then with water, and then sprayed dry with nitrogen vapor. These chips were then immersed in a mixture of NHS (100 mM) and EDC (400 mM) for 20 minutes. They were rinsed thoroughly with water and then immersed in a 50 μg / ml solution of mouse monocoulombic IgG antibody raised against HSVI glycoprotein D in 10 mM PBS at pH 7.0 for 1 hour. They were then rinsed with water and immersed in a 1M solution of ethanolamine for 10 minutes at pH 8.5. They were then rinsed thoroughly with water and stored at 4 ° C. in 1 ml of PBS.
[0065]
The number of virus particles / ml in a purified virus stock solution of Ficoll was determined using an electron microscope with an internal standard of latex spheres. 5 × 10TenHSVgD at a concentration of virus particles / ml+A 10-fold serial dilution of stock solution in PBS (10 mM Na) containing BSA (0.1 mg / ml)2HPOFour/ NaH2POFour, 2.7 mM KCl, 120 mM NaCl, pH 7.4) and stored at 4 ° C. The QCM chip was then mounted in the instrument by non-soldering contact, and 1 μl or 40 μl of each of these dilutions was placed on the chip surface covered with anti-gDlgG antibody. After 40 minutes, the surface was thoroughly washed with water, then coated with 40 μl PBS, and the QCM was scanned from 0-10V.
[0066]
The result is shown in FIG. FIG. 6A shows signal (noise peak near 7.5V) vs. gD for 1 μl (◯) and 40 μl (□) samples.+Figure 2 is a plot of the number of herpes simplex virus particles. FIG. 6B shows gD+And gD-Figure 5 is a plot of noise versus amplitude for a virus. GD with no special interaction with antibodies on the surface-Virus shows no peak; on the other hand gD+The virus shows a sharp peak around 7.5V.
[0067]
Example 5
For this bacterial binding analysis, a QCM chip was provided as in Example 4. E. coli and S. coli. aureus (laboratory strain) was cultured in brain heart / 0.5% yeast extract broth and grown overnight at 37 ° C. 10 as 1 ml sample of each culture is measured by optical densityTenAdjusted to a concentration of cfu / ml and centrifuged for 2 minutes at 12,000 g; the pellet was resuspended in sterile PBS. 10 μl of bacterial suspension was prepared in a manner similar to that described in Example 4 for anti-HSV antibodies in anti-E. Coated with E. coli IgG antibody and placed on a QCM chip. After 40 minutes, the surface was thoroughly washed with water, coated with 40 μl PBS, and scanned for QCM at 0-10V.
[0068]
The result is shown in FIG. The noise / amplitude plot is E. shows a sharp signal at about 6V for E. coli and There is nothing about aureus.
[0069]
Example 6
In this example, a SAW device as shown in FIG. 9 was used. In this case, a single instrument (HP 8512a, Hewlett Packard) was used, combining
Claims (32)
(i)前記第1の結合相手が表面上で不動にされ、前記第1および第2の結合相手が相互に結合するように、前記第1および第2の結合相手を接触させる工程と、
(ii)振動の振幅が前記第1および第2の結合相手が分離する値まで増大するように前記表面を振動させる工程と、
(iii)前記第1および第2の結合相手の親和力が分離状態から測定されるように、前記第1および第2の結合相手の分離を検出する工程と、を備えてなることを特徴とする方法。A method for measuring the affinity forces between the first and second binding partner,
(I) contacting the first and second binding partners such that the first binding partner is immobilized on a surface and the first and second binding partners bind to each other ;
(Ii) vibrating the surface such that the amplitude of vibration increases to a value that separates the first and second binding partners ;
And (iii) detecting the separation of the first and second binding partners so that the affinity of the first and second binding partners is measured from the separated state. Method.
(i)結合が形成され得る表面と、
(ii)前記表面を単調に増大している振幅で前記表面の平面で振動させるための手段と、
(iii)分離状態を検出するための手段と、を備えてなることを特徴とする装置。 In an apparatus for detecting separation of bonds ,
(I) a surface on which a bond can be formed ;
(Ii) means for vibrating the surface in a plane of the surface with a monotonically increasing amplitude;
(Iii) means for detecting the separation state.
Applications Claiming Priority (3)
| Application Number | Priority Date | Filing Date | Title |
|---|---|---|---|
| GBGB9909308.0A GB9909308D0 (en) | 1999-04-22 | 1999-04-22 | Measurement and use of molecular interactions |
| GB9909308.0 | 1999-04-22 | ||
| PCT/GB2000/001587 WO2001002857A1 (en) | 1999-04-22 | 2000-04-25 | Measurement and use of molecular interactions |
Publications (2)
| Publication Number | Publication Date |
|---|---|
| JP2003503735A JP2003503735A (en) | 2003-01-28 |
| JP4493892B2 true JP4493892B2 (en) | 2010-06-30 |
Family
ID=10852091
Family Applications (1)
| Application Number | Title | Priority Date | Filing Date |
|---|---|---|---|
| JP2001508053A Expired - Lifetime JP4493892B2 (en) | 1999-04-22 | 2000-04-25 | Measurement and use of molecular interactions |
Country Status (23)
| Country | Link |
|---|---|
| US (2) | US6589727B1 (en) |
| EP (1) | EP1171769B1 (en) |
| JP (1) | JP4493892B2 (en) |
| KR (1) | KR20020022648A (en) |
| CN (1) | CN1142435C (en) |
| AT (1) | ATE278191T1 (en) |
| AU (1) | AU755958B2 (en) |
| BR (1) | BR0009865A (en) |
| CA (1) | CA2369794A1 (en) |
| CZ (1) | CZ20013633A3 (en) |
| DE (1) | DE60014348T8 (en) |
| ES (1) | ES2226825T3 (en) |
| GB (1) | GB9909308D0 (en) |
| HK (1) | HK1041920B (en) |
| HU (1) | HUP0200787A2 (en) |
| IL (2) | IL145754A0 (en) |
| MX (1) | MXPA01010640A (en) |
| NO (1) | NO20015096L (en) |
| PL (1) | PL354354A1 (en) |
| RU (1) | RU2223500C2 (en) |
| UA (1) | UA57876C2 (en) |
| WO (1) | WO2001002857A1 (en) |
| ZA (1) | ZA200108562B (en) |
Families Citing this family (53)
| Publication number | Priority date | Publication date | Assignee | Title |
|---|---|---|---|---|
| NZ518740A (en) | 1999-11-08 | 2004-04-30 | Univ Florida | Marker detection method and apparatus to monitor drug compliance |
| US20050233459A1 (en) * | 2003-11-26 | 2005-10-20 | Melker Richard J | Marker detection method and apparatus to monitor drug compliance |
| US6981947B2 (en) * | 2002-01-22 | 2006-01-03 | University Of Florida Research Foundation, Inc. | Method and apparatus for monitoring respiratory gases during anesthesia |
| US20050054942A1 (en) * | 2002-01-22 | 2005-03-10 | Melker Richard J. | System and method for therapeutic drug monitoring |
| US7104963B2 (en) * | 2002-01-22 | 2006-09-12 | University Of Florida Research Foundation, Inc. | Method and apparatus for monitoring intravenous (IV) drug concentration using exhaled breath |
| AU2002310031A1 (en) * | 2001-05-23 | 2002-12-03 | University Of Florida | Method and apparatus for detecting illicit substances |
| DE10126798A1 (en) * | 2001-06-01 | 2002-12-19 | Nanotype Gmbh | Highly parallel determination of analytes, useful e.g. for diagnostic detection of proteins, by immobilization then contacting with surface carrying specific probes |
| US6865949B2 (en) | 2003-01-31 | 2005-03-15 | Hewlett-Packard Development Company, L.P. | Transducer-based sensor system |
| US20070167853A1 (en) | 2002-01-22 | 2007-07-19 | Melker Richard J | System and method for monitoring health using exhaled breath |
| US7079977B2 (en) * | 2002-10-15 | 2006-07-18 | Medtronic, Inc. | Synchronization and calibration of clocks for a medical device and calibrated clock |
| US7135806B2 (en) | 2002-10-31 | 2006-11-14 | Hewlett-Packard Development Company, L.P. | Transducer-based sensor system with multiple drive signal variants |
| WO2004067130A2 (en) * | 2003-01-26 | 2004-08-12 | Eberhard-Karls-Universität Tübingen Univer Sität Sklinikum | Method for separating and detecting at least one analyte in biological matrices |
| CA2517908A1 (en) * | 2003-03-04 | 2005-02-10 | Auburn University | Methods of forming monolayers of phage-derived products and uses thereof |
| WO2004095011A1 (en) * | 2003-04-17 | 2004-11-04 | Akubio Limited | Improvements to rupture event sensors |
| US7117743B2 (en) | 2003-07-31 | 2006-10-10 | Hewlett-Packard Development Company, L.P. | Multiple-transducer sensor system and method with selective activation and isolation of individual transducers |
| US6978656B2 (en) | 2003-10-31 | 2005-12-27 | Hewlett-Packard Development Company, L.P. | Transducer-based sensor system and method |
| NZ528338A (en) * | 2004-03-19 | 2006-10-27 | Ind Res Ltd | Biosensors for detecting bond rupture |
| US20050226773A1 (en) * | 2004-04-01 | 2005-10-13 | Honeywell International, Inc. | Multiple modes acoustic wave sensor |
| US7539459B2 (en) * | 2004-04-02 | 2009-05-26 | Edwards Vacuum, Inc. | Active noise cancellation system, arrangement, and method |
| US7497133B2 (en) | 2004-05-24 | 2009-03-03 | Drexel University | All electric piezoelectric finger sensor (PEFS) for soft material stiffness measurement |
| US20080193418A1 (en) * | 2004-06-04 | 2008-08-14 | University Of Northern Iowa Research Foundation | Bacteriophages that Infect Bacillus Bacteria (Anthrax) |
| US7749445B2 (en) | 2005-05-02 | 2010-07-06 | Bioscale, Inc. | Method and apparatus for analyzing bioprocess fluids |
| US7648844B2 (en) | 2005-05-02 | 2010-01-19 | Bioscale, Inc. | Method and apparatus for detection of analyte using an acoustic device |
| EP1940355B1 (en) * | 2005-09-30 | 2012-12-19 | Auburn University | Targeted drug delivery nanocarrier comprising a targeting landscape phage protein assembly |
| US8227261B2 (en) * | 2005-11-23 | 2012-07-24 | Bioscale, Inc. | Methods and apparatus for assay measurements |
| US7942056B2 (en) * | 2006-01-23 | 2011-05-17 | Drexel University | Self-exciting, self-sensing piezoelectric cantilever sensor |
| US8171795B1 (en) | 2006-01-23 | 2012-05-08 | Drexel University | Self-exciting, self-sensing piezoelectric cantilever sensor for detection of airborne analytes directly in air |
| WO2007133619A1 (en) * | 2006-05-10 | 2007-11-22 | Drexel University | Molecular control of surface coverage |
| GB0609382D0 (en) * | 2006-05-11 | 2006-06-21 | Univ Cambridge Tech | Acoustic wave transducer substrate and measurements using the same |
| DE102006034842A1 (en) * | 2006-07-27 | 2008-02-07 | Siemens Ag | fluid sensor |
| US7914460B2 (en) * | 2006-08-15 | 2011-03-29 | University Of Florida Research Foundation, Inc. | Condensate glucose analyzer |
| US8481335B2 (en) * | 2006-11-27 | 2013-07-09 | Drexel University | Specificity and sensitivity enhancement in cantilever sensing |
| WO2008067386A2 (en) | 2006-11-28 | 2008-06-05 | Drexel University | Piezoelectric microcantilever sensors for biosensing |
| US7992431B2 (en) | 2006-11-28 | 2011-08-09 | Drexel University | Piezoelectric microcantilevers and uses in atomic force microscopy |
| EP2115448A4 (en) * | 2007-02-01 | 2013-01-30 | Univ Drexel | A hand-held phase-shift detector for sensor applications |
| US7892759B2 (en) | 2007-02-16 | 2011-02-22 | Drexel University | Enhanced sensitivity of a cantilever sensor via specific bindings |
| US8512947B2 (en) | 2007-02-16 | 2013-08-20 | Drexel University | Detection of nucleic acids using a cantilever sensor |
| WO2009035732A2 (en) * | 2007-05-30 | 2009-03-19 | Drexel University | Detection and quantification of biomarkers via a piezoelectric cantilever sensor |
| US8354280B2 (en) * | 2007-09-06 | 2013-01-15 | Bioscale, Inc. | Reusable detection surfaces and methods of using same |
| WO2009079154A2 (en) | 2007-11-23 | 2009-06-25 | Drexel University | Lead-free piezoelectric ceramic films and a method for making thereof |
| RU2350957C1 (en) * | 2007-12-28 | 2009-03-27 | Институт аналитического приборостроения Российской академии наук | Device for immunologic research of biological liquids |
| US8236508B2 (en) * | 2008-01-29 | 2012-08-07 | Drexel University | Detecting and measuring live pathogens utilizing a mass detection device |
| US8741663B2 (en) | 2008-03-11 | 2014-06-03 | Drexel University | Enhanced detection sensitivity with piezoelectric sensors |
| US8562546B2 (en) * | 2008-05-16 | 2013-10-22 | Drexel University | System and method for evaluating tissue |
| GB2473635A (en) * | 2009-09-18 | 2011-03-23 | Cambridge Entpr Ltd | Detecting concentration of target species |
| US8722427B2 (en) * | 2009-10-08 | 2014-05-13 | Drexel University | Determination of dissociation constants using piezoelectric microcantilevers |
| US20110086368A1 (en) * | 2009-10-08 | 2011-04-14 | Drexel University | Method for immune response detection |
| US20130260396A1 (en) | 2010-05-25 | 2013-10-03 | Arryx, Inc. | Holographic fluctuation microscopy apparatus and method for determining mobility of particle and/or cell dispersions |
| GB201020237D0 (en) * | 2010-11-30 | 2011-01-12 | Cambridge Entpr Ltd | Method and apparatus for characterising molecules |
| NL2017705B1 (en) * | 2016-11-02 | 2018-05-18 | Lumicks Tech B V | Method and system for studying biological cells |
| US10191036B1 (en) * | 2018-03-22 | 2019-01-29 | NUB4U, Inc. | System for detecting and removing biological analytes in fluids |
| RU184943U1 (en) * | 2018-04-09 | 2018-11-15 | Федеральное государственное бюджетное учреждение науки Институт физики полупроводников им. А.В. Ржанова Сибирского отделения Российской академии наук | Device for highly specific detection of biomarkers on a quartz resonator |
| NL2026393B1 (en) * | 2020-09-01 | 2022-05-04 | Lumicks Ca Holding B V | Sorting of cellular bodies based on force spectroscopy |
Family Cites Families (13)
| Publication number | Priority date | Publication date | Assignee | Title |
|---|---|---|---|---|
| US4242096A (en) * | 1977-11-14 | 1980-12-30 | Minnesota Mining And Manufacturing Company | Immunoassay for antigens |
| US4314821A (en) * | 1979-04-09 | 1982-02-09 | Minnesota Mining And Manufacturing Company | Sandwich immunoassay using piezoelectric oscillator |
| US4236893A (en) * | 1979-04-09 | 1980-12-02 | Minnesota Mining And Manufacturing Company | Method for the assay of classes of antigen-specific antibodies |
| US4735906A (en) * | 1984-11-28 | 1988-04-05 | Texas A&M University | Sensor having piezoelectric crystal for microgravimetric immunoassays |
| US4999284A (en) * | 1988-04-06 | 1991-03-12 | E. I. Du Pont De Nemours And Company | Enzymatically amplified piezoelectric specific binding assay |
| US5501986A (en) * | 1988-04-06 | 1996-03-26 | E. I. Du Pont De Nemours And Company | Piezoelectric specific binding assay with mass amplified reagents |
| EP0587408A1 (en) * | 1992-09-07 | 1994-03-16 | Terumo Kabushiki Kaisha | Method for determination of DNA and sensor therefor |
| IL114692A (en) * | 1995-07-21 | 1999-10-28 | Yissum Res Dev Co | Determination of an analyte in a liquid medium |
| US5814525A (en) * | 1996-01-25 | 1998-09-29 | Sandia Corporation | Piezoelectric biosensor with a ladder polymer substrate coating |
| IL120445A0 (en) * | 1997-03-13 | 1997-07-13 | Yissum Res Dev Co | Biosensor for cells |
| GB9706991D0 (en) * | 1997-04-05 | 1997-05-21 | Univ Heriot Watt | Clathrate hydrate dissociation point detection and measurement |
| US6086821A (en) | 1999-03-29 | 2000-07-11 | The United States Of America As Represented By The Secretary Of The Navy | Ultrasonic force differentiation assay |
| US6308553B1 (en) * | 1999-06-04 | 2001-10-30 | Honeywell International Inc | Self-normalizing flow sensor and method for the same |
-
1999
- 1999-04-22 GB GBGB9909308.0A patent/GB9909308D0/en not_active Ceased
-
2000
- 2000-04-25 CZ CZ20013633A patent/CZ20013633A3/en unknown
- 2000-04-25 HU HU0200787A patent/HUP0200787A2/en unknown
- 2000-04-25 PL PL00354354A patent/PL354354A1/en not_active Application Discontinuation
- 2000-04-25 WO PCT/GB2000/001587 patent/WO2001002857A1/en active IP Right Grant
- 2000-04-25 CN CNB008065330A patent/CN1142435C/en not_active Expired - Lifetime
- 2000-04-25 US US09/700,485 patent/US6589727B1/en not_active Expired - Lifetime
- 2000-04-25 AT AT00925478T patent/ATE278191T1/en not_active IP Right Cessation
- 2000-04-25 EP EP00925478A patent/EP1171769B1/en not_active Expired - Lifetime
- 2000-04-25 UA UA2001117935A patent/UA57876C2/en unknown
- 2000-04-25 IL IL14575400A patent/IL145754A0/en active IP Right Grant
- 2000-04-25 CA CA002369794A patent/CA2369794A1/en not_active Abandoned
- 2000-04-25 KR KR1020017013287A patent/KR20020022648A/en active IP Right Grant
- 2000-04-25 ES ES00925478T patent/ES2226825T3/en not_active Expired - Lifetime
- 2000-04-25 AU AU44203/00A patent/AU755958B2/en not_active Ceased
- 2000-04-25 JP JP2001508053A patent/JP4493892B2/en not_active Expired - Lifetime
- 2000-04-25 BR BR0009865-5A patent/BR0009865A/en not_active IP Right Cessation
- 2000-04-25 RU RU2001131416/15A patent/RU2223500C2/en active
- 2000-04-25 DE DE60014348T patent/DE60014348T8/en active Active
- 2000-04-25 MX MXPA01010640A patent/MXPA01010640A/en unknown
-
2001
- 2001-10-04 IL IL145754A patent/IL145754A/en unknown
- 2001-10-18 ZA ZA200108562A patent/ZA200108562B/en unknown
- 2001-10-19 NO NO20015096A patent/NO20015096L/en not_active Application Discontinuation
-
2002
- 2002-02-28 HK HK02101553.5A patent/HK1041920B/en not_active IP Right Cessation
-
2003
- 2003-01-24 US US10/350,892 patent/US7195909B2/en not_active Expired - Lifetime
Also Published As
| Publication number | Publication date |
|---|---|
| IL145754A (en) | 2006-09-05 |
| BR0009865A (en) | 2002-03-19 |
| US7195909B2 (en) | 2007-03-27 |
| AU4420300A (en) | 2001-01-22 |
| DE60014348T2 (en) | 2006-02-16 |
| WO2001002857A1 (en) | 2001-01-11 |
| NO20015096L (en) | 2001-12-14 |
| JP2003503735A (en) | 2003-01-28 |
| CN1347500A (en) | 2002-05-01 |
| KR20020022648A (en) | 2002-03-27 |
| DE60014348D1 (en) | 2004-11-04 |
| ZA200108562B (en) | 2002-09-11 |
| MXPA01010640A (en) | 2003-08-20 |
| IL145754A0 (en) | 2002-07-25 |
| PL354354A1 (en) | 2004-01-12 |
| CA2369794A1 (en) | 2001-01-11 |
| DE60014348T8 (en) | 2006-04-27 |
| EP1171769A1 (en) | 2002-01-16 |
| CZ20013633A3 (en) | 2002-06-12 |
| UA57876C2 (en) | 2003-07-15 |
| CN1142435C (en) | 2004-03-17 |
| HUP0200787A2 (en) | 2002-07-29 |
| ES2226825T3 (en) | 2005-04-01 |
| RU2223500C2 (en) | 2004-02-10 |
| US20030194697A1 (en) | 2003-10-16 |
| ATE278191T1 (en) | 2004-10-15 |
| EP1171769B1 (en) | 2004-09-29 |
| US6589727B1 (en) | 2003-07-08 |
| HK1041920B (en) | 2005-03-18 |
| HK1041920A1 (en) | 2002-07-26 |
| NO20015096D0 (en) | 2001-10-19 |
| GB9909308D0 (en) | 1999-06-16 |
| AU755958B2 (en) | 2003-01-02 |
Similar Documents
| Publication | Publication Date | Title |
|---|---|---|
| JP4493892B2 (en) | Measurement and use of molecular interactions | |
| US7763475B2 (en) | Measurement and use of molecular interactions | |
| Allison et al. | Atomic force microscopy of biological samples | |
| US7759134B2 (en) | Magnetostrictive ligand sensor | |
| Cooper et al. | Direct and sensitive detection of a human virus by rupture event scanning | |
| US5763768A (en) | Analytical method using modified scanning probes | |
| Colton et al. | Scanning probe microscopy | |
| US7670765B2 (en) | Method of forming monolayers of phage-derived products and used thereof | |
| CA2530607A1 (en) | Device for detecting biological and chemical particles | |
| Cooper | Biosensing using rupture event scanning (REVS)™ | |
| AU6127899A (en) | Immuno-diagnostic test method for veterinary disease | |
| Xu et al. | Label-free microcantilever-based immunosensors for highly sensitive determination of avian influenza virus H9 | |
| JP4742342B2 (en) | Method for detecting antigen-antibody reaction and kit for detecting antigen-antibody reaction | |
| Eaimkhong | Application of Nanotechnology in Biological Research: Diagnostics and Physical Manipulation | |
| Kurus et al. | Measurement of the unwinding force of a DNA double helix | |
| Kelling et al. | Sensitive and direct detection using rupture event scanning (REVS/spl trade/) | |
| Lee | Chemical functionalization of AFM cantilevers | |
| Weldegiorgish | Enhancing Sensing in Nanoscale: Investigation of Smart Nanomechanical Cantilever Array | |
| Stukalov | Application Of Atomic Force Microscopy In Protein And Dna Biochips Development | |
| Atashbar et al. | Sensitivity enhancement of a QCM biosensor using polymer treatment | |
| Zhavnerko et al. | Oriented immobilization of C-reactive protein on solid surface for biosensor applications | |
| Glass | Specific phage based bacteria detection using microcantilever sensors | |
| Wikholm | Incorporation of model proteins into lipid layers | |
| FOHLEROVÁ | Biosensors and AFM technique for the monitoring of cell behaviour |
Legal Events
| Date | Code | Title | Description |
|---|---|---|---|
| RD04 | Notification of resignation of power of attorney |
Free format text: JAPANESE INTERMEDIATE CODE: A7424 Effective date: 20060425 |
|
| A621 | Written request for application examination |
Free format text: JAPANESE INTERMEDIATE CODE: A621 Effective date: 20061218 |
|
| A131 | Notification of reasons for refusal |
Free format text: JAPANESE INTERMEDIATE CODE: A131 Effective date: 20091117 |
|
| A711 | Notification of change in applicant |
Free format text: JAPANESE INTERMEDIATE CODE: A711 Effective date: 20100125 |
|
| A521 | Request for written amendment filed |
Free format text: JAPANESE INTERMEDIATE CODE: A523 Effective date: 20100201 |
|
| A521 | Request for written amendment filed |
Free format text: JAPANESE INTERMEDIATE CODE: A821 Effective date: 20100125 |
|
| TRDD | Decision of grant or rejection written | ||
| A01 | Written decision to grant a patent or to grant a registration (utility model) |
Free format text: JAPANESE INTERMEDIATE CODE: A01 Effective date: 20100309 |
|
| A01 | Written decision to grant a patent or to grant a registration (utility model) |
Free format text: JAPANESE INTERMEDIATE CODE: A01 |
|
| A61 | First payment of annual fees (during grant procedure) |
Free format text: JAPANESE INTERMEDIATE CODE: A61 Effective date: 20100407 |
|
| R150 | Certificate of patent or registration of utility model |
Ref document number: 4493892 Country of ref document: JP Free format text: JAPANESE INTERMEDIATE CODE: R150 Free format text: JAPANESE INTERMEDIATE CODE: R150 |
|
| FPAY | Renewal fee payment (event date is renewal date of database) |
Free format text: PAYMENT UNTIL: 20130416 Year of fee payment: 3 |
|
| FPAY | Renewal fee payment (event date is renewal date of database) |
Free format text: PAYMENT UNTIL: 20130416 Year of fee payment: 3 |
|
| FPAY | Renewal fee payment (event date is renewal date of database) |
Free format text: PAYMENT UNTIL: 20140416 Year of fee payment: 4 |
|
| R250 | Receipt of annual fees |
Free format text: JAPANESE INTERMEDIATE CODE: R250 |
|
| R250 | Receipt of annual fees |
Free format text: JAPANESE INTERMEDIATE CODE: R250 |
|
| R250 | Receipt of annual fees |
Free format text: JAPANESE INTERMEDIATE CODE: R250 |
|
| R250 | Receipt of annual fees |
Free format text: JAPANESE INTERMEDIATE CODE: R250 |
|
| R250 | Receipt of annual fees |
Free format text: JAPANESE INTERMEDIATE CODE: R250 |
|
| R250 | Receipt of annual fees |
Free format text: JAPANESE INTERMEDIATE CODE: R250 |
|
| R250 | Receipt of annual fees |
Free format text: JAPANESE INTERMEDIATE CODE: R250 |
|
| S111 | Request for change of ownership or part of ownership |
Free format text: JAPANESE INTERMEDIATE CODE: R313113 |
|
| S533 | Written request for registration of change of name |
Free format text: JAPANESE INTERMEDIATE CODE: R313533 |
|
| R350 | Written notification of registration of transfer |
Free format text: JAPANESE INTERMEDIATE CODE: R350 |